the Creative Commons Attribution 4.0 License.
the Creative Commons Attribution 4.0 License.
 | 28 Jul 2025
When colour makes minerals unique: the case of the green dolomite from Malentrata (Pomarance, Tuscany, Italy)
Matteo Ardit
Costanza Bonadiman
Michele Dondi
Maura Mancinelli
Giovanni Orazio Lepore
Elena Spagnoli
Luca Nodari
Renzo Tassinari
Alfonso Zoleo
Giordano Montegrossi
Francesco Di Benedetto
A peculiar green variety of dolomite has been described in several deposits in Europe (Miemo and Malentrata, Tuscany, Italy; Tarasp, the Grisons, Switzerland; Vučkovica, Serbia). This variety has attracted the interest of researchers and collectors for its aesthetic quality, which has led to its use as a semi-precious gemstone.
In the present study, a thorough multi-method characterisation of the green dolomite sampled at the Malentrata magnesite mine (Pomarance, Tuscany, Italy) has been carried out. The investigation included X-ray powder diffraction, electron probe microanalysis, X-ray fluorescence, X-ray absorption spectroscopy, scanning electron microscopy, thermal analysis, optical spectroscopy (UV–visible–NIR), and electron paramagnetic resonance spectroscopy.
As a result, two main pieces of evidence were described: (1) a peculiar reduction in cell volume, due to an anomalous excess of small-ionic-radius metal cations (i.e. Mg and Fe) with respect to Ca, and (2) the origin of the peculiar green colour, mainly determined by the Fe electronic transitions, probably in combination with those of Cr. In fact, the green dolomite of Malentrata contains aliquots of a number of environmentally relevant elements, in particular Mn, Cr, and Ni, whose mobility is consequently affected.
- Article
(3372 KB) - Full-text XML
-
Supplement
(1385 KB) - BibTeX
- EndNote


Dolomite, CaMg(CO3)2, is a mineral that is widely distributed in a variety of geological settings. These include mainly sedimentary rocks, but dolomite also occurs in some igneous and metamorphic rocks (Cai et al., 2021). A relevant number of studies have been conducted on this mineral because of its association with pivotal geological events that have shaped the Earth's crust. Its pervasiveness in many sedimentary rocks led to its initial description over two centuries ago. In its natural state, at ambient temperature and pressure, dolomite is a double carbonate in which alternating layers of octahedrally coordinated Ca2+ and Mg2+ ions are separated by layers of planar triangular CO groups whose orientation is normal to the crystallographic c axis. The differentiation of the two distinct octahedral layers is contingent upon the difference in ionic radii of the two constituting cations. The incorporation of other elements into the dolomite structure may occur during the crystallisation process, in particular by a replacement mechanism involving divalent cations such as Sr, Mn, and Fe (Cai et al., 2021). It is also noteworthy that a slight excess of Ca, which partially replaces Mg, is usually reported (Gregg et al., 2015), especially in dolomites that occur later (late-formation dolomite) than those imposed during the early stages of mineralisation (early-formation dolomite).
The occurrence of green-coloured dolomite is relatively uncommon and has attracted the attention of naturalists and scientists for many years. This is primarily due to its fascinating features, which differentiate it from other varieties. There is a paucity of literature on this variety. A banded sinter of cryptocrystalline green dolomite has been described since 1891 in the locality of Tarasp in the Grisons (Switzerland) and was named taraspite (mindat.org, 2024). A second well-characterised occurrence is reported by Orlandi (2006) and by Boschi et al. (2009). This occurrence is associated with the Malentrata magnesite mine (Pomarance, Pisa, Italy; Fig. 1a) and exhibits a colouration similar to that of the specimen from Tarasp. The Malentrata specimen is texturally associated with magnesite and additional mineralisations of colourless dolomite and opal. In this locality, the green variety of dolomite was named miemite from the Fattoria di Miemo (an agricultural farm, Montecatini Val di Cecina, Pisa, Italy), located about 20 km NNW of Malentrata. This dolomite variety was first documented in the second half of the 19th century during a survey for the potential exploitation of a copper mine. Indeed, the mineral assemblage at Miemo was described with a paragenesis that bears a striking resemblance to that of Malentrata (Orlandi, 2006).
The genesis of the green dolomite in the Tuscan occurrences has been elucidated by Boschi et al. (2009) in relation to the silicification–carbonation of pristine serpentinite, which is a constituent of the Ligurian ophiolites. In a complex multi-stage process, dolomite occurs in a second stage subsequent to a primary carbonation stage that drives the precipitation of Fe-rich magnesite. In the second stage, a series of dolomite crystallisation events reveals recurrent changes in the mineralising fluid and partial reaction with the magnesite deposited in the previous stage. Among the various forms of dolomite mineralisation, only one exhibits the characteristic green hue. A further occurrence of green dolomite in Tuscany has been documented by Rielli et al. (2022) in outcrops near Castiglioncello (Livorno, Italy). These outcrops also display a close association with magnesite. This occurrence is located 40 km NW of Malentrata.
Apart from the Tuscan occurrences, which are probably caused by a similar genetic event, the only other descriptions found in the literature are represented by the green dolomite from the Vučkovica deposit in central Serbia (Kurešević et al., 2022) and another occurrence coming from Vempalli Mandal in the Kadapa district of Andhra Pradesh, India (Reddy et al., 2008). The dolomite-bearing rocks from the Vučkovica deposit occur in a mineralogical context similar to that of Malentrata, resulting from a carbonation process of serpentinites, and in close association with magnesite. Dolomites from this locality have been used as semi-precious gemstone (Kurešević et al., 2022).
One of the most intriguing characteristics of the taraspite/miemite varieties of dolomite is indeed their green hue. This distinctive colouration has been correlated with an unusual incorporation of Ni in the mineral, as evidenced by various chemical techniques (Boschi et al., 2009; Kurešević et al., 2022; mindat.org, 2024). Indeed, there is a close resemblance in the mechanism of colour formation in gaspéite (NiCO3), the green nickel carbonate mineral (Reddy and Frost, 2004). A more detailed analysis suggests that when Ni replaces Mg in the smaller octahedral site of the dolomite crystal structure, the local structural environment of Ni may be similar to that in gaspéite. On this basis, Reddy et al. (2008) carried out an electronic spectroscopic investigation of green dolomite and established a close correlation between the observed electronic transitions and those observed in gaspéite.
The aim of the present study is to gain a deeper insight into the unusual structural and chemical properties of the green dolomite from Malentrata. To this end, a multi-method approach including X-ray powder diffraction (XRPD), X-ray fluorescence (XRF), electron probe microanalysis (EPMA), thermal analysis, electron paramagnetic resonance (EPR), X-ray absorption spectroscopy (XAS), and ultraviolet–visible–near infrared (UV–Vis–NIR) spectroscopy has been employed. The objective of this approach is twofold: first, to provide a comprehensive assessment of the crystal chemistry of the minor elements incorporated into the dolomite structure; and second, to establish a link between these elements and the seemingly anomalous green colour.
2.1 Specimen
The sample selected for this study is part of a large block of a carbonate rock sampled outside the main adit of the Malentrata Mine (Fig. 1b), where large quantities of tailings from former mining activities and other comparable samples are stored (Fig. 1c, d). The bulk rock sample has a colour composition characterised by three main shades: yellow-brown, associated with magnesite, and transparent green and white, associated with a dolomitic composition. For microanalytical determinations, a rock fragment was embedded in epoxy resin and polished down to 0.25 µm.
Conversely, all other analytical determinations were carried out on an aliquot of the rock containing only the green component. This aliquot was first coarsely crushed in a hydraulic press at 100 MPa and then ground in an agate mortar to obtain a powder with micrometre-sized grains.
2.2 X-ray fluorescence
The major and some trace element contents (Table 1) of the sample were determined in the bulk by wavelength-dispersive X-ray fluorescence spectrometry (WDXRF) on glass beads and pressed powder pellets, respectively. Analyses were performed with an ARL Advant-XP+ spectrometer at the Department of Physics and Earth Sciences of the University of Ferrara (Italy) and processed using Thermo Fisher OXSAS software. Acquired intensities were elaborated according to the matrix correction method proposed by Lachance and Traill (1966). For major element determination, a factory-made calibration for oxidised materials was used. For each trace element, the parameters of the calibration curves and the alpha factors for correcting for matrix effects were experimentally determined by MVR (multivariable regression) of the intensities obtained on a collection of over 100 certified reference materials of rocks, soils, and minerals covering compositions including almost all natural rock types. The accuracy of the XRF data was evaluated using results for the international standard of carbonates (MPC20, JDo1, and NIST 1c), together with a routine lab geological standard set, run as unknown. Analyses are considered accurate within 2 %–5 % for major elements and better than 10 % for trace elements. The loss on ignition (LOI) of the sample was determined by thermogravimetric analysis (TGA) (see Sect. 2.4).
2.3 X-ray powder diffraction
Data collection was performed using a Bruker D8 Advance Da Vinci diffractometer operating in Bragg–Brentano geometry. The instrument, located in the Department of Physics and Earth Sciences of the University of Ferrara (Italy), is equipped with an X-ray tube with a copper anode and a LynxEye XE silicon strip detector with an angular coverage range of 2.946° 2θ, calibrated to discriminate Cu Kα1,2 radiation. The sample was laterally loaded into a 2 mm deep cavity within a polymethylmethacrylate (PMMA) sample holder. The scan was conducted at room temperature (RT) in continuous mode from 5 to 125° 2θ, with a step size of 0.02° 2θ and a counting time of 3 s per step. In addition, a blade perpendicular to the sample holder was positioned at a sub-millimetre distance to reduce air scattering at low angles. Qualitative phase analysis was performed on the powder diffraction data using the Bruker AXS EVA software.
2.3.1 XRPD – Rietveld refinement
The fundamental-parameter approach was used for the Rietveld refinement of the green dolomite crystal structure using the Bruker TOPAS software (Cheary et al., 2004; Cheary and Coelho, 1992; Rietveld, 1969, 1967). Known instrumental parameters (the emission profile, goniometer radius, slit sizes, X-ray tube geometrical parameters, etc.) were employed to calculate the instrumental contribution to the peak profile, and the sample-related Lorentzian crystallite size and strain broadening information for each phase was extracted from the observed profile. An instrumental zero error was fixed at the value determined using a NIST Si640e standard, and the refinement included a sample displacement correction and a nine-term Chebyshev polynomial to model the background. The presence of associated magnesite was modelled through a multiphase refinement in which only the scale factor and unit-cell parameters for this phase were varied. The starting structural model for magnesite was that of Markgraf and Reeder (1985). The refinement of the dolomite phase was performed in the trigonal R-3H space group, starting from the structural model (i.e. unit-cell parameters, atomic coordinates, and atomic displacement parameters, ADPs) by Reeder and Wenk (1983). This resulted in final Rwp=0.1165, Rp=0.0844, and for 233 independent non-zero reflections in the collecting range. The refinement of the dolomite structure included unit-cell parameters, atomic coordinates, site scattering factors (for the 3a and 3b Wyckoff positions), and isotropic ADPs (Biso). During the refinement of the atomic coordinates, a set of soft constraints was applied to the metal–O bond lengths. Once the calculated standard deviation of the bond lengths was less than the tolerance applied to the constraints, the weight of the soft constraints, imposed as additional observations in the earlier stages of the refinement, was progressively reduced until the atomic coordinates were allowed to vary almost freely. The carbonate group was refined as a rigid body, with a C–O distance of 1.3 Å (Zemann, 1981). Isotropic ADPs for cations hosted at the same coordination site were constrained to vary identically. The final Rietveld refinement plot is shown in Fig. 2. Unit-cell parameters, final atomic coordinates, site occupancy, isotropic ADPs, and selected metal–oxygen bond distances are reported in Table 2.
2.4 Thermal analysis
Thermogravimetric analyses (TGA) and differential thermal analyses (DTA) were performed in a synthetic-air-controlled atmosphere from RT to 1200 °C using a Netzsch STA 409 PC LUXX® (Gerätebau, Germany) at the Department of Physics and Earth Sciences of the University of Ferrara (Italy). Measurements were performed in conditions of constant air flow at a heating rate of 10 °C min−1 from RT to 1200 °C. The tests were conducted using about 37 mg of sample placed in an inert crucible. Alumina (α-Al2O3) was used as control and standard.
2.5 Scanning electron microscopy
The SEM investigation was carried out at the MEMA interdepartmental centre at the University of Florence (Italy). The SEM analysis was performed on the massive sample, a piece of rock measuring cm. The sample was embedded in resin and carbon-coated using a Leica EM ACE200 low-vacuum coating system. The sample was coated with ∼25 nm of graphite for EDS (energy-dispersive X-ray spectroscopy) analysis. The analyses were carried out using a Zeiss EVO MA 15 SEM equipped with a tungsten filament for electron beam generation and multiple detectors (Oxford) for backscattered electron (BSE), secondary electron (SE), and chemical analysis (EDS). Data acquisition and processing were managed by Oxford's AZtec software for point chemical composition, chemical maps, and morphological and textural images.
2.6 Electron microprobe analysis
A centimetre-sized grain of dolomite was embedded in epoxy resin, polished with diamond paste down to 0.25 µm, and then coated with a ∼28 nm thick graphite layer. Chemical analysis was carried out using a JEOL-JXA-8230 electron microprobe (at the Department of Earth Sciences of the University of Florence, Italy) operated at 15 kV and 10 nA with a 10 µm beam diameter. Calibration standards used were olivine (for Mg Kα), ilmenite (for Fe Kα), bustamite (for Mn Kα), apatite (for P Kα), celestite (for Sr Lα), chromite (for Cr Kα), baryte (for Ba Lα), diopside (for Ca Kα), V and Ni metal (for V and Ni Kα), celestite (for S Kα), albite (for Si and Na Kα), and plagioclase (for Al Kα). Data were corrected for matrix effects using the ZAF (atomic number (Z), absorption (A), and fluorescence (F) correction) method of the JEOL software package. The average composition (means and ranges in wt % of oxides) is reported in Table 3.
2.7 X-ray absorption spectroscopy
An aliquot of the powdered sample was mixed with an appropriate amount of cellulose to prepare an absorber suitable for the XAS investigation in the fluorescence mode. The absorber was prepared as a pressed pellet. XAS investigations were carried out at the Ni K edge (8333 eV) at the BM08 LISA beamline of the European Synchrotron Radiation Facility (ESRF) (d'Acapito et al., 2019). The fluorescence yield was registered through a multi-element Ge detector set under liquid nitrogen temperature. The energy (eV) of the X-ray beam was selected by a fixed exit monochromator with a pair of Si (111) crystals (energy resolution ), while Si mirrors were used for harmonics rejection (Ecutoff≈15 keV). The step size in the XANES (X-ray absorption near-edge structure) region was 0.5 eV; the post-edge EXAFS (extended X-ray absorption fine structure) region of the spectrum was acquired with a fixed k step width of 0.05 Å−1. The beamline setup allowed for the simultaneous study of a reference material (a Ni metal foil in our setup) in a second chamber, located after the first, to provide accurate energy calibration. The pellet was placed in a sample holder inside an analytical chamber filled with He to minimise unwanted absorption by the gas environment inside the chamber. Measurements were carried out at room temperature. For EXAFS and XANES interpretation, a minimal set of relevant standards was registered: a metal Ni foil and NiO. The latter reference was also prepared as a pressed pellet mixed with cellulose in the opportune ratio. Reference spectra were recorded under the same environmental conditions but in transmission mode. For this set of measurements, two ionisation chambers were used, located up- and downstream of the pelletised samples along the X-ray path. The reduction of the experimental XAS spectra was performed using the Athena software, part of the Demeter package (Ravel and Newville, 2005). Namely, the raw absorption spectrum was energy calibrated, background subtracted, and normalised, and the EXAFS spectrum was extracted. The analysis of the EXAFS spectra was performed through the Artemis software, also part of the Demeter package (Ravel and Newville, 2005). Theoretical EXAFS paths for the Ni–O pair were generated with the FEFF8.0 code (Ankudinov et al., 1998), starting from the model reported in Pertlik (1986) for gaspéite using muffin-tin potentials and the Hedin–Lundqvist approximation. Data were analysed in the k range k= [2.4–5.9] Å−1, Fourier transformed in the R interval R= [0.9–2.9] Å, and fitted in the Fourier-transformed R space.
2.8 UV–Vis–NIR spectroscopy
Optical measurements were performed in the UV–visible–NIR range by using a JASCO V770 spectrophotometer (at the Department of Physics and Earth Sciences of the University of Ferrara, Italy) operating in diffuse reflectance (200–2500 nm range, 1 nm step size, BaSO4 integrating sphere, a Spectralon diffuse reflectance target as a white reference material). Reflectance (R∞) was converted to absorbance () by the Kubelka–Munk equation: . The crystal field absorbance bands were fitted by a Gaussian function (OriginLab). The peak interpretation was limited to the NIR–visible range (5000–25 000 cm−1), while further bands, occurring at 29 400, 32 400, and 41 000 cm−1, were deconvolved but not reported and discussed. Band deconvolution was initially centred on peak maxima and going to convergence by an automatic procedure. In this way, band energy (centroid) and width (full width at half maximum, FWHM) were obtained, where experimental error, including background correction and reproducibility, is around 2 %. The high-energy band due to metal–ligand charge transfer was fitted by a Lorentzian function with fixed energy (50 000 cm−1) and FWHM (24 000 cm−1).
2.9 Electron paramagnetic resonance spectroscopy
Room temperature EPR investigations were carried out using a Bruker ER 200 D instrument, available at the Department of Chemistry of the University of Florence (Italy). The operating microwave radiation frequency was approximately 9.78 GHz, and calibration was performed through an external reference of DPPH (2,2-diphenyl-1-picrylhydrazyl) radical. Spectra were registered in a panoramic view (scan range 0–1000 mT) to identify the main EPR signals, then repeating the spectrum in a region with a narrower field to register high quality spectra of the identified signals. During all measurements, modulation amplitude was set at 0.08 mT, and modulation frequency was set to 100 kHz. Total acquisition time for a single spectrum was 200 s.
Low-temperature EPR investigations were carried out at the Department of Chemical Sciences of the University of Padua (Italy). The operating microwave radiation frequency was approximately 9.56 GHz. Spectra were registered in the scan range 50–650 mT to identify all the expected EPR signals, with a modulation amplitude set to 0.3 mT and modulation frequency to 100 kHz. Total acquisition time for a single spectrum was 160 s.
2.10 Mössbauer spectroscopy
Room temperature Mössbauer spectroscopy was performed at the Department of Chemical Science, University of Padua, using a constant acceleration spectrometer equipped with a 57Co source in Rh matrix (nominal strength 1850 MBq). An LND, Inc. 4012 cylindrical proportional counter was used for signal detection. Due to the low Fe content of the sample and the low emission of the source after several half-lives, it was decided to collect the spectra using a large amount of material (≈1000 mg) mixed with petroleum jelly in a 38 mm diameter sample holder. This approach was chosen over the conventional method (using 80 mg of sample), which would have required an extremely long acquisition time, potentially affected by instrumental drift that is difficult to compensate for. This decision necessitated a pre-processing of the data to compensate for possible effects due to self-absorption and saturation, which could distort the shape and intensity of the spectral lines. The corrected spectrum was then fitted to Lorentzian line shapes using a minimum number of doublets. The obtained hyperfine parameters – isomer shift (δ), quadrupole splitting (Δ), and half linewidth at half maximum (Γ+) – are given in mm s−1, while the relative areas (A) are given in percent (%). Recoil software (Lagarek and Rancourt, 1998) was used to correct the spectrum and fit the data.
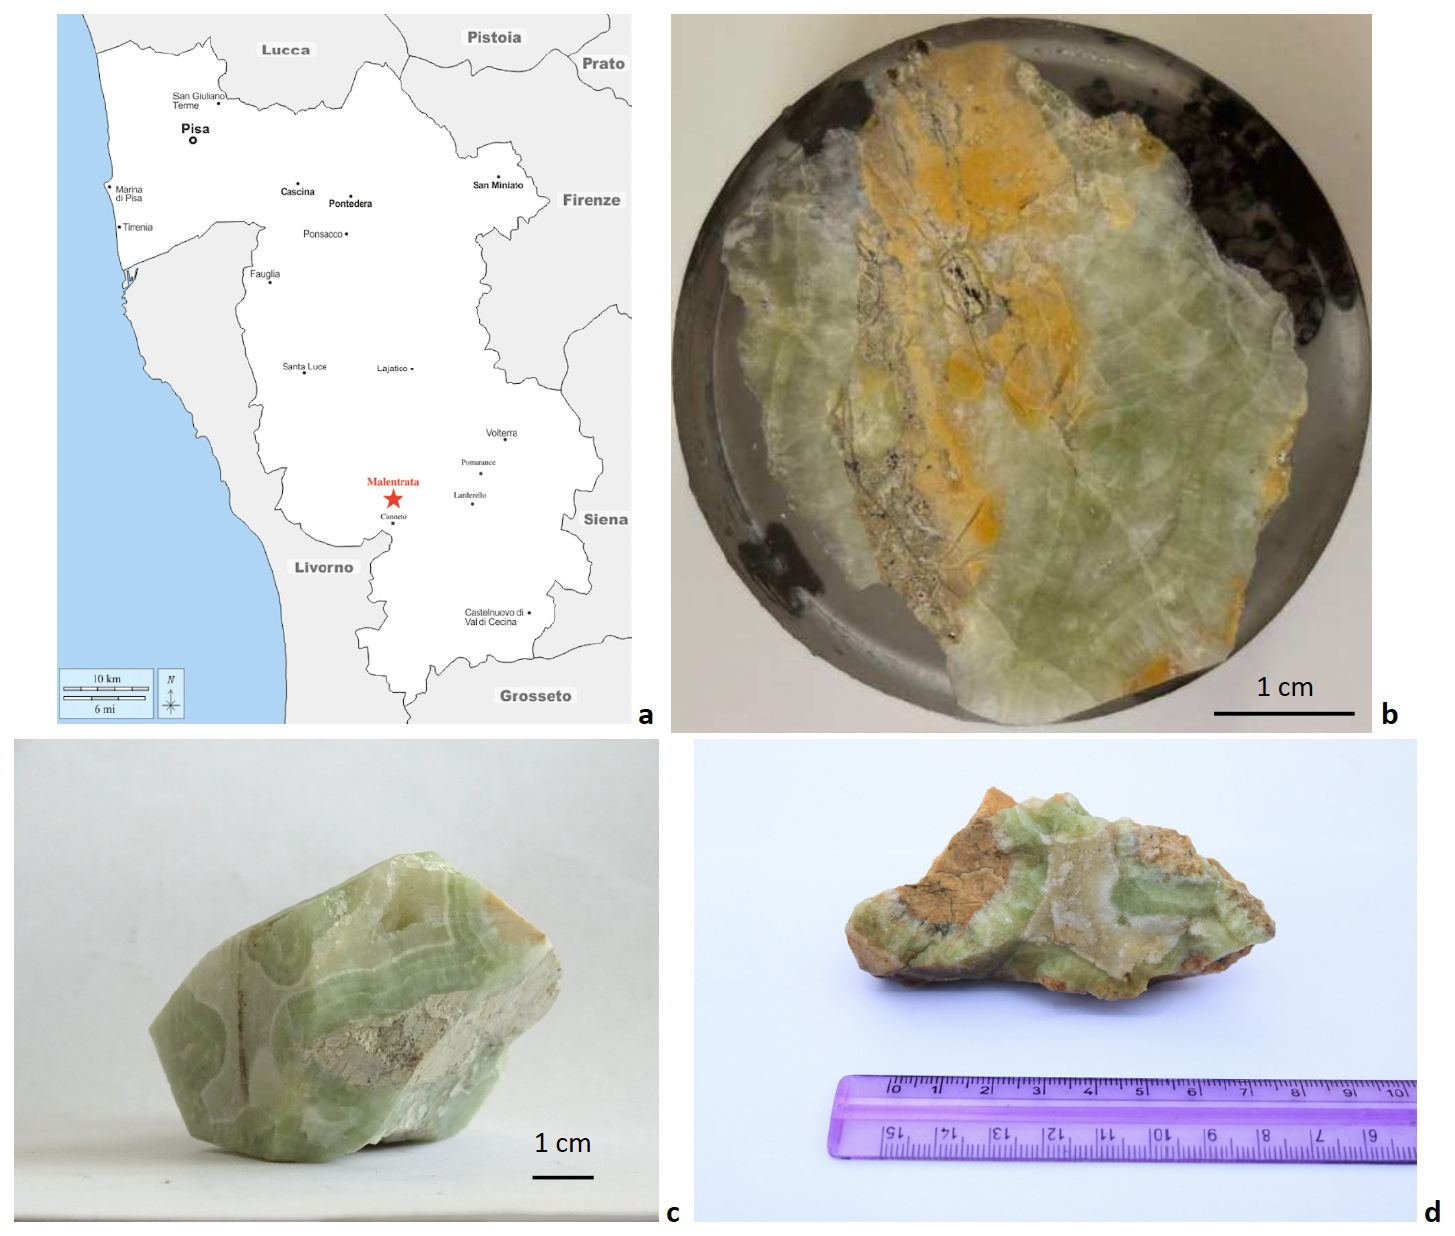
Figure 1(a) Localisation of the Malentrata magnesite mine (Pisa province, Tuscany, Italy; modified from d-maps.com). (b) Photograph of the Malentrata sample embedded in resin for the SEM investigation, performed at the binocular microscope; dolomite (green) and magnesite (yellow-brown) regions are apparent. (c, d) Photographs of other Malentrata samples showing the green dolomite zonation and the dolomite–magnesite boundary.
3.1 Microscopic features of the Malentrata rock fragment
As previously reported (Boschi et al., 2009; Rielli et al., 2022), microscopic analysis of the Malentrata rock fragment reveals a very close textural relationship between the weathered serpentinite matrix and several carbonate minerals, as well as additional minor phases (Figs. 1b and 3a). Higher magnification BSE micrographs allowed for the identification of these minor phases: phyllosilicates (Fig. 3b), chalcopyrite (Fig. 3c), chalcedony (Fig. 3d), and Fe and Cr oxides (Fig. 3a). The close intergrowth of compositionally distinct carbonate phases is highlighted in Fig. 3e and f. From SEM analyses, in particular BSE micrographs (Fig. 3a) and EDS spectra (Figs. S2–S11 in the Supplement), it is possible to identify carbonate-bearing veins associated with late-formation dolomite cutting through the pre-existing magnesite or even early-formation dolomite. The veins may also be chemically zoned, resulting in an enrichment of heavier elements (such as Fe and Mn) in the outer margins. When the main mass of dolomite is considered in regions where additional phases or secondary dolomite are present, some chemical zoning is still observed (Fig. 3g), confirming the high temporal and spatial variability of the chemical system. Finally, the existence of an abrupt change between the magnesite and dolomite mineralisation events is attested by the occurrence of net boundaries between the two minerals when in contact (Fig. 3h), a feature that remains characteristic even at very high magnification (Fig. 3i).
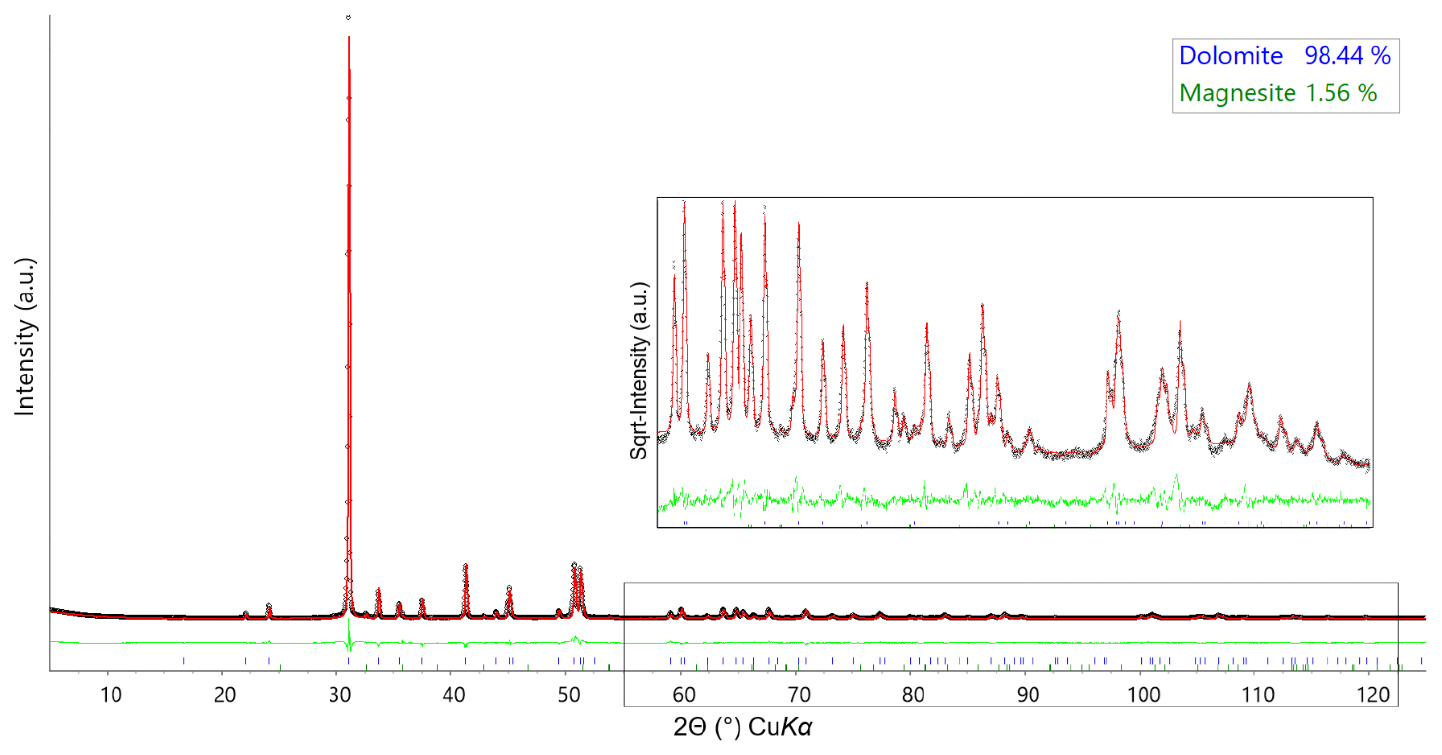
Figure 2Rietveld refinement plots for the green dolomite sample collected at RT. The experimental data are represented by circles (black), the calculated pattern is the solid red line, and the lower green curve is the weighted difference between the observed and calculated patterns. Vertical ticks at the bottom of the plot (colour-coded) indicate the position of the reflections for the identified phases. In the inset, a detailed view of the Rietveld refinement at high 2θ values is shown, with the intensity shown as square root.
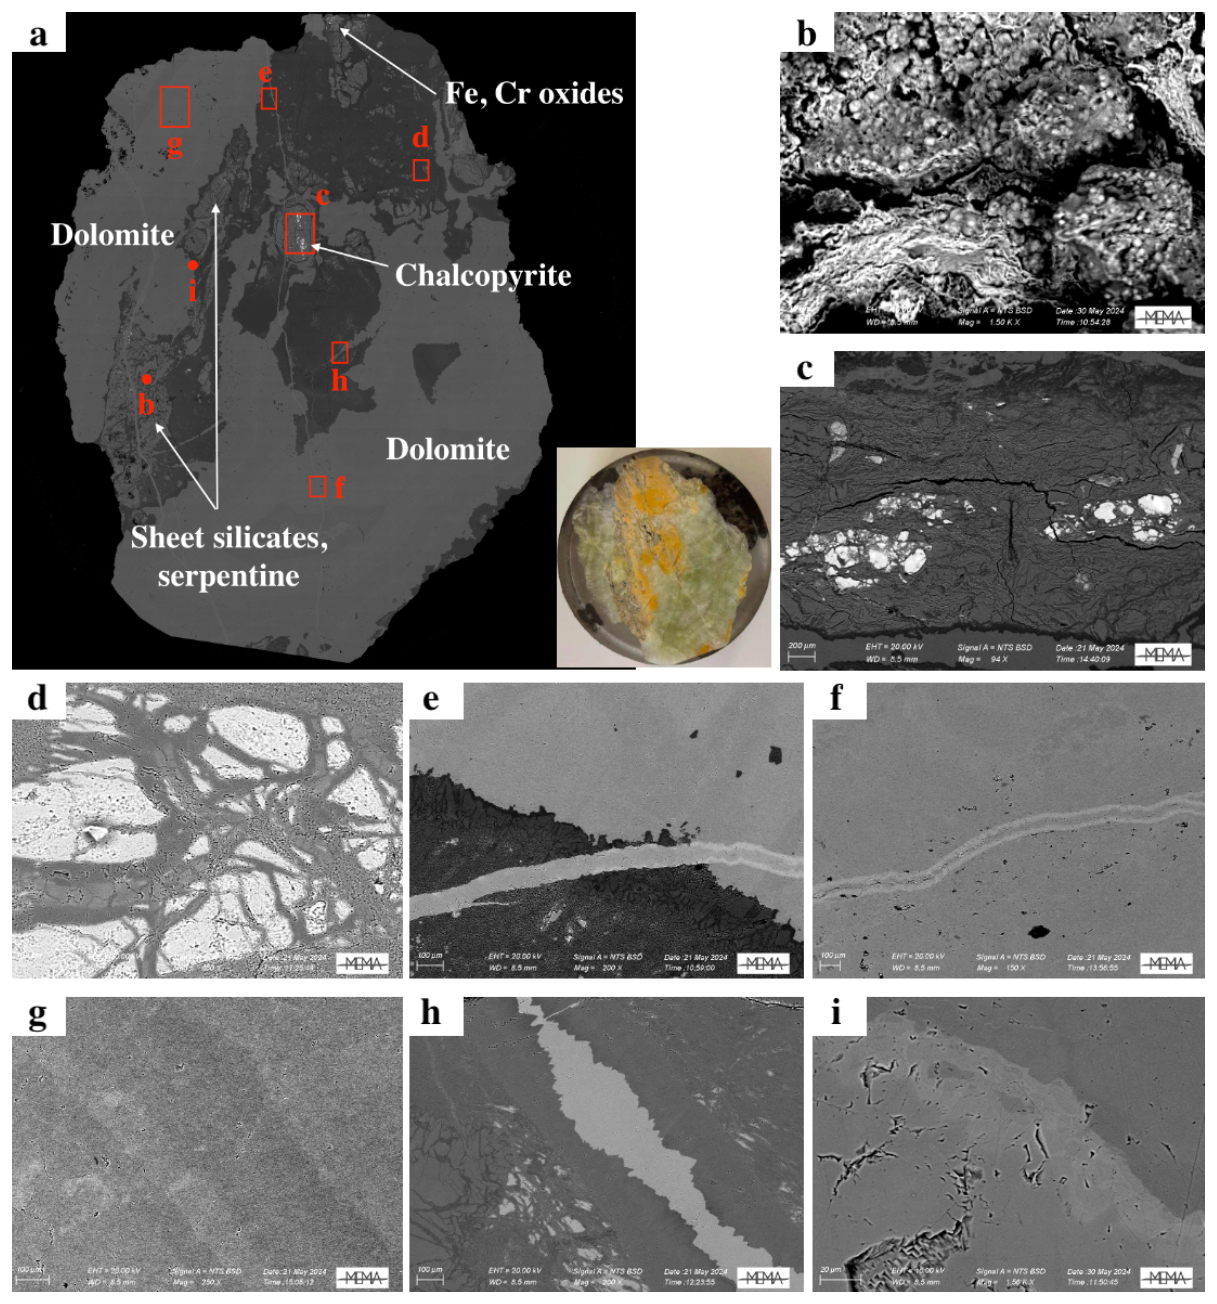
Figure 3(a) Backscattered electron (BSE) micrograph of the whole sample, obtained at 50× magnification: in white the localisation of the main minerals identified in the sample, in red the localisation and the size of the high-magnification (b–h) BSE micrographs. Magnification: (c) 94×, scale bar (SB) 200 µm; (d, g) 100×, SB 200 µm; (f) 150×, SB 100 µm; (e, h) 200×, SB 100 µm; (b, i) 1500×, SB 20 µm. In the Supplement the EDS spectra of panels (b)–(i) and a chemical map of a dolomite–magnesite boundary are shown.
Table 1Results of the microchemical SEM/EDS investigation are given: median, mean, interval, and standard deviation (SD) of 49 point analyses. Results obtained from XRF analysis of the green region of the sample powders are given: major elements (as weight %) and trace elements (as ppm). Major components are compared with the literature analyses.
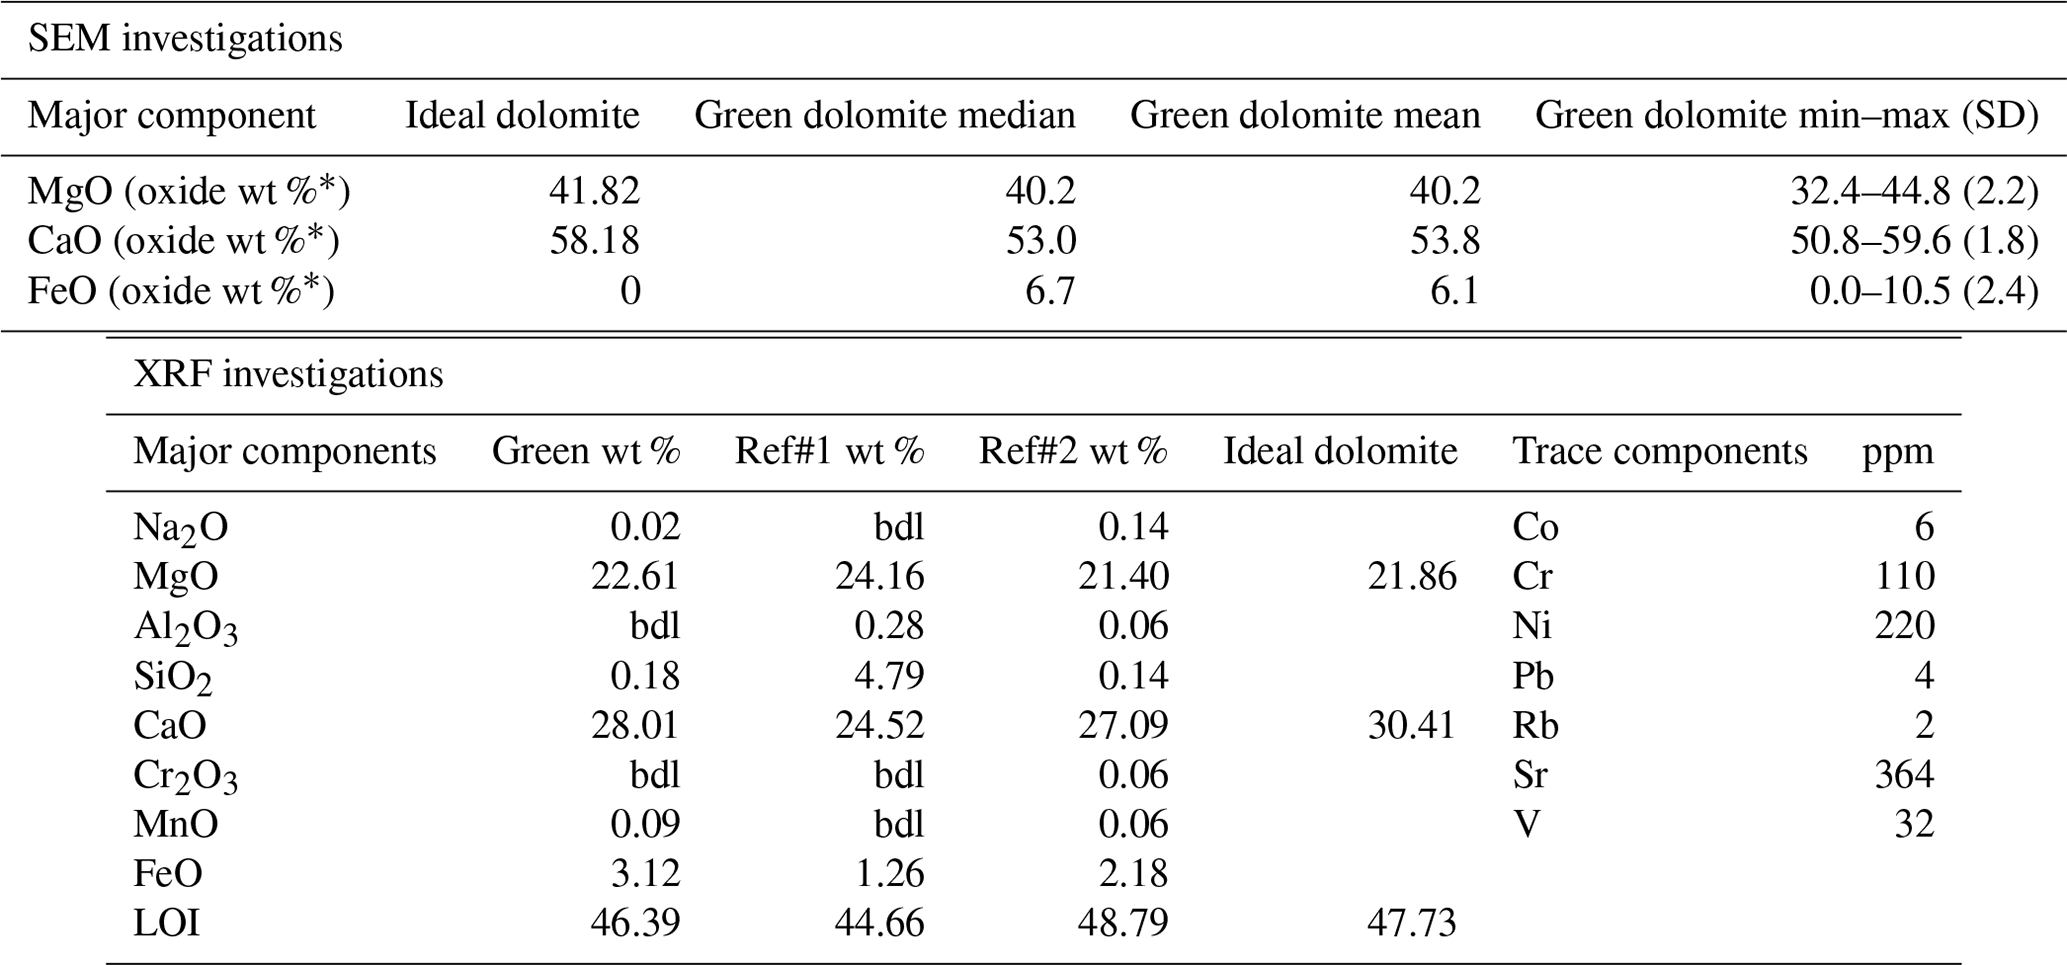
∗ Recalculated neglecting the CO2 content in the formula unit; Ref#1: Kurešević et al. (2022); Ref#2: recalculated from Boschi et al. (2009); bdl represents below detection limit.
3.2 General features of the green dolomite from the Malentrata Mine
Focusing on the green region of the sample, microanalysis coupled with BSE compositional maps (Fig. 3a and f) and XRF analysis (Table 1) led to the conclusion that this region clearly corresponds to an early-formation dolomite. XRPD Rietveld refinement of an aliquot of the green region of the sample reveals the presence of dolomite plus an Fe-rich magnesite (detected at concentrations of 1.6 wt %, Fig. 2). Compared to a dolomite of ideal composition (Tables 1 and 3), the Malentrata sample is slightly deficient in Mg and Ca with Fe compensating for this deficiency. The chemical formula, calculated from EPMA data (Table 3) (based on Σoctahedral-cations=2), yields indeed Mg0.97Ca0.92Fe0.09Na0.01(CO3)2, which also requires 0.01 apfu (atoms per formula unit) of Fe to be present as Fe(III) for charge balancing.
The chemical composition, as determined by EDS, XRF, and EPMA (Tables 1 and 3), indicates that, in addition to the major elements Ca, Mg, and Fe, the presence of chromophores was detected in trace amounts, especially Ni (220 ppm) and Cr (110 ppm). Kurešević et al. (2022) report that the green dolomite from the Vučkovica deposit also shows a distinctive enrichment (hundreds of ppm) of these ions.
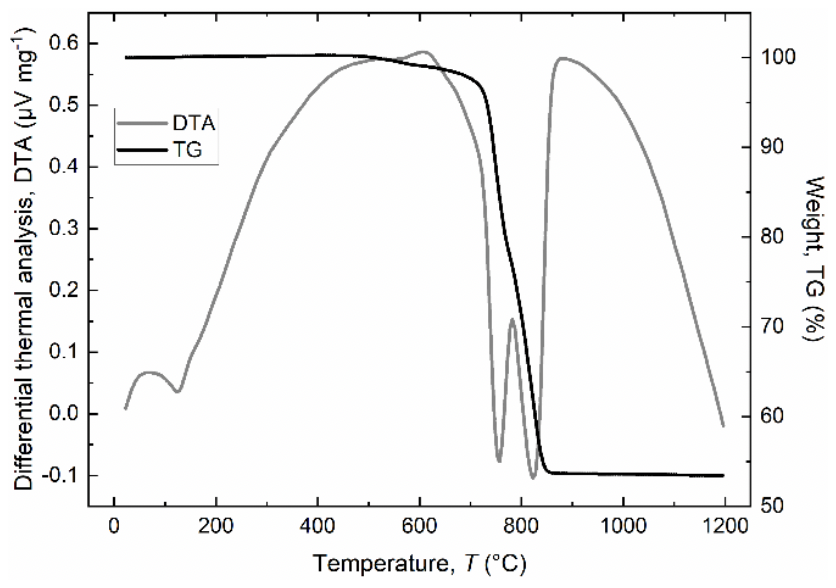
Figure 4Simultaneous DTA (grey line) and TG (black line) curves for the green dolomite sample heated in air from room temperature to 1200 °C at a rate of 10 °C min−1. DTA endotherms (downward inflections in the DTA curve) were observed at 120, 755, and 822 °C.
Figure 4 shows the thermal decomposition (TGA and DTA curves) of the green dolomite sample at temperatures ranging from RT to 1200 °C. The TGA curve is characterised by two separate weight loss stages with a total weight loss of about 47 wt %, which compares well with the LOI value reported in Table 1. The DTA curve shows a three-stage decomposition process, starting with the potential release of free and absorbed (if any) water (endothermic peak at ∼120 °C), followed by the endothermic decomposition of dolomite to calcite (CaCO3, or Mg-calcite) plus periclase (MgO) and the release of CO2 (peak centred at 755 °C), and the endothermic decomposition of calcite to CaO and CO2 (peak centred at 822 °C), in agreement with the reported values for a natural dolomite investigated under similar conditions (Gunasekaran and Anbalagan, 2007a, b). It is noteworthy that the decomposition peaks related to dolomite and calcite dissociations occur at slightly lower temperatures than those of other pure dolomite samples (Iwafuchi et al., 1983; Milodowski and Morgan, 1989; Otsuka, 1986; Resio, 2024). This fact is readily explained by considering the amount of Fe in the Malentrata sample, which influences the thermal response to heating through a temperature shift and a change in peak area.
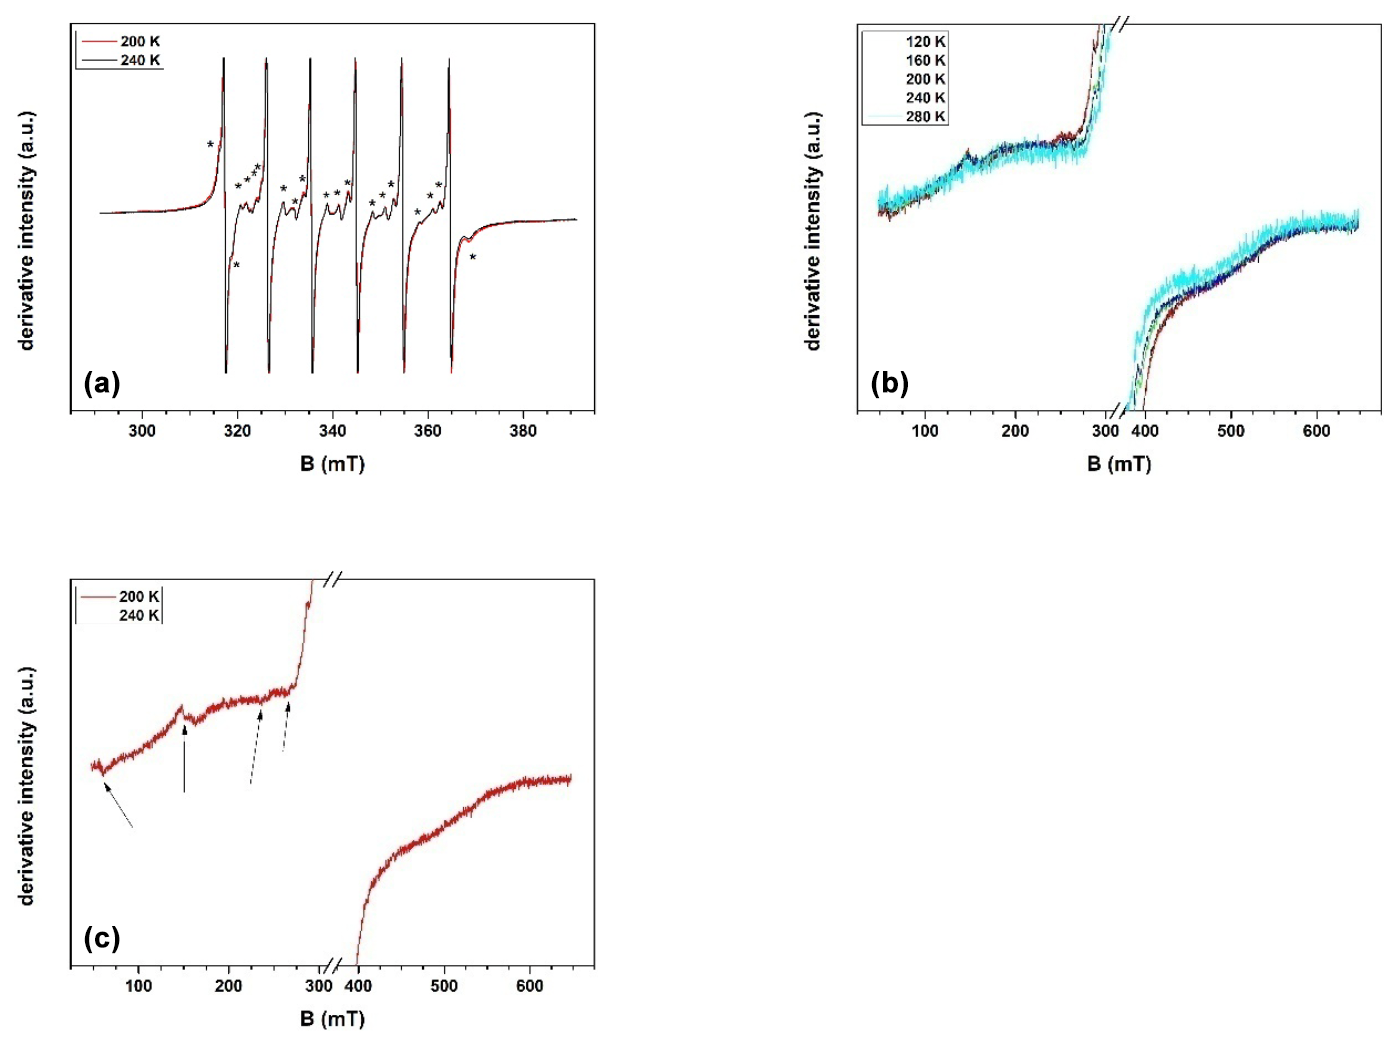
Figure 5(a) Detailed spectrum of Mn(II) registered in the sample of green dolomite, at two different temperature values; (b) panoramic spectra of the sample, exhibiting the temperature dependence (in the range 120–280 K) of a broad and weak signal; the spectrum at 280 K is multiplied by 2.4; (c) panoramic spectrum of the sample at 120 K, in which the presence of additional lines, marked by arrows, is visible.
3.3 Role of the transition metal ions
The role of transition metal ions in the green dolomite from the Malentrata Mine has been investigated by EPR, Mössbauer, XAS, and UV–Vis–NIR spectroscopic techniques.
The results of the EPR investigations are shown in Fig. 5. Three main distinct signals are identified: the main one is due to Mn(II) because of its characteristic hyperfine structure, while the other two are due to two different Fe(III) species. A detailed examination of the first signal shows that, in addition to the simple and intense sextet, additional lines are present (star symbols in Fig. 5a). The features of these additional lines (in particular the lack of a common periodicity with the main sextet) make it clear that there are two series of signals belonging to two different Mn(II) species. The most intense sextet, corresponding to the first Mn(II) species (labelled MnB), is characterised by six sharp and almost isotropic lines with no other features, indicating that this spectrum is essentially dominated by the hyperfine interaction. The second, weaker set of signals, attributed to a second Mn(II) species (MnA), is characterised by a more complex pattern, suggesting that the zero-field splitting interaction contributes in addition to hyperfine coupling. The latter spectrum has been tentatively attributed to Mn(II) ions replacing Mg in the dolomite structure, in agreement with Shepherd and Graham (1984). A numerical simulation carried out using the Hamiltonian parameters proposed in that study (isotropic Zeeman interaction, g=2.0028; isotropic hyperfine coupling, mT; axial zero-field splitting interaction, D=14.60 mT) agrees well with the present experimental evidence.
The assignment of the more intense sextet associated with MnB seems less straightforward. Indeed, the values of the isotropic g and A parameters, 2.0028 and −9.439 mT respectively, are almost identical to those observed for the MnA species, indicating a close similarity in the structural host of both the MnA and MnB species in the green dolomite sample. However, the almost complete absence of a zero-field interaction in MnB suggests that the local environment is definitely different. A convincing attribution can still be found in the work of Shepherd and Graham (1984), who claim another Mn(II) species, supposedly hosted in the Ca site of the dolomite structure, with g and a parameter values of 2.0020 and −9.48 mT, respectively. It should be recalled that Reddy et al. (2000) proposed the following values for Mn(II) in magnesite: g=2.007; a=9.0 mT. However, the spectrum shown by these authors apparently exhibits a fingerprint (not discussed) of the zero-field splitting interaction. Accordingly, we believe that the paramagnetic centre described by Reddy et al. (2000) is not appropriate to describe the experimental species revealed by the present investigation. Indeed, we can finally attribute the two Mn(II) signals in the experimental EPR spectrum to two different species, MnB and MnA, identified with aliquots of Mn(II) ions replacing Mg and Ca ions, respectively, in the dolomite lattice.
With regard to the broad signal between 100 and 600 mT (Fig. 5b), its attribution based on the spectrum at room temperature is hampered by the fact that no apparent fine or hyperfine structure can be detected. Therefore, the spectral change in the whole temperature range between 120 and 280 K was investigated. Based on the position and shape of this broad signal, its attribution to Fe(III) oxyhydroxide phases, likely cryptocrystalline or nanosized, is the more plausible. Indeed, as shown by Carbone et al. (2008), the particle size of Fe(III) oxyhydroxides would provide superparamagnetic signals that do not change line position with temperature, at least in a narrow temperature range, as in the present case.
The third group of lines share some common features, i.e. similar line width values and the fact that they are only clearly detectable below 240 K, with the signal-to-noise ratio increasing homogeneously with decreasing temperature (Fig. 5c). Accordingly, all these lines are interpreted as originating from the same paramagnetic centre. The geff values of the different lines are 11.5, 4.4, 2.9, and 2.6. A spectrum with such a broad structure, extending over hundreds of millitesla (mT), could be originated by an isolated paramagnetic ion, namely Fe(III), when subjected to a strong crystal field interaction (Di Benedetto et al., 2006). Moreover, a study carried out by Prissok and Lehmann (1986) on single crystals of synthetic dolomite revealed that Fe(III) is properly described by an interaction with a strong crystalline field, in full agreement with the proposed attribution. With regard to the host crystalline phase for this Fe(III) species, the quality of the EPR spectrum prevents a detailed interpretation. In principle, both magnesite and dolomite could host some Fe(III), by substituting Mg in the octahedral site (as discussed for Mn(II), the larger Ca octahedron of the dolomite crystal structure would not create conditions for a “strong ligand field”). Although a definitive attribution cannot be provided from EPR spectroscopy alone, a probabilistic consideration can be advanced: if the observed Fe(III) species were hosted in magnesite, whose abundance is 2 orders of magnitude lower than that of dolomite, its dilute state would be difficult to verify. Conversely, if Fe(III) species were hosted in dolomite, its dilution would be fully consistent. This would also be consistent with the EPMA results, which suggest that ca. 10 % of Fe should be present as Fe(III). Therefore, the Fe(III) species are attributed here to dolomite.
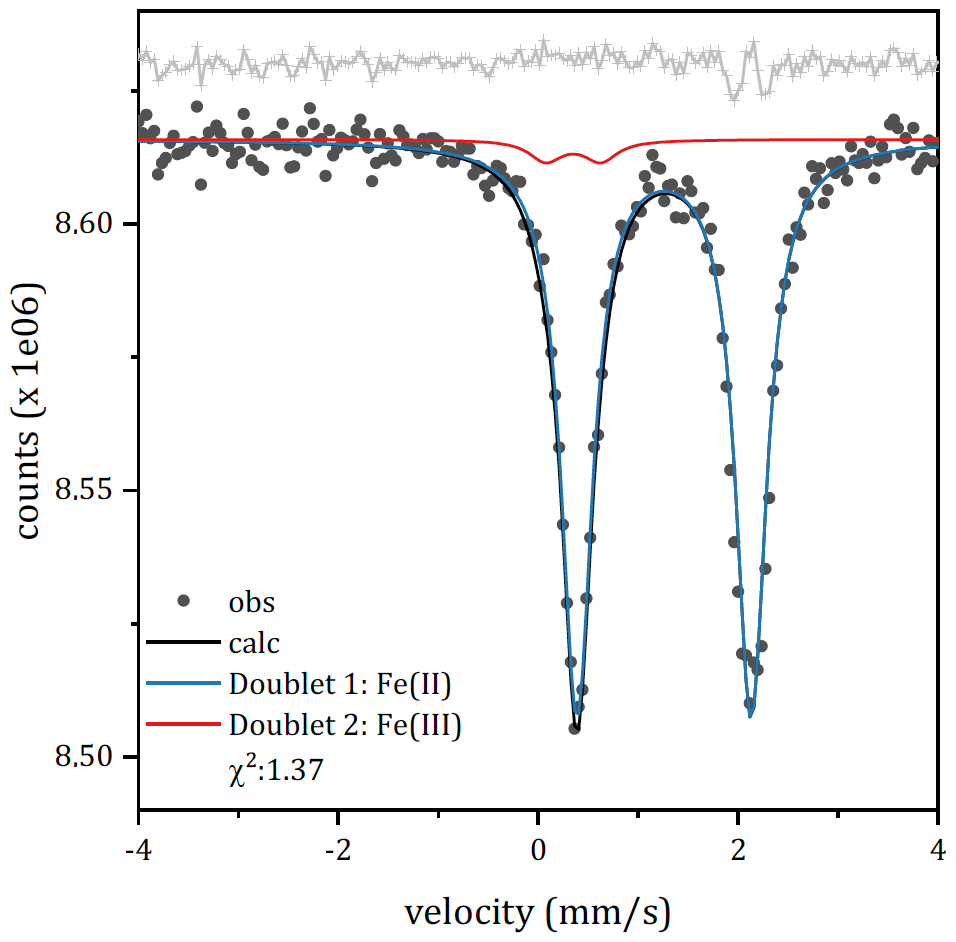
The RT Mössbauer spectrum (Fig. 6) exhibits an intense and slightly asymmetric doublet centred at ≈1.24 mm s−1. The intense doublet is similar to those observed in pioneering studies on Fe-substituted dolomites (Cole et al., 1978; Rozenson et al., 1980). The doublet was first fitted by a single doublet attributed to ferrous nuclei in a distorted octahedral site (δ=1.25 mm s−1 and Δ=1.50 mm s−1). Similar results, a single octahedral site exhibiting isomeric shift and quadrupole splitting of 1.24 and 1.48 mm s−1 respectively, were obtained by Moukarika and coworkers (Moukarika et al., 1991). The inclusion of an Fe(III) component, whose presence is unambiguously detected by EPR, has been done by constraining all fitting parameters. This constraint does not affect the goodness of fit: the errors on the hyperfine parameters of the Fe(II) site are not affected, and the chi-square shows a small variation. The proposed model consists of two doublets: one ascribable to Fe(II) and one to Fe(III), both in a distorted octahedral environment. The hyperfine parameters (reported in Table S1 in the Supplement) were fixed to those of Fe(III) in a distorted octahedral environment according to EPR measurements. The Fe(II) doublet shows quadrupole splitting slightly higher than that reported in the cited literature (1.743 mm s−1 instead of 1.50 mm s−1). This may be due to the presence of other substituents in the next-nearest neighbours. According to this model, the ratio is close to 0.02. It is interesting to note that the residuals on the high-velocity absorption of Fe(II) remain rather high. This is not due to the inadequacy of the fit but rather could be attributed to textural effects. An attempt to fit with multiple Fe(II) components did not significantly improve the distribution of residuals. Similar effects were observed in the literature (Ristić et al., 2017) for a similar carbonate, siderite, and ascribed to textural effects. Considering the possibility of iso-orientation also in dolomite, these textural effects are likely responsible for the observed asymmetry in the spectral lines.
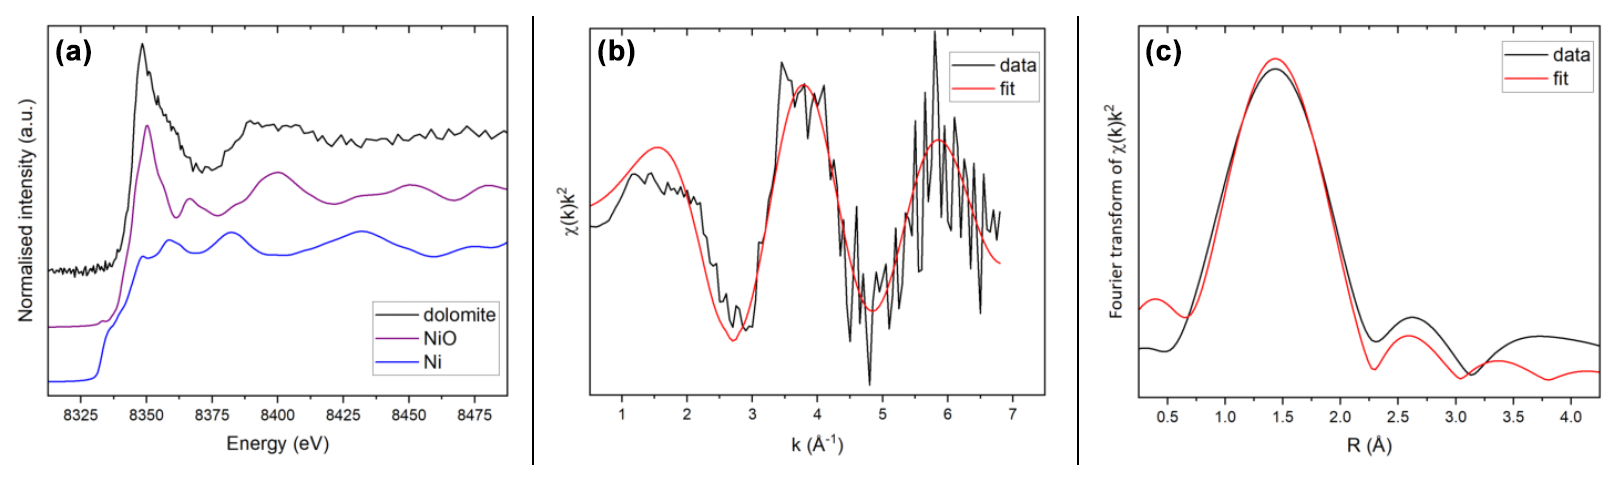
Figure 7(a) Normalised Ni K edge XANES spectra of the green dolomite, NiO and NiO samples; (b) k-weighted EXAFS region of the measured green dolomite sample, black, compared with the best multiparameter fit, red; (c) Fourier transform of the EXAFS trace in (b), black, compared with the best fit, red. Fits were performed in R space.
The XANES spectrum of the green dolomite sample is shown in Fig. 7a, compared with the spectra of two reference compounds, i.e. NiO and Ni0. The edge position of the spectrum compares very well with that of the NiO reference, resulting in a shift to higher energy values with respect to metallic Ni. It can therefore be concluded that Ni occurs in its divalent state, as expected.
With respect to the EXAFS region, the resulting spectrum was very noisy due to the high dilution of Ni(II) in the sample (220 ppm). The EXAFS spectrum in Fig. 7b is indeed the result of averaging 10 individual (1 h long) scans over the sample. Notwithstanding the background noise and the limited k range, the EXAFS signal is able to convey information about the first Ni coordination shell, namely the average Ni-O bond distance (Fig. 7b and c).
An attempt was made to refine the first shell of the experimental spectrum based on the assumption that a substitution of Mg by Ni at the dolomite octahedral site would result in a local environment similar to that of Ni in the gaspéite, NiCO3, crystal structure (Pertlik, 1986). Due to the limited number of independent points, only a limited number of parameters were refined. The coordination number N was defined as the ideal number derived from the bond-valence method (Gagné and Hawthorne, 2015) and the Debye–Waller factor (σ2) was constrained to vary between 0.001 and 0.01 Å2. The results of the quantitative EXAFS analysis yielded a Ni-O bond distance of 2.06(3) Å with a coordination number of 5.8(5), which is in full agreement with the value of 2.055 Å proposed for the gaspéite structure (Pertlik, 1986). The resulting S parameter is 1.1(3), and σ2 is 0.007(6) Å2. The EXAFS and Fourier transform fits are compared with the experimental spectra of the measured sample in Fig. 7b and c. Based on the quantitative interpretation of the EXAFS region, we conclude that Ni(II) in the green dolomite is hosted in octahedral coordination in a structural environment very close to that of gaspéite.
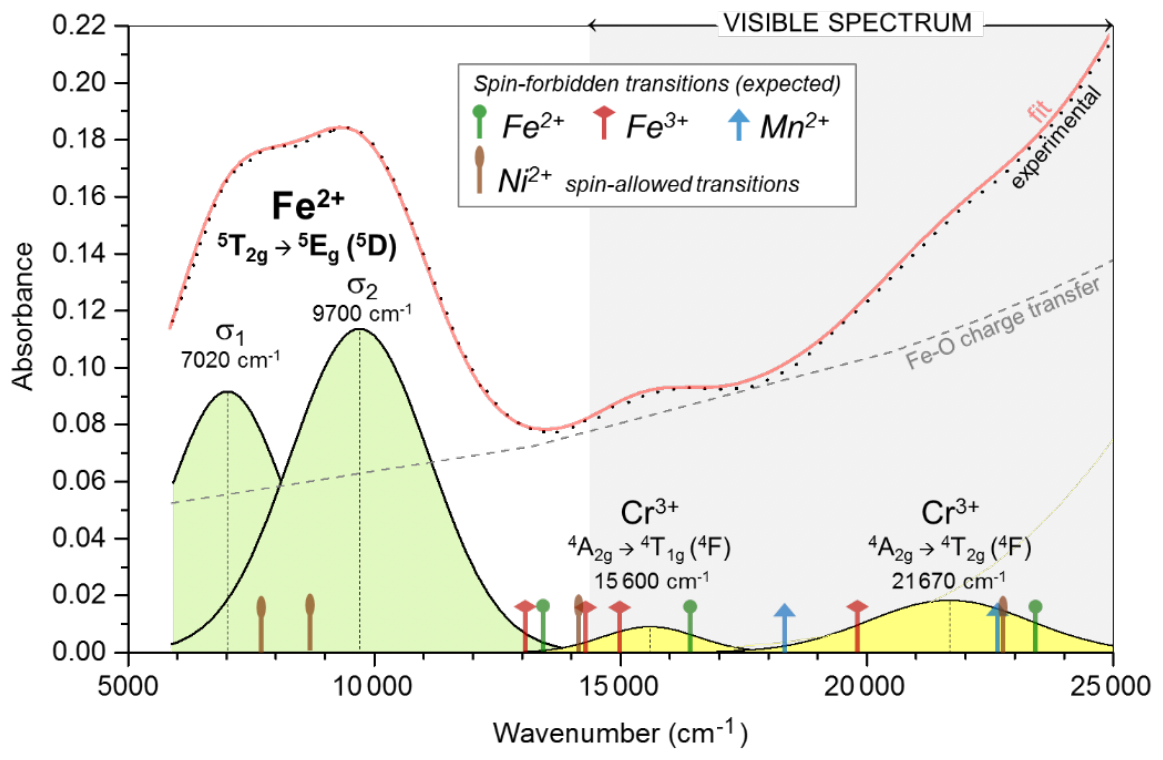
Figure 8NIR–visible spectrum of dolomite from Malentrata Mine, with band deconvolution and attribution to electron transitions (see Sect. 3.3).
The NIR–visible spectrum of dolomite from Malentrata is characterised by two main optical features (Fig. 8). A double band in the NIR region can be assigned to the spin-allowed transition 5T2g→5Eg (5D) of Fe2+ (d6, high spin) in octahedral coordination. In the visible range, the steep increase in absorbance from red to violet is ascribable to Fe-O metal–ligand charge transfer (MLCT).
The 5T2g→5Eg transition of Fe2+ is affected by Jahn–Teller splitting into two sub-bands centred at 7020±20 cm−1 (σ1) and 9700±20 cm−1 (σ2), respectively (Burns, 1993). The resulting crystal field strength ( cm−1) is lower than the Δ0∼8840 cm−1 in ankerite (Rossman, 2024) and the Δ0∼8600 cm−1 (Rossman, 2024) or 8970 cm−1 in siderite (Taran et al., 2017), particularly in the case of calcite, where a Δ0 value as high as 9880 cm−1 was derived (Gunasekaran and Ambalagan, 2008). This difference is mainly due to the low wavenumber of the σ1 sub-band of dolomite in comparison with ∼8100 cm−1 of ankerite (Rossman, 2024), ∼8500 cm−1 (Rossman, 2024) and 7720 cm−1 (Taran et al., 2017) of siderite, and 9120 cm−1 of calcite (Gunasekaran and Ambalagan, 2008). In contrast, the wavenumber of the σ2 sub-band is comparable for dolomite, ankerite, and siderite (always in the 9400–9700 cm−1 range), while it is remarkably higher for calcite (10 640 cm−1). As a consequence, the splitting of the 5T2g→5Eg transition of Fe2+ in dolomite ( cm−1) is remarkably broader than in other carbonates, where δ is always within the 1000–1700 cm−1 range (Gunasekaran and Ambalagan, 2008; Rossman, 2024; Taran et al., 2017).
Once the contribution of the Fe-O MLCT is subtracted, the residuals define two broad bands centred at 15 600±20 and 21 670±20 cm−1, respectively (Fig. 8). Any band from Ni2+ transitions or spin-forbidden transitions of Fe2+, Fe3+, or Mn2+ cannot be individually resolved. They are expected to occur for Fe2+ (based on the Tanabe–Sugano 3d6 diagram, Δ0=8360 cm−1, and Racah B = 820 cm−1) at ∼13 400, ∼16 400, and ∼23 400 cm−1 for the 3T1g(3H), 3T2g(3F), and 3Eg(3H) transitions, respectively. The Fe3+ transitions in dolomite have been reported at 13 100, 14 284, 14 995, and 19 800 cm−1 for the 4T1g, 4T2g, 4T2g, and 4Eg (all 4G) transitions, respectively (Reddy et al., 2008). The Mn2+ transitions in rhodocrosite are known to occur at 18 300 and 22 700 cm−1 for the 4T1g(4G) and 4T2g(4G) transitions, respectively (Frost et al., 2006). Based on the gaspéite spectrum, a contribution from the spin-allowed transitions of Ni2+ in octahedral coordination is expected at ∼7710 and ∼8690 cm−1 for 3A2g→3T2g (3F) as well as ∼13 200 and ∼22 700 cm−1 for 3T1g (3F) and 3T1g (3P), respectively (Bayyareddy and Frost, 2004). Overall, the occurrence of Fe2+, Fe3+, Mn2+, and Ni2+ crystal field transitions cannot explain the peaks at 15 600 and 21 670 cm−1 in the visible spectrum, even though they certainly contribute to the broad width of these bands. Interestingly, the wavenumbers of these bands match the expected values for the 4T1g and 4T2g (4F) spin-allowed transitions of Cr3+ in octahedral coordination (based on the Tanabe–Sugano 3d3 diagram, Δ0=15 600 cm−1, and Racah B = 625 cm−1). The Ni2+ spin-allowed transitions might interfere, but they only partially overlap the observed bands at 15 600 and 21 670 cm−1. Despite an extremely low content in the sample studied (110 ppm), the contribution of Cr(III) to the colour of the Malentrata dolomite is not negligible due to a crystalline field stabilisation energy (CFSE) which, together with that of octahedrally coordinated Co(III) and Fe(II), is much higher than that of other transition metal ions (e.g. Burns, 1993). The intriguing hypothesis of the role of Ni(II) in the colouring of the sample is reduced to speculation, because of both the very low concentration (220 ppm) and the uncertain assignment of bands in the visible spectrum. However, both contributions are secondary to the dominant contribution associated with the Fe-O MLCT.
3.4 Crystal chemistry
The combination of crystal structure and colour of the green dolomite from Malentrata Mine is that of a natural unicum. The unit-cell parameters, as determined by Rietveld refinement, are as follows: a=4.7946(1) Å, c=15.9486(3) Å, and V=317.51(1) Å3. Accordingly, the lattice parameter values are less than approximately 0.3 % and 0.5 % (a and c, respectively) of the average of those reported in the Inorganic Crystal Structure Database (ICSD) for dolomite structures at ambient conditions (the reference list of compared structures from the ICSD is provided in the Supplement).
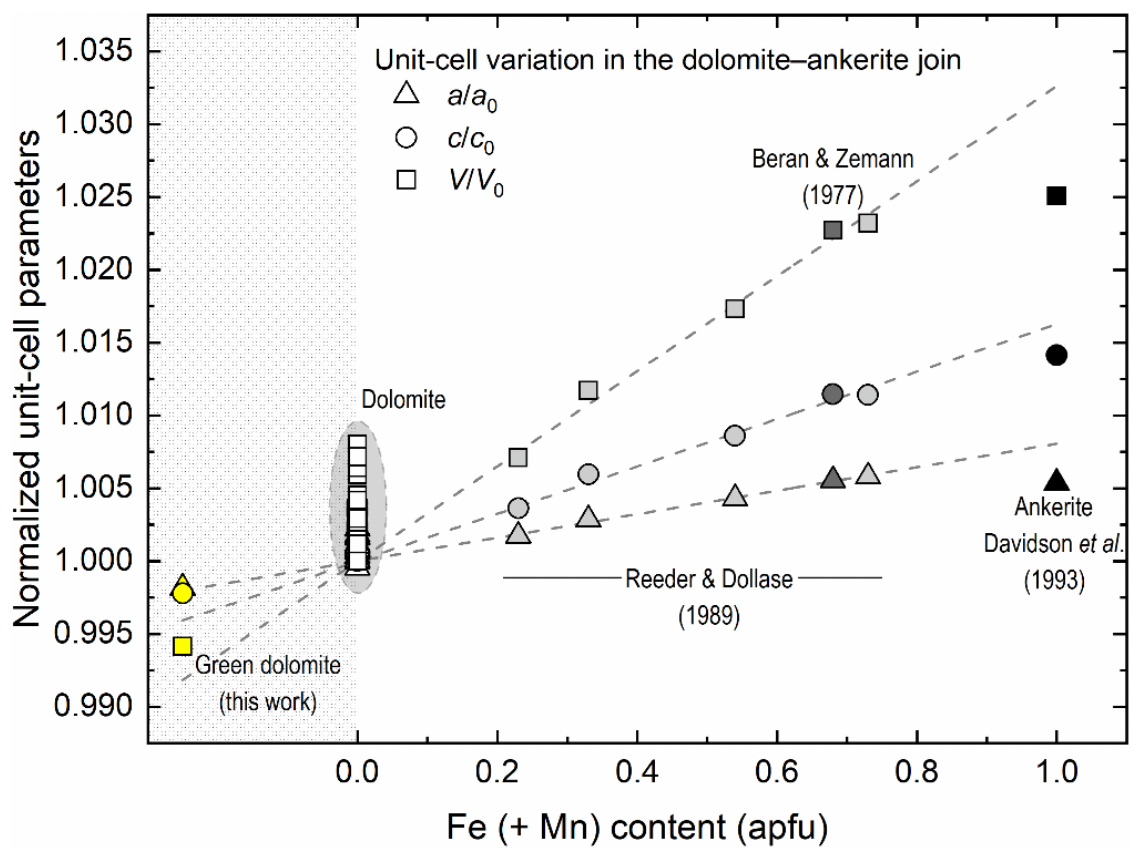
Figure 9Normalised unit-cell parameters along the dolomite–ankerite join as a function of increasing Fe (+ Mn) content. Empty, light grey, dark grey, and black symbols represent near-ideal dolomite samples (see reference list in the Supplement), the ankerite samples of Reeder and Dollase (1989), the ankerite of Beran and Zemann (1977), and the synthetic ankerite of Davidson et al. (1993), respectively. The unit-cell parameters of the green dolomite are represented by yellow symbols. It is noteworthy that the unit-cell parameters of the green dolomite are plotted with those of the dolomite and ankerite terms from the literature solely for graphical representation purposes, as they fall within a chemically implausible field (grey shaded), where the Fe (+ Mn) content is negative. Errors are smaller than the symbol size.
A possible explanation for the observed lattice shrinkage is a Ca-Mg disorder at the octahedral sites 3a and 3b of the dolomite structure. This would indicate that the green dolomite was subjected to a quenching process from a high-temperature (and/or high-pressure) condition, which is not supported by previous petrographic studies. An increase in cationic disorder, as defined by the order parameter (where s=1 for xCa=1 in a completely ordered dolomite, and s=0 for xCa=0.5 in a completely disordered dolomite, e.g. Antao et al., 2004), would result in an average increase in lattice parameters, particularly along the c axis (Reeder and Wenk, 1983). From a crystallochemical perspective, the XRF and EPMA indicate a composition that falls along the dolomite–ankerite join. In fact, in addition to Ca and Mg, the green dolomite sample contains significant amounts of Fe and Mn (Tables 1 and 3). The incorporation of Fe and Mn into the dolomite crystal structure at the expense of Mg at the 3b site would result in a lattice expansion (e.g. Beran and Zemann, 1977; Reeder and Dollase, 1989; Davidson et al., 1993). Indeed, the ionic radii of both Fe2+ and Mn2+ when octahedrally coordinated are larger than that of Mg2+ (i.e. 0.78 and 0.83 Å vs. 0.72 Å, respectively; Shannon, 1976). The compositional dependence of the unit-cell parameters of dolomites and ankerites is illustrated in Fig. 9, as derived from the literature. An almost linear expansion with increasing Fe (+ Mn) content, which primarily replaces Mg, is observed from the dolomitic field (empty symbols with grey background) up to ∼70 mol % ankerite. The unit-cell parameters of the green dolomite are also plotted with those of the dolomite and ankerite terms in Fig. 9 for the sole purpose of graphical representation. As these values are smaller than those observed in dolomites (where Fe2+ (+ Mn) is equal to or close to 0), they fall within a chemically implausible range where the Fe (+ Mn) content is less than 0. Moreover, a small amount of Si is detected only by XRF analysis (0.18 % of SiO2). As Si was only detected by XRF and not by EPMA point analysis, it can be concluded that the small amount of Si is not related to the chemistry of the dolomite phase investigated.
For the reasons given above, several strategies have been attempted to find the best structural solution. When Ca and Mg are ordered (i.e. fully occupying the octahedral sites 3a and 3b, respectively), the Rietveld refinement converges with an agreement factor . Through this atomic occupancy scheme, residuals of electron density (of ∼0.5 e− Å−3) with atomic coordinates close to those of Ca and Mg cations are detected through a three-dimensional (3D) Fourier analysis. It is noteworthy that the structural refinement of the green dolomite sample exhibits a significant improvement (final agreement factor ) when the partial substitution of both Ca and Mg by Fe is taken into account at the 3a and 3b sites, respectively. The final refined occupancy is Ca0.934Fe0.066 and Mg0.939Fe0.061 at site 3a and 3b, respectively, as detailed in Table 2. This finding is in good agreement with the total Fe amount derived from chemical data (0.11 and 0.09 apfu from XRF and EPMA, respectively).
Table 2Phase fraction and unit-cell parameters for the identified crystalline phase in the green dolomite sample and final atomic coordinates, site occupancy, isotropic ADPs, and selected metal–oxygen bond distances for the dolomite phase (note that s.g. represents space group).
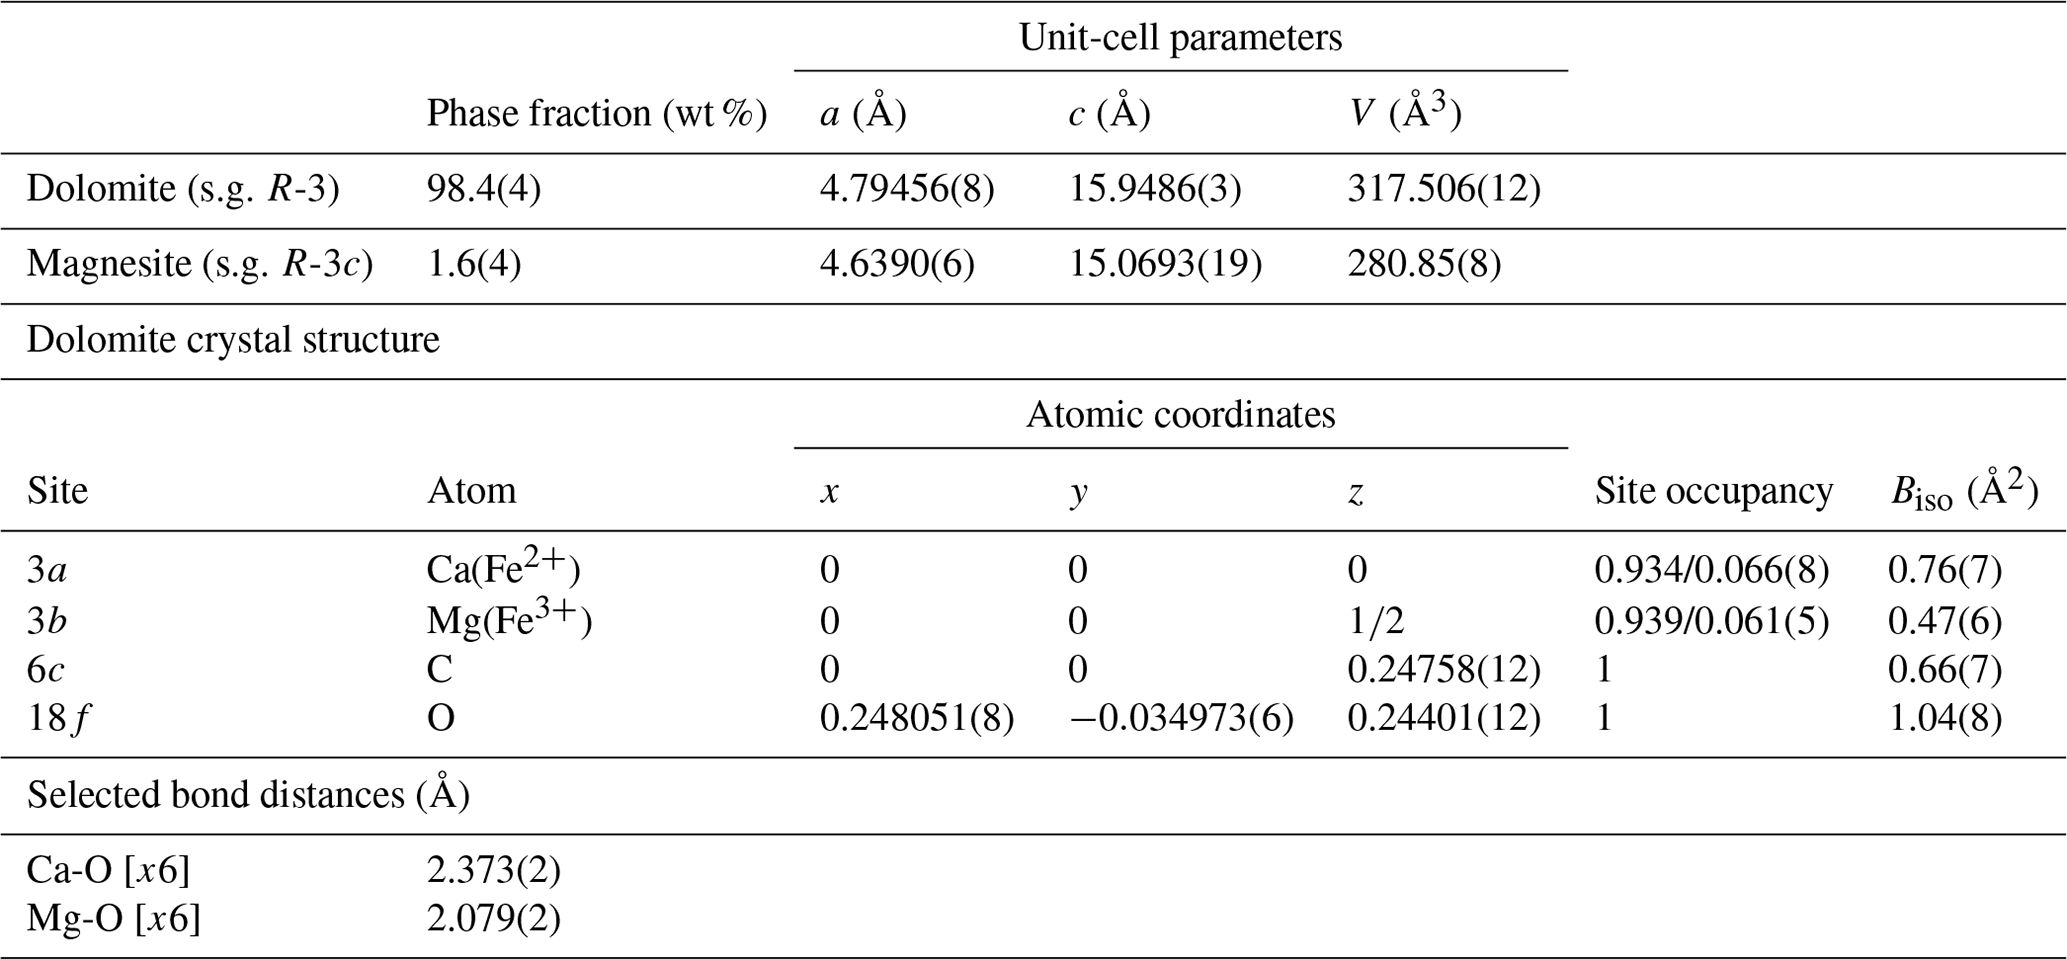
Table 3Chemical composition obtained from EPMA, with mean (mean in wt % oxides), range, and standard deviation of 28 point analyses of green dolomite.
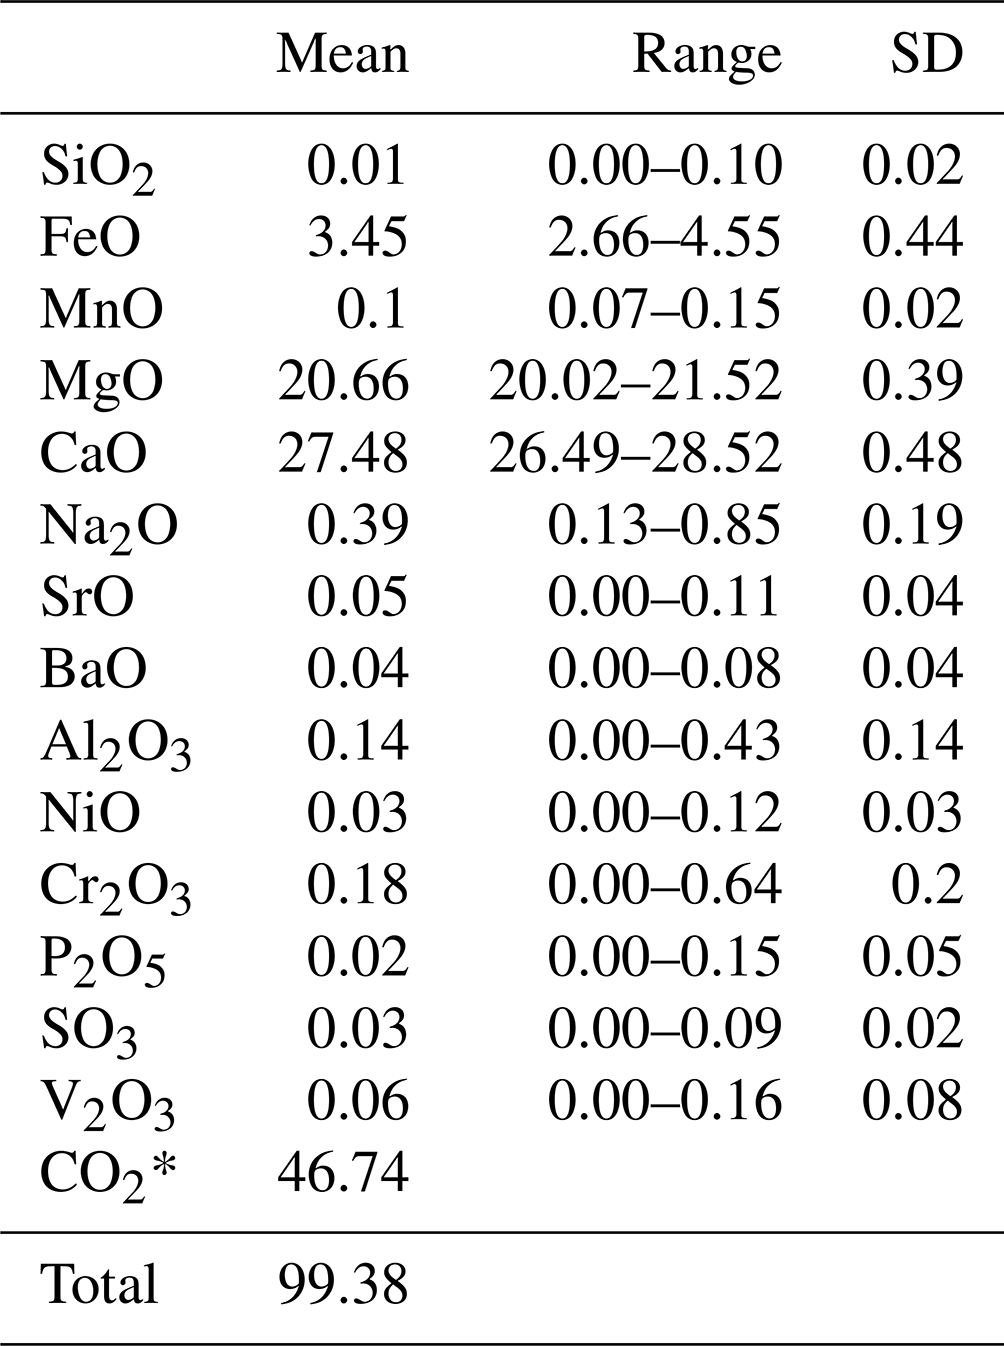
* CO2 mass % calculated on the basis of the ideal stoichiometry.
The pronounced lattice contraction observed in the green dolomite sample is further highlighted when the variation in metal–oxygen bond lengths is inspected (Table 2). It is evident that, regardless of the atomic occupation scheme employed, the octahedral metal–oxygen bond lengths of the green dolomite are the shortest when compared to those for dolomite and ankerite structures under ambient conditions, as reported in the Inorganic Crystal Structure Database. Specifically, the cations at sites 3a and 3b are coordinated by six oxygens at 2.374 and 2.110 Å, respectively. This implies that the Fe incorporation mechanism is at least partially ordered, with the Fe2+ substituting for Ca and Mg and with the smaller (0.645 Å) Fe3+ substituting only for Mg at the 3b site, resulting in a reduced mean metal–oxygen bond distance at both sites.
Indeed, both EPR and UV–Vis analysis demonstrated the presence of both Fe2+ and Fe3+ in the investigated sample. The crystal field strength determined by UV–Vis spectroscopy in the dolomite from Malentrata Mine is compatible with an Fe2+-O distance of 2.15±0.02 Å, using the overall relationship in silicates and carbonates as a reference (Fig. S12). This value is slightly longer than the Fe2+-O distance in siderite (2.14 Å) or ankerite (2.13 Å) and between the metal–oxygen distances for sites 3a and 3b in pure dolomite (2.38 and 2.09 Å, respectively). The occurrence of Fe2+ ions in the smaller site (3b with Mg-O distance of 2.11 Å) implies a local compressive constraint, which would translate in a shorter Fe2+-O distance and larger crystal field strength with respect to siderite or ankerite (not observed in the green dolomite). In contrast, Fe2+ ions accommodated at the larger site (3a with Ca-O distance of 2.37 Å) undergo structural relaxation, which would result in a longer Fe2+-O distance and smaller crystal field strength than in ankerite and siderite (apparently the features of the Malentrata Mine dolomite). This interpretation supports the XRD interpretation with Fe2+ at site 3a.
The study carried out on the green dolomite from Malentrata confirms the unicity of this mineralogical occurrence, which rests on two main relevant features: the uncommon crystal chemistry and the colour. The overall results of the present study, in fact, allow us to reveal a very peculiar double (partial) substitution of Ca2+ for Fe2+ and of Mg2+ for Fe3+ in the green dolomite from Malentrata, which would explain the volumetric shrinkage, chemical composition, and valence state of the ions. To the best of the authors' knowledge, this replacement mechanism is unprecedented in the description of natural carbonates.
The colour of the dolomite from Malentrata Mine is due to the occurrence of two absorbance maxima, one in the blue–violet region and the other in the red–orange region of the visible spectrum. Although the former is very strong and the latter weak, this still seems to satisfy the basic requirement for a green colour. Indeed, the minimum of absorbance, located around 18 000 cm−1, corresponds to green wavelengths. The human eye should see this transmitted light as predominant, since our optical perception is more efficient in the green than in the blue or red regions. The green colour therefore seems to be due to iron – by Fe-O MLCT absorbance of the blue–violet wavelengths – together with Cr3+ by crystal field absorbance of the red–orange wavelengths (with possible cooperative effects by Fe3+ and Ni2+). Although the latter contribution is very weak, it is sufficient to shift the maximum of transmittance towards the green region.
The results of the present investigation do not end the interest in the green dolomite from Malentrata. Two relevant questions emerge from our findings: (i) under which conditions was the mineralisation of the green dolomite possible, and (ii) how does this process relate to the general process of carbonation of the serpentinite that has occurred in the region?
Chemical, structural, and spectroscopic data are available upon request.
The supplement related to this article is available online at https://doi.org/10.5194/ejm-37-517-2025-supplement.
LA, MA, CB, MD, MM, GOL, ES, RT, AZ, GM, and FDB designed and carried out the different characterisation experiments. LA, MA, MD, and FDB prepared the manuscript with contributions from all co-authors.
The contact author has declared that none of the authors has any competing interests.
Publisher's note: Copernicus Publications remains neutral with regard to jurisdictional claims made in the text, published maps, institutional affiliations, or any other geographical representation in this paper. While Copernicus Publications makes every effort to include appropriate place names, the final responsibility lies with the authors.
This article is part of the special issue “Celebrating the outstanding contribution of Paola Bonazzi to mineralogy”. It is not associated with a conference.
Francesco Di Benedetto had the rare privilege, shared with Giovanni Orazio Lepore, of being first a student and then a colleague of Paola Bonazzi: under this double point of view, he had the chance of appreciating her dedication to teaching. For some years, we were involved in teaching the basics of mineralogy to the undergraduate students of Geology at the University of Florence: I will always remember those years as among the most enthusiastic and fruitful of my life. The same thoughts are shared by Giovanni Orazio Lepore, whose whole career, first as a student and then as a researcher, has been so deeply influenced by Paola.
The authors wish to express their sincere gratitude to Laura Chiarantini and Tiziano Catelani for their essential contribution to the SEM analyses conducted at MEMA (Florence). A special thanks to Teresa Salvatici from the Department of Earth Sciences, University of Florence, for her assistance in preparing the sample used in the SEM analysis and to Sandra Ristori, Department of Chemistry, University of Florence, for their support during the EPR analysis. Their support, availability, and reliable professionalism, as well as their valuable input in interpreting the obtained data, are deeply appreciated. Francesco d'Acapito and Jacopo Orsilli are warmly acknowledged for their assistance during the beamtime at the BM08 LISA Beamline. ESRF is acknowledged for provision of synchrotron radiation during the experiment (no. HG217).
This paper was edited by Dmitry Pushcharovsky and reviewed by three anonymous referees.
This study was funded by the University of Ferrara under the programmes FAR 2023 and FAR 2024 to Francesco Di Benedetto and FAR2023 to Costanza Bonadiman.
Ankudinov, A. L., Ravel, B., Rehr, J. J., and Conradson, S. D.: Real-space multiple-scattering calculation and interpretation of x-ray-absorption near-edge structure, Phys. Rev. B, 58, 7565–7576, https://doi.org/10.1103/PhysRevB.58.7565, 1998.
Antao, S. M., Mulder, W. M., Hassan, I., Richton, W. A., and Parise, J. B.: Cation disorder in dolomite, CaMg(CO3)2, and its influence on the aragonite + magnesite > dolomite reaction boundary, Am. Mineral., 89, 1142–1147, 2004.
Bayyareddy, J. and Frost, R. L.: Electronic and vibrational spectra of gaspeite, Neues Jahrb. Mineral. Abh., 11, 525–536, 2004.
Beran, A. and Zemann, J.: Refinement and comparison of the crystal structures of a dolomite and of an Fe-rich ankerite, Tschermaks Mineral. Petrogr. Mitteilungen, 24, 279–286, https://doi.org/10.1007/BF01081130, 1977.
Boschi, C., Dini, A., Dallai, L., Ruggieri, G., and Gianelli, G.: Enhanced CO2-mineral sequestration by cyclic hydraulic fracturing and Si-rich fluid infiltration into serpentinites at Malentrata (Tuscany, Italy), Chem. Geol., 265, 209–226, https://doi.org/10.1016/j.chemgeo.2009.03.016, 2009.
Burns, P.: Mineralogical Applications of Crystal Field Theory, Cambridge Topics in Mineral Physics and Chemistry, Cambridge University Press, https://www.cambridge.org/core/books/mineralogical-applications-of-crystal-field-theory/CDF9711F1C9F946772EC5ADE2C896522 (last access: 24 July 2025), 1993.
Cai, W. K., Liu, J. H., Zhou, C. H., Keeling, J., and Glasmacher, U. A.: Structure, genesis and resources efficiency of dolomite: New insights and remaining enigmas, Chem. Geol., 573, 120191, https://doi.org/10.1016/j.chemgeo.2021.120191, 2021.
Carbone, C., Di Benedetto, F., Sangregorio, C., Marescotti, P., Pardi, L. A., and Sorace, L.: Multifrequency EMR and Magnetic Characterization of Synthetic Powdered Hematite, J. Phys. Chem. C, 112, 9988–9995, https://doi.org/10.1021/jp712045s, 2008.
Cheary, R. W. and Coelho, A.: A fundamental parameters approach to X-ray line-profile fitting, J. Appl. Crystallogr., 25, 109–121, https://doi.org/10.1107/S0021889891010804, 1992.
Cheary, R. W., Coelho, A. A., and Cline, J. P.: Fundamental parameters line profile fitting in laboratory diffractometers, J. Res. Natl. Inst. Stand. Technol., 109, 1, https://doi.org/10.6028/jres.109.002, 2004.
Cole, R. D., Liu, J.-H., Smith, G. V., Hinckley, C. C., and Saporoschenko, M.: Iron partitioning in oil shale of the Green River Formation, Colorado: A preliminary Mössbauer study, Fuel, 57, 514–520, 1978.
d'Acapito, F., Lepore, G. O., Puri, A., Laloni, A., La Manna, F., Dettona, E., De Luisa, A., and Martin, A.: The LISA beamline at ESRF, J. Synchrotron Radiat., 26, 551–558, https://doi.org/10.1107/S160057751801843X, 2019.
Davidson, P. M., Symmes, G. H., Cohen, B. A., Reeder, R. J., and Lindsley, D. H.: Synthesis of the new compound CaFe(CO3)2 and experimental constraints on the (Ca,Fe)CO3 join, Geochim. Cosmochim. Ac., 57, 5105–5109, 1993.
Di Benedetto, F., Andreozzi, G., Baldi, G., Barzanti, A., Bernardini, G. P., Faso, V., Pardi, L. A., and Romanelli, M.: HF2EPR spectroscopy of Fe(III) impurities in a blue hercynite-based pigment, J. Eur. Ceram. Soc., 26, 2301–2305, https://doi.org/10.1016/j.jeurceramsoc.2005.04.007, 2006.
Frost, R. L., Reddy, B. J., Wain, D. L., and Hales, M. C.: An application of near infrared spectroscopy to the study of carbonate minerals – smithsonite, rhodochrosite, sphaerocobaltite and cadmium smithsonite, J. Infrared Spectrosc., 14, 317–324, 2006.
Gagné, O. C. and Hawthorne, F. C.: Comprehensive derivation of bond-valence parameters for ion pairs involving oxygen, Acta Crystallogr. Sect. B Struct. Sci. Cryst. Eng. Mater., 71, 562–578, https://doi.org/10.1107/S2052520615016297, 2015.
Gregg, J. M., Bish, D. L., Kaczmarek, S. E., and Machel, H. G.: Mineralogy, nucleation and growth of dolomite in the laboratory and sedimentary environment: A review, Sedimentology, 62, 1749–1769, https://doi.org/10.1111/sed.12202, 2015.
Gunasekaran, S. and Ambalagan, G.: Optical absorption and EPR studies on some natural carbonate minerals, Spectrochim. Acta. A. Mol. Biomol. Spectrosc., 69, 383–390, 2008.
Gunasekaran, S. and Anbalagan, G.: Thermal decomposition of natural dolomite, Bull. Mater. Sci., 30, 339–344, https://doi.org/10.1007/s12034-007-0056-z, 2007a.
Gunasekaran, S. and Anbalagan, G.: Spectroscopic study of phase transitions in dolomite mineral, J. Raman Spectrosc., 38, 846–852, https://doi.org/10.1002/jrs.1718, 2007b.
Iwafuchi, K., Watanabe, C., and Otsuka, R.: Thermal decomposition of ferromanganoan dolomite, Thermochim. Acta, 66, 105–125, https://doi.org/10.1016/0040-6031(93)85024-4, 1983.
Kurešević, L., Vušović, O., and Delić-Nikolić, I.: VUČKOVICA Carbonate-silica gemstone deposit (Central Serbia): geologic properties, genetic processes and deposition, Geol. Maced., 36, 105–118, https://doi.org/10.46763/GEOL22362105k, 2022.
Lachance, G. R. and Traill, R. J.: Practical Solution to the Matrix Problem in X-Ray Analysis, Can. Spectrosc., 11, 43–48, 1966.
Lagarek, K. and Rancourt, D. G.: RECOIL, Mössbauer spectral analysis software for windows (version 1.0), University of Ottawa, 1998.
Markgraf, S. A. and Reeder, R. J.: High-temperature structure refinements of calcite and magnesite, Am. Mineral., 70, 590–600, 1985.
Milodowski, A. E. and Morgan, D. J.: Thermal Analysis Studies of the dolomite-ferroan dolomite-ankerite Series. II. Decomposition Mechamism in Flowing CO2 Atmosphere, Thermochim. Acta, 152, 279–297, 1989.
mindat.org: Taraspite, https://www.mindat.org/ (last access: 20 May 2025), 2024.
Moukarika, A., O'Brien, F., Coey, M. D., and Resende, M.: Development of magnetic soil from ferroan dolomite, Geophys. Res. Lett., 18, 2043–2046, 1991.
Orlandi, P.: Siti di Interesse Minerario e Mineralogico del Territorio della Provincia di Pisa, Piano Territoriale di Coordinamento, Provincial Council Resolution no. 100 dated 27/07/2006, Provincia di Pisa, https://sit.provincia.pisa.it/sites/pisaprovincia/files/ptcp/qc007_siti_interesse_minerario_mineralogico_rid.pdf (last access: 23 July 2025), 2006.
Otsuka, R.: Recent studies on the decomposition of the dolomite group by thermal analysis, Thermochim. Acta, 100, 69–80, https://doi.org/10.1016/0040-6031(86)87051-4, 1986.
Pertlik, F.: Structures of hydrothermally synthesized cobalt(II) carbonate and nickel(II) carbonate, Acta Crystallogr., C42, 4–5, 1986.
Prissok, F. and Lehmann, G.: An EPR study of Mn2+ and Fe3+ in dolomites, Phys. Chem. Miner., 13, 331–336, https://doi.org/10.1007/BF00308350, 1986.
Ravel, B. and Newville, M.: ATHENA and ARTEMIS Interactive Graphical Data Analysis using IFEFFIT, Phys. Scr., 2005, 1007, https://doi.org/10.1238/Physica.Topical.115a01007, 2005.
Reddy, B. J. and Frost, R. L.: Electronic and vibrational spectra of gaspeite, Neues Jahrb. Für Mineral. – Monatshefte, 2004, 525–536, https://doi.org/10.1127/0028-3649/2004/2004-0525, 2004.
Reddy, R. R., Reddy, S. L., Reddy, G. S., and Reddy, B. J.: Optical absorption and EPR spectra of magnesite mineral, Radiat. Eff. Defects Solids, 153, 53–58, https://doi.org/10.1080/10420150008211834, 2000.
Reddy, S. L., Frost, R. L., Sowjanya, G., Reddy, N. C. G., Reddy, G. S., and Reddy, B. J.: EPR, UV-Visible, and Near-Infrared Spectroscopic Characterization of Dolomite, Adv. Condens. Matter Phys., 2008, 1–8, https://doi.org/10.1155/2008/175862, 2008.
Reeder, R. J. and Dollase, W. A.: Structural variation in the dolomite-ankerite solid-solution series: an X-ray, Mossbauer and TEM study, Am. Mineral., 74, 1159–1167, 1989.
Reeder, R. J. and Wenk, H. R.: Structure refinements of some thermally disordered dolomites, Am. Mineral., 68, 769–776, 1983.
Resio, L. C.: Dolomite thermal behaviour: A short review, Phys. Chem. Miner., 51, 19, https://doi.org/10.1007/s00269-024-01272-x, 2024.
Rielli, A., Boschi, C., and Dini, A.: Tectonically driven carbonation of serpentinite by mantle CO2: Genesis of the Castiglioncello magnesite deposit in the Ligurian ophiolite of central Tuscany (Italy), Ore Geol. Rev., 149, 105022, https://doi.org/10.1016/j.oregeorev.2022.105022, 2022.
Rietveld, H. M.: A profile refinement method for nuclear and magnetic structures, J. Appl. Crystallogr., 2, 65–71, https://doi.org/10.1107/S0021889869006558, 1969.
Rietveld, H. M.: Line profiles of neutron powder-diffraction peaks for structure refinement, Acta Crystallogr., 22, 151–152, https://doi.org/10.1107/S0365110X67000234, 1967.
Ristić, M., Krehula, S., Reissner, M., and Musić, S.: 57Fe Mössbauer, XRD, FT-IR, FE SEM Analyses of Natural Goethite, Hematite and Siderite, Croat. Chem. Acta, 90, 499–507, 2017.
Rossman, G. R.: Optical spectra of siderite (Tsumeb, Namibia) and ankerite (Styria, Austria) from the Mineral Spectroscopy Server of the California Institute of Technology, Pasadena, California, USA, 2024.
Rozenson, I., Zak, I., and Spiro, B.: The distribution and behavior of iron in sequences of dolomites, clays and oxides, Chem. Geol., 31, 83–96, 1980.
Shannon, R. D.: Revised effective ionic radii and systematic studies of interatomic distances in halides and chalcogenides, Found. Crystallogr., 32, 751–767, 1976.
Shepherd, R. A. and Graham, W. R. M.: EPR of Mn2+ in polycrystalline dolomite, J. Chem. Phys., 81, 6080–6084, https://doi.org/10.1063/1.447612, 1984.
Taran, M. N., Muller, J., Friedrich, A., and Koch-Muller, M.: High-pressure optical spectroscopy study of natural siderite, Phys. Chem. Miner., 44, 537–546, 2017.
Zemann, J.: Zür Stereochemie der Karbonate, Fortschritte Mineral., 59, 95–116, 1981.