the Creative Commons Attribution 4.0 License.
the Creative Commons Attribution 4.0 License.
 | 05 Apr 2023
A framework for quantitative in situ evaluation of coupled substitutions between H+ and trace elements in natural rutile
Renée Tamblyn
Jörg Hermann
The coupling behaviour of H+ and trace elements in rutile has been studied using in situ polarised Fourier transform infrared (FTIR) spectroscopy and laser ablation inductively coupled plasma mass spectrometry (LA–ICP–MS) analysis. H2O contents in rutile can be precisely and accurately quantified from polarised FTIR measurements on single grains in situ. The benefits of this novel approach compared to traditional quantification methods are the preservation of textural context and heterogeneities of water in rutile. Rutile from six different geological environments shows H2O contents varying between ∼ 50–2200 µg g−1, with large intra-grain variabilities for vein-related samples with H2O contents between ∼ 500 and ∼ 2200 µg g−1. From FTIR peak deconvolutions, six distinct OH absorption bands have been identified at ∼ 3280, ∼ 3295, ∼ 3324, ∼ 3345, ∼ 3370, and ∼ 3390 cm−1 that can be related to coupled substitutions with Ti3+, Fe3+, Al3+, Mg2+, Fe2+, and Cr2+, respectively. Rutile from eclogite samples displays the dominant exchange reactions of Ti4+ → Ti3+, Fe3+ + H+, whereas rutile in a whiteschist shows mainly Ti4+ → Al3+ + H+. Trace-element-dependent H+ contents combined with LA–ICP–MS trace-element data reveal the significant importance of H+ for charge balance and trace-element coupling with trivalent cations. Trivalent cations are the most abundant impurities in rutile, and there is not enough H+ and pentavalent cations like Nb and Ta for a complete charge balance, indicating that additionally oxygen vacancies are needed for charge balancing trivalent cations. Valance states of multivalent trace elements can be inferred from deconvoluted FTIR spectra. Titanium occurs at 0.03 ‰–7.6 ‰ as Ti3+, Fe, and Cr are preferentially incorporated as Fe3+ and Cr3+ over Fe2+ and Cr2+, and V most likely occurs as V4+. This opens the possibility of H+ in rutile as a potential indicator of oxygen fugacity of metamorphic and subduction-zone fluids, with the ratio between Ti3+- and Fe3+-related H+ contents being most promising.
- Article
(7006 KB) - Full-text XML
-
Supplement
(627 KB) - BibTeX
- EndNote


Rutile is the most common TiO2 polymorph and an important high-pressure (HP) metamorphic mineral (e.g. Meinhold, 2010). It frequently occurs as an accessory mineral in blueschist, amphibolite, granulite, and eclogite-facies rocks of various bulk geochemical compositions. Rutile generally incorporates a variety of minor and trace elements through substitution for Ti4+. Variations in rutile trace-element geochemistry are partially host-rock specific and therefore can be used as petrogenetic indicators. In mafic rocks, rutile is the main carrier of high-field-strength elements (HFSEs), and ratios of rutile are used as indicator of magmatic reservoirs, magma evolution, and subduction-zone processes (e.g. Foley et al., 2000; Schmidt et al., 2004). Additionally, Nb and Cr concentrations allow discrimination of metapelitic and metamafic rutile source lithologies (e.g. Zack et al., 2004b). Zirconium incorporation into rutile is highly temperature dependent (e.g. Zack et al., 2004a; Tomkins et al., 2007), which has led to the frequent application of Zr-in-rutile thermometry in metamorphic rocks. Furthermore, rutile from high-grade metamorphic rocks also can contain sufficiently high U (>5 µg g−1) to allow U–Pb geochronology (e.g. Metzger et al., 1989). Rutile oxygen isotopic compositions can provide information on fluid interactions and alteration (e.g. Matthews et al., 1979; Zheng et al., 2003).
The compatibility of trace elements in rutile is closely linked to their ionic charge and ionic radius (Fig. 1; e.g. Brenan et al., 1994). The most compatible trace elements in rutile are W6+, Sb5+, Nb5+, and Ta5+, while Mg2+ and Zn2+ are the least compatible. Several other trivalent (e.g. Al3+, Cr3+, Ga3+, V3+, Fe3+), tetravalent (e.g. V4+, Mo4+, Hf4+, Zr4+, U4+), pentavalent (e.g. V5+), and hexavalent (e.g. U6+) cations can be substituted for Ti4+ with varying compatibility (e.g. Graham and Morris, 1973; Tollo and Haggerty, 1987; Urban et al., 1992; Brenan et al., 1994; Rice et al., 1998; Zack et al., 2002; Bromiley and Hilairet, 2005; Scott , 2005; Carruzo et al., 2006; Meinhold, 2010). Some trace elements can be incorporated into rutile in different valence states (e.g. Ti3+, Ti4+; V3+, V4+, V5+; Cr2+, Cr3+, Cr4+; Fe2+, Fe3+; U4+, U6+), which complicates considerations of charge balance and trace element incorporation mechanisms. However, the multivalent nature of some trace elements provides the possibility to obtain crucial information on redox conditions during rutile growth (Kamperman, 1996).
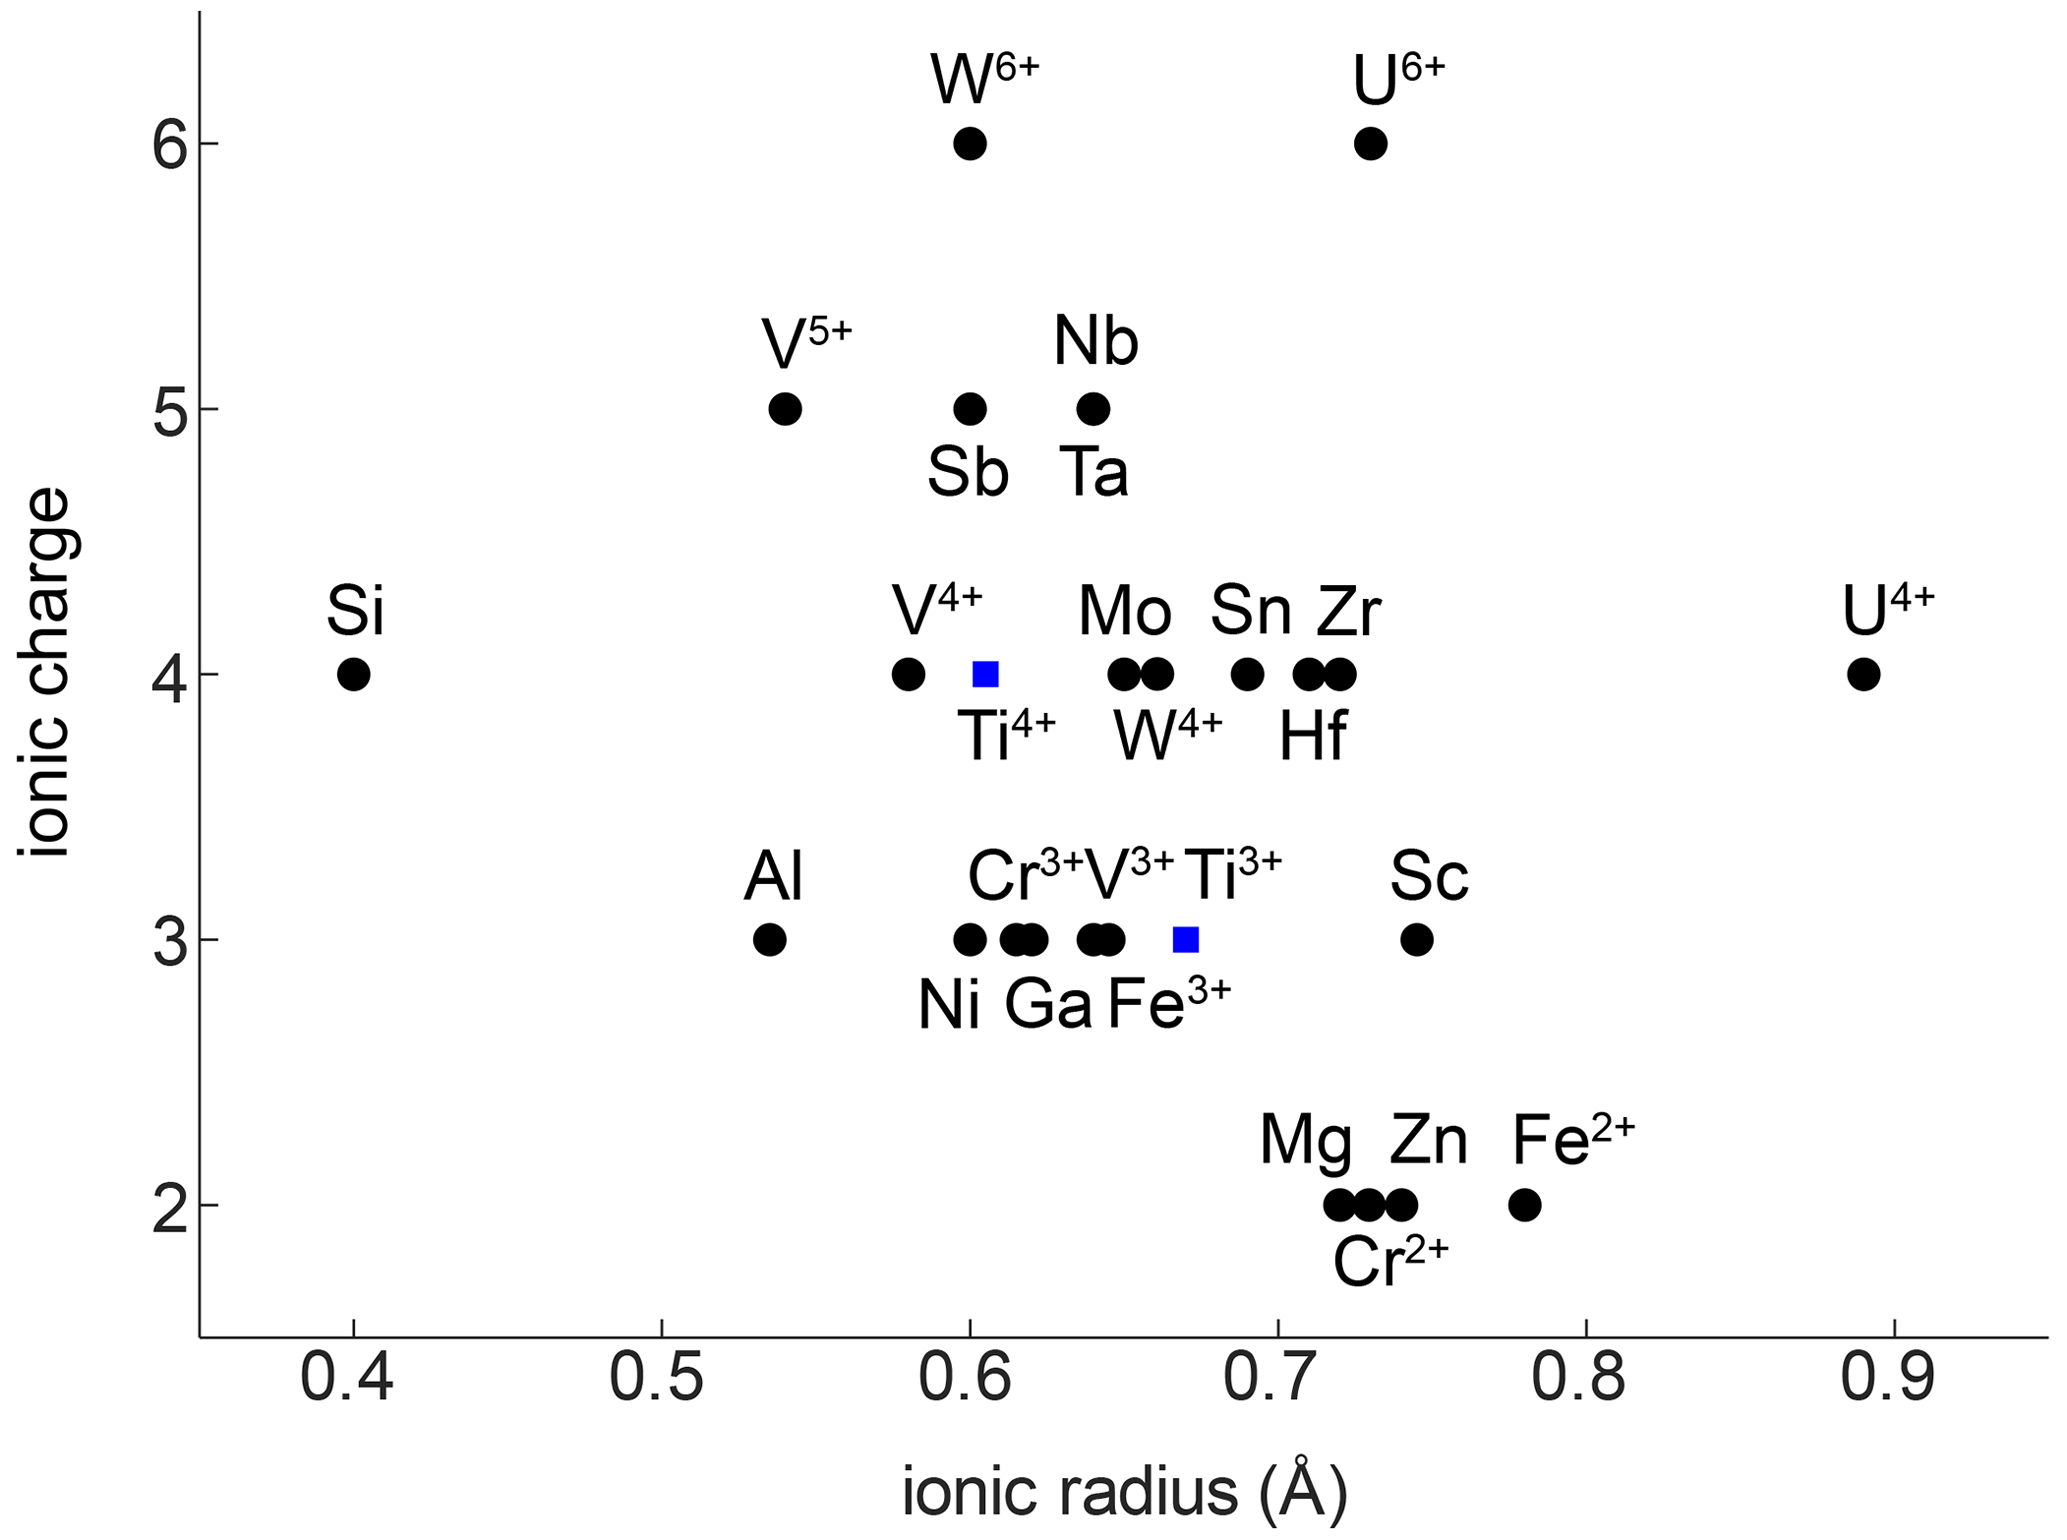
Figure 1Ionic radius vs. ionic charge of minor and trace elements that can be substituted into natural rutile. Ionic radii are taken from Shannon (1976).
Although rutile is a nominally anhydrous mineral (NAM), it can also contain trace amounts of H+. This was first shown by Soffer (1961), who identified a sharp double band in the OH-stretching region near 3300 cm−1 in the infrared (IR) spectrum of a synthetic rutile single crystal. Johnson et al. (1968) identified additional minor peaks at higher wavenumbers in the OH region and associated them with H+ linked to impurities caused by trivalent cations. Such a link between trivalent cations and H+ would suggest an involvement of H+ on the compensation of charge deficits created by the incorporation of trivalent cations, as previously proposed by Hill (1968). OH bands at 3270 cm−1 in IR spectra of natural rutile were first reported by Beran and Zemann (1971). Subsequent studies investigated the contents of H2O equivalents in natural rutile from different geological environments, showing that it can incorporate significant amounts of H2O. Reported values are in a range of 400–3000 µg g−1 H2O for magmatic and low-grade metamorphic rutile (Hammer and Beran, 1991; Vlassopoulos et al., 1993), 4000–9500 µg g−1 for eclogitic rutile (Zhang et al., 2001), and 7000–8000 µg g−1 for rutile from mantle xenoliths (Rossman and Smyth, 1990; Vlassopoulos et al., 1993). Eclogitic rutile from the Dabie Shan ultra-high pressure (UHP) terrain studied by Zhang et al. (2001) contains H2O 1–2 orders of magnitude above the whole-rock H2O content. Thus, rutile is one of the most hydrous NAMs and potentially very important for transporting H2O into the lower crust and mantle (Vlassopoulos et al., 1993; Kamperman, 1996; Zhang et al., 2001; Bromiley et al., 2004).
Fourier transform infrared (FTIR) spectroscopy studies of H+ in rutile typically examine oriented single grains by using polarised measurements (e.g. Hammer and Beran, 1991; Vlassopoulos et al., 1993; Khomenko et al., 1998; Colasanti et al., 2011; Yang et al., 2011; Lucassen et al., 2013; Guo, 2017). Zhang et al. (2001) studied in situ, unoriented grains and applied an orientation factor to counteract non-ideal spectra and unpolarised measurements. This method can be imprecise and potentially inaccurate considering preferential orientation of minerals in rocks, anisotropy of OH absorbance, and averaging of heterogeneous H2O contents in unpolarised measurements. Additionally, measuring separated, oriented rutile grains does not allow the differentiation of rutile from different textural positions (e.g. mineral inclusions vs. matrix grains vs. vein-associated grains). Thus, a method for precise and accurate determination of H2O contents in rutile should ideally maintain the textural context and any recorded intra-grain variabilities.
Studies combining infrared spectroscopy and electron paramagnetic resonance spectroscopy (EPR) on Fe-doped rutile have shown an association between Fe3+ on octahedral sites and H+ on interstitial ( 0) sites (Andersson et al., 1973, 1974; Ohlsen and Shen, 1974). Bromiley et al. (2004) identified an OH band at 3295 cm−1, related to Fe3+ in synthetic doped rutile. Furthermore, Kamperman (1996) and Khomenko et al. (1998) attributed OH bands in spectra of synthetic, pure, blue rutile to be associated with Ti3+. A variation of OH frequencies was also reported by Bromiley and Hilairet (2005) for trace-element doped rutile (Cr3+ 3257 cm−1; Ti3+ 3279 cm−1; Fe3+ 3295 cm−1; Al 3308 cm−1; Mg 3325 cm−1, 3349 cm−1). Table 1 summarises reported OH-band positions and associated trace elements.

For natural rutile, similar relationships between trace elements and OH-band positions have been proposed (Hammer and Beran, 1991; Vlassopoulos et al., 1993). However, only OH bands at 3320 and 3360 cm−1 have been identified to be related to Al3+ and Mg2+, respectively (Vlassopoulos et al., 1993). Thus, further investigation of trace element related OH-band positions in natural rutile is necessary to link trace-element contents to related H2O contents and, therefore, evaluate the influence of H+ on the incorporation, valence state, and charge balance of trace elements in rutile.
In this contribution, a new framework for the quantitative analysis of H2O in rutile is proposed. Firstly, a method to determine H2O contents in rutile in situ using polarised FTIR measurements is presented. This method is then applied to natural rutile-bearing samples from different geological environments to address the question of trace-element-related OH-band positions and the influence of H+ on charge balance in rutile. The benefits of an in situ method over a method relying on the orientation of rutile single grains and utilising statistical approaches are discussed, based on application of all three methods on the same samples. Different OH bands are allocated to various trace elements and defect types based on results from peak deconvolution on measured spectra, trace-element data, and literature evidence. Implications of the incorporation of H+ on valence state and charge balance of trace elements are evaluated based on trace element related H2O contents and molar trace-element contents.
Pure rutile has unit-cell parameters of a=4.594 Å and c=2.959 Å and crystallises in the tetragonal space group P4_2/mnm (Fig. 2; von Hippel et al., 1962; Baur, 2007). However, natural rutile commonly contains a variety of trace elements (e.g. Nb, Ta, V, Fe, Cr, Al) up to wt % range in total, which leads to significantly higher unit-cell parameters (Černý et al., 1999). The unit cell of pure rutile contains two TiO2 entities. The Ti4+ cations occupy octahedral sites, surrounded by six oxygen ions, which are located along diagonals perpendicular to the c axis (Fig. 2; Deer et al., 1992).
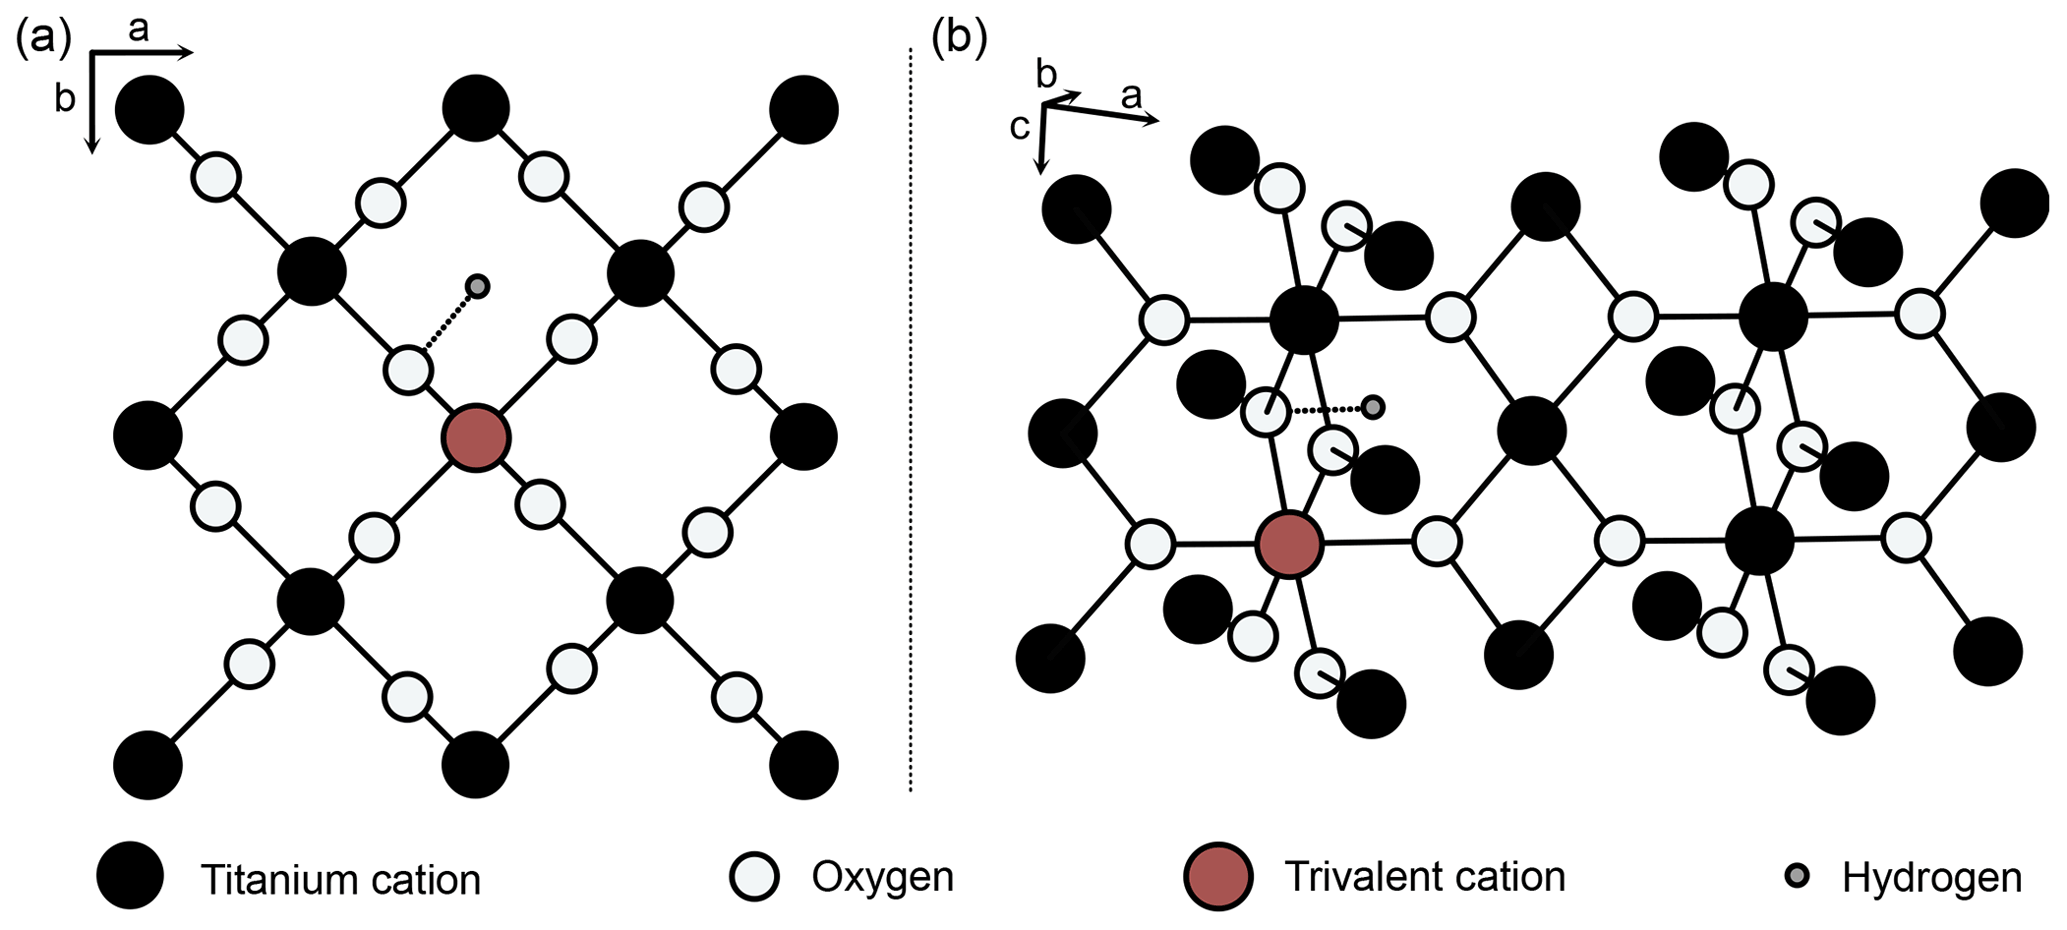
Figure 2Structure of rutile (after van Hippel et al., 1962; Swope et al., 1995). (a) View perpendicular to crystallographic c axis, (b) perspective view. Schematic depiction of linked substitution of trivalent cations for Ti4+ onto octahedral sites and incorporation of H+ in a slightly distorted interstitial ( 0 0) position, with an OH-band distance of 1.05 Å (Swope et al., 1995).
Von Hippel et al. (1962) suggested two possible interstitial positions for H between two oxygen ions in the ab plane (Fig. 2), which were later identified as ( 0) and ( 0 0) (Johnson et al., 1968). Both of these positions were shown by different studies on synthetic rutile as being energetically favourable (( 0): Vlassopoulos et al., 1993; Swope et al., 1995; ( 0 0): Johnson et al., 1968; Bromiley and Hilairet, 2005). However, evidence from first principle calculations suggests that the ( 0 0) position is more stable (Koudriachova et al., 2004). The OH bond is therefore located in the ab plane, and, as rutile is tetragonal, this results in a structural anisotropy of OH in rutile. This structural anisotropy leads to a high anisotropy of absorbance in Fourier transform infrared spectroscopy (FTIR) measurements. Maximum absorbance is reached for measurements with the electric vector (E) perpendicular to the crystallographic c axis, while virtually no absorbance can be detected for measurements with E parallel to the crystallographic c axis (e.g. Soffer, 1961; van Hippel et al., 1962, Johnson et al., 1968; Vlassopoulos et al., 1993; Bromiley et al., 2004). As the OH absorbance with E parallel a (E‖a) is needed for calculations, so far polarised measurements on oriented samples are necessary for quantitative FTIR analysis of H2O in rutile. Similarly, other anisotropic minerals, e.g. quartz (e.g. Stalder and Konzett, 2012), are typically analysed by polarised FTIR on oriented grains, with E parallel to the principle absorbance directions.
FTIR spectroscopy utilises the vibration of OH bonds in rutile formed by incorporation of interstitial H+; however, it is customary to report H+ contents as H2O equivalent.
FTIR analyses are quantified using a modified Beer–Lambert law:
where is the concentration of H2O in rutile, Δ the total integrated molar absorbance, kabs the mineral specific absorption coefficient, and t the thickness of the sample in centimetres:
and
where c is a conversion factor (106 for the conversion of g g−1 to µg g−1), the molar weight of H2O, d the density of rutile in kg m−3, ε the integrated molar absorption coefficient, and Δa, Δb, and Δc the integrated absorbance of the OH region of the IR spectra of rutile measured with E parallel to the crystallographic a, b, and c axes respectively.
Because rutile is tetragonal, its a and b axes are equal and therefore IR spectra measured with E‖a and E‖b are also equal. Due to the high structural anisotropy of OH in rutile and the consequential anisotropy in IR absorbance of OH bands, Δc can be approximated as zero. Thus,
Therefore, the concentration of H2O in rutile can be calculated using
The experimental determination of an integrated absorption coefficient for OH in rutile by Johnson et al. (1973) first allowed the calculation of H2O contents from measured IR spectra, following a modified Beer–Lambert law. Combining nuclear reaction analysis (NRA) and polarised FTIR analysis, Maldener et al. (2001) re-calibrated the integrated molar absorption coefficient as ε = 38 000 ± 4000 L mol−1 cm−2. Assuming a typical density for rutile of 4.23 g cm−3 (Deer et al., 1992) and a molar weight for H2O of 18.015 g mol−1, the H2O content in rutile can be calculated as
where is the integrated absorbance for E‖a normalised to 1 cm.
According to Eq. (6), to be able to quantify H2O contents of rutile in situ, the E‖a spectrum has to be measured in an unoriented grain. As rutile is tetragonal with equivalent a and b axes, the indicatrix of rutile is an ellipsoid with a circular base. Any randomly orientated cross-section through this indicatrix would cut the circular base and hence include the crystallographic a axis as semi-minor axis. Unoriented rutile grains can be seen as such cross-sections; therefore, any unoriented grain contains the crystallographic a axis. Polarised FTIR measurements, with varying polarisation angle of 0–180∘, should thus allow the measurement of E‖a spectra in situ in unoriented rutile grains. In this case, the spectrum with maximum absorbance should be equivalent to the spectrum with E‖a and therefore calculating the H2O content would lead to the same results for both a-axis spectrum and polarised maximum spectrum. To test this hypothesis, polarised FTIR analyses of oriented and unoriented rutile grains from the same samples were performed.
A total of eight samples from six different localities (Table 2) were used to develop an in situ analytical technique to (a) determine the H2O contents in rutile using FTIR and (b) evaluate H+–trace element coupling behaviour.
Table 2Samples with localities, main mineral assemblage, and P–T conditions. Mineral abbreviations after Warr (2021).
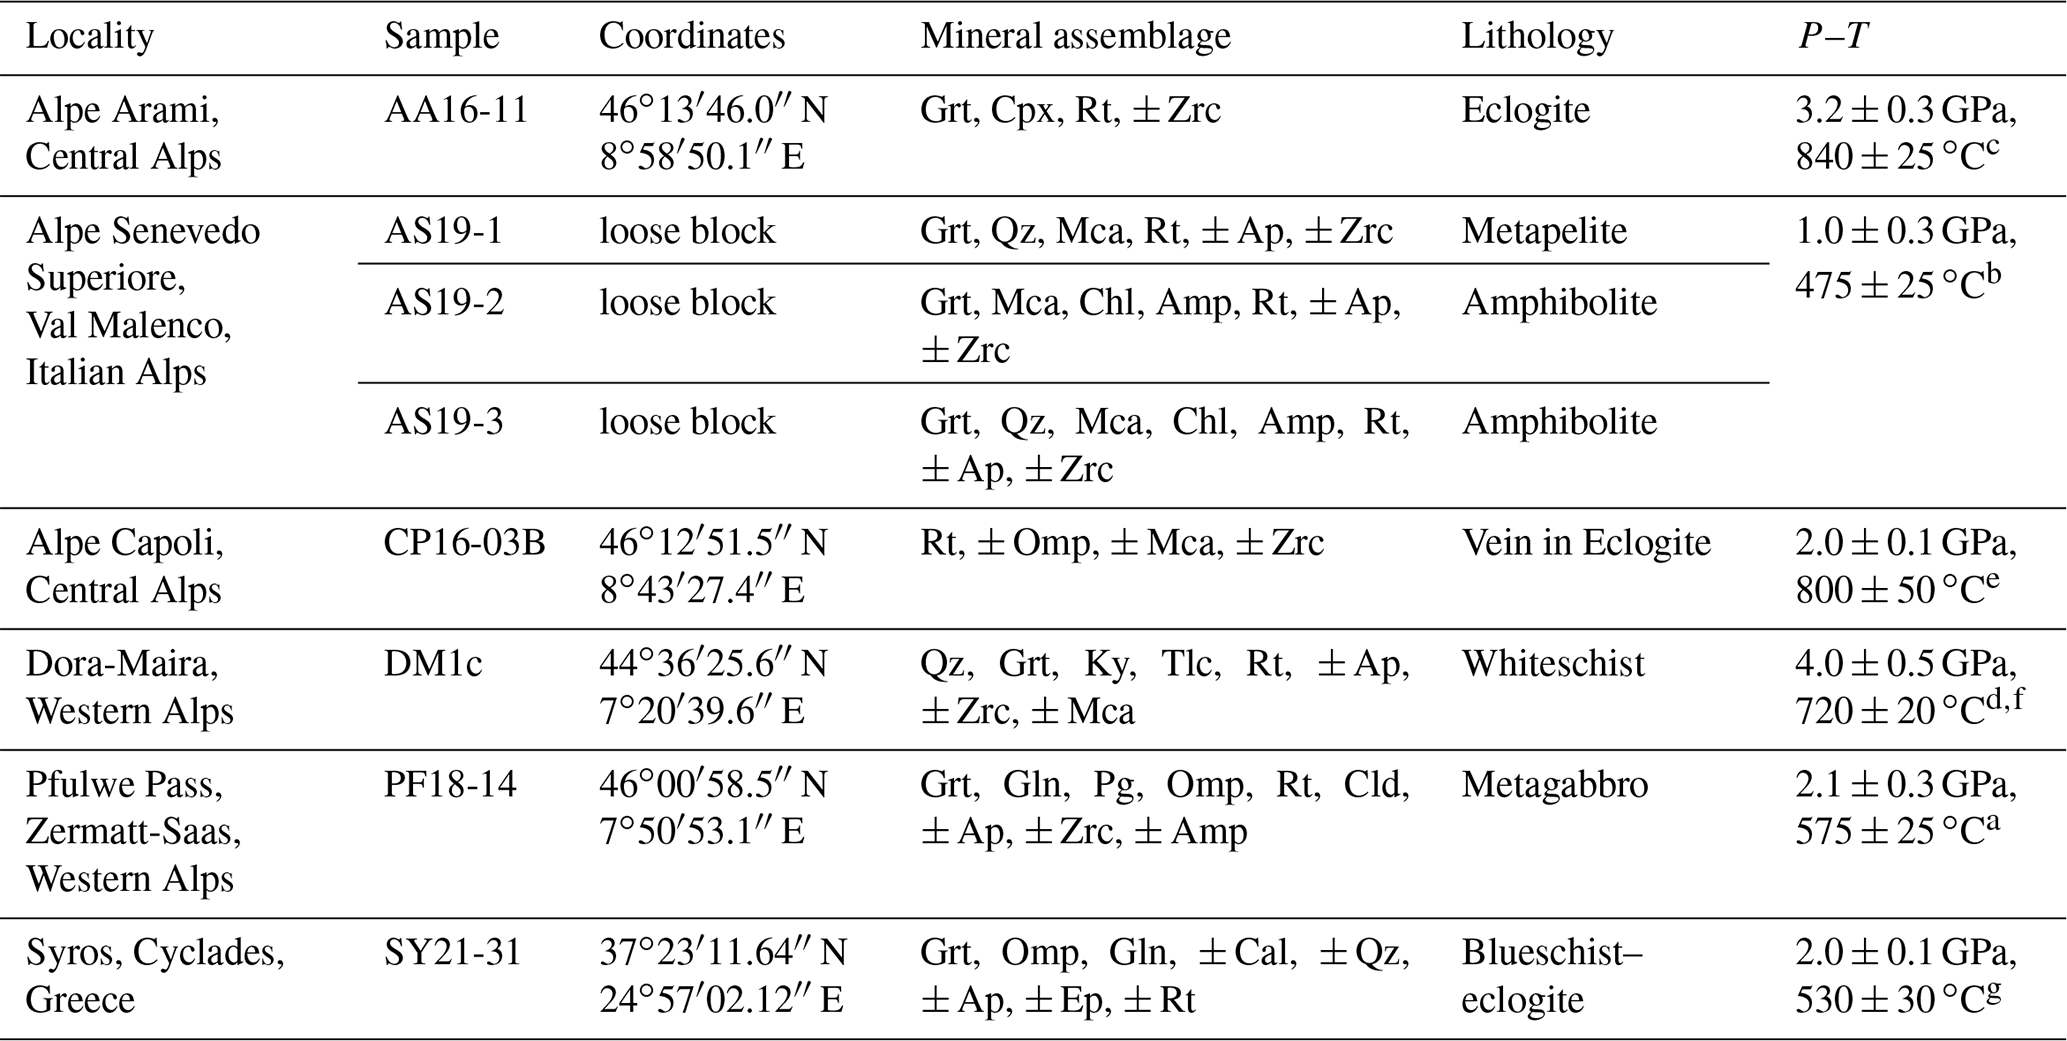
a Barnicoat and Fry (1986). b Bissig and Hermann (1999). c Nimis and Trommsdorff (2001). d Hermann (2003). e Brouwer et al. (2005). f Gauthiez-Putallaz et al. (2016). g Laurent et al. (2018).
Sample AA16-11 from Alpe Arami, Central Alps, is a rutile-bearing eclogite. Peak metamorphic conditions are approximately 3.2±0.3 GPa and 840 ± 25 ∘C (Nimis and Trommsdorff, 2001). Garnet and omphacite occur as large, 0.5–2.0 cm, elongated grains. Omphacite is often rimmed by retrograde amphibole, and fractures in garnet and omphacite are commonly filled with small quartz grains (Fig. 3a). Rutile occurs as large, millimetre-sized, yellow-brown grains, that are elongated parallel to garnet and omphacite.
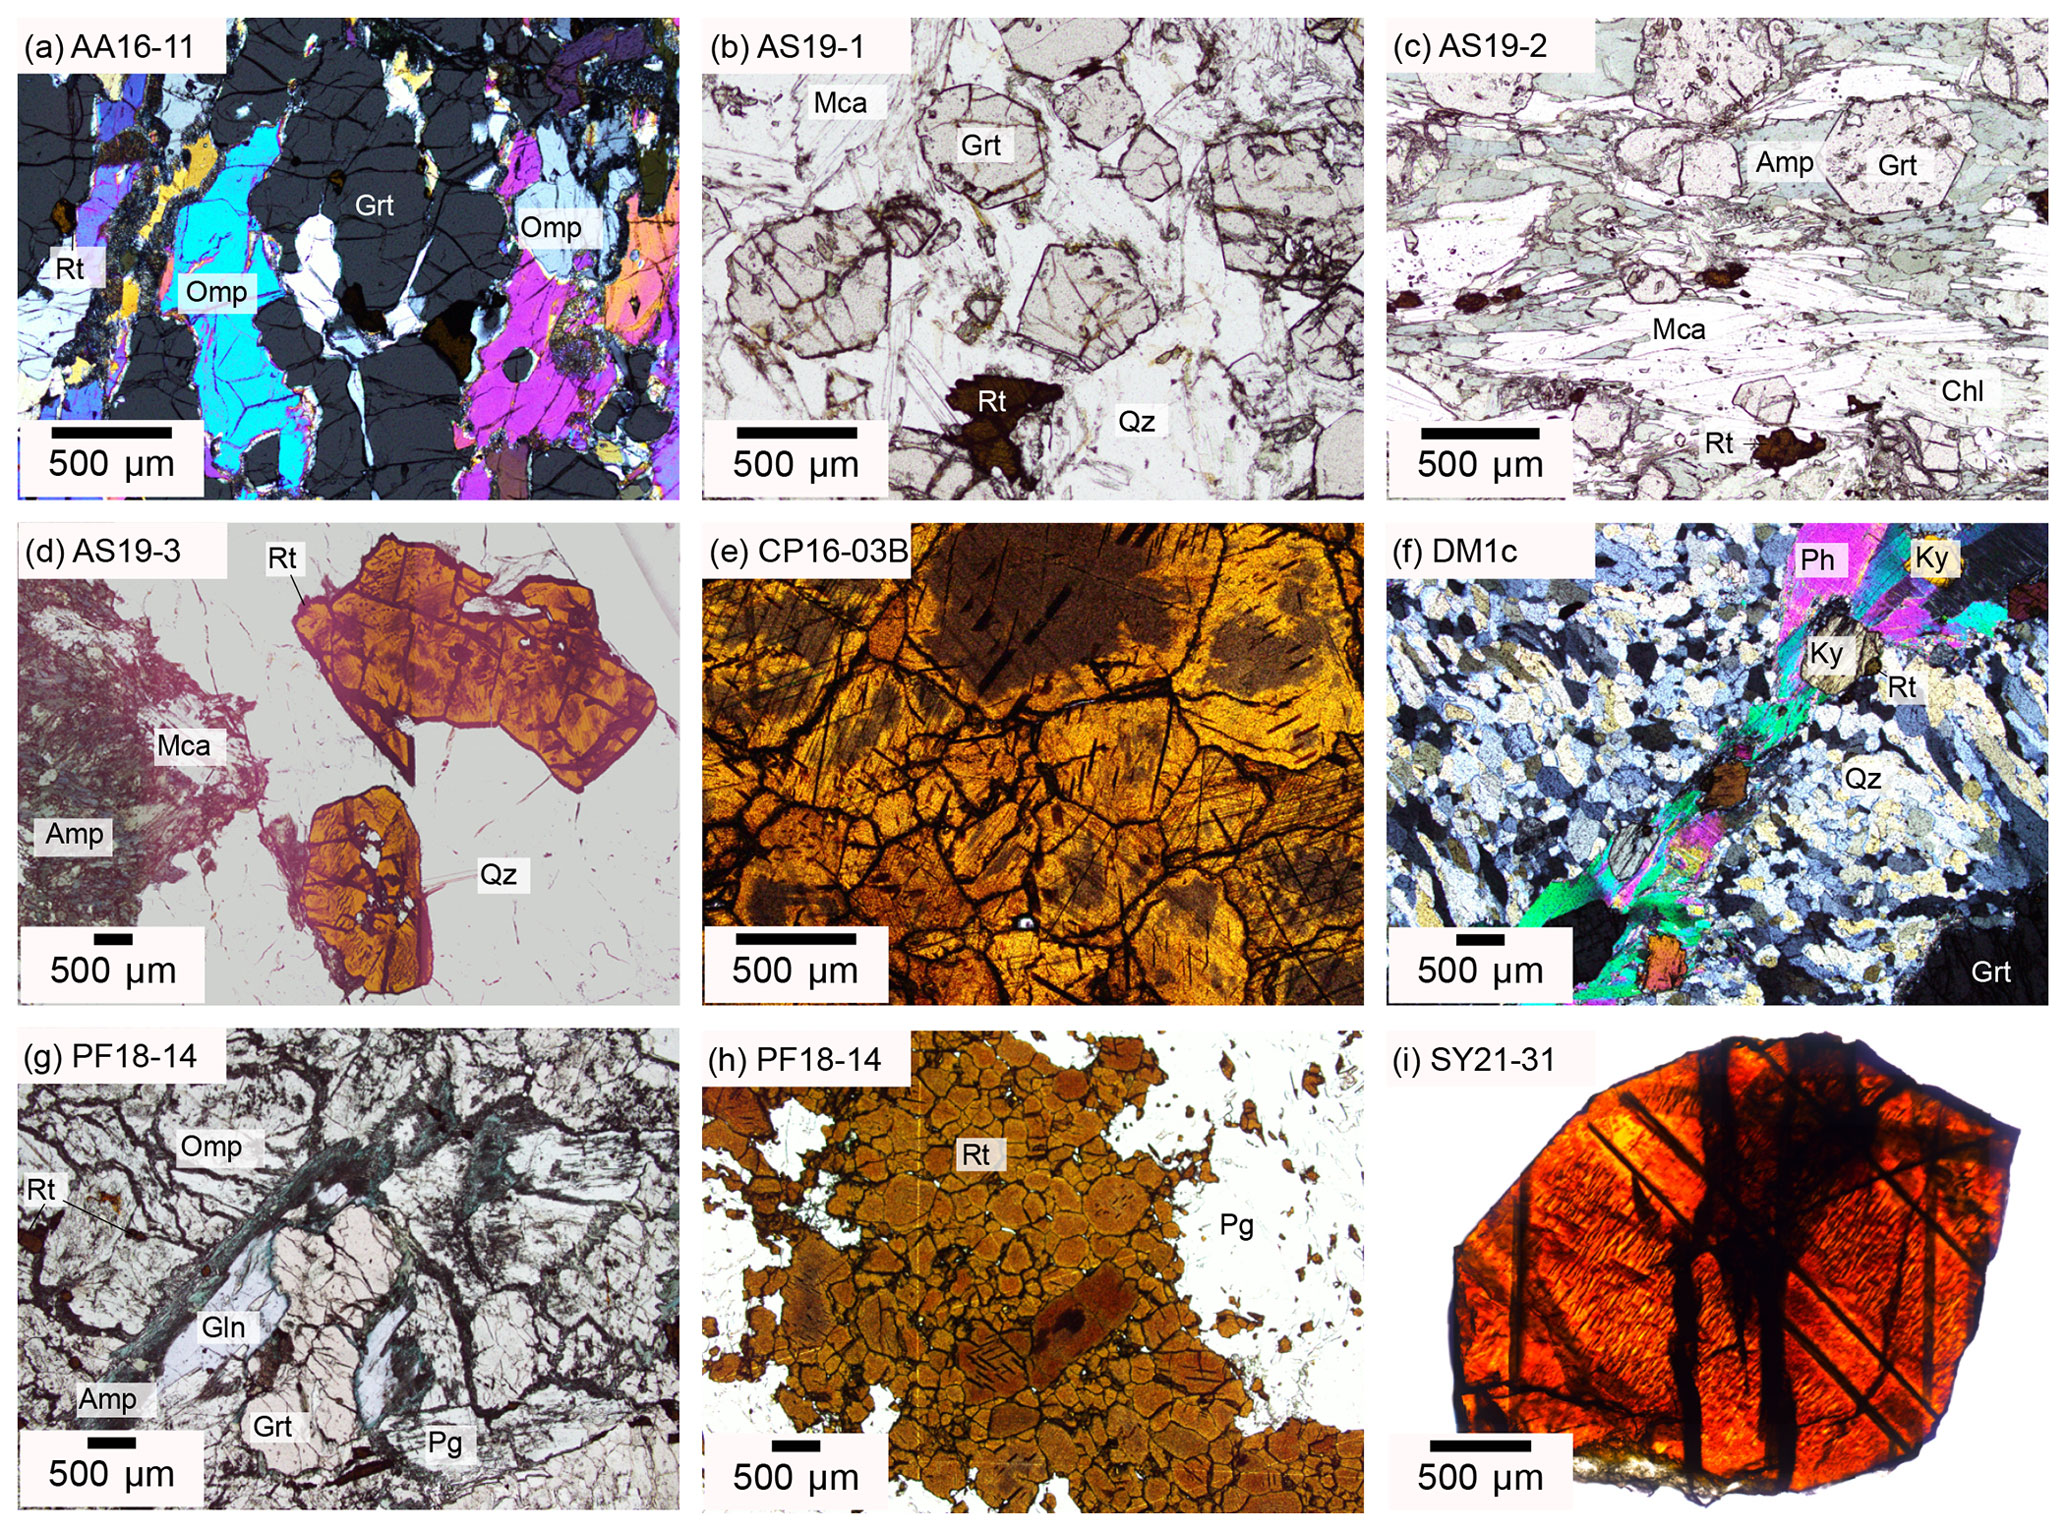
Figure 3Optical microphotographs of investigated samples depicting textures and mineralogical assemblages. (a, f) XPL, (b–d, g–h) PPL, (i) transmitted light. (a) Sample AA16-11 contains elongated garnet and omphacite grains and shows slight foliation defined by elongated matrix grains. (b) Sample AS19-1 has a matrix of quartz and white mica. Garnet forms large euhedral porphyroblasts. Rutile occurs as large grains or aggregates with ilmenite exsolution lamellae. (c) Sample AS19-2 has a pronounced foliation defined by white mica, chlorite, and amphiboles. Garnet porphyroblasts of varying size form pressure shadows containing finer-grained amphiboles. (d) Sample AS19-3 has a similar mineralogy as AS19-2 but does not show any foliation. A massive quartz vein contains centimetre-sized, elongated rutile with minor ilmenite exsolution lamellae. (e) Sample CP16-03B contains purely rutile. Rutile grains are optically zoned with bright rims and dark, blue tinted cores. (f) Sample DM1c has a matrix of quartz and phengite, with rounded kyanite porphyroblasts and large centimetre-sized, strongly resorbed garnet. (g, h) Sample PF18-14 has a matrix of omphacite and paragonite with garnet and glaucophane porphyroblasts and retrograde amphibole rims around garnet and omphacite. Rutile occurs as large vein-like aggregate of several hundreds of grains. Larger rutile grains are optically zoned with light rims and dark blue-grey cores. (i) Sample SY21-31 is a single rutile grain with ilmenite exsolution lamellae and two groups of approximately parallel fractures. Mineral abbreviations after Warr (2021).
The three samples from Alpe Senevedo Superiore, Val Malenco, Italian Alps (AS19-1, AS19-2, AS19-3), were used for oriented samples and were also measured in situ. The associated mafic rocks record pressure-dominated amphibolite facies conditions around 1.0 ± 0.3 GPa and 475 ± 25 ∘C (Bissig and Hermann, 1999). Sample AS19-1 is a metapelite, containing garnet, quartz, and phengitic white mica (Fig. 3b). Garnets are sub-rounded to hexagonal with a grain size of 0.5–2 mm. Phengite has variable grain sizes from micrometre to centimetre scale and shows undulating extinction. Small ∼ 200 µm rutile grains form in the matrix, while larger, centimetre-sized rutile is associated with a quartz layer. The larger rutile grains show noticeable ilmenite exsolutions, forming a rectangular grid within the grains. Samples AS19-2 and AS19-3 have a mineral assemblage of garnet, chlorite, amphibole, and white mica. AS19-2 contains a generally coarser grain size (200–500 µm) and a strong preferred orientation (Fig. 3c), while AS19-3 has significantly smaller (<150 µm), unoriented grains. Rutile in AS19-2 is fine grained and homogeneously distributed throughout the matrix. In AS19-3, besides matrix rutile, large centimetre-sized rutile can be found in association with quartz lenses (Fig. 3d), occurring throughout the sample. Large rutile in AS19-3 shows the same ilmenite exsolution texture as rutile in AS19-1.
Sample CP16-03B is part of a rutile vein, from an eclogite at Alpe Capoli, Central Alps. Peak metamorphic conditions are approximately 2.0±0.1 GPa and 800±50 ∘C (Brouwer et al., 2005). The sample contains ∼ 98 vol % rutile, with very few inclusions of pyroxene, amphibole, and white mica. The 0.5–2 cm size grains show equilibrium angles and dark brown exsolution lamellae (Fig. 3e), as described for AS19-1. The rutile grains have a light to medium brown colour, with several of the grains showing dark, blue tinted cores.
The sample DM1c comes from a Dora-Maira whiteschist in the Western Alps. Peak metamorphic conditions are approximately 4.0±0.5 GPa and 720±20 ∘C (Hermann, 2003; Gauthiez-Putallaz et al., 2016). The matrix consists of quartz (coesite at peak; Chopin, 1984), kyanite, and phengite (Fig. 3f). The weak foliation is formed mainly by phengite. Porphyroblastic garnet contains abundant inclusions of rutile and apatite, with less abundant monazite and zircon, and is partially resorbed. Kyanite, talc, and phlogopite at garnet rims indicate a small degree of retrogression.
The sample PF18-14 comes from a Fe–Ti metagabbro just below the Pfulwe pass, Zermatt–Saas region, Western Alps, that reached peak metamorphic conditions of approximately 2.1±0.3 GPa and 575±25 ∘C (Barnicoat and Fry, 1986). PF18-14 contains highly fractured, partially resorbed garnet with multiple inclusions of white mica, quartz, rutile, apatite, and zircon and is rimmed by retrograde amphibole (Fig. 3g). The matrix is comprised of large chloritoid, omphacite, glaucophane relicts, paragonite, and few small rutile grains. Rutile also occurs as aggregates of >100 individual grains (Fig. 3h) that are interpreted to be pseudomorphs replacing ilmenite layers from the protolith.
The sample SY21-31 comes from an eclogite–blueschist from Syros, Cyclades, Greece, that formed at approximately 2.0±0.1 GPa and 530±30 ∘C (Laurent et al., 2018). The sample was taken as rutile single grain without lithological context from the Kampos subunit, a blueschist to eclogite-facies metabasite melange. The Kampos subunit in general is comprised of an omphacite–phengite matrix with larger garnet and glaucophane phenocrysts with minor quartz, albite, calcite, epidote, and titanium phases (Laurent et al., 2018).
Oriented and unoriented grains of three rutile samples from Alpe Senevedo Superiore, Val Malenco, Italian Alps, were studied (AS19-1, AS19-2, AS19-3), to evaluate the in situ quantification method described above. To identify trace-element-dependent OH-band positions, in situ FTIR and laser ablation inductively coupled plasma mass spectrometry (LA–ICP–MS) analyses on rutile from eight different samples (AA16-11, AS19-1, AS19-2, AS19-3, CP16-03B, DM1c, PF18-14, SY21-31) were performed. All samples were chosen to represent a broad range of bulk-rock compositions, mineral assemblages, and P–T conditions (Table 2).
4.1 Sample preparation
The investigated rutile single grains from samples AS19-1, AS19-2, and AS19-3 are elongated along the crystallographic c axis. Separated rutile grains were oriented by using this morphological characteristic and cut approximately parallel and perpendicular to the crystallographic c axis. For sample AS19-3 a cross-section parallel to the c axis was not possible due to the small diameter (∼ 200 µm) of the grain. Resulting cross-sections were mounted in 1 in. epoxy mounts (∼2.5 cm) and subsequently doubly polished into thick sections with a thickness of about 150–350 µm, using first grinding paper and then polishing to a grade of 6 µm followed by polishing with diamond paste to a grade of 3 µm. Sample thickness was determined with a vertically mounted mechanical Mitutoyo ID-S112X micrometre with a precision of ±3 µm. From the same rutile grains, pieces of 2–3 mm length were cut and subsequently crushed using an agate mortar to form unoriented samples with a grain size of about 50–250 µm. Larger pieces (>100 µm diameter) were handpicked, mounted in epoxy, and polished using the same methods as for oriented samples.
The samples AA16-11, AS19-1, AS19-3, CP16-03B, DM1c, and PF18-14 were prepared as doubly polished thick sections with a thickness of 80–130 µm. To remove them from their glass plates, they were left in acetone for 12–48 h. Sample thickness was determined with a vertically mounted mechanical micrometre.
For sample SY21-31, only single rutile grains were collected in the field. Thus, to obtain unoriented, small grains, one 3 mm sized rutile grain was crushed in an agate mortar to a grain size of ∼ 20–200 µm. The grains were left unpolished, and grain thickness was determined from the calibrated z-stage position during FTIR measurements.
4.2 FTIR
Transmission FTIR spectroscopy on oriented and unoriented grains was performed using a Bruker Tensor II spectrometer with a globar infrared source equipped with a Bruker Hyperion 3000 microscope at the University of Bern. Data were acquired with a liquid-nitrogen-cooled mercury–cadmium–telluride (MCT) detector with an average over 64 scans and a resolution of 4 or 8 cm−1 over a wavenumber range of 600 to 4000 cm−1. For oriented and unoriented cuts of samples AS19-1, AS19-2, and AS19-3 as well as samples DM1c and SY21-31, a resolution of 8 cm−1 was needed to achieve a better signal-to-noise ratio. Samples AA16-11 and PF18-14 were measured with both 4 and 8 cm−1 resolution to evaluate comparability. Single-grain samples (AS19-1, AS19-2, AS19-3, SY21-31) were measured on IR-transparent CaF2 plates. The closed sample chamber was purged with dried air or nitrogen gas during measurements to minimise atmospheric water interference on measurements.
Samples cut perpendicular to the crystallographic c axis were measured using polarised light to collect spectra with E‖a (“a-axis spectra”). Additionally, spectra with E‖c (“c-axis spectra”) were collected from polarised measurements on samples cut parallel to the crystallographic c axis. Unoriented samples were measured by polarised FTIR with polarisation angles between 0–180∘ and a step of ∼ 6.5∘, as dictated by the instrument setup. Measured spectra were background corrected using the “concave rubberband” method with 4 iterations and 64 baseline points in the OPUS© software that is provided by Bruker. H2O contents were calculated from integrating the OH region between 3500–3200 cm−1 using Eq. (6).
Polarised transmission FTIR analyses on thick sections were performed by rotating the polariser until the measured spectrum reached its maximum in absorbance, indicating measurement with E‖a. Only those maximum spectra were collected. H2O contents were calculated according to Eq. (6) after background correction with the OPUS© software. Additionally, for samples AA16-11, AS19-1, AS19-2, AS19-3, CP16-03B, DM1c, and PF18-14, unpolarised spectra were measured.
4.3 FTIR mapping
To ensure homogeneity of oriented rutile samples, unpolarised MCT-FTIR maps of samples cut parallel to the crystallographic c axis were collected. The OPUS© software allows spot measurements in a grid with selectable spacing between spots. Choosing a tile spacing of 24–25 µm and an aperture of about 25 µm, it is possible to collect “pixel maps”. Each spot, or pixel, is the size of the aperture. As the tile spacing of the grid measurement is the same as the aperture, and tile spacing is measured between the centres of two tiles, or pixels, two neighbouring tiles are in direct contact. This effectively results in a map with a resolution of 25 µm. Measurements were performed using a resolution of 8 cm−1, as is standard for conventional FTIR mapping, and three scans, to allow for a feasible measurement time. Measured maps are background corrected using the “concave rubberband” function within the OPUS ©software. The OH region between 3350–3200 cm−1 was corrected using a linear background and integrated for calculation of H2O contents using MATLAB. Resulting H2O maps are depicted in the measured resolution of 25 µm2 pixel size.
4.4 Calculation of H2O contents using orientation factors
For the determination of H2O contents from unpolarised measurements, statistical approaches are used. Thus, several grains are measured and the resulting spectra are averaged. Assuming true random orientation of the grains within the sample and the measurement of a high number of grains, this would result in the spectrum of the median orientation and corresponding average integrated absorbance (Δθ). H2O contents are then calculated from the average spectrum using a modified Beer–Lambert law with an orientation factor γ (Paterson, 1982):
According to Sambridge et al. (2008) and Kovács et al. (2008), the total absorbance Δ and the average integrated absorbance of unpolarised measurements can be approximated as
Comparing Eqs. (1) and (7), this gives an orientation factor γ of 3. Thus, for unpolarised measurements, can be calculated as
Using the same density of rutile, integrated molar absorption coefficient, and molar weight of H2O, Eq. (9) can be simplified to
is the integrated absorbance of the OH region normalised to 1 cm. H2O contents calculated from this statistical approach, which assumes random orientation of grains and homogeneous H2O contents, were compared with results of calculations from in situ a-axis spectra, which are able to resolve inhomogeneous H2O contents.
4.5 Deconvolution of FTIR spectra
To identify individual trace-element-dependent OH-band positions, a deconvolution was applied to the OH region of spectra averaged over 10–30 single analyses of different grains. The MATLAB script used was developed by Reynes et al. (2020) and is based on the peakfit function by O'Haver (2015). Peak positions of Lorentzian peaks were fixed with peak heights and width fitted by the program. Peak positions were manually adapted to generate the best fit for measured spectra. From the resulting trace-element-dependent spectra, trace-element-dependent H2O contents were calculated using Eq. (6).
4.6 LA–ICP–MS
LA–ICP–MS was performed at University of Bern on the same rutile grains previously measured by transmission FTIR, to identify the trace elements related to different OH-band positions. A Resonetics RESOlution SE 193 nm excimer laser system equipped with a S-155 large-volume constant-geometry ablation cell (Laurin Technic, Australia) coupled to an Agilent 7900 quadrupole ICP16-03B-MS system was used. Ablation was performed in ultra-pure He (0.04 L min−1) and N2 (0.003 L min−1) mix with Ar (0.86 L min−1) immediately after the ablation cell. A laser repetition rate of 5 Hz and a surface energy density of 4 J cm−2 on the sample was employed. The beam size used was between 24 and 50 µm, depending on grain size. The grain surface was pre-ablated with three pulses for cleaning using a slightly larger beam size. Each measurement had a total acquisition time of ∼ 85 s, with ∼ 50 s of gas background pre-ablation and ∼ 30 s sample signal for a suite of 26 elements. Primary (SRM-NIST610) and secondary standard (SRM-NIST612) were measured every 10–15 min (Jochum et al., 2011). Data reduction was performed using the software Iolite (Hellstrom et al., 2008; Paton et al., 2011). Instrument drift was corrected for by applying a step-forward spline function fit to the set of standard measurements, and backgrounds were subtracted from all spot analyses. Quantification was performed using a fixed value of 59.94 wt % Ti for all samples. 26Mg was measured rather than 25Mg to avoid interference from doubly charged 50Ti.
5.1 FTIR on rutile single grains, Val Malenco
Quantitative MCT-FTIR maps are presented in Fig. 4. The maps are expressed in µg g−1 H2O equivalent, calculated from Eq. (6) for the OH region of 3350–3200 cm−1. H2O maps are superimposed on light microscopy images obtained during FTIR analysis. All three samples show generally homogeneous H2O contents of ∼ 280 ± 60 µg g−1 for AS19-1, ∼ 410 ± 100 µg g−1 for AS19-2, and ∼ 350 ± 60 µg g−1 for AS19-3. Areas of significantly lower H2O contents (< 150 µg g−1) align with fractures that are visible in optical microscopy images.
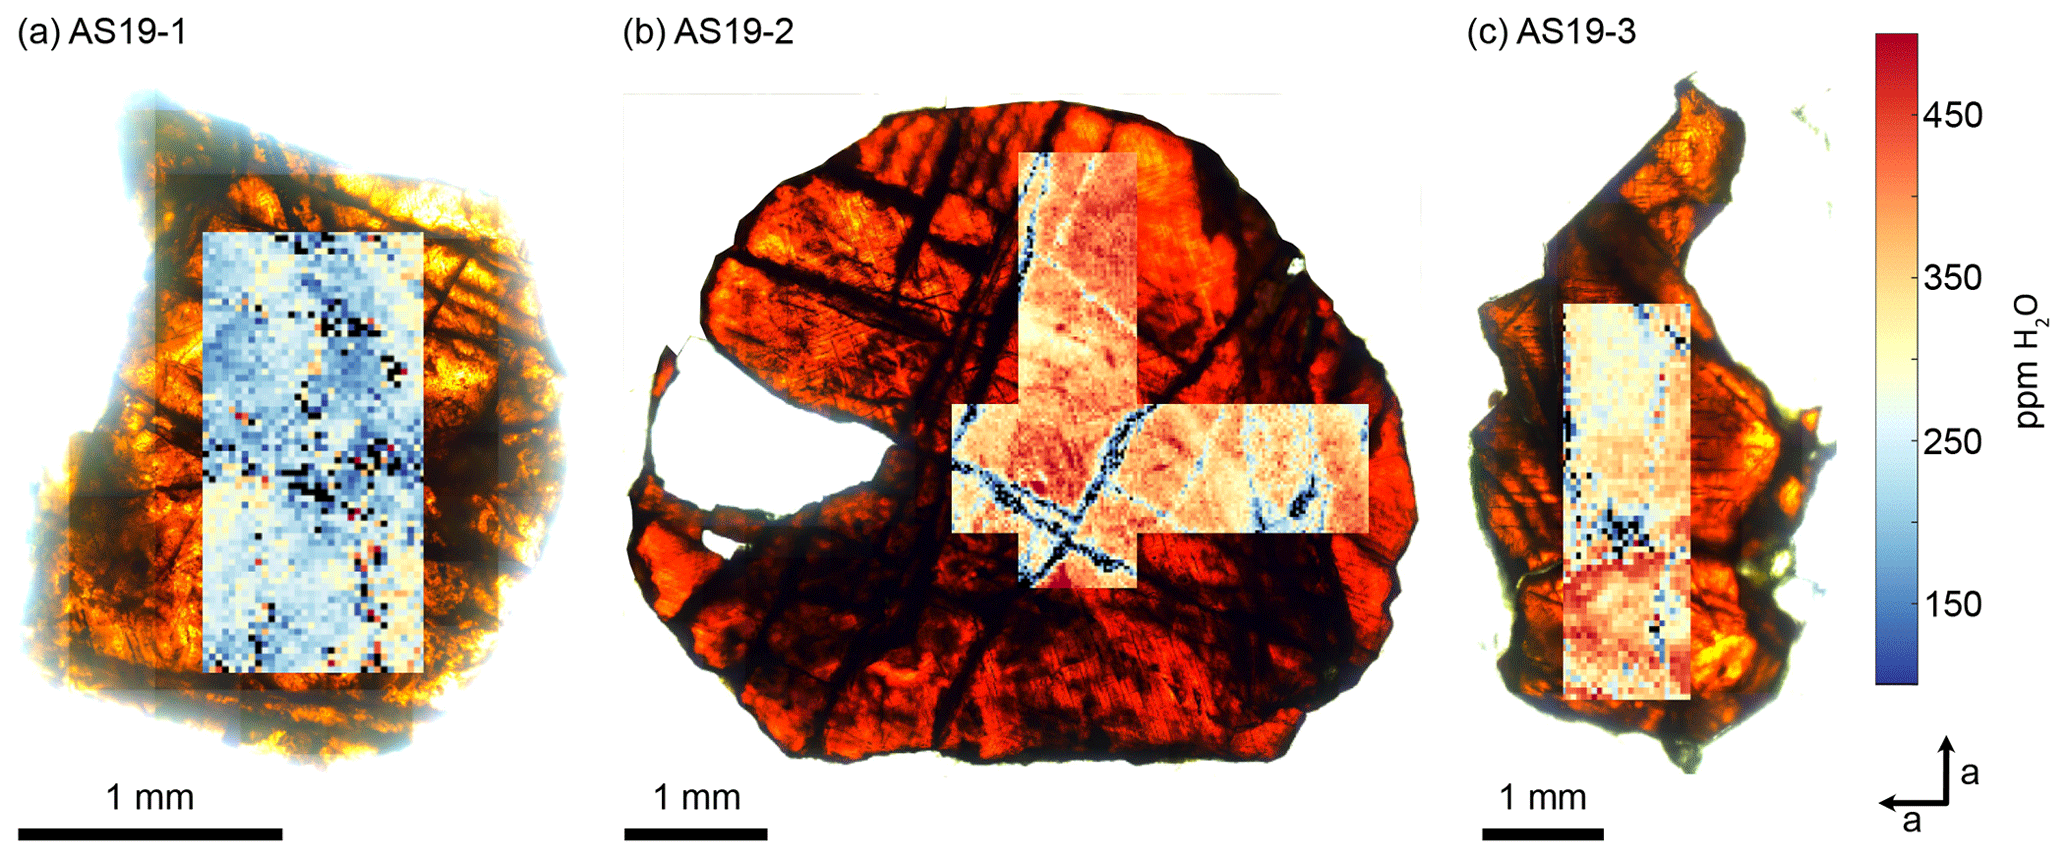
Figure 4MCT-FTIR maps of samples cut perpendicular to the crystallographic c axis. H2O contents have been calculated from the OH range of 3200–3500 cm−1 using Eq. (6). H2O maps are superimposed on transmitted-light microscopy images taken during the FTIR analysis.
Representative a-axis and c-axis spectra and polarised measurements of unoriented samples for all three rutile grains were selected and are shown in Fig. 5. Spectra measured along the c axis for samples AS19-1 and AS19-2 show no detectable absorbance. The a-axis spectra for all three samples show a narrow double band at 3281 and 3295 cm−1 with a lower left shoulder at ∼ 3323 cm−1. Calculated H2O contents using a-axis spectra on oriented grains are 230, 430, and 405 µg g−1, respectively. The H2O contents for a-axis spectra of AS19-1 spread between 200–225 µg g−1, for AS19-2 between 405–445 µg g−1, and for AS19-3 between 350–405 µg g−1.
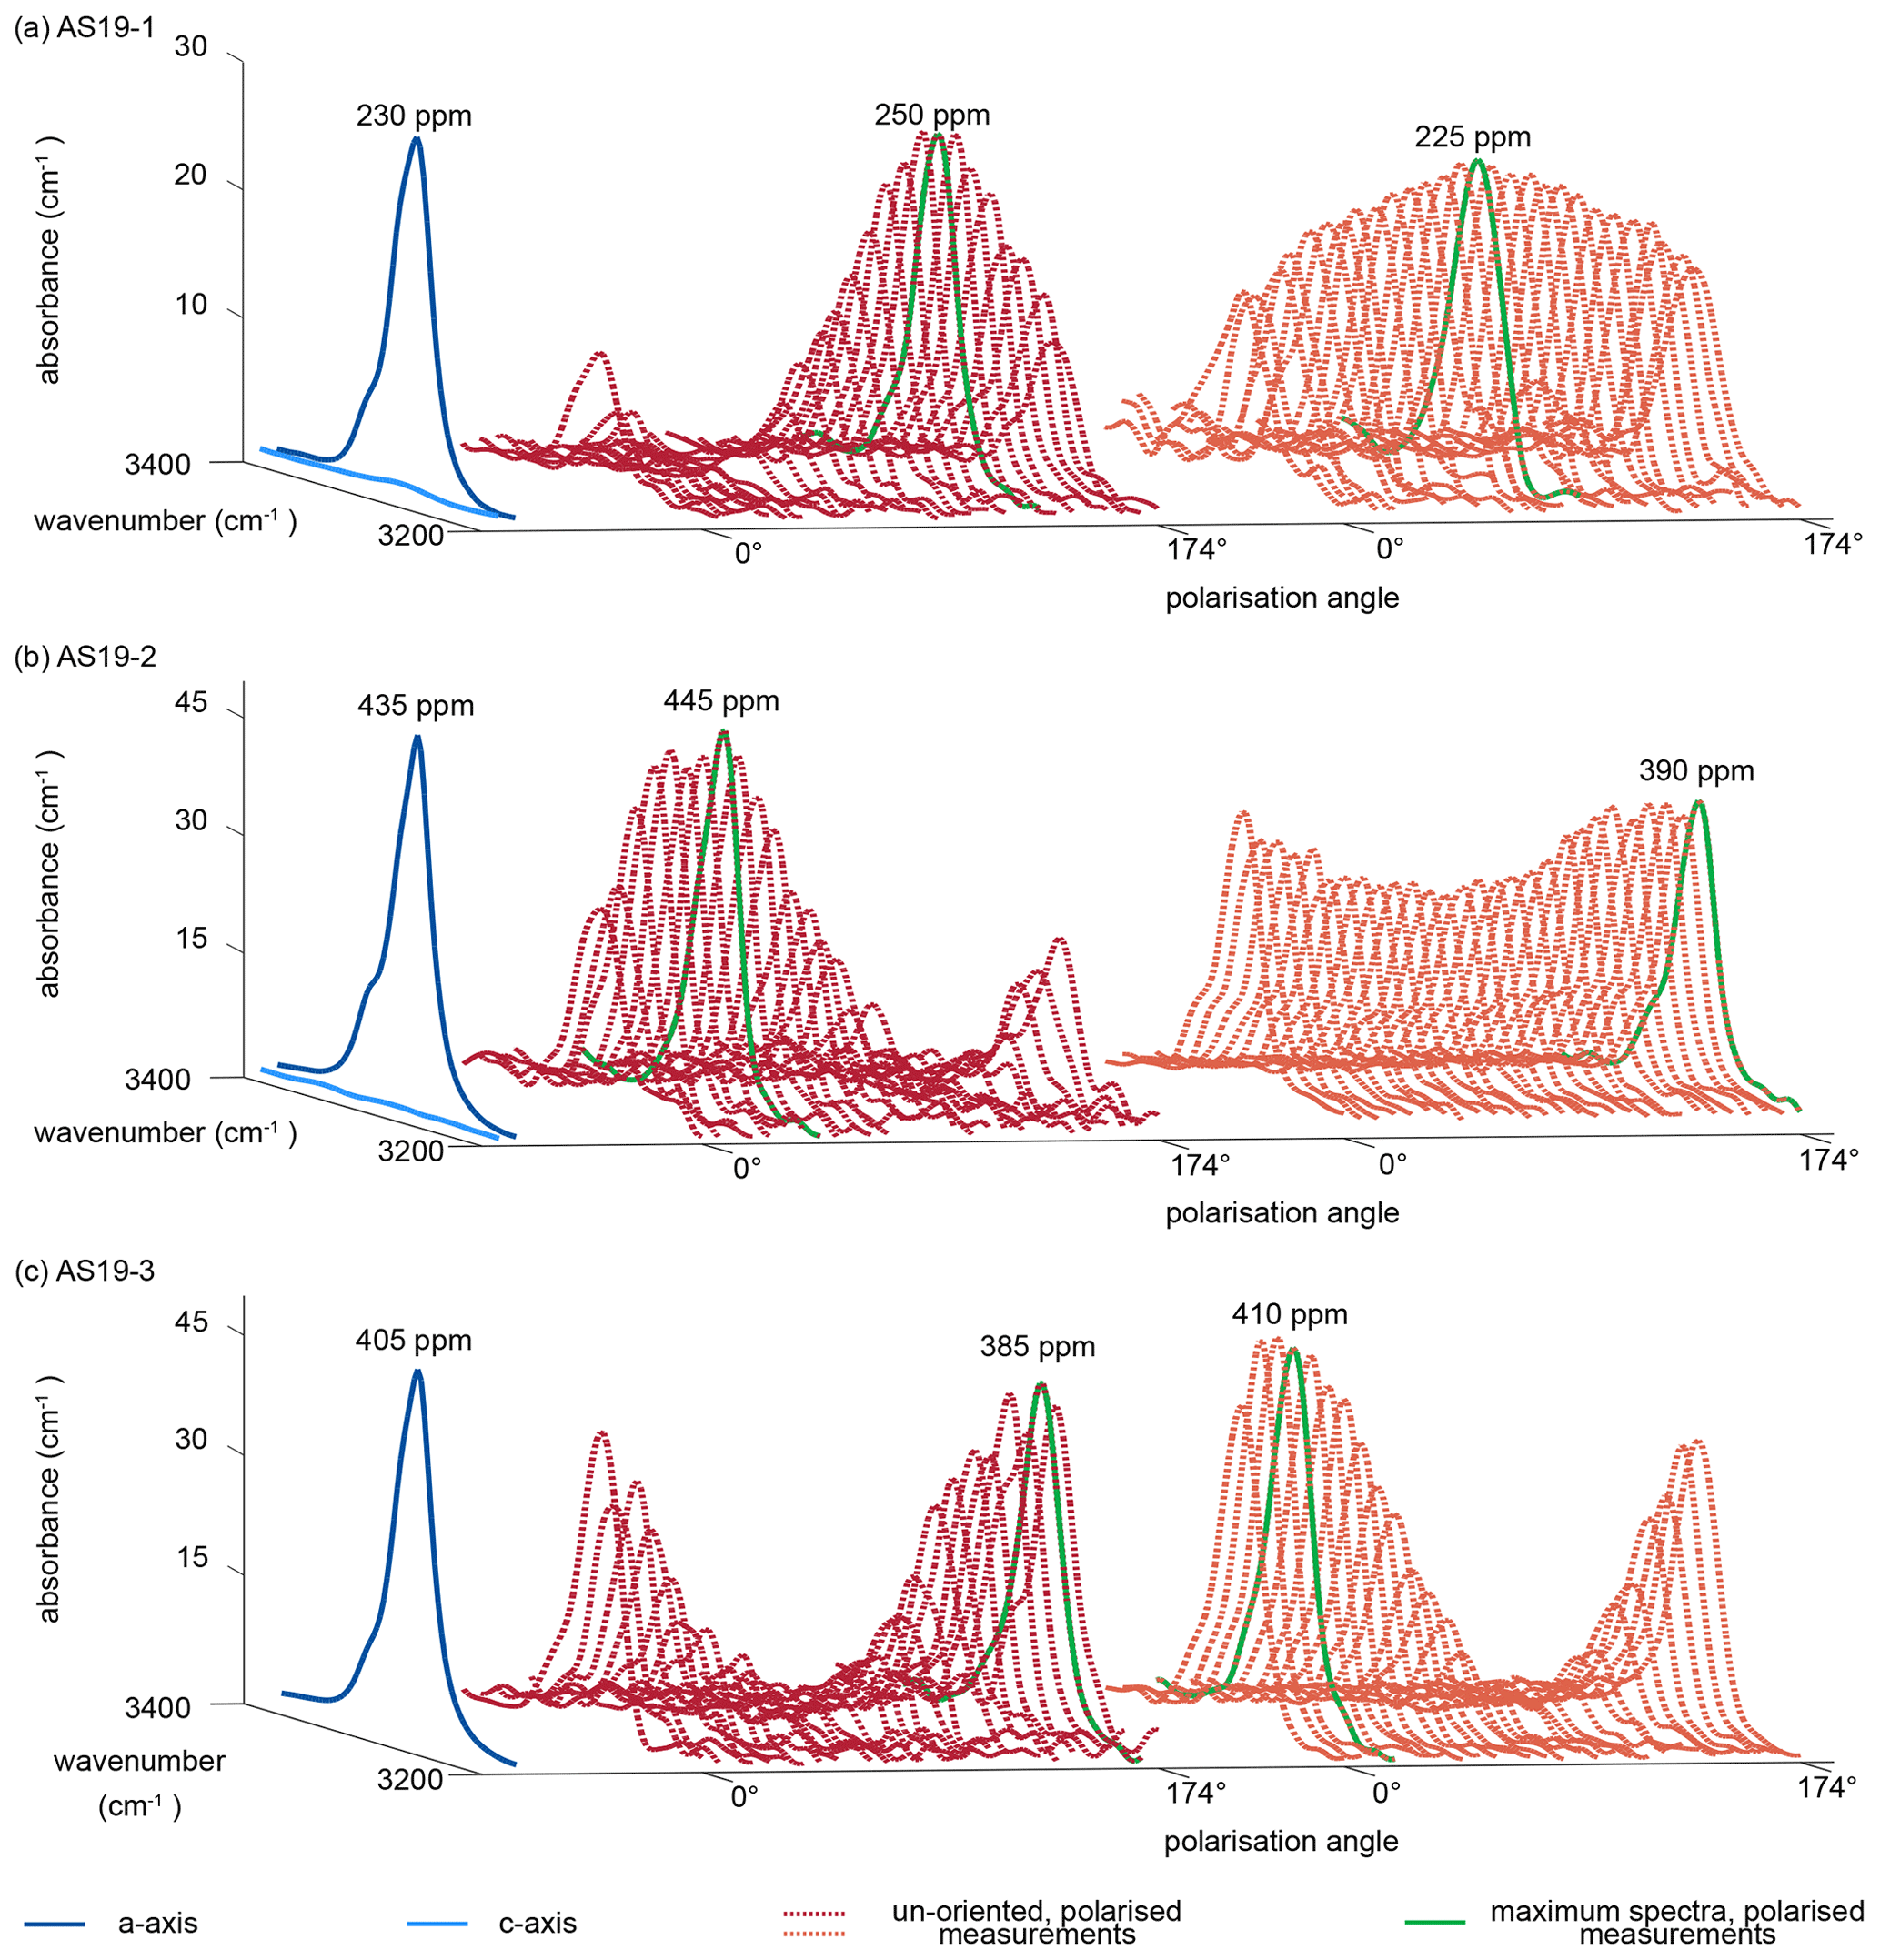
Figure 5Polarised FTIR spectra of oriented vs. unoriented rutile grains. Spectra are normalised to 1 cm. Blue spectra show absorbance measured parallel the crystallographic c and a axis, with virtually no absorbance in the c-axis spectrum. Red and orange dotted lines show polarised measurements of representative unoriented rutile grains with varying polarisation angle of 0 to 174∘. The maximum spectra of the unoriented grains are indicated as bright green line and represent the a-axis spectrum. Calculated H2O contents for the a-axis spectrum and the maximum spectrum of the unoriented grain are indicated.
The individual unoriented samples show a high variability in absorbance across polarisation angles, from partially up to effectively no observable absorbance. Therefore, spectra with maximum absorbance are easily identified. Calculated H2O contents for maximum spectra have a median of 290±45 µg g−1 with a variability between 235–340 µg g−1 for AS19-1 (Fig. 5a), a median of 410±35 µg g−1 with a variability between 360–480 µg g−1 for AS19-2 (Fig. 5b), and a median of 360±45 µg g−1 with a variability between 29–410 µg g−1 for AS19-3 (Fig. 5c).
For all three samples the variability of calculated H2O contents from spot analyses on oriented samples lies in the range of 10 %–15 %, which is less than the intra-grain variability observed in the MCT-FTIR maps, and all calculated H2O contents for a-axis spectra and maxima spectra of unoriented samples overlap within the intra-grain variability observed in MCT-FTIR maps.
5.2 In situ FTIR and LA–ICP–MS analysis
The OH regions of average spectra for the investigated samples with deconvoluted OH-band positions are presented in Fig. 5. Six different OH bands can be identified, with samples AA16-11, AS19-1, AS19-2, and AS19-3 showing the same three OH bands at 3278–3281, 3294–3297, and 3323–3325 cm−1. Samples PF18-14 and SY21-31 also show three OH bands, with two being identical to the previous group of samples at wavenumber ranges of 3278–3281 and 3294–3297 cm−1, and an additional OH band at ∼ 3370 cm−1. Samples CP16-03B and DM1c show four OH bands. Sample DM1c has the same OH bands as the first group, with an additional band at ∼ 3345 cm−1, and sample CP16-03B has the same OH bands as group two, with a fourth OH band at ∼ 3390 cm−1. Samples AS19-1, AS19-2, AS19-3, and PF18-14 show a distinct double band at 3279–3281 and 3294–3297 cm−1, while in the spectra of AA16-11 and CP16-03B the OH band at 3294–3297 cm−1 forms a left shoulder on the main OH band at 3279–3281 cm−1 (Fig. 6). In SY21-31 the similar height and width of both OH bands lead to an apparent broad single peak. The same OH-band positions have also been identified in DM1c, with less absorbance relative to other OH bands observed in the samples. The OH band at 3279–3281 cm−1 forms a distinct low absorbance peak, while the OH band at 3294–3297 cm−1 can be seen as a right shoulder to the main OH band. The OH band with highest absorbance in DM1c is located at 3325 cm−1. This OH band can be observed as a left shoulder to the main double band in AA16-11, AS19-1, AS19-2, AS19-3, and CP16-03B at 3323 cm−1. DM1c also shows a left shoulder to the main OH band at 3345 cm−1. In CP16-03B, PF18-14, and SY21-31 additional broad OH bands at higher wavenumber can be observed at 3370 cm−1 in all three samples and at 3390 cm−1 in CP16-03B.
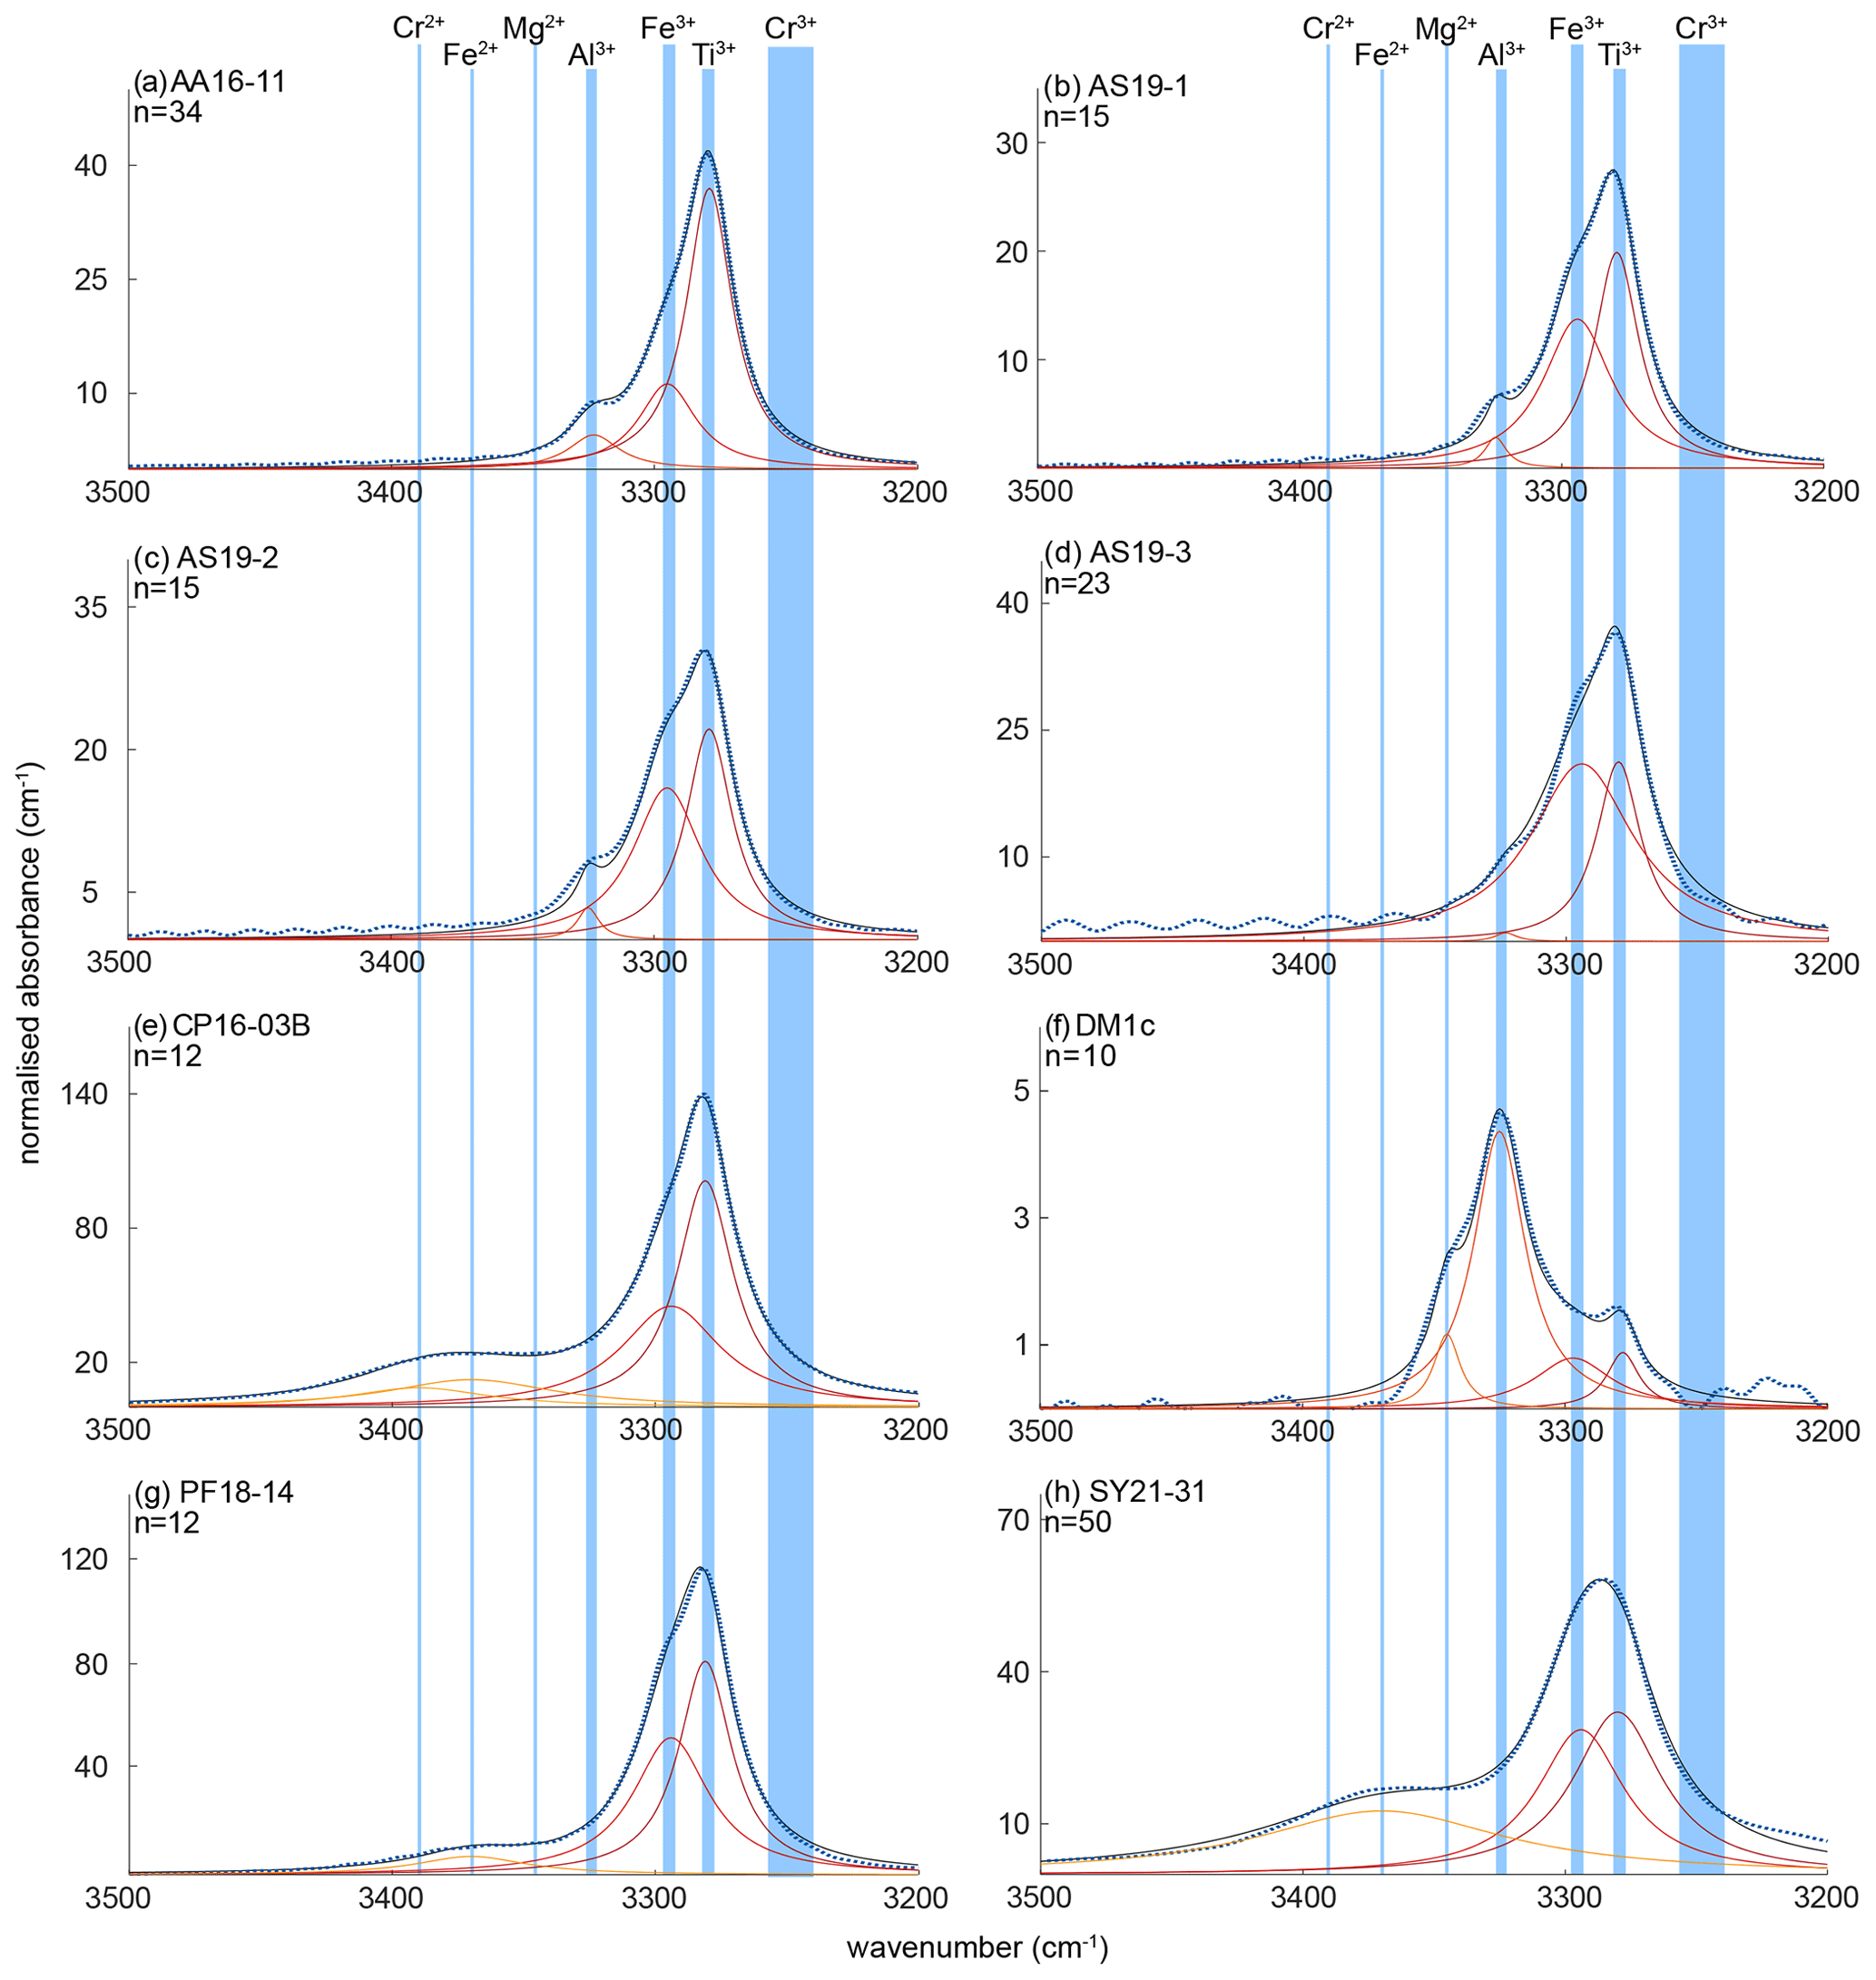
Figure 6Trace-element-dependent OH-band positions in natural rutile. Black lines are averages of n measured FTIR spectra. Orange and red dashed lines are trace-element-specific OH spectra as resulting from peak deconvolution. Blue dashed lines are cumulative spectra. Vertical blue lines depict the OH-band ranges. Ranges are 3278–3281 cm−1 for Ti3+, 3294–3297 cm−1 for Fe3+, 3323–3325 cm−1 for Al3+, 3345 cm−1 for Mg2+, 3370 cm−1 for Fe2+, and 3390 cm−1 for Cr2+. The wavenumber range of Cr3+ (3240–3257 cm−1) is taken from experimental results by Kamperman (1996) and Bromiley and Hilairet (2005).
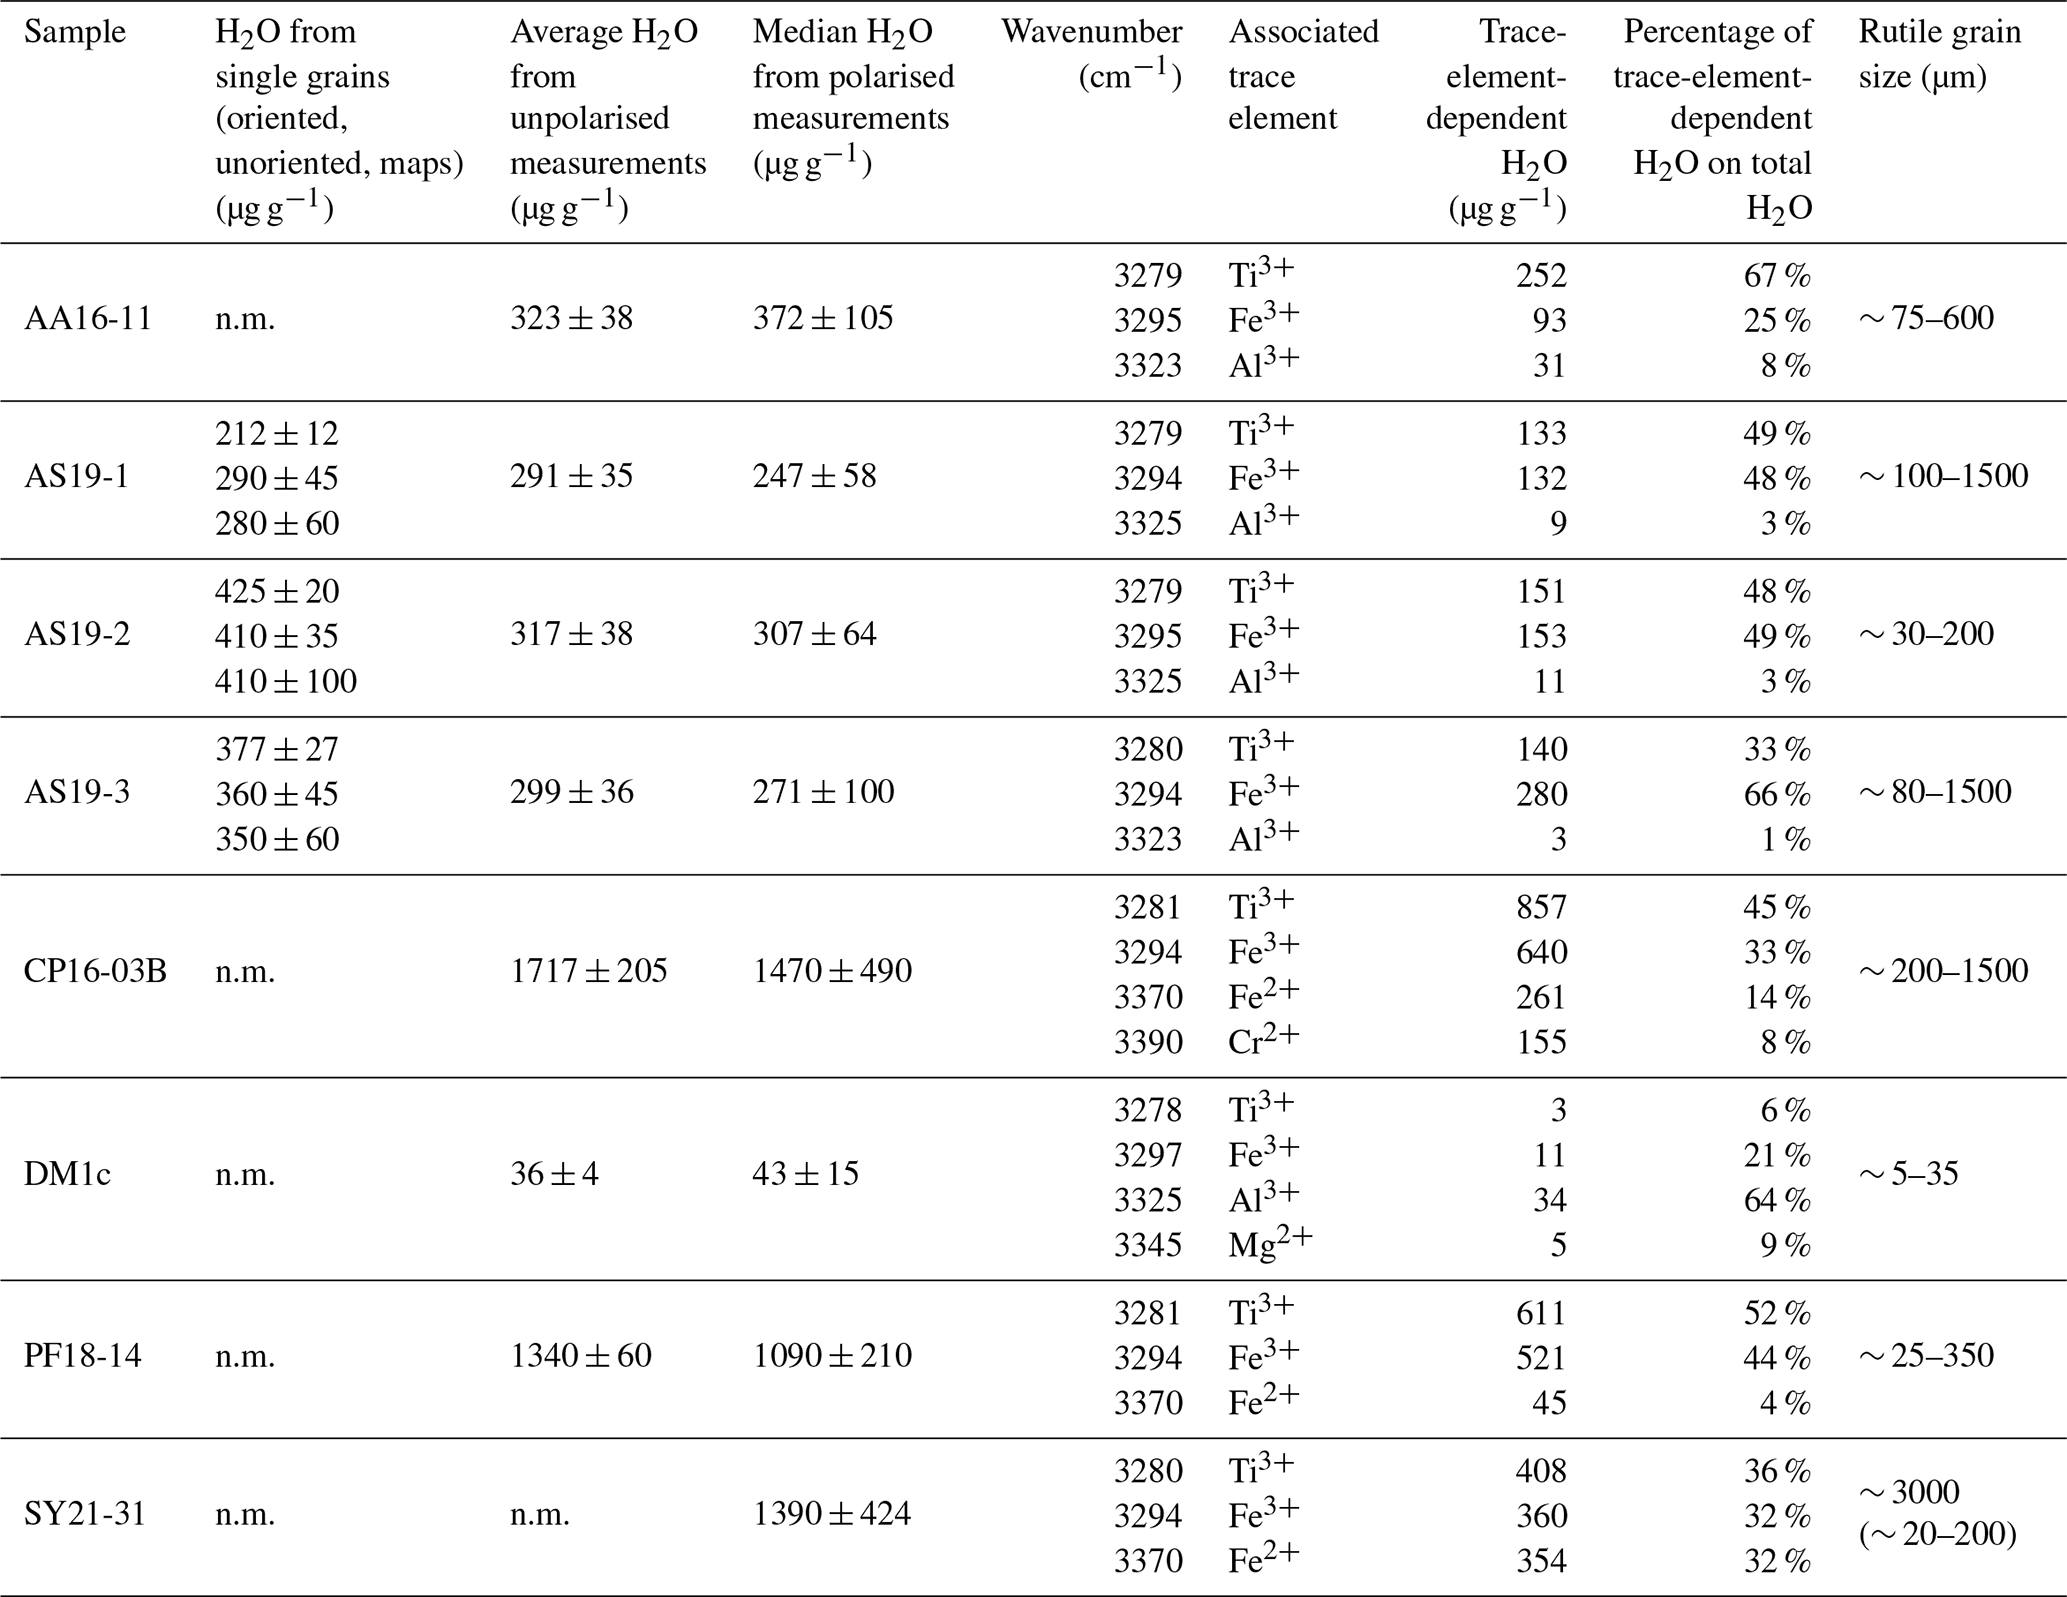
Calculated H2O contents of samples AA16-11, AS19-1, AS19-2, AS19-3, CP16-03B, DM1c, and PF18-14 for polarised and unpolarised grains are shown in Fig. 7 and given in Table 4. The H2O content of AA16-11 is homogeneous throughout the 34 polarised measured grains, with a median of 372 ± 105 µg g−1. The average H2O content calculated from unpolarised measurements on the same grains is slightly lower at 323 ± 38 µg g−1. Samples AS19-1, AS19-2, and AS19-3 also have homogeneous H2O contents with 247 ± 58, 307 ± 64 and 271 ± 100 µg g−1, respectively. Calculated average H2O contents from unpolarised measurements for AS19-1 (15 grains), AS19-2 (15 grains), and AS19-3 (23 grains) are within the range of polarised measurements at 291 ± 35, 317 ± 38, and 299 ± 36 µg g−1, respectively. The calculated H2O contents from unpolarised measurements of AA16-11, AS19-1, AS19-2, and AS19-3 fall within the spread observed in polarised measurements. The H2O contents of sample CP16-03B vary broadly between the 21 analysed grains. The median H2O content is 1470 ± 490 µg g−1, with single grains having up to 2200 µg g−1 H2O. This indicates heterogeneity of water contents in this sample. The average H2O content of 1717 ± 205 µg g−1 calculated from unpolarised measurements falls within that range, though it is significantly higher than the median H2O content of polarised measurements. Sample DM1c has significantly lower H2O contents than all other studied samples with a median H2O content of the eight polarised measured grains of 43 ± 15 µg g−1. Additionally, three grains were analysed with H2O contents below detection limit of approximately 10 µg g−1 due to the high signal-to-noise ratio. The average H2O content from unpolarised measurements falls slightly below the median value at 36 ± 4 µg g−1. The H2O content of sample PF18-14 is significantly higher compared to samples AA16-11, AS19-1, AS19-2, and AS19-3 at 1090 ± 210 µg g−1, with a relatively large spread across the 17 analysed grains. However, the calculated average H2O content from unpolarised measurements is higher by about a factor of 1.5 (1340 ± 160 µg g−1) and falls towards the upper end of the spread observed for polarised measurements. Sample SY21-31 has a median H2O content of 1390 ± 424 µg g−1 with a large spread of 615–2200 µg g−1, similar to sample CP16-03B.
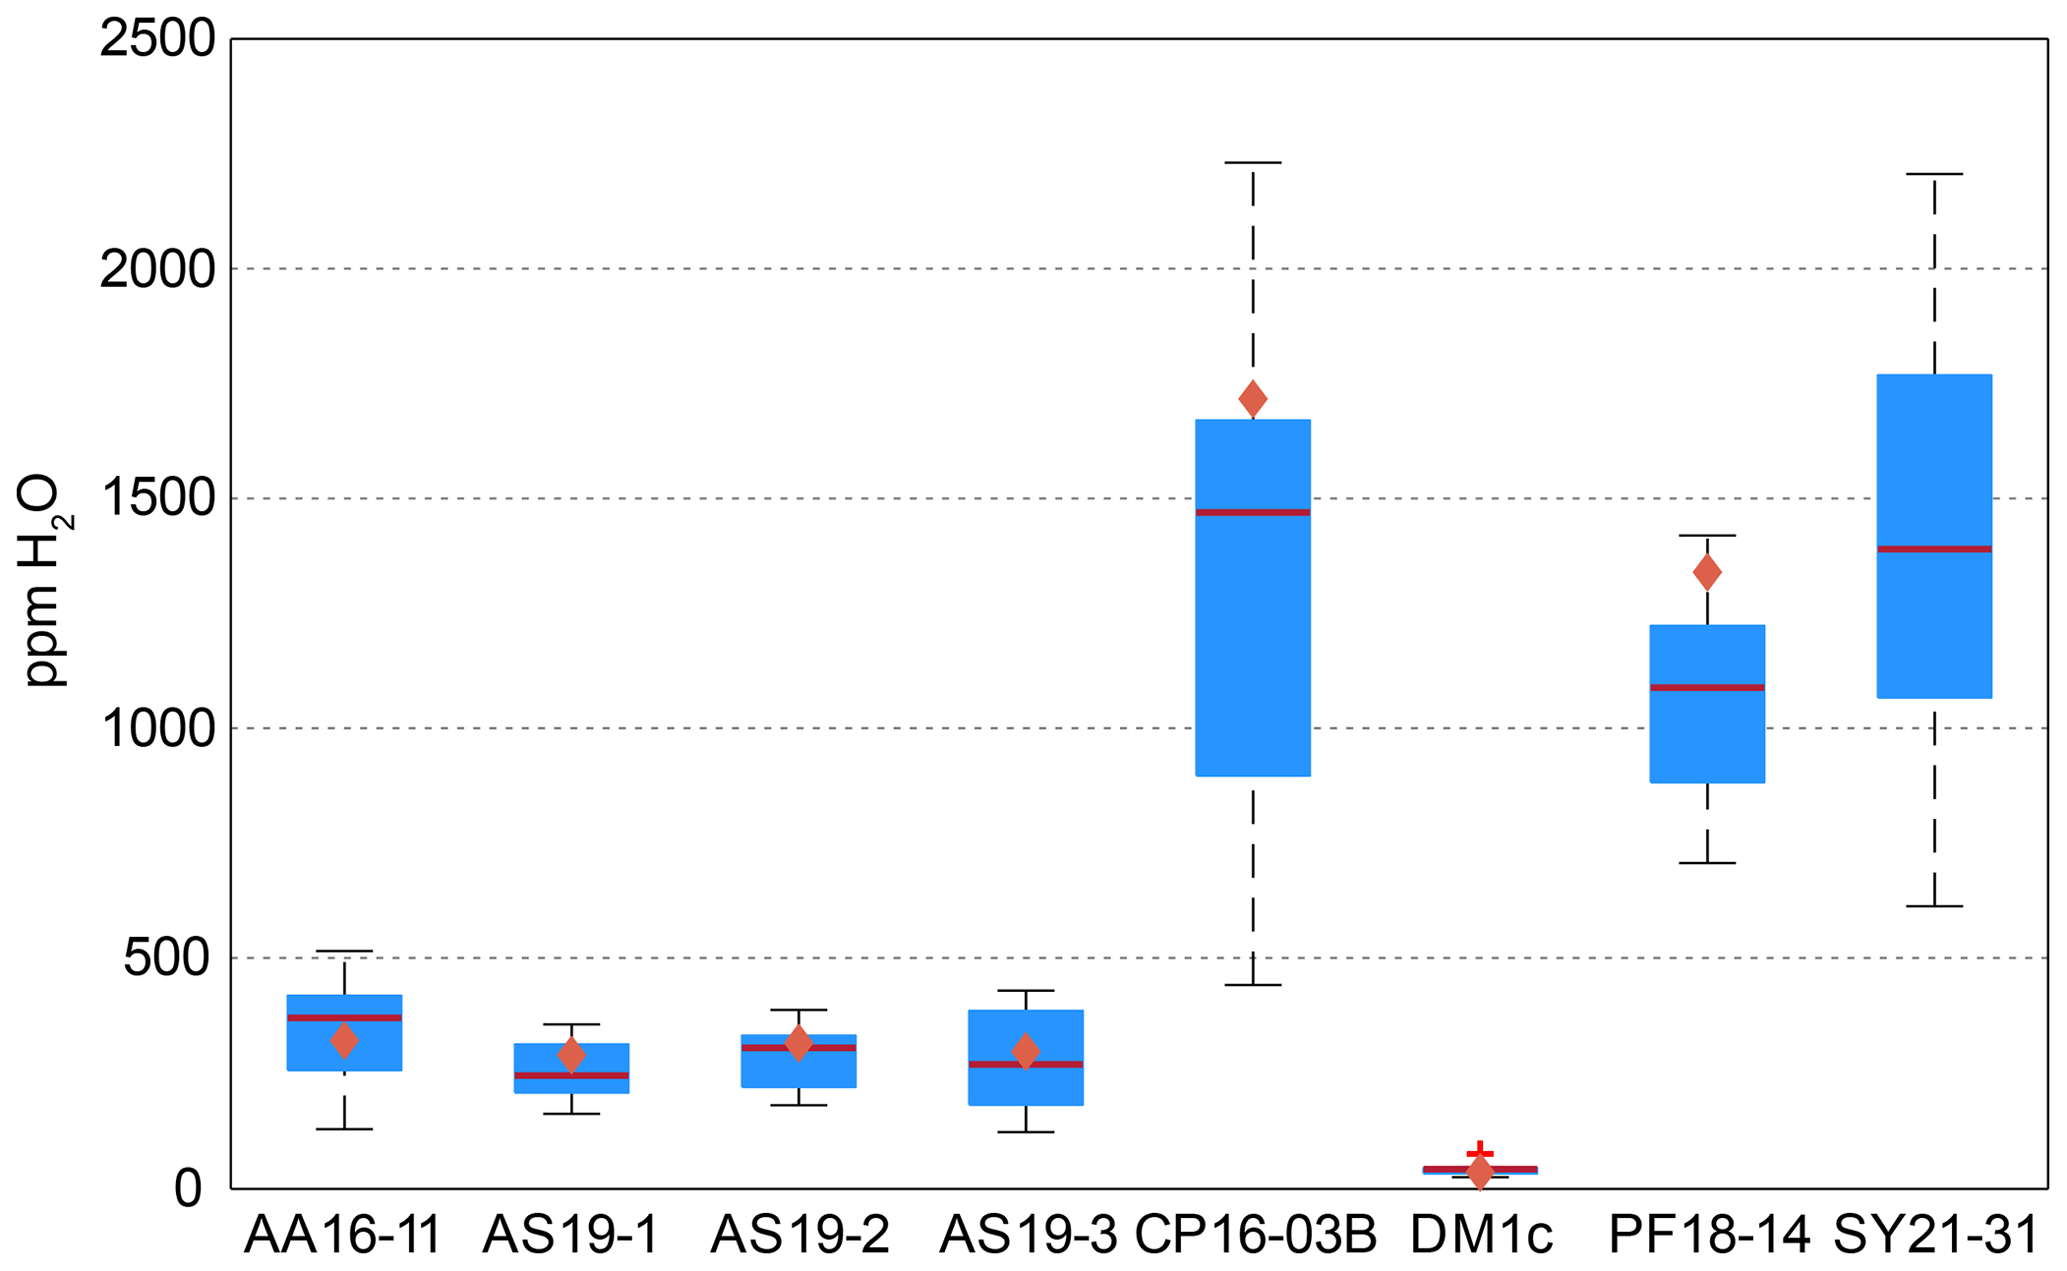
Figure 7H2O contents for polarised and unpolarised measurements. Red lines give the median H2O content from polarised analysis. Blue boxes depict the 25th and 75th percentile of the H2O content from polarised measurements; black dashed lines depict the total spread and the red cross for sample DM1c represents an outlier. Orange diamonds relate to the H2O contents calculated from unpolarised measurements using average spectra and an orientation factor of 3.
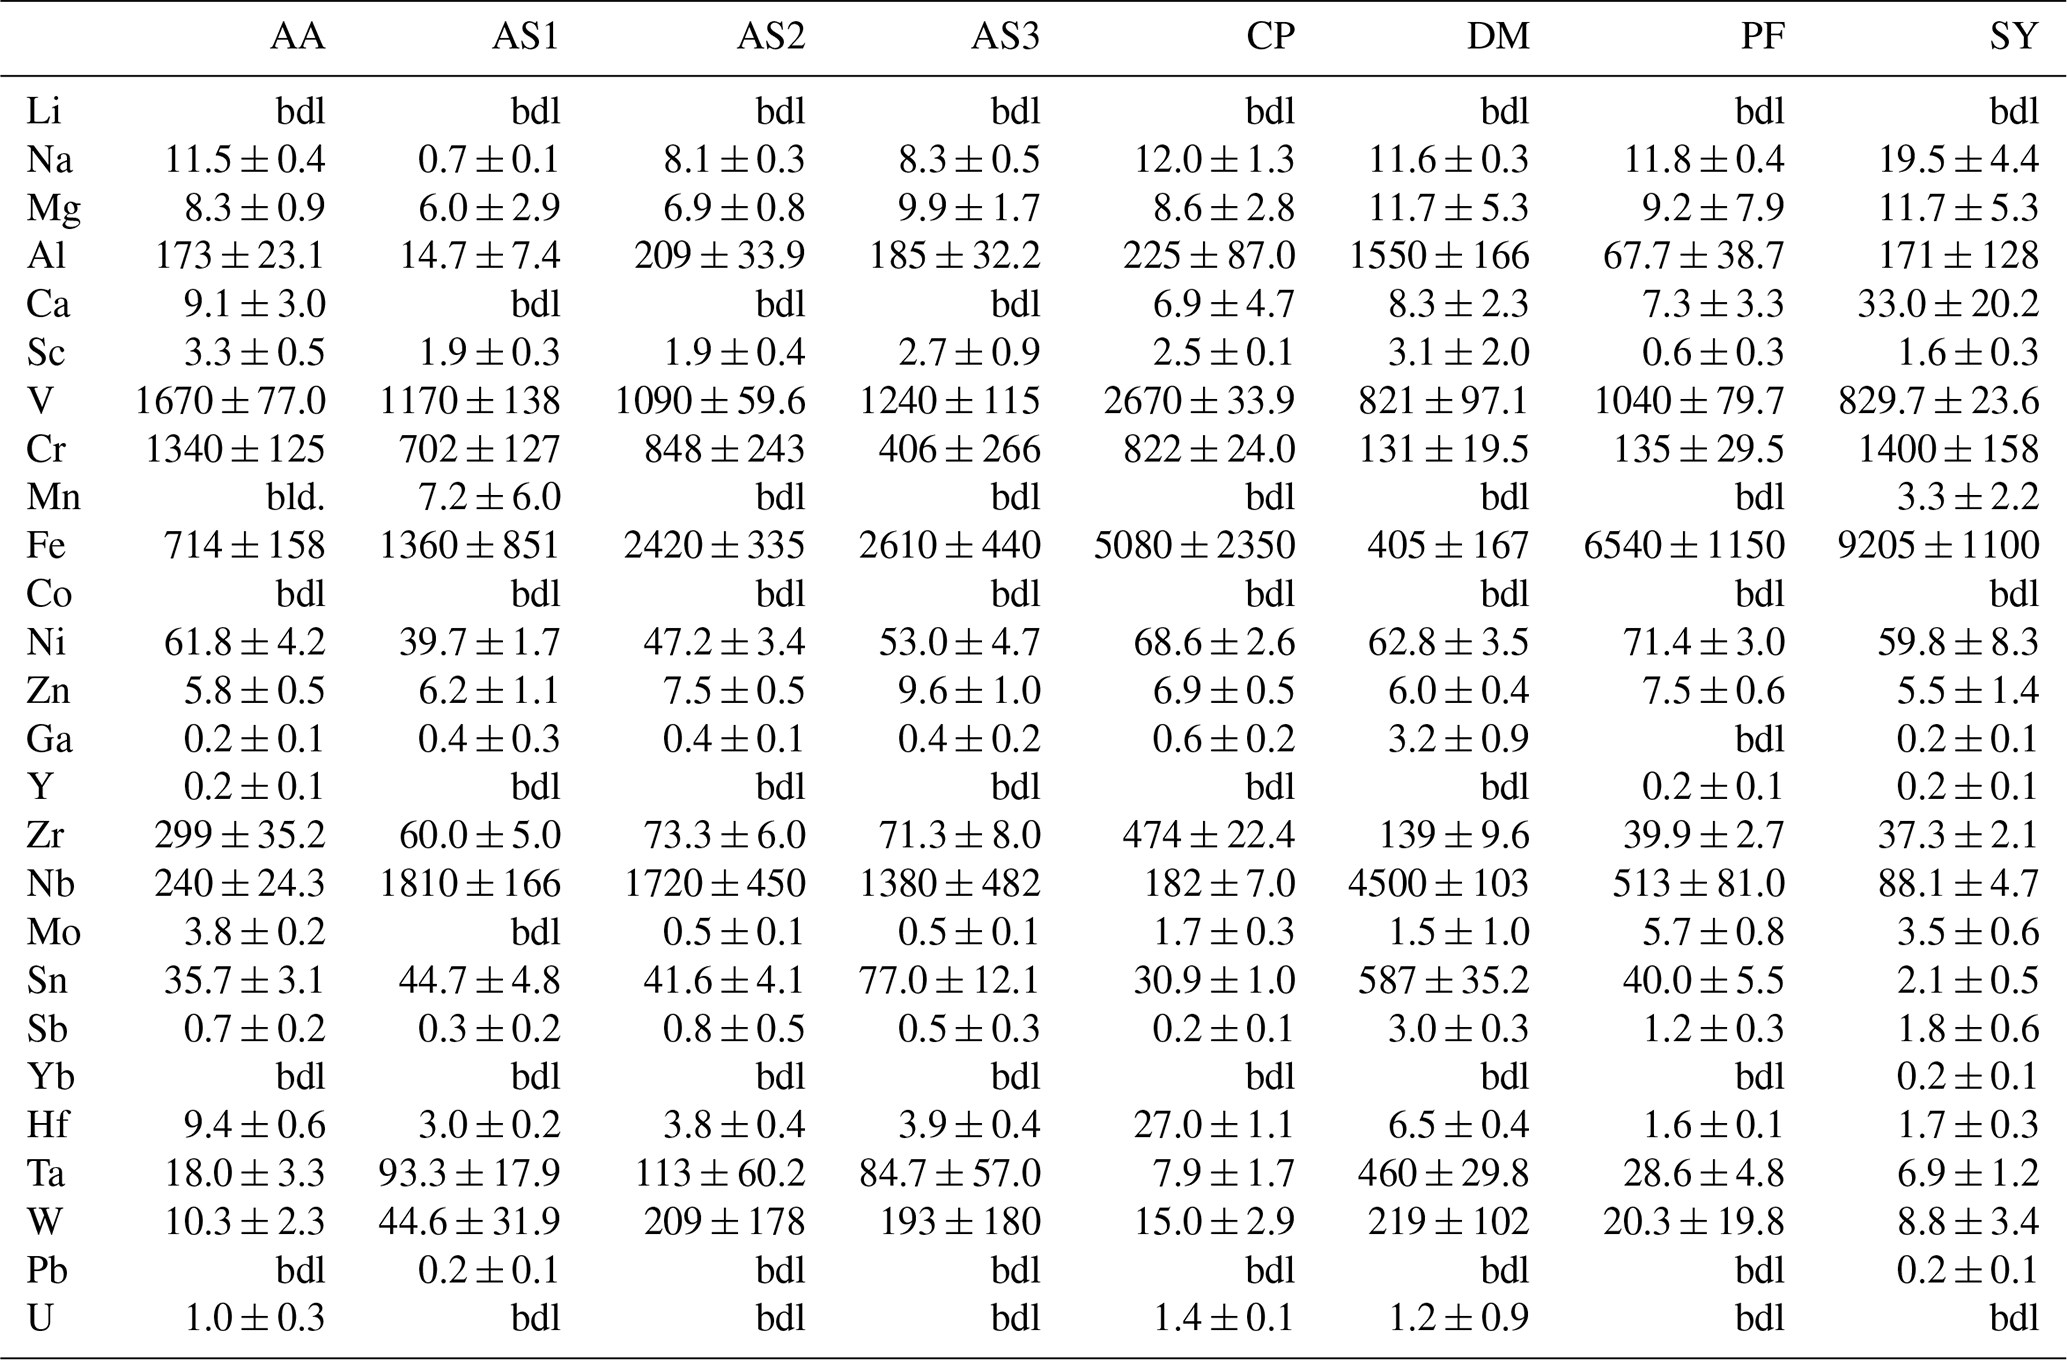
Trace-element compositional data for Mg, Al, V, Cr, and Fe, obtained by LA–ICP–MS, are shown in Table 3, and the complete data set is given in Table S1 in the Supplement.
Table 3Rutile trace-element content, measured by LA–ICP–MS, values given in µg g−1 with 2σ errors.
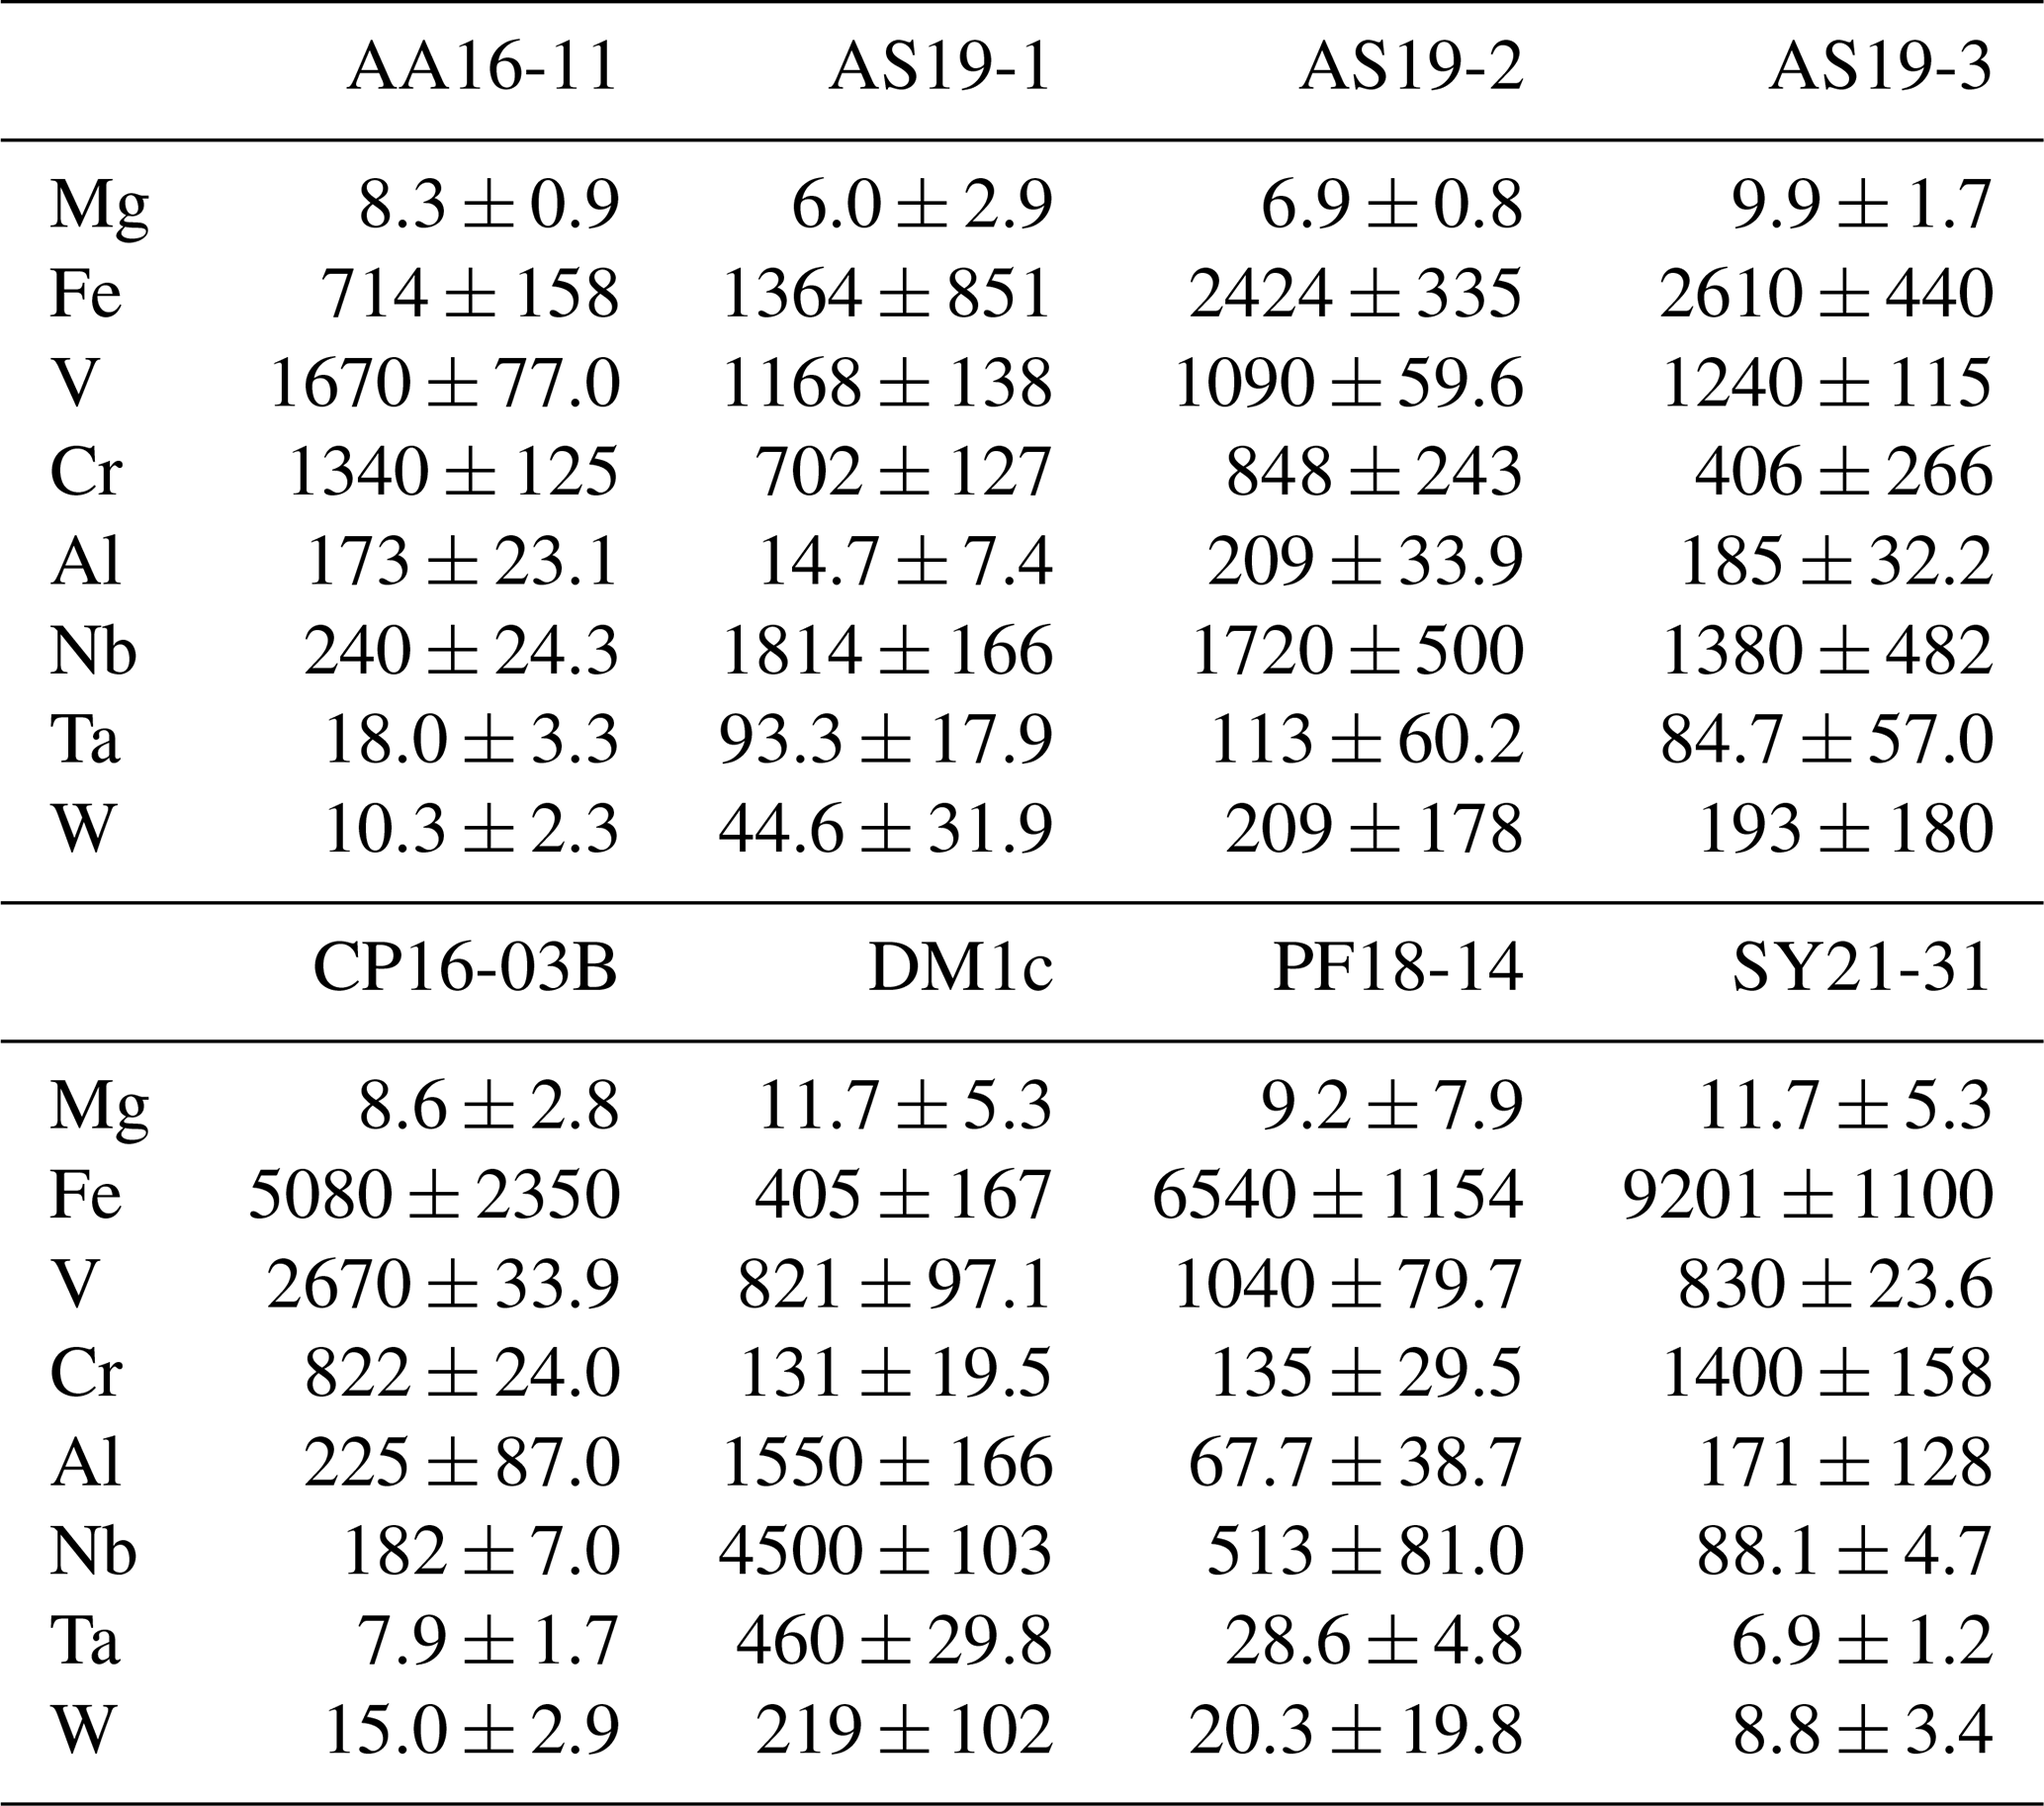
Table 4Total- and trace-element-dependent IR absorbance and H2O content in the 3200–3500 cm−1 range of thick-section samples. Errors are given at 2σ. n.m. – not measured. Grain sizes for SY21-31 represent whole grain and crushed grains.
Magnesium contents (∼ 6–12 µg g−1) are significantly lower than all other trace element abundances, at about 1–2 orders of magnitude below the next higher trace-element content (Cr for DM1c, Al for all other samples). The highest Mg contents were observed in samples DM1c and SY21-31 at ∼ 12 µg g−1. Samples SY21-31 (∼ 9200 µg g−1), PF18-14 (∼ 6540 µg g−1), and CP16-03B (∼ 5075 µg g−1) have significantly higher Fe contents than the other studied samples, by up to 1 order of magnitude. Vanadium contents are similar in all samples at ∼ 800–1200 µg g−1, with slightly higher V content for AA16-11 (∼ 1670 µg g−1) and by a factor of >2 higher V content in CP16-03B (∼ 2670 µg g−1). Chromium contents vary broadly throughout the studied samples, with lowest Cr contents in DM1c (∼ 130 µg g−1) and PF18-14 (∼ 135 µg g−1). Samples AA16-11 and SY21-31 have the highest Cr contents (∼ 1340 and ∼ 1400 µg g−1, respectively) at about 1 order of magnitude above samples DM1c and PF18-14. Al contents are generally low. Most samples have Al contents at ∼ 100–200 µg g−1, with 1 order of magnitude lower Al content in sample AS19-1 (∼ 15 µg g−1) and 1 order of magnitude higher Al content in sample DM1c (∼ 1550 µg g−1).
In six samples (AS19-1, AS19-2, AS19-3, CP16-03B, PF18-14, SY21-31), similar trends in the trace-element compositions can be observed, with the absolute abundance decreasing from Fe to V, Cr, and Al. In sample AS19-1, the Fe content (∼ 1360 µg g−1) is only slightly higher than the V content (∼ 1170 µg g−1), while the Fe contents in samples AS19-2, AS19-3, and CP16-03B (∼ 2420, ∼ 2610, and ∼ 5075 µg g−1, respectively) are higher by a factor of ∼ 2 compared to V (∼ 1090, ∼ 1240, and ∼ 2670 µg g−1, respectively), and by a factor of ∼ 6.5 in sample PF18-14 (∼ 6540 µg g−1 Fe and ∼ 1040 µg g−1 V). Chromium contents in sample AS19-2 (∼ 850 µg g−1) are slightly lower than V contents (∼ 1090 µg g−1). In sample AS19-1, Cr contents (∼ 700 µg g−1) are lower by a factor of ∼ 1.5, while samples AS19-3 and CP16-03B have Cr contents (∼ 405 and ∼ 820 µg g−1, respectively) that are lower by a factor of 3, and Cr contents in sample PF18-14 (∼ 135 µg g−1) are lower by almost 1 order of magnitude. Sample SY21-31 is the only studied sample where Cr contents (∼ 1400 µg g−1) are higher than V contents (∼ 830 µg g−1), by about a factor of 2. The Al contents are lowest in all six samples, in samples AS19-3 (∼ 180 µg g−1) and PF18-14 (∼ 70 µg g−1) by about a factor of 2, relative to the next higher trace element abundance, a factor of 4 in samples AS19-2, CP16-03B, and SY21-31 (∼ 210, ∼ 225, and ∼ 170 µg g−1, respectively), and a factor of 50, thus more than 1 order of magnitude, in sample AS19-1 (∼ 15 µg g−1).
In sample AA16-11, Fe contents (∼ 710 µg g−1) are lower than V and Cr contents. V contents (∼ 1670 µg g−1) are slightly higher than Cr contents (∼ 1340 µg g−1), as for sample AS19-2, with Fe contents by a factor of 2 lower than Cr contents. Al contents (∼ 170 µg g−1) are by a factor of 4 lower than Fe contents and thus follow similar trends relative to the trace element with the next higher absolute abundance as in samples AS19-2, CP16-03B, and SY21-31.
Sample DM1c has a significantly different trend in absolute trace-element abundance compared to all other studied samples, as Al contents (∼ 1550 µg g−1) are highest, with V contents (∼ 820 µg g−1) being lower by a factor of 2 compared to Al contents, Fe contents (∼ 400 µg g−1) being by a factor of 2 lower than V contents, and Cr contents (∼ 130 µg g−1) being by a factor of 3 lower than Fe contents.
Sample DM1c has the lowest total trace-element abundance for Mg, Fe, Al, Cr, and V of all samples (∼ 3000 µg g−1), due to the relatively low V and Cr contents and significantly lower Fe contents, compared to other samples. The total trace-element content of sample AS19-1 is only slightly higher (∼ 3250 µg g−1), due to comparably low Fe and Al contents. Even though sample AA16-11 has the second lowest Fe content of all samples, the high relative abundance of V and Cr in the sample leads to a total trace-element abundance that is higher by a factor of ∼ 1.3 (∼ 3900 µg g−1) compared to samples DM1c and AS19-1. The intermediate Fe, V, and Cr contents in samples AS19-2 and AS19-3 lead to intermediate total trace-element abundances (∼ 4575 and ∼ 4450 µg g−1, respectively). The significantly higher Fe contents in samples CP16-03B, PF18-14, and SY21-31 result in very high total trace-element abundances in these samples (∼ 8800, ∼ 7800, and ∼ 9200 µg g−1, respectively). Even though CP16-03B has the lowest Fe contents of the three samples, high V and Cr contents result in higher total trace-element contents compared to PF18-14.
6.1 In situ quantitative FTIR analysis
H2O contents calculated from a-axis spectra of oriented samples and spectra of polarised measurements on unoriented samples with maximum absorbance (“maximum spectra”) overlap within the intra-grain variability of H2O contents observed in MCT-FTIR maps. Therefore, polarised FTIR analysis on unoriented rutile grains in situ is a valid tool to quantify H2O contents. H2O contents calculated from the maximum spectra and spectra with ±6.5∘ polarisation angle deviate by approximately 1 %–10 %, depending on the sample and the orientation of the unoriented grains. Grains oriented closer to the a-axis plane have less variation in absorbance of the polarised measurements compared to grain orientations parallel to the c axis. Therefore, deviations in calculated H2O contents for small differences in polarisation angles will be smaller for grains cut nearly perpendicular to the c axis. Still, the deviation for all samples is within the observed intra-grain variability of the H2O content. To obtain the most precise results when applying the method, it is advised to measure not only the apparent maximum spectrum, but also spectra at two polarisation steps lower and higher to reduce any uncertainties. This is especially helpful for samples with low H2O content or high signal-to-noise ratio.
Comparing results from polarised and unpolarised measurements demonstrates the benefits of in situ polarised FTIR analyses. Results from unpolarised measurements of AA16-11, AS19-1, AS19-2, AS19-3, and DM1c are, within error, reproducing median H2O contents obtained from polarised measurements. Thus, for these samples, the method described by Kovács et al. (2008) may be applicable. For samples CP16-03B and PF18-14, H2O contents from unpolarised measurements overestimate the median H2O contents significantly. Two factors can contribute to the deviation of median values from polarised measurements and average values from unpolarised measurements. (1) Rutile grains are not randomly oriented but have an apparent preferred orientation. (2) Kovács et al. (2008) state that due to approximations in the derivation of their Eq. (8), calculated H2O contents have a possible large error depending on maximum and minimum absorbance for polarised measurements on the same grains when the linear absorbance of the main band exceeds 0.4. The higher the maximum absorbance and the larger the difference between maximum and minimum absorbance, the larger the error on the calculated average H2O content for unpolarised measurements. As Δc is always zero, the minimum absorbance can be assumed to be zero as well. Thus, for rutile a high Δa leads to a large error on the calculation of H2O content from unpolarised measurements. Samples AS19-3 and DM1c have low maximum linear polarised absorbances of 0.26 and 0.11 respectively, which would coincide with a calculation error of <10 % for unpolarised measurements. Samples AA16-11, AS19-1, and AS19-2 have slightly higher maximum linear polarised absorbances of 0.66, 0.53, and 0.51, respectively, which is related to calculation errors of ∼ 15 %–25 % for unpolarised measurements. Samples CP16-03B and PF18-14 have very high maximum polarised absorbances of 2.26 and 1.63 cm−1, respectively, and therefore errors in the calculation from unpolarised measurements above 60 % can be expected. Such large errors agree with observed differences for median H2O contents from polarised measurements and average H2O contents from unpolarised measurements. Consequently, for rutile with low H2O content, small errors for unpolarised measurements can be expected, while for rutile with high H2O contents, generally large errors for unpolarised measurements, likely above reasonable uncertainties, might be expected.
Additionally, H2O contents can be very heterogeneous, as seen for sample CP16-03B and to lesser extent sample PF18-14. Calculations using average spectra cannot take this heterogeneity into account, as they attribute all variations in absorbance to difference in orientation. Therefore, average calculations from unpolarised measurements are not able to depict intra-grain heterogeneities. In situ polarised measurements allow the calculation of the H2O content of each individual grain and therefore are able to account for homo- or heterogeneity. Thus, H2O calculations from in situ polarised analysis give more precise and accurate results than H2O calculations using unpolarised measurements and orientation factors and additionally allow evaluation of intra-grain variability of H2O contents.
6.2 Allocation of OH-band positions to defect types
From peak deconvolution, six OH-band ranges were identified: 3278–3281, 3294–3297, 3323–3325, 3345, 3370, and 3390 cm−1. Trace-element-dependent OH-band positions and calculated H2O contents are given in Table 4.
The band position at 3278–3281 cm−1 correlates with values associated with Ti3+, reported for synthetic pure rutile at 3279 cm−1 (Kamperman, 1996; Khomenko et al., 1998; Bromiley and Hilairet, 2005; Lucassen et al., 2013) and natural rutile from different environments at 3280 cm−1 (Hammer and Beran, 1991).
The OH band at 3294–3297 cm−1 is interpreted to be related to Fe3+. Similar OH-band positions (3295 cm−1) have previously only been reported for Fe-doped synthetic rutile (Bromiley and Hilairet, 2005). All studied samples have significant Fe contents, with the highest Fe contents measured in CP16-03B, PF18-14, and SY21-31. These samples also show higher absorbance of Fe3+-related OH bands compared to other trace-element-dependent OH bands within the same samples. Samples AA16-11 and DM1c have comparatively lower absorbance of Fe3+-related OH bands, correlating with lower Fe contents.
The two OH bands at 3278–3281 and 3294–3297 cm−1 are the dominant peaks in the spectra of AA16-11, CP16-03B, PF18-14, and SY21-31. The spectrum of DM1c also contains both of these OH bands, although the highest absorbance can be observed for the OH band at 3323–3325 cm−1. This sample has an order of magnitude higher Al content compared to the other samples; Al is approximately 3 times as high as the Fe content measured. Therefore, the OH band at 3323–3325 cm−1 is interpreted to be related to Al3+. The same band position was also observed in AA16-11 and CP16-03B at lower absorbance, corresponding to Al contents that are lower by an order of magnitude in the two samples. For synthetic rutile, both an OH band at 3323–3326 cm−1 (Johnson et al., 1968, 1973; Guo, 2017) and an OH band at 3308 cm−1 (Bromiley and Hilairet, 2005) have been attributed to Al3+. The latter has not been observed in any of the natural samples studied. One possible explanation could be that two individual OH bands at higher (∼ 3325 cm−1) and lower (∼ 3280 cm−1) wavenumber, as observed for Al3+ and Ti3+, respectively, have been interpreted as a single broad OH band by Bromiley and Hilairet (2005).
Generally, for all trivalent cations related to OH bands, smaller ionic radii of the cations relate almost linearly to OH bands at higher wavenumber (Fig. 8). Ti3+ has an ionic radius of 0.670 Å with an OH band at 3278–3281 cm−1; Fe3+ with an ionic radius of 0.645 Å relates to a shift of ∼ 16 cm−1, and Al3+ with an ionic radius of 0.535 Å relates to a shift of ∼ 44.5 cm−1. Relatively high Cr and V contents in most samples would support the possibility of Cr3+- and V3+-related OH bands. Cr3+-related OH bands have been described in Cr-doped synthetic rutile at 3240–3257 cm−1 (Kamperman, 1996; Bromiley and Hilairet, 2005). The natural samples in this study do no show OH bands in this wavenumber region; thus H+ related to Cr3+ is not present. Additionally, identifying V3+-related OH bands may not be possible using this method. According to the linear trend between ionic radius of the cation and wavenumber of the related OH band observed for other trivalent cations, and considering an ionic radius of 0.640 for V3+, V3+-related OH bands would be expected at a wavenumber of ∼ 3285–3300 cm−1. As measurements were performed with a resolution of 4 cm−1, and Ti3+- and Fe3+-related OH bands occur at 3280 and 3295 cm−1, respectively, it might not be possible to resolve V3+-related H+ from the Ti3+- and Fe3+-related OH bands.
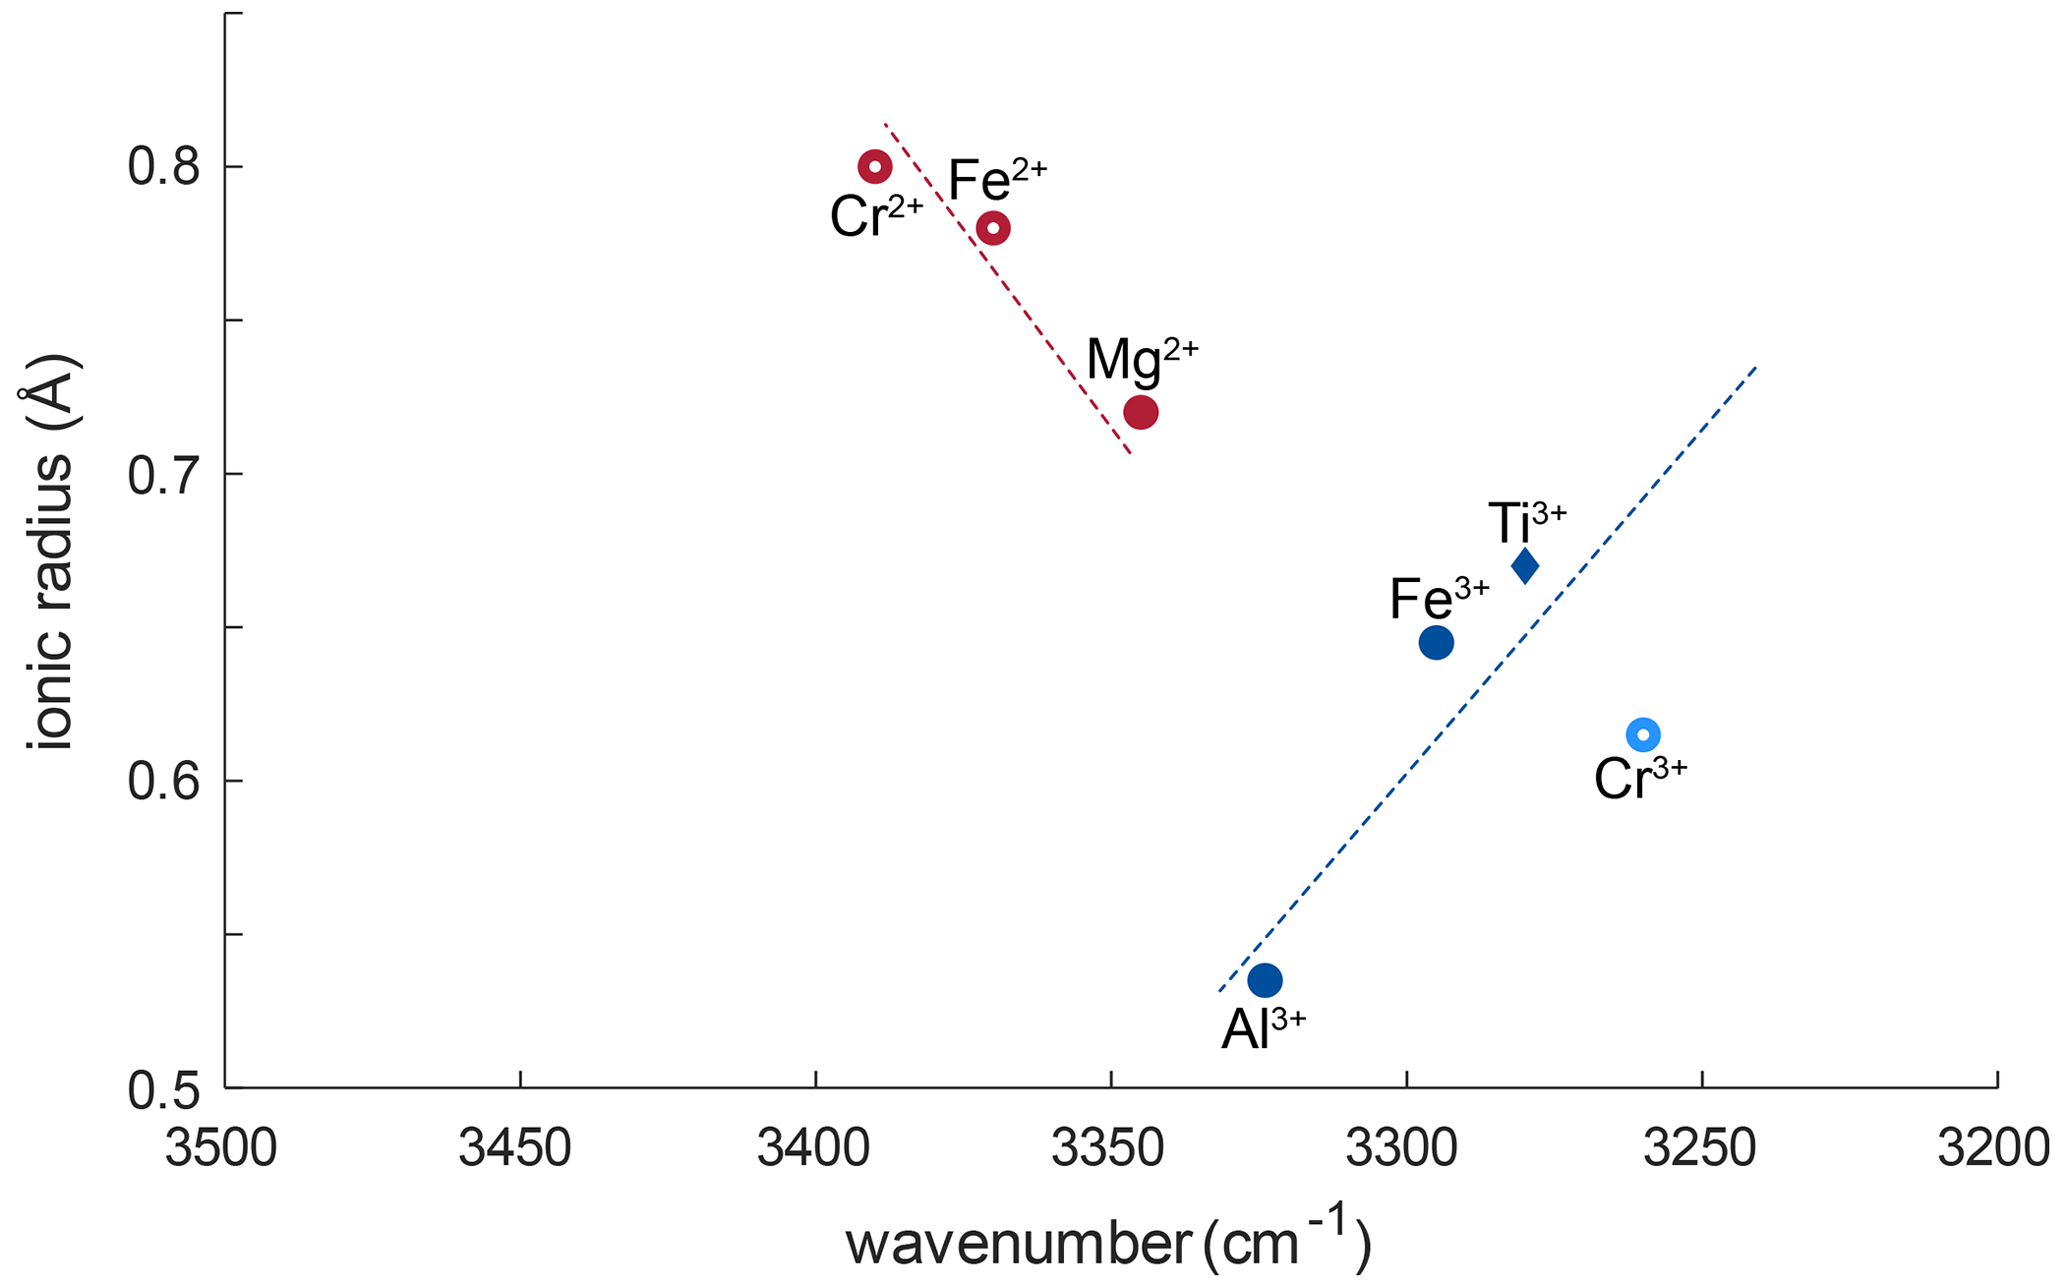
Figure 8Ionic radii (Shannon, 1976) vs. wavenumber of trace-element-related OH bands. Blue symbols correspond to trivalent cations, red symbols to divalent cations. Filled symbols represent trace elements identified from literature; open red circles represent previously unreported OH-band positions. The approximate linear relationship between ionic radius of the trace element and wavenumber of the related OH bond for trivalent cations is represented as blue dotted line. The red dashed line shows the approximate linear trend that can be assumed for divalent cations. Open, light blue circles represent possible OH bands for Cr3+ (Bromiley and Hilairet, 2005) that were not observed in this study.
The left shoulder of the main OH band in DM1c is interpreted to be related to Mg2+, as band positions at 3348–3349 cm−1 have been reported for Mg-doped synthetic rutile (Johnson et al., 1968; Bromiley and Hilairet, 2005). The absorbance of the Mg2+-related OH band in DM1c is comparable to the absorbance of the Ti3+- and Fe3+-related OH bands in the sample, although the Mg content is more than a magnitude lower than the Fe content measured, indicating different coupling behaviour of Mg2+ and Fe3+ with H+ and pentavalent cations.
The lower valence state of Mg2+ seems to lead to a different relationship between ionic radius and wavenumber. According to the linear trend observed for Ti3+, Fe3+, and Al3+, Mg2+ with an ionic radius of 0.720 Å should cause an OH band around 3260 cm−1. The observed OH band however is seen at 3345 cm−1, which implies a shift of ∼ 85 cm−1 due to the lower valence state. A possible explanation for this behaviour might be that the two H+ linked to Mg2+ are located in slightly distorted positions, resulting in an OH band at higher wavenumber. Additionally, the Mg-related OH band is much broader compared to the rather sharp, narrow Ti3+-, Fe3+-, and Al3+-related OH bands. Widening of OH bands in heating experiments on Al-doped rutile has been attributed to weakening of the OH bond (Guo, 2017), with decreased bond strength being the result of an elongation of the OH bond. Thus, the lower valence state also might cause a broader OH band.
The broad OH bands at 3370 and 3390 cm−1 observed in CP16-03B, PF18-14, and SY21-31 have not been previously described. Vlassopoulos et al. (1993) reported an OH band at 3365 cm−1, which they interpret to be caused by H in the ( 0 ) site, due to a dependence of absorption on polarisation in samples cut perpendicular to the crystallographic c axis. This behaviour was not observed for the broad OH bands at 3370 cm−1 in CP16-03B, PF18-14, and SY21-31; thus this reasoning cannot be applied here. The location at high wavenumbers and the broad morphology of both bands however suggests that the presence of H+ is coupled to divalent cations. Assuming that a linear relationship between ionic radius and wavenumber is given for divalent cations as for trivalent cations, the OH bands at 3370 and 3390 cm−1 could be attributed to Fe2+ and Cr2+, with ionic radii of 0.73 and 0.80 Å, respectively. Chromium typically occurs as trivalent cation, though it can also occur as Cr4+ and Cr2+. Lucassen et al. (2013) argue that rutile can incorporate Cr4+ that is reduced to Cr2+ during reaction with H+. Based on UV–VIS spectroscopic data from Cr-doped synthetic rutile, they exclude the presence of Cr3+. Cr2+ is also described in high-pressure synthetic minerals (Furche and Langer, 1998) and under reducing conditions in lunar rocks (Mao and Bell, 1976). Therefore, it is possible that the 3390 cm−1 OH band may be related to Cr2+. Correlating Cr–LA–ICP–MS maps and potential Cr-related H2O maps may provide further information to test this hypothesis. Further investigation of valence states of Cr and Fe in rutile is needed to provide more robust evidence. From extrapolating to lower ionic radii the negative correlation between wavenumber of the OH band and ionic radius of the related divalent cations inferred (Fig. 8), it can be observed that it intersects with the positively correlating trend observed for trivalent cations at approximately the ionic radius of Ti4+. The physical basis of this intersect and the opposite correlations however needs further investigation, for example through ab initio calculations.
6.3 Implications for coupled trace element exchange
As rutile can incorporate a variety of trace elements with different valence states, charge balance has to be achieved, making coupled substitutions necessary. Traditionally, focus has mainly been on Zr4+, Nb5+, and Ta5+ substitution in rutile. However, molar trace-element contents show that these trace elements usually play a subordinate role compared to trivalent cations and H+, which are observed to have much higher contents in rutile on a molar basis (Fig. 9, Table 5). If trivalent cations are substituted for Ti4+, charge balance has to be achieved by coupled substitution. Due to the high molar abundance of trivalent cations, charge balance considerations are highly relevant to understand coupled trace-element exchange and therefore rutile trace-element geochemistry. Three types of coupled substitutions in rutile are possible. (1) Ti4+ can be substituted by a di- or trivalent cation plus H+ that is incorporated into an interstitial position, e.g. Ti4+ → (Fe, Al)3+ + H+, Ti4+ → (Mg, Fe, Cr)2+ + 2H+. (2) If H+ is not involved in the charge balance, di- and trivalent cations can be balanced by pentavalent cations, e.g. 2Ti4+ → (Ti, Fe, Al, Cr)3+ + Nb5+ or 3Ti4+ → (Mg, Fe, Cr)2+ + 2Nb5+. (3) Charge deficits of di- and trivalent cations can be balanced by oxygen vacancies (Kamperman, 1996; Bromiley et al., 2004), e.g. Ti2O4 → Fe2O3.
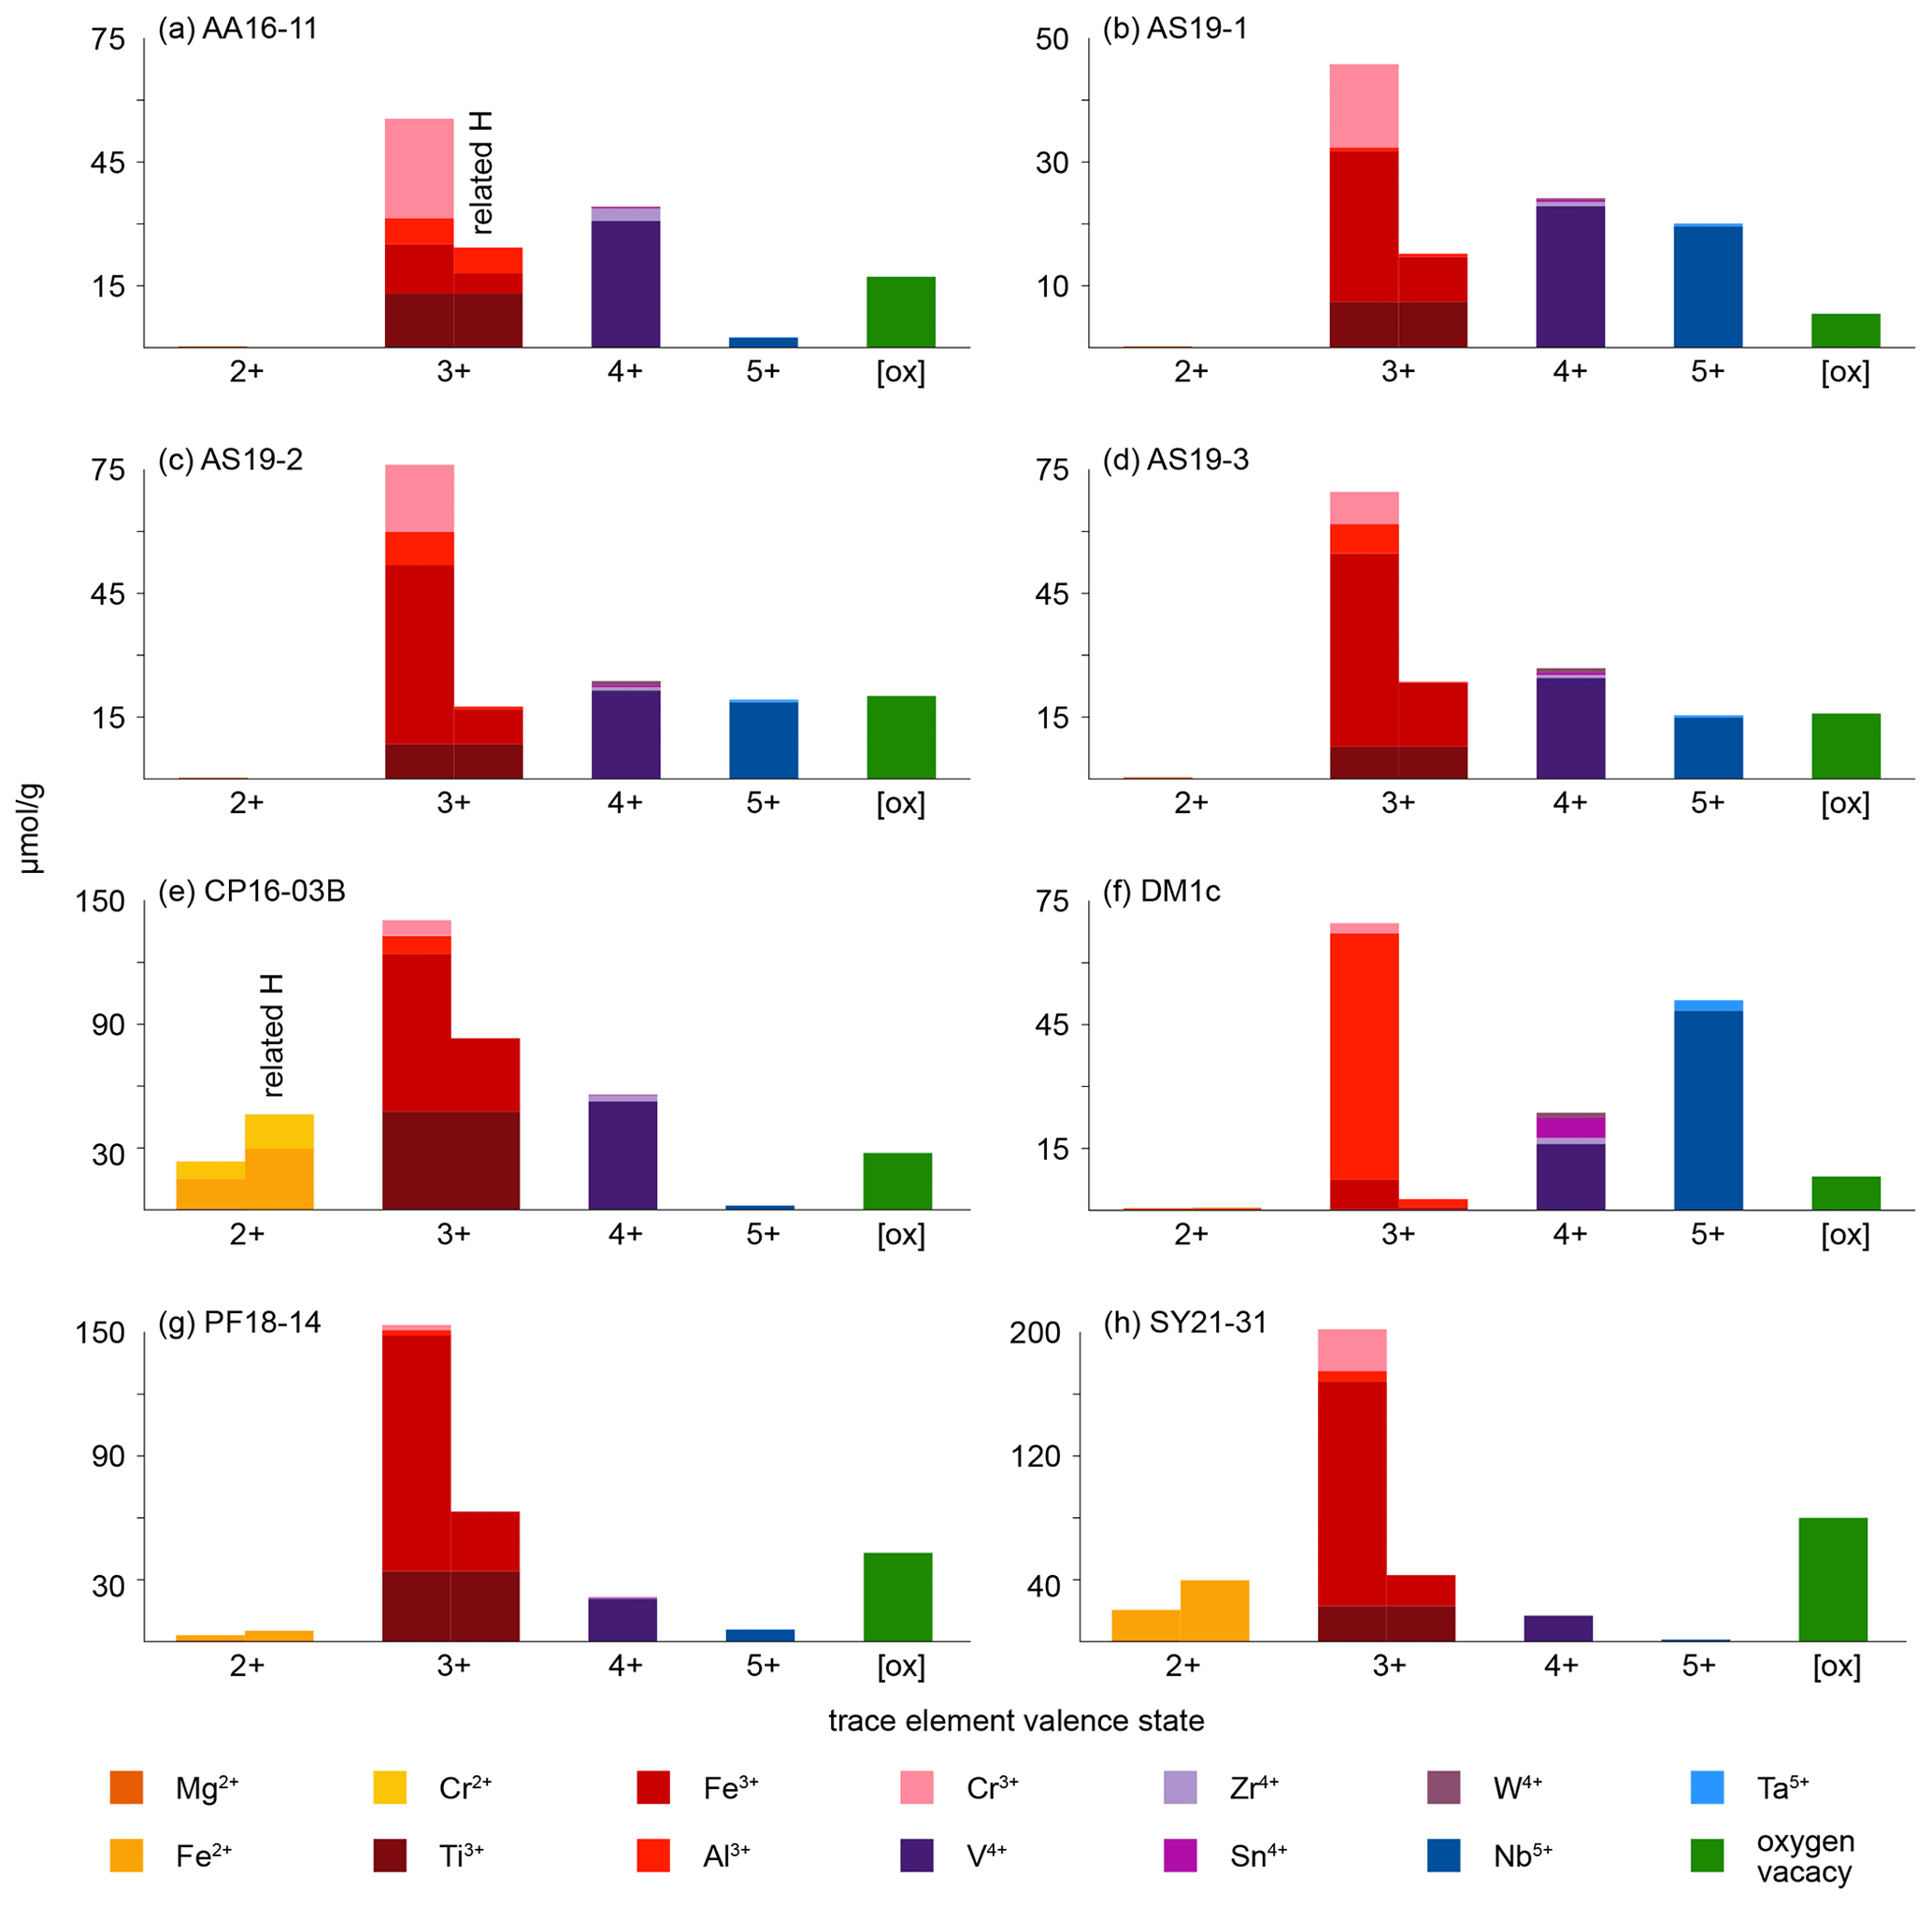
Figure 9Molar trace-element contents (µmol g−1) by valence state. Each bar represents all trace elements with the same valence state. For di- and trivalent cations, the left column depicts the trace-element content and the right column the trace-element-related H+ content. Cations that create a charge deficit are shown in orange and red, cations that create a charge surplus in blue, and cations that do not influence charge balance in violet. Oxygen vacancies are calculated from total excess of di- and trivalent cations over pentavalent cations. It is assumed that Cr occurs as Cr2+ when Cr-related OH bands are visible and as Cr3+ otherwise; V is considered to occur purely as V4+; V3+ and V5+ are not considered. Ti3+ is given as minimum values, assuming coupling only with H+ and not pentavalent cations. For Fe and Cr, it is assumed that if Cr2+ and/or Fe2+ are present, they are completely charge balanced by H and H, respectively, while Cr3+ and Fe3+ are calculated as Crtotal − Cr2+ and Fetotal − Fe2+. Any charge surplus from di- and trivalent cations that is not charge balanced by H+ or pentavalent cations is assumed to be balanced by oxygen vacancies, with one oxygen vacancy balancing two trivalent cations. Data can be found in Table 5.
Table 5Trace element and related H+ data (µmol g). [ox] – oxygen vacancies.
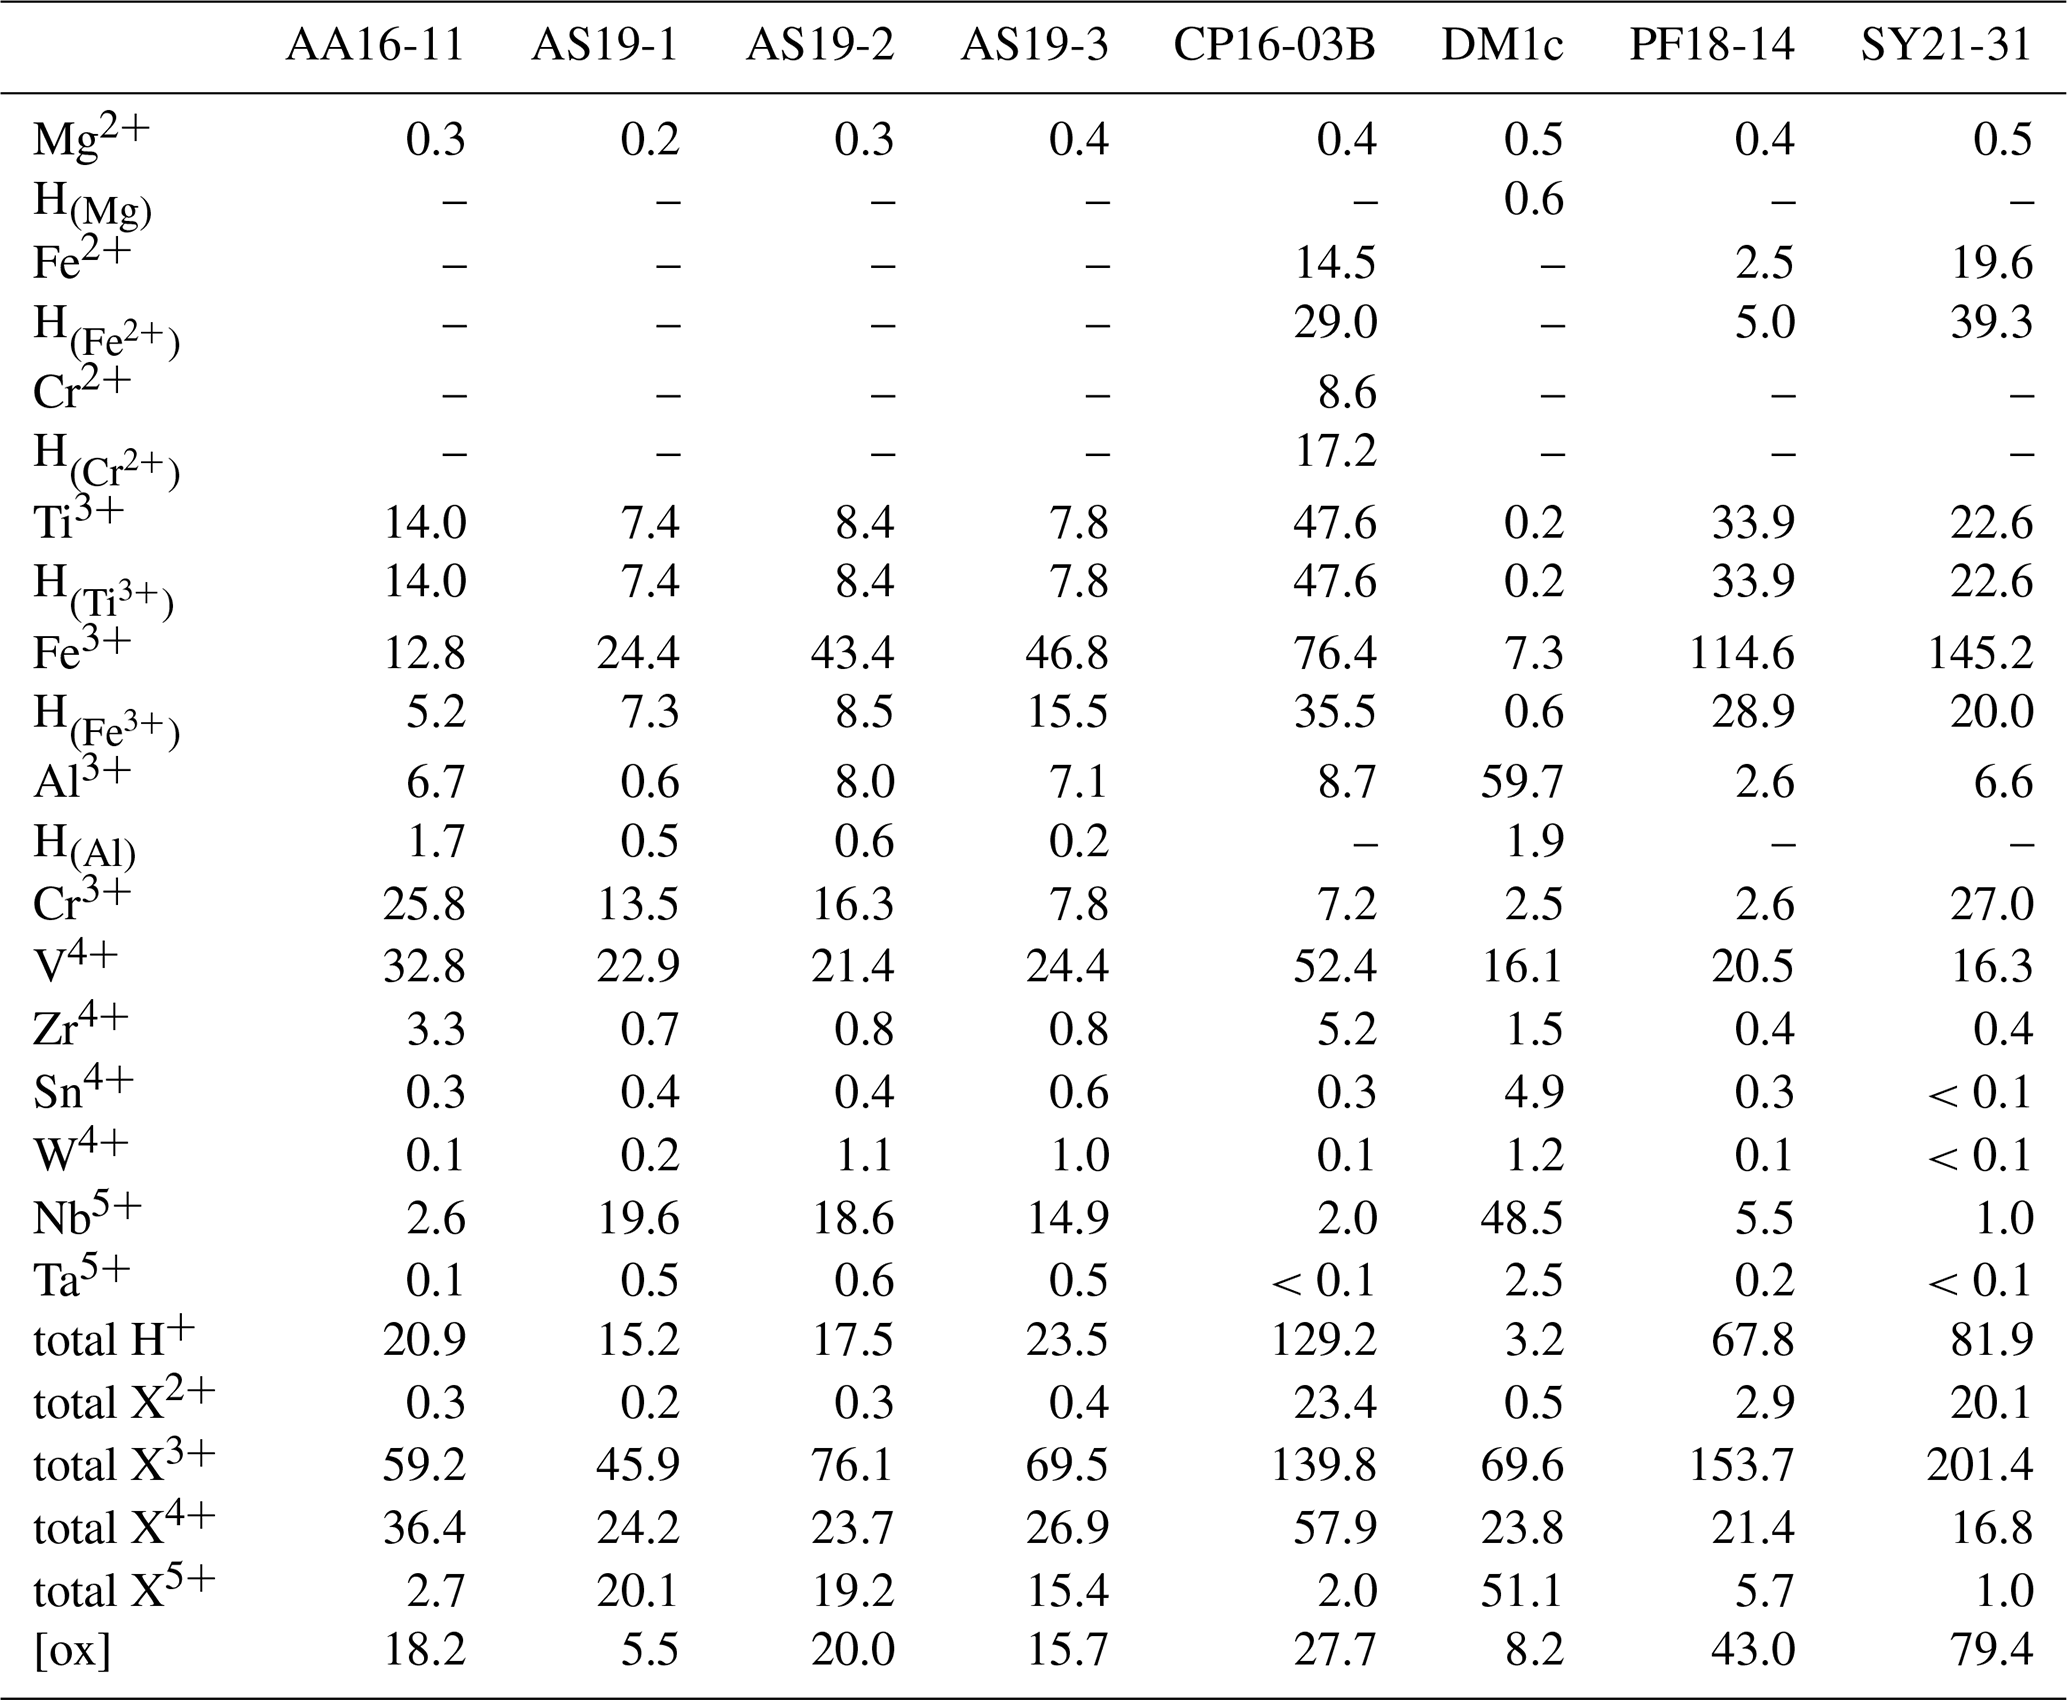
Figure 10 shows the relationship between trace-element-related H+ content and trace-element content on molar basis (µmol g−1). It can be seen that the trace-element-dependent H+ contents cannot balance the related trace elements completely. If H+ would entirely charge balance the related trace element, a 1 : 1 ratio between trace-element-related H+ content and trace-element content for trivalent cations and a 2 : 1 ratio for divalent cations would be seen. As none of the trace-element–H+ pairs show these ratios, charge balance between di- and trivalent cations with pentavalent cations needs to occur. An error in the calibration coefficient used for calculation of H2O contents does not explain the observed deviations, as there are no systematic but rather random offsets for the respective trace elements.
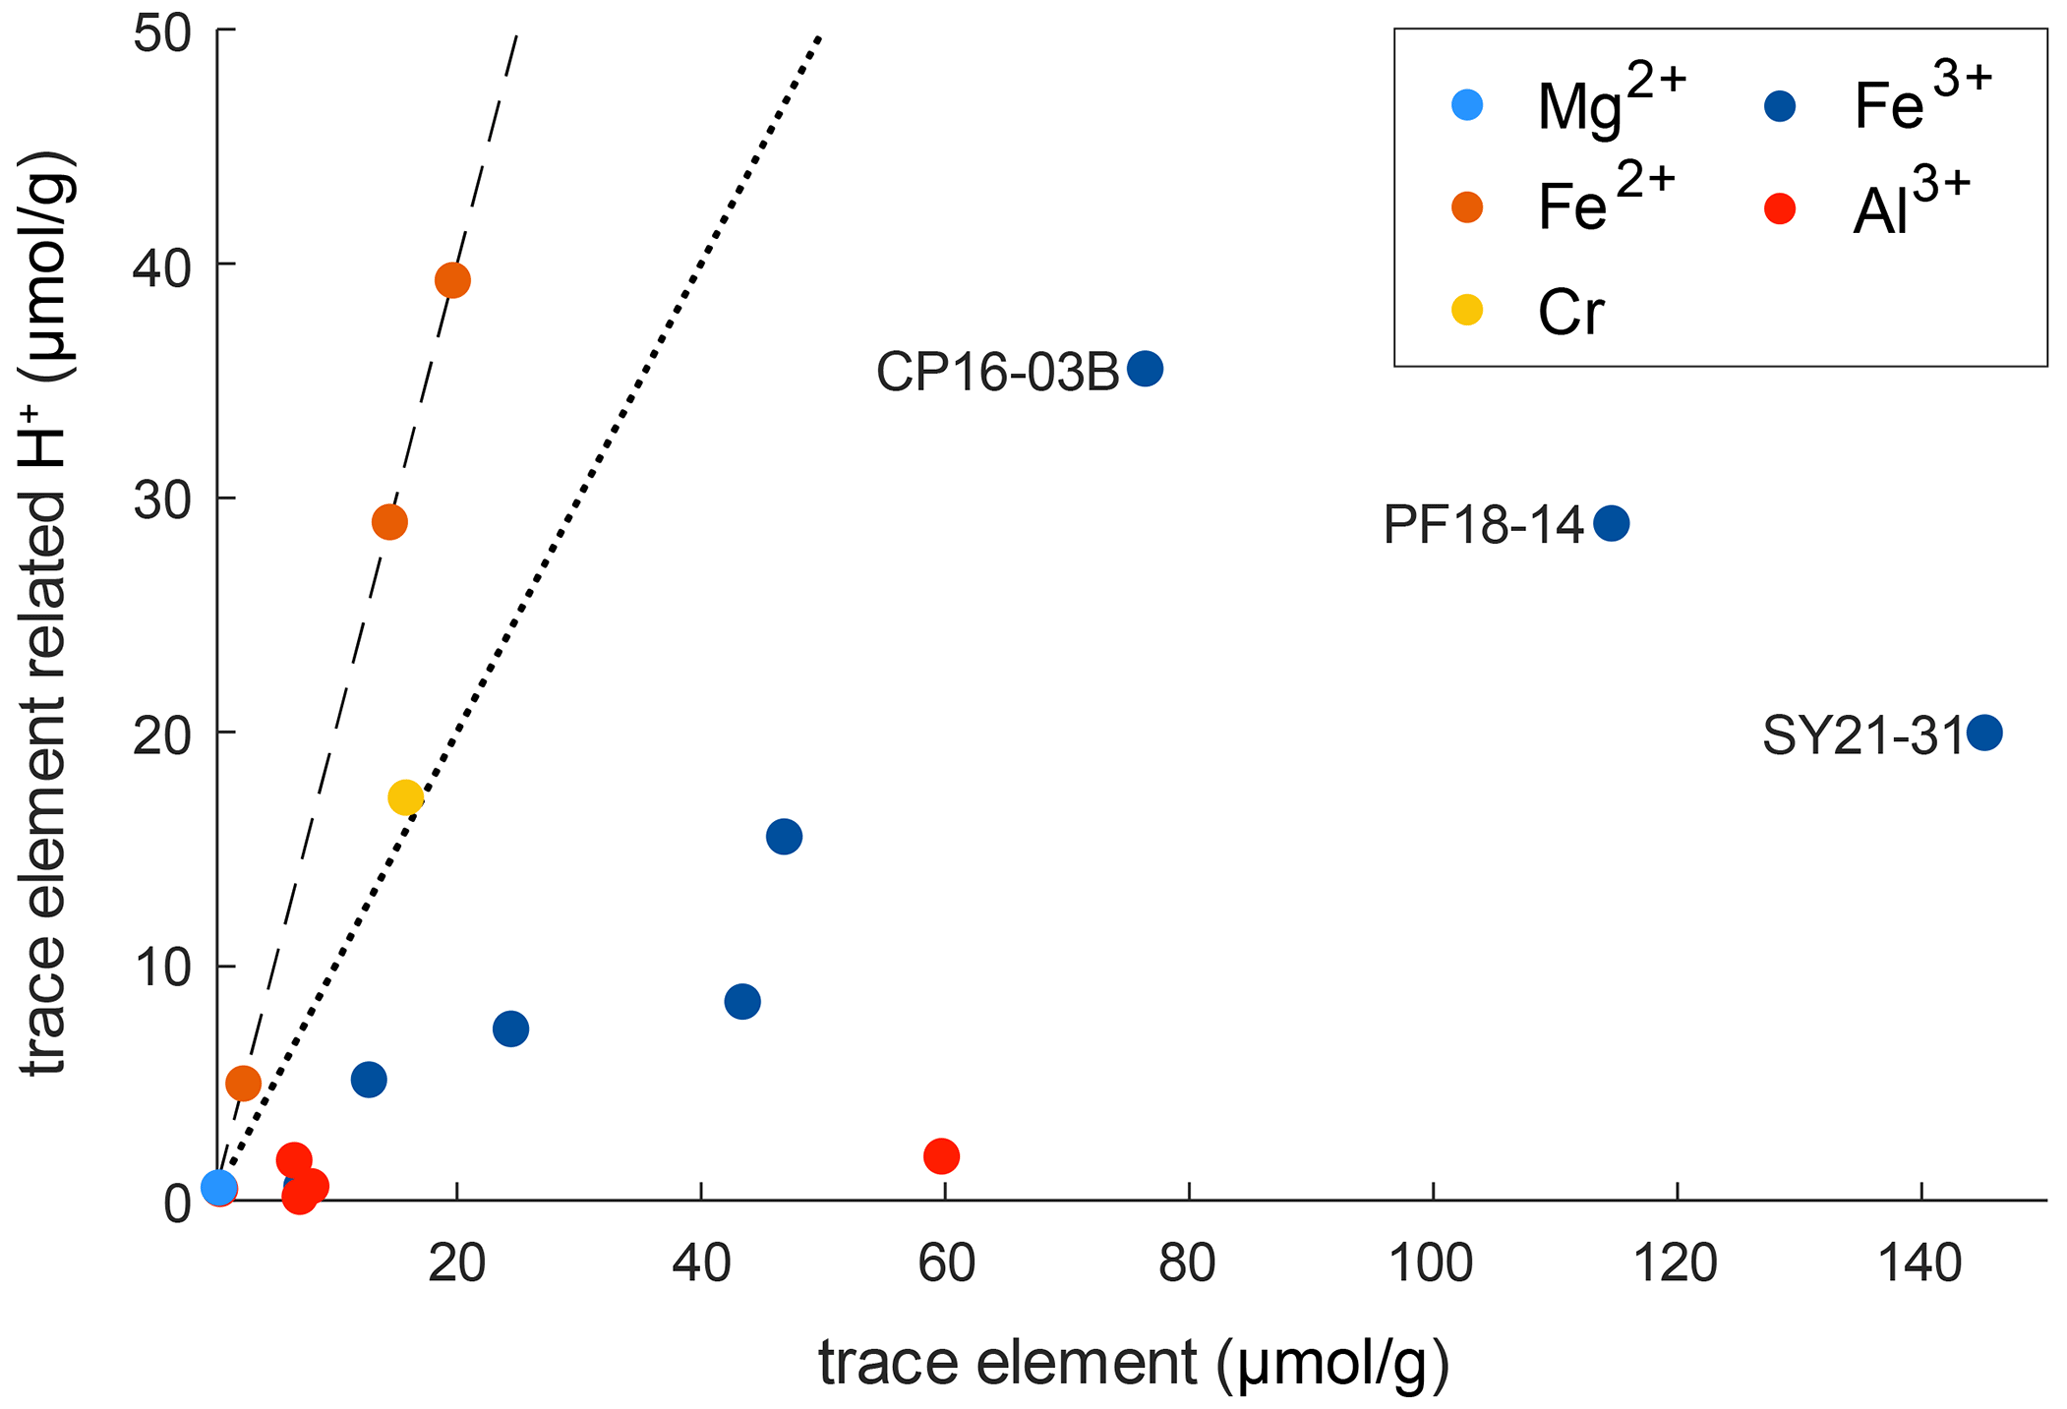
Figure 10Molar trace-element content vs. trace-element-related H+ content. The dotted line represents a 1 : 1 ratio between H+ and related trace element that would denote a perfect balance of H+ and trivalent cations. The dashed line represents a 2 : 1 ratio between H+ and related trace element that would denote a perfect balance of H+ and divalent cations.
However, ratios between trace-element-related H+ contents and the related trace element allow the evaluation of preferential coupling between di- and trivalent cations with H+ and pentavalent cations. Cr2+ in sample CP16-03B falls very close to the 2 : 1 ratio and thus is preferentially charge balanced by H+. Fe3+ shows a rather large spread, with most samples falling relatively close to a 1 : 3 ratio. Hence coupling of Fe3+ with H+ and pentavalent cations varies between samples. The furthest spread can be observed for samples containing both Fe2+ and Fe3+ (CP16-03B, PF18-14, SY21-31); hence the presence of Fe2+ seems to have an influence on the preferred charge balance for Fe3+. Al3+ deviates the furthest from a 1 : 1 ratio and is thus preferentially balanced by pentavalent cations such as Nb5+ and Ta5+.
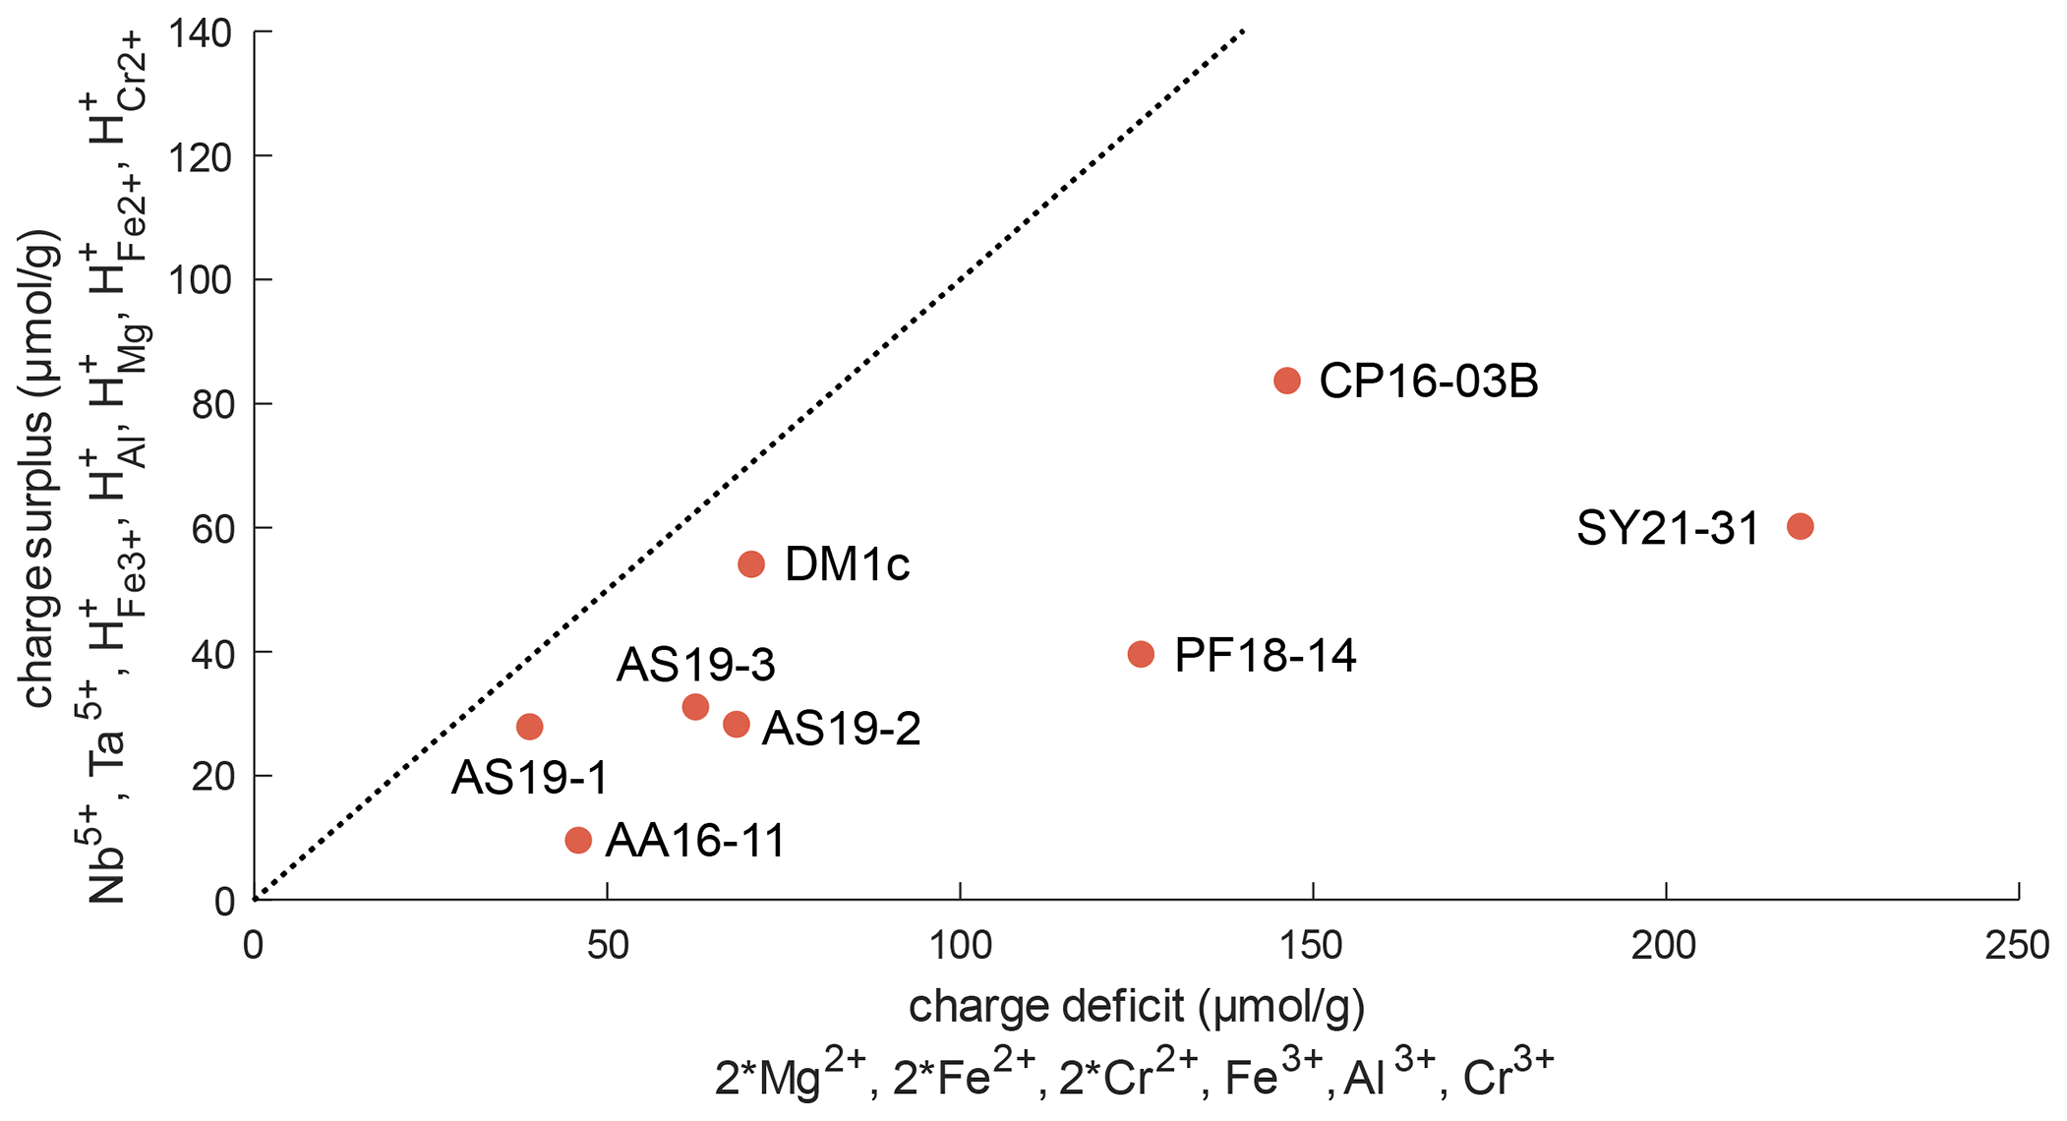
Figure 11Charge balance of di-, tri-, and pentavalent cations and trace-element-related H+, excluding Ti3+. The dotted line represents a 1 : 1 ratio between “charge deficit” and “charge surplus”. The position of all samples below this line indicates an excess of di- and trivalent cations that can be balanced by oxygen vacancies.
Figure 11 depicts the charge balance of H+ and pentavalent (Nb5+, Ta5+) cations with di- (Mg2+, Fe2+, Cr2+) and trivalent (Fe3+, Al3+, Cr3+) cations. Ti3+ was not determined independently, and therefore Ti3+ content is a minimum value, calculated from the Ti3+-related H+ content. Therefore, Ti3+ and its related H+ content is not considered in this calculation. A 1 : 1 ratio between H+ and pentavalent over di- and trivalent cations would indicate complete charge balance. As all investigated samples show an excess of di- and trivalent cations, oxygen vacancies have to be taken into account for charge balance. Previous studies have proposed that oxygen vacancies form due to the incorporation of Fe3+ and Cr3+ (Kampermann, 1996; Bromiley et al., 2004).
6.4 Considerations on trace-element valence states
The OH bands in rutile are related to specific trace elements with fixed valence states. Therefore, identification of OH bands and quantification of the related H+ content together with trace-element data offer not only a unique opportunity for considerations of trace-element coupling for charge balance, but also for identification of valence states of multivalent trace elements. As rutile can incorporate multiple trace elements that can occur in different valence states (e.g. Ti4+, Ti3+, Fe3+, Fe2+, Cr3+, Cr2+, V5+, V4+, V3+), being able to identify the valence states these trace elements have in a specific sample is novel and potentially useful.
Titanium in rutile is tetravalent; however it has been shown that upon incorporation of H+, Ti can be reduced to Ti3+ (e.g. Bromiley and Hilairet, 2005; Lucassen et al., 2013; Guo, 2017). The total Ti3+ content cannot be determined; however it is possible to give a minimum value if all Ti3+ were coupled to H+. Thus, a minimum proportion of 0.03 ‰–7.6 ‰ Ti has to be trivalent in our samples.
Iron usually is considered to be incorporated into rutile as Fe3+ (e.g. Ohlsen and Shen, 1974; Kamperman, 1996; Bromiley et al., 2004; Bromiley and Hilairet, 2005; Lucassen et al., 2013) and can be linked to OH bands. All investigated samples show these OH bands and thus contain Fe3+. In samples CP16-03B, PF18-14, and SY21-31 additional evidence of Fe2+-related OH bands was found. Thus, rutile in these samples incorporates both Fe3+ and Fe2+. Other samples do not show any evidence of containing Fe2+ measurable by the employed methods. In samples that contain both Fe2+-related H+ and Fe3+-related H+ (CP16-03B, PF18-14, SY21-31), it is assumed that Fe2+ is completely balanced by H+ and all excess Fe is considered to be Fe3+. Samples without a Fe2+-related OH band are therefore assumed to contain only Fe3+, as previous studies only report Fe3+ in rutile (e.g. Bromiley et al., 2004; Bromiley and Hilairet, 2005).
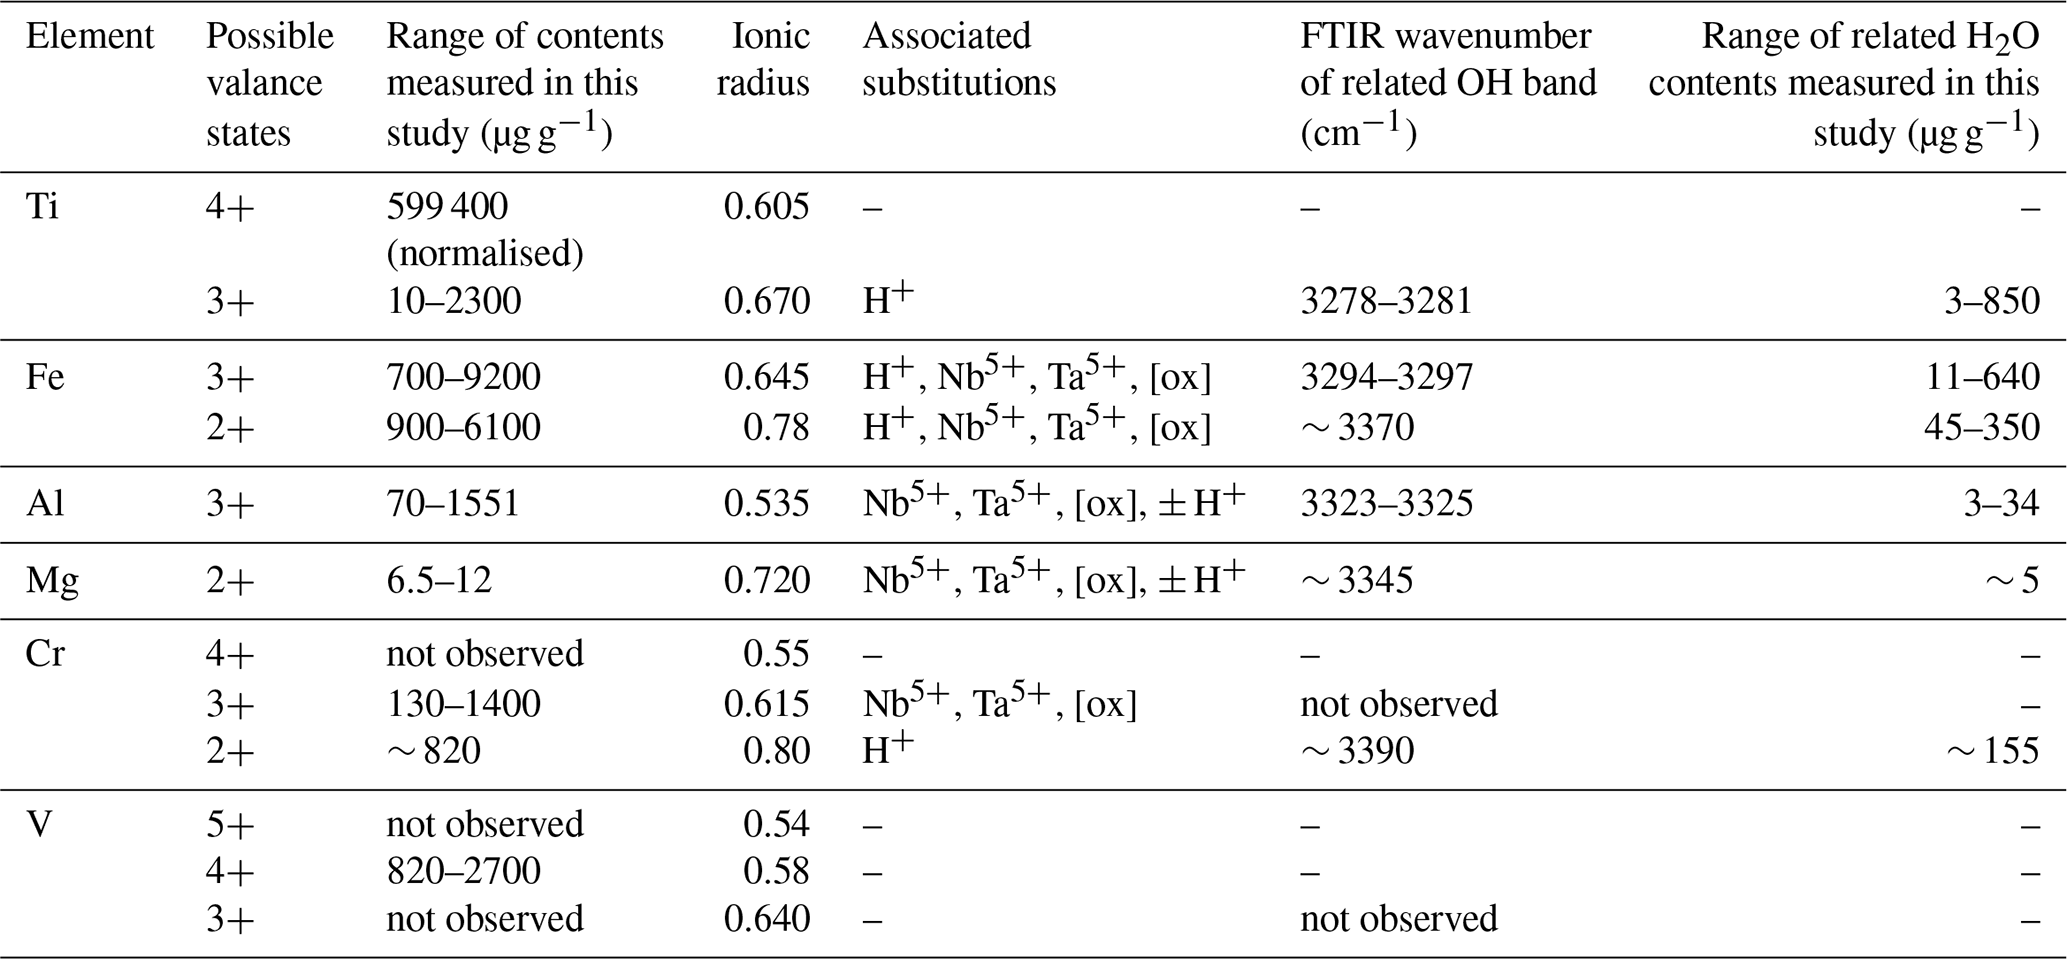
Table 6Overview of measured trace-element contents, ionic radii, valence states, related H2O contents, and FTIR OH bands. [ox]: oxygen vacancies.
Different studies on Cr-doped rutile show that rutile can incorporate Cr as Cr2+, Cr3+, and Cr4+ (Ishida et al., 1990; Kamperman, 1996; Bromiley and Hilairet, 2005; Lucassen et al., 2013). So far only Cr3+-related OH bands have been identified (Kamperman, 1996; Bromiley and Hilairet, 2005). However, Lucassen et al. (2013) report H+ in Cr2+-bearing rutile. Cr3+-related OH bands were not observed in the investigated samples, even though Cr3+ contents are significant. This is interpreted as evidence for a preferential coupling between Cr3+ and pentavalent cations or oxygen vacancies. Cr2+ however seems to be preferentially balanced by H+ over pentavalent cations, as the ratio of Cr2+-related H+ content over Cr2+ content in CP16-03B is slightly above a 1 : 1 ratio (∼ 1.1) that would indicate about half of the Cr2+ being related to H+ and a little less than half being present as Cr3+ coupled with pentavalent cations. As for Fe, different valance states of Cr might indicate different redox conditions. Under common oxidation states, Cr should occur as Cr3+ in rutile (e.g. Ishida et al., 1990; Kamperman, 1996; Bromiley and Hilairet, 2005), while Cr2+ indicates reducing conditions (e.g. Mao and Bell, 1976) and Cr4+ indicates more oxidising conditions (Ishida et al., 1990; Lucassen et al., 2013). Partitioning of other redox sensitive elements between rutile and other minerals has been shown to be redox sensitive (Holycross and Cotttrell, 2022). Thus Fe3+-, Fe2+-, and Cr2+-related H+ contents might aid in the interpretation of partitioning data of Fe and Cr between rutile and other minerals. Particularly promising as a potential proxy for oxygen fugacity is the ratio between Fe3+- and Ti3+-related OH bands.
Another redox sensitive trace element that occurs in high concentrations in rutile is V. Vanadium has been described as V3+, V4+, and V5+ in rutile (e.g. Klemme et al., 2005; Lucassen et al., 2013; Holycross and Cottrell, 2020; Holycross and Cottrell, 2022). In experimental studies, V is abundant in rutile over a variety of oxygen fugacities, with V4+ being the prevailing species at oxygen fugacities common for subduction zones (Sutton et al., 2005). For charge balance calculations it was assumed that all samples contain solely tetravalent V. If V3+ were also incorporated into reduced rutile samples, the excess of trivalent cations over H+ and pentavalent cations would increase further, resulting in a higher concentration of oxygen vacancies. Additionally, the presence of V5+ cannot be ruled out completely (Holycross and Cottrell, 2022). The presence of V5+ instead of or simultaneously with V4+ would reduce the concentration of oxygen vacancies in samples AA16-11, AS19-1, AS19-2, AS19-3, and DM1c. Sample AS19-1 has an excess of V over calculated oxygen vacancies, meaning that if no oxygen vacancies would exist in the sample, V4+ and V5+ would coexist. The other samples have an excess of oxygen vacancies over V; thus, even if all V were pentavalent, oxygen vacancies would be necessary for charge balance. However, the concentration of oxygen vacancies would be drastically reduced to ∼ 1 %–50 % of the oxygen vacancies calculated under the assumption that only V4+ occurs. Hence, V can be an important factor for charge balance in rutile, but V valence states need to be better understood. A potentially powerful tool to assess valence states of V is partitioning between rutile, clinopyroxene, and garnet (Holycross and Cottrell, 2022), as rutile preferentially incorporates oxidised V species, while garnet and clinopyroxene prefer reduced V. Such partitioning data combined with the FTIR data on Ti3+ and Fe3+ in rutile might provide new avenues to constrain oxygen fugacity in metamorphic rocks.
-
In situ polarised FTIR analyses provide a powerful tool for quantification of H2O in rutile. Calculated H2O contents are more precise and accurate than statistical approaches using orientation factors for unpolarised measurements, and they keep textural evidence and information on homogeneity that is lost during orientation of rutile grains for classical polarised FTIR analysis.
-
Deconvolution of FTIR spectra allows identification of crystal environments of H+ in rutile and calculation of trace-element-related H2O contents.
-
By combining in situ FTIR and in situ LA–ICP–MS analysis, six point defects were identified at ∼ 3280, ∼ 3295, ∼ 3324, 3345, 3370, and 3390 cm−1, related to Ti3+, Fe3+, Al3+, Mg2+, Fe2+, and Cr2+ respectively. The dominant defects are related to Ti3+ and Fe3+ (Table 6).
-
Charge balance considerations and peak positions of H+-related defects and trace elements in rutile are helpful to determine valence state of Ti, Cr, Fe, and V in rutile. Ti3+ occurs in rutile at a proportion of ∼ 0.03 ‰–7.6 ‰. Fe3+ is the main iron species. Chromium commonly occurs as Cr3+, or Cr2+ if linked with H+. Vanadium, though prevailingly incorporated as V4+, might potentially occur in two valance states (V4+ and V5+) simultaneously in the same sample (Table 6).
-
The study of H+, Ti3+, Fe, Cr, and V contents in rutile could be a promising tool to monitor redox conditions of subduction-zone fluids or metamorphic fluids when combined with data from co-existing minerals.
Table A1Complete data set of rutile trace-element compositional data, measured by LA–ICP–MS, values given in µg g−1 with 2σ errors. bdl – below detection limit.
Data are available upon contacting the corresponding author.
Samples are available upon contacting the corresponding author.
The supplement related to this article is available online at: https://doi.org/10.5194/ejm-35-243-2023-supplement.
ML and JH developed the theoretical background for rutile in situ FTIR; ML carried out the measurements. RT and ML performed LA–ICP–MS measurements and data treatment. ML prepared the manuscript with contributions from JH and RT.
The contact author has declared that none of the authors has any competing interests.
This article is part of the special issue “(Ultra)high-pressure metamorphism, from crystal to orogenic scale”. It is a result of the 14th International Eclogite Conference (IEC-14) held in Paris and Lyon, France, 10–13 July 2022.
Publisher's note: Copernicus Publications remains neutral with regard to jurisdictional claims in published maps and institutional affiliations.
We want to thank Thorsten Markmann and Daniela Rubatto for providing samples used for this study. Francesca Piccoli and Thorsten Markmann are thanked for assistance with LA–ICP–MS measurements and Julien Reynes for help with deconvolution of FTIR spectra. We thank Nils B. Gies for repeated discussions that helped improve our work. We appreciate the reviews of Monika Koch-Müller, Esther Schmädicke and an anonymous reviewer that helped to improve the manuscript. This work was financially supported by the Swiss Science Foundation (grant no. 196927).
This research has been supported by the Schweizerischer Nationalfonds zur Förderung der Wissenschaftlichen Forschung (grant no. 196927).
This paper was edited by Gaston Godard and reviewed by Monika Koch-Müller, Esther Schmädicke and an anonymous reviewer.
Andersson, P.-O., Kollberg, E. L., and Jelenski, A.: Extra EPR Spectra of Iron-Doped Rutile, Phys. Rev. B, 8, 4956–4965, https://doi.org/10.1103/PhysRevB.8.4956, 1973.
Andersson, P. O., Kollberg, E. L., and Jelenski, A.: Charge compensation in iron-doped rutile, J. Phys. C Solid State, 7, 1868–1880, https://doi.org/10.1088/0022-3719/7/10/014, 1974.
Barnicoat, A. C. and Fry, N.: High-pressure metamorphism of the Zermatt-Saas ophiolite zone, Switzerland, J. Geol. Soc. London, 143, 607–618, 1986.
Baur, W. H.: The rutile type and its derivatives, Crystallogr. Rev., 13, 65–113, https://doi.org/10.1080/08893110701433435, 2007.
Beran, A. and Zemann, J.: Messung des Ultrarot-Pleochroismus von Mineralen XI. Der Pleochroismus der OH-Streckfrequenz in Rutil, Anatas, Brookit und Cassiterit, Tscher. Miner. Petrog., 15, 71–80, 1971.
Bissig, T. and Hermann, J.: From pre-Alpine to Alpine convergence: the example of the southwestern margin of the Margna nappe (Val Malenco, N-Italy), Schweiz. Miner. Petrog., 79, 363–380, 1999.
Brenan, J. M., Shaw, H. F., Phinney, D. L., and Ryerson, F. J.: Rutile-aqueous fluid partitioning of Nb, Ta, Hf, Zr, U and Th: implications for high field strength element depletions in island-arc basalts, Earth. Planet. Sc. Lett., 128, 327–339, https://doi.org/10.1016/0012-821X(94)90154-6, 1994.
Bromiley, G. D. and Hilairet, N.: Hydrogen and Minor Element Incorporation in Synthetic Rutile, Mineral. Mag., 69, 345–358, https://doi.org/10.1180/0026461056930256, 2005.
Bromiley, G., Hilairet, N., and McCammon, C.: Solubility of hydrogen and ferric iron in rutile and TiO2 II: Implications for phase assemblages during ultrahigh-pressure metamorphism and for the stability of silica polymorphs in the lower mantle, Geophys. Res. Lett., 31, 2–6, https://doi.org/10.1029/2004GL019430, 2004.
Brouwer, F. M., Burri, T., Engi, M., and Berger, A.: Eclogite relics in the Central Alps: PT – evolution, Lu-Hf ages and implications for formation of tectonic mélange zones, Schweiz. Miner. Petrog., 85, 147–174, 2005.
Carruzzo, S., Clarke, D. B., Pelrine, K. M., and MacDonald, M. A.: Texture, composition, and origin of rutile in the South Mountain Batholith, Nova Scotia, Can. Mineral., 44, 715–729, https://doi.org/10.2113/gscanmin.44.3.715, 2006.
Černý, P., Chapman, R., Simmons, W. B., and Chackowsky, L. E.: Niobian rutile from the McGuire granitic pegmatite, Park County, Colorado: Solid solution, exsolution, and oxidation, Am. Mineral., 84, 754–776, https://doi.org/10.2138/am-1999-5-607, 1999.
Chopin, C.: Coesite and pure pyrope in high-grade blueschists of the Western Alps: a first record and some consequences, Contrib. Mineral. Petr., 86, 107–118, https://doi.org/10.1007/BF00381838, 1984.
Colasanti, C. V., Johnson, E. A., and Manning, C. E.: An experimental study of OH solubility in rutile at 500–900 ∘C, 0.5–2 GPa, and a range of oxygen fugacities, Am. Mineral., 96, 1291–1299, https://doi.org/10.2138/am.2011.3708, 2011.
Deer, W. A., Howie, R. A., and Zussman, J.: An introduction to Rock-Forming Minerals, 2nd Edn., Longman Group Ltd, Harlow, UK, 712 pp., ISBN 978-0903056-33-5, 1992.
Foley, S. F., Barth, M. G., and Jenner, G. A.: Rutile/melt partition coefficients for trace elements and an assessment of the influence of rutile on the trace element characteristics of subduction zone magmas, Geochim. Cosmochim. Ac., 64, 933–938, https://doi.org/10.1016/S0016-7037(99)00355-5, 2000.
Furche, A. and Langer, K.: Polarized electronic absorption spectra of Cr2SiO4 single crystals, Phys. Chem. Miner., 25, 393–400, https://doi.org/10.1007/s002690050129, 1998.
Gauthiez-Putallaz, L., Rubatto, D., and Hermann, J.: Dating prograde fluid pulses during subduction by in-situ U-Pb and oxygen isotope analysis, Contrib. Mineral. Petr., 171, 1–20, https://doi.org/10.1007/s00410-015-1226-4, 2016.
Graham, J. and Morris, R. C.: Tungsten- and antimony-substituted rutile, Mineral. Mag., 21, 9–12, https://doi.org/10.1180/minmag.1973.039.304.11, 1973.
Guo, H.: In-situ infrared spectra of OH in rutile up to 1000 ∘C, Phys. Chem. Miner., 44, 547–552, https://doi.org/10.1007/s00269-017-0881-6, 2017.
Hammer, V. M. F. and Beran, A.: Variations in the OH concentration of rutiles from different geological environments, Mineral. Petrol., 45, 1–9, https://doi.org/10.1007/BF01164498, 1991.
Hellstrom, J., Paton, C., Woodhead, J., and Hergt, J.: Iolite: Software for spatially resolved LA-(quad and MC) ICP-MS analysis, Mineralogical Association of Canada Short Course Series, 40, 343–348, 2008.
Hermann, J.: Experimental evidence for diamond-facies metamorphism in the Dora-Maira massif, Lithos, 70, 163–182, https://doi.org/10.1016/S0024-4937(03)00097-5, 2003.
Hill, G. J.: The effect of hydrogen on the electrical properties of rutile, J. Phys. D Appl. Phys., 1, 1151–1162, https://doi.org/10.1088/0022-3727/1/9/308, 1968.
Holycross, M. and Cottrell, E.: Partitioning of V and 19 other trace elements between rutile and silicate melt as a function of oxygen fugacity and melt composition: Implications for subduction zones, Am. Mineral., 105, 244–254, https://doi.org/10.2138/am-2020-7013, 2020.
Holycross, M. and Cottrell, E.: Experimental quantification of vanadium partitioning between eclogitic minerals (garnet, clinopyroxene, rutile) and silicate melt as a function of temperature and oxygen fugacity, Contrib. Mineral. Petr., 177, 1–23, https://doi.org/10.1007/s00410-022-01888-8, 2022.
Ishida, S., Hayashi, M., Fujimura, Y., and Fujiyoshi, K.: Spectroscopic Study of the Chemical State and Coloration of Chromium in Rutile, J. Am. Ceram. Soc., 73, 3351–3355, https://doi.org/10.1111/j.1151-2916.1990.tb06460.x, 1990.
Jochum, K. P., Weis, U., Stoll, B., Kuzmin, D., Yang, Q., Raczek, I., Jacob, D. E., Stracke, A., Birbaum, K., Frick, D. A., Günther, D., and Enzweiler, J.: Determination of reference values for NIST SRM 610-617 glasses following ISO guidelines, Geostand. Geoanal. Res., 35, 397–429, https://doi.org/10.1111/j.1751-908X.2011.00120.x, 2011.
Johnson, O. W., Ohlsen, W. D., and Kingsbury, P. I.: Defects in rutile. III. Optical and electrical properties of impurities and charge carriers, Phys. Rev., 175, 1102–1109, https://doi.org/10.1103/PhysRev.175.1102, 1968.
Johnson, O. W., Deford, J., and Shaner, J. W.: Experimental technique for the precise determination of H and D concentration in rutile (TiO2), J. Appl. Phys., 44, 3008–3012, https://doi.org/10.1063/1.1662697, 1973.
Kamperman, M.: An experimental study into the behaviour of titanium-rich and chromium-rich oxide mineral phases at high pressures and temperatures, PhD thesis, University of Tasmania, 274 pp., 1996.
Khomenko, V. M., Langer, K., Rager, H., and Fett, A.: Electronic absorption by Ti3+ ions and electron delocalization in synthetic blue rutile, Phys. Chem. Miner., 25, 338–346, https://doi.org/10.1007/s002690050124, 1998.
Klemme, S., Prowatke, S., Hametner, K., and Günther, D.: Partitioning of trace elements between rutile and silicate melts: Implications for subduction zones, Geochim. Cosmochim. Ac., 69, 2361–2371, https://doi.org/10.1016/j.gca.2004.11.015, 2005.
Koudriachova, M. V., De Leeuw, S. W., and Harrison, N. M.: First-principles study of H intercalation in rutile TiO2, Phys. Rev. B, 70, 165421, https://doi.org/10.1103/PhysRevB.70.165421, 2004.
Kovács, I., Hermann, J., O'Neill, H. S. C., Gerald, J. F., Sambridge, M., and Horváth, G.: Quantitative absorbance spectroscopy with unpolarized light: Part II. Experimental evaluation and development of a protocol for quantitative analysis of mineral IR spectra, Am. Mineral., 93, 765–778, https://doi.org/10.2138/am.2008.2656, 2008.
Laurent, V., Lanari, P., Naïr, I., Augier, R., Lahfid, A., and Jolivet, L.: Exhumation of eclogite and blueschist (Cyclades, Greece): Pressure-temperature evolution determined by thermobarometry and garnet equilibrium modelling, J. Metamorph. Geol., 36, 769–798, https://doi.org/10.1111/jmg.12309, 2018.
Lucassen, F., Koch-Müller, M., Taran, M., and Franz, G.: Coupled H and Nb, Cr, and V trace element behavior in synthetic rutile at 600 ∘C, 400 MPa and possible geological application, Am. Mineral., 98, 7–18, https://doi.org/10.2138/am.2013.4183, 2013.
Maldener, J., Rauch, F., Gavranic, M., and Beran, A.: OH absorption coefficients of rutile and cassiterite deduced from nuclear reaction analysis and FTIR spectroscopy, Mineral. Petrol., 71, 21–29, https://doi.org/10.1007/s007100170043, 2001.
Mao, H. K. and Bell, P. M.: Crystal-field effects in spinel: oxidation states of iron and chromium, Geochim. Cosmochim. Ac., 39, 865–874, https://doi.org/10.1016/B978-0-08-019954-2.50011-1, 1976
Matthews, A., Beckinsale, R. D., and Durham, J. J.: Oxygen isotope fractionation between rutile and water and geothermometry of metamorphic eclogites, Mineral. Mag., 43, 405–413, 1979.
Meinhold, G.: Rutile and its applications in earth sciences, Earth Sci. Rev., 102, 1–28, https://doi.org/10.1016/j.earscirev.2010.06.001, 2010.
Metzger, K., Hanson, G. N., and Bohlen, S. R.: High-precision U-Pb ages of metamorphic rutiles: application to the cooling history of high-grade terranes, Earth Planet. Sc. Lett., 96, 106–118, https://doi.org/10.1016/0012-821X(89)90126-X, 1989.
Nimis, P. and Trommsdorff, V.: Revised thermobarometry of Alpe Arami and other garnet peridotites from the Central Alps, J. Petrol., 42, 103–115, https://doi.org/10.1093/petrology/42.1.103, 2001.
O'Haver, T.: A Pragmatic Introduction to Signal Processing with applications in scientific measurement; an illustrated essay with free software and spreadsheet templates to download, https://terpconnect.umd.edu/~toh/spectrum/ (last access: 14 July 2018), 2015.
Ohlsen, W. D. and Shen, L. N.: Hyperfine Structure of Fe3+ Ions in Rutile (TiO2), J. Phys. Soc. Jpn., 37, 1467, https://doi.org/10.1143/JPSJ.37.1467, 1974.
Paterson, M. S.: The determination of hydroxyl by infrared adsorption in quartz, silicate glasses and similar materials, B. Mineral, 105, 20–29, https://doi.org/10.3406/bulmi.1982.7582, 1982.
Paton, C., Hellstrom, J., Paul, B., Woodhead, J., and Hergt, J.: Iolite: Freeware for the visualisation and processing of mass spectrometric data, J. Anal. Atom. Spectrom., 26, 2508–2518, https://doi.org/10.1039/c1ja10172b, 2011.
Reynes, J., Lanari, P., and Hermann, J.: A mapping approach for the investigation of Ti-OH relationships in metamorphic garnet, Contrib. Mineral. Petr., 175, 1–17, https://doi.org/10.1007/s00410-020-01681-5, 2020.
Rice, C. M., Darke, K. E., Still, J. W., and Lachowski, E. E.: Tungsten-bearing rutile from the Kori Kollo gold mine, Bolivia, Mineral. Mag., 62, 421–429, https://doi.org/10.1180/002646198547684, 1998.
Rossman, G. R. and Smyth, J. R.: Hydroxyl contents of accessory minerals in mantle eclogites and related rocks, Am. Mineral., 75, 775–780, 1990.
Sambridge, M., Gerald, J. F., Kovács, I., O'Neill, H. S. C., and Hermann, J.: Quantitative absorbance spectroscopy with unpolarized light: Part I. Physical and mathematical development, Am. Mineral., 93, 751–764, https://doi.org/10.2138/am.2008.2657, 2008.
Schmidt, M. W., Dardon, A., Chazot, G., and Vannucci, R.: The dependence of Nb and Ta rutile-melt partitioning on melt composition and fractionation during subduction processes, Earth Planet. Sc. Lett., 226, 415–432, https://doi.org/10.1016/j.epsl.2004.08.010, 2004.
Scott, K. M.: Rutile geochemistry as a guide to porphyry Cu-Au mineralization, Northparkes, New South Wales, Australia, Geochemistry Explor. Environ. Anal., 5, 247–253, https://doi.org/10.1144/1467-7873/03-055, 2005.
Shannon, R. D.: Revised effective ionic radii and systematic studies of interatomic distances in halides and chalcogenides, Acta Crystallogr. A, 32, 751–767, https://doi.org/10.1107/S0567739476001551, 1976.
Soffer, B. H.: Studies of the optical and infrared absorption spectra of rutile single crystals, J. Chem. Phys., 35, 940–945, https://doi.org/10.1063/1.1701242, 1961.
Stalder, R. and Konzett, J.: OH defects in quartz in the system quartz-albite-water and granite-water between 5 and 25 kbar, Phys. Chem. Miner., 39, 817–827, https://doi.org/10.1007/s00269-012-0537-5, 2012.
Sutton, S. R., Karner, J., Papike, J., Delaney, J. S., Shearer, C., Newville, M., Eng, P., Rivers, M., and Dyar, M. D.: Vanadium K edge XANES of synthetic and natural basaltic glasses and application to microscale oxygen barometry, Geochim. Cosmochim. Ac., 69, 2333–2348, 2005.
Swope, R. J., Smyth, J. R., and Larson, A. C.: H in rutile-type compounds: I. Single-crystal neutron and X-ray diffraction study of H in rutile, Am. Mineral., 80, 448–453, https://doi.org/10.2138/am-1995-5-604, 1995.
Tollo, R. P. and Haggerty, S. E.: Nb-Cr-Rutile in the Orapa Kimberlite, Botswana, Can. Mineral., 25, 251–264, 1987.
Tomkins, H. S., Powell, R., and Ellis, D. J.: The pressure dependence of the zirconium-in-rutile thermometer, J. Metamorph. Geol., 25, 703–713, https://doi.org/10.1111/j.1525-1314.2007.00724.x, 2007.
Urban, A. J., Hoskins, B. F., and Grey, I. E.: Characterization of V-Sb-W-bearing Rutile from the Hemlo Gold Deposit, Ontario, Can. Mineral., 30, 319–326, 1992.
Vlassopoulos, D., Rossman, G. R., and Haggerty, S. E.: Coupled substitution of H and minor elements in rutile and the implications of high OH contents in Nb- and Cr-rich rutile from the upper mantle, Am. Mineral., 78, 1181–1191, 1993.
Von Hippel, A., Kalnajs, J., and Westphal, W. B.: Protons, dipoles, and charge carriers in rutile, J. Phys. Chem. Solids, 23, 779–799, https://doi.org/10.1016/0022-3697(62)90536-x, 1962.
Warr, L. N.: IMA–CNMNC approved mineral symbols, Mineral. Mag., 85, 291–320, https://doi.org/10.1180/mgm.2021.43, 2021.
Yang, Y., Xia, Q., Feng, M., and Gu, X.: In-situ FTIR investigations at varying temperatures on hydrous components in rutile, Am. Mineral., 96, 1851–1855, https://doi.org/10.2138/am.2011.3826, 2011.
Zack, T., Kronz, A., Foley, S. F., and Rivers, T.: Trace element abundances in rutiles from eclogites and associated garnet mica schists, Chem. Geol., 184, 97–122, https://doi.org/10.1016/S0009-2541(01)00357-6, 2002.
Zack, T., Moraes, R., and Kronz, A.: Temperature dependence of Zr in rutile: Empirical calibration of a rutile thermometer, Contrib. Mineral. Petr., 148, 471–488, https://doi.org/10.1007/s00410-004-0617-8, 2004a.
Zack, T., von Eynatten, H., and Kronz, A.: Rutile geochemistry and its potential use in quantitative provenance studies, Sediment. Geol., 171, 37–58, https://doi.org/10.1016/j.sedgeo.2004.05.009, 2004b.
Zhang, J., Jin, Z., Green, H. W., and Jin, S.: Hydroxyl in continental deep subduction zone: Evidence from UHP eclogites of the Dabie mountains, Chinese Sci. Bull., 46, 592–596, https://doi.org/10.1007/BF02900418, 2001.
Zheng, Y. F., Fu, B., Gong, B., and Li, L.: Stable isotope geochemistry of ultrahigh pressure metamorphic rocks from the Dabie-Sulu orogen in China: Implications for geodynamics and fluid regime, Earth Sci. Rev., 62, 105–161, https://doi.org/10.1016/S0012-8252(02)00133-2, 2003.
- Abstract
- Introduction
- Calculation of H2O contents from FTIR analysis
- Sample descriptions
- Methods
- Results
- Discussion
- Conclusion
- Appendix A
- Data availability
- Sample availability
- Author contributions
- Competing interests
- Special issue statement
- Disclaimer
- Acknowledgements
- Financial support
- Review statement
- References
- Supplement