the Creative Commons Attribution 4.0 License.
the Creative Commons Attribution 4.0 License.
 | 09 Dec 2022
Non-destructive determination of the biotite crystal chemistry using Raman spectroscopy: how far we can go?
Stylianos Aspiotis
Jochen Schlüter
Günther J. Redhammer
Boriana Mihailova
Raman spectroscopy combined with electron microprobe analysis as well as Mössbauer spectroscopy was applied to a series of 18 samples along the phlogopite (KMg3AlSi3O10(OH)2)–annite (KFeAlSi3O10(OH)2) join to establish a truly non-destructive method for crystallochemical characterization of biotite (A1M3T4O10X2, M3 = M1M2M2). The Raman scattering arising from the framework (15–1215 cm−1) and OH-stretching phonon modes (3000–3900 cm−1) was used to build up correlation trends between the Raman spectral features and crystal chemistry of biotite. We show that (a) the contents of MMg, MFe2+, and MFe3+ contents can be quantified with a relative error of ∼ 6 %, ∼ 6 %, and ∼ 8 %, respectively, by combining the integrated intensities of the OH-stretching peaks assigned to various M1M2M2 local configurations with the wavenumber of the MO6 vibrational mode near 190 cm−1; (b) the MTi content can be estimated from the peak position and FWHM (full width at half maximum) of the second strongest TO4-ring mode at ∼ 680 cm−1, with a precision of 22 %; (c) the content of TSi can be estimated from the position of the second peak related to TO4-ring vibrations near 650 cm−1; (d) for phlogopite the TAl content can indirectly be calculated by knowing the amount of TSi, whereas for annite it is hindered by the plausible presence of TFe3+; (e) the AK content can be quantified by the position of the peak generated by T-Ob-T bond-stretching-and-bending vibration at ∼ 730 cm−1; and (f) interlayer-deficient biotites and F-rich phlogopite can be identified via their unique OH-stretching Raman peaks around 3570 cm−1 and 3695 cm−1, respectively. Our results show a potential tool for non-destructive quantitative estimations of the major (Mg, Fe, Si, Al, K) and minor (Ti) elements of the crystal chemistry of the biotite mineral group by using a non-destructive technique such as Raman spectroscopy, although its sensitivity is generally lower than that of electron microprobe analysis and therefore cannot detect trace elements. This is fundamental within the framework of cultural heritage where samples cannot be powdered or disassembled.
- Article
(7319 KB) - Full-text XML
-
Supplement
(1405 KB) - BibTeX
- EndNote


Phyllosilicates can be found in a variety of cultural-heritage objects such as clay tablets (e.g., Uchida et al., 2015), seals (Zazoff, 1983), earth pigments (e.g., Hradil et al., 2011; Corradini et al., 2021), blotting sand (e.g., Milke, 2012), archeological decoration-related ceramics (e.g., Bersani and Lottici, 2016; El Halim et al., 2018), inscribed gems (e.g., Wang et al., 2013; Bersani and Lottici, 2016; Mihailova et al., 2021, and references therein), and in general as weathering products on the surface of common rock-forming silicate minerals (e.g., Velbel, 1993). To achieve a detailed insight into the locality and provenance of such cultural-heritage objects (e.g., Bersani and Lottici, 2016; Mihailova et al., 2021), the determination of the mineral/phase composition as well as of the crystal chemistry within each single mineral constituent is necessary.
Commonly, the crystallochemical characterization of minerals is carried out through wavelength-dispersive electron microprobe analysis (WD-EMPA) and X-ray diffraction (XRD). However, such analytical methods require special sample preparation, which is highly undesirable or even prohibitive from the viewpoint of cultural heritage, due to the uniqueness of the examined sample. X-ray fluorescence (XRF) reflection is a well-known method for non-destructive chemical characterization of samples, but the final output is just the average chemical composition of the studied object expressed in oxide weight percent (wt %), without any information about the chemistry of the individual mineral phases inside the cultural-heritage object. Besides, the detection of light element-containing mineral species, for instance H-, C-, and B-bearing, is not viable by XRF. Consequently, alternative, non-invasive, preparation-free methods such as Raman spectroscopy that can solve such challenges are becoming increasingly popular among the scientific community. The biggest advantage of Raman spectroscopy over other non-destructive analytical methods is that it can distinguish between different mineral phases within the same rock. At the same time, the exact elemental distribution within each structure type can be determined, as vibrational phonon modes are sensitive to both structure and chemistry (e.g., Bendel and Schmidt, 2008; Prencipe et al., 2012; Watenphul et al., 2016b; Waeselmann et al., 2020). Furthermore, the overall roughness of the surface does not interfere with analysis, because the use of a microscope allows for focusing down to 1–2 µm.
For a truly non-destructive crystallochemical characterization of rock-based written artifacts containing phyllosilicates, we have decided to study a series of natural biotite samples by WD-EMPA and Raman spectroscopy, because this type of layered silicates can form a complete solid solution between the magnesian endmember phlogopite (KMg3AlSi3O10(OH)2) and ferrous endmember annite (KFeAlSi3O10(OH)2) and thus can serve as model phyllosilicate group with interlayer cations.
Biotite is a trioctahedral mica with the general formula AKM(Mg3−xFe)T(AlSi3)O(OH,F)2, where the A site can accommodate additional minor or trace quantities of Na+, □ (vacancy), Ca2+, and Ba2+; M refers to the octahedrally coordinated cationic site, where minor amounts of Fe3+, Al3+, Ti4+, and Mn2+ and trace amounts of Cr3+, Zn2+, Li+ and □ can be found; T refers to the tetrahedrally coordinated cationic site, which can also incorporate Fe3+ as a minor element; and X denotes the anionic site, which can be also occupied by minor or trace quantities of Cl− and O2−. Biotite crystallizes in monoclinic C2/m symmetry and its structure consists of an octahedral sheet (Os) sandwiched between two tetrahedral sheets (Ts). The Ts–Os–Ts layers are intercalated by A-site monovalent cations (see Fig. 1), resulting in the Ts–Os–Ts–A stacking sequence typical of biotites. Each tetrahedron shares three O atoms (bridging O atoms; Ob) with adjacent tetrahedra, thus forming a quasi-two-dimensional system of six-membered rings. The tetrahedral non-bridging O (Onb) is shared with three octahedrally coordinated M cations, which are distributed between two crystallographic sites, M1 and M2, and each M1M2M2 triplet is bonded to two X-site anions. Based on single-crystal XRD analysis, it has been established that M2 is the preferred site for Ti4+ and Fe3+, whilst divalent M cations as well as Al3+ are randomly partitioned on both M1 and M2 sites (e.g., Redhammer et al., 2000; Scordari et al., 2006; Lacalamita et al., 2011). Finally, A-site cations are coupled with six Ob atoms of the tetrahedral sheets.
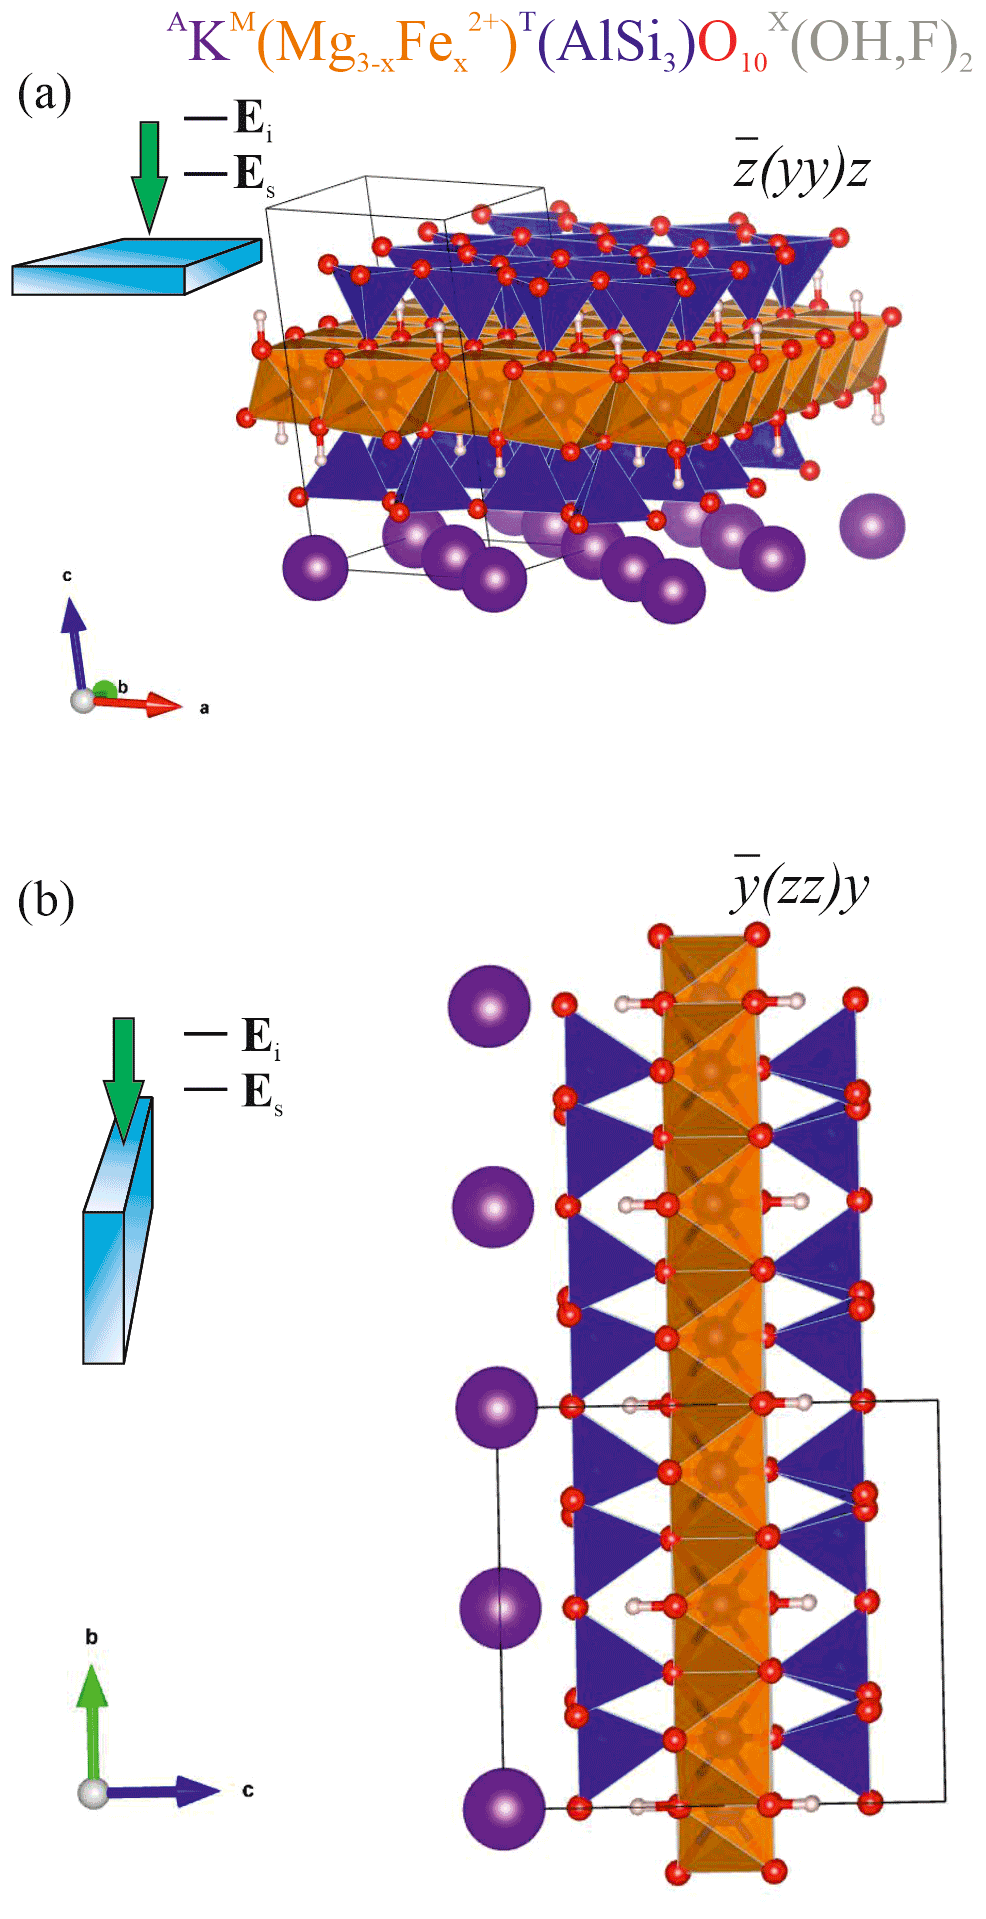
Figure 1Sketch of the scattering geometries along with fragments of the atomic structure of biotite in the corresponding orientations: (a) horizontal orientation with the cleavage plane ⊥ to the laser beam direction and to Ei and (b) vertical orientation of the biotite crystal with the cleavage plane to laser beam direction and ⊥ to Ei. TO4 tetrahedra are in blue; MO6 octahedra are in orange; A-site cations are in purple; O2− anions are in red; H+ cations are in pink-whitish. VESTA software package (Momma and Izumi, 2008) was used to plot the atomic structure.
So far, the substitutional mechanisms of biotites with various chemical compositions have been thoroughly studied by single-crystal XRD, EMPA, and Mössbauer spectroscopy (e.g., Brigatti et al., 2000; Redhammer et al., 2002; Scordari et al., 2006; Lacalamita et al., 2011; Schingaro et al., 2013). In addition, Fourier-transform infrared (FTIR) and Raman spectral features of biotites together with peak assignment of the framework vibrational modes (15–1215 cm−1) and OH-stretching modes (3550–3750 cm−1) have been reported over the last 3 decades (e.g., McKeown et al., 1999; Tutti and Lazor, 2008; Wang et al., 2015; Singha and Singh, 2016). Much attention has been given to the FTIR analysis of the OH-stretching peaks and their relation to different chemical configurations of M1M2M2 triplet sharing X(OH)−, such as MgMgMg-OH− at 3709 cm−1, MgMgFe2+-OH− at ∼ 3695 cm−1, MgMgFe3+-OH− near 3660–3670 cm−1, MgFe2+Fe2+-OH− near 3666–3670 cm−1, and Fe2+Fe2+Fe2+-OH− near 3640–3665 cm−1 (e.g., Redhammer et al., 2000; Scordari et al., 2012; Schingaro et al., 2013, and references therein). Recently, Wang et al. (2015) suggested a linear dependence of the positions of specific Raman peaks in the spectral ranges 750–780 and 3500–3800 cm−1 on the ratio, although they have neither separated TFe and MFe nor discriminated Fe2+ from Fe3+. Moreover, Tlili et al. (1989) postulated that the Raman peak of di- and trioctahedral micas at ∼ 195 cm−1 is sensitive to MAl and TAl content, since it shifts towards higher wavenumbers with increasing both tetrahedrally and octahedrally coordinated Al content; however the number of biotite samples (a total of four) used in this study was insufficient to quantify the trend along the phlogopite–annite join.
In the present paper, we report the results of comprehensive Raman spectroscopic analyses combined with EMP and Mössbauer spectroscopy on 18 biotites with various chemical compositions, covering the whole biotite solid-solution series, aiming at establishing quantitative relationships between Raman signals (peak positions, integrated intensities, and full widths at half maximum; FWHMs) and the crystallochemical composition of the biotite-group minerals. The goals were (i) to verify whether the Raman scattering arising from the framework and OH-stretching vibrations can assist in identifying biotite-group minerals through an entirely non-destructive analytical technique; (ii) to clarify the effect of grain orientation on the Raman signals; and (iii) to understand the behavior of the major as well as minor elements (for instance Ti) within each crystallographic site as a function of the Raman signals, since they are significant crystallochemical markers that can indicate locality, a critical aspect in the field of cultural heritage.
2.1 Samples
The biotite minerals studied here are from the mineral collection of the Mineralogical Museum, Universität Hamburg. Details about their provenance, chemical formulae, and names according to the IMA (International Mineralogical Association) nomenclature (Rieder et al., 1998) are given in Table 1.
Table 1Biotite chemical formulae (in apfu, atoms per formula unit) calculated from EMPA and Mössbauer spectroscopy (for the samples with an superscripted b) on the basis of 12 anions at the X site. Sample provenance and biotite names according to IMA nomenclature (Rieder et al., 1998) are provided as well.

a Cationic and anionic site occupancy is given in decreasing order of abundance.
2.2 Analytical methods
2.2.1 Wavelength-dispersive electron microprobe analysis (WD-EMPA)
EMP analyses of biotite were performed with a Cameca SX100 SEM (scanning electron microscope) system with a wavelength-dispersive detector by using the following operating conditions: 15 kV electron accelerating voltage, 20 nA beam current, and a ∼ 10 µm beam-spot size on the sample surface. The employed standards were LiF for F; albite for Na; MgO for Mg; corundum for Al; andradite for Si, Ca, and Fe; vanadinite for Cl; orthoclase for K; MnTiO3 for Ti and Mn; NiO for Ni; olivenite for Cu; Pb-containing glass for Zn; SrTiO3 for Sr; and Ba-containing glass for Ba and Cr2O3 for Cr. The acquisition times were 20 s for Mg, Al, Si, K, Ca, and Fe; 30 s for Na, Cl, and Ti; 60 s for Mn, Ni, Cu, Zn, Sr, Ba, and Cr; and 120 s for F. EMP data were acquired on 50–100 separate spots on each sample and then averaged to yield the chemical compositions and statistical standard deviations (σ) presented in Table S1 in the Supplement. The content of hydroxyl groups, as well of tetrahedrally and octahedrally coordinated Fe3+ (TFe3+ and MFe3+, respectively), was calculated using the charge-balance approach of Li et al. (2020), who developed a machine learning method based on principal component regression (PCR). This method was built up on a dataset of more than 150 well-characterized biotite reference samples whose crystallochemical data have previously been refined. Biotite samples have randomly been categorized into two groups, namely the training and the test set, where the latter one has been used to testify the performance of the model and to establish a linear regression coefficient matrix. Based on the derived matrix, the atomic proportions of elements, including TFe3+, MFe2+, MFe3+, XOH, and XO2−, can be precisely calculated with R2>0.95 for the major elements. We have assumed that the analyzed biotite samples are lithium-free, which did not affect the quality of the calculated chemical formulae, as pointed out by Li et al. (2020). Elements whose standard deviation was greater than the average content were not included in the calculated chemical formulae. Moreover, biotite formulae were calculated by assuming that the valence state of Ti is 4+, after Scordari et al. (2013).
2.2.2 Mössbauer spectroscopy
Selected biotite samples were further subjected to 57Fe Mössbauer spectroscopy to verify the fraction of Fe3+ cations and their distribution over the T and M sites, using the setup available at the Universität Salzburg, Austria. Data were acquired at room temperature using an apparatus in a horizontal arrangement (57Fe Co / Rh single-line thin source, constant acceleration mode with symmetric triangular velocity shape, multi-channel analyzer with 1024 channels, and regular velocity calibration against metallic Fe). Absorbers were prepared with a nominal density of about 5 mg Fe cm−2 with the mica sample being filled into Cu rings, with an inner diameter of 10 mm and depth of 2 mm and fixed with epoxy resin. The spectra were recorded with the absorber being oriented at the so-called magic angle (54∘) to the source to avoid texture effects. Data evaluation was done with the RECOIL program suite, using the Voigt-based hyperfine distribution approach; for details on data evaluation, see Redhammer et al. (2005).
2.2.3 Raman spectroscopy
Raman spectra were collected with a Horiba Jobin Yvon T64000 triple-monochromator system coupled with a Symphony LN2-cooled CCD (charge-coupled device) detector and an Olympus BH41 confocal microscope with a 50× long working distance objective. The green line (λ=514.532 nm) of a Coherent Innova 90C FreD Ar+ laser was used to excite the Raman scattering. The spectral resolution achieved with the green laser was ∼ 2 cm−1, while the instrumental peak position accuracy was ∼ 0.35 cm−1. The Raman spectrometer was calibrated using the 520.5 cm−1 line of a silicon standard wafer. The laser-spot diameter on the sample surface was ∼ 2 µm, while the laser power on the sample surface was 7.9 mW. The spectra were collected in the spectral ranges 15–1215 and 3000–3900 cm−1, with exposure times varying between 20 and 60 s and averaging 10 to 30 repeated acquisitions to improve the signal-to-noise ratio. The measured Raman spectra were baseline-corrected with a polynomial function, temperature-reduced to account for the Bose–Einstein distribution of phonons, and fitted with pseudo-Voigt peak-shape functions PV = (L and G stand for Lorentz and Gauss peak-shape functions, respectively, while μ is a variable weight coefficient) to define the peak positions ω, FWHMs, and integrated intensities I. The usage of the OriginPro 2019 software package facilitated the Raman data evaluation.
In general, Raman peak intensities depend on the crystal orientation as well as on the mutual orientation of the polarization of the incident (Ei) and scattered light (Es). Considering that in trioctahedral micas such as biotites the OH groups are perpendicular to the cleavage plane (Libowitzky and Beran, 2004), i.e., the crystallographic (001) plane, parallel-polarized () and cross-polarized (Ei⊥Es) Raman spectra were collected in backscattered geometry from two different orientations of the biotite crystals, with Ei parallel (Fig. 1a) and perpendicular to the cleavage plane (Fig. 1b). This results in four scattering geometries (given in Porto's notation): horizontal parallel-polarized , horizontal cross-polarized , vertical parallel-polarized , and vertical cross-polarized geometries, with z perpendicular to the (001) plane and .
3.1 Chemical composition from wavelength-dispersive EMPA and Mössbauer spectroscopy
The chemical composition in oxide weight percent of the studied biotites are reported in Table S1. The relatively low standard deviations reveal an overall homogenous distribution of major and minor elements among each studied biotite; i.e., the crystals are not chemically zoned. The EMPA results were initially checked for too low or too high oxide totals in weight percent, which should typically vary between 93.5 wt % and 98.5 wt %, as the H2O content varies between 1.5 wt %–4.5 wt % (e.g., Brigatti et al., 2000, 2001; Righter et al., 2002; Laurora et al., 2007; Scordari et al., 2012; Brigatti et al., 2015). Sample B3, seemingly a tetra-ferri-containing (OH)-rich fluorophlogopite, has oxide totalscalc of 85.7(2.4) wt %, indicating surface defects/roughness, which in turn compromises the correct composition determined via EMPA. Therefore, the dataset of sample B3 was not taken into consideration while constructing calibration curves. On the other hand, high total oxides equal to 100 wt % can be explained by high F content such as in fluorophlogopite (e.g., Gianfagna et al., 2007; Scordari et al., 2013; Lacalamita et al., 2020). The fraction of trivalent iron and its distribution over the M and T sites for samples B4, B13, B14, B17, B19, and B21 was derived from the Mössbauer spectra (see Table S2 and Fig. S1 in the Supplement).
Following the procedures of the Excel spreadsheet by Li et al. (2020), the biotite chemical formulae were calculated in atoms per formula unit (apfu) (Table 1). As can be seen, the compositions of the studied biotites expand over the whole biotite solid-solution series with samples B1 (sodian F-rich phlogopite) and B21 (tetra-ferri- and Ti-containing fluorannite) having the highest and lowest MMg content, respectively.
Mineral names are given following the analytical procedures described by Rieder et al. (1998) and provided in Table 1. Sample B18 was named magnesian interlayer-deficient annite rather than interlayer-deficient mica, as the cation partitioning at the M site resembles that of a typical magnesium-rich annite (e.g., Brigatti et al., 2015), while the K content lies between 0.6 and 0.85 apfu.
3.2 Raman-scattering analysis
3.2.1 Effect of tetrahedral-octahedral layer stacking sequence in phyllosilicates
Various phyllosilicate mineral groups in a rock sample or a cultural-heritage object can straightforwardly be distinguished, based on their Raman spectra (Fig. 2). Indeed, compositional variations, the stacking sequence of the tetrahedral and octahedral sheets, and the presence or absence of interlayer species affect significantly the Raman spectra. The major differences in the Raman spectra of the main layered silicates (Fig. 2) are in the ranges 100–500 cm−1, dominated by MO6 vibrations; around 600–800 cm−1, generated by TO4-ring modes (i.e., T-Ob-T modes); and 3500–3800 cm−1, generated by OH-stretching vibrational modes (Tlili et al., 1989; McKeown et al., 1999; Lacalamita et al., 2020) and can be used to fingerprint the phyllosilicate mineral group. Particularly, the OH-stretching region is characterized by multiple Raman peaks in the case of 1 : 1 layer silicates (antigorite, (Mg,Fe)3Si2O5(OH)4; dickite, Al2Si2O5(OH)4), whereas in 2 : 1 layer silicates with empty interlayer space (talc and pyrophyllite; Mg3Si4O10(OH)2 and Al2Si4O10(OH)2, respectively), there is only one sharp peak. If the interlayer space is filled by monovalent cations, as in the case of muscovite, biotite, or illite (K0.65(Al,Mg,Fe)2(Si,Al)4O10(OH)2), or by H2O molecules along with mono-/divalent cations, as in the case vermiculite ((Mg,Fe3+,Al3+)3(Al,Si)4O10(OH)2 • 4H2O), the OH stretching produces broad Raman peaks.

Figure 2Raman spectra (in counts per second, cps) of various phyllosilicates. The spectra are vertically offset for clarity.
3.2.2 Group-theory considerations
According to group-theory analysis, the most common C2/m polytype of biotite shows a total of 63 optical phonon modes at the Γ point (Kroumova et al., 2003). Among them, 33 are IR active and 30 Raman active (see Table 2). The Raman-active modes of biotite are of Ag and Bg symmetries, and they have the following Raman tensor components:
Consequently, the parallel-polarized Raman spectra of oriented crystals will be generated only from the Ag modes, whereas depending on the orientation, both Ag and Bg modes can contribute to the cross-polarized spectra. In our case, the vertical parallel-polarized Raman spectra are determined from the zz component of the polarizability tensor α of the Ag mode, Ag(azz), while the vertical cross-polarized spectra are dominated by the Ag(axz). Accordingly, the horizontal parallel-polarized spectra are characterized by the Ag(ayy) component, whilst the horizontal cross-polarized spectra are characterized by the Bg(axy) component. Given that the orientation of the binary b axis with respect to the laboratory coordinate axes (x,y) is usually unknown, Ag(axx) and Bg(azy) may also contribute to the horizontal parallel-polarized and vertical cross-polarized spectra, respectively.
Table 2Group-theory analysis for the monoclinic C2/m space group of biotite.

Table 2 reveals that H atoms occupy the 4i Wyckoff position and generate 2Ag+Bg Raman-active modes. Considerations of the directions of the atomic vector displacements via the Bilbao Crystallographic Server (Kroumova et al., 2003) reveal that one Ag mode corresponds to the OH-stretching vibration perpendicular to the (001) plane, while one Ag and the Bg mode are related to the OH-librational modes, with H+ motions within the (a, b) plane and causing a change in the M–O–H bond angle. Therefore, the presence of more than one Raman peaks in the OH-stretching region implies a chemical deviation from the endmember composition, due to different types of octahedrally coordinated cations bonded to OH groups. Such behavior has already been observed in other hydrous minerals like amphiboles and tourmalines (Leissner et al., 2015; Watenphul et al., 2016a; Hawthorne, 2016).
3.2.3 Effect of crystal orientation
As the structure of biotite-group minerals is strongly anisotropic, it is obvious that the Raman scattering can chiefly depend on the crystal orientation with regard to the polarization of the incident and scattered light. However, since C2/m is a nonpolar crystal class, the orientation of the biotite crystals will influence the relative intensities but not the Raman peak positions. Biotite grains, which are exposed on the sample surface and can be non-destructively probed by Raman spectroscopy, can be randomly oriented. Since the relative intensities of the Raman peaks depend on the crystal orientation with respect to the polarization of the incident and scattered light, Raman spectra collected from biotite grains within the same rock/cultural-heritage specimen may appear inconsistent at a first glance. Moreover, some of the Raman peaks may be suppressed in specific experimental geometry. Therefore, to clarify the effect of the grain orientation on the Raman spectra and identify Raman signals that can be resolved independently of the grain orientation, we have systematically measured representative biotite single crystals in different scattering geometries. Figure 3 presents the Raman spectra of a phlogopite measured in the four different scattering geometries specified above. It is apparent that parallel-polarized spectra are much stronger than the cross-polarized ones, and hence the latter do not provide any additional information that is not included in the former. Therefore, Ag modes should dominate the spectra regardless of the crystal orientation. For the framework vibrations the spectrum differs considerably from the , in accordance with the group-theory prediction (azz≠ayy). At the same time, although axx and ayy are allowed to be different by symmetry constraints, in a horizontal orientation Raman spectra remained practically the same upon rotation of the biotite samples around the laser beam direction, indicating that the axx and ayy Raman tensor components are almost equal. The OH-stretching modes contribute only to the parallel-polarized spectra, generating a multi-component Raman band. The overall OH-stretching Raman scattering is stronger in than in , but the relative intensities of band components are the same in both scattering geometries. Thus, regardless of selected orientation and induced photoluminescence, the strongest Raman peaks of biotite samples can be identified at wavenumbers close to 190, 650, 680, 730, 780, and 1020 cm−1 and between 3500–3800 cm−1 and used for crystallochemical analysis.
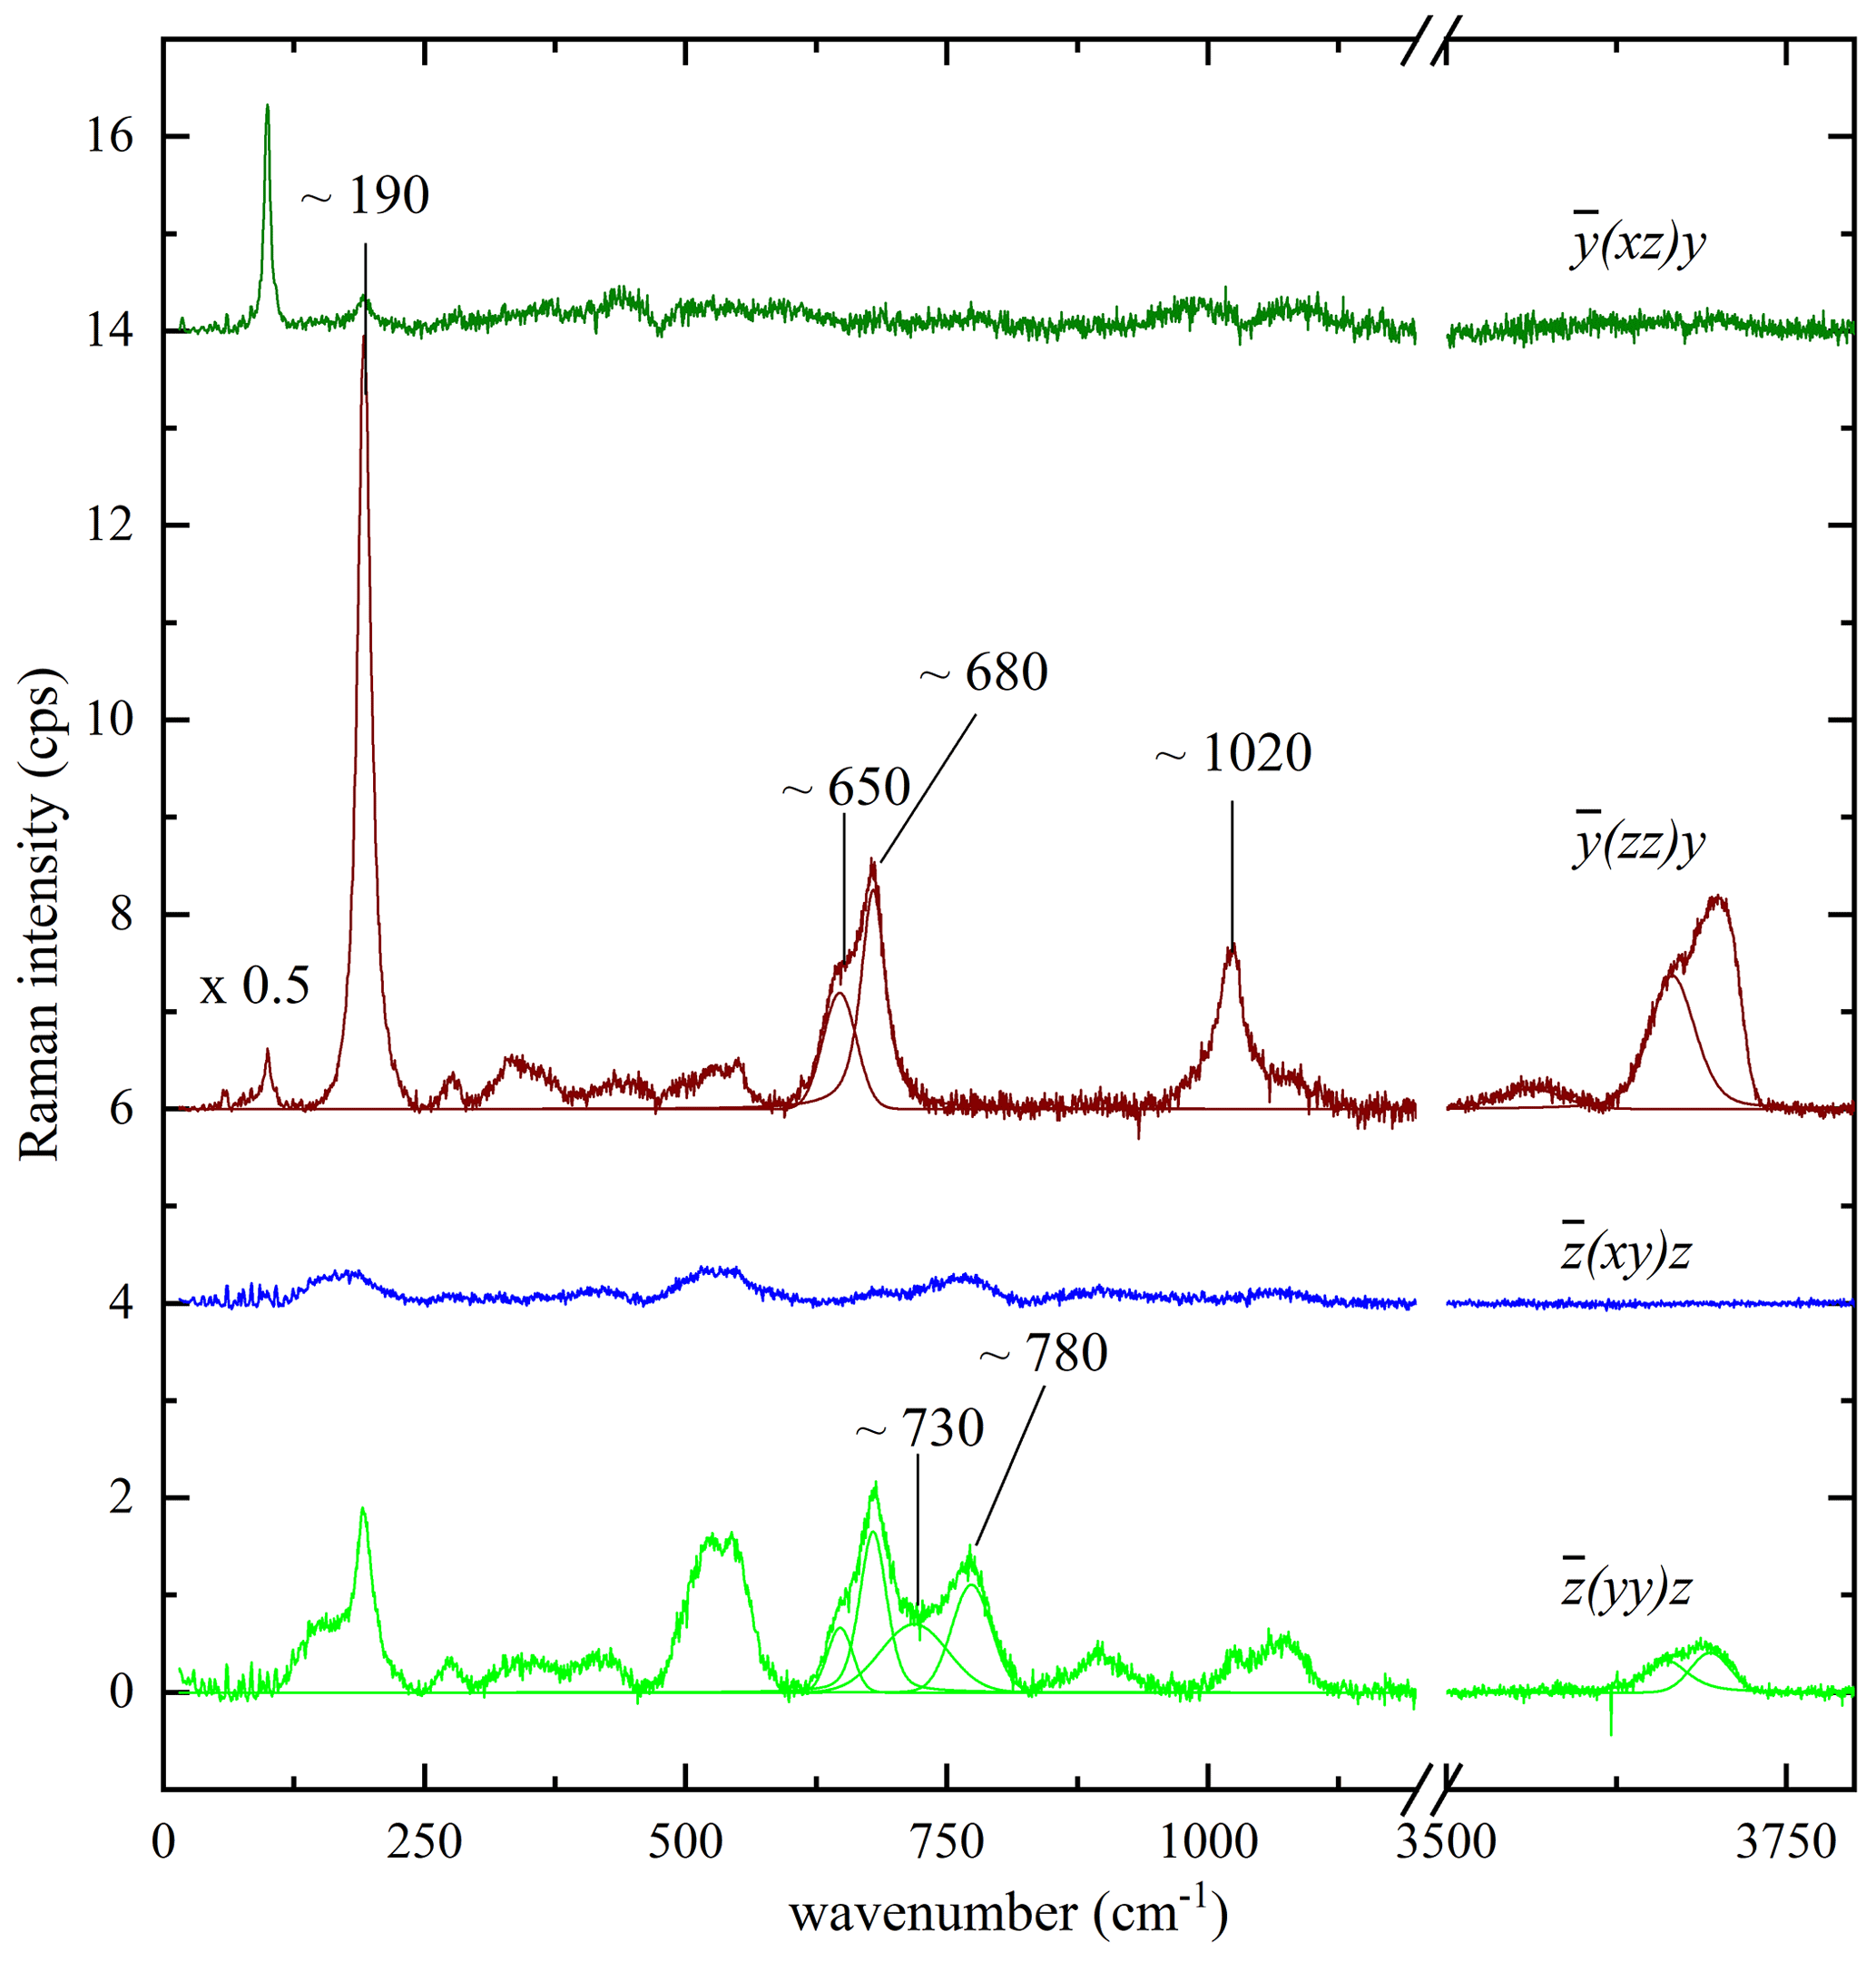
Figure 3Raman spectra of phlogopite measured in four different scattering geometries, as described in the text. The spectra are vertically offset for clarity.
3.2.4 Raman peak assignment and effect of chemistry
Figure 4 shows the characteristic Raman spectra of selected biotite samples with different Mg contents at the M site. One can divide the Raman scattering into four spectral ranges according to the dominant atomic displacements: range I (15–600 cm−1), dominated by octahedral vibrations; range II (600–800 cm−1), dominated by TO4-ring modes comprising vibrations of T–Ob–T linkages; range III (800–1215 cm−1), generated by TO4-stretching modes; and range IV (3500–3800 cm−1), arising from OH-stretching modes.
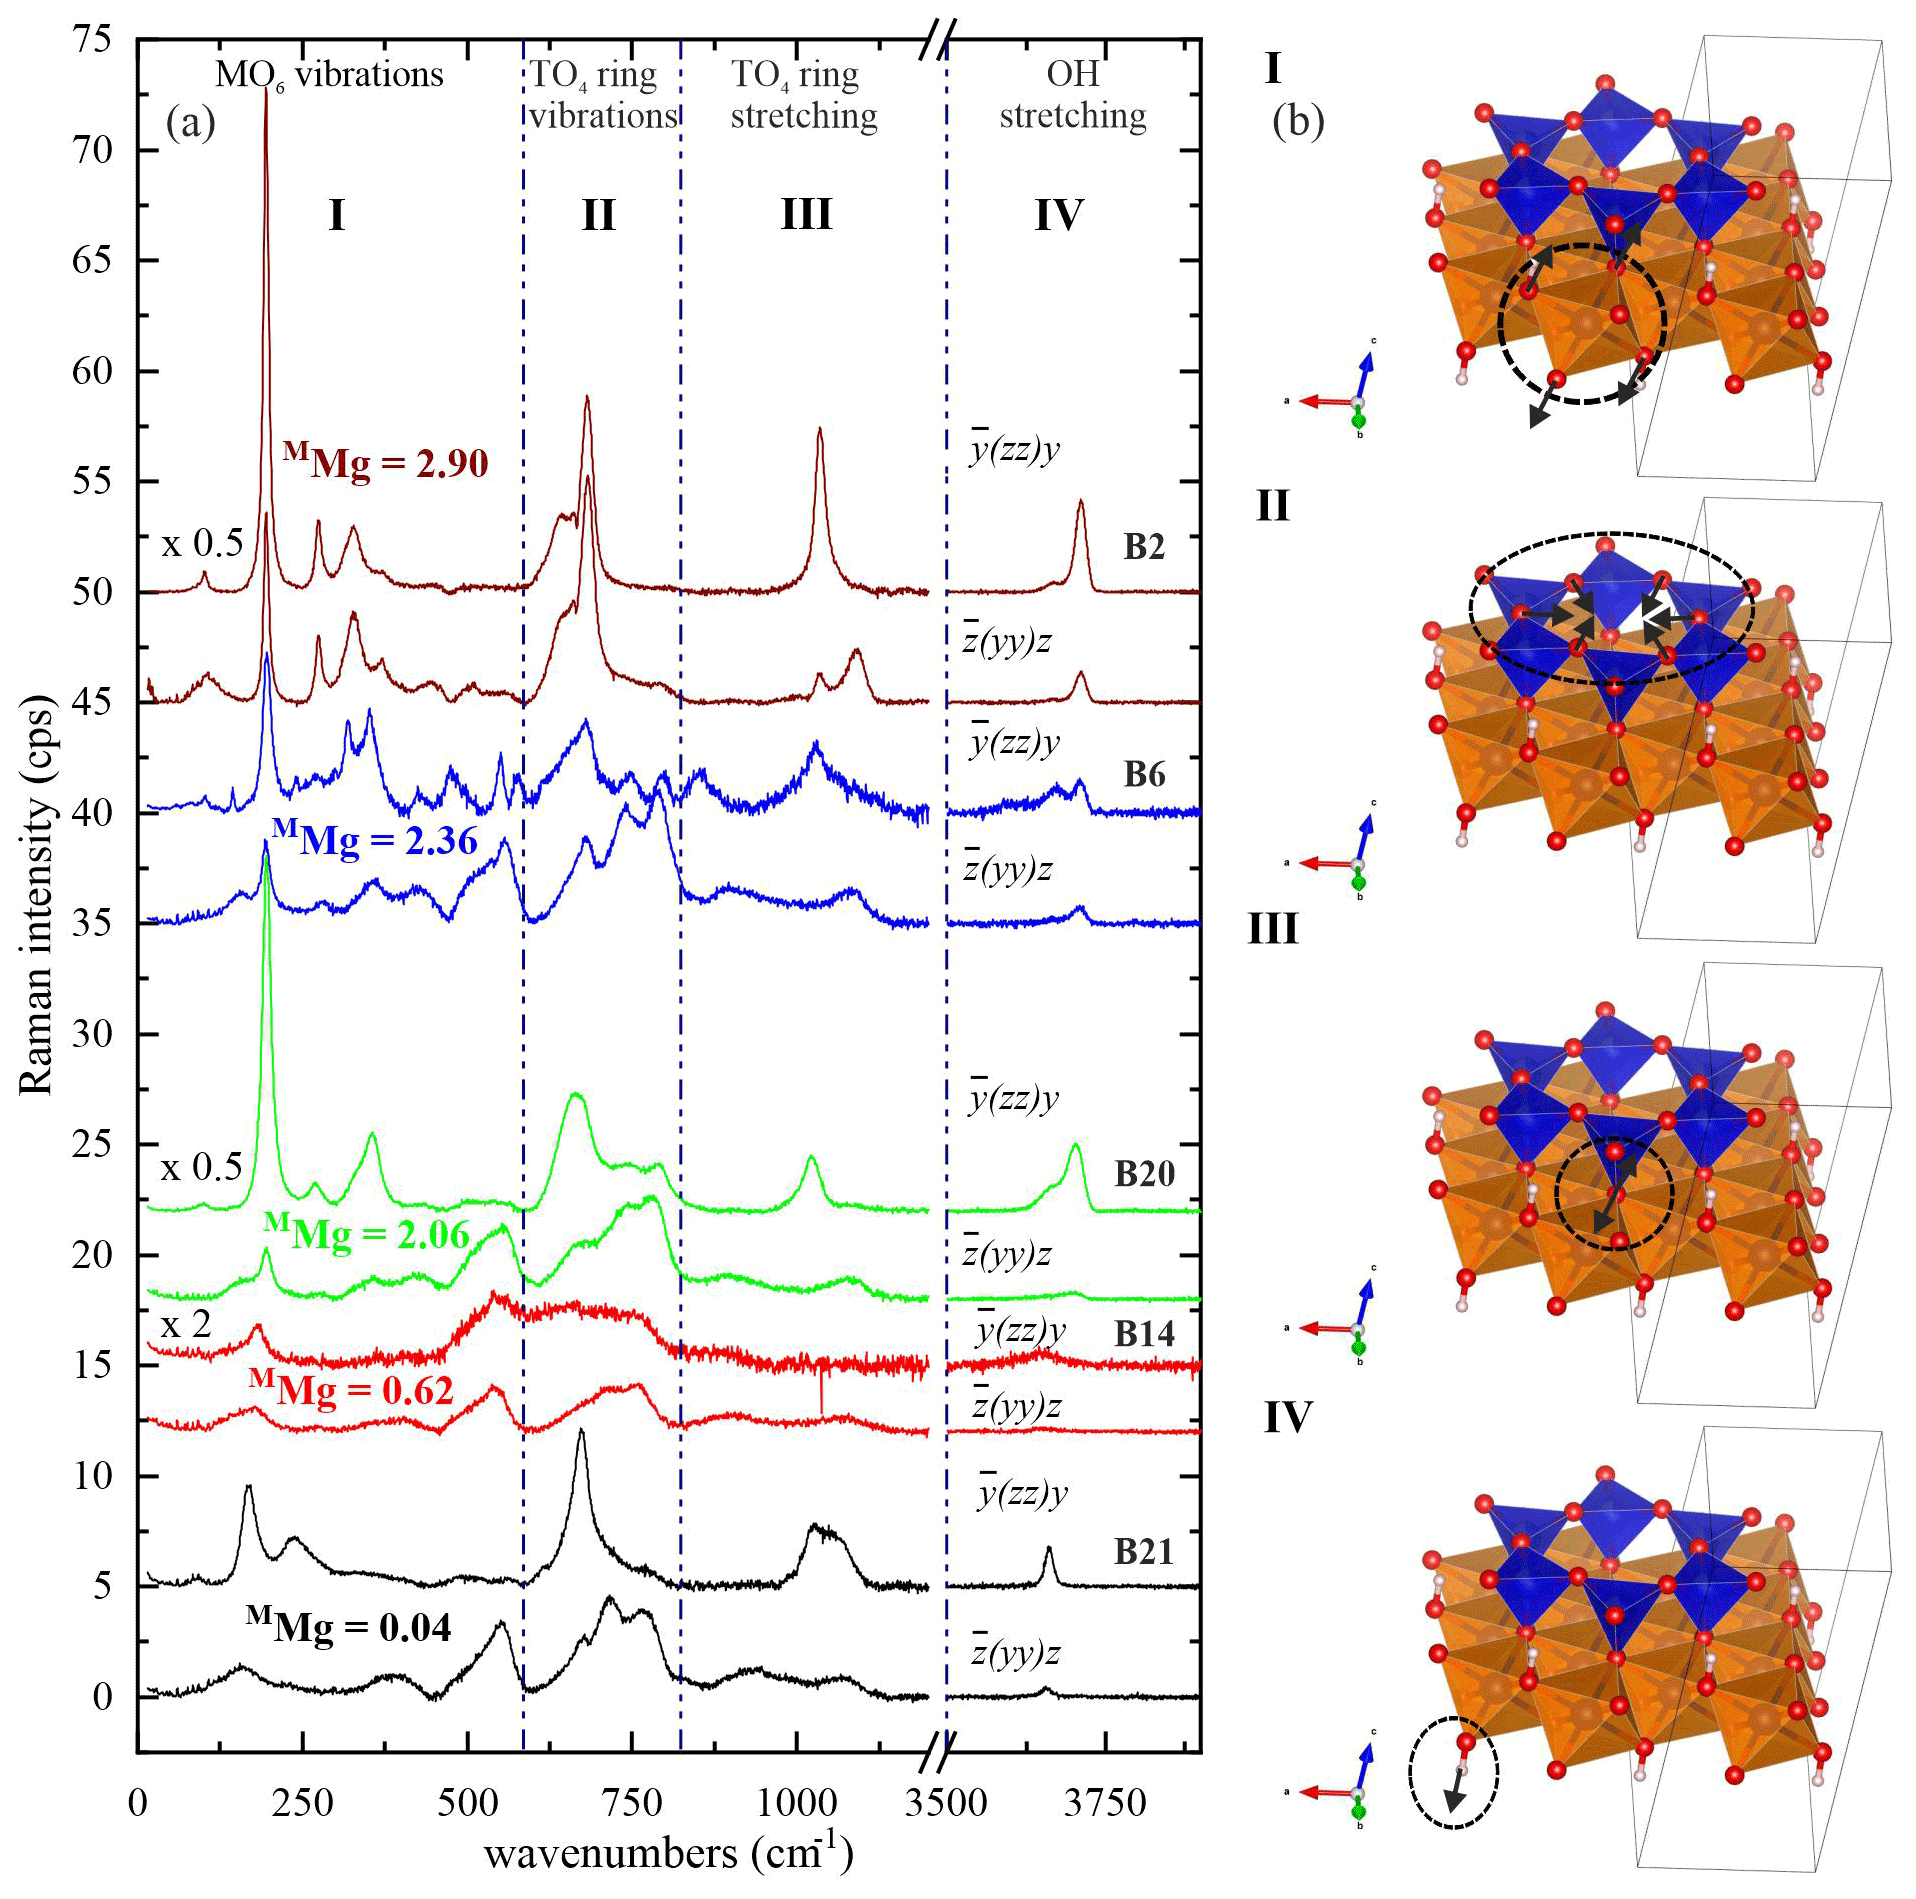
Figure 4(a) Raman spectra of selected biotite samples with increasing octahedrally coordinated Mg content in atoms per formula unit from bottom to top. Spectra with the same color refer to the same sample and were measured in horizontal and vertical parallel-polarized geometries. The spectra are vertically offset for clarity. (b) Sketches illustrate the type of dominating atomic displacements within each spectral range (I–IV). VESTA software package (Momma and Izumi, 2008) was used to plot the atomic structures.
The strongest Raman feature of spectral range I in both parallel-polarized spectra (Fig. 4) occurs near 190 cm−1 for phlogopite, and it shifts considerably towards lower wavenumbers for annite with MMg < 0.70 apfu (Figs. 5a and 6a). As in general (K is the force constant and μ is the reduced mass of atoms participating in the mode) and mFe>mMg while K(Fe2+-O) > K(Mg-O), this trend indicates one-mode behavior of the mode near 190 cm−1, due to the change in mass of the M cations (Chang and Mitra, 1971). In this case, only one peak can be observed corresponding to the mixed (Mg3−xFex) concentration at the M site and whose ω lineally depends on the concentration x. Our experimental observations are in accordance with previous studies indicating that MO6 vibrations contribute considerably to the Raman scattering below 600 cm−1 (Loh, 1973; Tlili et al., 1989; McKeown et al., 1999; Tutti and Lazor, 2008). Moreover, the strong Raman scattering near 150 cm−1 observed in monoclinic amphiboles shows the same trend of ω vs. MMg content (Waeselmann et al., 2020), implying that this is a general feature of complex silicates containing strips of linked tetrahedral and octahedral sheets. Biotites are also similar to amphiboles (Waeselmann et al., 2020) by the appearance of additional Raman scattering between 500–550 cm−1 when MFe3+ is present (see spectra in Fig. 4 and Table 1).
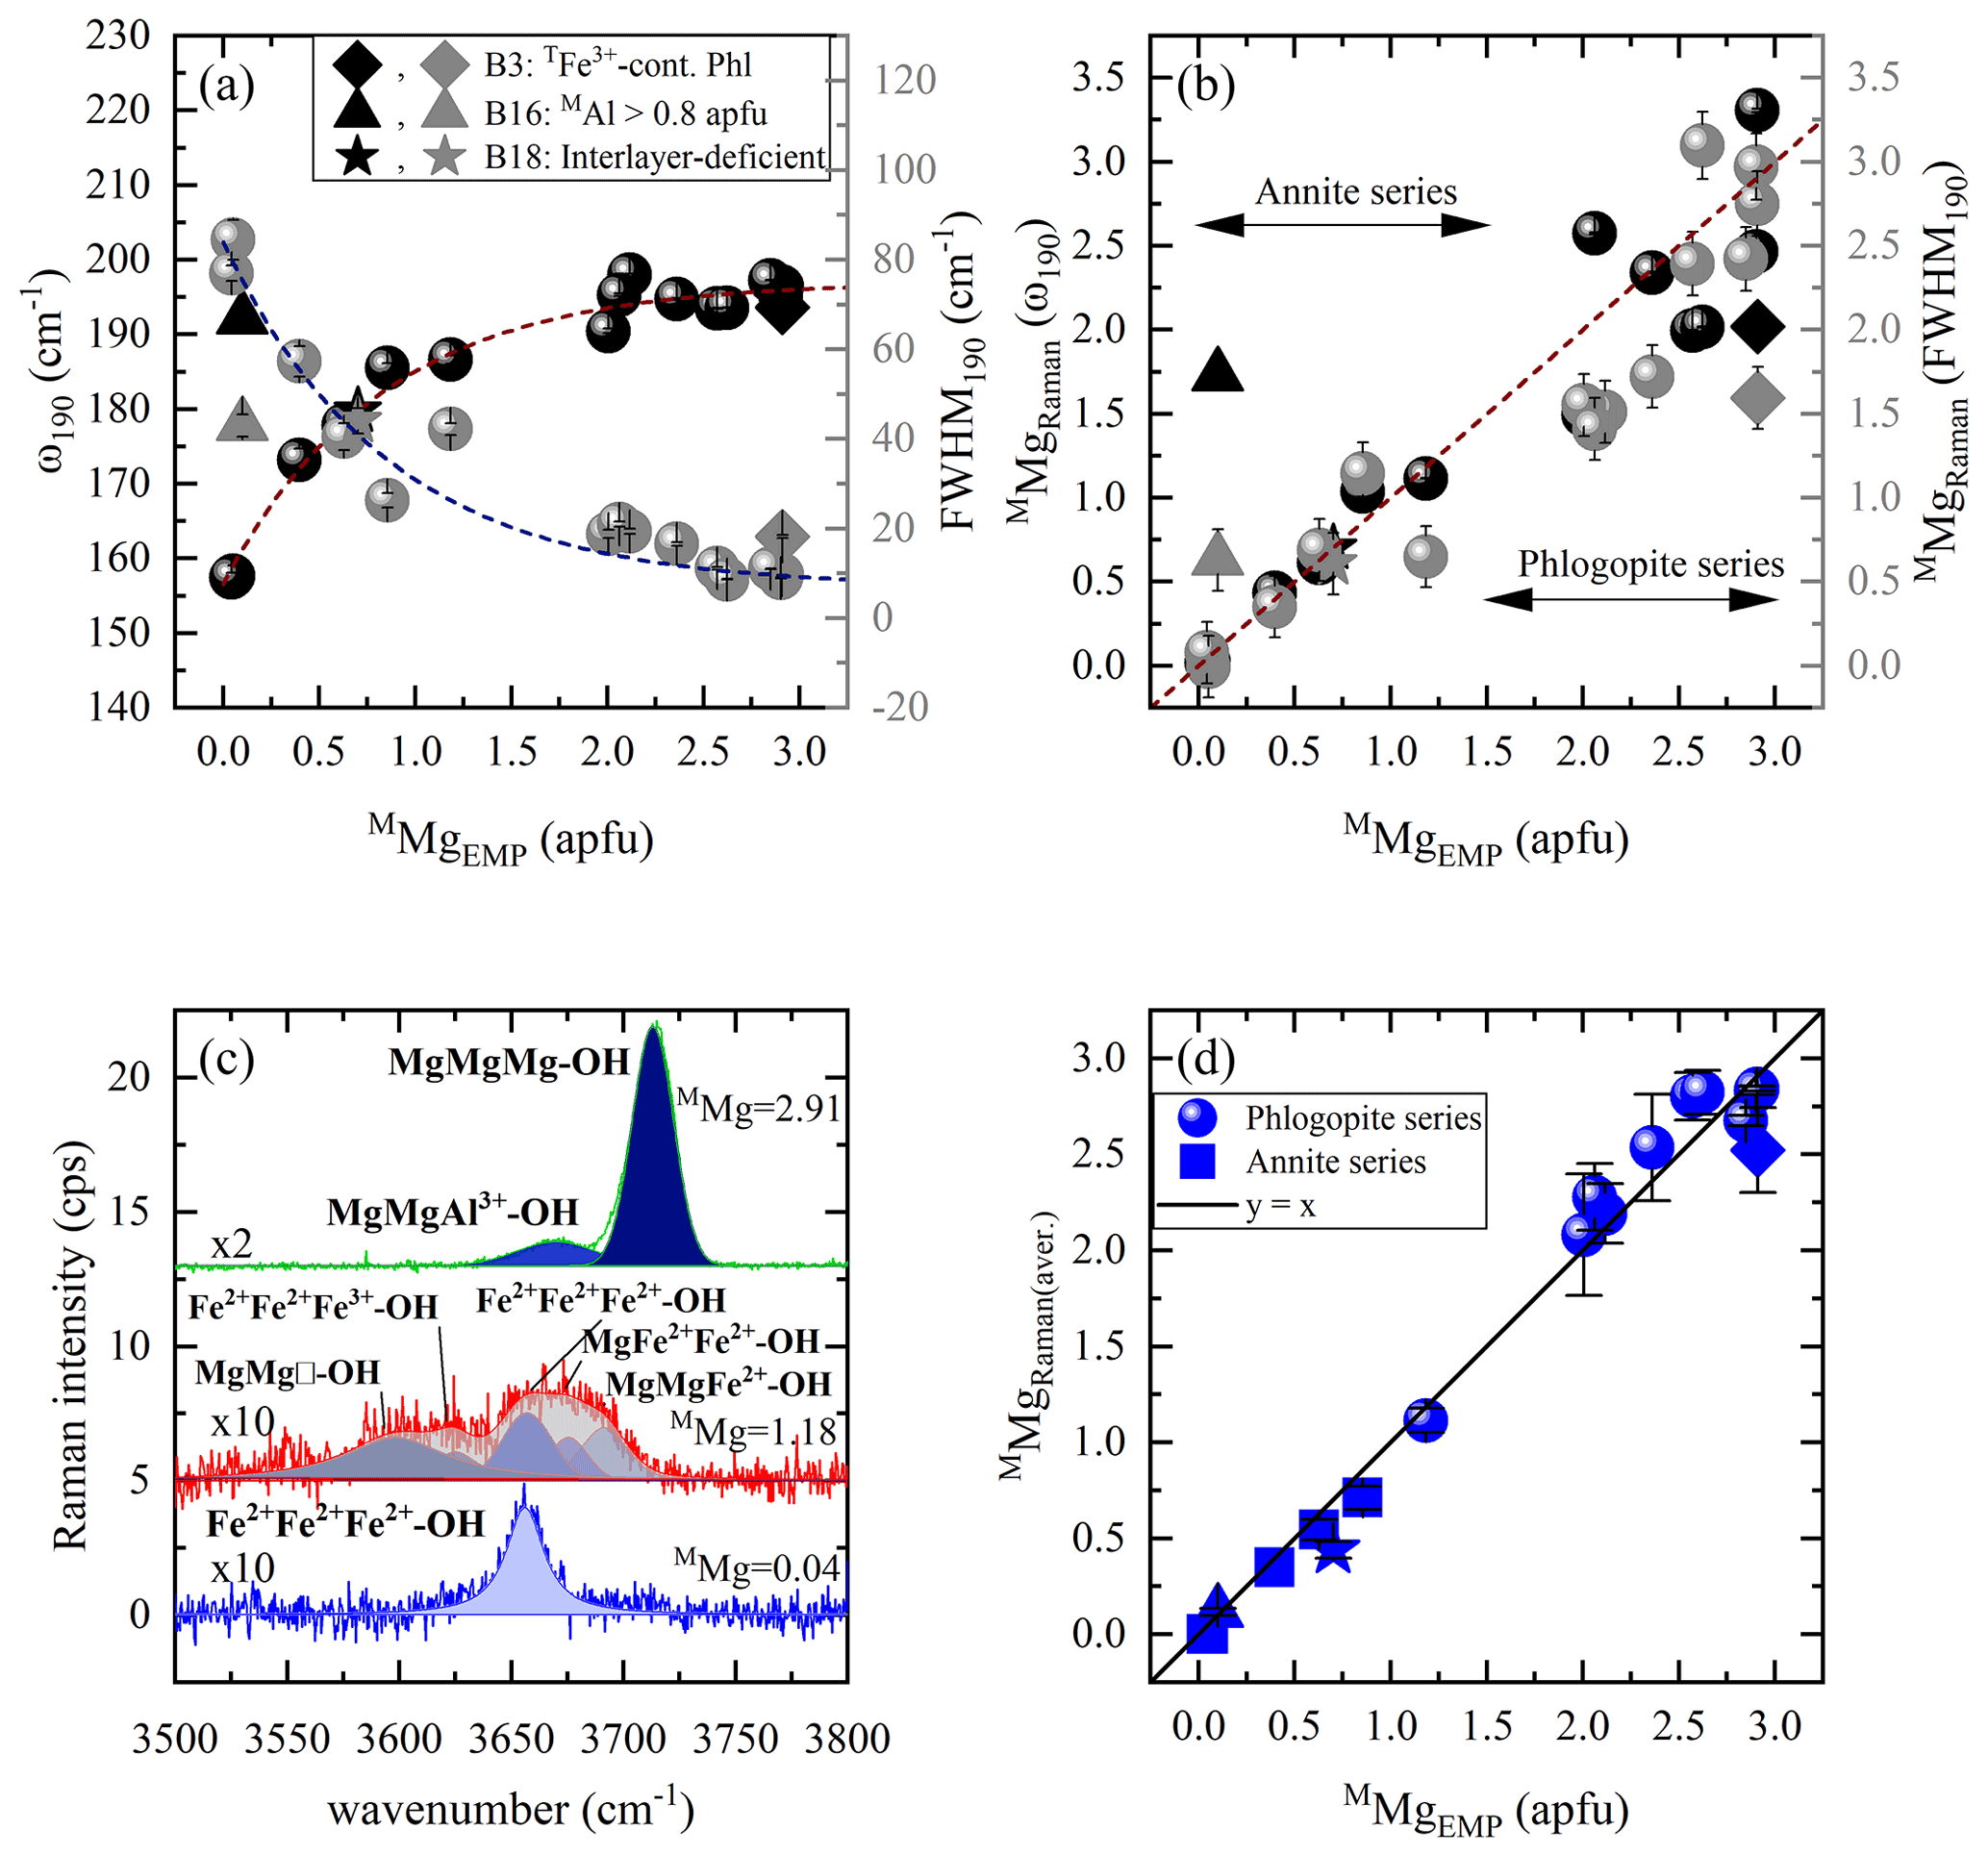
Figure 5Estimation of MMg content according to MO6 vibrations and OH-stretching peaks: (a) Raman peak position at ∼ 190 cm−1 vs. MMg (black symbols) and FWHM190 vs. MMg (gray symbols), (b) MMg content derived from the Raman spectroscopic analysis (MMgRaman) of ω190 (black symbols) and FWHM190 (gray symbols) vs. that calculated from EMPA (MMgEMP), and (c) OH-stretching vibrations of three representative biotites (Mg-richest, sample B1; Mg-poorest, sample B21; with an intermediate composition, sample B12) are presented in horizontal parallel-polarized spectra. (d) MMgEMP vs. MMgRaman of the OH-stretching region of both parallel-polarized geometries. Deviating points in panels (a), (b), and (d): rhombus for a TFe3+-containing OH-rich phlogopite (Phl), triangle for an aluminian F-rich annite with MAl > 0.8 apfu, and star for a magnesian interlayer-deficient annite.

Figure 6Estimation of MFe2+ and M(Fe2+ + Fe3+) contents according to MO6 vibrations and OH-stretching peaks: (a) MFe2+ amount vs. Raman peak position at 190 cm−1 (black symbols) and M(Fe2+ + Fe3+) content vs. ω190 (gray symbols), (b) MFe2+ from the Raman spectroscopic analysis (MFe) of the OH-stretching vibrations vs. that calculated from EMPA (MFe), and (c) M(Fe2+ + Fe3+) from the Raman spectroscopic analysis (M(Fe2+ + Fe)) of the OH-stretching region vs. that calculated from EMPA (M(Fe2+ + Fe)). (d) Non-(Mg,Fe) cationic content at the M site of the samples deviating from the one-to-one correlation lines of Fig. 6b and c, where the non-(Mg,Fe) amount from the Raman spectroscopic analysis (non-(Mg,Fe)Raman) was plotted vs. that calculated from EMPA (non-(Mg,Fe)EMP). Deviating data points mentioned in the legend are same as in Fig. 5.
The spectral profile of range II changes in a rather complex way from one sample to another (Figs. 4 and S2) and can be fitted with up to four components, near 650, 680, 730, and 780 cm−1. The Raman-active phonon modes near 650 and 680 cm−1 produce strong peaks in both and geometries, but only the wavenumber of the former mode turned to be exclusively sensitive to T-site occupancy (see Fig. 7a). In fact, this is in accordance with the peak assignment by Tlili et al. (1989) and Lacalamita et al. (2020), attributing the peaks near 650 and 680 cm−1 to Si–Ob–Al and Si–Ob–Si bond vibrations, respectively. Our analysis revealed that both ω680 and FWHM680 are sensitive to MTi content (see Fig. 7c and e). Given that Ti occupies predominantly the M2 site, this result is in agreement with previous studies suggesting that the chemistry of the M2 site can affect the T–Ob–T vibrations (e.g., McKeown et al., 1999; Wang et al., 2015; Lacalamita et al., 2020). In addition, the Raman signal near 730 cm−1, well-resolved in and spectra (see Figs. 3 and 4), tends to shift to higher wavenumbers in the presence of A-site vacancies (see Fig. 8a).

Figure 7Estimation of TSi and MTi contents in accordance with the TO4-ring modes near 650 and 680 cm−1: (a) TSi amount vs. Raman peak position at ∼ 650 (blue symbols) and ∼ 680 cm−1 (red symbols), (b) TSi content derived from the Raman spectroscopic analysis (TSiRaman) of ω650 vs. that determined from EMPA (TSiEMP), (c) MTi content vs. Raman peak position at ∼ 650 (blue symbols) and ∼ 680 cm−1 (red symbols), (d) MTi content obtained from the Raman spectroscopic analysis (MTiRaman) of ω680 vs. that determined from EMPA (MTiEMP), (e) MTi amount vs. FWHM at ∼ 650 (blue symbols) and ∼ 680 cm−1 (gray symbols), and (f) MTi content obtained from the Raman spectroscopic analysis (MTiRaman) of FWHM680 vs. that determined from EMPA (MTiEMP).
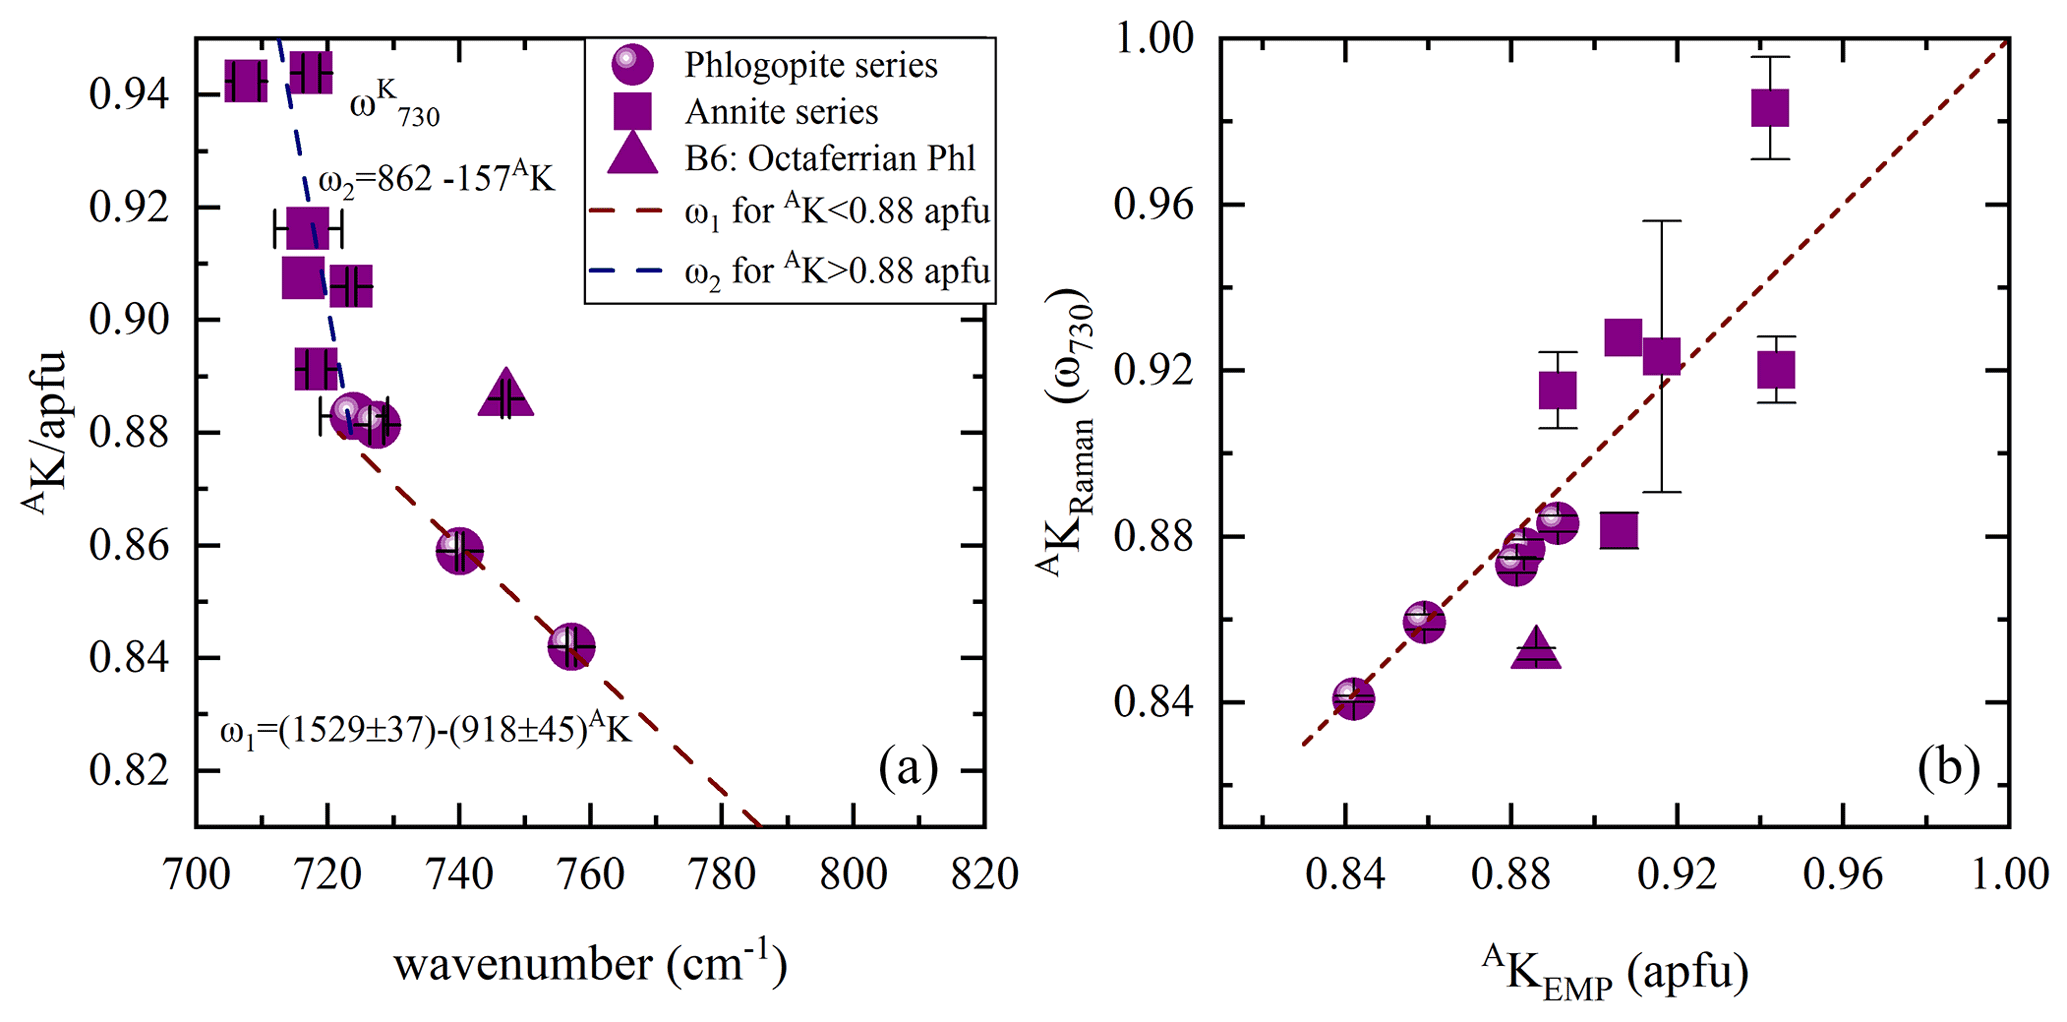
Figure 8(a) Content of A-site coordinated K vs. ω730, where the Raman spectroscopic data are emerging from the scattering geometry, while in (b) AKRaman vs. AKEMP estimated from both ω1 and ω2 linear trends in (a). Deviating point: triangle indicates sample B6, a phlogopite containing octahedrally coordinated Fe3+ at concentrations of ∼ 0.30 apfu.
We have expected the TO4-stretching modes in range III to be sensitive to the octahedral site occupancy, as in the case of Mg-Fe-Mn amphiboles (Waeselmann et al., 2020); however, we were not able to establish a rational dependence of the spectral parameters of these modes on the chemistry neither at the M site nor at the T site.
The reported observations for the framework phonon modes should be combined with the Raman-scattering results arising from OH-stretching modes to gain a detailed description of the entire biotite Raman spectrum and to comprehend its dependence on the site occupancy. As expected, range IV exhibits more than one peak generated by OH-stretching vibrations due to two-mode behavior, typical of complex hydrous silicates (Leissner et al., 2015; Watenphul et al., 2016a; Hawthorne, 2016). In such a case, more Raman peaks than those predicted by group-theory analysis can appear in the spectra, whose fractional intensities correlate with the composition x. This two-mode behavior of the OH-stretching phonon modes is caused by the perturbation of the K(O-H) force constant by the averaged M–O interactions in the surrounding triplet of MO6 octahedra sharing oxygen atom with the X-site hydroxyl group, 〈δK(M-O)〉. Thus the OH-stretching wavenumber will be , resulting in different Raman/IR peaks for different M1M2M2 chemical configurations (paper on Raman; e.g., Lacalamita et al., 2020, paper on IR; Redhammer et al., 2000). It should be emphasized that according to group theory two H+ in the primitive unit cell participate into the OH-stretching Ag mode. At the same time, two instances of X(OH)- in the chemical formula correspond to three octahedrally coordinated M cations (M1M2M2). Hence, 〈δK(M-O)〉 is related precisely to those three octahedra, and consequently the intensities of the OH-stretching peaks arising from different M1M2M2 triplets can be used for the correct quantification of the chemical composition of the octahedral sheets in biotite.
Table 3 presents the assignment of the multi-component Raman scattering in the OH-stretching region of the analyzed biotites to specific M-site local arrangements, following the categorization by Vedder (1964) based on the valence state of the M1M2M2 triplet surrounding the OH groups and the possibility of a vacancy at the M site: (i) the N-type bands (normal; M2+M2+M2+), where the hydroxyl groups are surrounded by three divalent cations; (ii) the I-type bands (impurity; M2+M2+M3+), where the stretching modes are caused by hydroxyl groups surrounded by one trivalent and two divalent M-site cations; and (iii) the V-type bands (vacancy; M2+M/M2+M/M3+M), where the local atomic arrangement of the OH bonds includes a vacancy and two occupied octahedral sites.
Table 3Raman peak assignment of the OH-stretching vibrations associated with various local configurations of the octahedrally coordinated cations.
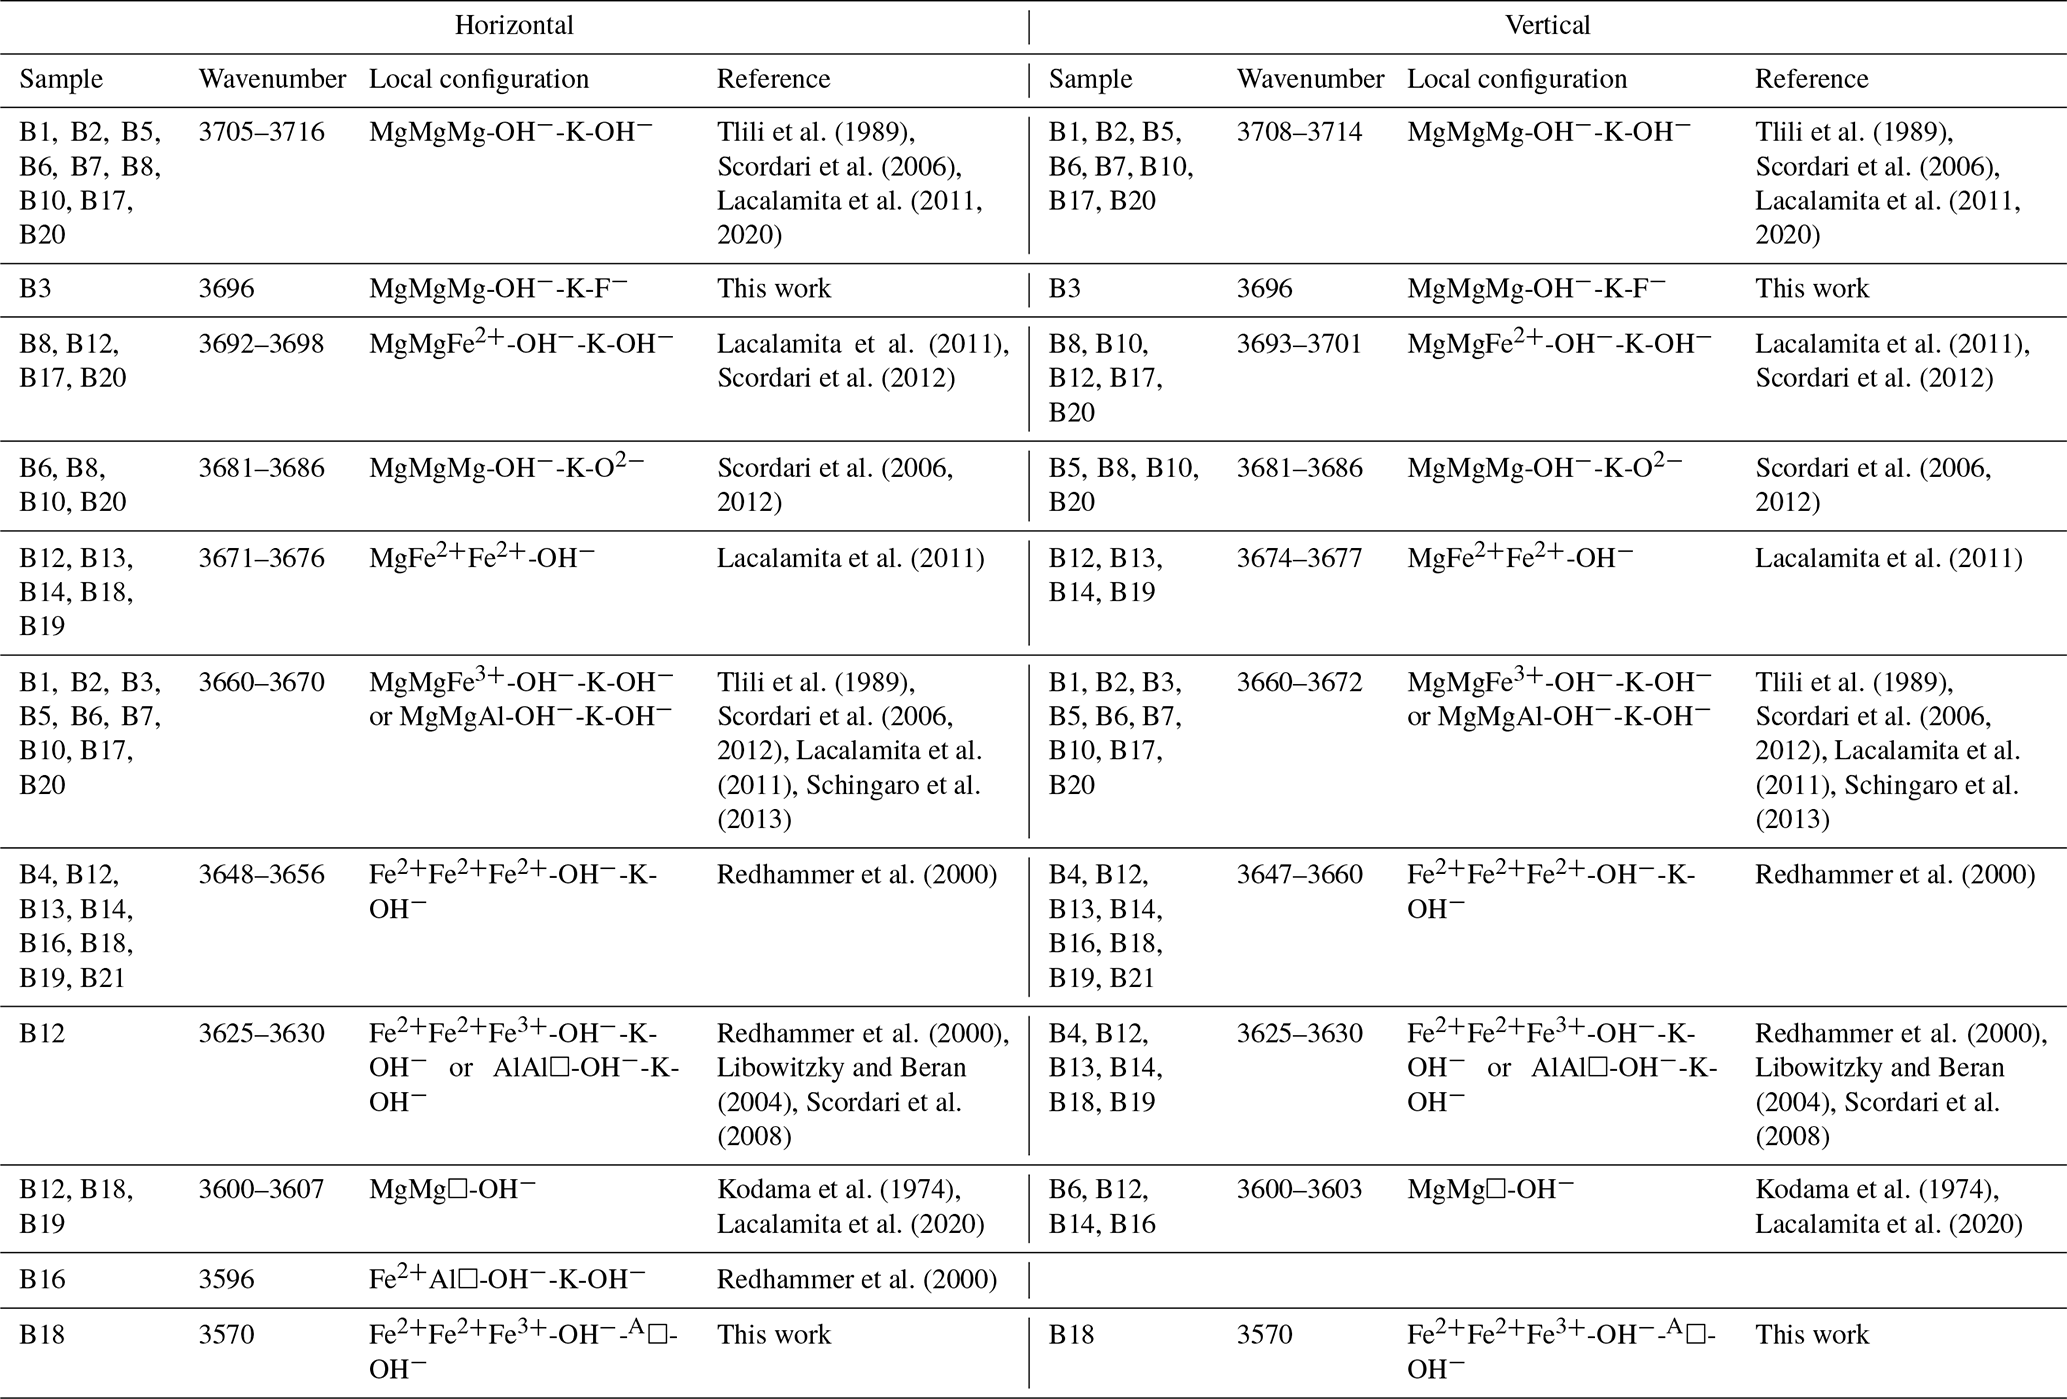
In accordance with the two-mode behavior approach, the strongest OH-stretching peak corresponds to the most abundant M1M2M2 chemical configuration. Since biotite represents a solid solution between phlogopite and annite, where Mg and Fe2+ are the dominant octahedrally coordinated cations, for each biotite sample the most intense OH-stretching peak should correspond to the most probable M2+M2+M2+ chemical species. Hence, weaker OH-stretching peaks will correspond to less probable M1M2M2 local configurations. Consequently, peaks related to MgMgMg-OH−-K-X local configurations are observed for all of the studied phlogopite samples (B1, B2, B3, B5, B6, B7, B8, B10, B17, and B20) with the exception of sample B12, which shows an intermediate composition in the octahedral layer (see Table 1). However, the peak position slightly varies depending on the X-site anion adjacent to AK. Furthermore, the majority of the phlogopite samples exhibits OH-stretching modes in the range 3660–3670 cm−1 corresponding to MgMgFe3+ and MgMgAl, whose OH groups are involved in an OH−-K-OH− local environment (Tlili et al., 1989; Scordari et al., 2006; Lacalamita et al., 2011; Scordari et al., 2012; Schingaro et al., 2013). It is worth noting that the gradual substitution of Mg by Al at the M site, emerging from the Al-Tschermak substitution mechanism, will downshift the peak position of the initial MgMgMg-OH−-K-OH− local configuration by ∼ 30–35 cm−1, i.e., from ∼ 3705–3715 to 3670–3675 cm−1. This assumption corroborates the conclusions by Hawthorne et al. (2000), Scordari et al. (2012), and Watenphul et al. (2016a), who showed that a similar Raman peak shift towards lower frequencies has been monitored for the OH-stretching peaks in tremolites and phlogopite as well as for the W-site OH stretching in tourmalines.
At the same time, most of the examined annite samples (B4, B13, B14, B16, B18, B19, and B21) display the strongest OH-stretching N-type Raman peak between 3650 and 3660 cm−1 (Figs. S2 and S3, Table 3), corresponding to Fe2+Fe2+Fe2+-OH−-K-X (Redhammer et al., 2000). For sample B16, an aluminian F-rich annite, the Raman peak at ∼ 3596 cm−1 is assigned to a Fe2+Al□-OH− local configuration (Redhammer et al., 2000) rather than to MgMg□-OH−, by taking into account the following aspects: (i) the peak centered at ∼ 3596 cm−1 being the strongest feature of the Raman spectrum of sample B16 (Fig. S2), indicating that it should be assigned to the most abundant cations at the M site, and (ii) the cationic distribution of the M site with MFe apfu, MAl = 0.88 apfu, and MMg = 0.10 apfu.
4.1 Major elements in the octahedral sheets
Quantification of MMg content in atoms per formula unit can be achieved by the Raman signals of two different vibrational groups (Fig. 5). The best candidate from the framework vibrational modes are the MO6 vibrations at ∼ 190 cm−1, whose peak position and FWHM are plotted against M-site Mg concentration (Fig. 5a). Data points of both plots were fitted with the exponential functions and , respectively. Then, using the inverse functions and , one can calculate the content of MMg from the Raman data (MMgRaman). It is worth noting that sample B16, an aluminian F-rich annite, strongly deviates from both exponential trends in Fig. 5a, which we attribute to the high amount of octahedrally coordinated Al > 0.8 apfu, the highest among the studied biotites; consequently an alternative should be found to quantify MMg in such MAl-rich biotites. Moreover, MMgRaman plotted against MMgEMP (Fig. 5b) reveals relatively large deviation from the one-to-one correlation line for phlogopite (MMg > 1.5 apfu). Hence, the introduction of a second vibrational group sensitive to M-site occupancy by Mg is mandatory to solve this issue.
As pointed out above, the M-site chemistry has a strong effect on the OH-stretching modes, in a way very similar to that for amphiboles (Leissner et al., 2015; paper on IR; e.g., Hawthorne, 2016). The correct assignment of the OH-stretching peaks to different chemical M1M2M2 species is however, a key factor for the proper utilization of the two-mode behavior approach, since the peak position of the strongest OH-stretching Raman peak will reveal the dominant cations occupying the octahedral layer. We have attributed the observed OH-stretching peaks based on multiple studies by others (see Table 3, Fig. 5c). Then the content of MMg was calculated by averaging the sum of the integrated I of each parallel-polarized orientation ( and ) generated by Mg-containing M1M2M2 configurations, multiplied by the number of Mg cations in the corresponding triplet: , where IOH(total) the sum of the integrated intensities of all OH-stretching modes in both and Raman spectra; in the case of a single-crystal grain with unknown orientation or polycrystalline sample, IOH(total) can be simply the intensity summed up over all OH-stretching Raman peaks. The MMgRaman (aver.) values plotted against those calculated from the EMP analysis (MMgEMP) exhibit an excellent one-to-one correlation (Fig. 5d).
It is worth commenting more in detail on the OH-stretching peak assignment of B18 (magnesian AK-deficient annite). The Raman peak at 3570 cm−1 observed in the spectrum of B18 was assigned to Fe2+Fe2+Fe3+-OH−-A□-OH− rather than to Fe3+Al□-OH−-K-OH−, which generates an infrared absorption peak in close proximity in energy (Redhammer et al., 2000), based on the following decisive criteria: (i) this is the strongest Raman signal in the OH-stretching range, and therefore it can be hardly attributed to defects in the octahedral layer. (ii) B18 is the only interlayer-deficient biotite among all the samples studied here, with a considerable amount of A-site vacancies A(K0.63□0.37). (iii) B18 is MAl-poor annite; i.e., Fe2+ and Fe3+ are the most abundant octahedrally coordinated cations. (iv) Previous Raman and infrared studies on amphiboles (Leissner et al., 2015; Hawthorne, 2016) indicated that an OH-stretching peak generated by a given triplet of MO6 octahedra next to A-site vacancy is downshifted in wavenumber by approximately 50–60 cm−1 with respect to the OH-stretching peak generated by the same MO6 triplet but next to a filled A-site, which favors a Fe2+Fe2+Fe3+ over a Fe2+Fe2+Fe2+ configuration (compare the corresponding peak positions related to AK in Table 3). It should be mentioned that a perfect match of sample B18 with the one-to-one line of Fig. 5d can be achieved by taking into consideration the influence of TAl on the ω of the M1M2M2 triplets in the scattering geometry, since B18 has the highest content of tetrahedrally coordinated Al in the sample suite studied here (TAl = 1.51 apfu). Previous research on the TAl effect in synthetic amphiboles with vacant A sites (Hawthorne et al., 2000) and along the annite–siderophyllite (K(Fe,Al)(Si2Al2)O10(OH)2) join with fully occupied A sites (Redhammer et al., 2000) indicated that progressive substitution of TSi by TAl resulted in a downshift of the OH-stretching bands by 15–20 cm−1. This accounts principally for the N- and I-type OH Raman peaks in the case of TAl-rich annite. Thus, the peaks at 3677 and 3655 cm−1 of the horizontal parallel-polarized spectrum of B18 should rather be assigned to MgMgFe2+-OH− and MgFe2+Fe2+-OH− local arrangements, respectively. Therefore, an MMgRaman (aver.) value of 0.73 apfu can be obtained, which is almost identical to 0.70 apfu of the EMP analysis. Nevertheless, the crosschecking of the calculations gained from Fig. 5b and d will reduce the uncertainties and give an unequivocal determination of MMg content of sample B18.
Nominally biotite is an M(Mg, Fe2+) solid solution, and therefore ω190 as a function of the MFe2+ content shows a reverse trend (see Fig. 6a) compared to that against MMg content (Fig. 5a). Consequently, MFe2+ content can be estimated using the equation . However, similarly to the case of MMg (Fig. 5b), there is an unsatisfactory deviation of the phlogopite dataset from the one-to-one-correlation (see Fig. S4). Since the MMg content could be quantified more precisely by the integrated I of OH-stretching modes, the same strategy was followed to quantify MFe2+, using the equation , where IOH(total) the sum of the integrated intensities of all OH-stretching modes of the horizontal and vertical parallel-polarized spectra, respectively. Figure 6b shows the correlation of MFe with MFe2+ concentration determined by EMPA, where the data points for Mg-rich biotites with MFe2+ < 0.8 apfu follow a one-to-one correlation line and for Fe-rich biotites (with MFe2+ > 0.8 apfu) a linear trend that can be expressed by the relation MFe.
It should be underlined that the presence of MFe3+ also affects the peak position of the MO6 vibrations at ∼ 190 cm−1, which increases exponentially with increasing M(Fe2+ + Fe3+) content and can be calculated by (Fig. 6a). Besides that, the integrated intensities of the OH-stretching modes, where Fe3+ is involved in the assigned local environment and is mainly emerging from the MgMgFe3+ and Fe2+Fe2+Fe3+ triplets for phlogopite and annite, respectively, can be used to quantify the total amount of octahedrally coordinated Fe and then plotted against M(Fe2+ + Fe3+)EMP (Fig. 6c). Similarly to the trends in Fig. 6b, good one-to-one correlation can be achieved for phlogopite with M(Fe2+ + Fe3+) < 0.8 apfu, whilst for samples exceeding this value, M(Fe2+ + Fe3+) content can be obtained from M(Fe2+ + Fe3+).
The fact that MFe2+ and M(Fe2+ + Fe3+) are overestimated by Raman spectroscopy, while MMg is not, suggests that additional non-magnesium, non-iron elements contribute to the spectral range dominated by OH-stretching modes related to ferrous/ferric M1M2M2 configurations. This is also evident by the overall broad bands (FWHM ∼ 27–40 cm−1) in the range 3650–3660 cm−1 in the Raman spectra of annite samples (B13, B14, B16, B18, and B19), indicating a superposition of multiple different octahedrally coordinated cationic combinations such as Fe2+Fe2+Fe3+, Fe2+Fe2+Al, and AlAl□- (e.g., Redhammer et al., 2000; Libowitzky and Beran, 2004; Scordari et al., 2008; Schingaro et al., 2013). Hence, subtle amounts of minor elements such as Al, Ti, and Mn, entering the M site, whose vibrational modes cannot be separated from the ascribed ones, lead to the deviation of the annite dataset from the one-to-one correlation lines of Fig. 6b and c. This can be seen by plotting the contents of the non-(Mg,Fe) octahedrally coordinated cations calculated from the Raman and EMP analyses (Fig. 6d), where a one-to-one match with discrepancies within the relative errors is observed for all samples. The only exception is sample B16, characterized by an unusual high content of non-(Mg,Fe) cations of almost 47 % of the M-site occupancy. By subtracting the excess of MFe2+ (y2(x) in Fig. 6b) from the total amount of octahedrally coordinated (y2(x) in Fig. 6c), one can estimate MFe, which is significant in Earth sciences, as it is indicative of oxidation processes. We could not find a satisfactory trend to directly quantify MFe3+, e.g., via ω and integrated I of the Raman scattering in the range 500–550 cm−1, which is noticeable spectral indicators for the presence of octahedrally coordinated Fe3+ in Na amphiboles (Waeselmann et al., 2020).
4.2 Major elements in the tetrahedral sheets
Among the framework phonon modes the TO4-ring modes near 650 and 680 cm−1 (i.e., T–Ob–T bending) appear to be most sensitive to the T-site occupancy (see Fig. 7a). However, the position of the Raman peak near 680 cm−1 (Si–Ob–Si) turned to be also sensitive to the content of MTi (see the discussion below), whereas the position of the peak near 650 cm−1 (Si–Ob–Al) is indifferent to the M-site occupancy. Therefore, we propose to use the wavenumber of the TO4-ring mode near 650 cm−1 to estimate the amount of TSi. The evolution of ω650 with respect to TSi can be fitted with a Boltzmann-type function , and then the TSi amount can be quantified by the inverse function (see Fig. 7a). Only sample B3 slightly deviates from fitting trend, an effect that can be connected to the incorporation of Fe3+ at the T site. Despite that, the plot of TSi amount derived from the Raman data against TSiEMP provides an excellent one-to-one correlation for all values between 2.6 and 3.2 apfu with a relative uncertainty of ∼ 3 % (Fig. 7b). Due to the sigmoidal shape of the TSi(ω650) curve, the uncertainly in determining TSi considerably increases for values below 2.6 apfu.
The common tetrahedrally coordinated elements in biotite are Si, Al, and trivalent Fe, but TFe3+ is usually found in annite rather than in phlogopite. Therefore, for phlogopite the amount of tetrahedrally coordinated Al cations can be also determined: ω650 as TAl = 4–TSi(ω650) apfu. This can help in general to cross-check the correctness of OH-stretching assignment, which is significant for the refinement of the M-site occupancy, because studies on the annite–siderophyllite (K(Fe,Al)(Si2Al2)O10(OH)2) join (Redhammer et al., 2000) as well as on amphiboles with vacant A sites (Hawthorne et al., 2000) revealed that the progressive substitution of TAl for TSi results in a downshift of the OH-stretching mode by 15–20 cm−1.
4.3 Presence of M-site Ti
Interestingly, the position and FWHM of the TO4-ring mode at ∼ 680 cm−1, involving Si–Ob–Si-bond-bending vibrations exhibit a linear correlation with the MTi (Fig. 7c and e, respectively), without showing any dependence on the major M-site elements. This is probably related to the fact that tetravalent Ti interacts stronger with the TO4 apical oxygen atoms, resulting in subtle change of the TO4-ring tilt geometry and thus influencing the T–O–T-bending vibrations. The linear fits to the corresponding data points yielded and . As can be seen in Fig. 7d and f several data points for annite (samples B4, B12, B13, and B18) derived from MTi(ω680) deviate from the one-to-one trend, whereas the dispersion is considerably less for the data derived from MTi(FWHM680). Thus, using the relation , one can determine MTi with a relative uncertainty of ∼ 20 %. The only deviating point in the trend showed in Fig. 7f is sample B4, in whose spectrum the two peaks near 650 and 680 cm−1 could not be resolved and appeared as a single very broad Raman peak centered at ∼ 670 cm−1 with FWHM680=105.3 cm−1 (Fig. 7e). It should be mentioned that in Ti-rich biotites (MTi > 0.2 apfu) contributions from OH stretching of X-site hydroxyl groups shared between Ti-containing M1M2M2 triplets can be expected (e.g., Scordari et al., 2006). However, to keep local charge balance, commonly the anionic X sites next to MTi are occupied by an O2−-forming local chemical arrangement of type K-O2−-M2+M2+Ti4+-O2−-K, in which no OH-stretching peaks should be observed. Possible Raman-active modes of the OH-stretching vibrations, including Ti in the assigned triplets to comply with the requirements for local charge balance can be K-OH−-M2+Ti-OH−-K, K-O2−-M2+M2+Ti4+-OH−-A□ or less probably A□-O2−-M2+ M2+Ti4+-OH−-K. Such considerations are supported by the main substitution mechanisms involving Ti after Li et al. (2020). However, we could not resolve such additional OH-stretching peaks in our Ti-rich samples, namely phlogopite B6, B8, and B20 and annite B4, B14, and B21.
4.4 Interlayer cations
In contrast to earlier findings by Wang et al. (2015), a direct connection of the linearly increasing ratio with decreasing ω of the Raman peaks at 715–755 (ω730) and 760–780 cm−1 (ω780) could not be observed. Though, the peak position of the ring mode vibrations at ∼ 730 cm−1 in the Raman spectra tends to be sensitive to the occupancy of the interlayer space and shifts linearly to higher wavenumbers in the presence of A-site vacancies with a gradient change at MMg contents of 1.5 apfu. This tendency reflects to some extent the evolution of AK content with increasing ω730 values. Accordingly, AK content was only plotted against ω730 (Fig. 8a), as ω780 could not mirror the amount of A-site cations, in particular of K. For biotites belonging to the phlogopite series AK content can be determined by using the equation , while that of annite can be expressed by the relation . The Raman-scattering analysis provides precise calculation of the amount of AK for the phlogopite dataset with a relative error of ∼ 3 %, but the uncertainty obtained from the inverse trend of ω1 is too large to quantify AK content of annite (Fig. 8b). Sample B6 deviates from the ω2 linear trend and is characterized by MFe3+ contents of ∼ 0.30 apfu. Though, it cannot be stated whether the elevated MFe3+ contents in the crystal structure of phlogopite shift the corresponding peak towards higher wavenumbers, since in sample B5, an octaferrian phlogopite with similar amount of MFe3+, we could not identify a peak between 715 and 755 cm−1.
4.5 Limitations of the method
Raman spectroscopy, as with any other analytical technique, has its limitations, and undoubtedly, it cannot achieve the detection limit of EMPA (∼ 100–200 ppm), and trace elements cannot be detected by Raman spectroscopy. Besides, the uncertainties in the quantification of major and minor elements by Raman spectroscopy are affected by the quality of the measured spectra, i.e., by the signal-to-noise ratio and spectral resolution. Nevertheless, here we demonstrate that the relative uncertainties of TSi, AK, MMg, MFe2+, and MFe3+ amounts in atoms per formula unit, as derived from Raman-scattering data, are 3 %, 3 %, 6 %, 6 %, and 8 %, respectively, whereas the uncertainties in the chemical formulae calculated from EMP data are ∼ 1 %–2 %. Moreover, the determination of Fe3+ only on the basis of EMPA is not straightforward. Minor elements such as MTi can be estimated by Raman spectroscopy with a relatively large uncertainty of 20 % against 6 % by EMPA.
The results of our combined Raman spectroscopic and WD-EMP as well as Mössbauer analyses clearly reveal that the major cations occupying the octahedral, tetrahedral, and interlayer sites of biotites can be determined with acceptable relative errors. Minor elements at the M site such as Ti, which are critical crystallochemical markers indicative of specimen locality, can be quantified as well. According to the overall spectral profile, one can easily distinguish between phlogopite and annite, as the strongest MO6 peak (region I; Fig. 4) appears at ∼ 195 and 165 cm−1, respectively, while the strongest OH-stretching peak (region IV; Fig. 4) is at 3710 and 3650 cm−1, respectively. Furthermore, the established calibration curves between the Raman signals and the chemical composition of the analyzed biotites provide a preparation-free, fast, and easy-to-handle tool for the crystallochemical characterization of those phyllosilicates. Guidelines for non-specialists to non-destructively determine the crystallochemical composition of biotites are listed as follows:
-
By following the recommended OH-stretching peak assignment to different local cationic arrangements (Table 3), MMgRaman (aver.), MFe, and M(FeFe can be calculated.
-
Deviations from the one-to-one correlation lines, in the case of estimating the MFe2+ and MFe3+ amounts, demonstrate incorporation of non-(Mg,Fe) cations in the octahedral layer (Fig. 6d).
-
The amount of M-site Mg, Fe2+, and Fe3+ can be cross-checked by the position of the strong Raman peak near 190 cm−1, arising from the MO6 vibrations; in the case of MMg, FWHM190 can be used as well.
-
MTi content can be quantified by the peak position and FWHM of the TO4-ring mode at ∼ 680 cm−1. Due to smaller relative errors, it is recommended to use the MTi(FWHM680) trend if two peaks near 650 and 680 cm−1 can be resolved.
-
The presence of MAl > 0.8 apfu in annite can be detected by cross-checking the MMg contents derived from ω190 and of the integrated intensities of the OH-stretching peaks.
-
The amount of TSi can be monitored using the peak position of the TO4-ring modes at ∼ 650 cm−1. TAl content of phlogopite can indirectly be extracted by TAl = 4−TSi.
-
Potassium deficiency in phlogopite larger than 0.12 apfu can be quantified from the position of the peak at ∼ 730 cm−1. Interlayer-deficient annite can be recognized by the position of the strongest OH-stretching mode, appearing at 3570 instead of ∼ 3650 cm−1.
Overall, our study shows that Raman spectroscopy is a reliable experimental method for the crystallochemical characterization also for biotites along with other complex hydrous silicates, though still not so precise as EMPA. However, the truly non-destructive nature of Raman spectroscopy makes it an extremely useful tool for characterizing cultural-heritage objects, and the trends provided here demonstrate that it can be used even for quantitative analyses. Moreover, one can directly analyze mineral grains in thin sections as prepared for polarization microscopy. It is highly anticipated that a similar analytical approach to other groups of phyllosilicates, including those that can be found in cultural-heritage artifacts, could facilitate the non-invasive determination of their crystallochemical composition.
Data derived from this research are presented in the Supplement. Additional data are available upon request from the corresponding author.
The supplement related to this article is available online at: https://doi.org/10.5194/ejm-34-573-2022-supplement.
BM and JS initiated the project. SA carried out the Raman experiments as well as the Raman and EMP data evaluation and analyses. GJR performed the Mössbauer spectroscopic analysis. SA prepared the manuscript with contributions from BM and JS. All authors discussed and interpreted the results.
The contact author has declared that none of the authors has any competing interests.
Publisher’s note: Copernicus Publications remains neutral with regard to jurisdictional claims in published maps and institutional affiliations.
The research for this study was funded by the Deutsche Forschungsgemeinschaft (DFG, German Research Foundation) under Germany's Excellence Strategy for “Understanding Written Artefacts: Material, Interaction and Transmission in Manuscript Cultures” (EXC 2176; project no. 390893796). The research was conducted within the scope of the Centre for the Study of Manuscript Cultures (CSMC) at Universität Hamburg. We thank Stefanie Heidrich and Peter Stutz, Universität Hamburg, for helping with WD-EMPA measurements and sample preparation. We are very grateful to the Mineralogical Museum of Universität Hamburg for kindly providing the whole of the biotite crystals.
This research has been supported by the Deutsche Forschungsgemeinschaft (grant no. EXC 2176 “Understanding Written Artefacts: Material, Interaction and Transmission in Manuscript Cultures”).
This paper was edited by Tiziana Boffa Ballaran and reviewed by Monika Koch-Müller and one anonymous referee.
Bendel, V. and Schmidt, B. C.: Raman spectroscopic characterisation of disordered alkali feldspars along the join KAlSi3O8-NaAlSi3O8: application to natural sanidine and anorthoclase, Eur. J. Mineral., 20, 1055–1065, https://doi.org/10.1127/0935-1221/2009/0021-1856, 2008.
Bersani, D. and Lottici, P. P.: Raman spectroscopy of minerals and mineral pigments in archaeometry, J. Raman Spectrosc., 47, 499–530, 2016.
Brigatti, M. F., Frigieri, P., Ghezzo, C., and Poppi, L.: Crystal chemistry of Al-rich biotites coexisting with muscovites in peraluminous granites, Am. Mineral., 85, 436–448, 2000.
Brigatti, M. F., Kile, D. E., and Poppi, M.: Crystal structure and crystal chemistry of Lithium-bearing muscovite-2M1, Can. Mineral., 39, 1171–1180, 2001.
Brigatti, M. F., Affronte, M., Elmi, C., Malferrari, D., and Laurora, A.: Trioctahedral Fe-rich micas: Relationships between magnetic behavior and crystal chemistry, Am. Mineral., 100, 2231–2241, 2015.
Chang, I. F. and Mitra, S. S.: Long wavelength optical phonons in mixed crystals, Adv. Phys., 20, 359–404, 1971.
Corradini, M., de Ferri, L., and Pojana, G.: Spectroscopic characterization of commercial pigments for pictorial retouching, J. Raman Spectrosc., 52, 35–58, 2021.
El Halim, M., Daoudi, L., El Ouahabi, M., Rousseau, V., Cools, C., and Fagel, N.: Mineralogical and geochemical characterization of archaeological ceramics from the 16th century El Badi Palace, Morocco, Clay Miner., 53, 459–470, 2018.
Gianfagna, A., Scordari, F., Mazziotti-Tagliani, S., Ventruti, G., and Ottolini, L.: Fluorophlogopite from Biancavilla (Mt. Etna, Sicily, Italy): Crystal structure and crystal chemistry of a new F-dominant analog of phlogopite, Am. Mineral., 92, 1601–1609, 2007.
Hawthorne, F. C.: Short-range atomic arrangements in minerals. I: The minerals of thze amphibole, tourmaline and pyroxene supergroups, Eur. J. Mineral., 28, 513–536, https://doi.org/10.1127/ejm/2016/0028-2538, 2016.
Hawthorne, F. C., Welch, M. D., Della Ventura, G., Liu, S., Robert, J.-L., and Jenkins, D. M.: Short-range order in synthetic aluminous tremolites. An infrared and triple-quantum MAS NMR study, Am. Mineral., 85, 1716–1724, 2000.
Hradil, D., Píšková, A., Hradilová, J., Bezdička, P., Lehrberger, G., and Gerzer, S.: Mineralogy of Bohemian green earth pigment and its microanalytical evidence in historical paintings, Archaeometry, 53, 563–586, 2011.
Kodama, H., Ross, G. J., Iiyama, J. T., and Robert, J.-L.: Effect of layer charge location on potassium exchange and hydration of micas, Am. Mineral., 59, 491–495, 1974.
Kroumova, E., Aroyo, M. I., Perez-Mato, J. M., Kirov, A., Capillas, C., Ivantchev, S., and Wondratschek, H.: Bilbao Crystallographic Server: useful databases and tools for phase-transition studies, Phase Transit., 76, 155–170, 2003.
Lacalamita, M., Schingaro, E., Scordari, F., Ventruti, G., Fabbrizio, A., and Pedrazzi, G.: Substitution mechanisms and implications for the estimate of water fugacity for Ti-rich phlogopite from Mt. Vulture, Potenza, Italy, Am. Mineral., 96, 1381–1391, 2011.
Lacalamita, M., Schingaro, E., Mesto, E., Zaccarini, F., and Biagioni, C.: Crystal-chemistry of micas belonging to the yangzhumingite-fluorophlogopite and phlogopite-fluorophlogopite series from the Apuan Alps (northern Tuscany, Italy), Phys. Chem. Miner., 47, 54, https://doi.org/10.1007/s00269-020-01118-2, 2020.
Laurora, A., Brigatti, M. F., Mottana, A., Malferrari, D., and Caprilli, E.: Crystal chemistry of trioctahedral micas in alkaline and subalkaline rocks: A case study from Mt. Sassetto (Tolfa district, Latium, central Italy), Am. Mineral., 92, 468–480, 2007.
Leissner, L., Schlüter, J., Horn, I., and Mihailova, B.: Exploring the potential of Raman spectroscopy for crystalochemical analyses of complex hydrous silicates: I. Amphiboles, Am. Mineral., 100, 2682–2694, 2015.
Li, X., Zhang, C., Behrens, H., and Holtz, F.: Calculating biotite formula from electron microprobe analysis data using a machine learning method based on principal components regression, Lithos 356–357, 105371, https://doi.org/10.1016/j.lithos.2020.105371, 2020.
Libowitzky, E. and Beran, A.: IR spectroscopic characterization of hydrous species in minerals, in: Spectroscopic methods in mineralogy, edited by: Beran, A. and Libowitzky, E., EMU Notes in Mineralogy, Eötvös University Press, Budapest, 227–279, https://doi.org/10.1180/EMU-notes.6.6, 2004.
Loh, E.: Optical vibrations in sheet silicates, J. Phys. C Solid State, 6, 1091–1104, 1973.
McKeown, D. A., Bell, M. I., and Etz, E. S.: Raman spectra and vibrational analysis of the trioctahedral mica phlogopite, Am. Mineral., 84, 970–976, 1999.
Mihailova, B., Schlüter, J., and Harter-Uibopuu, K.: Inscribed gems: Material profiling beyond visible examination, in: Exploring written artefacts: Objects, methods and concepts, edited by: Quenzer, J. B., De Gruyter, Berlin, Boston, 229–244, https://doi.org/10.1515/9783110753301-012, 2021.
Milke, R.: Geomaterials in the manuscript archive: The composition of writing sands and the regional distribution of writing-sand types in SW-Germany and northern Switzerland, 14th to 19th century, Eur. J. Mineral., 24, 759–770, 2012.
Momma, K. and Izumi, F.: VESTA: a three-dimensional visualization system for electronic and structural analysis, J. Appl. Crystallogr., 41, 653–658, 2008.
Prencipe, M., Mantovani, L., Tribaudino, M., Bersani, D., and Lottici, P. P.: The Raman spectrum of diopside: a comparison between ab initio calculated and experimentally measured frequencies, Eur. J. Mineral., 24, 457–464, 2012.
Redhammer, G. J., Beran, A., Schneider, J., Amthauer, G., and Lottermoser, W.: Spectroscopic and structural properties of synthetic micas on the annite-siderophyllite binary: Synthesis, crystal structure refinement, Mössbauer, and infrared spectroscopy, Am. Mineral., 85, 449–465, 2000.
Redhammer, G. J., Amthauer, G., Lottermoser, W., and Roth, G.: Quadrupole splitting distribution of Fe2+ in synthetic trioctahedral micas, Hyperfine Interact., 141/142, 345–349, 2002.
Redhammer, G. J., Amthauer, G., Lottermoser, W., Bernroider, M., Tippelt, G., and Roth, G.: X-ray diffraction and 57Fe – Mössbauer spectroscopy of synthetic trioctahedral micas {K}[Me3] < TSi3 > O10(OH)2, Me = Ni2+, Mg2+, Co2+, Fe2+; T = Al3+, Fe3+, Miner. Petrol., 85, 89–115, 2005.
Rieder, M., Cavazzini, G., D'Yakonov, Y. S., Frank-Kamenetskii, V. A., Gottardi, G., Guggenheim, S., Koval, P. V., Müller, G., Neiva, A. M. R., Radoslovich, E. W., Robert, J.-L., Sassi, F. P., Takeda, H., Weiss, Z., and Wones, D. R.: Nomenclature of the micas, Can. Mineral., 36, 1–10, 1998.
Righter, K., Dyar, M. D., Delaney, J. S., Vennemann, T. W., Hervig, R. L., and King, P. L.: Correlations of octahedral cations with OH−, O2−, Cl−, and F− in biotite from volcanic rocks and xenoliths, Am. Mineral., 87, 142–153, 2002.
Schingaro, E., Lacalamita, M., Scordari, F., and Mesto, E.: 3T-phlogopite from Kasenyi kamafugite (SW Uganda): EPMA, XPS, FTIR, and SCXRD study, Am. Mineral., 98, 709–717, 2013.
Scordari, F., Ventruti, G., Sabato, A., Bellatreccia, F., Della Ventura, G., and Pedrazzi, G.: Ti-rich phlogopite from Mt. Vulture (Potenza, Italy) investigated by a multianalytical approach: Substitutional mechanisms and orientation of the OH dipoles, Eur. J. Mineral., 18, 379–391, 2006.
Scordari, F., Schingaro, E., Ventruti, G., Lacalamita, M., and Ottolini, L.: Red micas from basal ignimbrites of Mt. Vulture (Italy): Interlayer content appraisal by a multi-methodic approach, Phys. Chem. Miner., 35, 163–174, 2008.
Scordari, F., Schingaro, E., Lacalamita, M., and Mesto, E.: Crystal chemistry of trioctahedral micas-2M1 from Bunyaruguru kamafugite (southwest Uganda), Am. Mineral., 97, 430–439, 2012.
Scordari, F., Schingaro, E., Ventruti, G., Nicotra, E., Viccaro, M., and Mazziotti Tagliani, S.: Fluorophlogopite from Piano delle Concazze (Mt. Etna, Italy): Crystal chemistry and implications for the crystallization conditions, Am. Mineral., 98, 1017–1025, 2013.
Singha, M. and Singh, L.: Vibrational spectroscopic study of muscovite and biotite layered phyllosilicates, Indian J. Pure Appl. Phys., 54, 116–122, 2016.
Tlili, A., Smith, D. C., Beny, J.-M., and Boyer, H.: A Raman microprobe study of natural micas, Mineral. Mag., 53, 165–179, 1989.
Tutti, F. and Lazor, P.: Temperature-induced phase transition in phlogopite revealed by Raman spectroscopy, J. Phys. Chem. Solids, 69, 2535–2539, 2008.
Uchida, E., Niikuma, D., and Watanabe, R.: Regional differences in the chemical composition of cuneiform clay tablets, Archaeological Discovery, 3, 179–207, 2015.
Vedder, W.: Correlations between infrared spectrum and chemical composition of mica, Am. Mineral., 49, 736–768, 1964.
Velbel, M. A.: Formation of protective surface layers during silicate-mineral weathering under well-leached, oxidizing conditions, Am. Mineral., 78, 405–414, 1993.
Waeselmann, N., Schlüter, J., Malcherek, T., Della Ventura, G., Oberti, R., and Mihailova, B.: Nondestructive determination of the amphibole crystal-chemical formulae by Raman spectroscopy: One step closer, J. Raman Spectrosc., 51, 1530–1548, 2020.
Wang, A., Freeman, J. J., and Jolliff, B. L.: Understanding the Raman spectral features of phyllosilicates, J. Raman Spectrosc., 46, 829–845, 2015.
Wang, Y. Y., Gan, F. X., and Zhao, H. X.: Inclusions of black-green serpentine jade determined by Raman spectroscopy, Vib. Spectrosc., 66, 19–23, 2013.
Watenphul, A., Burgdorf, M., Schlüter, J., Horn, I., Malcherek, T., and Mihailova, B.: Exploring the potential of Raman spectroscopy for crystallochemical analyses of complex hydrous silicates: II. Tourmalines, Am. Mineral., 101, 970–985, 2016a.
Watenphul, A., Schlüter, J., Bosi, F., Skogby, H., Malcherek, T., and Mihailova, B.: Influence of the octahedral cationic-site occupancies on the framework vibrations of Li-free tourmalines, with implications for estimating temperature and oxygen fugacity in host rocks, Am. Mineral., 101, 2554–2563, 2016b.
Zazoff, P. (Ed.): Die antiken Gemmen – Handbuch der Archäologie, C.H. Beck'sche Verlagsbuchhandlung, Munich, Germany, ISBN 3406088961, 1983 (in German).