the Creative Commons Attribution 4.0 License.
the Creative Commons Attribution 4.0 License.
 | 24 May 2022
High-pressure homogenization of olivine-hosted CO2-rich melt inclusions in a piston cylinder: insight into the volatile content of primary mantle melts
Roxane Buso
Didier Laporte
Federica Schiavi
Nicolas Cluzel
Claire Fonquernie
Experimental homogenization of olivine-hosted melt inclusions representative of near-primary basic and ultrabasic magmas is a powerful approach to investigate the nature of their source regions and the melting conditions in Earth's mantle. There is growing evidence that the total CO2 contents of olivine-hosted melt inclusions may reach values of the order of a single to several weight percent, especially in intraplate continental basalts. To be able to homogenize melt inclusions with such high CO2 contents, we developed a technique allowing for heat treating of the melt inclusions under hydrostatic pressures up to 3–4 GPa in a piston cylinder, using thick-walled Au80–Pd20 containers and molten NaCl as the surrounding medium for the inclusion-bearing olivines. We applied this technique to olivine phenocrysts from Thueyts basanite, Bas-Vivarais volcanic province, French Massif Central. Thueyts melt inclusions were chosen because of their high CO2 contents, as indicated by up to 1.19 wt % dissolved CO2 in the glasses and by the presence of shrinkage bubbles containing abundant carbonate microcrystals in addition to a CO2 fluid phase. The homogenization experiments were conducted at pressures of 1.5 to 2.5 GPa, temperatures of 1275 and 1300 ∘C, and run durations of 30 min.
In all the melt inclusions treated at 2.5 GPa–1300 ∘C and half of those treated at 2 GPa–1300 ∘C, we were able to completely homogenize the inclusions, as indicated by the disappearance of the starting bubbles, and we obtained total CO2 contents ranging from 3.2 wt % to 4.3 wt % (3.7 wt % on average). In all the other melt inclusions (equilibrated at 1.5 or 2 GPa and 1300 ∘C or at 2.5 GPa–1275 ∘C), we obtained lower and more variable total CO2 contents (1.4 wt % to 2.9 wt %). In the inclusions with the highest total CO2 contents, the size of the shrinkage bubble was in most cases small (<5 vol %) to medium (<10 vol %): this is a strong argument in favor of an origin of these melt inclusions by homogeneous entrapment of very CO2-rich basanitic liquids (∼ 4 wt %) at pressures of 2 to 2.5 GPa. The lower total CO2 contents measured in some inclusions could reflect a natural variability in the initial CO2 contents, due for instance to melt entrapment at different pressures, or CO2 loss by decrepitation. An alternative scenario is heterogeneous entrapment of basanitic liquid plus dense CO2 fluid at lower pressures but still at least on the order of 1 GPa as indicated by dissolved CO2 contents up to 1.19 wt % in the glasses of unheated melt inclusions. Whatever the scenario, the basanites from the Bas-Vivarais volcanic province were generated in a mantle environment extremely rich in carbon dioxide.
- Article
(7920 KB) - Full-text XML
-
Supplement
(940 KB) - BibTeX
- EndNote


Melt inclusions are tiny volumes of melt (± immiscible fluid) trapped at depth within crystals growing in a magma. Once the inclusion is enclosed in the host crystal, it may be preserved from most of the changes affecting the magma until final cooling (e.g., Frezzotti, 2001). Thus, it provides very valuable information on the composition and physical state of the magma at the time of entrapment (e.g., Roedder, 1979; Frezzotti, 2001; Schiano, 2003; Kent, 2008; Métrich and Wallace, 2008; Audétat and Lowenstern, 2014; Esposito, 2021). In particular, melt inclusions are often the only way to characterize the initial volatile contents of magmas at depth (H2O; CO2; and S, F, or Cl species) because volcanic products at the surface are almost fully degassed.
Many changes may take place in a melt inclusion after its entrapment. The most common one is the formation of a shrinkage bubble during cooling (Fig. 1a–b), which is due to crystallization of the host mineral from the melt onto the inclusion walls and to the greater thermal contraction of the melt relative to its host mineral, among others. Upon cooling, the internal pressure of the inclusion decreases, so at some point the melt becomes saturated with a volatile phase, and a bubble nucleates (Roedder, 1979; Lowenstern, 1995). The shrinkage bubble can store a significant fraction of the volatiles initially dissolved in the melt; thus it is necessary to measure or calculate this fraction to restore the initial volatile content (e.g., Anderson and Brown, 1993; Hartley et al., 2014; Moore et al., 2015; Maclennan, 2017). Recent studies found that an average of 20 % to 90 % of the carbon dioxide initially dissolved in olivine-hosted melt inclusions is present as a fluid phase in the shrinkage bubbles (e.g., Hartley et al., 2014; Moore et al., 2015; Wallace et al., 2015; Tucker et al., 2019). In addition to the volatile species present in the fluid phase filling the shrinkage bubble, a significant amount of carbon and sulfur may also be stored in micro- or nanocrystals on the bubble walls, mainly carbonates, sulfides, and sulfates (Fig. 1c; Kamenetsky et al., 2002; Kamenetsky and Kamenetsky, 2010; Moore et al., 2015; Esposito et al., 2016; Robidoux et al., 2018; Venugopal et al., 2020; Schiavi et al., 2020).

Figure 1(a) Euhedral olivine phenocryst from Thueyts showing a large melt inclusion and a smaller one in its core and several small melt inclusions and embayments along its rims. (b) Zoom on the large melt inclusion showing the CO2-rich bubble and the characteristic shape of the Bas-Vivarais melt inclusions: the melt inclusion is an irregular polyhedron with rounded faces convex towards the interior of the inclusion. (c) Field-emission scanning electron microscope (SEM) microphotograph showing rhombohedral carbonate microcrystals on the bubble wall of a melt inclusion from Lac d'Issarlès, Bas-Vivarais (microphotograph taken by Dr. Letian Li with a Helios G4 PFIB CXe system at the Thermo Fisher Scientific NanoPort in Eindhoven, the Netherlands). Scale bars: 200 µm in (a), 50 µm in (b), and 2 µm in (c).
The mass of CO2 contained in the bubble and in the carbonate crystals must be added to the CO2 dissolved in the glass to reconstruct the bulk CO2 content in the inclusion at the time of entrapment. In the first studies (e.g., Anderson and Brown, 1993; Shaw et al., 2010; see also Wallace et al., 2015), computational methods were used to calculate the amount of CO2 in the bubble based on the bubble volume and on the assumption that bubble and melt were at equilibrium at the time of eruption. More recently, the mass of CO2 in the shrinkage bubble has been inferred from direct measurement of CO2 density by Raman spectroscopy (e.g., Esposito et al., 2011; Steele-MacInnis et al., 2011; Hartley et al., 2014; Moore et al., 2015; Aster et al., 2016). An alternative approach is to homogenize the olivine-hosted melt inclusion at high temperature and to analyze the CO2 dissolved in the glass after quenching. This has been done both at room pressure using a high-temperature heating stage (Wallace et al., 2015; Hanyu et al., 2020) and under pressure in an internally heated pressure vessel (300–500 MPa, Mironov et al., 2015) or in a piston cylinder (600 MPa, Hudgins et al., 2015; 500–800 MPa, Rasmussen et al., 2020). Hanyu et al. (2020) combined homogenization in a heating stage, X-ray microtomography to measure precisely the volumes of melt inclusions and bubbles (after heating), and Raman spectroscopy to measure CO2 density in bubbles. With these, they were able to estimate the total CO2 content in the inclusions with an error of ∼ 10 %. Most of the above studies were primarily concerned with the CO2 stored as a fluid in the shrinkage bubble. A first attempt to estimate the contribution of carbonate microcrystals to the bulk CO2 content of the melt inclusion was made by visual inspection of optical photomicrographs to obtain a rough estimate of the volume of carbonates (Moore et al., 2015). Recently, Schiavi et al. (2020) developed a novel application of Raman microtomography allowing for simultaneously identifying the microcrystals on the bubble walls and estimating their volumes along with the bubble volume. They showed that carbonates can occupy up to a third of the bubble cavity.
Although many olivine-hosted melt inclusions have CO2 contents of a thousand to a few thousand parts per million (e.g., Maclennan, 2017), there is a growing evidence that the total CO2 contents of melt inclusions may reach much higher values, on the order of a single to several weight percent (Naumov et al., 2003; Helo et al., 2011; Hudgins et al., 2015; Rasmussen et al., 2017; Hanyu et al., 2020; Schiavi et al., 2020), especially in ocean island basalts and to an even greater extent in intraplate continental basalts. These volatile-rich melt inclusions cannot be homogenized at ambient pressure with a heating stage (Schiavi et al., 2016; see also Rasmussen et al., 2020, and references therein). So to be able to homogenize melt inclusions with such high CO2 contents, we developed a technique allowing for heat treating olivine-hosted melt inclusions under hydrostatic pressures up to 3–4 GPa in a piston cylinder. Below we firstly present the details of the technique and then we show the results of an application to CO2-rich melt inclusions hosted in olivine phenocrysts in basanites from the Bas-Vivarais volcanic province (Ardèche, France).
2.1 Melt inclusion homogenization at high pressure: choice of the experimental configuration
The most conventional tool to homogenize melt inclusions is the microscope heating stage, in which the inclusion can be monitored continuously under the microscope during heating to determine precisely the homogenization temperature (e.g., Danyushevsky et al., 2002; Massare et al., 2002; Cannatelli et al., 2016). However, during heating at 1 atm, the increase in the internal pressure of the melt inclusion can overcome the strength of the host mineral and lead to its failure and to the decrepitation of the inclusion (Ferrero and Angel, 2018); plastic deformation and volumetric re-equilibration of the host mineral are also possible (e.g., Schiavi et al., 2016; Drignon et al., 2021). Even if the host mineral does not fail and the inclusion keeps its volatiles, heating at ambient pressure does not allow for the total homogenization of CO2-rich melt inclusions and the disappearance of the bubble. Different high-pressure techniques may be used to avoid decrepitation during homogenization of volatile-rich melt inclusions: gas pressure vessels, either externally heated (Student and Bodnar, 2004; Thomas et al., 2006) or internally heated (Skirius et al., 1990; Anderson et al., 2000; Mironov et al., 2015; Portnyagin et al., 2019); piston-cylinder apparatuses (Sparks and Mavrogenes, 2005; Perchuk et al., 2008; Bartoli et al., 2013, 2016; Cesare et al., 2015; Hudgins et al., 2015; Ferrero et al., 2018; Rasmussen et al., 2020; Lewis et al., 2021; see also Malaspina et al., 2006, for the case of solute-rich aqueous inclusions); and hydrothermal diamond anvil cells (Li and Li, 2014). The principle is to subject crystals containing unexposed melt inclusions to a confining pressure using a gas, a liquid, or a solid medium in order to balance the high internal pressure of the melt inclusion. Among these high-pressure techniques, only the hydrothermal diamond anvil cell allows for continuous, in situ observation of the changes that occur in the melt inclusion during heating and homogenization (Li and Li, 2014). In the other high-pressure techniques, the homogenized inclusions can only be observed after quenching. This drawback is to some extent compensated for by much larger volumes of the sample chamber (≥ 100 mm3 in gas pressure vessel and ∼ 10 mm3 in a piston cylinder vs. 0.1–1 mm3 in the hydrothermal diamond anvil cell), which allow for several melt inclusion-bearing crystals to be treated in a single experiment.
To homogenize CO2-rich magmatic inclusions in olivine phenocrysts, we chose a piston-cylinder apparatus rather than an internally heated pressure vessel (e.g., Mironov et al., 2015), because the latter is limited to pressures well below 1 GPa. The piston-cylinder technique offers excellent performance in pressure and temperature (3–4 GPa and up to 1500 ∘C and more), high quench rate, large sample chamber, and relative ease of use. Of the previous homogenization experiments in a piston cylinder, most have been applied to garnet-hosted melt inclusions in high-grade metamorphic rocks (e.g., Bartoli et al., 2013; Cesare et al., 2015; Ferrero et al., 2018) and only a few to basaltic melt inclusions in olivine (Hudgins et al., 2015; Rasmussen et al., 2020) or in plagioclase (Lewis et al., 2021). For our application, we opted for a new configuration, in which the olivine crystals are placed inside a thick-walled sample chamber and surrounded by molten NaCl to ensure a hydrostatic environment during the experiment (Fig. 2). This configuration is designed to meet the following specifications: protect crystals from non-hydrostatic stresses to prevent fracturing even at confining pressures of several GPa, avoid chemical contamination of the melt inclusions during the homogenization step, and allow for easy recovery of crystals after the experiment. Compared to previous studies, the main differences are (i) the use of a thick-walled, precious metal container (Fig. 2a) to minimize deformation of the sample chamber during the experiment and (ii) the choice of molten salt as matrix. In most previous experiments, thin-walled metal containers, or even just a graphite container (Hudgins et al., 2015), were used, and the matrix was a silicate powder, with or without added water: for example, silica powder in the case of garnet-hosted melt inclusions (Bartoli et al., 2013; Cesare et al., 2015) or basalt powder in the case of olivine-hosted melt inclusions (e.g., Mironov et al., 2015). Nevertheless, Perchuk et al. (2008), Rasmussen et al. (2020), and Lewis et al. (2021) have already used halide salts (NaCl, KBr, and CsI, respectively) as a matrix in their high-pressure homogenization experiments.
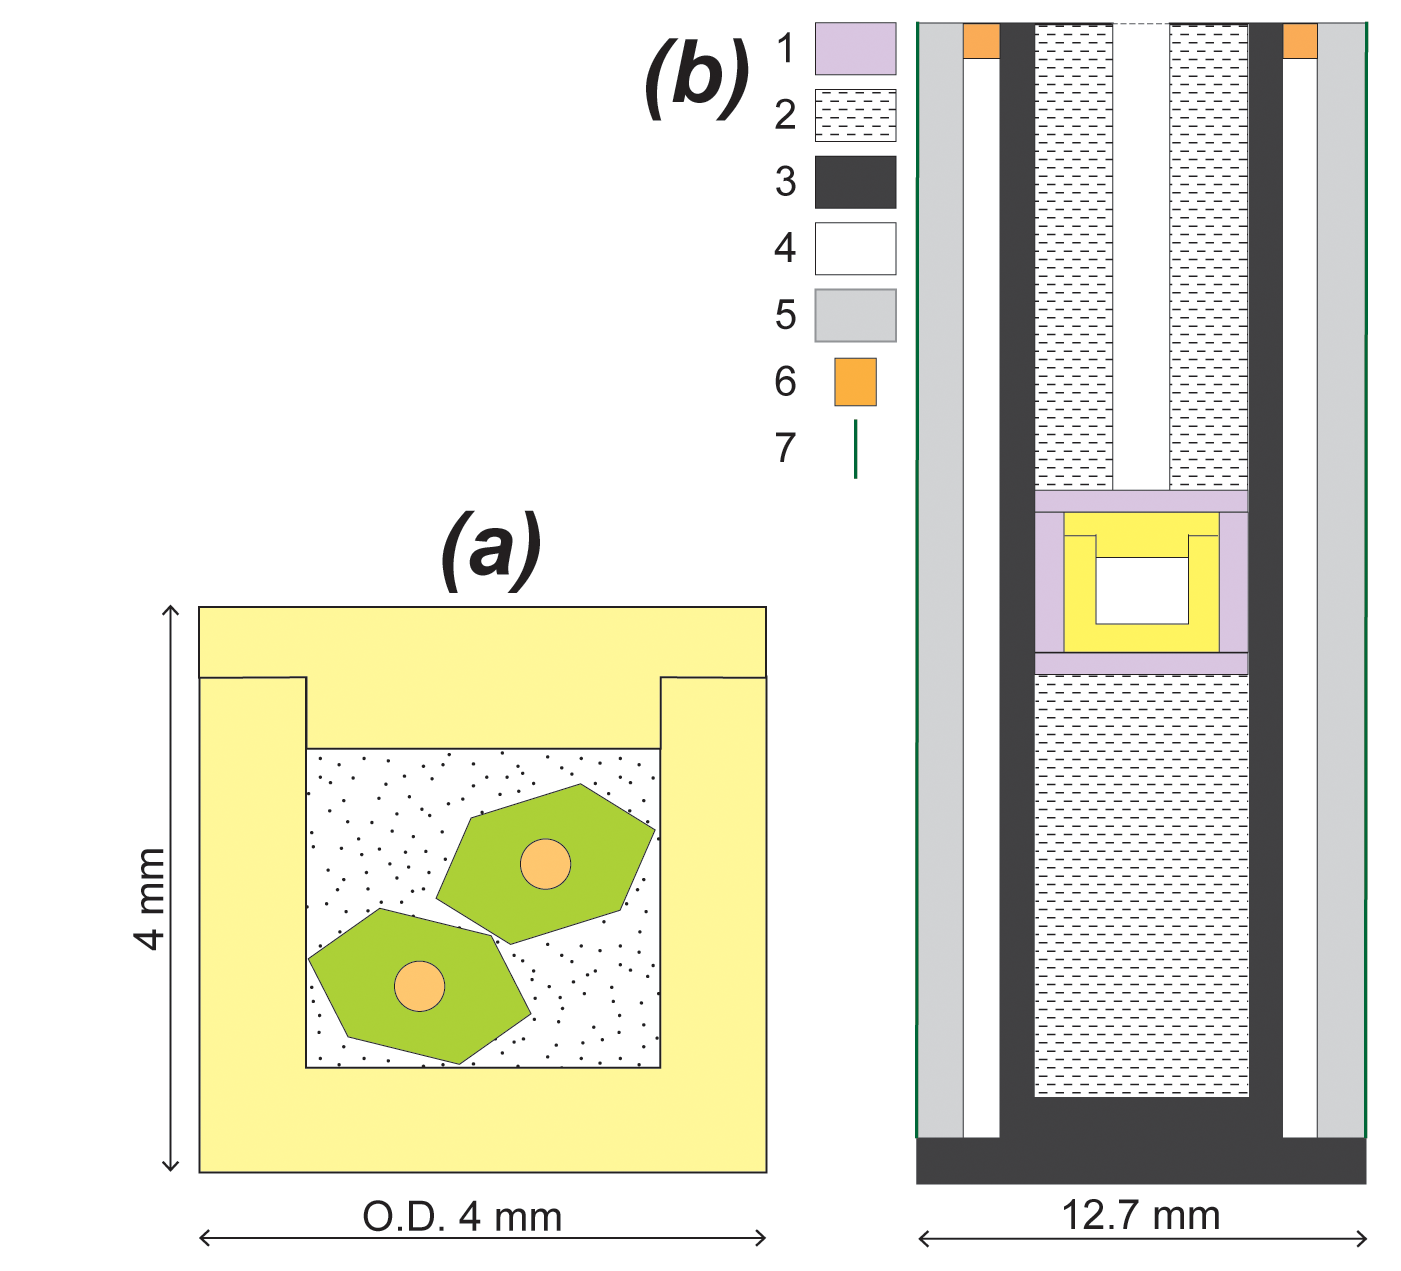
Figure 2(a) Two olivine phenocrysts are loaded in a thick-walled Au80–Pd20 container along with a mixture of NaCl and powdered olivine. The homogenization experiments are run at P–T conditions above the melting curve of sodium chloride, ensuring hydrostatic conditions inside the container. (b) Sketch of the in. piston-cylinder assembly: 1 – fired pyrophyllite, 2 – crushable MgO, 3 – graphite furnace, 4 – pyrex cylinder, 5 – NaCl cell, 6 – brass ring, and 7 – Teflon foil.
A sketch of the sample chamber is shown in Fig. 2a. It is composed of a thick-walled (∼ 0.75 mm) Au80–Pd20 container capped by a 1 mm thick lid. The inner diameter of the container is 2.5 mm. The sample chamber goes into a casing of fired pyrophyllite at the center of a in. piston-cylinder assembly (Fig. 2b). The thick walls of the capsule and the fired pyrophyllite are intended to minimize deformation of the capsule during the experiment. To ensure hydrostatic conditions for the olivine, the crystals are surrounded by a fluid medium during the experiment. Among the low-melting-point compounds used as solvents to grow large crystals of silicates in the flux-growth methods (PbO, V2O5, tungstates, molybdates, borates, alkali halides, etc.; Carlson, 1986; Skogby, 1999), we selected NaCl because the solubility of silicate components in alkali halides is much lower than in the other solvents (Carlson, 1986) and because sodium chloride is very easy to dissolve at the end of the experiments. Accordingly, the olivine phenocrysts in the homogenization experiments were surrounded by a mixture of 80 wt % reagent grade NaCl and 20 wt % powdered olivine (same composition as the phenocrysts). The purpose of adding small grains of olivine to NaCl was to minimize the amount of dissolution undergone by the large olivine crystals.
Olivine phenocrysts hosting melt inclusions were selected, prepared, and fully characterized before the experiment (see next section). Two phenocrysts, about 1200 µm long, were loaded in the Au80–Pd20 container along with the dry NaCl–olivine mixture. On average, the ratio of olivine (phenocrysts + powder) to olivine + NaCl is equal to 26 wt %. After loading, the thick lid was pushed into the borehole of the container using a bench vise. Finally, the lid and the container were welded together, and the whole was placed in the center of the piston-cylinder assembly.
2.2 Choice and preparation of the starting olivine phenocrysts
All the olivine phenocrysts used in this study were collected in basanitic tephras from the strombolian pyroclastic fallout of Thueyts volcano, Ardèche, France. This volcano belongs to the quaternary intraplate volcanic province of Bas-Vivarais, in the southeast of the French Massif Central (e.g., Nomade et al., 2016). Thueyts olivine phenocrysts have high forsterite contents (Fo > 85 %) and contain bubble-bearing, CO2-rich melt inclusions (Fig. 1a–b). Indeed quantitative characterization of volatiles by Raman microtomography yielded a total CO2 content in excess of 2 wt % in a melt inclusion from Thueyts (Schiavi et al., 2020). The high total CO2 content of Bas-Vivarais melt inclusions is due to the combination of a high level of dissolved CO2 in the glass phase of the melt inclusions (in excess of 1 wt %; see below), the presence of CO2 fluid in the bubbles, and the abundance of carbonate microcrystals on the bubble walls (Fig. 1c). The dominant carbonate phase is most often magnesian calcite, but dolomite or magnesite are dominant in some bubbles (as determined from the wavenumbers of the Raman modes; Perrin et al., 2016). Due to this high total CO2 content, all our attempts to homogenize Thueyts inclusions at room pressure and temperature up to 1230 ∘C failed: in no case was it possible to make the CO2 bubbles disappear (see Supplement and Table S4 for details on heating experiments at 1 atm). Accordingly, Thueyts melt inclusions are perfect candidates for homogenization at high pressures.
A population of olivine grains with melt inclusions was prepared for this study. Some grains were ground and polished to expose the inclusions at the surface in order to analyze the basanitic glasses before homogenization using electron probe microanalysis (major elements, S, Cl, and F) and Raman spectrometry (water and CO2). Olivine crystals (generally in the size range 650–1750 µm) hosting several melt inclusions far from any cracks and from the grain surface, not connected to the external melt, and randomly distributed were selected for the experiments. These melt inclusions are polyhedral; in general larger than 40 µm; and contain one or more bubbles (Fig. 1b), which occupy on average 8.6 (±1.0) vol % of the inclusion volume (from 3.3±0.7 vol % to 26.6±3.0 vol %). Before the experiment, the olivines were doubly polished to remove the surrounding glass and allow for clear observation of the melt inclusions inside. The melt inclusions and the bubbles were measured and photographed using an optical microscope.
2.3 Experimental techniques and run conditions
Our homogenization experiments cover pressure (P) and temperature (T) ranges of 1.5 to 2.5 GPa and 1275 to 1300 ∘C, respectively (see Table 1 for a summary of the experimental parameters); the run duration was 30 min in all the experiments. They can be separated into three groups. The first group corresponds to our standard experimental conditions (P=2.5 GPa, T=1300 ∘C, t=30 min), for which we observed a complete homogenization of the melt inclusions. The choice of 2.5 GPa was dictated by the need to be above the volatile saturation pressure of a basanitic melt that could contain up to 3 wt % CO2 or even more. To guide us in this choice, a first-order estimate of the solubility of CO2 in our basanitic composition was obtained using the models of Duan (2014) and Eguchi and Dasgupta (2018), considering a temperature of 1300 ∘C and pressures between 1.5 and 2.5 GPa. In the absence of water, Duan's model yields CO2 solubilities ranging from 2.0 wt % at 1.5 GPa to 2.7 wt % at 2.0 GPa and to 3.2 wt % at 2.5 GPa. Assuming 2 wt % dissolved water (close to the maximum water content measured in Thueyts melt inclusions: 1.94 wt %; Table 2), it yields slightly lower CO2 solubilities: 1.9 wt %, 2.6 wt %, and 3.0 wt % CO2 at 1.5, 2.0, and 2.5 GPa, respectively. The CO2 solubilities computed using the model of Eguchi and Dasgupta (2018) are significantly larger: 3.1 wt %, 4.5 wt %, and 5.9 wt % at 1.5, 2.0, and 2.5 GPa, respectively (assuming a molar ratio of = 0.19; Gaborieau et al., 2020). These larger values are in better agreement with the CO2 solubilities measured in low-silica alkaline magmas (Thibault and Holloway, 1994; Brooker et al., 2001). The CO2 solubility measured by Brooker et al. (2001) in a Ca-rich nephelinite and an Mg-rich nephelinite is equal to 4.1 wt % and 4.6 wt %, respectively, at 2 GPa–1400 ∘C. In the case of a tephrite close to our melt composition (SiO2: 44.1 wt %; CaO: 14.3 wt %; Na2O: 3.2 wt %; K2O: 3.5 wt %), Thibault and Holloway (1994) report CO2 solubilities equal to 4.5 wt % at 1.5 GPa–1300 ∘C and 6.2 wt % at 2 GPa–1350 ∘C. From this dataset, we estimate that it should be feasible to homogenize basanitic melt inclusions with 3 wt % to 4 wt % CO2 at 2.5 GPa and possibly even at 2 GPa. Regarding the temperature, our choice of 1300 ∘C is based on the temperature computed from the composition of unheated melt inclusions corrected for post-entrapment crystallization and their hosts (Table 2) using the olivine–liquid thermometer of Putirka et al. (2007) and assuming equilibrium at a pressure of 2.5 GPa.
Table 1Summary of experimental parameters (run duration was 30 min in all experiments). Cpx: clinopyroxene; Fo: forsterite; Ol: olivine.
a Mass ratio of olivine in the starting material; the mass of olivine includes the mass of the large olivine grains and the mass of olivine powder mixed with NaCl. b “Homogenization: total” means that all the melt inclusions were fully homogenized (bubble-free) at the end of the experiment. “Homogenization: partial ()” means that only two out of three melt inclusions were fully homogenized, with the third one containing a residual bubble at the end of the experiment. In run HOP no. 18 at 1275 ∘C, a daughter mineral (clinopyroxene) grew during the experiment. c In HOP no. 1, we used two olivine grains without melt inclusions (control experiment to evaluate the extent of olivine dissolution in molten NaCl). d HOP no. 4 is the only experiment in which we added some water to the mixture of NaCl and olivine powder in order to minimize water loss from the melt inclusions during high-pressure homogenization. The amount of added water was equal to 1.98 wt %, which corresponds to a ratio of equal to 2.97 wt %. e In HOP no. 16, the starting material was a cube of synthetic forsterite embedded in pure NaCl. The cube was cut in a piece of forsterite kindly provided by Kazuhiko Ito (Ito et al., 2003).
Table 2Glass compositions of unheated melt inclusions. The compositions are corrected from post-entrapment crystallization with the software MIMiC (melt inclusion modification corrections; Rasmussen et al., 2020), using a ratio of equal to 0.19 (Gaborieau et al., 2020).
a Oxide concentrations are given in weight percent. Major and minor elements are given after normalization to a total of 100 wt % (excluding volatile elements). “Σ EPMA” is the original analytical total of the electron probe microanalysis. b Volatile elements are given in parts per million (F, Cl, and S) or in wt % (H2O and CO2); “b.d.l.” stands for below detection limit. All the volatile elements are corrected using MIMiC, except F, which is not taken into account by the software. Fluorine was corrected so that the ratio of F incompatible elements after correction is equal to the ratio of F incompatible elements of the electron probe microanalysis. c “Total” equals the sum of major and minor oxides (Σ EPMA) plus the volatile elements. d The molar ratio of corresponds to the percentage of forsterite of the olivine (Ol-Fo) and the ratio of magnesium to iron in the glass of the melt inclusion (Mg#), where the total iron in the sample is considered Fe2+. e XOl is the percentage of olivine added to melt composition by the software MIMiC in the case of post-entrapment crystallization. f Average composition of unheated melt inclusions.
In the second group of experiments, the run parameters were varied one by one relative to their values in the standard experiments, with (i) three experiments at lower pressure (one at 1.5 and two at 2 GPa, at T=1300 ∘C), (ii) one experiment at lower temperature (1275 ∘C, at P=2.5 GPa), and (iii) one experiment with water added to the NaCl–olivine mixture to evaluate the effect on water loss in the melt inclusions (P=2.5 GPa, T=1300 ∘C).
The third group includes two experiments designed to evaluate the importance of the interactions between olivine and molten NaCl: HOP no. 1 is identical to the standard experiments (P=2.5 GPa, T=1300 ∘C, t=30 min), except that the two natural olivine crystals are devoid of melt inclusions; HOP no. 16 was done under the same P–T–t conditions but with a cube of synthetic forsterite in a matrix of pure NaCl. The purpose of these two experiments was to verify that the amount of olivine dissolved in the molten salt is small and to determine the reaction of olivine dissolution.
Target pressure and temperature, for instance 2.5 GPa and 1300 ∘C, were reached in three steps: (1) pressurization to 300 MPa at room temperature, (2) heating to 900 ∘C and pressurization to 400 MPa in ∼ 18 min, and (3) heating to target T at 25 ∘C min−1 and simultaneous pressurization to target P at ∼ 100 MPa min−1. After 30 min at the target P and T (homogenization step), the experiments were terminated by shutting off the power of the apparatus, resulting in an average quench rate of 160 ∘C s−1 over the first 600 ∘C. From the end of step 2 to the end of the homogenization step, the P–T conditions were at all times above the melting curve of sodium chloride (from 801 ∘C at ambient pressure to 1227 ∘C at 2.5 GPa; Akella et al., 1969), ensuring hydrostatic conditions inside the container. At the end of the experiment, the container was slightly shortened and deformed into a barrel. The lid was cut off, and the salt was dissolved in water to recover the olivine crystals.
We describe below the main techniques used to characterize the melt inclusions before and after high-pressure (HP) homogenization: electron microprobe analysis and Raman spectroscopy. In addition to these techniques, we used CHNS elemental analysis and Fourier-transform infrared spectroscopy (FTIR) to measure the volatile contents of two new basanitic reference glasses that were synthesized to complete our set of standards for quantification of H2O and CO2 by Raman spectroscopy. These two techniques are detailed in the Supplement.
3.1 Electron microprobe analysis (EMPA)
Melt inclusions, homogenized or not, and their host olivines were analyzed for major and volatile (Cl, F, and S) elements with a CAMECA SXFive-TACTIS electron microprobe using a 15 kV accelerating voltage. Major elements analyses of olivine were performed with a 1 µm diameter focused beam and a current of 15 nA, whereas melt inclusions were analyzed using a defocused beam of 5–10 µm diameter and a current of 4–8 nA. Volatiles were measured with a 5 µm beam size and a 40 nA current (Rose-Koga et al., 2020) after all other analyses have been performed.
The raw compositions obtained by EMPA are given in the Supplement (Tables S2 and S3). The compositions listed in Tables 2 and 3 have been corrected for post-entrapment crystallization (PEC) or post-entrapment dissolution (PED) of the host olivine: PEC (or more rarely PED) occurs after melt entrapment in response to changing physicochemical conditions in the magma during ascent and eruption (Sobolev, 1996; Danyushevsky et al., 2002) or due to olivine–liquid exchanges that may occur at the end of the experiments during quench. In the case of PEC, a layer of olivine crystallizes at the expense of the liquid along the inclusion walls (or a layer of olivine is dissolved in the liquid in the case of PED), resulting in significant changes in the major element compositions of the liquid, in particular its Fe and Mg contents. In this study, melt inclusion compositions were corrected for PEC/PED using the software MIMiC (Rasmussen et al., 2020). The correction involves adding increments of olivine back into the liquid until the Fe–Mg partition coefficient between olivine and liquid, KD, reaches the equilibrium value (calculated using the model of Toplis, 2005). The software MIMiC applies an iterative correction requiring as input data the major element composition of the melt, its S, Cl, H2O, and CO2 contents; the forsterite content of the host olivine; and the oxidation state of the melt. For the latter, we used an oxygen fugacity of +1 log unit relative to the quartz–fayalite–magnetite oxygen reference buffer (ΔQFM + 1), as determined by Jannot et al. (2005) for the Chaîne des Puys, another volcanic province of French Massif Central. In addition to the corrected major element composition of the melt, the output data include the degree of post-entrapment crystallization or melting. All the natural melt inclusions from Thueyts experienced PEC, with a degree comprised between 2.8 % and 11.8 % (7.3 % on average). In the case of the compositions measured in the homogenization experiments, MIMiC output is PEC for eight inclusions, and PED is output for the other five, with ranges from 3.0 % olivine crystallization to 3.7 % olivine dissolution (0.5 % crystallization on average). It is possible that the natural melt inclusions have suffered some Fe loss. We cannot evaluate to what extent, however, because the FeO content of bulk rocks in the Bas-Vivarais volcanic province is biased by systematic contamination by crustal and mantle xenocrysts.
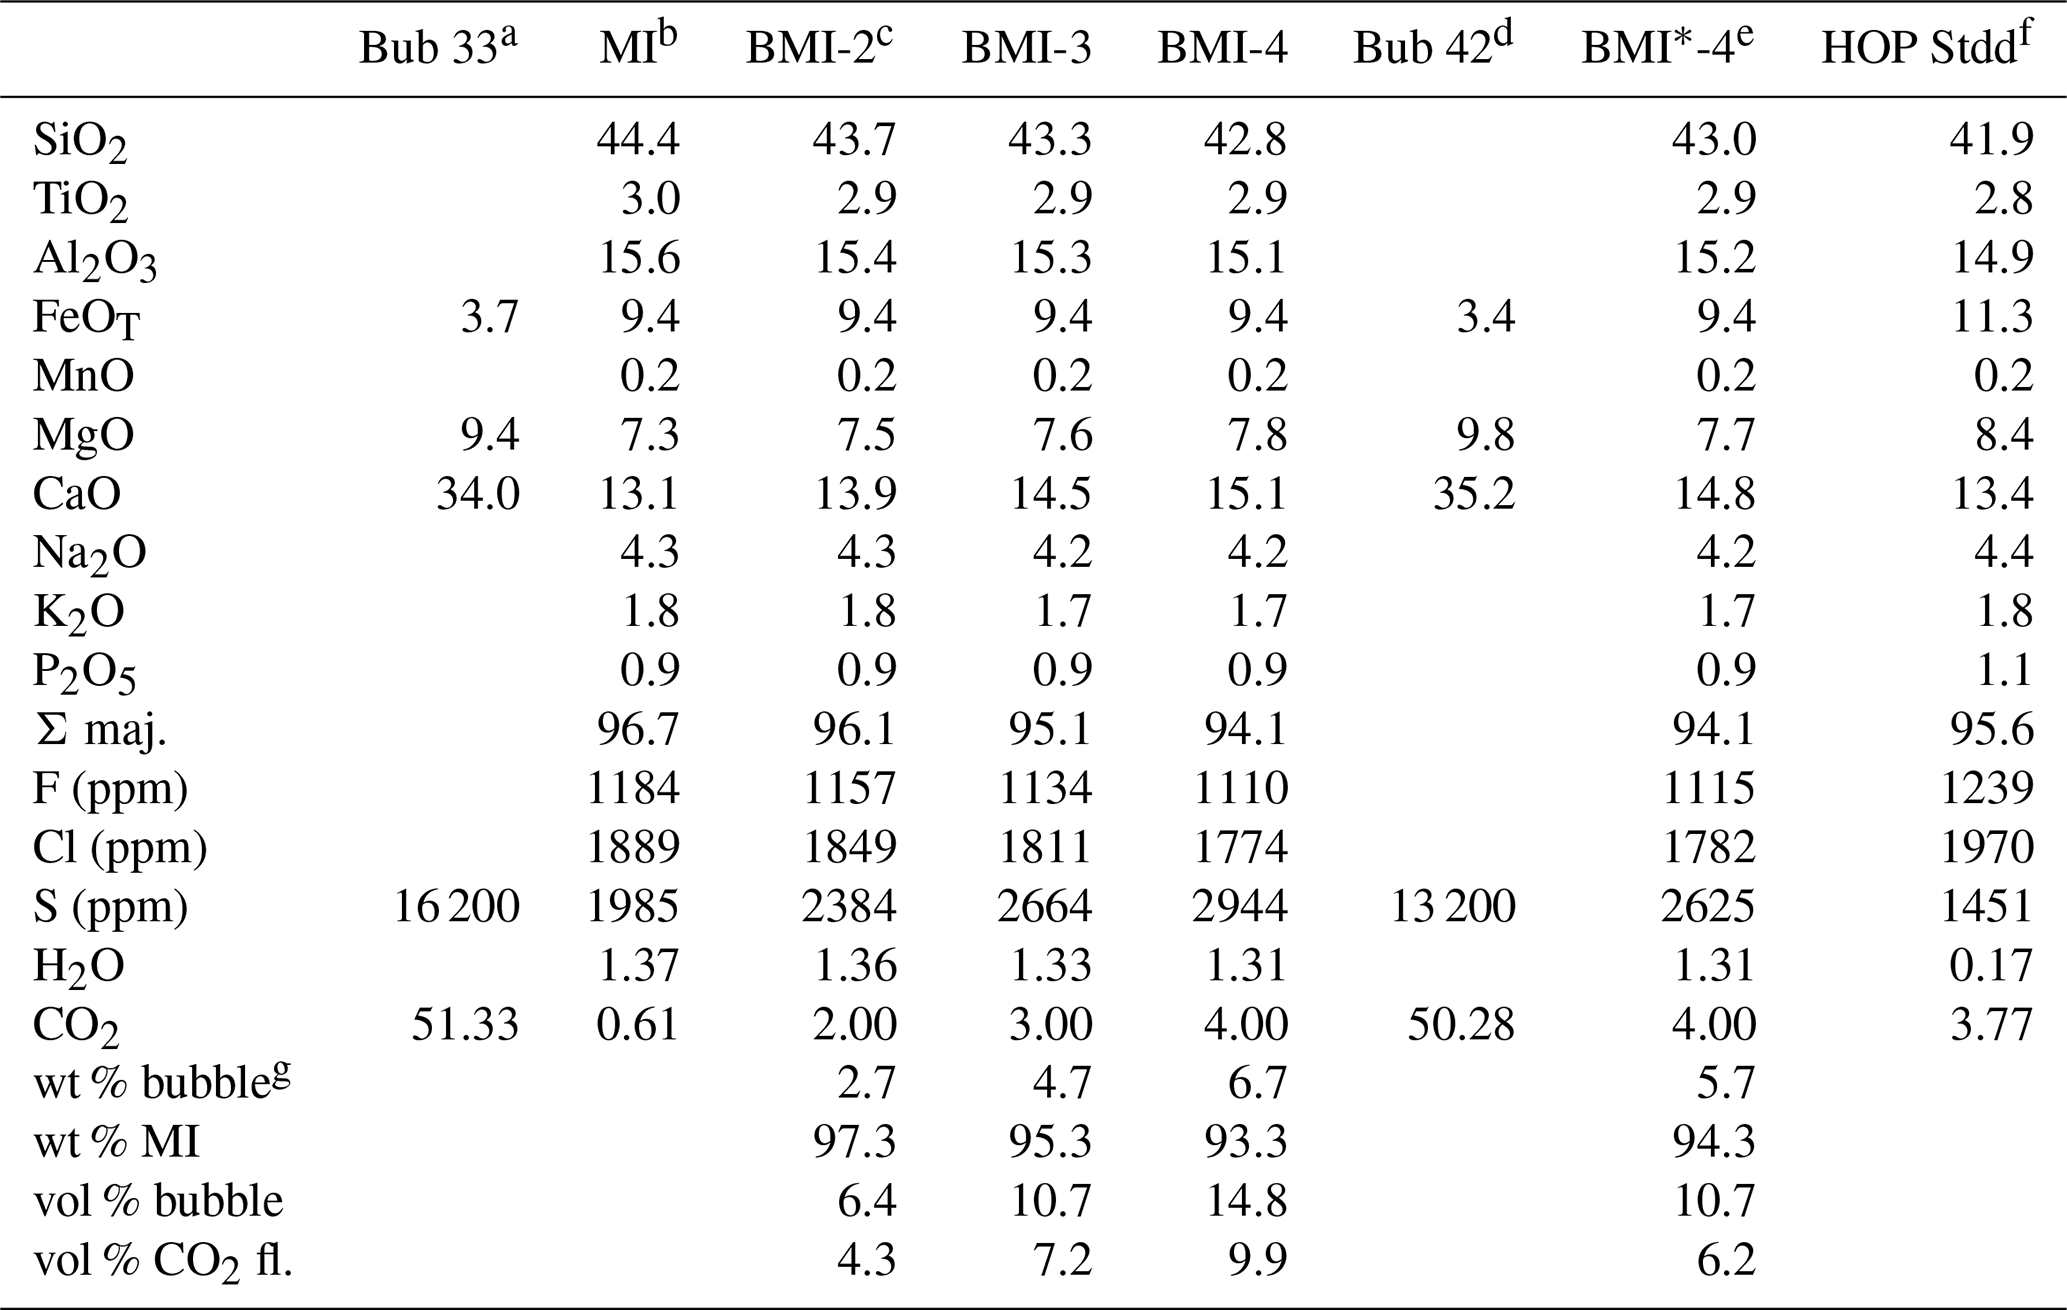
Table 3Glass compositions of melt inclusions after high-pressure homogenization experiments. The compositions are corrected from post-entrapment crystallization or olivine dissolution with the software MIMiC (Rasmussen et al., 2020), using a ratio of equal to 0.19 (Gaborieau et al., 2020).
a Run conditions: “Stdd”, standard conditions (2.5 GPa–1300 ∘C, no added water); “+ H2O”, 2.5 GPa–1300 ∘C with added water; “1.5 GPa”, 1.5 GPa–1300 ∘C; “2.0 GPa”, 2.0 GPa–1300 ∘C; “1275 ∘C”, 2.5 GPa–1275 ∘C. b Oxide concentrations are given in weight percent. Major and minor elements are given after normalization to a total of 100 wt % (excluding volatile elements). “Σ EPMA” is the original analytical total of the electron probe microanalysis. c Volatile elements are given in parts per million (F, Cl, and S) or in weight percent (H2O and CO2); “b.d.l.” stands for below detection limit. All the volatile elements are corrected using MIMiC, except F, which is not taken into account by the software. Fluorine was corrected so that the ratio of F incompatible elements after correction is equal to the ratio of F incompatible elements of the electron probe microanalysis. d “Total” equals the sum of major and minor oxides (ΣEPMA) plus the volatile elements. e Ol-Fo is the percentage of forsterite of the olivine after experiment, defined as the molar ratio of . f XOl is the percentage of olivine added to or subtracted from melt composition by the software MIMiC: olivine is added (positive figures) in the case of post-entrapment crystallization; olivine is subtracted from the melt composition (negative figures) to correct for the effect of olivine dissolution. f “Average Stdd” corresponds to the average values of the melt inclusions homogenized under standard conditions (2.5 GPa–1300 ∘C).
3.2 Raman spectroscopy
Water and CO2 contents of the glass inclusions and their bubbles were measured in back-scattered geometry using a Renishaw inVia confocal Raman micro-spectrometer equipped with a 532.1±0.3 nm diode laser (180 mW output power), a CCD (charge-coupled device) detector of 1040×256 pixels, a Rayleigh rejection edge filter, and a Leica DM2500 M optical microscope with a motorized XYZ stage. Daily calibration of the spectrometer was performed using a silicon standard (520.5 cm−1 peak). During analysis, a grating of 2400 grooves mm−1, a ×100 microscope objective (numerical aperture = 0.9), a 20 µm slit aperture (high-confocality setting), and a 3 mW laser power on the sample were used. Under these analytical conditions, the spectral resolution was ∼ 0.5 cm−1, while the lateral and vertical spatial resolutions were, respectively, 1 µm and 2–3 µm near the sample surface. The spectra of the glass were recorded using the WiRE™ 4.4 (Windows-based Raman Environment) software in the wavenumber ranges from ∼ 100 to 1350 cm−1 (aluminosilicate network region) and from ∼ 2900 to 3800 cm−1 (water region) for eight cycles of 30 s. For the analysis of the CO2 bubbles present in unheated melt inclusions and in two inclusions homogenized at medium pressure, the spectra were acquired in the ∼ 200–1400 cm−1 range for four cycles of 15 s. The Raman spectra measured in some inclusions are contaminated by the signal of the host crystal. To correct for this effect, we subtracted the purely olivine spectrum (measured in the same analytical conditions as for the melt inclusions) from the glass spectra.
For quantification of H2O and CO2 in glasses, five basanitic reference glasses with known CO2 and H2O contents (Schiavi et al., 2018) were used as external standards and analyzed several times during each session using the same analytical conditions. In order to extend the calibration to the highest CO2 concentrations measured in studied glass inclusions, two more basanitic reference glasses with higher CO2 contents were synthesized (BSN150121 and BSN210121, with 3.69 wt % and 4.46 wt % CO2, respectively; see Table S1 in the Supplement). Basanite powder was loaded along with the required amount of oxalic acid dihydrate, (COOH)2 ⋅ 2H2O, in thin-walled Au80–Pd20 capsules. After welding, the capsules were subjected to P = 2.5 GPa and T=1390 ∘C for 3 h in an end-loaded piston cylinder and then quenched.
The water content in the polished inclusion glasses was determined at 1 µm depth following the method described by Schiavi et al. (2018). This method uses both an external calibration, based on the absolute intensities of the water band compared to that of the reference glasses, and an internal calibration, which normalizes the intensity of the water band to the area of the bands in the silicate network region. The areas of the water and silicate bands were determined after subtraction of a cubic and a multi-linear baseline, respectively, using PeakFit© software.
For determination of the CO2 content of the inclusion glasses, first Long's correction was applied to the raw data of the silicate band (Long, 1977), then a cubic baseline was subtracted from spectra fixing two peak-free anchor intervals at 100–250 and 1160–1350 cm−1. The spectra of the glasses show three bands: a low-frequency band (200–625 cm−1), a middle-frequency band (625–830 cm−1), and a high-frequency band (830–1200 cm−1). The dissolved CO in the glass phase produces a peak near 1083 cm−1, whose intensity increases with the CO2 content (Morizet et al., 2013). We performed spectral peak fitting using WiRE™ 4.4 software, in order to identify and quantify the spectral components of the silicate band. The entire spectrum was fitted with 10 Gaussian components (9 for the silicate band and 1 for the CO peak) using a multiple-peak fit tool and following the method described by Morizet et al. (2013). This method consists of several steps. (i) The number of components is determined. The number of 10 components was chosen because it gave the best fit quality (expressed as chi-square, χ2): tests with either more or fewer components resulted in poorer quality fits with higher values of χ2. (ii) A first set of iterations is executed in which peak positions and full widths at half maximum (FWHM) are fixed until χ2 remains stable on a minimum value. (iii) A second set of iterations is performed with peak positions, FWHM, and heights left free to evolve until the best fit (i.e., the lowest χ2) is attained. The 10 components best fitting the samples and reference glasses have the following positions (Fig. S1 in the Supplement): (I) 422 cm−1 on average (400–458 cm−1, minimum and maximum, respectively), (II) 512 cm−1 (489–528 cm−1), (III) 580 cm−1 (574–587 cm−1), (IV) 725 cm−1 (686–768 cm−1), (V) 797 cm−1 (780–825 cm−1), (VI) 880 cm−1 (842–895 cm−1), (VII) 958 cm−1 (872–976 cm−1), (VIII) 1009 cm−1 (970–1033 cm−1), (IX) 1098 cm−1 (1028–1133 cm−1), and (X) 1085 cm−1 (1081–1088 cm−1). Component X corresponds to the CO peak.
The CO2 concentration of unknown glass samples was obtained from an independent linear relationship between the relative area of the CO peak and the CO2 concentration of the known reference glasses measured by CHNS elemental analysis and FTIR spectroscopy (see Table S1). The calibration line (Fig. 3) providing the best fit (R2=0.987) is
where AcompX is the area of the CO peak and Atot is the entire area of the silicate and carbonate bands.
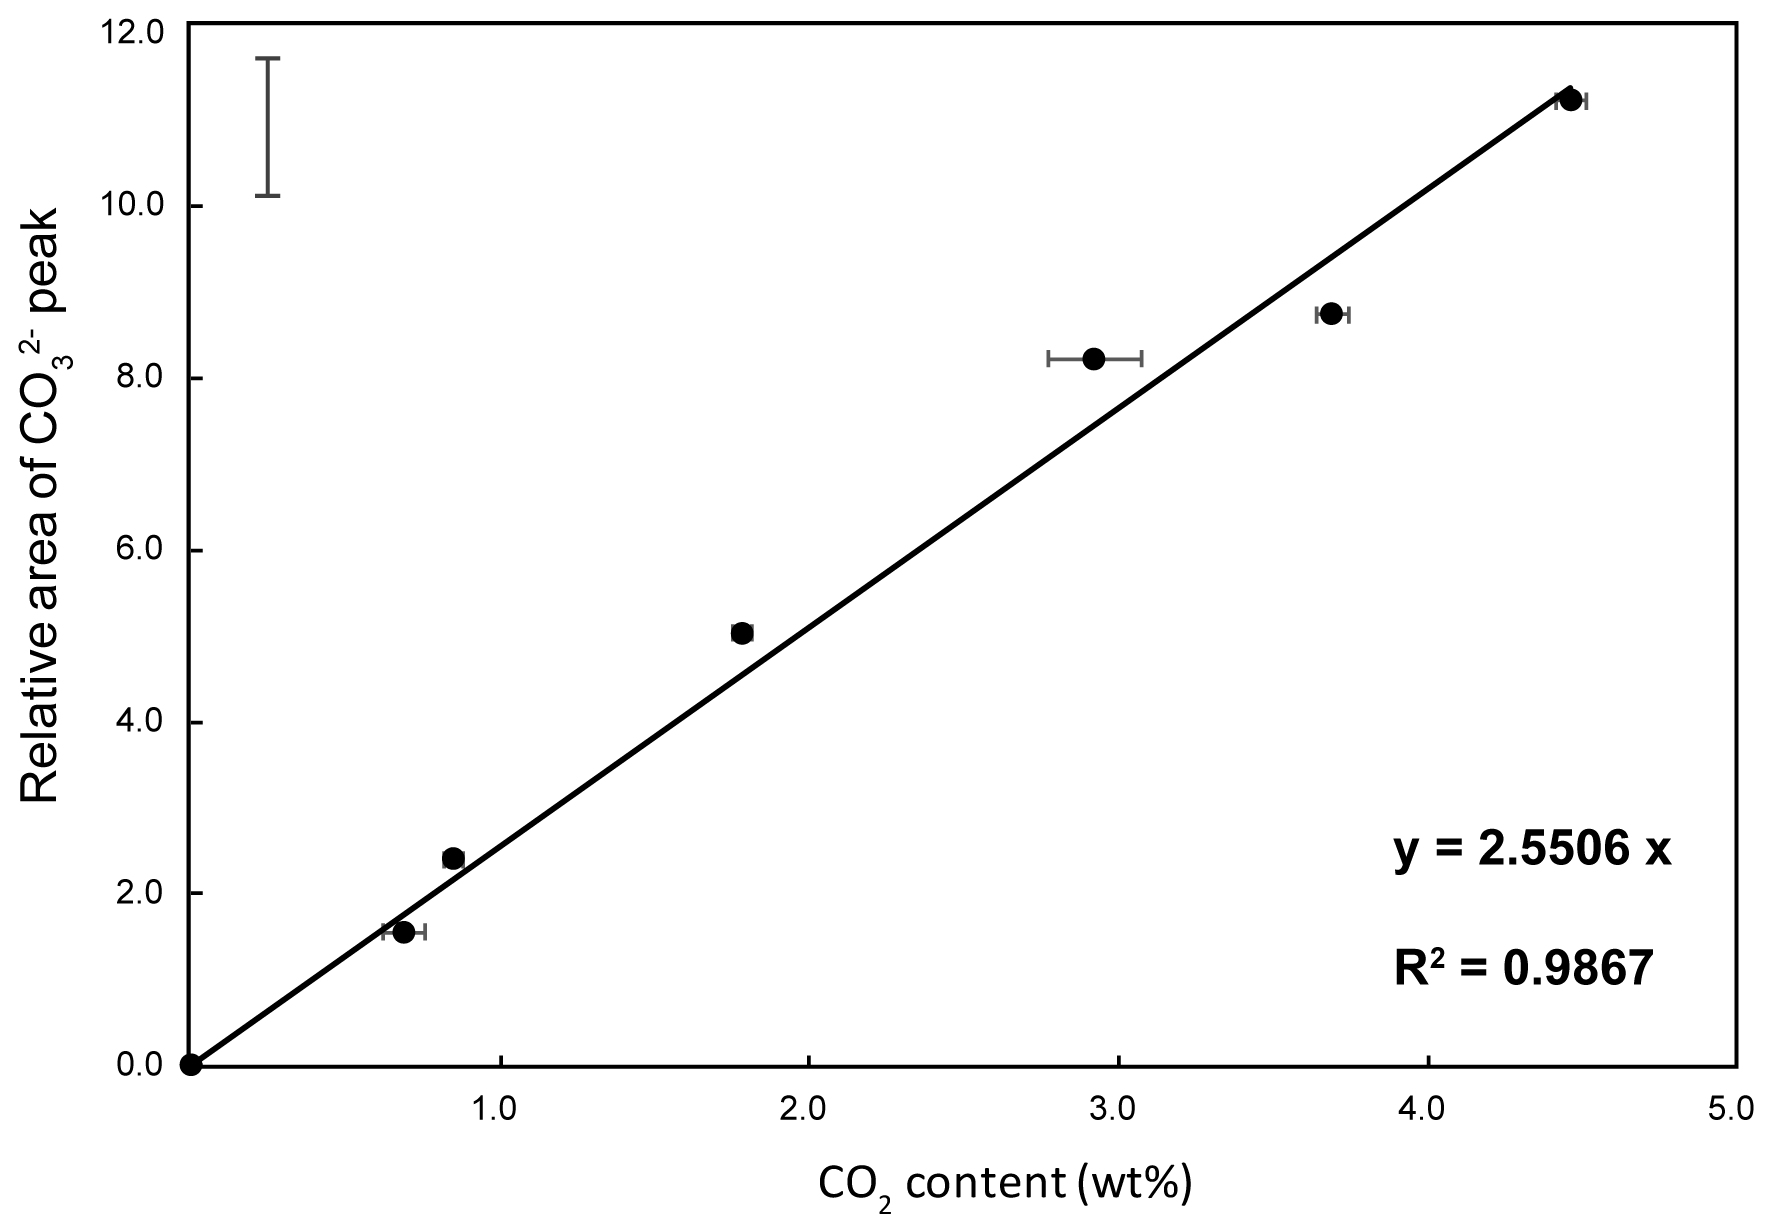
Figure 3Raman calibration line: plot of the relative area of the CO peak of the Raman spectra ( in Eq. 1) as a function of the CO2 concentration of the reference glasses. The error bar represents the 95 % confidence interval.
In line with the results of Morizet et al. (2013), we found that precise assignment of each Gaussian component to specific structural units of the glass is not essential for our calibration, since this is built on the ratio. Nonetheless, we highlight that the number and positions of the components resulting from the fitting are in good agreement with previous studies (Morizet et al., 2013, and references therein). Moreover, Long's correction (Long, 1977) amplifies the intensity of the bands at higher frequencies, including the CO peak, compared to the low-frequency bands, which facilitates fitting the spectra around the CO peak. Noticeably, the FWHM of the CO peak is 43–44 cm−1 for the reference glasses and ranges from 38 to 44 cm−1 in the studied samples; this is consistent with observations by Morizet et al. (2013).
4.1 Composition of Thueyts melt inclusions
Analyses of 10 unheated melt inclusions (corrected for PEC) are reported in Table 2 (see Table S2 for the raw data). All melt inclusions have undergone post-entrapment crystallization to a variable degree: from 2.8 % to 11.8 %. Thueyts melt inclusions have a basanitic composition, with a restricted range of oxide concentrations: 43.7 wt %–44.8 wt % SiO2, 6.1 wt %–8.1 wt % MgO, 8.5 wt %–10.6 wt % FeOT, 11.8 wt %–14.1 wt % CaO, 14.9 wt %–17.3 wt % Al2O3, 3.8 wt %–4.8 wt % Na2O, 1.5 wt %–2.2 wt % K2O, and 2.6 wt %–3.8 wt % TiO2. Basanites are the typical rock types of the Bas-Vivarais volcanic province (Rochette et al., 1993) and are interpreted as near-primary magmas ascending rapidly from mantle depths to Earth's surface without any significant chemical differentiation in the crust.
The melt inclusions are rich in volatiles, in particular in CO2. The ranges of volatile concentrations measured in the glass phase of the inclusions are as follows: from < 0.20 wt % to 1.19 wt % CO2, from 1.01 wt % to 1.94 wt % H2O, from 1291 to 2683 ppm S, from 1481 to 2098 ppm Cl, and from 1038 to 1376 ppm F. Although such elevated CO2 concentrations have rarely been documented in the glass phase of melt inclusions, they represent only a small part of the total amount of CO2 in Thueyts inclusions. Indeed, Schiavi et al. (2020) estimated that 66 % of the total CO2 in a melt inclusion from Thueyts was stored in the bubble as CO2 fluid and as carbonate microcrystals along the bubble walls (Fig. 1c) and that the total CO2 was larger than 2 wt %. In addition to carbon, 20 % of the sulfur is stored in the bubbles as sulfide microcrystals.
For two unheated melt inclusions, we computed the mass of CO2 vapor contained in the bubble by multiplying the bubble volume by the CO2 density. The later was measured by Raman spectroscopy using the relationship between the Fermi diad split and CO2 density (Song et al., 2009). By adding the CO2 vapor and the CO2 in the glass, we obtain 2.02 wt % and 2.69 wt % CO2 (Table S2). These are minimum values because we did not take into account the CO2 stored in the carbonates, but they confirm the abundance of CO2 in the Bas-Vivarais melt inclusions.
4.2 Interactions between olivine and NaCl at high pressure and temperature
After NaCl dissolution at the end of the experiments, some grains come out intact, while others are broken into a few pieces. The intact grains are covered by a crust of prismatic crystals that is characteristic of the chemical interactions between olivine and the NaCl matrix (Fig. 4a). In the broken grains, the fractures show smooth olivine surfaces devoid of crust, indicating that fracturing occurred late, during quench and unloading or during capsule opening. The olivine grains were doubly polished to remove the crust and to expose the homogenized melt inclusions. Some melt inclusions observed before experiments were lost during polishing or because of fracturing of the grains during decompression and unloading of the piston-cylinder experiment.

Figure 4(a) SEM photograph of one of the olivine grains recovered at the end of experiment HOP no. 4 after NaCl dissolution: the grain is intact, and its surface is fully covered by a crust of prismatic crystals (mostly orthopyroxene). (b) SEM photograph of the forsterite parallelepiped at the end of experiment HOP no. 16: the crystal is practically unchanged from its original form and is partially covered by orthopyroxene needles. The crystal broke at the end of the experiment, which explains the conchoidal fracture surface on the lower side of the image. (c) Zoom showing the orthopyroxene needles partially covering the surface of the forsterite crystal (run HOP no. 16). Scale bars: 500 µm in (a), 400 µm in (b), and 90 µm in (c).
The scanning electron microscopy (SEM) photograph in Fig. 4a shows an intact olivine grain, 2 mm long, recovered at the end of experiment HOP no. 4. The olivine itself is not visible, as it is covered by a crust of crystals welded together by films and patches of interstitial silicate glass. The most abundant crystals are elongated prisms of orthopyroxene. In addition to orthopyroxene, some clinopyroxene and oxide grains were also observed. The growth of orthopyroxene, which is absent in the starting material, indicates a process of incongruent dissolution of olivine during the reaction with molten salt. In experiment HOP no. 4, some water was added to the mixture of NaCl + olivine powder (Table 1), resulting in enhanced interactions between olivine and molten salt. In other experiments under the same conditions but without added water (such as HOP no. 1), the crust is less developed but is also characterized by the predominance of orthopyroxene rods.
In experiments with natural olivines, the interactions between the mineral and the molten salt are made more chemically complex because of the presence of some basaltic glass on the starting olivine crystals. This is why we performed an experiment with a forsterite parallelepiped in pure NaCl (HOP no. 16; Table 1). The SEM photographs in Fig. 4b–c show that the parallelepiped remains practically unchanged from its original shape at the end of the experiment and that it is partially covered by orthopyroxene needles. Orthopyroxene presumably results from incongruent dissolution of forsterite according to the following reaction:
where the subscripts salt and xl stand for molten salt and crystalline silicates, respectively, and most of the sodium oxide is expected to be dissolved in the molten salt (e.g., Kimura, 2011; Sheikh, 2016) and some in the orthopyroxene. The fact that the dimensions and shape of the parallelepiped hardly change during the experiment and the absence of rounding at the edges and corners (Fig. 4b) demonstrate that the degree of dissolution of forsterite is negligible. This observation supports the choice of molten NaCl as a matrix for HP homogenization of melt inclusions hosted in Mg-rich olivines and suggests that the addition of small grains of olivine to NaCl to minimize the amount of dissolution undergone by the large olivine crystals is not necessary.
4.3 Homogenization experiments: textures and phase assemblages
4.3.1 Homogenization experiments at 2.5 GPa–1300 ∘C–30 min
All experiments at 2.5 GPa–1300 ∘C gave consistent results and ended in successful homogenization of the starting melt inclusions. Photographs of a melt inclusion before and after experiment HOP no. 3 (2.5 GPa–1300 ∘C, no added water; Table 1) are shown in Fig. 5a–b. Overall, the shape and size of the inclusions remain almost unchanged after homogenization. In particular, the melt inclusion in Fig. 5a–b maintains the same polyhedral shape during the experiment. In most cases, we lacked well-defined reference points so that it was not possible to make very precise measurements of length before and after the experiment (Table S3). As illustrated in Fig. 5b, the main change in the experiments at 2.5 GPa–1300 ∘C is the complete disappearance of the bubble, with the whole volume of the inclusion being occupied by glass (plus one or a few small grains of sulfide in most experiments; Fig. 5b and Table S3). This suggests that all the CO2 initially stored in the bubble has been dissolved in the silicate liquid. The experiment at 2.5 GPa–1300 ∘C with added water (HOP no. 4) also resulted in complete homogenization of the melt inclusions and total resorption of bubbles.
4.3.2 Effect of temperature
The choice of 2.5 GPa and 1300 ∘C as standard P–T conditions for our homogenization experiments is supported by the results of experiments at lower pressure or temperature. The effect of a lower temperature is illustrated by experiment HOP no. 18, which was conducted at P = 2.5 GPa and T = 1275 ∘C instead of 1300 ∘C. In this experiment, the melt inclusion partially crystallized, resulting in a significant change in the composition of the liquid phase (see below). In addition to olivine, the new mineral phase that grew at 1275 ∘C is clinopyroxene (see Fig. S2). No bubble was observed at the end of this experiment.
4.3.3 Effect of pressure
Three runs were conducted at a pressure lower than 2.5 GPa: HOP no. 13 and HOP no. 20 at 2.0 GPa and HOP no. 10 at 1.5 GPa. Unlike the experiments at 2.5 GPa, melt inclusions in the experiments at 1.5 or 2 GPa show contrasting behaviors. Indeed, in the same run, we can observe inclusions with a residual bubble characteristic of an incomplete homogenization and inclusions without a bubble. The first case is illustrated in Fig. 5c–d, which shows a melt inclusion before and after the experiment at 1.5 GPa–1300 ∘C (HOP no. 10): a CO2 bubble smaller than the initial bubble is still present at the end of the experiment. The two other inclusions heat-treated at 1.5 GPa–1300 ∘C were completely homogenized (that is, bubble-free; Table S3). At the end of the experiments at 2 GPa, four out of five inclusions were completely homogenized, but the last one still had a bubble, which was filled by a dense CO2 phase (0.91 g cm−3). Unlike the bubbles before homogenization, the bubbles remaining after the experiments are devoid of carbonate microcrystals along their walls.
4.3.4 Cases of leaking melt inclusions
In most experiments, at least one melt inclusion was destroyed or did not behave as a closed system during HP homogenization. This is due to fracturing of the olivine phenocrysts during the preparation stage, the loading stage, or the high-temperature stage of the experiment. The most obvious case of failure corresponds to melt inclusions that show visual signs of decrepitation (e.g., planes of inclusions in the adjacent olivine) and/or chemical evidence of contamination by the molten salt, with Cl and Na2O contents that may exceed 3 wt % and 9 wt %, respectively. More rarely, especially in the experiments at 1.5 GPa (see below), we suspect that some melt inclusions may have lost part of their volatile components even though there is no visual evidence of decrepitation or chemical evidence of NaCl contamination. To minimize the risk of leaking melt inclusions during HP homogenization, only robust olivine phenocrysts should be retained for experiments, i.e., those that are of sufficient size, that are free of visible defects, and that contain a melt inclusion or a small number of melt inclusions well in the center.
4.4 Compositions of homogenized melt inclusions: major elements, F, Cl, and S
4.4.1 Homogenization experiments under standard conditions (2.5 GPa–1300 ∘C; no added water)
The compositions of homogenized melt inclusions are reported in Table 3 and illustrated in Figs. 6 and 7. Melt inclusions homogenized under our standard conditions are characterized by low analytical totals (94.7 wt % on average) and have basanitic compositions with 41.9 wt % SiO2, 8.4 wt % MgO, 11.3 wt % FeOT, 4.3 wt % Na2O, and 1.8 wt % K2O (oxide concentrations are given after correction and normalization to 100 wt % of the sum of the major elements). Compared to unheated melt inclusions, the compositions after homogenization at 2.5 GPa–1300 ∘C (no added water) are significantly enriched in MgO and FeOT and depleted in SiO2 (Fig. 6). The average F and Cl contents (∼ 1230 and 1950 ppm, respectively) are comparable to the F and Cl contents in the unheated inclusions (Fig. 7a). The similarity of chlorine and Na2O contents before and after homogenization demonstrates the absence of contamination of the melt inclusions by molten salt.
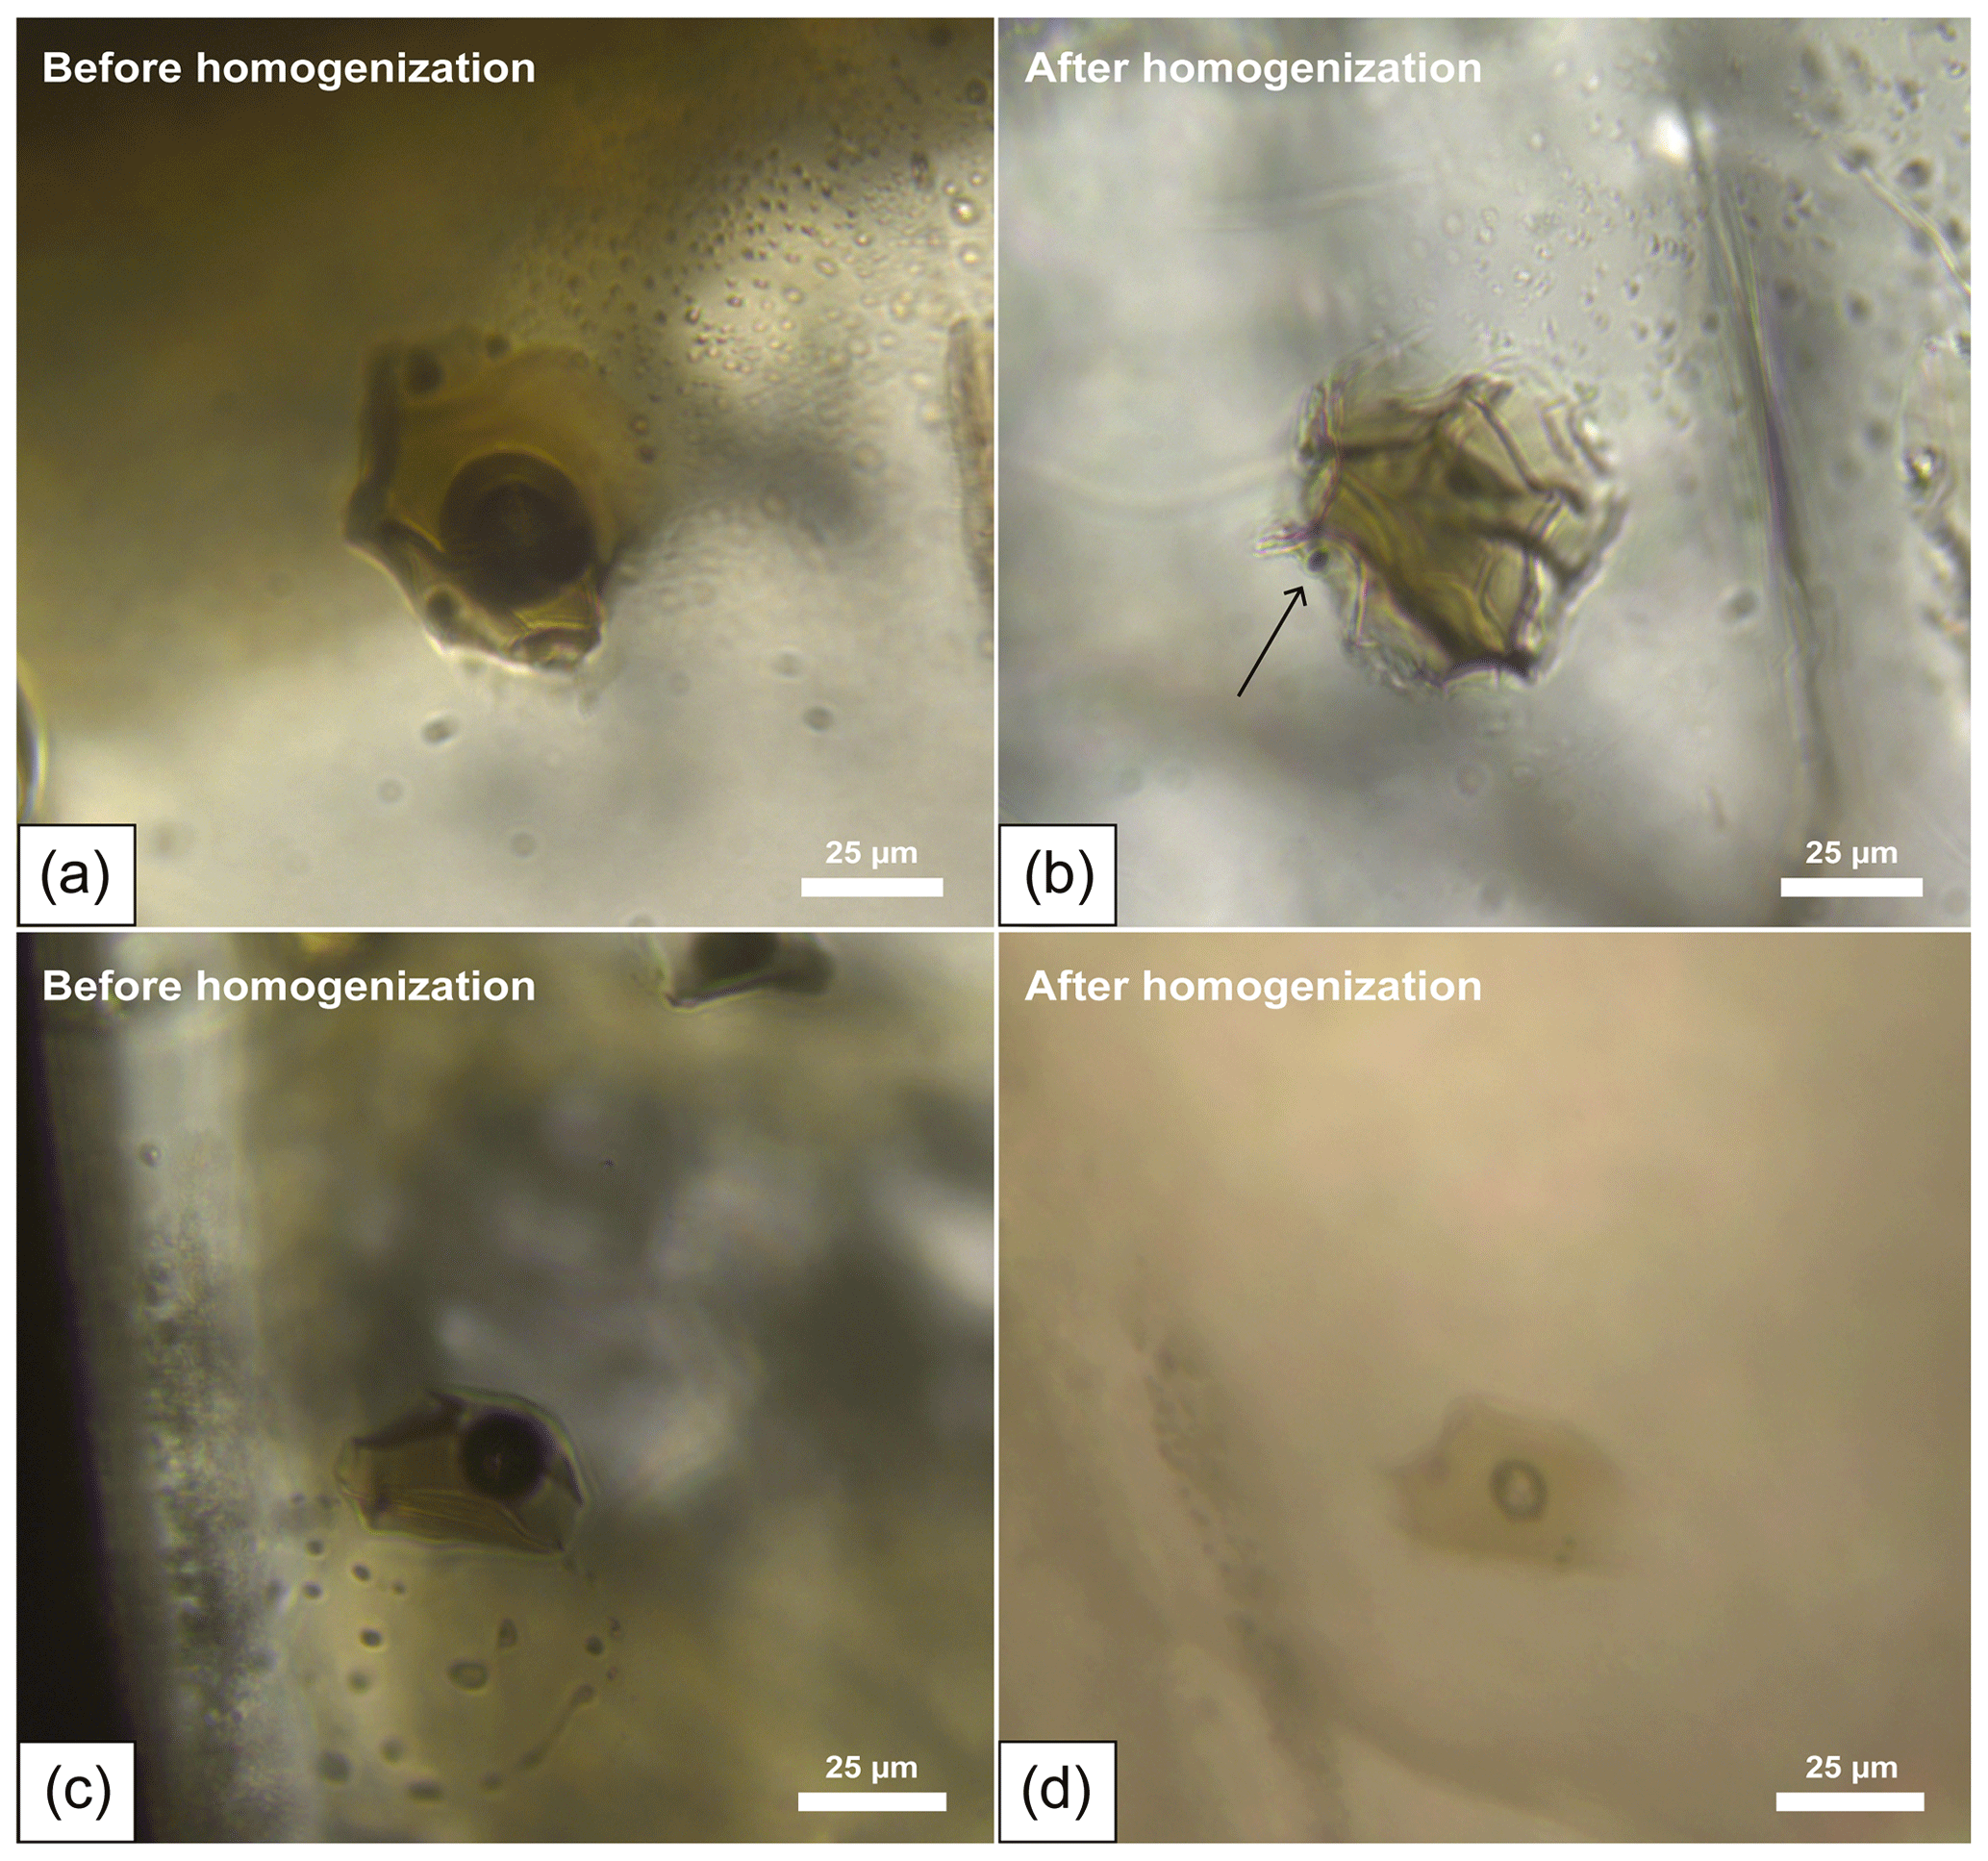
Figure 5(a–b) Optical microphotographs of a melt inclusion before (a) and after (b) homogenization at 2.5 GPa–1300 ∘C–30 min (HOP no. 3b-MIa). Note the complete disappearance of the bubble, which indicates that all the CO2 initially stored in the bubble has been dissolved in the liquid. The arrow points to a small sulfide grain. (c–d) Optical microphotographs of a melt inclusion before (c) and after (d) homogenization at medium pressure (1.5 GPa–1300 ∘C–30 min; HOP no. 10a-MIb): the pressure was not sufficient to completely homogenize the inclusion, as shown by the persistence of a small CO2 bubble.
4.4.2 Homogenization experiments under non-standard conditions
The melt inclusions homogenized at lower pressure (1.5 or 2.0 GPa) yield normalized compositions close to those measured in the experiments under standard conditions but with higher EMPA totals. In contrast, the compositions of the melt inclusions in the lower-temperature experiment and in the experiment with added water differ significantly from the compositions obtained under standard experimental conditions. In run HOP no. 18 at 2.5 GPa–1275 ∘C, melt compositions are strongly enriched in alkalis (∼ 6.0 wt % Na2O, 2.6 wt % K2O; Fig. 6b), TiO2, Al2O3, P2O5, F, and Cl (Fig. 7a) and depleted in MgO and CaO relative to melt inclusions homogenized at 2.5 GPa–1300 ∘C. These features indicate significant liquid crystallization at 1275 ∘C, in perfect agreement with the observation of a large clinopyroxene crystal in the inclusion (Fig. S2 in the Supplement). This result confirms our choice of 1300 ∘C as standard temperature. In run HOP no. 4 at 2.5 GPa–1300 ∘C with added water, the average melt composition is enriched in SiO2 (44.0 wt %) and MgO (10.7 wt %) and depleted in all incompatible elements in comparison with the composition in the standard conditions (same P and T but with no added water). If we compare now the melt in run HOP no. 4 with the average composition of unheated melt inclusions, we find evidence of a significant amount of olivine dissolution: strong enrichment in MgO and depletion in CaO, Al2O3, and TiO2, at a nearly constant SiO2 level.
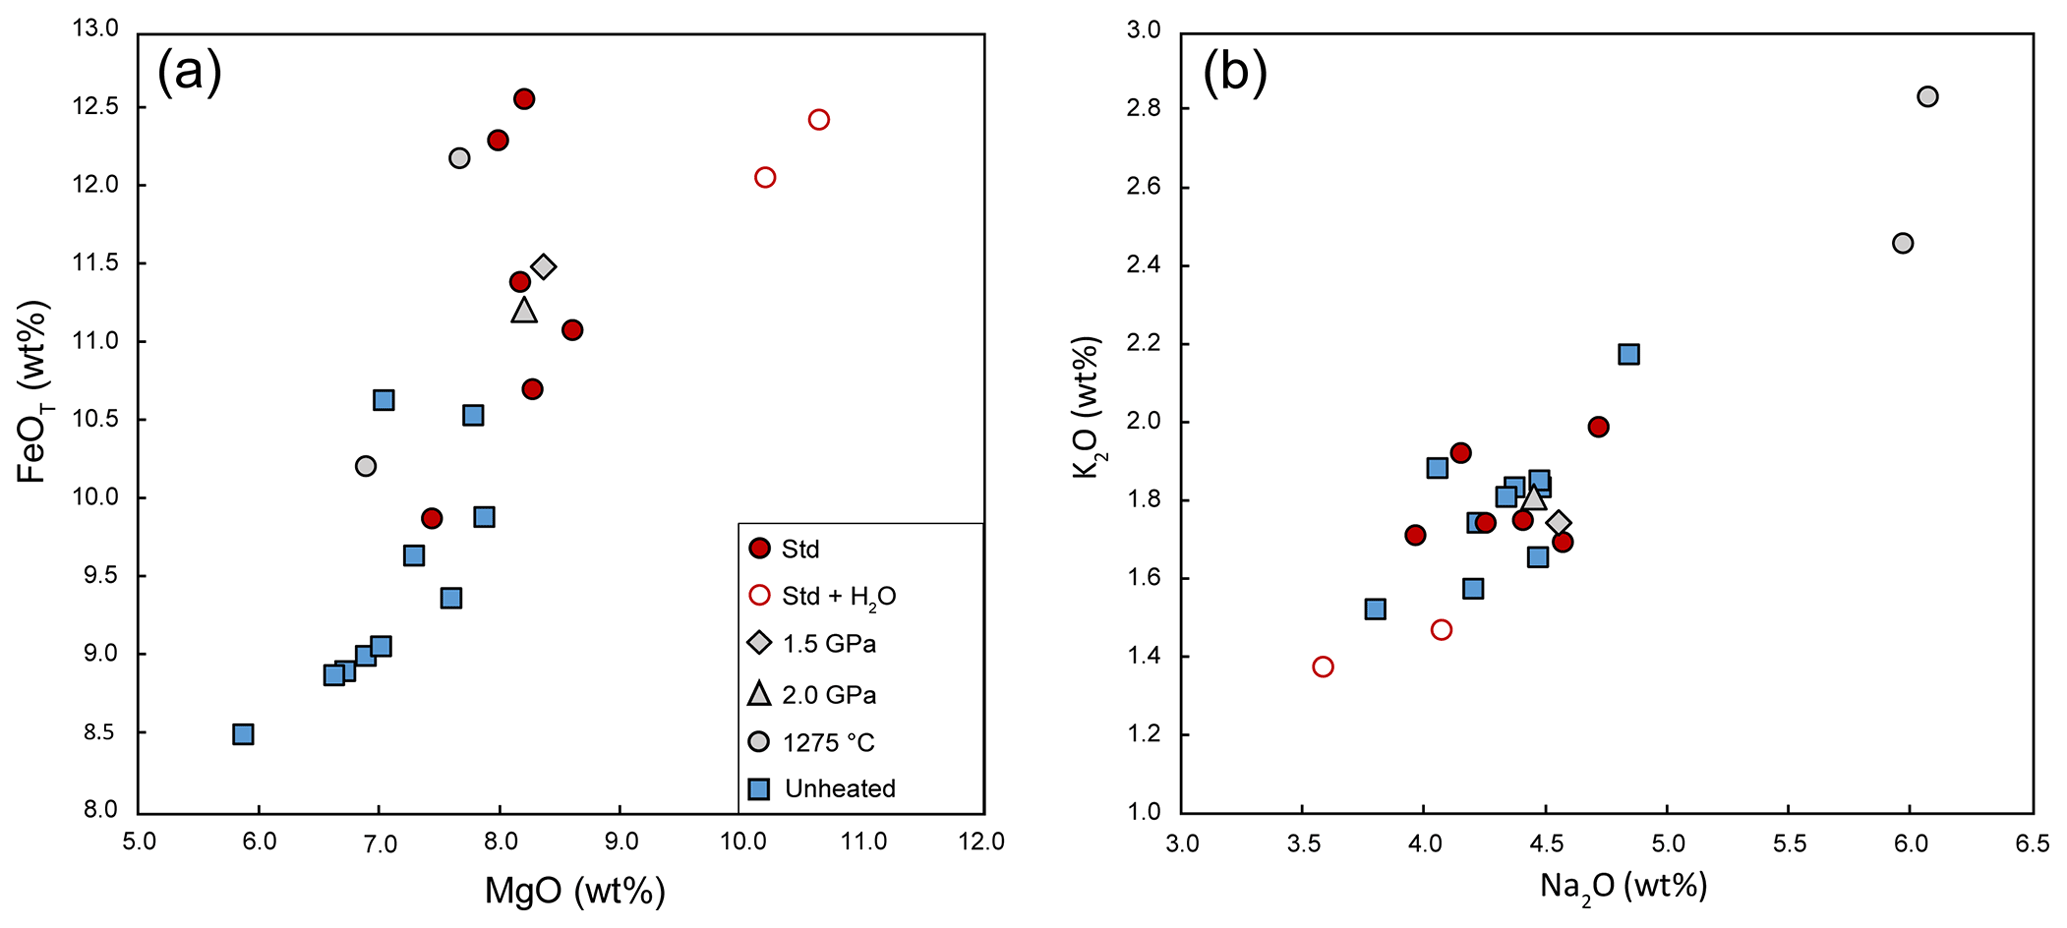
Figure 6Major element compositions of unheated and homogenized melt inclusions. Symbols are as follows: solid blue squares, unheated melt inclusions; red circles, homogenization experiments at 2.5 GPa–1300 ∘C without water (solid red circles) or with added water (empty red circles); solid grey diamond, experiment at 1.5 GPa–1300 ∘C; solid grey triangle, experiment at 2 GPa–1300 ∘C; and solid grey circles, experiment at 2.5 GPa–1275 ∘C. All the compositions are corrected from PEC/PED and normalized to a total of 100 % (on a volatile-free basis).
4.4.3 The case of sulfur
On average, the S content is ∼ 430 ppm lower in the homogenized melt inclusions than in the unheated ones (1556 vs. 1985 ppm S, respectively; Fig. 7b) and even 550 ppm lower if we consider only the inclusions homogenized under standard conditions (1435 ppm S on average). In many homogenized melt inclusions, S is still within the range of the values measured in the unheated melt inclusions (from 1291 to 2683 ppm S), but in some inclusions it is outside this range (down to 1109 ppm S). As most homogenized melt inclusions contain one or a few grains of sulfide in addition to the glass phase (Table S3), the lower average S content presumably results from sulfide immiscibility during HP homogenization. There are two notable exceptions (Fig. 7b). The first corresponds to the melt inclusion in run HOP no. 10 at 1.5 GPa, which is rich in sulfur (>2000 ppm) while containing sulfide grains. The second exception corresponds to the experiment with added water (HOP no. 4), in which we did not detect sulfide grains. The average S content in this sample (1916 ppm) is close to that of natural samples and would be even higher if we took into account the fact that the addition of water resulted in excessive dissolution of the host olivine and thus in sulfur dilution.

Figure 7(a) Fluorine (ppm) as a function of chlorine (ppm) in melt inclusion glasses. (b) Sulfur (ppm) vs. H2O (wt %) in melt inclusion glasses. Melt inclusions contaminated by NaCl during homogenization experiments are not shown because of their high Cl contents (more than 3 wt %). Symbols are as follows: solid blue squares, unheated melt inclusions; red circles, homogenization experiments at 2.5 GPa–1300 ∘C without water (solid red circles) or with added water (empty red circles); solid grey diamond, experiment at 1.5 GPa–1300 ∘C; solid grey triangles, experiment at 2 GPa–1300 ∘C; and solid grey circles, experiment at 2.5 GPa–1275 ∘C. The data are corrected for PEC/PED.
4.5 Compositions of homogenized melt inclusions: carbon dioxide
A first qualitative assessment of the CO2 content of the melt inclusions after homogenization was done by analyzing the glass (not yet exposed) through the olivine crystal by Raman spectroscopy. By comparison with the Raman spectrum before homogenization, this allowed us to quickly evaluate the success of the experiment and observe a significant increase in the CO2 content of melt inclusions homogenized at high pressure. The glass was then exposed, and its CO2 concentration was precisely quantified by Raman spectroscopy (Fig. 8). The CO2 contents are reported in Table 3, with additional data in Table S3 for melt inclusions that were not analyzed with the electron microprobe (the compositions in Tables 3 and S3 are slightly different because the former have been corrected with the MIMiC software but the latter have not). The CO2 concentrations are plotted as a function of MgO contents in Fig. 9.
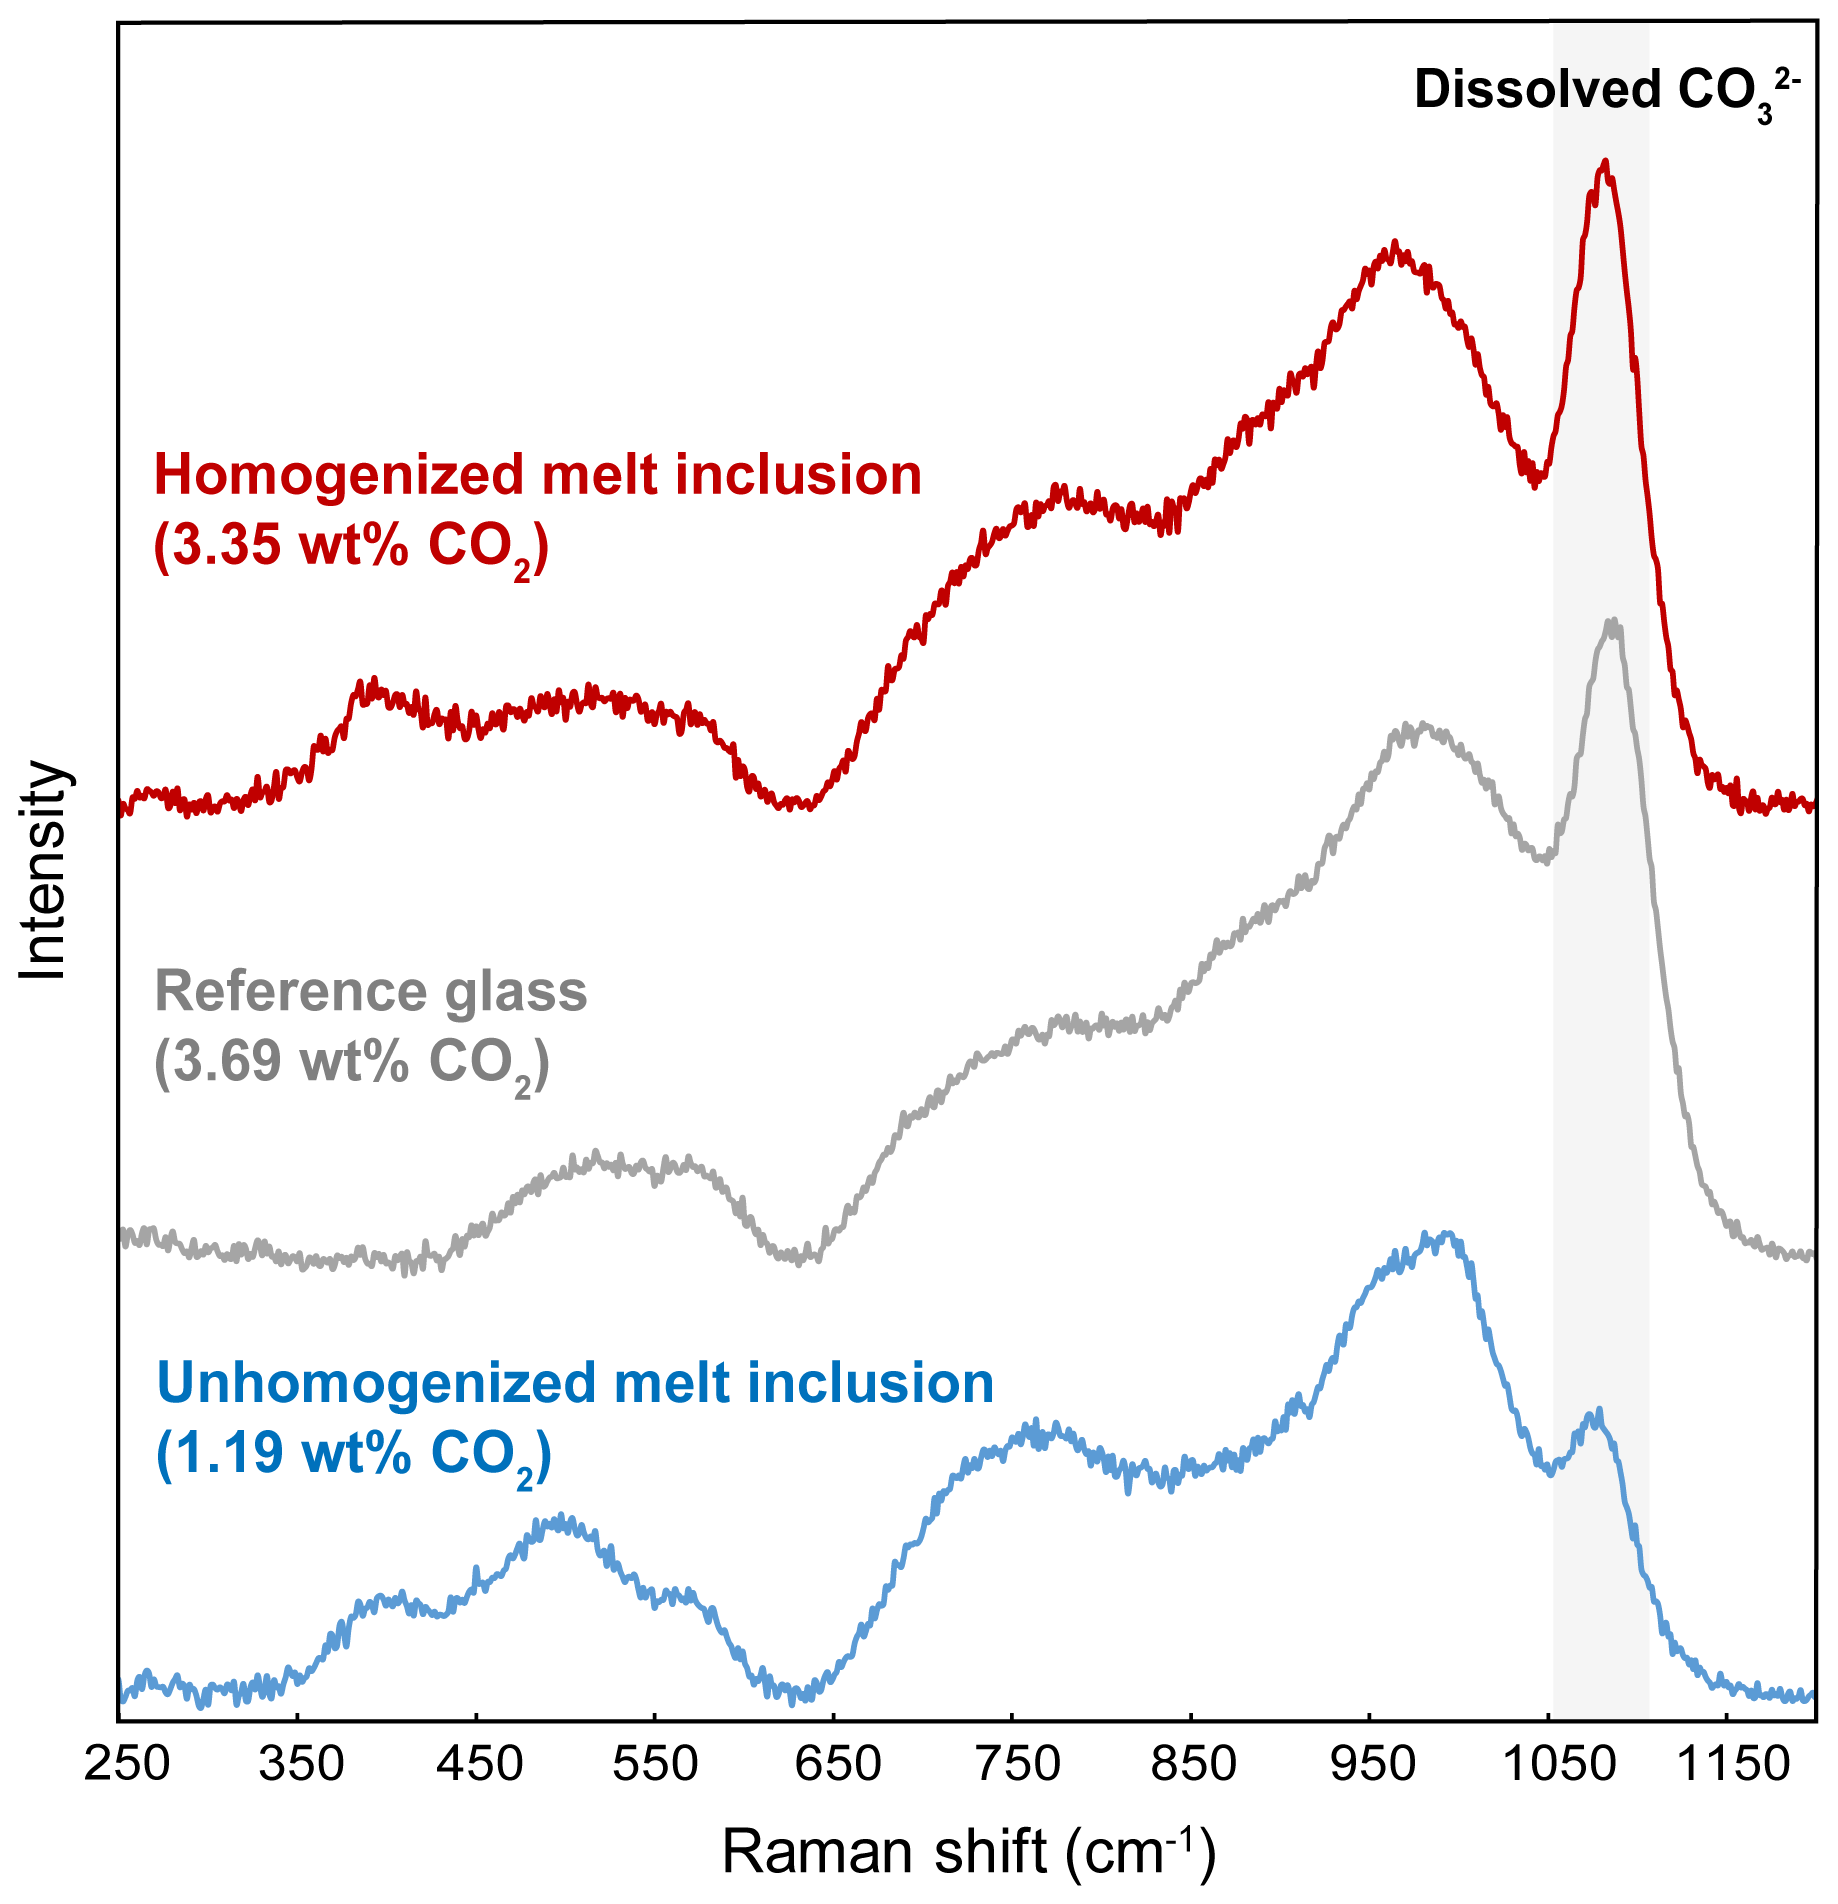
Figure 8Comparison of the Raman spectrum of basanitic standard BSN150121 (3.69 wt % CO2) in grey with a spectrum representative of an unheated melt inclusion (Thu3-6a) in blue and a spectrum after homogenization at 2.5 GPa–1300 ∘C (HOP no. 5a-MI) in red. The size of the CO band at 1080 cm−1 in the glass homogenized at 2.5 GPa is as big as the CO band in the basanitic standard with 3.69 wt % CO2.
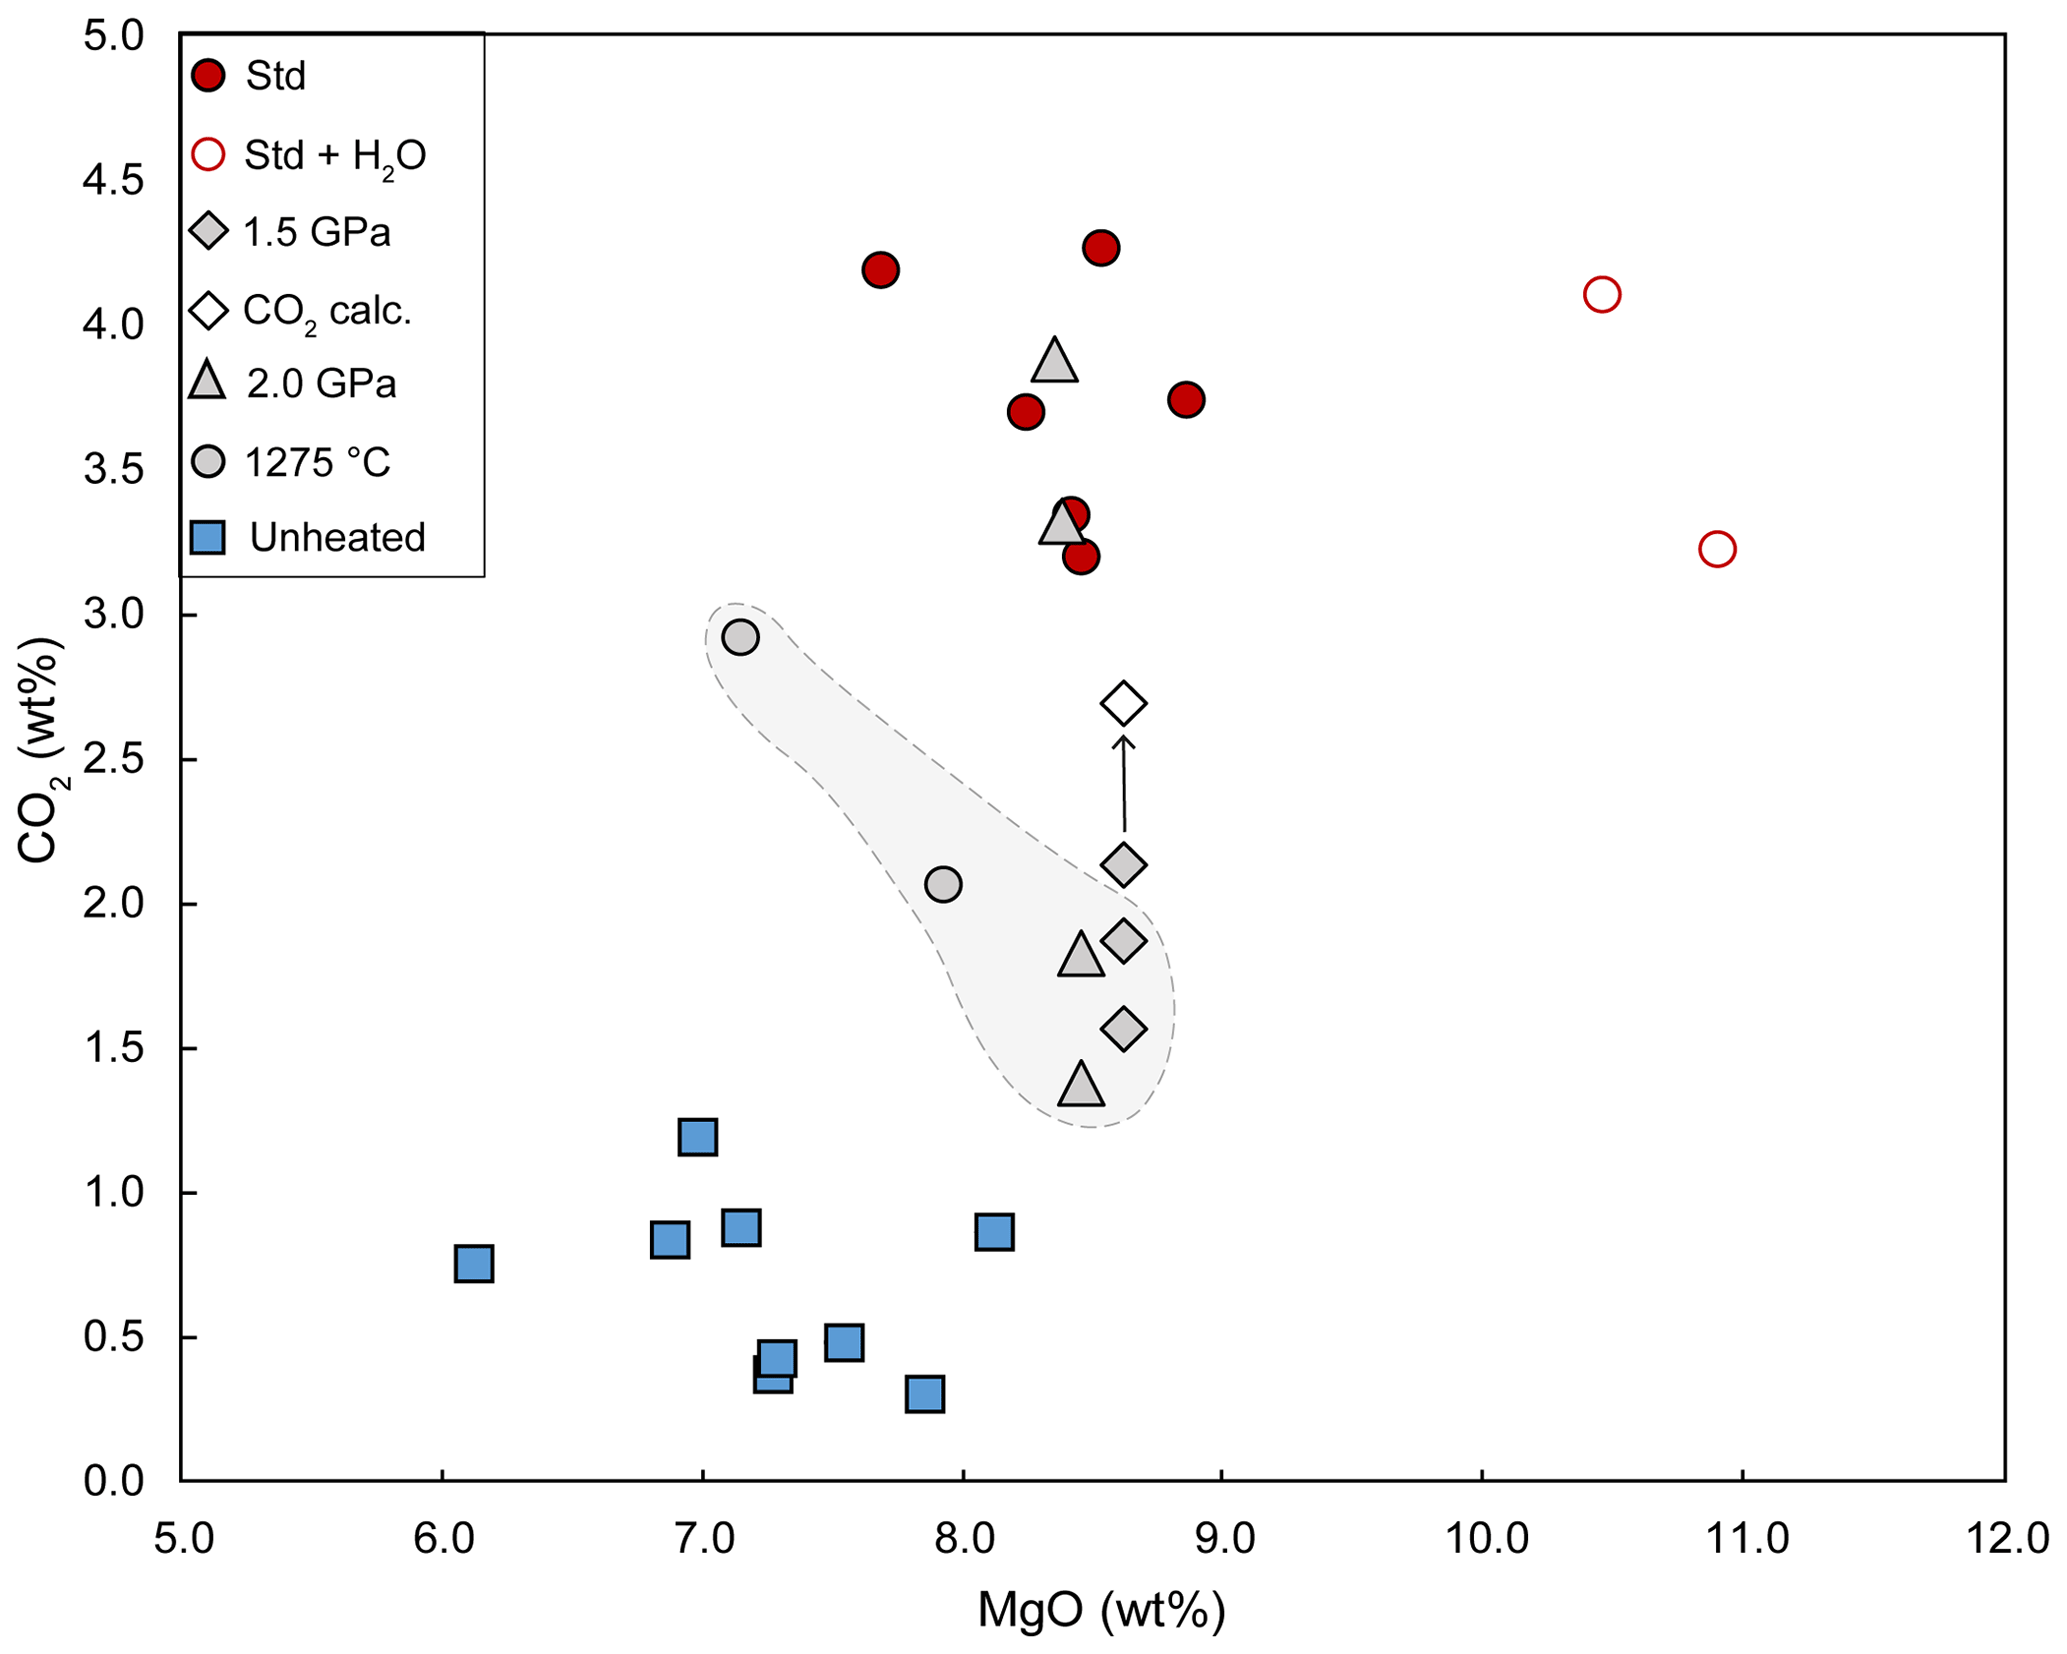
Figure 9CO2 contents in glasses plotted as a function of MgO. Symbols are as follows: solid blue squares, unheated melt inclusions; red circles, homogenization experiments at 2.5 GPa–1300 ∘C without water (solid red circles) or with added water (empty red circles); solid grey diamonds, experiment at 1.5 GPa–1300 ∘C; solid grey triangles, experiments at 2 GPa–1300 ∘C; and solid grey circles, experiment at 2.5 GPa–1275 ∘C. The solid grey diamond and empty diamond joined by an arrow corresponding to melt inclusion HOP no. 10a-MIb: the empty diamond shows the total CO2 content estimated by adding the CO2 contained in the residual bubble to the CO2 dissolved into the glass. With the exception of this one, all the melt inclusions presented are bubble-free and completely homogenized. The grey area surrounded by a dashed line corresponds to the melt inclusions that may have undergone CO2 loss through cryptic decrepitation (see Sect. 4.5 for explanation). The MgO contents correspond to the values after normalization to 100 wt % of the sum of major and minor elements (on a volatile-free basis); the CO2 contents correspond to the values after PEC/PED correction (or to the raw data when the glass composition was not analyzed with the electron microprobe).
4.5.1 Experiments at 2.5 GPa–1300 ∘C
The CO2 contents of melt inclusions homogenized at 2.5 GPa–1300 ∘C (both without added water and with added water) are extremely high: from 3.20 wt % to 4.27 wt % CO2 (Table 3; Fig. 9). This is highlighted in Fig. 8, which compares the Raman spectrum of basanitic standard BSN150121 (3.69 wt % CO2) with a spectrum representative of an unheated melt inclusion and a spectrum after homogenization at 2.5 GPa–1300 ∘C. The striking feature in the later Raman spectrum is the size of the CO band at 1080 cm−1, which is as big as the CO band in the basanitic standard with 3.69 wt % CO2. We emphasize that the bubble volume in the melt inclusions that yielded these extreme values of CO2 was relatively small compared to the inclusion volume: from 3.5 (±0.5) vol % to 13.3 (±0.6) vol % (8.9±0.8 vol % on average; Table S3). The CO2 contents measured in the experiments at 2.5 GPa–1300 ∘C are slightly to significantly higher than the solubility value of 3.2 wt % predicted by the model of Duan (2014), indicating that the model underestimates the solubility of CO2 for compositions like ours. In contrast, they are well below the solubility of 5.9 wt % CO2 calculated using the model of Eguchi and Dasgupta (2018). Considering the average CO2 contents measured in the glass phase of unheated melt inclusions (0.61 wt %) and in the melt inclusions homogenized at 2.5 GPa (3.74 wt %), we estimate that in Thueyts melt inclusions, ∼ 84 % of the total CO2 is initially sequestered in bubbles, both as CO2 fluid and as carbonate microcrystals.
4.5.2 Experiments at 2 GPa–1300 ∘C
In the two experiments at 2 GPa, four out of five melt inclusions were completely homogenized. These four bubble-free inclusions yield a wide range of CO2 contents: 1.39 wt %, 1.87 wt %, 3.31 wt %, and 3.88 wt %. This observation suggests that the initial CO2 content is variable from one melt inclusion to the other and that the CO2 solubility at 2 GPa–1300 ∘C is larger than 3.88 wt %. For comparison, Duan's model predicts a much lower CO2 solubility (2.7 wt %; Duan, 2014), whereas the model of Eguchi and Dasgupta (2018) yields a CO2 solubility equal to 4.5 wt %. The fifth inclusion contains a bubble with a dense CO2 phase (0.91 g cm−3; melt inclusion HOP no. 13a in Table S3), and the glass shows a sharp CO band. Unfortunately, the CO2 content of the glass could not be quantified by Raman spectroscopy due to a fluorescence problem specific to this inclusion. We interpret inclusion HOP no. 13a as the most CO2-rich melt inclusion of the set of five inclusions tested at 2 GPa, with an initial CO2 content slightly above the saturation value at this pressure.
4.5.3 Experiment at 1.5 GPa–1300 ∘C
For the experiment at 1.5 GPa, the three inclusions analyzed give dissolved CO2 contents of 1.57 wt %, 1.90 wt %, and 2.14 wt %. The two poorest inclusions were bubble-free, while the richest inclusion contains a bubble of 2.9 (±0.7) vol %, with a CO2 density equal to 0.53 g cm−3 (Fig. 5d; inclusion HOP no. 10a-MIb in Table S3). Knowing the total volume of the inclusion and the volume of the bubble, we calculated a total content of 2.69 wt % CO2. This is only a semi-quantitative estimate because of the complex shape of the inclusion and therefore the large uncertainty in the volume. From these observations, we infer that the initial CO2 content in melt inclusion HOP no. 10a-MIb was above the CO2 solubility at 1.5 GPa–1300 ∘C and that the latter is equal to ∼ 2.1 wt %. For comparison, the CO2 solubilities computed using the models of Duan (2014) and Eguchi and Dasgupta (2018) are equal to 2.0 wt % and 3.1 wt %, respectively.
4.5.4 Experiment at 2.5 GPa–1275 ∘C
The two inclusions in experiment HOP no. 18 at 2.5 GPa–1275 ∘C are bubble-free and have CO2 contents of 2.07 wt % and 2.93 wt % (Table 3). The higher value is close to the CO2 contents measured in homogenized melt inclusions at 2.5 GPa–1300 ∘C, while the other value is much lower (Fig. 9). The high degree of crystallization of the liquid in the experiment at 1275 ∘C led to a significant increase in all incompatible elements (Fig. 6b): +30 % for F, +37 % for Cl, and +47 % for K2O (taking as reference the average composition of melt inclusions homogenized under standard conditions). Considering a closed-system behavior (but see below) and an average enrichment in incompatible elements of 38 %, the corrected CO2 contents fall to 1.5 wt % and 2.1 wt %.
4.5.5 Cases of cryptic decrepitation?
Figure 9 shows a wide range of CO2 contents in the heated melt inclusions: from 1.39 wt % to 4.27 wt %. It is common that inclusions trap melts with different amounts of dissolved CO2, for instance when olivine phenocrysts crystallize at various depths (Esposito, 2021). Statistically, however, we note that all the inclusions homogenized at 2.5 GPa–1300 ∘C are systematically very rich in dissolved CO2 (≥3.20 wt %), whereas the inclusions homogenized at 1.5 GPa yield much lower values: between 1.57 wt % and 2.69 wt % CO2. In the experiments at 2 GPa, an intermediate situation is observed, with both CO2-rich melt inclusions (3.31 wt % and 3.88 wt %) and CO2-poor ones (1.39 wt % and 1.87 wt %). It is therefore possible that some inclusions in the 1.5 and 2 GPa experiments have lost part of their CO2 when the pressure difference between the inclusion and the molten salt exceeded a decrepitation threshold on the order of a few hundred megapascals (e.g., 250 MPa; Maclennan, 2017). Since there is no clearly visible evidence of leakage, at least under the optical microscope, or signs of chemical contamination, we call this hypothetical process cryptic decrepitation. In addition to the experiments at 1.5 and 2 GPa, cryptic decrepitation could also be involved in the experiment at 2.5 GPa–1275 ∘C. If we assume that the melt inclusions in this experiment had initial CO2 contents in the range of the other experiments at 2.5 GPa (on average 3.74 wt % CO2), the crystallization of the liquid would cause a significant increase in CO2 content (up to 4.9 wt % or 5.5 wt % depending on whether we take F or K2O as a reference) and thus an increase in the internal pressure in the inclusion that could ultimately lead to decrepitation. In the future, it would be interesting to couple high-pressure homogenization experiments with high-resolution X-ray computed tomography (e.g., Hanyu et al., 2020) to try to identify microtextures characteristic of cryptic decrepitation and confirm the existence of this process.
4.6 Compositions of homogenized melt inclusions: water
In all experiments except HOP no. 4 (the run with added water), a significant water loss is observed in the melt: the water contents measured at the end of the experiments are between <0.10 wt % and 0.95 wt % (on average 0.33 wt %) as compared to water contents between 1.01 wt % and 1.94 wt % (on average 1.37 wt %) in unheated melt inclusions. Water loss is a well-known problem in homogenization experiments in a heating stage and is due to rapid diffusion of H+ through the host olivine at high temperature (Chen et al., 2011; Gaetani et al., 2012; see also Portnyagin et al., 2008). In run HOP no. 4, we added 2 wt % H2O to the system (corresponding to a ratio of H2O to H2O + NaCl equal to 2.97 wt %; Table 1) to minimize the gradient in water activity between the melt inclusion and its environment. Water contents in HOP no. 4 melt inclusions (2.16 wt %–2.64 wt % H2O) are significantly higher than in all experiments without added water and even than in the unheated melt inclusions. As no water was found in the bubbles of Thueyts melt inclusions (Schiavi et al., 2020), these higher water contents may be attributed to a diffusive water gain during the experiment. Therefore, by adding water to the surrounding environment, it is possible to reduce or even reverse the water activity gradient between the melt inclusion and the exterior (see also Mironov et al., 2015; Rasmussen et al., 2020). A good knowledge of the activity–composition relation for H2O in NaCl at high P and T would be required to calculate the exact amount of added water required to cancel the water gradient between the melt inclusion and the molten salt. The melt inclusions of experiment HOP no. 4 have the lowest EMPA totals (91.2 wt %–91.7 wt %) in perfect agreement with their high contents in both CO2 and water.
5.1 The success of HP homogenization experiments of CO2-rich melt inclusions
Our experiments show that it is possible to homogenize melt inclusions very rich in volatiles (here, up to 4.3 wt % total CO2) provided that a sufficient pressure is applied. The minimum pressure required to homogenize the most CO2-rich melt inclusions from Thueyts is between 2 and 2.5 GPa: at 2.5 GPa, we observe the complete disappearance of the initial bubbles and the formation of homogeneous liquids whose Raman spectra have CO peaks as big as those in our richest reference glasses (3.69 wt % and 4.46 wt % CO2; Fig. 8). At P≤2 GPa, the most CO2-rich melt inclusions retain a residual bubble at the end of the experiments, and the liquid in equilibrium is not as rich in CO2 as at 2.5 GPa: such features indicate that the experimental pressure is insufficient to dissolve the total CO2 content of the inclusion in the liquid phase. These observations demonstrate that olivine-hosted melt inclusions behave as closed systems for CO2 during HP homogenization experiments and that olivine constitutes a tight container with respect to CO2 exchanges (at the timescale of our experiments).
Because of the uncertainty in the physicochemical parameters at the time of melt inclusion entrapment, it is unlikely to reproduce exactly the initial composition of the inclusion at the end of a homogenization experiment. For example, the melt inclusion can be overheated during HP homogenization, which will result in excessive dissolution of the host olivine and thus in CO2 dilution. Conversely, the melt inclusion may be underheated, resulting in insufficient dissolution of the host crystal and overconcentration of CO2. It is possible to correct for CO2 dilution by estimating the amount of excess olivine dissolved (e.g., Wallace et al., 2015) or the deficit of dissolved olivine in the case of CO2 overconcentration.
5.2 Behavior of F, Cl, and S during HP homogenization experiments
If we take into account the effects of dissolution or crystallization of the host crystal as a function of the experimental parameters, we find that there is a good match between the concentrations of F and Cl in unheated melt inclusions and those in homogenized melt inclusions (except in the case of decrepitation and NaCl contamination by the molten salt). This indicates that olivine-hosted melt inclusions behave as a closed system for these two volatile elements for at least 30 min during HP homogenization.
A closed-system behavior is presumably the rule in the case of sulfur as well, but this is more complicated to assess for two reasons. First, S concentrations in the starting melt inclusions are not precisely known because, in addition to the sulfur dissolved in the glass phase, sulfur is also present as sulfide microcrystals along the bubble walls. It is well known indeed that large amounts of sulfur may be stored in the bubbles of melt inclusions (e.g., Esposito et al., 2016; Venugopal et al., 2020). In the Bas-Vivarais province, FeS2 has been identified by Raman microtomography in a melt inclusion from Thueyts and CuFeS2 in a melt inclusion from the nearby Lac d'Issarlès volcano (Schiavi et al., 2020). Schiavi et al. (2020) estimated that 20 % of the total sulfur was stored in these sulfides in the melt inclusion from Thueyts. The second reason is that a microscopic sulfide phase is present at the end of most homogenization experiments (see Table S3), suggesting the formation of an immiscible sulfide liquid in the melt inclusion at high temperature. This process is well known in the literature and has been explained in different ways based on the interrelationship between water loss, iron loss, oxygen fugacity, and the solubility of sulfur (Danyushevsky et al., 2002; Baker and Moretti, 2011; Wallace and Edmonds, 2011). As a result of sulfide immiscibility, the S content in the silicate glass of the experiments homogenized under standard conditions is 550 ppm lower than in the glass phase of unheated melt inclusions (on average 1435 ppm vs. 1985 ppm, respectively; Fig. 7b). Based on these average values and considering that 20 % of the total sulfur in the starting melt inclusions is stored as sulfide microcrystals lining the bubble walls, it is estimated that the total sulfur content is about 2500 ppm and that, in homogenization experiments under our standard conditions, the sulfide phase accounts for slightly more than 40 % of total sulfur.
Another lesson from the experiments is that the addition of water to minimize the gradient in water activity between the melt inclusion and the external environment is also beneficial for the homogenization of sulfur. Indeed, in run HOP no. 4 with ∼ 2 wt % added water, there is no evidence of the formation of an immiscible sulfide liquid in the melt inclusion at high temperature, and all the sulfur is dissolved in the silicate glass at the end of the experiment (Fig. 7b). Further experiments with added water would be necessary to confirm this observation and to establish the link between water loss or gain, oxygen fugacity, and sulfur solubility.
5.3 Behavior of H2O during HP homogenization experiments
With respect to water, the two main findings of our study are the following: (1) a rapid and systematic loss of water from melt inclusions in experiments without added water, in agreement with previous work (Portnyagin et al., 2008; Chen et al., 2011; Gaetani et al., 2012), and (2) the possibility of minimizing this loss, or even increasing the water content in the melt inclusions, by adding water to the surrounding medium (see also Rasmussen et al., 2020). In our case, the initial water contents of the melt inclusions are low (1.37 wt % on average), and our priority was not to keep constant the water concentrations during the experiments but to estimate the total CO2 content of the melt inclusions. Nevertheless, keeping water during homogenization experiments is important in order to fully recover the melt composition and the temperature at the time of melt inclusion entrapment (Danyushevsky et al., 2002; Chen et al., 2011). This is all the more important as water loss can be accompanied by a significant decrease in the silica content of the melt inclusion and thus lead to an underestimation of the SiO2 content of the original magma (Portnaygin et al., 2019). According to these authors, the coupled loss of silica and water is caused by the growth along the inclusion walls of a defect olivine, in which vacancies in metal sites are occupied by hydrogen. In the case of water-rich melt inclusions such as in island-arc systems, this effect could lead to concomitant depletion of melt in H2O and SiO2 of up to 4 wt %–5 wt % (Portnyagin et al., 2019).
In our standard experiments at 2.5 GPa–1300 ∘C, the SiO2 content of the glasses is 41.9 wt % (on a volatile-free basis), and the H2O content is 0.16 wt % on average (Table 3). In comparison, the SiO2 and H2O contents of unheated melt inclusions are equal to 44.4 wt % and 1.37 wt % (Table 2). On its own, water loss during the experiments cannot explain the decrease in SiO2 from 44.4 wt % to 41.9 wt %, but, following Portnyagin et al. (2019), it could contribute to a decrease in SiO2 in melt on the order of 1 wt %. The other factor that contributes to the decrease in SiO2 in our experiments is the incorporation into the silicate liquid of the carbonate microcrystals contained in the bubbles, as discussed in the next section. The importance of water and the coupling between H2O and SiO2 are also well demonstrated by our experiment with added water (HOP no. 4), in which both H2O and SiO2 are significantly higher than in our standard experiments: 2.40 wt % vs. 0.16 wt % for H2O and 44.1 wt % vs. 41.9 wt % for SiO2. Given the importance of water and its impact on other compositional parameters, more experiments with added water are needed to properly control water concentrations after homogenization and thus better constrain the original melt composition of trapped liquids and the trapping temperature.
5.4 Importance of HP homogenization for major and trace elements
In the case of melt inclusions such as those of Bas-Vivarais, where large quantities of carbonate microcrystals and to a lesser extent of sulfides are observed inside the bubbles (Fig. 1; Schiavi et al., 2020), a significant effect of homogenization on melt composition can be anticipated not only for volatile elements but also for major and trace elements too and probably also in terms of isotope ratios, particularly those of carbon and sulfur. For trace elements, all the elements present in carbonates and sulfides are concerned, the first of which is Cu because chalcopyrite was identified in most of the bubbles in the melt inclusions studied by Schiavi et al. (2020). Regarding the major elements, the main elements concerned are Ca, Mg (contained in carbonates), and Fe (contained in carbonates and sulfides). To illustrate the effect of homogenization on major elements, the bulk composition of a bubble was calculated and then mixed in different proportions with the average composition of Thueyts melt inclusions (Table 4). To compute the bubble composition, we used the masses of carbonate, FeS2, and fluid CO2 given by Schiavi et al. (2020) for a melt inclusion from Thueyts, and we considered a composition of 70 % CaCO3, 27 % MgCO3, and 3 % FeCO3 (mol %) for the carbonate phase. With these parameters, we obtain the bulk composition Bub 33 (33 stands for the percentage of carbonates in the bubble: 33 vol %): 51.3 wt % CO2, 34 wt % CaO, 9.4 wt % MgO, 3.7 wt % FeO, and 1.6 wt % S. We “homogenized” this composition with the average composition of Thueyts melt inclusions to produce mixtures with 2, 3, and 4 wt % CO2 (Table 4). Besides the increase in total CO2 content, the main effects of homogenization are a decrease in SiO2 from 44.3 wt % to 42.8 wt % (on a volatile-free basis) and an increase in CaO from 13.1 wt % to 15.1 wt %. The MgO content increases slightly, and the FeOT content is nearly constant. These chemical trends are not very sensitive to the choice of carbonate composition (dolomite vs. Mg-calcite).
Table 4Theoretical composition of bubbles in melt inclusions from Thueyts (Bub 33 and Bub 42) and bulk compositions (BMI and BMI*; bulk melt inclusion) obtained by homogenizing these bubbles with the glass phase of Thueyts melt inclusions. For BMI and BMI*, the number in the suffix corresponds to the weight percentage of CO2 in the mixture: 2 wt %, 3 wt %, or 4 wt % CO2.
a Bubble composition Bub 33 is based on the masses of carbonate, FeS2, and CO2 fluid reported by Schiavi et al. (2020) in the bubble of a melt inclusion from Thueyts, which contains 33 vol % carbonate. For the carbonate phase, we consider a mixture of 70 mol % CaCO3, 27 mol % MgCO3, and 3 mol % FeCO3. b MI is the average glass composition measured in unheated melt inclusions from Thueyts (corrected for PEC). For all the silicate liquids in the table (but not for the bubble), the major and minor elements (SiO2 to P2O5) are normalized to a total of 100 %; the total before normalization is given in the line “Σ maj.” (major). c BMI-2 to BMI-4 are obtained by mixing Bub 33 and MI in different proportions to obtain bulk compositions with 2 wt %, 3 wt %, or 4 wt % CO2, respectively. d Bubble composition based on the same data as for Bub 33 but considering 42 vol % of carbonates instead of 33 vol % to take into account the uncertainty in Raman tomography (±9 vol %; Schiavi et al., 2020). e BMI*-4 is a composition with 4 wt % CO2 obtained by mixing Bub 42 with the average melt inclusion composition MI recalculated with 1.2 wt % dissolved CO2 (see text for explanation). f HOP Stdd is the average composition of melt inclusions homogenized under standard conditions, with all iron recalculated as FeO. g Weight percentages of bubble and silicate glass required to produce the mixtures with 2 wt %, 3 wt %, and 4 wt % CO2. The volume percentages of the whole bubble and of CO2 fluid (fl.) are given for comparison and were computed using a bulk density of 1.15 g cm−3 for Bub 33 or 1.41 g cm−3 for Bub 42, a density of 2.8 g cm−3 for the silicate liquid, and a percentage of fluid CO2 of 67 vol % in Bub 33 and 58 vol % in Bub 42.
In terms of weight, the proportions of bubbles needed to reach 2 wt % to 4 wt % CO2 after homogenization range from 2.7 % to 6.7 % (Table 4). In terms of volume, this corresponds to proportions of 6.4 % to 14.8 % if we consider the whole bubble and 4.3 % to 9.9 % if we consider only the CO2 fluid. The main parameters that control these proportions are the CO2 content of the silicate glass and especially the percentage of carbonates in the bubble, which strongly affects the bulk density of the bubble. The percentage of carbonates is variable and can exceed 50 vol % in some bubbles of Bas-Vivarais (unpublished data). Thus, we made a mixing calculation considering a bubble with 42 vol % carbonates and a silicate glass with 1.2 wt % CO2 (the maximum measured in unheated melt inclusions), instead of 33 vol % carbonates and 0.61 wt % dissolved CO2 in the calculations above. With these new parameters, the bubble volume required to reach 4 wt % CO2 after homogenization falls to 10.7 vol % (6.2 vol % of CO2 fluid), instead of 14.8 vol %.
These calculations are exploratory because there are currently very few constraints on the compositions and quantities of carbonates and sulfides contained in melt-inclusion-hosted bubbles and thus on the bulk composition and density of bubbles. However, if we compare the compositions of unheated melt inclusions and of melt inclusions homogenized under standard conditions, we see that the dissolution of the bubble components into the silicate liquid contributes to the evolution of major elements, in particular the decrease in SiO2 and the slight increase in CaO. On the other hand, the high concentrations of FeOT and MgO in the homogenized melt inclusions require in addition a dissolution of the host olivine. In the mixing calculations of Table 4, it is interesting to note that it is not possible to reach SiO2 contents as low as in our standard homogenization experiments (41.9 wt % SiO2), even in the most CO2-rich compositions (BMI-4, 42.8 wt % SiO2; BMI*-4, 43.0 wt % SiO2). Therefore, some of the decrease in SiO2 content (∼ 1 wt %) observed in these experiments may be coupled to water loss, as proposed by Portnyagin et al. (2019).
5.5 The need for a multi-analytical-technique approach
High-pressure homogenization is a powerful tool to access the total CO2 content of volatile-rich melt inclusions. There is, however, an intrinsic limitation to this technique which comes from the impossibility to accurately measure the parameters of the melt inclusions before homogenization: glass composition, water content, and nature and abundance of microcrystals in the bubbles. This limitation stems from the need to keep the inclusion at a significant depth in the host crystal to avoid decrepitation. The inability to individually characterize each melt inclusion prior to HP homogenization is a source of uncertainty due to the significant heterogeneity in major and trace elements in melt inclusion suites, even within the same sample, the same crystal, or the same melt inclusion assemblage (e.g., Helo et al., 2011; Esposito et al., 2014; Wallace et al., 2015). Therefore, prior to any series of HP homogenization experiments, a thorough petrographic study of the suite of melt inclusions (location, shape, and size of melt inclusions; bubble sizes) is required, and a number of representative inclusions must be characterized by conventional glass analysis techniques (EPMA, vibrational spectroscopies, ion microprobe) and other less conventional techniques such as Raman microtomography, X-ray computed tomography, and dual-beam approaches (focused ion beam and field-emission scanning electron microscopy) to quantify the content of the bubbles (Schiavi et al., 2020).
In the future, it would be highly beneficial to systematically couple HP homogenization experiments with high-resolution X-ray computed tomography (e.g., Hanyu et al., 2020; Drignon et al., 2021). Prior to homogenization, this nondestructive technique would allow for accurate (≤ 0.5 µm) measurement of the shape and size of melt inclusions and bubbles, characterization of additional phases (crystals, immiscible phases), and possibly discarding melt inclusions with hidden defects. After homogenization, X-ray computed tomography should be used to determine the final shape and size of the melt inclusions, to identify any residual or newly grown phases (bubbles, sulfides, silicate crystals, etc.) and quantify their volumes, to detect decrepitation microtextures, etc. The benefits will include the following: (1) accurate quantification of size and shape variations in melt inclusions during homogenization that will help confirm excess dissolution or crystallization of the host crystal, (2) the ability to precisely calculate the total CO2 content of melt inclusions with a residual bubble through reliable measurement of volumes, and (3) the possibility of detecting experimental failure even though there is no visual evidence under the optical microscope.
5.6 Homogeneous vs. heterogeneous melt inclusion entrapment
As our study shows, homogenization at high pressure (up to 3–4 GPa) in a piston cylinder is a powerful approach to characterize melt inclusions very rich in volatile elements. One must be careful, however, in the interpretation of the results because there is a risk of mistakenly homogenizing melt inclusions resulting from heterogeneous entrapment. In the case of heterogeneous entrapment, the bubble is not a shrinkage bubble but comes from a primary bubble trapped with the silicate liquid at the time of the inclusion formation. Heterogeneous entrapment can involve a wide variety of immiscible fluids, such as silicate melt–CO2 fluid, silicate melt–carbonate melt, silicate melt–sulfide melt, and silicate melt–aqueous solutions (e.g., Roedder, 1992; Kamenetsky and Kamenetsky, 2010). In some cases, it is straightforward to identify melt inclusions issued from heterogeneous entrapment, such as when the CO2 bubble occupies a large part of the inclusion volume or the bubble melt inclusion volume ratio varies greatly in nearby, coeval melt inclusions (e.g., Bodnar and Student, 2006; Steele-MacInnis et al., 2017; Esposito, 2021). In other cases, it is more difficult. In general, the bubble melt inclusion volume ratio below which a melt inclusion is considered likely to result from homogeneous entrapment is ≤10 vol %: for example, 5 vol % for Hartley et al. (2014) and Moore et al. (2015) or 6 vol % to 8 vol % for Aster et al. (2016). Recently, Hanyu et al. (2020) made a series of homogenization of CO2-rich melt inclusions in olivine phenocrysts from ocean island basalts and used a threshold of 12 vol % to distinguish homogeneous from heterogeneous entrapment. At this stage, it is difficult to set the exact threshold value to be considered for our melt inclusions because of the lack of a model describing the formation and evolution of shrinkage bubbles in the specific case of a CO2-rich magma rising rapidly from mantle depths.
In the population of melt inclusions studied, there is a positive correlation between bubble size and inclusion size, with bubble melt inclusion ratios mostly between 3 vol % and 10 vol % (Fig. 10a). These characteristics are consistent with an origin by homogeneous entrapment for the majority of melt inclusions but do not exclude cases of heterogeneous entrapment. Some bubbles exceed 10 vol %, and there are two melt inclusions with large bubbles (>20 vol %) that must correspond to heterogeneous entrapment. Most of the melt inclusions used for the homogenization experiments had bubbles <10 vol %, with only two inclusions exceeding the 12 vol % threshold (Fig. 10b). Two major results that emerge from Fig. 10b are that there is no positive correlation between bubble volume percentage and total CO2 content and that most of the highest CO2 contents are related to small- (<5 vol %) to medium-sized bubbles (<10 vol %).
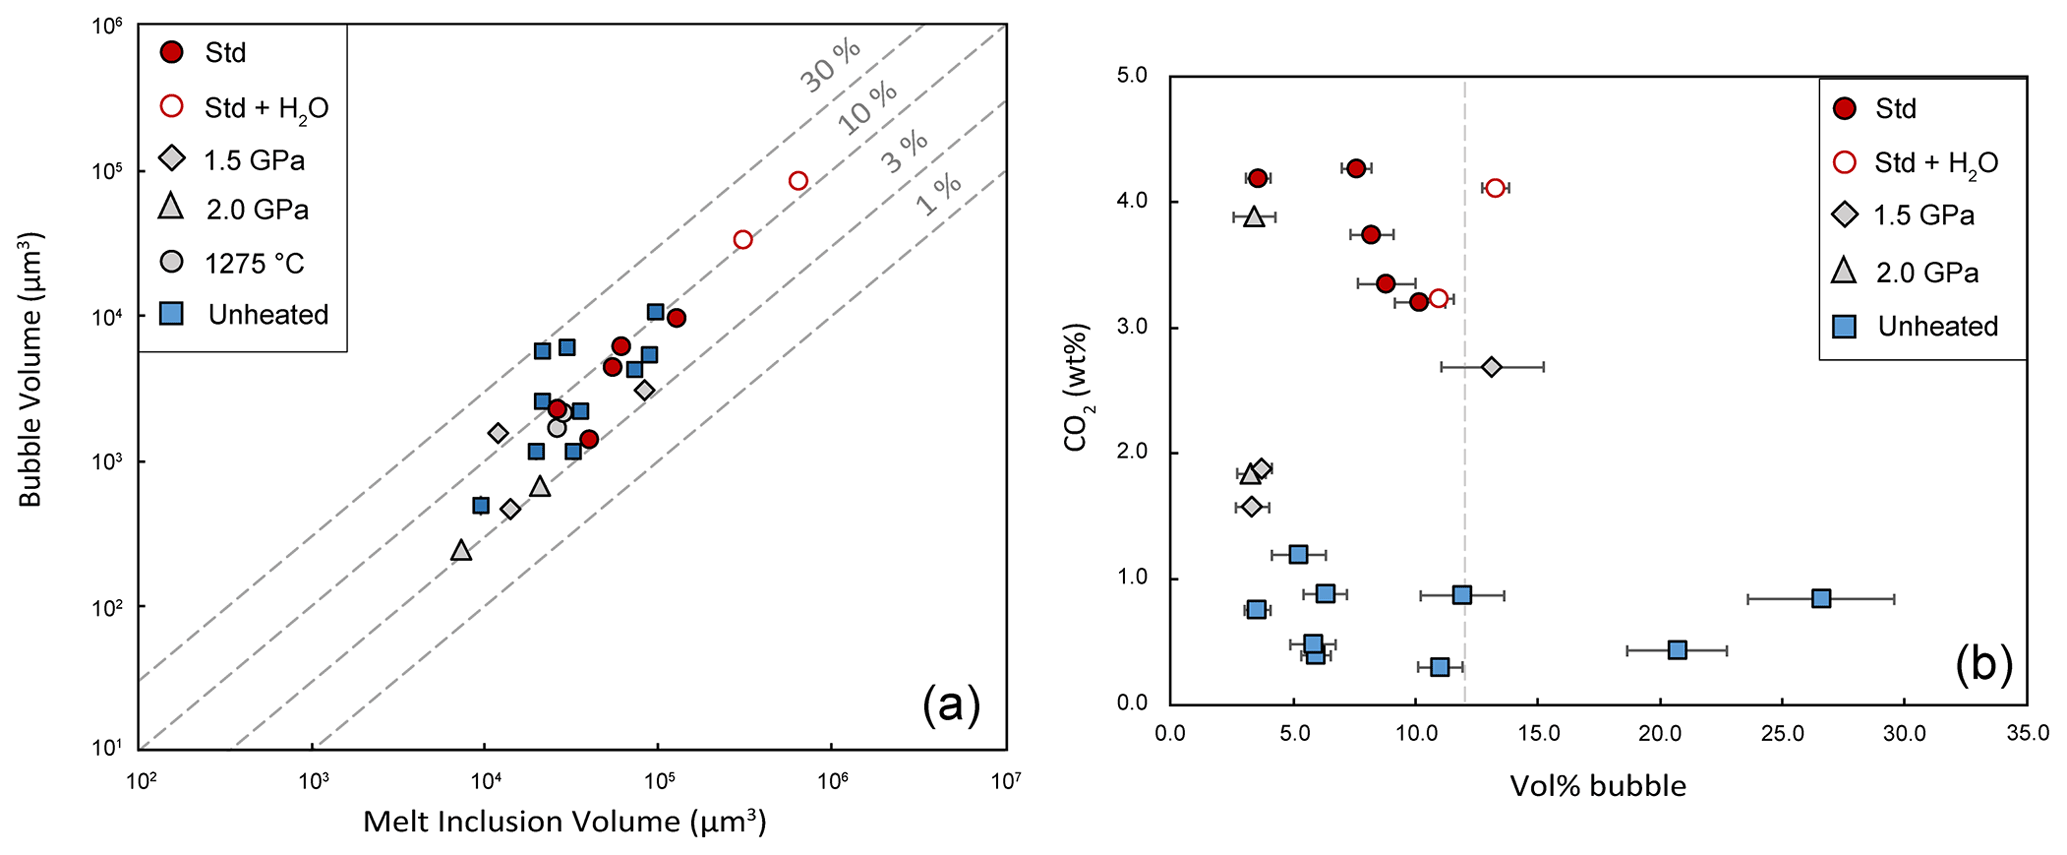
Figure 10(a) Plot of bubble volumes (µm3) as a function of melt inclusion volumes (µm3) for both the unheated melt inclusions and the melt inclusions used in the homogenization experiments (same symbols as in Fig. 9). Isovolumetric lines corresponding to bubble / melt inclusion volume ratios of 1 %, 3 %, 10 %, and 30 % are also shown. Bubble volumes were calculated from the bubble diameters assuming a spherical shape. Melt inclusion volumes and associated errors were computed following the method described by Moore et al. (2015). Most of the melt inclusions have complex shapes that were approximated by an ellipsoidal shape. (b) Plot of the total CO2 contents measured in the homogenization experiments and the CO2 contents measured in the glasses of unheated melt inclusions as a function of bubble sizes (in vol %). The dashed line at 12 vol % is the threshold used by Hanyu et al. (2020) to separate homogeneous from heterogeneous entrapment.
The volumetric analysis above and the relationship between bubbles' percentage by volume and total CO2 contents provide strong arguments in favor of homogeneous entrapment of very CO2-rich basanitic liquids (∼ 4 wt %) at pressures of 2 to 2.5 GPa. As low-silica alkaline liquids are expected to be generated at pressures mostly in the range 2–4 GPa depending on the model (Dasgupta et al., 2007; Foley et al., 2012; Mallik and Dasgupta, 2014; Pilet, 2015), such entrapment pressures correspond to near-source mantle depths. In this scenario of homogeneous entrapment, the lower total CO2 contents measured in some inclusions could reflect a natural variability in the initial CO2 contents, due for instance to melt entrapment at different pressures. Alternatively, melt inclusion entrapment could be heterogeneous and occur at lower pressures but still at least on the order of 1 GPa as indicated by dissolved CO2 contents up to 1.19 wt % in the glasses of unheated melt inclusions. In this case, the wide range of total CO2 contents (from 1.39 wt % to 4.27 wt %) would result from the entrapment of CO2 bubbles in addition to the silicate liquid. The presence of these bubbles could be due either to deep gas exsolution during ascent of CO2-rich primary magmas or to CO2 fluxing from depth. Whatever the scenario, one cannot escape the conclusion that the basanites from the Bas-Vivarais volcanic province were generated in a mantle environment rich in carbon dioxide.
It is beyond the scope of this paper to make a definitive choice between these different petrogenetic scenarios. This will be the focus of a subsequent paper based on systematic studies of melt inclusions from several volcanoes of the Bas-Vivarais province (homogenization experiments at medium to high pressure; trace and major element analyses of unheated and homogenized inclusions).
5.7 Insights into the mantle source of Bas-Vivarais volcanism and the origin of carbon dioxide
Thueyts melt inclusions are characterized by very high CO2 contents. High CO2 contents have already been reported in other alkaline magmas from different continental intraplate settings but not to the same extent as in the Bas-Vivarais volcanic province: for instance, up to 1.8 wt % in basanites from Ross Island, within the West Antarctic Rift System (Rasmussen et al., 2017), or 2.5 wt % in Montcineyre basanite, in the French Massif Central (Schiavi et al., 2020). In basanites from the East African Rift, Hudgins et al. (2015) measured total CO2 contents up to 1 wt % and calculated initial CO2 contents in the primary magmas of 3 wt % to 5 wt % or 5 wt % to 10 wt % on the basis of CO2–Nb and CO2–Cl systematics, respectively.
The abundance of CO2 in Thueyts melt inclusions is in good agreement with current petrogenetic models of low-silica alkaline lavas. It is now well accepted that low-silica magmas such as nephelinites and basanites cannot be produced directly from dry lherzolites and that the presence of volatiles and/or recycled components in the source region is required to explain their major element compositions, their high content of incompatible trace elements, and their isotopic signature (e.g., Pilet, 2015). The nature of the recycled components (oceanic crust, delaminated lower crust) is still a matter of debate, but the participation of a carbonate component is increasingly recognized as being critical (Dasgupta et al., 2007; Zeng et al., 2010; Mallik and Dasgupta, 2014; Hammouda and Keshav, 2015; Xu et al., 2020; Brenna et al., 2021). For example, Xu et al. (2020) concluded that the Cenozoic low-silica alkaline lavas of eastern China were produced in two stages: first partial melting of recycled oceanic crust (eclogite) in the presence of pervasive carbonate melt that yielded relatively silica-rich melts and then reaction between these silica-rich melts and peridotite to generate silica-undersaturated alkaline magmas. Alternatively, low-silica alkaline lavas could be produced directly by low-degree melting of a metasomatized peridotite enriched in CO2 (0.1 wt %–0.25 wt % CO2) by the addition of a carbonatitic melt (Dasgupta et al., 2007).
Direct evidence of carbonatitic magmatism in the French Massif Central is very rare: a few occurrences of carbonatites mixed with Cenozoic volcanic products, with negligible erupted volumes (Chazot and Mergoil-Daniel, 2012), or subtle geochemical signatures of metasomatism by carbonatitic melts or by carbonated alkali basalt melts in some xenoliths from the lithospheric mantle (e.g., Uenver-Thiele et al., 2017; Puziewicz et al., 2020). The generation of low-silica alkaline magmas, such as the basanites of the Bas-Vivarais volcanic province, and the abundance of CO2 in these magmas are arguments in favor of a more pervasive presence of interstitial carbonatitic melt in the deeper mantle of the French Massif Central, beneath the lithosphere–asthenosphere boundary.
In this paper, we present a new technique to homogenize volatile-rich olivine-hosted melt inclusions in a piston-cylinder apparatus at pressures up to 3–4 GPa. We applied this technique to olivine phenocrysts from Thueyts basanite, of the Bas-Vivarais volcanic province, in the French Massif Central. Thueyts melt inclusions were chosen because of their high CO2 contents, as indicated by up to 1.19 wt % dissolved CO2 in the glasses and by the presence of shrinkage bubbles containing a multitude of carbonate microcrystals in addition to CO2 fluid. In all the melt inclusions treated at 2.5 GPa–1300 ∘C and half of those treated at 2 GPa–1300 ∘C, we were able to completely homogenize the melt inclusions, and we obtained total CO2 contents ranging from 3.20 wt % to 4.27 wt % (3.7 wt % on average). In all the other melt inclusions (equilibrated at 1.5 or 2 GPa and 1300 ∘C or at 2.5 GPa–1275 ∘C), we obtained lower and more variable total CO2 contents (1.39 wt % to 2.93 wt %), either because of a natural variability in the initial CO2 contents or because of CO2 loss by decrepitation. The abundance of CO2 in the primary magmas of the Bas-Vivarais volcanic province is in good agreement with the presence of a carbonatite component in the mantle source regions of low-silica alkaline magmas, as advocated by most current petrogenetic models. High-pressure homogenization of melt inclusions representative of near-primary mantle magmas is a powerful approach to investigate the nature of their source regions and the melting conditions.
Most of the relevant data are included in the article (in Tables 2 and 3) or the Supplement (Tables S2, S3, and S4). Raw data not included can be provided by the corresponding author upon request.
The supplement related to this article is available online at: https://doi.org/10.5194/ejm-34-325-2022-supplement.
DL designed the experiments at high pressure, and RB carried them out. RB prepared the samples and performed the measurements with FS. RB and NC carried out the experiments with the heating stage. CF performed the measurements with the CHNS. RB, DL, FS, and NC analyzed the data. RB and DL prepared the manuscript with contributions from all other co-authors.
The contact author has declared that neither they nor their co-authors have any competing interests.
Publisher's note: Copernicus Publications remains neutral with regard to jurisdictional claims in published maps and institutional affiliations.
This article is part of the special issue “Probing the Earth: experiments and mineral physics at mantle depths”. It is not associated with a conference.
The authors thank the following people for their help and technical assistance: Jean-Luc Devidal (electron probe microanalysis), Emmy Voyer (scanning electron microscopy), Franck Pointud and Antoine Mathieu (management and maintenance of experimental facilities), and Jean-Louis Fruquière and Cyrille Guillot (machine shop). We also thank Hans Keppler (Bayerisches Geoinstitut), Ali Bouhifd, Mickaël Laumonier, Manon Hardiagon, and Emmanuelle Defive for scientific discussions and advice. The field-emission SEM image in Fig. 1c was made with a Helios G4 PFIB CXe DualBeam at the Thermo Fisher Scientific NanoPort in Eindhoven, the Netherlands: Letian Li and Laurent Vassé are warmly thanked for their hospitality and expertise. We are grateful to the two reviewers, Rosario Esposito and Maxim Portnyagin, for their constructive comments, and to Max Wilke for editorial handling and patience as well as Elisabetta Rampone. Roxane Buso thanks the region of Auvergne-Rhône-Alpes for funding her doctoral thesis. This is a contribution of the Laboratory of Excellence ClerVolc (Clermont-Ferrand Centre for Volcano Research; no. 535).
This research has been supported by the Région Auvergne-Rhône-Alpes (Pack Ambition Recherche; grant no. VolcAURA-LS172914).
This paper was edited by Max Wilke and reviewed by Rosario Esposito and Maxim Portnyagin.
Akella, J., Vaidya, S. N., and Kennedy, G. C.: Melting of sodium chloride at pressures to 65 kbar, Phys. Rev., 185, 1135–1140, https://doi.org/10.1103/PhysRev.185.1135, 1969.
Anderson, A. T. and Brown, G. G.: CO2 contents and formation pressures of some Kilauean melt inclusions, Am. Mineral., 78, 794–803, 1993.
Anderson, A. T., Davis, A. M., and Lu, F.: Evolution of Bishop Tuff rhyolitic magma based on melt and magnetite inclusions and zoned phenocrysts, J. Petrol., 41, 449–473, https://doi.org/10.1093/petrology/41.3.449, 2000.
Aster, E. M., Wallace, P. J., Moore, L. R., Watkins, J., Gazel, E., and Bodnar, R. J.: Reconstructing CO2 concentrations in basaltic melt inclusions using Raman analysis of vapor bubbles, J. Volcanol. Geoth. Res., 323, 148–162, https://doi.org/10.1016/j.jvolgeores.2016.04.028, 2016.
Audétat, A. and Lowenstern, J. B.: Melt inclusions, in: Treatise on Geochemistry, 2nd Edn., edited by: Holland, H. D. and Turekian, K. K., Elsevier, Oxford, 143–173, https://doi.org/10.1016/B978-0-08-095975-7.01106-2, 2014.
Baker, D. R. and Moretti, R.: Modeling the solubility of sulfur in magmas: A 50-year old geochemical challenge, Rev. Mineral. Geochem., 73, 167–213, https://doi.org/10.2138/rmg.2011.73.7, 2011.
Bartoli, O., Cesare, B., Poli, S., Acosta-Vigil, A., Esposito, R., Turina, A., Bodnar, R. J., Angel, R. J., and Hunter, J.: Nanogranite inclusions in migmatitic garnet: behavior during piston cylinder re-melting experiments, Geofluids, 13, 405–420, https://doi.org/10.1111/gfl.12038, 2013.
Bartoli, O., Acosta-Vigil, A., Ferrero, S., and Cesare, B.: Granitoid magmas preserved as melt inclusions in high-grade metamorphic rocks, Am. Mineral., 101, 1543–1559, https://doi.org/10.2138/am-2016-5541CCBYNCND, 2016.
Bodnar, R. J. and Student, J. J.: Melt inclusions in plutonic rocks: petrography and microthermometry, in: Melt inclusions in plutonic rocks, edited by: Webster J. D., Mineralogical Association of Canada Short Course, 36, 1–25, https://doi.org/10.1111/j.1468-8123.2007.00192.x, 2006.
Brenna M., Ubide, T., Nichols, A. R. L., Mollo, S., and Pontesilli, A.: Anatomy of Intraplate Monogenetic Alkaline Basaltic Magmatism: Clues From Magma, Crystals, and Glass, in: Crustal Magmatic System Evolution: Anatomy, Architecture, and Physico-Chemical Processes, edited by: Masotta, M., Beier, C., and Mollo, S., American Geophysical Union, Geophys. Monogr., 264, 79–103, https://doi.org/10.1002/9781119564485.ch4, 2021.
Brooker, R. A., Kohn, S. C., Holloway, J. R., and McMillan, P. F.: Structural controls on the solubility of CO2 in silicate melts, Part I: bulk solubility data, Chem. Geol., 174, 225–239, https://doi.org/10.1016/S0009-2541(00)00353-3, 2001.
Cannatelli, C., Doherty, A. L., Esposito, R., Lima, A., and De Vivo, B.: Understanding a volcano through a droplet: A melt inclusion approach, J. Geochem. Explor., 171, 4–19, https://doi.org/10.1016/j.gexplo.2015.10.003, 2016.
Carlson, W. D.: Vanadium pentoxide as a high-temperature solvent for phase equilibrium studies in CaO-MgO-AI203-SiO2, Contrib. Mineral. Petr., 92, 89–92, https://doi.org/10.1007/BF00373966, 1986.
Cesare, B., Acosta-Vigil, A., Bartoli, O., and Ferrero, S.: What can we learn from melt inclusions in migmatites and granulites?, Lithos, 239, 186–216, https://doi.org/10.1016/j.lithos.2015.09.028, 2015.
Chazot, G. and Mergoil-Daniel, J.: Co-eruption of carbonate and silicate magmas during volcanism in the Limagne graben (French Massif Central), Lithos, 154, 130–146, https://doi.org/10.1016/j.lithos.2012.06.032, 2012.
Chen, Y., Provost, A., Schiano, P., and Cluzel, N.: The rate of water loss from olivine hosted melt inclusions, Contrib. Mineral. Petr., 162, 625–636, https://doi.org/10.1007/s00410-011-0616-5, 2011.
Danyushevsky, L. V., McNeill, A. W., and Sobolev, A. V.: Experimental and petrological studies of melt inclusions in phenocrysts from mantle-derived magmas: an overview of techniques, advantages and complications, Chem. Geol., 183, 5–24, https://doi.org/10.1016/S0009-2541(01)00369-2, 2002.
Dasgupta, R., Hirschmann, M. M., and Smith, N. D.: Partial melting experiments of peridotite + CO2 at 3 GPa and genesis of alkalic ocean island basalts, J. Petrol., 48, 2093–2124, https://doi.org/10.1093/petrology/egm053, 2007.
Drignon, M. J., Arbaret, L., Cluzel, N., Nielsen, R. L., and Bodnar, R. J.: Experimentally induced volumetric re-equilibration of plagioclase-hosted melt inclusions, Geochem. Geophy. Geosy., 22, 2020GC009357, https://doi.org/10.1029/2020GC009357, 2021.
Duan, X.: A general model for predicting the solubility behaviour of H2O-CO2 fluids in silicate melts over a wide range of pressure, temperature and compositions, Geochim. Cosmochim. Ac., 125, 582–609, https://doi.org/10.1016/j.gca.2013.10.018, 2014.
Eguchi, J. and Dasgupta, R.: A CO2 solubility model for silicate melts from fluid saturation to graphite or diamond saturation, Chem. Geol., 487, 23–38, https://doi.org/10.1016/j.chemgeo.2018.04.012, 2018.
Esposito, R.: A protocol and review of methods to select, analyze and interpret melt inclusions to determine pre-eruptive volatile contents of magmas, in: Fluid and Melt Inclusions: Applications to Geologic Processes, edited by: Lecumberri-Sanchez, P., Steele-MacInnis, M., and Kontak, D. J., Mineralogical Association of Canada Short Course, 49, 163–194, 2021.
Esposito, R., Bodnar, R. J., Danyushevsky, L. V., De Vivo, B., Fedele, L., Hunter, J., Lima, A., and Shimizu, N.: Volatile evolution of magma associated with the Solchiaro eruption in the Phlegrean Volcanic District (Italy), J. Petrol., 52, 2431–2460, https://doi.org/10.1093/petrology/egr051, 2011.
Esposito, R., Hunter, J., Schiffbauer, J., Shimizu, N., Bodnar, R. J.: An assessment of the reliability of melt inclusions as recorders of the pre-eruptive volatile content of magmas, Am. Mineral., 99, 976–998, https://doi.org/10.2138/am.2014.4574, 2014.
Esposito, R., Lamadrid, H. M., Redi, D., Steele-MacInnis, M., Bodnar, R. J., Manning, C. E., De Vivo, B., Cannatelli, C., and Lima, A.: Detection of liquid H2O in vapor bubbles in reheated melt inclusions: Implications for magmatic fluid composition and volatile budgets of magmas?, Am. Mineral., 101, 1691–1695, https://doi.org/10.2138/am-2016-5689, 2016.
Ferrero, S. and Angel, R. J.: Micropetrology: Are Inclusions Grains of Truth?, J. Petrol., 59, 1671–1700, https://doi.org/10.1093/petrology/egy075, 2018.
Ferrero, S., O'Brien, P. J., Borghini, A., Wunder, B., Wälle, M., Günter, C., and Ziemann, M. A.: A treasure chest full of nanogranitoids: an archive to investigate crustal melting in the Bohemian Massif, in: Metamorphic Geology: Microscale to Mountain Belts, edited by: Ferrero, S., Lanari, P., Goncalves, P., and Grosch, E. G., Geol. Soc. Spec. Publ., 478, 13–38, https://doi.org/10.1144/SP478.19, 2018.
Foley, S. F., Link, K., Tiberindwa, J. V., and Barifaijo, E.: Patterns and origin of igneous activity around the Tanzanian craton, J. Afr. Earth Sci., 62, 1–18, https://doi.org/10.1016/j.jafrearsci.2011.10.001, 2012.
Frezzotti, M. L.: Silicate-melt inclusions in magmatic rocks: applications to petrology, Lithos, 55, 273–299, https://doi.org/10.1016/S0024-4937(00)00048-7, 2001.
Gaborieau, M., Laubier, M., Bolfan-Casanova, N., McCammon, C. A., Vantelon, D., Chumakov, A. I., Schiavi, F., Neuville, D. R., and Venugopal, S.: Determination of Fe3+/ΣFe of olivine-hosted melt inclusions using Mössbauer and XANES spectroscopy, Chem. Geol., 547, 119646, https://doi.org/10.1016/j.chemgeo.2020.119646, 2020.
Gaetani, G. A., O'Leary, J. A., Shimizu, N., Bucholz, C. E., and Newville, M.: Rapid reequilibration of H2O and oxygen fugacity in olivine-hosted melt inclusions, Geology, 40, 915–918, https://doi.org/10.1130/G32992.1, 2012.
Hammouda, T. and Keshav, S.: Melting in the mantle in presence of carbon: review of experiments and discussion on the origin of carbonatites, Chem. Geol., 418, 171–188, https://doi.org/10.1016/j.chemgeo.2015.05.018, 2015.
Hanyu, T., Yamamoto, J., Kimoto, K., Shimizu, K., and Ushikubo, T.: Determination of total CO2 in melt inclusions with shrinkage bubbles, Chem. Geol., 557, 119855, https://doi.org/10.1016/j.chemgeo.2020.119855, 2020.
Hartley, M. E., Maclennan, J., Edmonds, M., and Thordarson, T.: Reconstructing the deep CO2 degassing behaviour of large basaltic fissure eruptions, Earth Planet. Sc. Lett., 393, 120–131, https://doi.org/10.1016/j.epsl.2014.02.031, 2014.
Helo, C., Longpré, M.-A., Shimizu, N., Clague, D. A., and Stix, J.: Explosive eruptions at mid-ocean ridges driven by CO2-rich magmas, Nat. Geosci., 4, 260–263, https://doi.org/10.1038/ngeo1104, 2011.
Hudgins, T. R., Mukasa, S. B., Simon, A. C., Moore, G., and Barifaijo, E.: Melt inclusion evidence for CO2-rich melts beneath the western branch of the East African Rift: implications for long-term storage of volatiles in the deep lithospheric mantle, Contrib. Mineral. Petr., 169, 46, https://doi.org/10.1007/s00410-015-1140-9, 2015.
Ito, K., Sato, H., Kanazawa, H., Kawame, N., Tamada, O., Miyazaki, K., Uehara, S., Iio, Y., Takei, H., Kitazawa, T., Koike, M., Matsushita, Y., and Ito, Y.: First synthesis of olivine single crystal as large as 250 carats, J. Cryst. Growth, 253, 557–561, https://doi.org/10.1016/S0022-0248(03)01029-7, 2003.
Jannot, S., Schiano, P., and Boivin, P.: Melt inclusions in scoria and associated mantle xenoliths of Puy Beaunit Volcano, Chaîne des Puys, Massif Central, France, Contrib. Mineral. Petr., 149, 600–612, https://doi.org/10.1007/s00410-005-0670-y, 2005.
Kamenetsky, V. S. and Kamenetsky, M. B.: Magmatic fluids immiscible with silicate melts: examples from inclusions in phenocrysts and glasses, and implications for magma evolution and metal transport, Geofluids, 10, 293–311, https://doi.org/10.1111/j.1468-8123.2009.00272.x, 2010.
Kamenetsky, V. S., Davidson, P., Mernagh, T. P., Crawford, A. J., Gemmell, J. B., Portnyagin, M. V., and Shinjo, R.: Fluid bubbles in melt inclusions and pillow-rim glasses: high-temperature precursors to hydrothermal fluids?, Chem. Geol., 183, 349–364, https://doi.org/10.1016/S0009-2541(01)00383-7, 2002.
Kent, A. J. R.: Melt inclusions in basaltic and related volcanic rocks, Rev. Mineral. Geochem., 69, 273–331, https://doi.org/10.2138/rmg.2008.69.8, 2008.
Kimura, T.: Molten Salt Synthesis of Ceramic Powders, in: Advances in Ceramics – Synthesis and Characterization, Processing and Specific Applications, chap. 4, edited by: Sikalidis, C., IntechOpen, 75–100, https://doi.org/10.1002/chin.201326193, 2011.
Lewis, K. R., Ustunisik, G. K., and Nielsen, R. L.: Experimental constraints on homogenization of plagioclase-hosted melt inclusions from plagioclase ultraphyric basalts, Front. Earth Sci., 8, 584371, https://doi.org/10.3389/feart.2020.584371, 2021.
Li, J. and Li, S.: Application of hydrothermal diamond anvil cell to homogenization experiments of silicate melt inclusions, Acta Geol. Sin.-Engl., 88, 854–864, https://doi.org/10.1111/1755-6724.12242, 2014.
Long, D. A.: Raman Spectroscopy, in: The Characterization of Chemical Purity: Organic Compounds, edited by: Staveley, L. A. K., Elsevier, New-York, 276 pp., 1977.
Lowenstern, J. B.: Applications of silicate melt inclusions to the study of magmatic volatiles, in: Magmas, Fluids and Ore Deposits, Volume #23, edited by: Thompson J. F. H., Mineralogical Association of Canada Short Course, 71–99, 1995.
Maclennan, J.: Bubble formation and decrepitation control the CO2 content of olivine-hosted melt inclusions, Geochem. Geophy. Geosy., 18, 597–616, https://doi.org/10.1002/2016GC006633, 2017.
Malaspina, N., Hermann, J., Scambelluri, M., and Compagnoni, R.: Polyphase inclusions in garnet-orthopyroxenite (Dabie Shan, China) as monitors for metasomatism and fluid-related trace element transfer in subduction zone peridotite, Earth Planet. Sc. Lett., 249, 173–187, https://doi.org/10.1016/j.epsl.2006.07.017, 2006.
Mallik, A. and Dasgupta, R.: Effect of variable CO2 on eclogite-derived andesite and lherzolite reaction at 3 GPa – Implications for mantle source characteristics of alkalic ocean island basalts, Geochem. Geophy. Geosy., 15, 1533–1557, https://doi.org/10.1002/2014GC005251, 2014.
Massare, D., Métrich, N., and Clocchiatti, R.: High-temperature experiments on silicate melt inclusions in olivine at 1 atm: Inference on temperatures of homogenization and H2O concentrations, Chem. Geol., 183, 87–98, https://doi.org/10.1016/S0009-2541(01)00373-4, 2002.
Métrich, N. and Wallace, P. J.: Volatile abundances in basaltic magmas and their degassing paths tracked by melt inclusions, Rev. Mineral. Geochem., 69, 363–402, https://doi.org/10.2138/rmg.2008.69.10, 2008.
Mironov, N., Portnyagin, M., Botcharnikov, R., Gurenko, A., Hoernle, K., and Holtz, F.: Quantification of the CO2 budget and H2O-CO2 systematics in subduction-zone magmas through the experimental hydration of melt inclusions in olivine at high H2O pressure, Earth Planet. Sc. Lett., 425, 1–11, https://doi.org/10.1016/j.epsl.2015.05.043, 2015.
Moore, L. R., Gazel, E., Tuohy, R., Lloyd, A., Esposito, R., Steele-MacInnis, M., Hauri, E. H., Wallace, P. J., Plank, T., and Bodnar, R. J.: Bubbles matter: An assessment of the contribution of vapor bubbles to melt inclusion volatile budgets, Am. Mineral., 100, 806–823, https://doi.org/10.2138/am-2015-5036, 2015.
Morizet, Y., Brooker, R. A., Iacono-Marziano, G., and Kjarsgaard, B. A.: Quantification of dissolved CO2 in silicate glasses using micro-Raman spectroscopy, Am. Mineral., 98, 1788–1802, https://doi.org/10.2138/am.2013.4516, 2013.
Naumov, V. B., Portnyagin, M. V., Tolstykh, M. L., and Yarmolyuk, V. V.: Composition of magmatic melts from the Southern Baikal volcanic region: A study of inclusions in olivine from trachybasalts, Geochem. Int., 41, 213–223, 2003.
Nomade, S., Genty, D., Sasco, R., Scao, V., Féruglio, V., Baffier, D., Guillou, H., Bourdier, C., Valladas, H., Reigner, E., Debard, E., Pastre, J.-F., and Geneste, J.-M.: A 36,000-year-old volcanic eruption depicted in the Chauvet-Pont d'Arc Cave (Ardèche, France)?, PLoS ONE, 11, e0146621, https://doi.org/10.1371/journal.pone.0146621, 2016.
Perchuk, A. L., Burchard, M., Maresch, W. V., and Schertl, H. P.: Melting of hydrous and carbonate mineral inclusions in garnet host during ultrahigh pressure experiments, Lithos, 103, 25–45, https://doi.org/10.1016/j.lithos.2007.09.008, 2008.
Perrin, J., Vielzeuf, D., Laporte, D., Ricolleau, A., Rossman, G. R., and Floquet, N.: Raman characterization of synthetic magnesian calcites, Am. Mineral., 101, 2525–2538, https://doi.org/10.2138/am-2016-5714, 2016.
Pilet, S.: Generation of low-silica alkaline lavas: Petrological constraints, models, and thermal implications, in: The Interdisciplinary Earth: A Volume in Honor of Don L. Anderson, edited by: Foulger, G. R., Lustrino, M., and King, S. D., Geol. S. Am. S. 514 and American Geophysical Union Special Publication 71, 281–304, https://doi.org/10.1130/2015.2514(17), 2015.
Portnyagin, M., Almeev, R., Matveev, S., and Holtz, F.: Experimental evidence for rapid water exchange between melt inclusions in olivine and host magma, Earth Planet. Sc. Lett., 272, 541–552, https://doi.org/10.1016/j.epsl.2008.05.020, 2008.
Portnyagin, M., Mironov, N., Botcharnikov, R., Gurenko, A., Almeev, R. R., Luft, C., and Holtz, F.: Dehydration of melt inclusions in olivine and implications for the origin of silica-undersaturated island-arc melts, Earth Planet. Sc. Lett., 517, 95–105, https://doi.org/10.1016/j.epsl.2019.04.021, 2019.
Putirka, K. D., Perfit, M., Ryerson, F. J., and Jackson, M. G.: Ambient and excess mantle temperatures, olivine thermometry, and active vs. passive upwelling, Chem. Geol., 241, 177–206, https://doi.org/10.1016/j.chemgeo.2007.01.014, 2007.
Puziewicz, J., Matusiak-Małek, M., Ntaflos, T., Grégoire, M., Kaczmarek, M.-A., Aulbach, S., Ziobro, M., and Kukuła, A.: Three major types of subcontinental lithospheric mantle beneath the Variscan orogen in Europe, Lithos, 362–363, 105467, https://doi.org/10.1016/j.lithos.2020.105467, 2020.
Rasmussen, D. J., Kyle, P. R., Wallace, P. J., Sims, K. W. W., Gaetani, G. A., and Phillips, E. H.: Understanding degassing and transport of CO2-rich alkalic magmas at Ross Island, Antarctica using olivine-hosted melt inclusions, J. Petrol., 58, 841–862, https://doi.org/10.1093/petrology/egx036, 2017.
Rasmussen, D. J., Plank, T. A., Wallace, P. J., Newcombe, M. E., and Lowenstern, J. B.: Vapor-bubble growth in olivine-hosted melt inclusions, Am. Mineral., 105, 1898–1919, https://doi.org/10.2138/am-2020-7377, 2020.
Robidoux, P., Frezzotti, M. L., Hauri, E. H., and Aiuppa, A.: Shrinkage bubbles: the C-O-H-S magmatic fluid system at San Cristobal volcano, J. Petrol., 59, 2093–2122, https://doi.org/10.1093/petrology/egy092, 2018.
Rochette, P., Bertrand, H., Braun, C., and Berger, E.: La province volcanique Pléistocène Supérieur du Bas-Vivarais (Ardèche, France): propagation de fentes crustales en échelons?, CR Acad. Sci., 316, 913–920, 1993.
Roedder, E.: Origin and significance of magmatic inclusions, B. Mineral., 102, 487–510, 1979.
Roedder, E.: Fluid inclusion evidence for immiscibility in magmatic differentiation, Geochim. Cosmochim. Ac., 56, 5–20, https://doi.org/10.1016/0016-7037(92)90113-W, 1992.
Rose-Koga, E. F., Koga, K. T., Devidal, J-L., Shimizu, N., Le Voyer, M., Dalou, C., and Döbeli, M.: In-situ measurements of magmatic volatile elements, F, S, and Cl, by electron microprobe, secondary ion mass spectrometry, and heavy ion elastic recoil detection analysis, Am. Mineral., 105, 616–626, https://doi.org/10.2138/am-2020-7221, 2020.
Schiano, P.: Primitive mantle magmas recorded as silicate melt inclusions in igneous minerals, Earth Sci. Rev., 63, 121–144, https://doi.org/10.1016/S0012-8252(03)00034-5, 2003.
Schiavi, F., Provost, A., Schiano, P., and Cluzel, N.: P–V–T–X evolution of olivine-hosted melt inclusions during high-temperature homogenization treatment, Geochim. Cosmochim. Ac., 172, 1–21, https://doi.org/10.1016/j.gca.2015.09.025, 2016.
Schiavi, F., Bolfan-Casanova, N., Withers, A. C., Médard, E., Laumonier, M., Laporte, D., Flaherty, T., and Gómez-Ulla, A.: Water quantification in silicate glasses by Raman spectroscopy: Correcting for the effects of confocality, density and ferric iron, Chem. Geol., 483, 312–331, https://doi.org/10.1016/j.chemgeo.2018.02.036, 2018.
Schiavi, F., Bolfan-Casanova, N., Buso, R., Laumonier, M., Laporte, D., Medjoubi, K., Venugopal, S., Gómez-Ulla, A., Cluzel, N., and Hardiagon, M.: Quantifying magmatic volatiles by Raman microtomography of glass inclusion-hosted bubbles, Geochem. Perspect. Lett., European Association of Geochemistry, 16, 17–24, https://doi.org/10.7185/geochemlet.2038, 2020.
Shaw, A. M., Behn, M. D., Humphris, S. E., Sohn, R. A., and Gregg, P. M.: Deep pooling of low degree melts and volatile fluxes at the 85∘ E segment of the Gakkel Ridge: Evidence from olivine-hosted melt inclusions and glasses, Earth Planet. Sc. Lett., 289, 311–322, https://doi.org/10.1016/j.epsl.2009.11.018, 2010.
Sheikh, R. A.: The synthesis of cementitious compounds in molten salts, Doctoral dissertation, University College London, 2016.
Skirius, C. M., Peterson, J. W., and Anderson, A. T.: Homogenizing rhyolitic glass inclusions from the Bishop Tuff, Am. Mineral., 75, 1381–1398, 1990.
Skogby, H.: Mineral synthesis by flux-growth methods, in: Microscopic properties and processes in minerals, edited by: Wright, K. and Catlow, R., Kluwer academic Publishers, the Netherlands, 189–199, 1999.
Sobolev, A. V.: Melt inclusions in minerals as a source of principle petrological information, Petrology, 4, 228–239, 1996.
Song, Y., Chou, I.-M., Hu, W., Burruss, R., and Lu, W.: CO2 density-Raman shift relation derived from synthetic inclusions in fused silica capillaries and its application, Acta Geol. Sin.-Eng., 83, 932–938, https://doi.org/10.1111/j.1755-6724.2009.00090.x, 2009.
Sparks, H. A. and Mavrogenes, J. A.: Sulfide melt inclusions as evidence for the existence of a sulfide partial melt at Broken Hill, Australia, Econ. Geol., 100, 773–779, https://doi.org/10.2113/gsecongeo.100.4.773, 2005.
Steele-MacInnis, M., Esposito, R., and Bodnar, R. J.: Thermodynamic model for the effect of post-entrapment crystallization on the H2O-CO2 systematics of vapor-saturated, silicate melt inclusions, J. Petrol., 52, 2461–2482, https://doi.org/10.1093/petrology/egr052, 2011.
Steele-MacInnis, M., Esposito, R., Moore, L. R., and Hartley, M. E.: Heterogeneously entrapped, vapor-rich melt inclusions record pre-eruptive magmatic volatile contents, Contrib. Mineral. Petr., 172, 18, https://doi.org/10.1007/s00410-017-1343-3, 2017.
Student, J. J. and Bodnar, R. J.: Silicate melt inclusions in porphyry copper deposits: identification and homogenization behavior, Can. Mineral., 42, 1583–1599, https://doi.org/10.2113/gscanmin.42.5.1583, 2004.
Thibault, Y. and Holloway, J. R.: Solubility of CO2 in a Ca-rich leucitite: effects of pressure, temperature, and oxygen fugacity, Contrib. Mineral. Petr., 116, 216–224, 1994.
Thomas, R., Webster, J. D., and Davidson, P.: Understanding pegmatite formation: the melt and fluid inclusion approach, Mineralogical Association of Canada, Short Course, Montreal, Quebec, 36, 189–210, 2006.
Toplis, M. J.: The thermodynamics of iron and magnesium partitioning between olivine and liquid: Criteria for assessing and predicting equilibrium in natural and experimental systems, Contrib. Mineral. Petr., 149, 22–39, https://doi.org/10.1007/s00410-004-0629-4, 2005.
Tucker, J. M., Hauri, E. H., Pietruszka, A. J., Garcia, M. O., Marske, J. P., and Trusdell, F. A.: A high carbon content of the Hawaiian mantle from olivine-hosted melt inclusions, Geochim. Cosmochim. Ac., 254, 156–172, https://doi.org/10.1016/j.gca.2019.04.001, 2019.
Uenver-Thiele, L., Woodland, A. B., Seitz, H.-M., Downes, H., and Altherr, R.: Metasomatic processes revealed by trace element and redox signatures of the lithospheric mantle beneath the Massif Central, France, J. Petrol., 58, 395–422, https://doi.org/10.1093/petrology/egx020, 2017.
Venugopal, S., Schiavi, F., Moune, S., Bolfan-Casanova, N., Druitt, T., Williams-Jones, G.: Melt inclusion vapour bubbles: the hidden reservoir for major and volatile elements, Sci. Rep.-UK, 10, 9034, https://doi.org/10.1038/s41598-020-65226-3, 2020.
Wallace, P. J. and Edmonds, M.: The sulfur budget in magmas: Evidence from melt inclusions, submarine glasses, and volcanic gas emissions, Rev. Mineral. Geochem., 73, 215–246, https://doi.org/10.2138/rmg.2011.73.8, 2011.
Wallace, P. J., Kamenetsky, V. S., and Cervantes, P.: Melt inclusion CO2 contents, pressures of olivine crystallization, and the problem of shrinkage bubbles, Am. Mineral., 100, 787–794, https://doi.org/10.2138/am-2015-5029, 2015.
Xu, R., Liu, Y., Wang, X-C., Foley, S. F., Zhang, Y., and Yuan, H.: Generation of continental intraplate alkali basalts and implications for deep carbon cycle, Earth Sci. Rev., 201, 103073, https://doi.org/10.1016/j.earscirev.2019.103073, 2020.
Zeng, G., Chen, L. H., Xu, X. S., Jiang, S. Y., and Hofmann, A. W.: Carbonated mantle sources for Cenozoic intra-plate alkaline basalts in Shandong, North China, Chem. Geol., 273, 35–45, https://doi.org/10.1016/j.chemgeo.2010.02.009, 2010.