the Creative Commons Attribution 4.0 License.
the Creative Commons Attribution 4.0 License.
 | 10 Nov 2021
New insights in the mechanisms of the reaction 3.65 Å phase = clinoenstatite + water down to nanoscales
Oona Appelt
Bernd Wunder
Richard Wirth
The reaction of 3.65 Å phase clinoenstatite + water was investigated in five experiments at 10 GPa, 470–600 ∘C, using a rotating multi-anvil press. Under these conditions, clinoenstatite exists in its high-pressure modification, which, however, is not quenchable to ambient conditions but transforms back to low-pressure clinoenstatite. The quenched run products were characterized by electron microprobe analyses (EMPA), powder X-ray diffraction (XRD), Raman spectroscopy and by high-resolution transmission electron microscopy (HRTEM) on focused ion beam (FIB)-cut foils. We bracketed the reaction in the T range 470 to 510 ∘C (at 10 GPa). The hydration of clinoenstatite to the 3.65 Å phase at 470 ∘C was very sluggish and incomplete even after 96 h. Clinoenstatites range in size from less than 1 to up to 50 µm. Usually clinoenstatite has a very small grain size and shows many cracks. In sub-micron-sized broken clinoenstatite, an amorphous phase (0.91Mg:1.04Si, with about 20 wt % H2O) was observed, which further transformed with increasing reaction time into the 3.65 Å phase (1Mg:1Si, with 34 wt % H2O). Thus, the sub-micron-sized fractured clinoenstatite transformed via an amorphous water-bearing precursor phase to the 3.65 Å phase. The dehydration to clinoenstatite was faster but still incomplete after 72 h at 600 ∘C. From the backscattered electron images of the recovered sample of the dehydration experiment, it is obvious that there is a high porosity due to dehydration of the 3.65 Å phase. Again, the grain size of clinoenstatite ranges from less than 1 up to 50 µm. There are still some clinoenstatite crystals from the starting material present, which can clearly be distinguished from newly formed sub-micron-sized clinoenstatite. Additionally, we observe a water-rich crystalline phase, which does not represent the 3.65 Å phase. Its Raman spectra show the double peaks around 700 and 1000 cm−1 characteristic for enstatite and strong water bands at 3700 and 3680 cm−1. The Mg:Si ratio of 0.90:1.04 was determined by EMPA, totalling to 81 wt %, in accordance with its high water content. Diffraction patterns from high-resolution images (fast Fourier transform – FFT) are in agreement with an orthoenstatite crystal structure (Pbca).
The surprising observation of this study is that, in both directions of the investigated simple reaction, additional metastable phases occur which are amorphous in the hydration and crystalline in the dehydration reaction. Both additional phases are water rich and slightly deviate in composition from the stable products 3.65 Å phase and clinoenstatite, respectively. Thus, as a general remark, conventional investigations on reaction progress should be complemented by nanoscale investigations of the experimental products because these might reveal unpredicted findings relevant for the understanding of mantle processes.
The extreme reduction in grain size observed in the dehydration experiments due to the formation of nanocrystalline clinoenstatite rather than the slowly released fluids might cause mechanical instabilities in the Earth's mantle and, finally, induce earthquakes.
- Article
(12099 KB) - Full-text XML
- Companion paper
-
Supplement
(277 KB) - BibTeX
- EndNote


For decades, a considerable part of geoscience research has been focused on the deep water cycle, but there are still open questions, e.g. how and to what extent water is transported into the deeper mantle. It is obvious that subducting slabs must be involved, but details about the mineral phases and their structural changes with pressure, temperature and time are often unconstrained. Serpentine and talc are the most abundant H2O-bearing phases during the subduction of hydrothermally altered oceanic crust. They have limited thermal stabilities, so they cannot transport H2O into the deep mantle below depths of about 200 km. Dense hydrous magnesium silicates (DHMSs) are considered to be carriers of water down to greater depths of the Earth's mantle via subduction (e.g. Wunder, 1998; Stalder and Ulmer, 2001; Ohtani et al., 2004; Mussi et al., 2012; Maurice et al., 2018). They are assumed to be formed from the hydrothermally altered oceanic crust in combination with dehydration reactions, which would produce the water necessary for their formation within the normally dry peridotitic system. If DHMSs are present in the Earth's upper mantle, they would have significant effects on the properties of the mantle, e.g. elastic wave velocities and electrical conductivity. They also have limited thermal stabilities, and their dehydration reactions during subduction might be associated with water-influenced processes such as melt generation, metasomatism and seismicity (e.g. Ferrand et al., 2017; Zhan, 2020). Therefore, it is of great importance to study DHMSs' stabilities and understand phase transitions in detail.
In this article, we focus on the DHMSs 3.65 Å phase, which is named after the d spacing of its prominent X-ray reflection. Wunder et al. (2011) synthesized the 3.65 Å phase as a main product beside traces of the 10 Å phase or stishovite in multi-anvil experiments at 9.5–10 GPa, 400–500 ∘C, during a 3–10 d run duration from a gel of =1 plus excess water. The combination of electron microprobe (EMP) and transmission electron microscopy (TEM) analyses resulted in a chemical formula of MgSi(OH)6, which was also consistent with an IR-determined high water content of 34 wt % (Wunder et al., 2011). A combination of the first principles density functional theory (DFT) calculations, low T Fourier-transform infrared (FTIR) spectroscopy and powder X-ray diffraction (XRD; using Rietveld analysis) revealed that the 3.65 Å phase has a hydrous, A site vacant perovskite structure with six-fold coordinated Si and Mg (Wunder et al., 2012). A single-crystal structure analysis confirmed these results, and its structure was refined in the space group P2 in analogy to the stottite group phases (Welch and Wunder, 2012). Mookherjee et al. (2015) performed high-pressure XRD on the 3.65 Å phase in a diamond anvil cell (DAC) up to 69 GPa with a PETRA III synchrotron radiation source(Deutsches Elektronen-Synchrotron, DESY, Hamburg, Germany). They found that the 3.65 Å phase's equation of state is well represented by a third-order Birch–Murnaghan formulation, with K0 = 83 GPa, .9, and V0=194.53 Å3. Combining phase relations from former studies, the synthesis conditions and the results on elasticity from the first-principles simulations, Mookherhjee et al. (2015) concluded that the 3.65 Å phase might be present in cold parts of the subduction zones and perhaps is a relevant phase for the seismological X discontinuity. However, experiments on the 3.65 Å phase's P and T stability are still missing to verify these assumptions.
Within the system of MgO–SiO2–H2O (MSH), Rashchenko et al. (2016) investigated various reactions, including the phases of talc, the 10 Å phase, coesite, stishovite, enstatite, the 3.65 Å phase and water at high pressures by in situ experiments via XRD in DAC. They determined that 10 Å phase, 3.65 Å phase, enstatite, stishovite and hydrous fluid coexist at an invariant point near 10 GPa and 450 ∘C (Fig. 1). Although the temperature is quite low, the authors emphasized that the investigated reactions are extremely fast, which allowed them to observe the forward and backward reactions via in situ XRD. They report a complete high-pressure breakdown of the 10 Å phase at 9.7 GPa and 500 ∘C in only 35 min. We see considerable weaknesses in this low-temperature in situ study. The authors report that the 10 Å phase changed in composition during the first experimental series by incorporating considerable amounts of additional water into the structure via the hydrogarnet substitution. In spite of this change in composition, they used the altered phase in the second series as starting material and put the results in one and the single-phase diagram. This is not appropriate, as the starting materials of the two sets of experiments are different. The authors claim to have constrained the stability fields using relative intensities of a few XRD peaks. Having a closer look at the results of their experiments, we realized that the reactions are only approximately constrained. The diffraction patterns show heterogeneity in the Debye rings, and multiple phases (stable and metastable) were detected in most of the in situ observations; thus, these results have to be treated with care. Furthermore, the mechanism of hydration and dehydration reactions has to be studied in more detail, and also as a function of time, because various recent studies revealed amorphous precursor phases as being intermediate reaction products in dehydration reactions. Incel et al. (2017) investigated the breakdown of lawsonite experimentally and reported the presence of amorphous material appearing as bubbles or pockets in the matrix after the experiment. Konrad-Schmolke et al. (2018) studied naturally occurring hydration reaction products of pyroxene to amphibole and observed a dissolution–precipitation process in which an amorphous phase was involved. Applying TEM, they showed that mineral reactions via an amorphous precursor phase is possible and suggested a precipitation of the product phase via repolymerization of the amorphous phase. Perrillat et al. (2005) reported that the dehydration of antigorite studied in the in situ multi-anvil experiments proceeds via a talc-like precursor phase. Chollet et al. (2011) found a two-step dehydration process of serpentine in a time-resolved synchrotron XRD study using a Paris–Edinburgh press and reported an intermediate hydrous phyllosilicate as precursor phase.
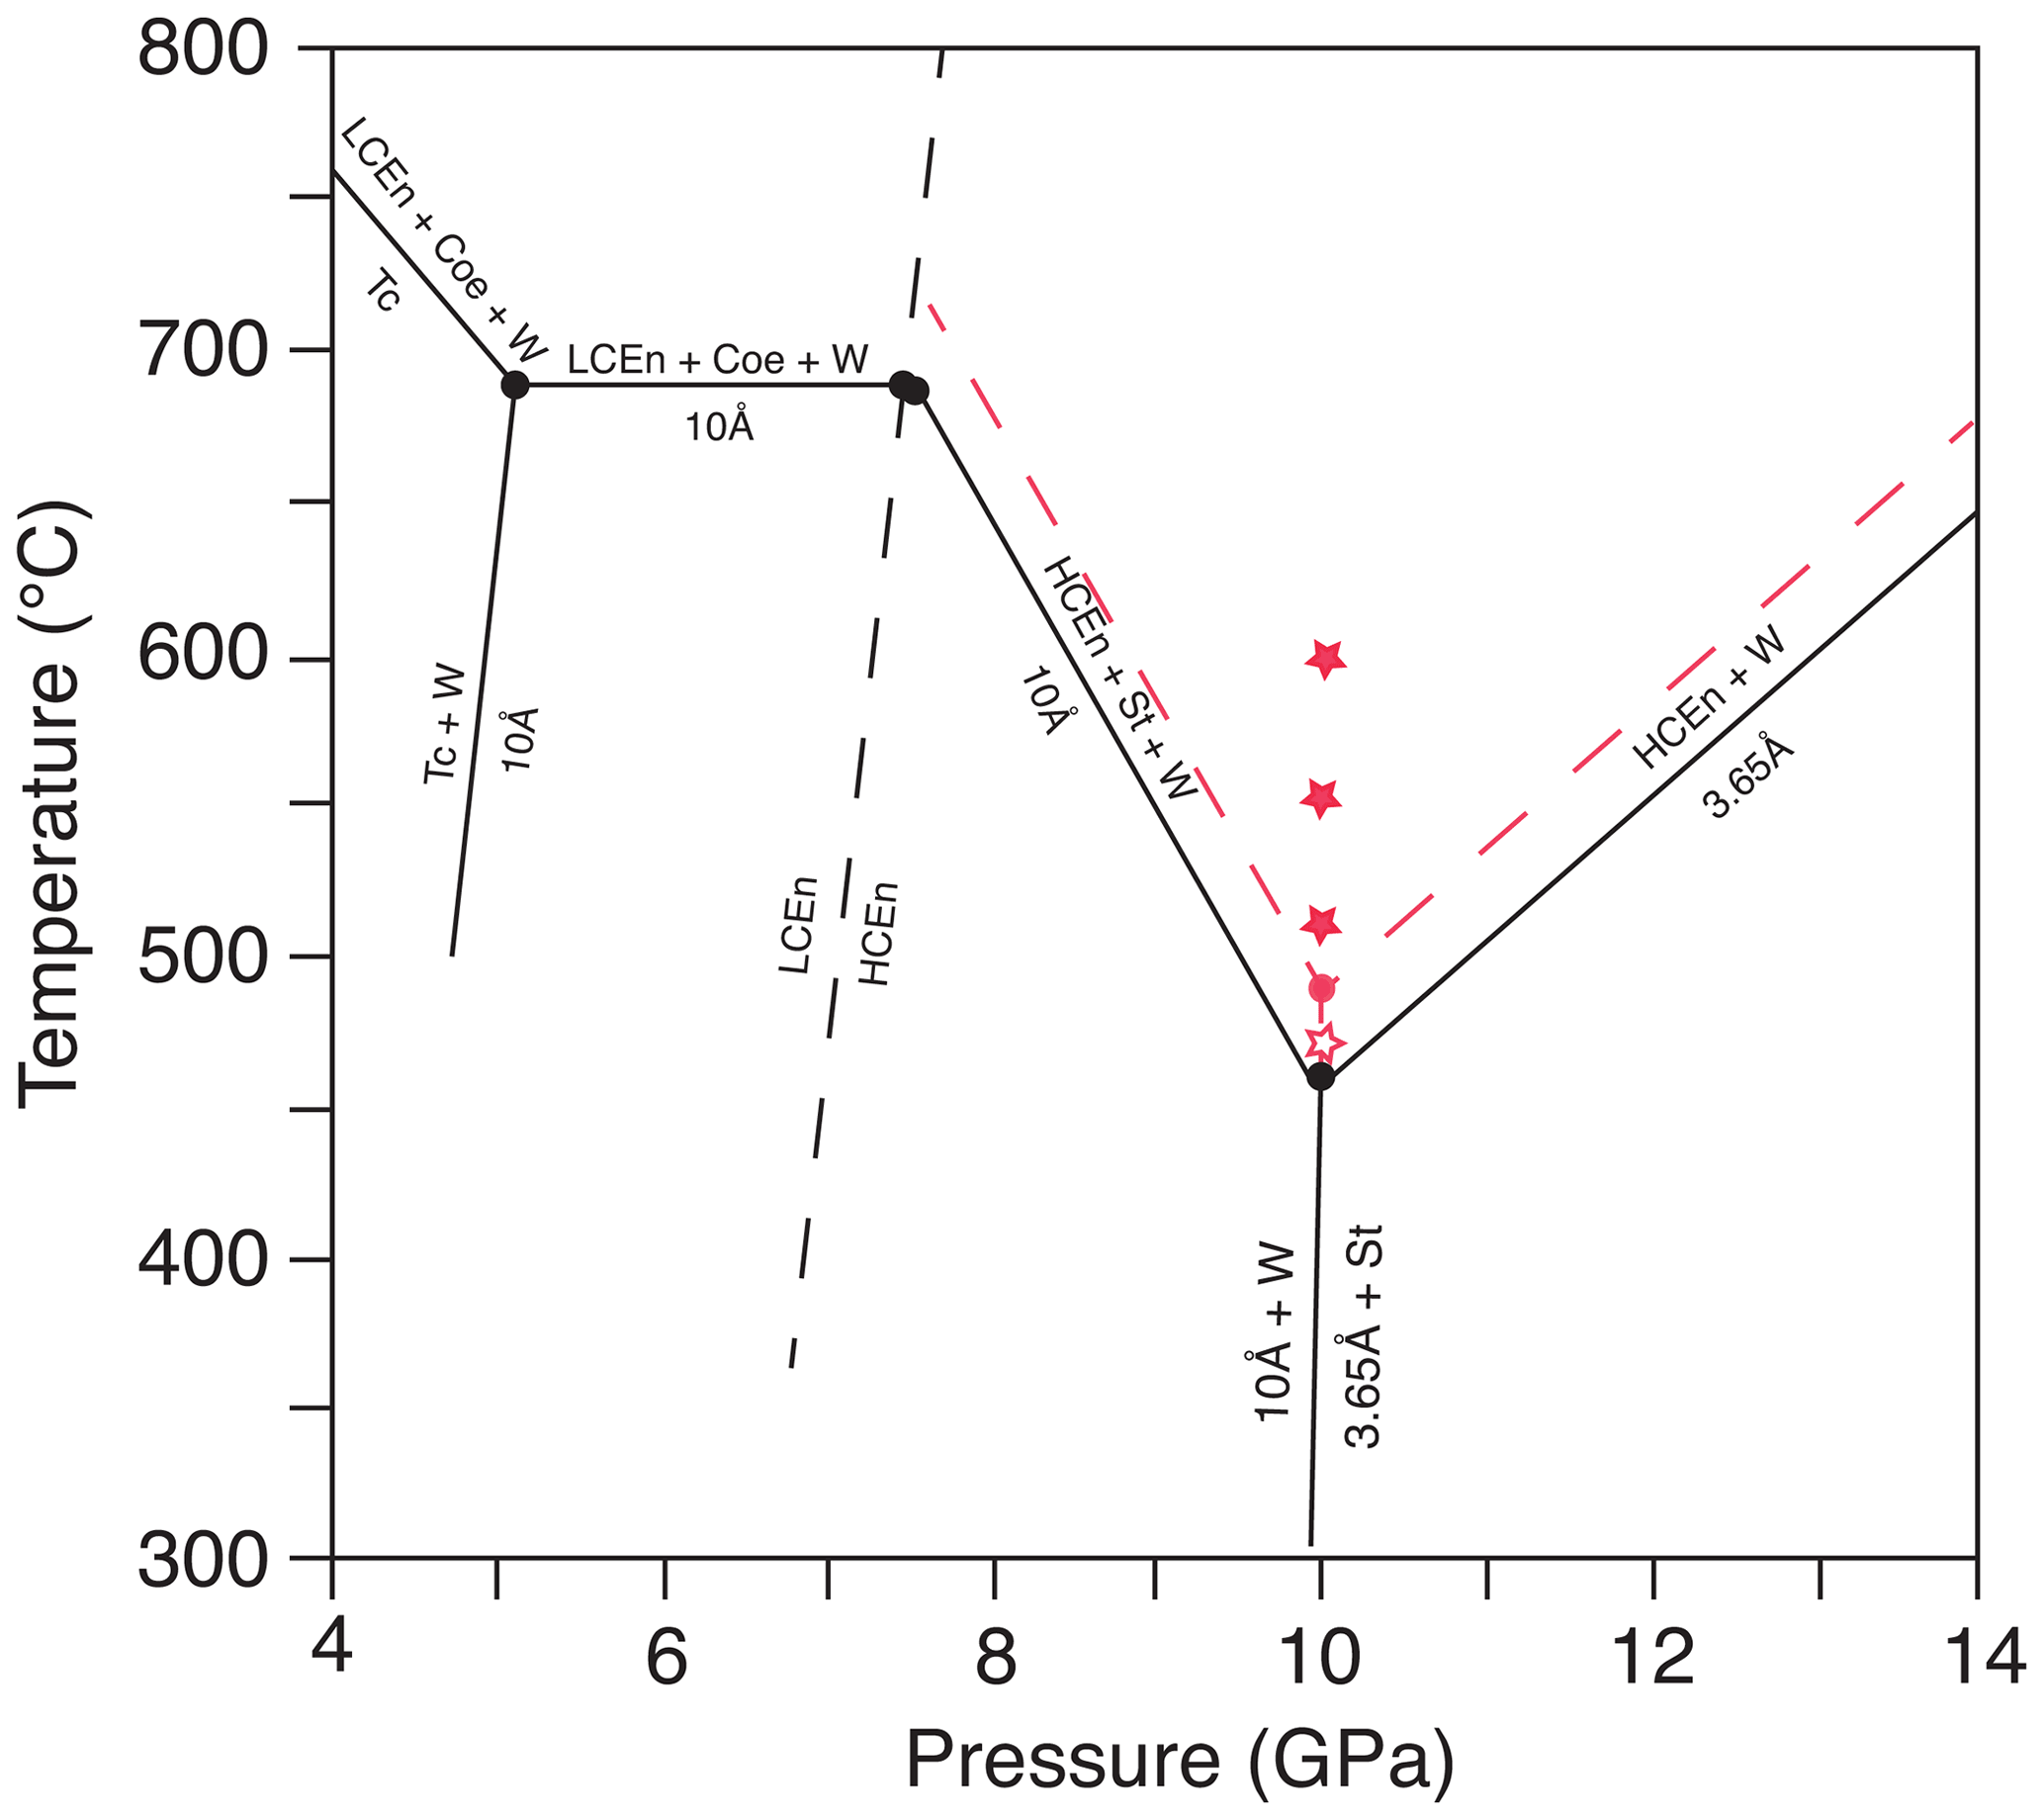
Figure 1Stability field of the 10 Å phase and 3.65 Å phase (modified after Rashchenko et al., 2016). The open red star represents growth of 3.65 Å phase and solid red stars growth of Cen, according to our experiments. The new invariant point at 10 GPa (red dot) and the phase boundaries (red dashed lines) are approximately 40 ∘C higher compared to the data of Rashchenko et al. (2016). The dashed black line is the phase boundary of low-pressure clinoenstatite to high-pressure clinoenstatite, after Ulmer and Stalder (2001). Abbreviations: Tc – talc; Cen – clinoenstatite; LCen – low-pressure clinoenstatite (P21/c); HCen – high-pressure clinoenstatite (C2/c); Coe – coesite; W – water; 10 Å – 10 Å phase; St – stishovite; 3.65 Å – 3.65 Å phase.
In this article, we focus on the reaction clinoenstatite (Cen) + H2O = 3.65 Å phase, which may be relevant in cold subduction zones, report the results of time-dependent experiments performed as quenched multi-anvil press runs of variable run durations and investigate the run products in detail at the atomic scale to clarify the dehydration and hydration mechanism. Under the experimental conditions, the clinoenstatite should be the high-pressure modification (C2/c), which, however, is not quenchable to ambient conditions (Ulmer and Stalder, 2001) but transforms back to the low-pressure clinoenstatite (P21/c).
2.1 Synthesis and high-pressure equilibrium experiments
Synthesis of the 3.65 Å phase and the high-pressure equilibrium experiments were performed in the 800 t rotating multi-anvil press apparatus installed at the GeoForschungsZentrum (GFZ) in Potsdam, Germany. We used MgO (+5 % Cr2O3) octahedra with an edge length of 14 mm as pressure assemblies. The starting materials were placed into Pt capsules. The WC anvils had a truncation edge length of 8 mm. Temperature was measured using W5 %Re–W26 %Re (type C) with a precision of about ±10 ∘C. We determined the temperature distribution within the capsule with the two-pyroxene geothermometer (for details, see Müller et al., 2017). The temperature was homogeneously distributed at ±30 ∘C. The variation of ±30 ∘C is not a real temperature variation but is due to the limitation of the EMP analyses (mixed analyses of coexisting pyroxenes). Pressure was calibrated by press load experiments using several well-known phase transitions. The estimated pressure uncertainty is about ±0.3 GPa. During heating, the Walker-type module was rotated through 360∘ with a rate of 5∘ /s to prevent separation of fluid and solid components (Schmidt and Ulmer, 2004). The press was rotated during the first hour of the run duration of the syntheses and equilibrium experiments. In our experience, this procedure prevents the formation of foreign phase precipitates. A detailed description of the press and the experimental method is given in Koch-Müller et al. (2009).
The starting material for high-pressure equilibrium experiments consisted of a homogeneous mixture of 3.65 Å phase and low-pressure clinoenstatite, both synthetic, in the molar ratio of 1:1 plus water in excess, according to the reaction under investigation (Fig. S1 in the Supplement). The synthesis runs of the 3.65 Å phase were performed at 10 GPa, 425 ∘C and 77 h run duration. We used a gel with a corresponding composition as a solid starting material that was prepared after the method of Hamilton and Henderson (1968). About 5 mg of the gel and 40 wt % of water were added to the Pt capsule. After quenching the experiments and slow decompression, the recovered capsules were cleaned, checked for leakage by weighing and then opened. Low-pressure clinoenstatite (P21/c) was synthesized at 1 atm by heating a MgSiO3s glass at 1500 ∘C for 3 h, following the method described by Anderson and Bowen (1914). The starting materials were mixed, as described above, and ground together in a mortar. The starting materials were examined optically (see Fig. S1) and characterized by XRD (see Table S1 in the Supplement). Both materials were fully crystalline. Table 1 shows the experimental conditions. After the experiment, the recovered Pt capsule was cut in half and one was half prepared as a cross-sections mount by embedding it in epoxy. These mounts were then polished and were further investigated by Raman spectroscopy, EMP and TEM. Material of the other half was extracted from the Pt capsule, and powder XRD analyses were performed from the run products.
Table 1Experimental conditions and analytical methods used.
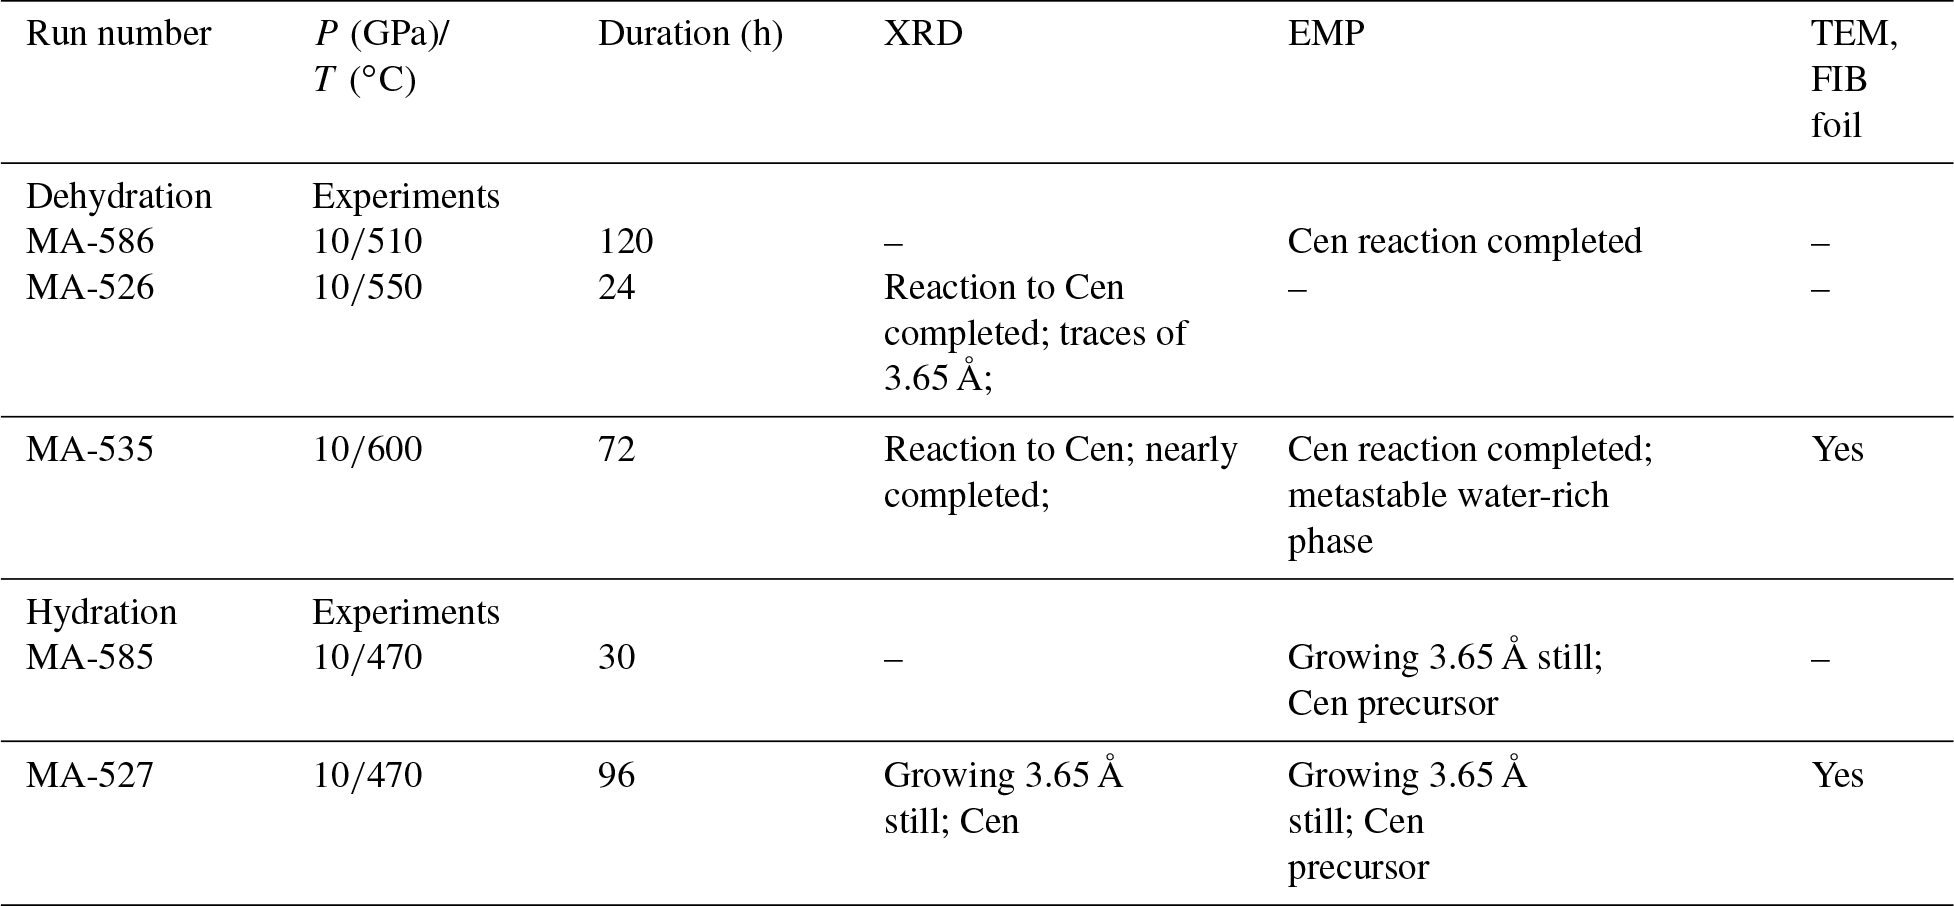
Abbreviations: Cen – clinoenstatite; 3.65 Å – 3.65 Å phase
2.2 Analytic methods
Electron microprobe analyses (EMPA) and backscattered electron (BSE) images were obtained with the JEOL thermal field emission type (FEG) electron probe (JXA-8500F; Hyperprobe). The analytical conditions included an acceleration voltage of 15 kV, a beam current of 10–20 nA and a beam diameter of 1 µm. On-peak counting times were 20 s, and the background on both sides of the peak were 10 s. As standard for Mg and Si, we used well-defined synthetic Fe-bearing ringwoodite. In total, four out of five cross sections of the capsules after the run were analysed by EMPA.
To identify the different phases in the electron microprobe mount and estimate the water content, we used Raman spectroscopy. The Raman spectra were recorded with a HORIBA Jobin-Yvon LabRAM HR800 VIS spectrometer (gratings of 1800 lines per millimetre, confocal pinhole set to 1000 µm and the slit aperture to 100 µm) in backscattering configuration. The spectrometer is equipped with a charge-coupled device (CCD) detector and an Olympus BXFM microscope. A Cobolt Blues™ diode-pumped solid-state (DPSS) laser, with a wavelength of 473 nm, was used for the excitation. To avoid laser-induced damage of the sample, the laser power was filtered to 25 % or 50 % and the Raman spectra were taken with six accumulations for 10–30 s each, depending on the sensitivity to the laser power.
Powder (XRD) patterns were recorded in transmission mode, using a fully automated STOE STADI P diffractometer equipped with a primary monochromator and a 7∘ wide position sensitive detector. Intensities were recorded in the ∘2Θ range of 5–125 for Cukα1 radiation in 0.1∘ intervals. The normal focus Cu X-ray tube was operated at 40 kV and 40 mA, using a take-off angle of 6∘. Counting times were selected to yield a maximum of 4200 counts, resulting in 10 s per detector step. For quantitative phase analyses and determination of structural parameter, Rietveld analyses were performed using the General Structure Analysis System (GSAS) software package (Larson and Von Dreele, 1987) and the EXPGUI interface (Toby, 2001). In total, three out of five runs products were investigated by XRD and Rietveld analyses (Table 1).
For transmission electron microscopy (TEM), foils of approximately 0.150 µm thickness were cut out of the microprobe mounts of two run products (MA-535 and MA-527) using a focused ion beam (FIB) technique (FEI FIB 200 TEM) with a Ga-ion source operated with an acceleration voltage of 30 kV (Wirth, 2004). High-resolution TEM (HRTEM) images and fast Fourier transform (FFT) from HRTEM were acquired using a FEI Tecnai G2 F20 X-Twin transmission electron microscope with a FEG electron emitter. The TEM is equipped with a high-angle annular dark field detector (HADDF) and a Gatan imaging filter (Tridiem). The composition of each phase studied in the TEM was determined using an EDAX X-ray analyser of the TEM.
3.1 XRD and EMP analyses and Raman spectra of the run products
Run conditions and XRD and EMP results are given in Tables 1 and 2, respectively. In addition, the run products were characterized with Raman spectroscopy in the range of 100–1100 cm−1 (Fig. 2a), and water incorporation into their structures was checked with Raman spectroscopy in the OH-stretching range from 3000 to 3800 cm−1 (Fig. 2b). A total of three out of the five experiments performed were dehydration experiments, and two of them showed growth of the 3.65 Å phase. From the different methods used, we distinguished the following four different phases as run products:
- i.
The dry clinoenstatite (Cen), with its characteristic double peaks at around 700 and 1000 cm−1 in the Raman spectra (Fig. 2a) and only traces of water (Fig. 2b), which is confirmed by EMPA (Table 2). We collected several diffraction patterns (FFT from HRTEM) from FIB foils of this phase, which could only be indexed on low-pressure clinoenstatite (Fig. 3g). The observed d spacing and angles between adjacent planes are presented in Table S2. According to Ulmer and Stalder (2001), the presence of Raman peaks at 244, 369, and 430 cm−1 indicates that the quenched pyroxene (now Cen; space group – P21/c) came from either from the high-pressure (HP) or low-pressure (LP) clinopyroxene stability field and not from the orthoenstatite (Oen; space group – Pbca). We observed the peaks in the Raman spectra of the quenched Cen samples of each experiment (Fig. 2a).
- ii.
The 3.65 Å phase, with its Raman lattice band of 269 cm−1 and its characteristic OH bands (Wunder et al., 2011) between 3100 and 3500 cm−1 (Fig. 2). The EMP data give Mg:Si ratios of 1:1 (calculated on the basis of 6 OH).
- iii.
In the hydration runs, we observe an additional water-rich phase with weight percent (hereafter wt %) oxides, summing up to 81 % and Mg:Si ratios of 0.91:1.04 (Table 2 and Fig. 2). The FTIR spectrum in the OH stretching region shows an intense peak at 3723 cm−1. TEM investigation revealed that the phase is amorphous with partly crystalline areas.
- iv.
In the dehydration runs, we observe an additional water-rich phase. Its Raman spectra show the characteristic double peaks around 700 and 1000 cm−1 for enstatite (clino- or orthoenstatite) and strong water bands at 3700 and 3680 cm−1. The wt % oxides, summing up to 81 % and Mg:Si ratios of 0.90:1.04 (Table 2 and Fig. 2). TEM (FFT of HRTEM) showed an electron diffraction pattern equivalent to orthoenstatite (Pbca; Fig. 4c). The observed d spacing and angles between adjacent planes are listed in Table S2.
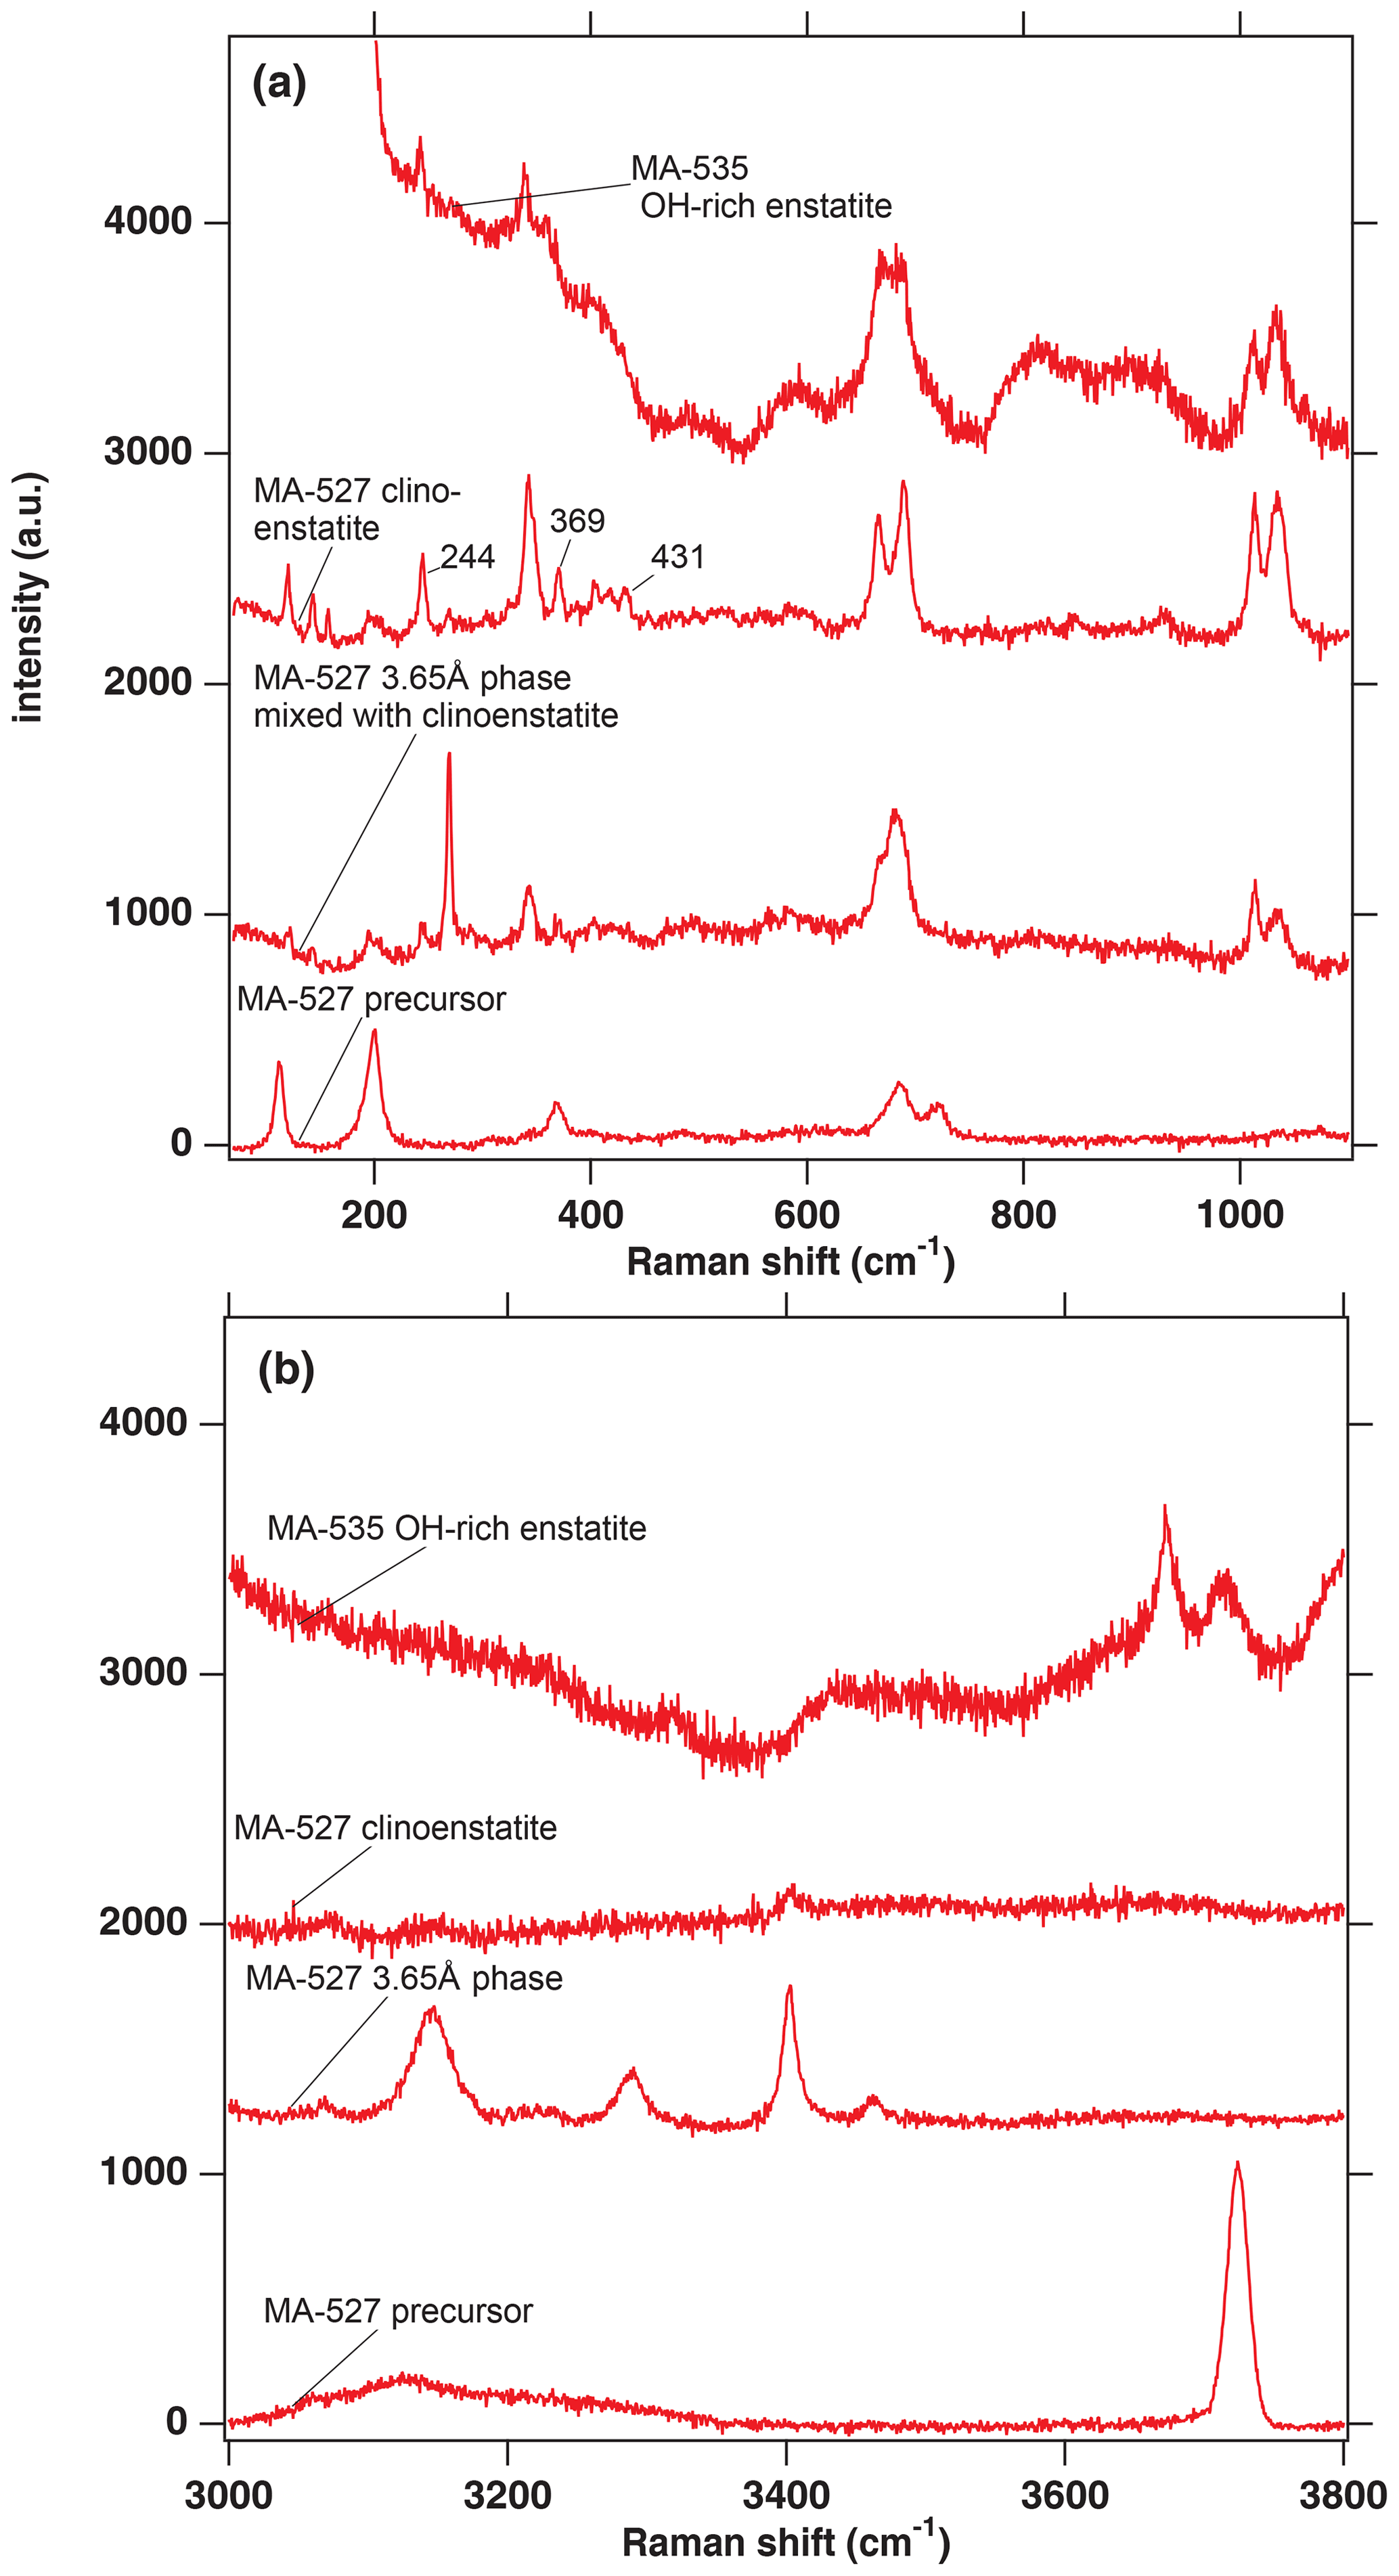
Figure 2(a) Raman spectra in the range from 100 to 1100 cm−1 from selected phases of the experimental runs of MA-527 and MA-535. The numbers 244, 369 and 431 are the wavenumbers indicative of a quenched pyroxene coming either from the HP or LP clinopyroxene stability field (Ulmer and Stalder, 2001). (b) Raman spectra in the range of the OH stretching vibrations from selected phases of the experimental runs of MA-527 and MA-535. In panels (a) and (b), MA-535 OH-rich enstatite is in the orthoenstatite space group (Pbca).
Table 2Electron microprobe analyses of selected run products.
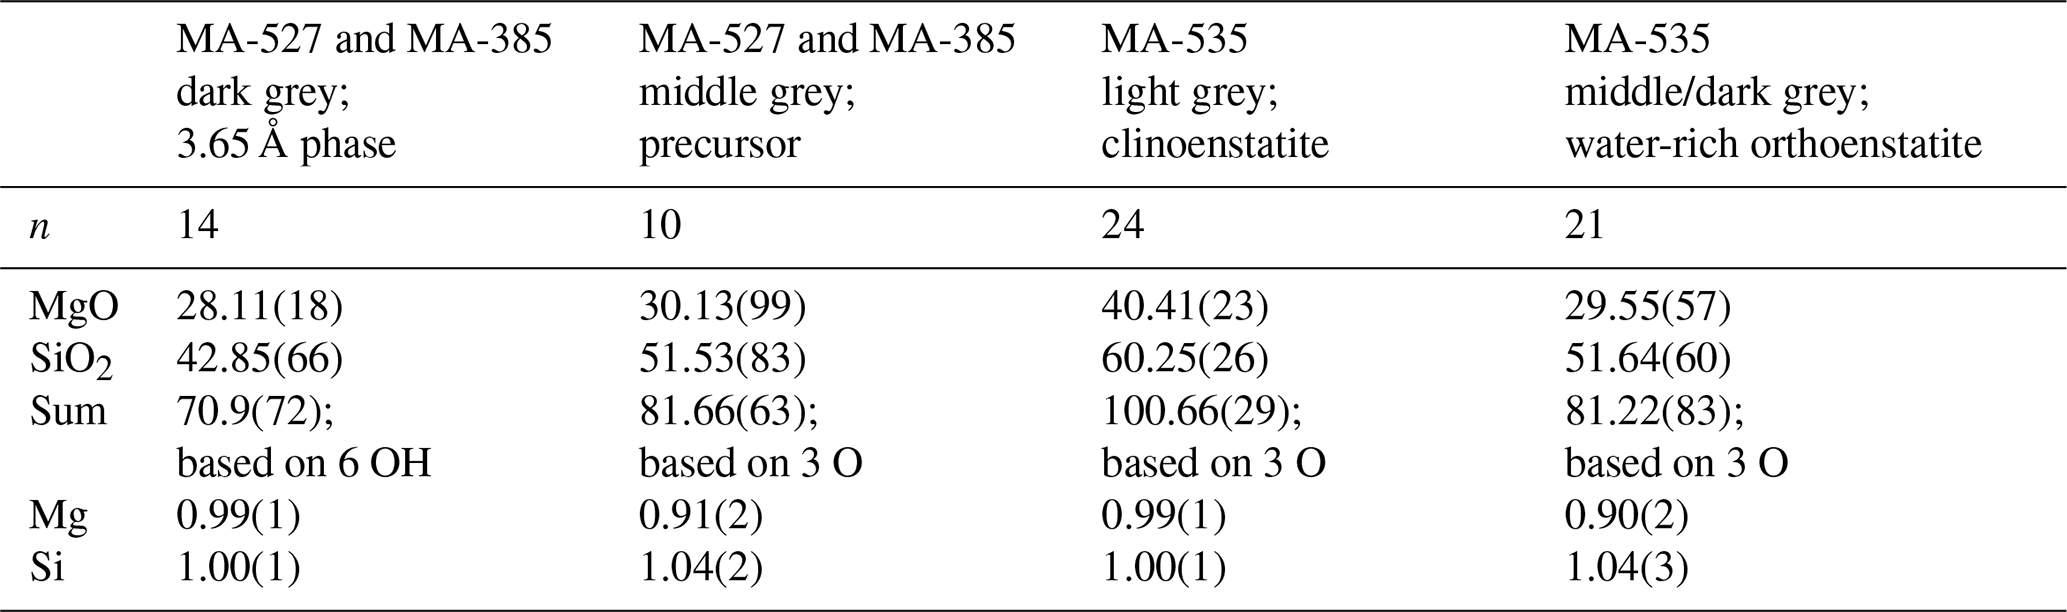
n is the number of analyses. Numbers in parentheses show the standard deviation.
3.2 Phase relations
The criterion used to determine the reaction direction for the runs MA-526, MA-535 and MA-527 was XRD. We compared the initial XRD pattern of the mixture of the starting material with those after the experiments. Experiment MA-526 contained only traces (< 3 %) of the 3.65 Å phase, whereas MA-535 showed a complete 3.65 Å phase breakdown. Experiment MA-527 showed significant growth of the 3.65 Å phase, but still Cen occurred in the diffraction pattern. Experiment MA-585 was a short version of the run MA-527, and no XRD was performed. The reaction direction of experiment MA-586 could be determined from BSE images acquired in the electron microprobe because only clinopyroxene could be observed (Fig. 4d).
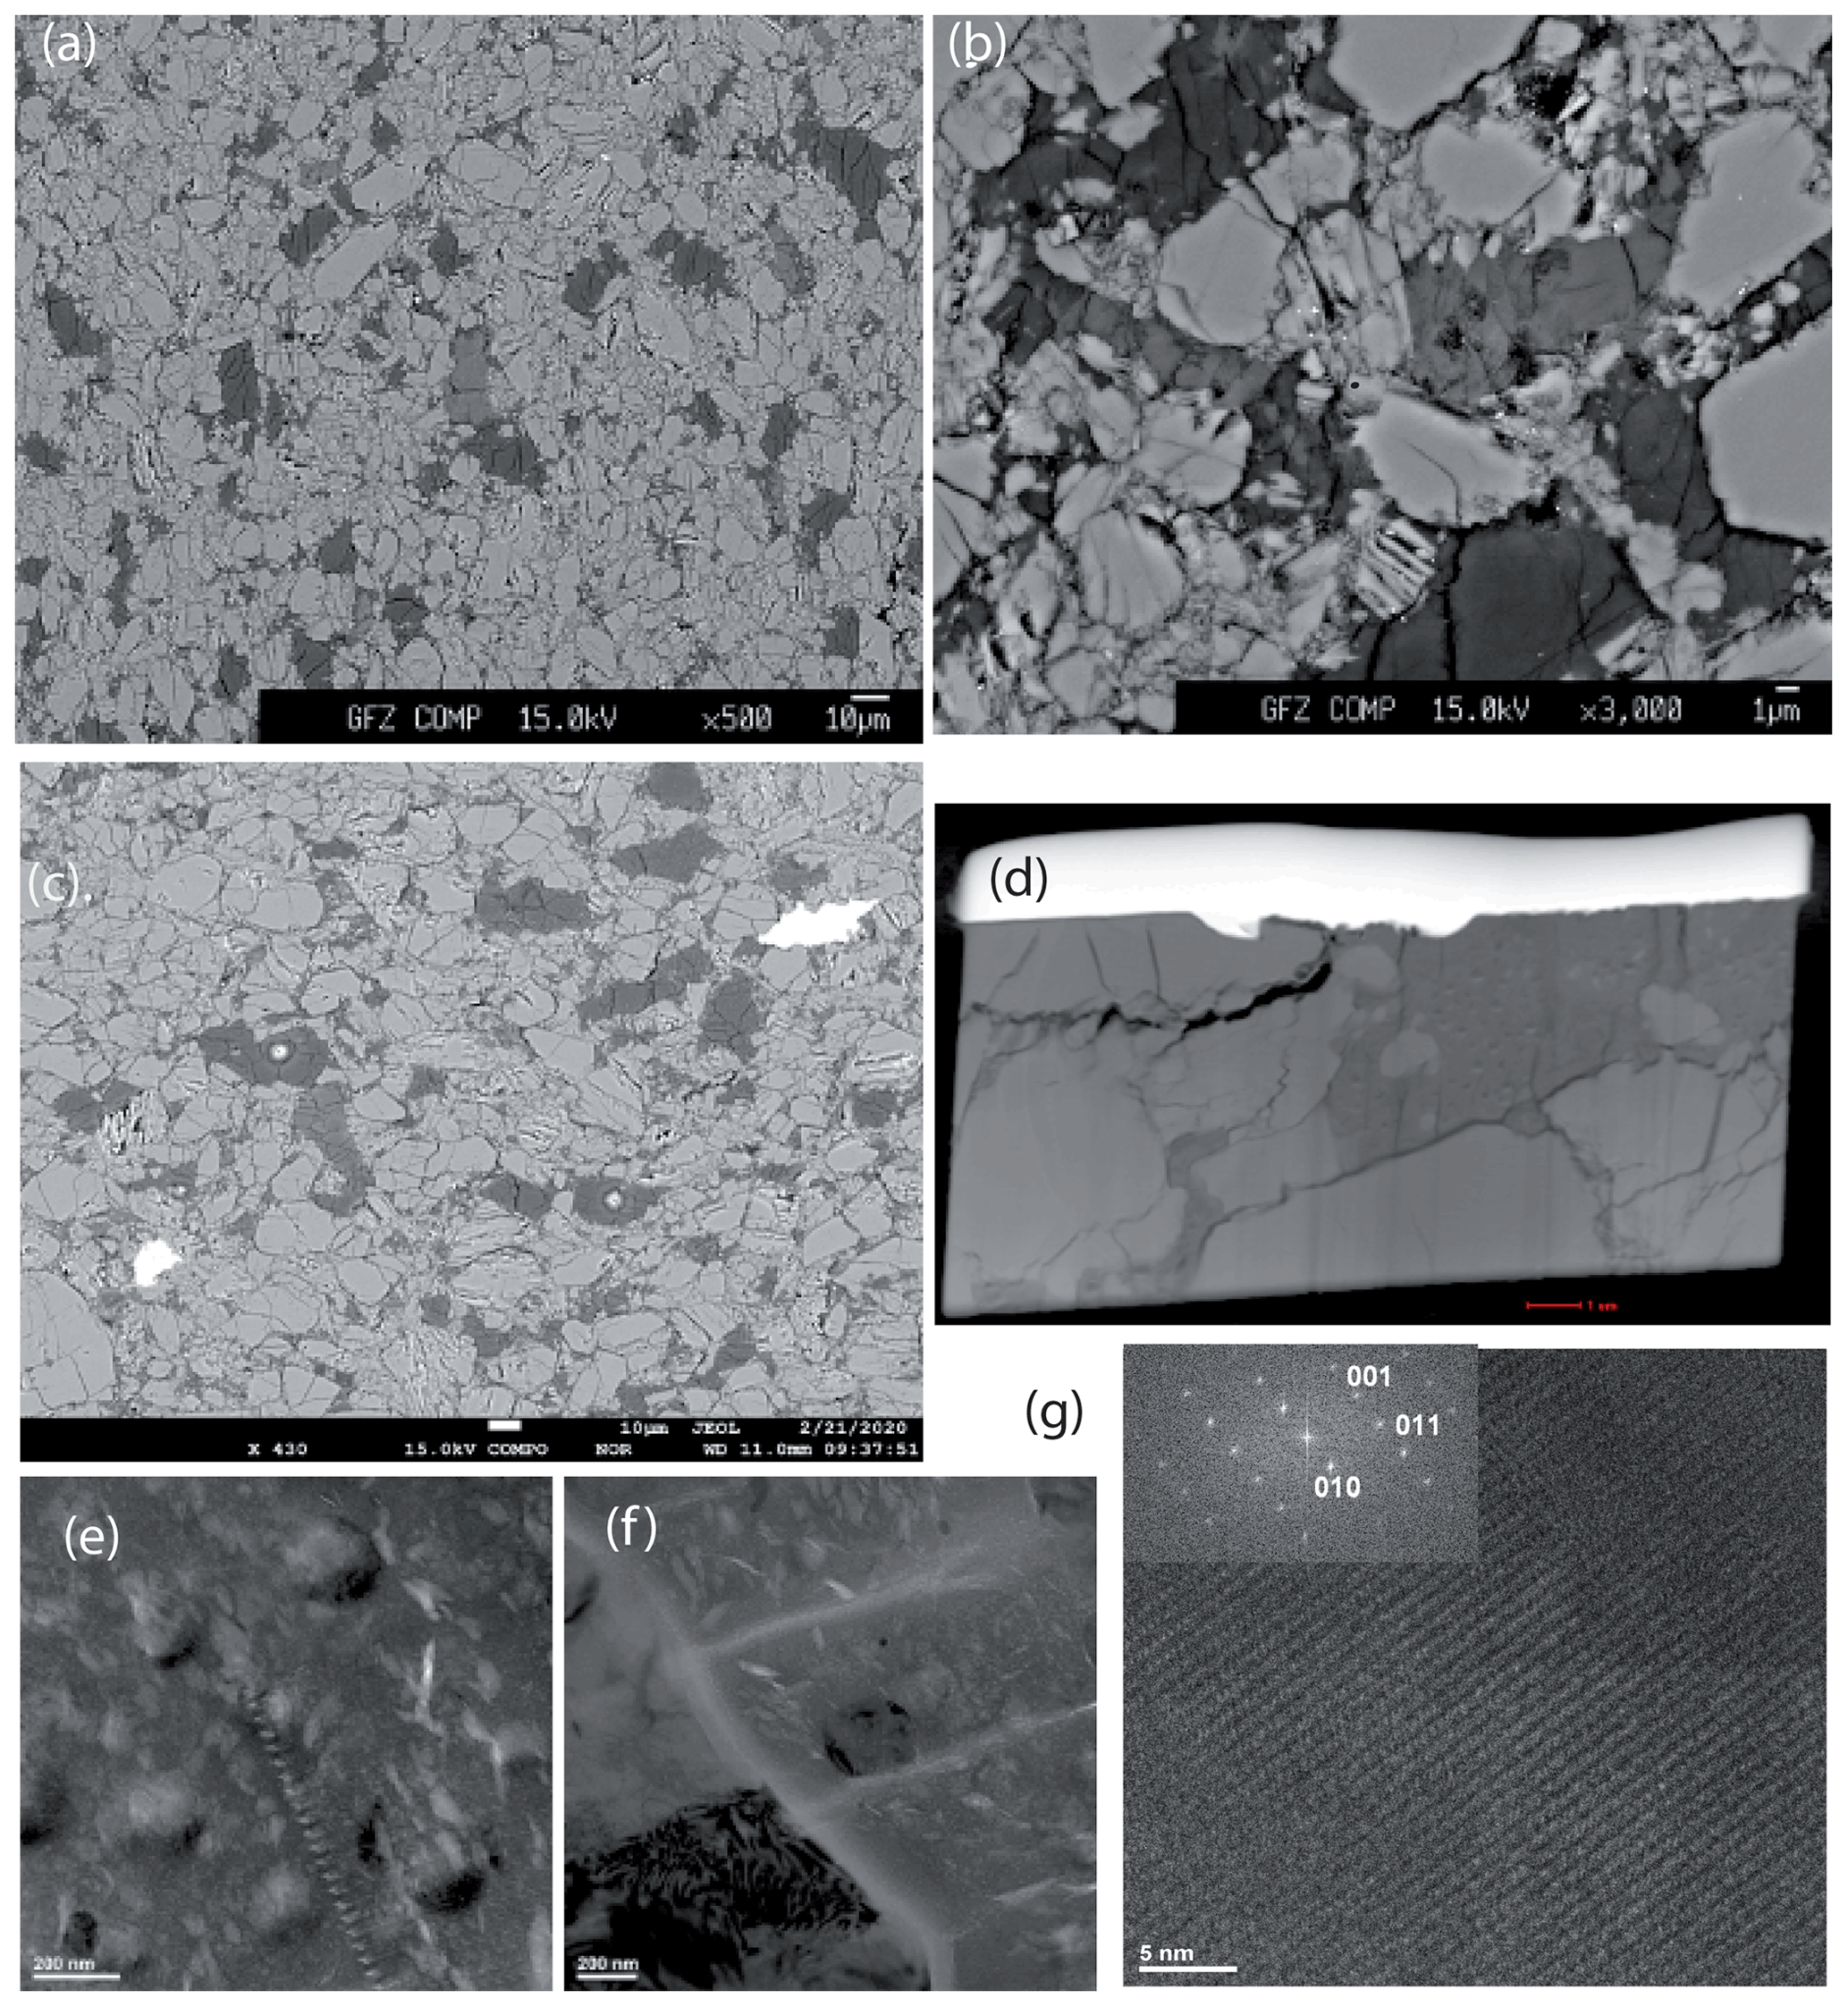
Figure 3Images of the run products of the dehydration experiments. (a, c) Backscattered electron (BSE) images showing parts of the experimental charges after the runs of MA-527 and MA-585, respectively. Light grey colour – Cen; dark grey colour – 3.65 Å phase; middle grey – see text. The light circles (see arrows) in the dark grey phase (c) show that it is not stable under the electron beam of the microprobe. (b) BSE image showing a more detailed part of the experimental charge after the run of MA-527. (d) Overview of a FIB foil taken from the run product of MA-527. The foil is approximately 15 µm wide. The light stripe is a Pt marker, and the grey parts are the run products. (e, f) Bright field images taken from the amorphous dark part of the foil shown in Fig. 3d. However, diffraction contrast (dark patches in the image) indicates that the phase is partly crystalline and contains remnants of pyroxene. (g) High-resolution TEM lattice fringe image (HRTEM) image of Cen from experiment MA-527. The inset shows the (100) zone axis diffraction pattern indexed as low-pressure clinopyroxene (see also Table S2 for the d spacings and angles).
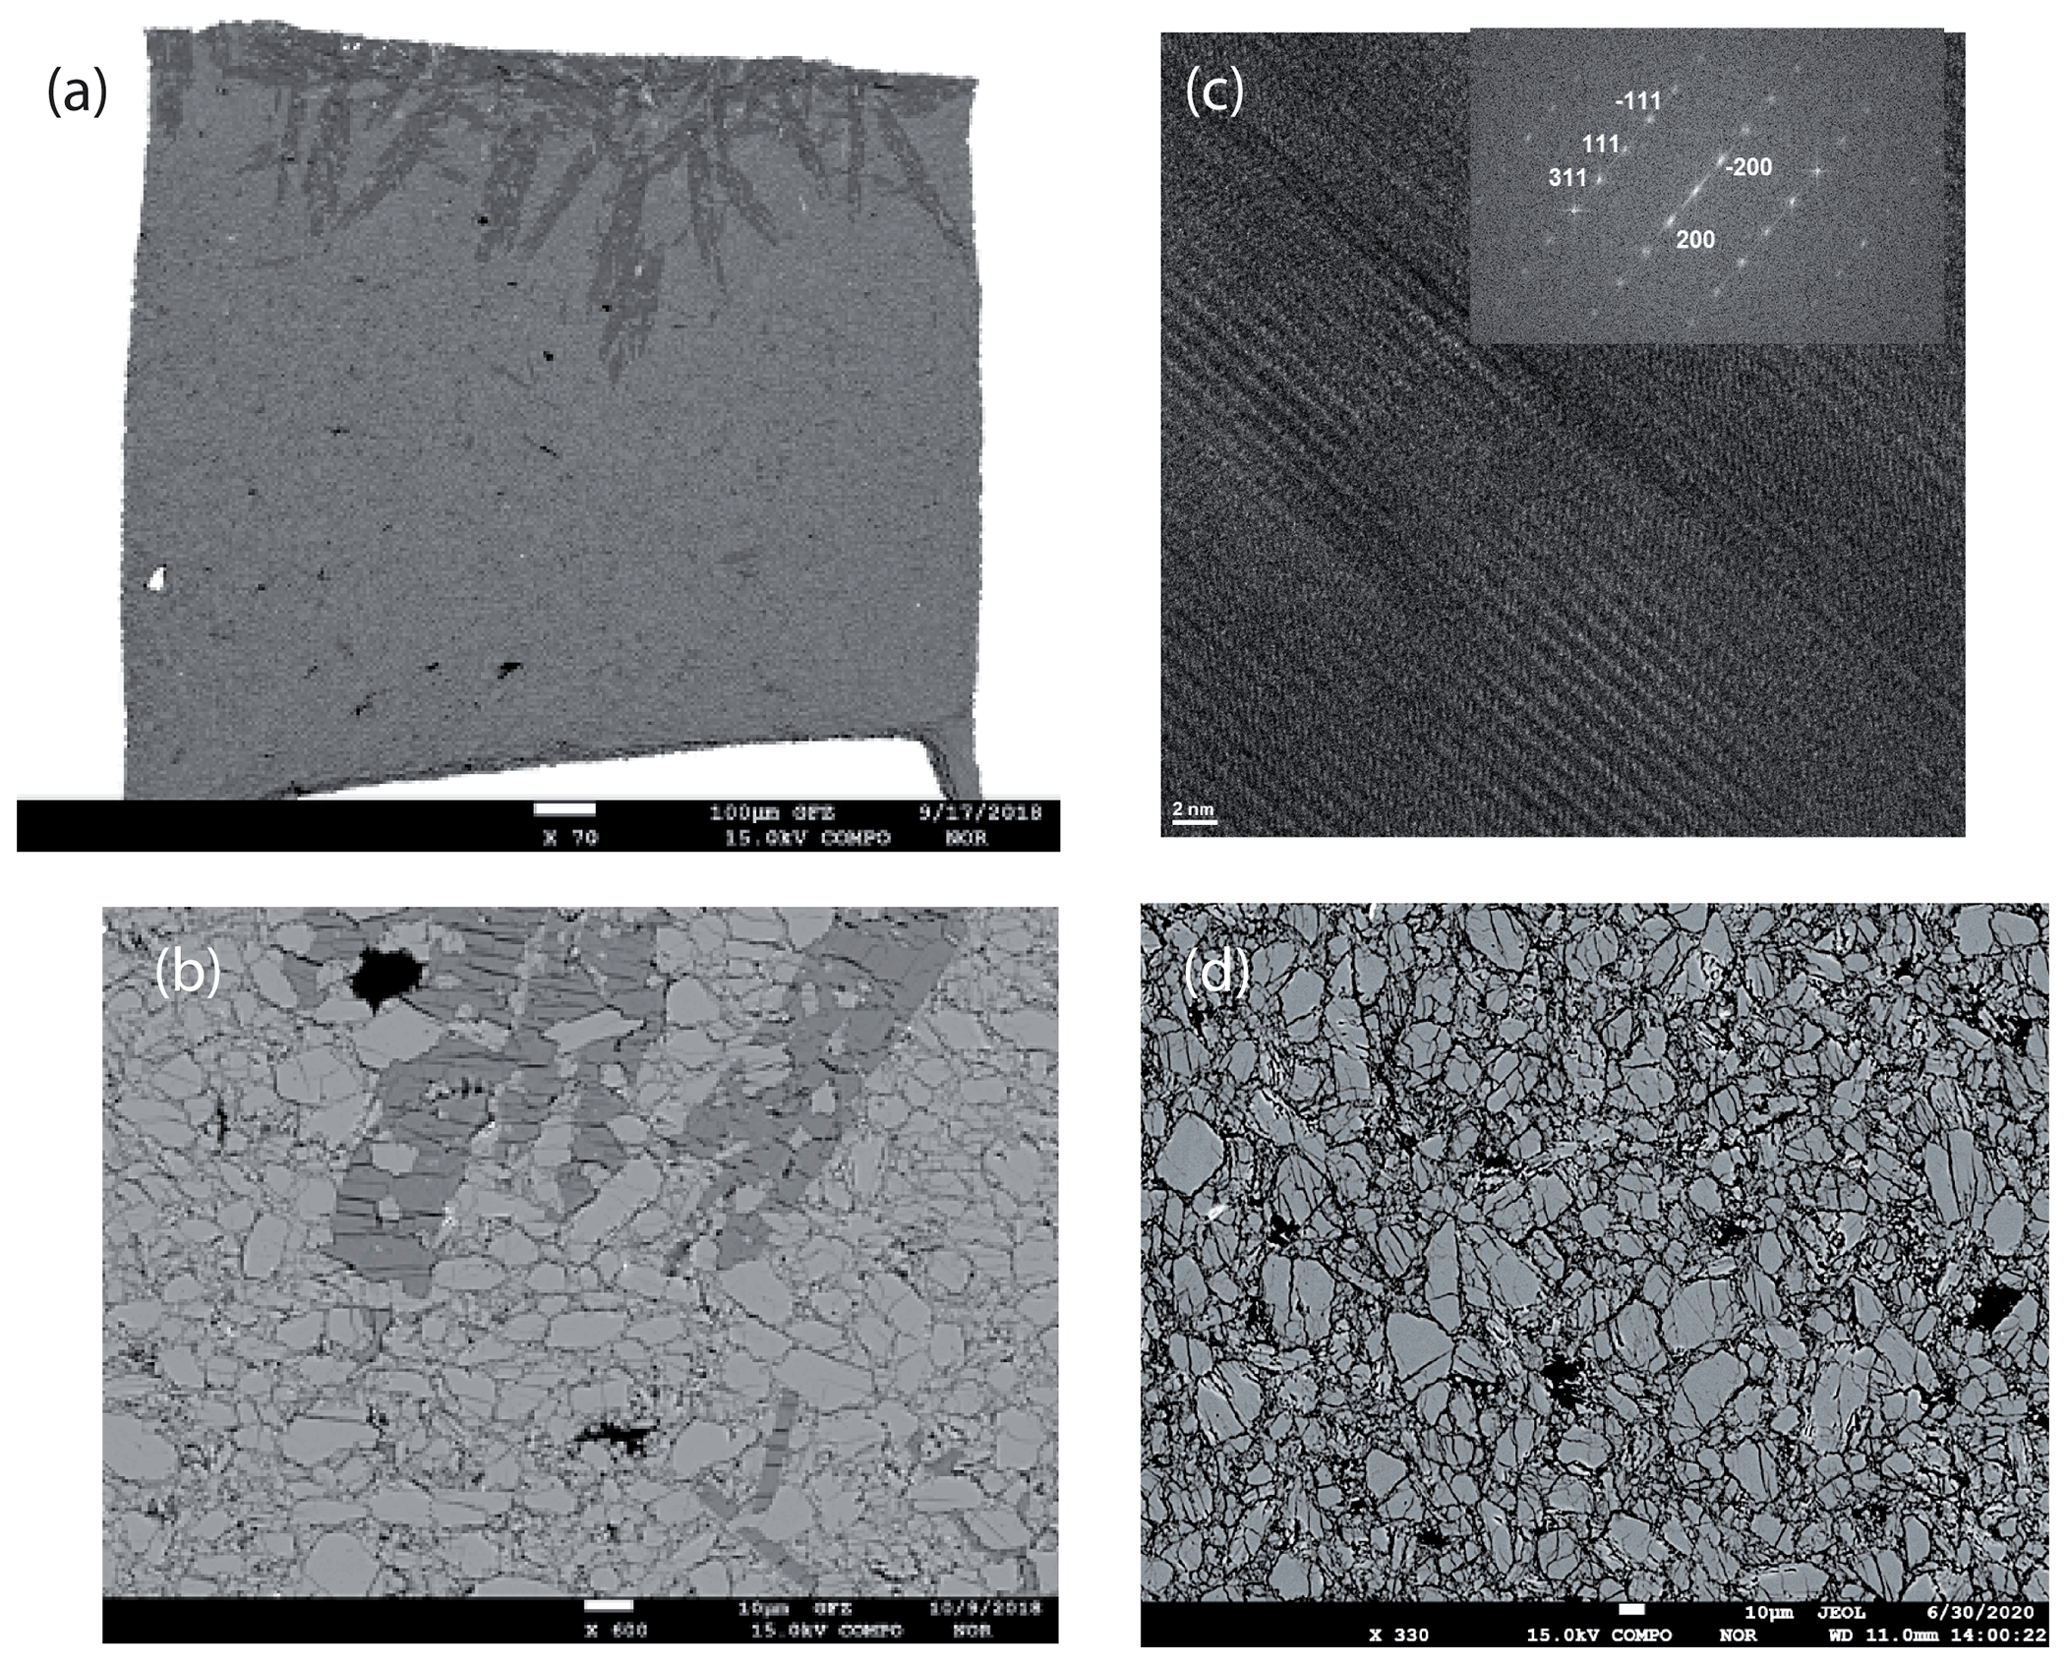
Figure 4Images of the run products of the dehydration experiments MA-535 and MA-586. (a) BSE image of a cross section of the Pt capsule after the run of MA-535. The white part at the bottom is part of the Pt capsule. The dark parts at the top show a water-rich enstatite-like phase, and the other grey phase is Cen. On top, small needles of a Ca–Mg-bearing phase are present, which must be an impurity either already in the capsule during the experiment or caused during polishing. (b) Details of the cross section of the Pt capsule (Fig. 4a). The sample consists of Cen (remnants of the starting materials) and very fine-grained newly formed Cen as products of the dehydration reaction. The dark grey phase is a water-rich metastable orthoenstatite-like phase. Black contrast indicates the high porosity due to the dehydration. (c) HRTEM lattice fringe image of the dark phase, while the inset FFT of the HRTEM is indexed based on orthopyroxene (see also Table S2 for the d spacing and angles between adjacent planes). (d) BSE image of a part of a cross section of the Pt capsule after the run of MA-586, where only Cen could be observed with a similar size distribution for Cen as in (b).
3.2.1 Hydration experiments
From XRD and Rietveld refinement it is obvious that the 3.65 Å phase is growing at the expense of Cen. However, even after 96 h the reaction is far from being complete (MA-527). Figure 3a is a backscattered electron (BSE) image acquired with electron microprobe showing a part of a cross section through the Pt capsule after the experiment MA-527. The light grey colour corresponds to Cen, which contained only traces of water (Fig. 2a, b), and the very dark contrast corresponds to the 3.65 Å phase. Interestingly, there is a third phase showing an intermediate grey colour, which contains less Mg, more Si and less water than the 3.65 Å phase with a Mg:Si ratio of 0.91:1.04 and an EMP-determined oxide sum of about 81 % only, which suggests a water content of approximately 20 wt %. The minor water content compared to the 3.65 Å phase is probably the reason for the slightly brighter contrast in the BSE images. The water incorporation in the middle grey phase was also confirmed with Raman spectroscopy (Fig. 2b). Cen crystals range in size from less than 1 to up to 50 µm. Mostly Cen has a very small grain size and shows a lot of cracks. The middle grey phase is located in regions where the crushed pyroxenes dominate. The texture shown in Fig. 3b indicates that the 3.65 Å phase growths at the expense of the middle grey phase. Thus, we conclude that the middle grey phase is a precursor of the 3.65 Å phase. The hydration experiment MA-585 showed the same result, but the amount of the amorphous phase and the newly formed 3.65 Å phase was less prominent compared to MA-527, indicating the sluggishness of the reaction (Fig. 3c). To identify the middle grey phase, we cut thin foils from the EMP mount of MA-527 exactly where we have grain boundaries with the 3.65 Å phase using the focused ion beam (FIB) technique. Figure 3d shows an overview of the FIB foil no. 5417. The light grey parts are Cen crystals, and the dark part corresponds to the middle grey phase in the BSE images. TEM analyses reveal that the dark phase is mostly amorphous but can be partly crystalline (Fig. 3e), and furthermore, it is very sensitive to the electron beam, which suggests the presence of water. The fact that most of the material is amorphous does not exclude that some parts are crystalline. The amorphous part can be composed of nanocrystalline subunits that appear in the diffraction pattern as broad scattering intensities due to the very small grain size. The crystalline parts are mosaic crystals, which are composed of an assemblage of the sub-nanocrystalline subunits, thus forming a crystal. We assigned it to the precursor phase. We found remnants of Cen in the amorphous phase, which clearly indicate a dissolution process (Fig. 3f).
3.2.2 Dehydration experiments
In the BSE image (Fig. 4a) of the capsule's cross section (MA-535), light grey enstatite is visible and, in addition, a darker phase which is according to the EMPA and Raman spectroscopy not the 3.65 Å phase but a newly formed phase (Table 2 and Fig. 2). The phase with the light grey colour is nearly water-free Cen, whereas the new phase is water rich (Fig. 2b). Only at the bottom part of the capsule shown in Fig. 4a do we observe the darker phase due to yet unclear reasons. Maybe there was a temperature gradient that has not yet been observed in other experiments (Müller et al., 2017). Nevertheless, experiment MA-526 already showed the growth of Cen, and we used this sample for detailed analyses of the reaction mechanism on a macroscopic and microscopic scale. A detailed picture of the capsule is shown in Fig. 4b. We have cut several FIB foils from the dark grey phase and investigated them with TEM. The phase was very sensitive to the electron beam, which suggests high water content. Figure 4c shows a HRTEM image, with the corresponding electron diffraction pattern (FFT; Fig. 4c inset). We took several electron diffraction patterns and identified them in all cases as being orthoenstatite (Table S2). From the texture in Fig. 4b, mainly from the appearance of water-free Cen within the dark grey water-rich phase, it is indicated that the water-rich orthoenstatite phase transformed into water-free clinoenstatite. Figure 5 shows TEM bright field images taken from the FIB foil of experiment MA-535. It shows newly formed sub-micron-sized crystals in each centre. With HRTEM (FFT), we assigned it to Cen (inset; Table S2). We observe nanocrystalline reaction products, Cen, and high porosity due to the dehydration (Figs. 5 and S2). Powder XRD of MA-535 only showed Cen without any traces of the water-rich orthoenstatite, which indicates that the volume fraction might have been too small to be detected by conventional XRD. Another experiment was held for 120 h at 10 GPa/510 ∘C (MA-586). EMP analyses of the polished cross section of the capsule showed that, after 120 h, the reaction was finally completed, as we only observed dry clinoenstatite (Fig. 4d). Despite the lower temperature of 510 ∘C versus 600 ∘C, the longer run duration was sufficient to transform all the hydrous phases into Cen. There was neither 3.65 Å phase left nor an intermediate phase. Notable is the occurrence of the nanocrystalline Cen reaction products in both dehydration experiments. The third dehydration experiment (MA-526) was held for 24 h at 10 GPa/550 ∘C. As for MA-535, the powder XRD showed only the presence of clinoenstatite. However, this experiment was not investigated with an electron microprobe; thus, the formation of the unstable water-rich orthoenstatite-like phase could not be confirmed for this experiment.
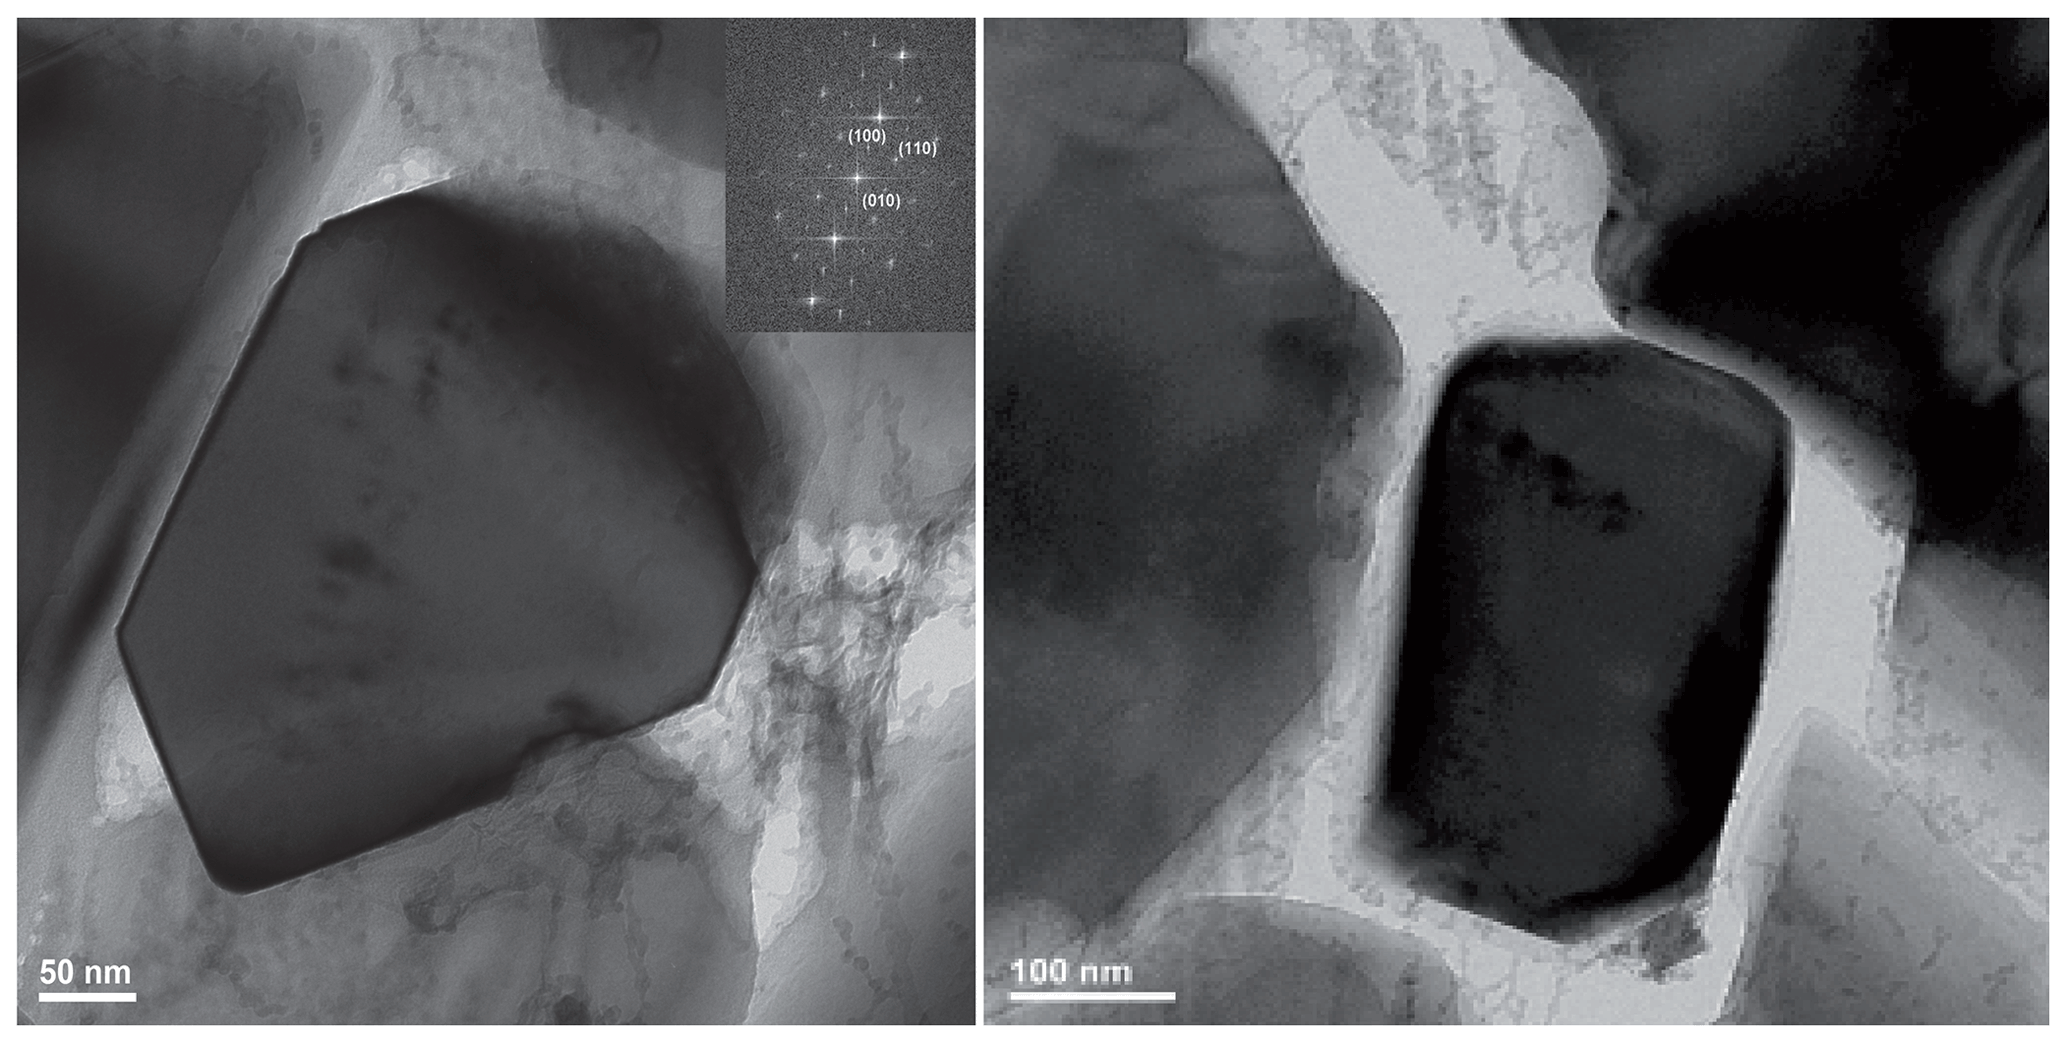
Figure 5Bright field images (plus electron diffraction pattern FFT) taken from the run product of experiment MA-535 showing, in each centre, a newly formed idiomorphic Cen within a pore. Cen was identified by dhkl spacing and angles between adjacent lattice planes. The indexing to Cen is, however, not unambiguous in this orientation – it could also be indexed as Oen. However, as the most of our final reaction products of the dehydration experiments were assigned to Cen (also by XRD), we are in favour of the assignment to Cen. See also Table S2 for the d spacing and angles between adjacent lattice planes.
Figure 1 shows the diagram of DHMS, after Rashchenko et al. (2016), in comparison to our results. According to our results, the invariant point where the 10 Å phase, 3.65 Å phase, enstatite, stishovite and hydrous fluid coexist at 10 GPa is at about 40 ∘C higher temperatures.
The size distribution of the Cen crystals in the hydration and dehydration experiments is similar – they range in size from less than 1 to up to 50 µm, but they have a different origin. In the dehydration experiments, the sub-micron-sized Cen are newly formed (Fig. 5), whereas in the hydration experiments the sub-micron-sized Cen represent the breakdown products of the starting material Cen (Figs. 3 and S2). One could argue that the fractured sub-micron-sized Cen in the hydration experiments are formed during decompression when high-pressure clinoenstatite (HCen) transformed back to low-pressure clinoenstatite (LCen). However, this is not the case because it was not observed in other experiments in which HCen was involved and reacted back to LCen (Christian Lathe, personal communication, 2021). In both types of experiments, hydration and dehydration, we observe larger (up to 50 µm) Cen crystals. We interpret these as remnants of the starting material (Fig. S1), most probably because the starting materials were ground together, instead of being ground separately, so some larger crystals were left.
In the hydration experiment MA-527, most of the Cen show brittle fractures, indicating that Cen breaks down and can be observed as cracked sub-micron-sized crystals. Cen is then dissolved and transforms into an amorphous precursor phase (Fig. 3b). Remnants of dissolved Cen can be found in this phase. This precursor phase transforms into the 3.65 Å phase; however, even after 96 h, there are still large amounts of the starting Cen. Our suggested reaction scenario is as follows: clinoenstatite breaks down under the conditions indicated by the small grains full of cracks. The amorphous precursor phase is formed from the crashed pyroxenes and transforms into the 3.65 Å phase. This precursor phase is suggested to be composed of subunits of the 3.65 Å phase which assemble later to form a kind of mosaic crystals of the 3.65 Å phase. The formation of mosaic crystals from precursor phases is well known from calcite and bassanite (Raz et al., 2000; Stawski et al., 2020). As mentioned before, amorphous precursor phases in dehydration reactions have also been found in other studies; however, the formation mechanism is not well understood.
In dehydration experiment MA-535, large crystals are surrounded by newly formed sub-micron-sized pyroxenes, with the still-existing educt Cen as a large crystal and the product Cen as fine-grained reaction products. Figure S1 shows the size distribution of the starting material, and although we have grounded the mixture, there is some larger Cen left over. Our suggested reaction scenario is as follows: we assume that the 3.65 Å phase is unstable under the P and T conditions of run MA-535 and transforms into a water-rich orthoenstatite-like metastable phase, which, with increasing reaction time, transforms to stable, nominally dry clinoenstatite. It seems that the high water content of this metastable phase favours the crystallization in the orthorhombic structure. We suggest that the 3.65 Å phase disintegrates in numerous subunits of a precursor phase, which is not a classical nucleation of a new phase (grain size < 1 nm), and these precursors recombine during continuing dehydration to the observed less hydrous phase, forming mosaic crystals. This might be a similar process to the formation of calcite in water where precursors assemble to larger structures and, finally, mosaic crystals (Raz et al., 2000). The formation of mosaic crystals of zircon from nanometre-sized subunits of zircon has been recently observed and described with zircon from the Vredefort impact structure (Kovaleva et al., 2021). The important point here is that it is not classical nucleation and growth but nanometre or sub-nanometre-sized precursors that assemble to crystals due to surface charging. Such a mechanism would explain the observed fine lamellae of Cen and the observed broad diffuse diffraction spots (see the diffraction pattern in Fig. 4c). It is a characteristic feature of crystals that have been assembled from precursors that they form a kind of mosaic crystal because the individual units are slightly misoriented. The formation of that intermediate phase through the assemblage of precursor phases to finally form Cen is a new mechanism not reported before in such a context.
We observed an intermediate reaction with the precursor phases in each of the hydration and dehydration experiments, which we would have missed in in situ X-ray experiments because the precursor phase in the hydration experiments is amorphous, and the one in the dehydration experiments could not be detected by X-ray diffraction. The reactions are not only complex with intermediate phases, but the reaction rates are quite slow.
Similar textures are described for other mantle-phase transformations (e.g. Rubie and Ross, 1994; Kirby et al., 1996; Incel et al., 2017). Due to high nucleation rates and low growth rates at the onset of transformation, very fine-grained reaction products will be formed. Hydration and dehydration experiments strongly differ in the generated porosity, which is due to volume difference between the educt and product phases and the huge amount of water expelled during dehydration of the 3.65 Å phase.
In contrast to the dehydration breakdown of serpentine minerals, which is extremely fast, the breakdown of the 3.65 Å phase is astonishingly sluggish. Chollet et al. (2011) measured the kinetics of serpentine dehydration in situ and concluded that it is fast enough to induce mechanical instabilities that may trigger seismicity in the down-going slab. The two-step dehydration reaction of serpentine was completed in only 3 h. The experimental results of Rashchenko et al. (2016), and especially the short time to complete the dehydration of the 3.65 Å phase, would suggest that this DHMS could also lead to fluid-triggered seismicity but deeper in the slab, as suggested by, e.g., Shirey et al. (2021). However, in this study, we show that hydrous metastable breakdown phases were still present after 72 h and such slowly released fluids may not play a role in generating deep earthquakes.
On the other hand, according to Ferrand et al. (2017), it is not only the released fluid which may cause seismicity. They showed that the dehydration of antigorite not only releases fluids but also forms nanocrystalline reaction products during its breakdown, which can lead to extreme weakening, transfer of stress to the surrounding rocks and, finally, cause intermediate earthquakes. Similar observations were reported by Incel et al. (2017) for the dehydration of glaucophane. Shirey et al. (2021) found a correlation between slabs that are capable of transporting water into the deep mantle in DHMS with slabs that produce seismicity below 300 km depth. They propose that the dehydration of DHMS may play the same role for deep earthquakes as antigorite does for intermediate ones, namely that they become extremely weak through the formation of nanocrystalline reaction products. Our study proves, for the first time, that this is indeed the case for the dehydration of the 3.65 Å phase. In a forthcoming study (Christian Lathe, personal communication, 2021), we will show that, during the dehydration reaction, clinoenstatite + phase A to forsterite + water, nanocrystalline products are also produced even though the temperature was (> 700 ∘C) considerably higher.
Our experiments show that neither the mechanism, the kinetics, nor the exact P and T conditions of the apparently simple reaction 3.65 Å phase ⇔ Cen + water were well constrained, and that the data presented in Rashchenko et al. (2016) are not constraining the coordinates of the reaction correctly. Our study is a step forward in understanding the reaction mechanism. It further indicates that nanoscale investigations are essential for the understanding of hydration and dehydration processes in the mantle, which may show unpredicted, surprising findings. It is now widely discussed (e.g. Shirey et al., 2021) that the fluid release from the breakdown of DHMS may trigger deep earthquakes. The result of the sluggishness of the dehydration of the 3.65 Å phase, as obtained in this study, indicates that this is most likely not the case.
However, the extreme reduction in grain size observed in the dehydration experiments due to the formation of nanocrystalline clinoenstatite, rather than the slowly released fluids, might cause instabilities in the Earth's mantle and, finally, induce earthquakes.
All data derived from this research are presented in the enclosed tables, figures and in the Supplement.
The supplement related to this article is available online at: https://doi.org/10.5194/ejm-33-675-2021-supplement.
MKM and BW had the initial idea for the project, performed the experiments and prepared the paper, with contribution of all co-authors. OA did the electron microprobe measurements and analyses. RW was responsible for the TEM work.
The authors declare that they have no conflict of interest.
Publisher's note: Copernicus Publications remains neutral with regard to jurisdictional claims in published maps and institutional affiliations.
This article is part of the special issue “Probing the Earth: experiments and mineral physics at mantle depths”. It is a result of the 17th International Symposium on Experimental Mineralogy, Petrology and Geochemistry, Potsdam, Germany, 1–3 March 2021.
The authors are very thankful to Andreas Ebert, Hans-Peter Nabein and Reiner Schulz, for their technical help, and Alan B. Woodland and an anonymous reviewer, for their support. The authors also acknowledge the scientific exchange and support of the Centre for Molecular Water Science (CMWS).
The research has been supported by the Deutsche
GeoForschungsZentrum.
The article processing charges for this open-access publication were covered by the Helmholtz Centre Potsdam – GFZ German Research Centre for Geosciences.
This paper was edited by Patrizia Fumagalli and reviewed by Alan Woodland and one anonymous referee.
Anderson, O. and Bowen, N. L.: Das binäre System Magnesiumoxyd-Silicium-2-oxyd, Z. Anorg. Chem., 87, 283–299, 1914.
Chollet, M., Daniel, I., Koga, K. T., Morard, G., and van de Moortèle, B.: Kinetics and mechanism of antigorite dehydration: Implications for subduction zone seismicity, J. Geophys. Res., 116, B04203, https://doi.org/10.1029/2010JB007739, 2011.
Ferrand, T. P., Hilairet, N., Incel, S., Deldicque, D., Labrousse, L., Gasc, J., Renner, J., Wang, Y., Green, II, H. W., and Schubnel, A.: Dehydration-driven stress transfer triggers intermediate-depth earthquakes. Nat. Commun., 8, 15247, https://doi.org/10.1038/ncomms15247, 2017.
Hamilton, D. L. and Henderson, C. M. B.: The preparation of silicate compositions by a gelling method, Mineral. Mag., 36, 832–838, 1968.
Incel, S., Hilairet, N., Labrousse, L., John, T., Deldicque, D., Ferrand, T., Wang, Y., Renner, J., Morales, L., and Schubnel, A.: Laboratory earthquakes triggered during eclogitization of lawsonite-bearing blueschist, Earth Planet. Sc. Lett., 459, 320–331, 2017.
Kirby, S. H., Stein, S., Okal, E. A., and Rubie, D. C.: Metastable mantle phase transformations and deep earthquakes in subducting oceanic lithosphere, Rev. Geophys., 34, 261–306, 1996.
Koch-Müller, M., Rhede, D., Schulz, R., and Wirth, R.: Breakdown of hydrous ringwoodite to pyroxene and spinelloid at high P and T and oxidizing conditions, Phys. Chem. Miner., 36, 329–341, 2009.
Konrad-Schmolke, M., Halama, R., Wirth, R., Thomen, A., Klitscher, N., Morales, L., Schreiber, A., and Wilke, F. D. H.: Mineral dissolution and reprecipitation mediated by an amorphous phase, Nat. Commun., 9, 1637, https://doi.org/10.101038/s41467-018-03944-z, 2018.
Kovaleva, E., Kusiak, M. A., Kenny, G. G., Whitehouse, M. J., Habler, G., Schreiber, A., and Wirth, R.: Nanoscale investigation of granular neoblastic zircon, Vredefort impact structure, South Africa: Evidence for complete shock melting, Earth Planet. Sc. Lett., 565, 116948, https://doi.org/10.1016/j.epsl.2021.116948, 2021.
Larson, A. C. and Von Dreele, R. B.: Generalized structure analysis system. Los Alamos National Laboratory Report LAUR 86-748, 1987.
Maurice, J., Bolfan-Casanova, N., Padrón-Navarta, J. A., Manthilake, G., Hammouda, T., Hénot, J. M., and Andrault D.: The stability of hydrous phases beyond antigorite breakdown for a magnetite-bearing natural serpentinite between 6.5 and 11 GPa, Contrib. Mineral. Petr., 173, 86, https://doi.org/10.1007/s00410-018-1507-9, 2018.
Mookherjee, M., Speziale, S., Marquardt, H., Jahn, S., Wunder, B., Koch-Müller, M., and Liermann, H.-P.: Equation of state and elasticity of the 3.65 Å-phase: Implications for the X-discontinuity, Am. Mineral., 100, 2199–2208, 2015.
Müller, J., Koch-Müller, M., Rhede, D., Wilke, F., and Wirth, R.: Melting relations in the system CaCO3-MgCO3 at 6 GPa, Am. Mineral., 102, 2440–2449, 2017.
Mussi, A., Cordier, P., and Frost, D. J.: Crystal defects in dense hydrous magnesium silicate phase A deformed at high pressure: characterization by transmission electron microscopy, Eur. J. Mineral., 24, 429–438, 2012.
Ohtani, E., Litasov, K., Hosoya, T., Kubo, T., and Kondo, T.: Water transport into the deep mantle and formation of a hydrous transition zone, Phys. Earth Plant. Int., 143–144, 255–269, 2004.
Perrillat, J.-P., Daniel, I., Koga, K. T., Reynard, B., Cardon, H., and Crichton, W. A.: Kinetics of antigorite dehydration: a real-time X-ray diffraction study, Earth Planet. Sc. Lett., 236, 899–913, 2005.
Rashchenko, S. V., Kamada, S., Hirao, N., Litasov, K. D., and Ohtani, E.: In situ X-ray observation of 10 Å phase stability at high pressure, Am. Mineral., 101, 2564–2569, 2016.
Raz, S., Weiner, S., and Addati, L.: Formation of high-magnesian calcites via an amorphous precursor phase: possible biological implications, Adv. Materials, 12, 38–42, 2000.
Rubie, D. C. and Ross, C. R.: Kinetics of the olivine-spinel transformation in subducting lithosphere – experimental constraints and implications for deep slab processes. Phys. Earth Planet. Int., 86, 223–241, 1994.
Schmidt, M. W. and Ulmer, P.: A rocking multi-anvil: elimination of chemical segregation in fluid-saturated high-pressure experiments, Geochim. Cosmochim. Ac., 68, 1889–1899, https://doi.org/10.1016/j.gca.2003.10.031, 2004.
Shirey, S. B., Wagner, L. S., Walter, M. J., Pearson, D. G., and van Keken, P. E.: Slab transport of fluids to deep focus earthquake depths – thermal modelling constraints and evidence from diamonds, AGU Advances, 2, e2020AV000304, https://doi.org/10.1029/2020AV000304, 2021.
Stalder, R. and Ulmer, P.: Phase relations of a serpentine composition between 5 and 14 GPa: significance of clinohumite and phase E as water carriers into the transition zone, Contrib. Mineral. Petr., 140, 670–679, 2001.
Stawski, T., Besselink, R., Chatzipanagis, K., Hövelmann, J., Benning, L. G., and van Driessche, A. E.: Nucleation pathway of calcium sulphate hemihydite (Bassanite) from solution: implications for calcium sulfates on Mars, J. Phys. Chem. C, 124, 8411–8422, 2020.
Toby, B. H.: EXPGUI, a graphical user interface for GSAS, J. Appl. Crystallogr., 34, 210–213, 2001.
Ulmer, P. and Stalder, R.: The Mg(Fe)SiO3, orthoenstatite-clinoenstatite transitions at high pressures and temperatures determined by Raman spectroscopy on quenched samples, Am. Mineral., 86, 1267–1274, 2001.
Wirth, R.: A novel technology for advanced application of micro- and nanoanalysis in geosciences and applied mineralogy, Eur. J. Mineral., 16, 863–876, https://doi.org/10.1127/0935-1221/2004/0016-0863, 2004.
Welch, M. and Wunder, B.: A single-crystal X-ray diffraction study of the 3.65 Å-phase MgSi(OH)6, a high-pressure hydroxide-perovskite, Phys. Chem. Mineral., 39, 693–697, 2012.
Wunder, B.: Equilibrium experiments in the system MgO-SiO2-H2O (MSH): Stability fields of clinohumite-OH (Mg9Si4O16(OH)2), chondrodite-OH (Mg5Si2O8(OH)2) and phase A (Mg7Si2O8(OH)6), Contrib. Mineral. Petr., 132, 111–120, 1998.
Wunder, B., Wirth, R., and Koch-Müller, M.: The 3.65 Å-phase in the system MgO–SiO2–H2O: Synthesis, composition and structure, Am. Mineral., 96, 1207–1214, 2011.
Wunder, B., Jahn, S, Koch-Müller, M., and Speziale, S.: The 3.65 Å-phase (MgSi(OH)6): Structural insights from DFT-calculations, T-dependent IR spectroscopy and compressibility measurements, Am. Mineral., 97, 1043–1048, 2012.
Zhan, Z.: Mechanisms and implications of deep Earthquakes, Annu. Rev. Earth Pl. Sci., 48, 147–174, 2020.