the Creative Commons Attribution 4.0 License.
the Creative Commons Attribution 4.0 License.
 | 31 Mar 2022
In situ reinvestigation of reaction phase A plus high-pressure clinoenstatite to forsterite plus water in the system MgO-SiO2-H2O (MSH)
Christian Lathe
Monika Koch-Müller
Bernd Wunder
Oona Appelt
Shrikant Bhat
Robert Farla
The dehydration reaction of phase A + high P clinoenstatite to forsterite + water was experimentally investigated at water-saturated conditions in the pressure range between 7.0 and 10.0 GPa by in situ reversal runs in a multi-anvil press at the synchrotron source of PETRA III in Hamburg. By using closed watertight X-ray transparent Ti capsules, its position is determined by reversal brackets at 8.3 GPa (700–760 ∘C), 8.6 GPa (700–740 ∘C), and 9.8 GPa (750–800 ∘C); thus, the equilibrium of the reaction corresponds ideally to the data reported by Wunder (1998). Optical investigations of the quenched product phases show strong grain coarsening of phase A and clinoenstatite, whereas nucleated forsterite from the breakdown of the aforementioned phases is very fine grained. This corresponds to recent experimental observations that the grain size of phases formed in hydration reactions are significantly larger than those from dehydration reactions.
In addition, we performed three time-dependent in situ experiments at 9–10 GPa and 800–870 ∘C and monitored the reaction progress every 10 min to determine the kinetics of the forsterite formation from phase A + high P clinoenstatite. The growth of forsterite at these P–T conditions, already visible after 10 min, confirms the results of the bracketing experiments. However, the reaction is extremely slow, and even after more than 3 h, significant amounts of phase A and high P clinoenstatite are still present. This is in contradiction to other dehydration reactions of former experimental studies, e.g. the fast dehydration of serpentine, which completely dehydrates within 3 h, even at much lower temperatures, closely overstepping serpentine stability.
Despite its reaction sluggishness, which would contradict the concept of earthquake initiation, the observed formation of nano-sized forsterite as a dehydration product may still indicate the potential of this reaction to cause mechanical instabilities and, thus, seismicity within cold subduction zones at depths of the Earth's mantle. Additionally, at depths exceeding serpentine dehydration, the phase A + high P/low P clinoenstatite breakdown to forsterite + water might induce geochemical and geophysical processes, including the formation of low-velocity zones within the overlying mantle wedge from the large amounts of fluid liberated by this water line reaction. After the breakdown of antigorite, the assemblage phase A + clinoenstatite might act as a bridge to transport water to larger depths during cold subduction, followed by the formation of other hydrous high P phases.
- Article
(8568 KB) - Full-text XML
- Companion paper
-
Supplement
(481 KB) - BibTeX
- EndNote


Dense hydrous magnesium silicates (DHMSs) are a group of synthetic phases which have not been found in nature, with the exception of 10 Å phase (Khisina and Wirth, 2008). Their P–T stabilities range from upper to lower mantle conditions (e.g. Angel et al., 2001; Ohtani et al., 2000); thus DHMSs are discussed as possible candidates for carrying water deep into the Earth's mantle (e.g. Hacker et al., 2003; Komabayashi et al., 2005a, b). The key phase to transporting water by the subduction of hydrated oceanic lithosphere into the upper mantle is the serpentine mineral antigorite (e.g. Scambelluri et al., 2004). Antigorite dehydrates along cold subduction geotherms at temperatures below about 550 ∘C (Komabayashi et al., 2005a) to form the assemblage phase A (Mg7Si2O8(OH)6, ph A) + low P clinoenstatite (LP cen) + water in the system of MgO-SiO2-H2O (MSH). During further subduction, the breakdown of this assemblage by the reaction of ph A + LP/HP cen = forsterite (Fo) + water (w) was defined by Liu (1987) as the water line, above which the (OH)-rich phase ph A (containing about 9.7 wt % of H2O) might transport water further into deeper portions of the mantle, below which forsterite might coexist with free water. The dehydration reaction is as follows:
which would produce a huge amount of water and which might be associated with water-influenced processes such as melt generation, metasomatism, seismicity, or the new formation of hydrous phases in the overlying mantle wedge (e.g. Ferrand et al., 2017; Zhan, 2020; Shirey et al., 2021) and might be indicated by low-velocity zones due to free fluids, with the water line representing the base of this zone in the Earth's mantle (Liu, 1987). Due to the importance of the water line, the Reaction (R1) ph A + 3 LP/HP cen = 5 fo + 3 w, was investigated intensively in the MSH system in three different experimental studies (Luth, 1995; Wunder, 1998; Komabayashi et al., 2005a), which resulted in significant different P–T conditions (see Fig. 3).
Aimed to determine the exact position of Reaction (R1) and to clarify the reasons for these discrepancies, in this study we again constrained the P–T coordinates of Reaction (R1) in the pressure range 7–10 GPa. We performed reverse in situ experiments in a multi-anvil press combined with a synchrotron source. Importantly, following the method described by Chinnery et al. (1999), we used Ti capsules, which are transparent for the X-ray beam and allow us to investigate both hydration and dehydration processes in the closed system in situ. In addition, we also studied the kinetics of the transformation of phase A + high P clinoenstatite to forsterite + H2O at water-saturated conditions.
2.1 Synthesis and characterisation of starting and product materials
Synthesis of phase A was performed in the 800 t rotating multi-anvil press apparatus installed at the GeoForschungsZentrum GFZ, Potsdam, Germany at 8 GPa (700 ∘C) and had a run duration of 48 h. We used the pressure assembly, which consists of MgO (+5 % Cr2O3) octahedra, with an edge length of 14 mm and tungsten carbide (WC) cubic anvils with 8 mm truncations. Other pressure transmitting parts and the sleeve around the graphite heater were made of MgO. About 5 mg of the starting material for the phase A syntheses, a gel with 7 MgO–2 SiO2 composition, was placed into Pt capsules plus 1.5 µl water. The gel was prepared after the method of Hamilton and Henderson (1968). Temperature was measured using a W5 %Re–W26 %Re thermocouple (type C), with a precision of about ±10 ∘C. We did not correct the pressure effect on the electromotive force (emf) of the thermocouple as, to our knowledge, only emf corrections for type D and K thermocouples are known from the literature (e.g. Getting and Kennedy, 1970; Xie et al., 2021), which, in addition, showed that, at the low temperature of our study, the correction would be within the T uncertainties. We determined the temperature distribution within the capsule with the 2-pyroxene geothermometer (for details, see Müller et al., 2017). Pressure was calibrated by press load experiments, using a number of high-pressure ambient and high-pressure–high-temperature phase transformations. The estimated pressure uncertainty is about ±0.3 GPa. The press was rotated through 360∘, with a rate of 5∘/s during heating to prevent the formation of foreign-phase precipitates. A detailed description of the press and the experimental method is given in Koch-Müller et al. (2009). Low P clinoenstatite ( was synthesised at 1 atm, heating a MgSiO3 glass at 1500 ∘C for 3 h, following the method described by Anderson and Bowen (1914). We used synthetic forsterite, provided by the Leibniz-Institut für Kristallzüchtung (IKZ), Berlin, which was used in former experimental studies (Milke et al., 2009; Gardés et al., 2012).
Powder X-ray diffraction patterns of synthesised phases were recorded on a STOE Stadi P diffractometer (CuKα1 radiation, curved Ge (111) monochromator, 40 kV accelerating voltage, 40 mA beam current, 2Θ range 5–125∘, and 0.01∘ scan step). Phase proportions and cell dimensions were determined by Rietveld refinement, using the software package GSAS (General Structure Analysis System; Larson and Von Dreele, 1987) combined with the graphic interface EXPGUI (Toby, 2001), and are shown in Table S1 in the Supplement. Initial structure parameters were taken from the Inorganic Structure Database (ICSD; FIZ Karlsruhe).
After the experiments, some of the recovered capsules were embedded in epoxy, polished, and coated with graphite for electron microprobe (EMP) characterisation. The EMP analyses of phase A (starting material) and of the solid product phases were done at GFZ (German Research Centre for Geosciences, Potsdam) with the EMP JXA-8230 from JEOL Ltd. The EMP analyses were done in WDS (wavelength disperse spectroscopy) mode with an accelerating voltage of 15 kV, a beam current of 10 nA, and a beam size of 5 µm. As standards for the EMP analyses, we used diopside for Mg and Si and rutile for Ti. The counting time on the peak was 10 s. The data reduction was done by a φ (ρZ) correction procedure (Armstrong, 1995). At these conditions, the lower detection limit is ≤ 0.01 wt % for main elements. The analysis error is about 1 %. The EMP is advantageous for high spatial resolutions and the possibility for backscatter electron (BSE) controlled point analysis, whereby the stimulation of small inclusions is excluded or minimised. With the electron microprobe, we made pictures of BSE and secondary electrons (SEs). Additionally, element distribution patterns were done at GFZ with a field emission JEOL hyper tube JXA-8500FPlus. The maps for Si–Kα (tallium acid phthallate, TAP, crystal) and Mg–Kα (large tallium acid phthallate, TAPL, crystal) were done in stage mode, with an accelerating voltage of 15 kV, a beam current of 20 nA, and a beam size of 1 µm at a dwell time of 40 ms. The element distribution maps were taken to observe the size distribution after the run and to confirm the reaction direction and progress of the experiments.
We performed FTIR (Fourier transform infrared) spectroscopic measurements within the OH stretching region and lattice vibration of the starting material of phase A using a thin film technique (Li et al., 2022). To check if we incorporated H2O into the forsterite and clinoenstatite during the experiments in Hamburg, we performed FTIR spectroscopic measurements directly on the selected crystals in the OH stretching region after identifying the samples via Raman spectroscopy. We used a VERTEX 80v FTIR spectrometer (Bruker optics) with an attached HYPERION II microscope. In the OH region, we used a tungsten light source, an InSb (indium antimonide) detector, and a CaF2 beam splitter, and for the mid-infrared region, the settings consisted of a Globar light source, a HgCdTe (mercury cadmium telluride, MCT) detector, and a KBr beam splitter. The thin films were placed on a diamond, as a sample holder, and the single crystals were placed on KBr discs. Measurements were averaged over 256 scans, with a two wavenumber (cm−1) spectral resolution.
Raman spectra of the starting material and quenched samples of phase A were also taken in the OH stretching and lattice vibration region. Raman spectra of the different phases of the run products were measured using the polished cross section with a HORIBA Jobin–Yvon LabRAM HR800 VIS spectrometer (gratings of 1800 lines mm−1, a confocal pinhole set to 1000 µm, and the slit aperture set to 100 µm) in backscattering configuration. The spectrometer is equipped with a charge-coupled device (CCD) detector and an Olympus BXFM microscope. A Cobolt Blues™ diode-pumped solid-state (DPSS) laser, with a wavelength of 532 nm, was used for the excitation. To avoid the laser-induced damage of the sample, the laser power was filtered to 50 %, and the Raman spectra were taken with 3 accumulations for 20–30 s each, depending on the sensitivity to the laser power.
2.2 In situ multi-anvil press experiments
We examined Reaction (R1) by means of high P–T in situ X-ray diffraction measurements in the Aster-15 large volume press (LVP) at the synchrotron storage ring of PETRA III in Hamburg (beamline P61B; large volume press with extreme conditions – LVP-ECs). We used the same standard multi-anvil assembly, as described above, for the syntheses of phase A. The experiments in the LVP are combined with in situ energy dispersive X-ray diffraction (XRD; 30–160 keV). We used a solid-state germanium detector (SSD) with a multichannel analyser (MCA) to collect the diffraction patterns. The energy range of the SSD-MCA was calibrated using the gamma ray lines of different metals (57Co and 133Ba).
Hydrous reactions must be studied in sealed and inert capsules and, in addition, they need to be adequately transparent for X-rays if the phases are investigated in situ under P and T. Therefore, we used Ti capsules, which have been demonstrated to be ideal sample containers for studying hydration/dehydration reactions (Chinnery et al., 1999) in situ. The capsule size was 3 mm in length and 2 mm in diameter, with a wall thickness of 0.1 mm; the sample volume is around 7 mm3.
Table 1Results of reversed and kinetic experiments, including their starting materials, experimental conditions, and the reaction progress.

Please note: runs 384 and 385 were performed by using a Ge detector at 5∘. The pyrophyllite gaskets absorbed X-rays below 40 keV, so no reflections lower than this energy could be determined. Ia/Io represents the intensity ratio of measured and initial intensities of the starting materials of some selected reflections exemplarily recording the reaction
progress. The three kinetic experiments did not contain any forsterite in the starting material. In these experiments of Ia/Io of phase A represent the ratio determined at the end of the experiments. Note: Fo – forsterite; ph A – phase A; LP cen – low-pressure clinoenstatite; HP cen – high-pressure clinoenstatite.
a Run 383 failed during heating at a pressure of 6.7 GPa. The maximum temperature reached after about 40 min was assumed to be below about 450 ∘C. This experiment is not considered for bracketing the reaction, and its reaction progress is considered here only qualitatively. It is included here for completeness; a Si element map (Fig. S4) of the quenched
sample of this run is given in the Supplement.
b In run 501, already after 20 min, forsterite was observed by the in situ diffraction analyses. We held this experiment at 10 GPa, 870 ∘C for a further 1.5 h before quenching. The run product was analysed by IR spectroscopy (Fig. S3), which detected traces of clinoenstatite beside forsterite in the sample. Both phases contain significant amounts of hydrogen.
c In run 503, shortly after reaching 830 ∘C and 10.2 GPa, the synchrotron beam was dumped for 2 h. During this duration, the temperature of the experiment was turned down to 200 ∘C (at constant P of 10.2 GPa) and was increased to 830 ∘C when the beam was available again.
The runs 384 and 385 (Table 1) were carried out with a Ge detector at the diffraction angle of 5∘; all other runs were carried out with a Ge detector at a diffraction angle of 3∘, which caused a wider spread of the diffraction peaks and shifts the peaks to higher energies. MgO, surrounding the Ti capsule, was used as an in situ P marker. The following reflections were used: (111), (200), and (220) for the detector at 3∘ and (220), (420) for the detector at 5∘ diffraction angle, and pressures were calculated using the programme PDIndexer ver4.386 (open source). The pressure was measured several times during the P and T increase until reaching the target P–T conditions and during the annealing. In some experiments, we realised a small drop in pressure, for which we than calculated an average pressure.
The diffraction angle 2θ was calculated from the fitted peak positions of the internal pressure marker MgO. A slit system was used to change the beam size for X-ray diffraction. We used a slit of 100 × 100 µm to measure the angle and pressure very precisely and a larger slit of 100 × 300 µm to measure a larger volume of the sample with better statistics. By opening the slits to 2400 × 2000 µm, it was possible to take a radiographic image of the position of the sample, capsule, thermocouple, and pressure marker in situ (Fig. 1). The image was collected with a sCMOS camera (pco.edge 5.5 MP) with 5× magnification after a thin scintillator (40 µm GGG:Eu) and a glassy carbon mirror. To exclude special orientations from the sample material, the press oscillated around the vertical press axis between −4 and 4∘ at 0.4∘ min−1 during each XRD acquisition.
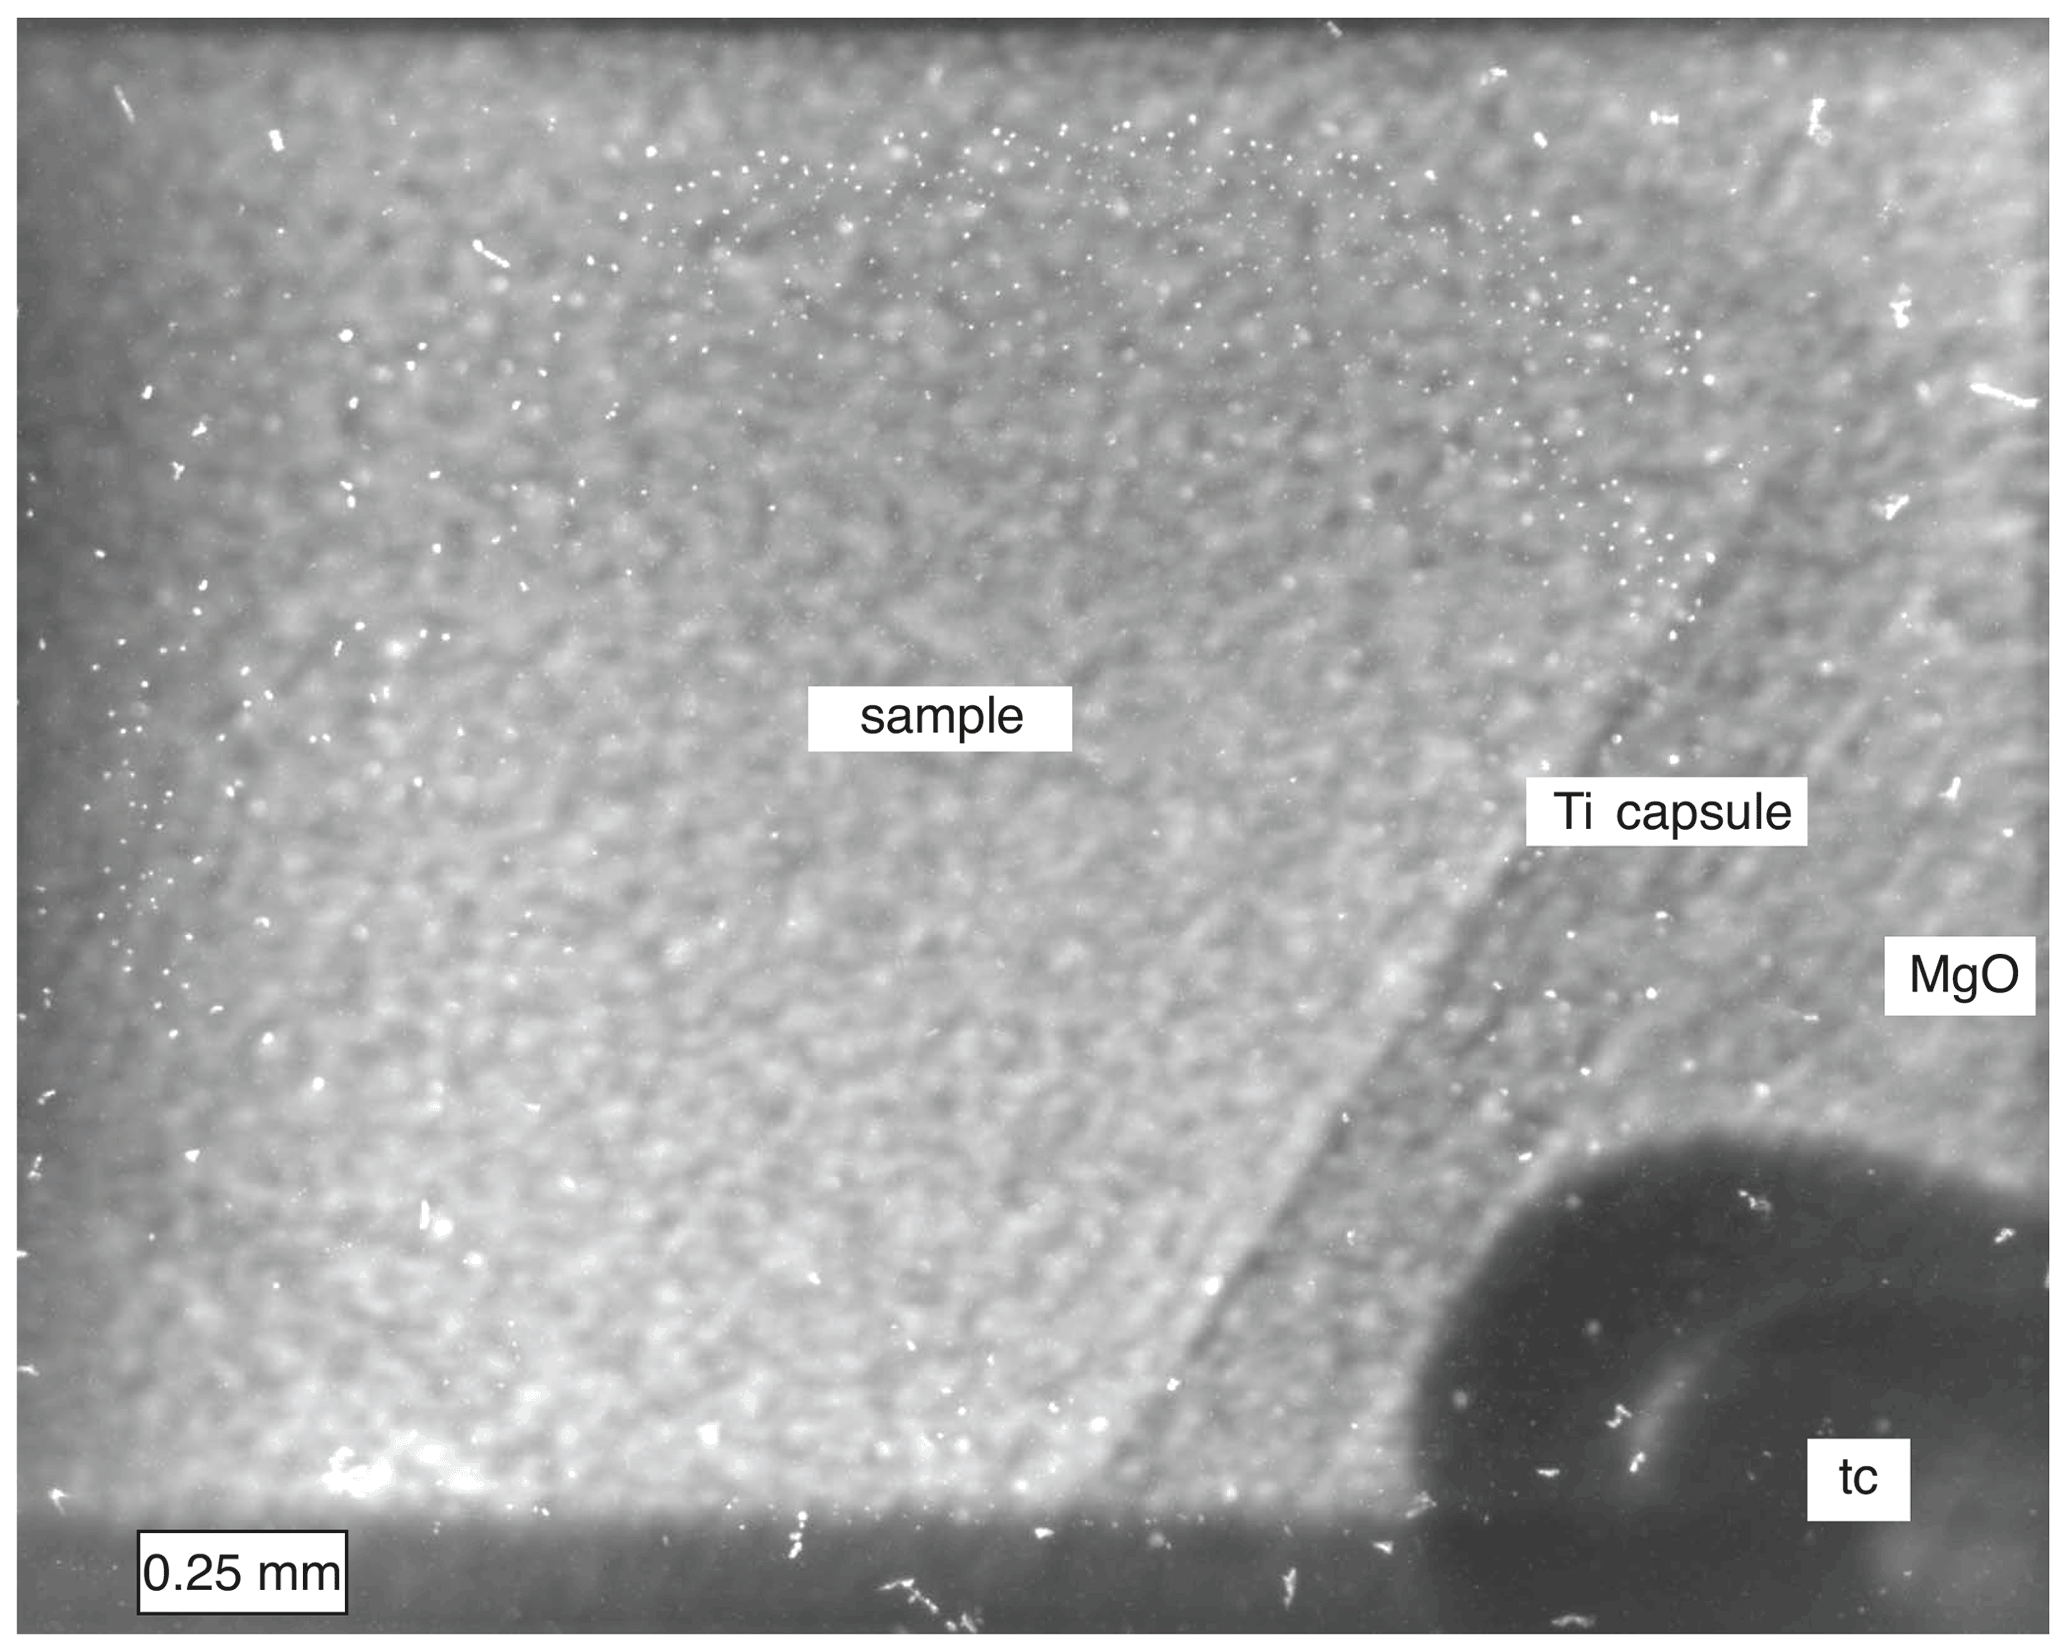
Figure 1Shown are parts of the sample, Ti capsule, thermocouple (tc), and MgO, which is used for embedding the capsule and as material for the in situ pressure determination. The total frame is 2400 × 2000 µm, which corresponds to the size of the slit opening for taking the radiographic image with a sCMOS camera on a white beam X-ray microscope.
The starting material for the reversed equilibrium experiments (Table 1) consisted of a mixture of phase A, low P clinoenstatite, and forsterite with a molar ratio according to the reaction plus water in excess. The fine-grained starting materials were mixed and ground together in a mortar. The kinetic experiments (Table 1) were performed with a mixture of phase A and low P clinoenstatite with a molar ratio 1 : 3 plus water in excess. X-ray diffraction patterns of the two starting materials are shown in Fig. 2a and b, respectively. The size distribution in the starting materials was very homogeneous (Fig. 1), and the grains are smaller than 20 µm.
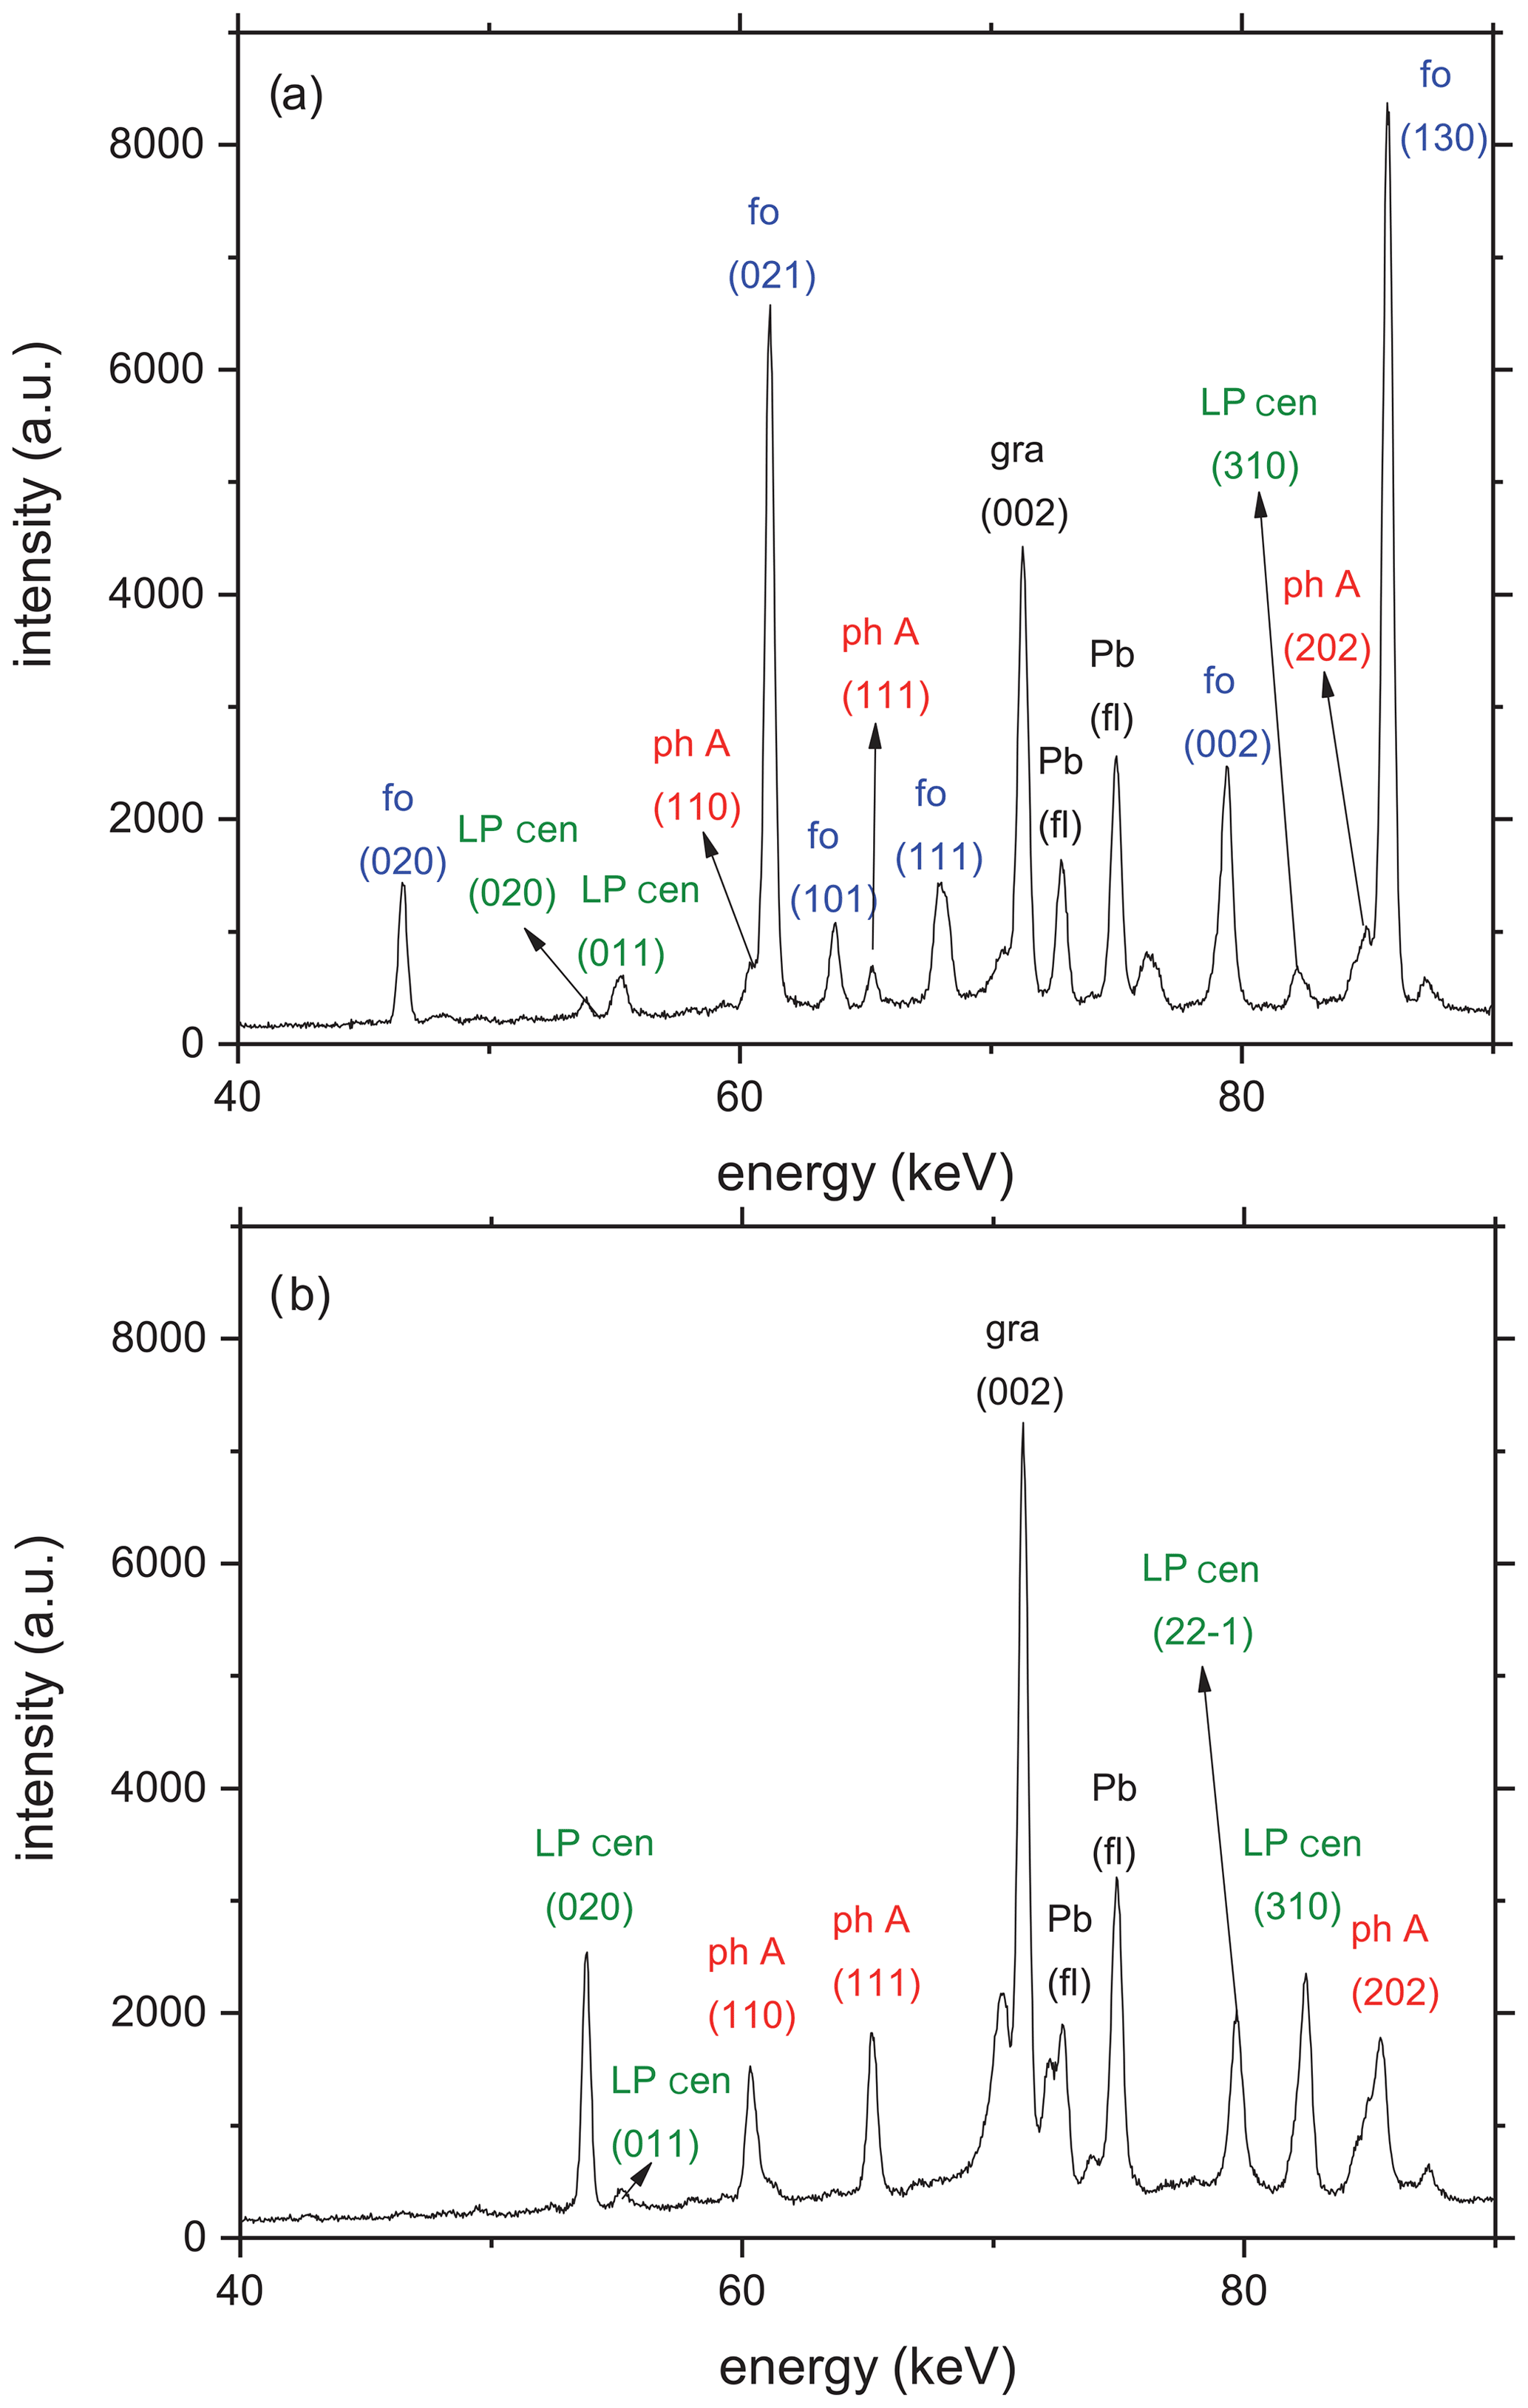
Figure 2(a) Representative diffraction patterns of the starting material for all reversal experiments taken at room T and ambient P in situ in the multi-anvil press. Beside the X-ray reflections of the starting materials forsterite (fo), phase A (ph A), and low P clinoenstatite (LP cen), additional reflections relate to the (002) graphite (gr) peak at 71.3 keV from the heater and Pb fluorescence (fl) at 74.96 and 72.80 keV from the detector shielding. (b) Representative diffraction pattern of the starting material for all kinetic experiments at room P and T, containing ph A and LP cen, together with the (002) graphite peak and the two Pb fluorescence lines.
The procedure during the equilibrium experiments was the following: we first increased the pressure to the target pressure, e.g. 9.8 GPa (in run 384; Table 1); then we started heating from room temperature to temperatures close to the expected phase transition. The pressure and temperature was held constant, and we monitored the reaction progress via collecting the X-ray diffraction pattern in situ. For detecting the reaction progress, we monitored the intensity changes of the strongest reflections of the different phases that do not overlap with reflections of the other phases in detail. After determining the reaction direction, e.g. a growth of phase A and HP cen at 9.8 GPa, 700 ∘C (in run 384; Table 1), we increased the temperature to bracket the reaction. We collected X-ray diffraction patterns at a constant temperature as a function of time, which ranged between 28 and 180 min, until growth of forsterite was unambiguously determined. In one experiment (run 455; Table 1) we were after the first pressure (7.0 GPa) and temperature increase (to 690 ∘C) already in the forsterite stability field. Therefore, we increased pressure to 8.6 GPa at 700 ∘C to also document the hydration progress by growth of the hydrous assemblage ph A + HP cen. In all, the experiments were performed at four different pressures between 7.0 and 9.8 GPa with temperatures between 690 and 880 ∘C, such that data at 12 P–T conditions were collected (Table 1). One experiment (run 383; Table 1) failed during heating and was not considered for bracketing the reaction.
The procedure during the kinetic experiments was the following: we again started with increasing the pressure to the target pressure of, for example, 9.3 GPa (run 456; Table 1) and then increased the temperature from room T to a target temperature (800 ∘C) within the forsterite stability field. The temperature was chosen according to the results of the equilibrium experiments. For example, at 10.2 GPa, 830 ∘C (run 503; Table 1), we monitored the reaction process via collecting the X-ray diffraction pattern in situ every 10 min up to a total duration of 195 min. In this experiment, we additionally collected the time-dependent diffraction pattern at three different sample positions to check for reproducibility. In run 503 (Table 1), shortly after reaching 830 ∘C, 10.2 GPa, the synchrotron beam was dumped for 2 h. During this duration, the temperature of the experiment was turned down to 200 ∘C (at a constant P of 10.2 GPa) and was increased again to 830 ∘C when the beam was available again. In each of the three kinetic experiments (Table 1) which were performed between 800 and 870 ∘C, we determined the pressure in each time step and noted small P drops in the range of 0.4–0.5 GPa (Table 1). Nevertheless, all data were still collected in the forsterite + water P–T stability field.
It can be assumed that the relative integral intensities of the diffraction peaks are proportional to the weight fraction of the phase because the X-ray absorption coefficient does not change during the transformation. The line profile was calculated by assuming a Gaussian distribution counted by the solid-state detector (e.g. Lauterjung and Will, 1985). We estimated the transformed volume from the relative peak intensities of the (110) and (111) diffraction peaks of phase A. The degree of transformation X(t) is thus calculated as (1), where Iat is the intensity of the diffraction peak of phase A at time t, and Ia0 is the value at time t=0 and plotted the transformation percent versus time (see Fig. 6). Preferred crystal orientation due to non-hydrostatic pressure conditions can lead to the apparent growth or decline of diffraction peaks, even at constant phase proportions. As there is no forsterite in the starting material of the kinetic experiments, we needed a different approach to calculate the transformation X(t) to forsterite. We determined the relative peak intensities (now in arbitrary units) of the forsterite reflections (021) for corresponding times and plotted them versus time (see Fig. 6). We also used the reflections (111), (101), and (131) of forsterite to calculate the transformation X(t), which resulted in similar growth rates.
3.1 Characterisation of the starting materials and quenched product phases
Details on the syntheses of the starting materials and results of their characterisation are summarised in Table S1. All materials are fully crystalline. Forsterite and the synthesised low P clinoenstatite are single-phase material, respectively, whereas the high P experiment mainly produced phase A together with traces of periclase. The cell dimensions of the two phases low P clinoenstatite and forsterite (Table S1) correspond to those known from the literature, respectively. The cell dimensions of phase A, a=7.8628(3) Å, c=9.5758(3) Å, V=512.70(3) Å3, are slightly smaller than those known from the literature (e.g. Wunder, 1998). This correlates with the small Mg deficiency observed from the EMP analyses and the resulting structural formula of Mg6.89(4)Si2.03(2)O14H6.1, which might indicate a small amount of octahedrally coordinated Si and little Mg = 2H substitution. The Raman spectra of phase A show two OH stretching bands at 3400 and 3518 cm−1 (Fig. S1a). Our IR investigation confirmed the two main OH bands (Cynn et al., 1996); additionally, we identified a further weak OH band at about 3245 cm−1, which might be due to the substitution Mg = 2H (Fig. S2a). Li et al. (2022) observed a weak band at similar wavenumbers in Al bearing shy B and assigned it to OH vibrations associated with a vacant Mg octahedron. The mid infrared (MIR) absorption spectra of phase A (Fig. S2b) and the Raman spectra in the lattice vibrational region (Fig. S1b) are in good agreement with the spectra reported in Cynn et al. (1996) and Liu et al. (1997), respectively. Figure S3 in the Supplement shows spectra in the OH stretching region of recovered forsterite and clinoenstatite crystals of run 501, which was 1.5 h within the forsterite stability field at 870 ∘C and 9.8 GPa. The stable forsterite and the traces of relict clinoenstatite both contain OH groups. The spectrum of olivine is very similar to that reported in Matveek et al. (2001; their Fig. 4b) and that of clinoenstatite is very similar to what is reported in Bromiley and Bromiley (2006; their Fig. 4). Growth of phase A (see Table 1) and the observation of OH groups in the structure of the product forsterite and clinoenstatite strongly indicate that the Ti capsules were closed, and water-saturated conditions were obtained during the experiments.
EMP analyses of the quenched product phases from all runs show that neither phase A, clinoenstatite, nor forsterite have any Ti incorporated, indicating the lack of any contamination from the capsule material. The compositions of forsterite and clinoenstatite do not show any deviation from their ideal structural formula; in total, 10 analyses of phase A from run 455 resulted in the structural formula Mg6.96(3)Si2.02(2)O14H6.1. As this formula corresponds to the ideal composition Mg7Si2O8(OH)6 within 2σ of their standard deviation, any Si[6] or Mg = 2H substitution mentioned above is not unambiguously verified. The Raman spectrum of quenched phase A in the range of the OH stretching vibrations (Fig. S1a) does not show any changes compared to the spectrum of the starting phase A (Fig. S1a).
3.2 In situ high-pressure experiments
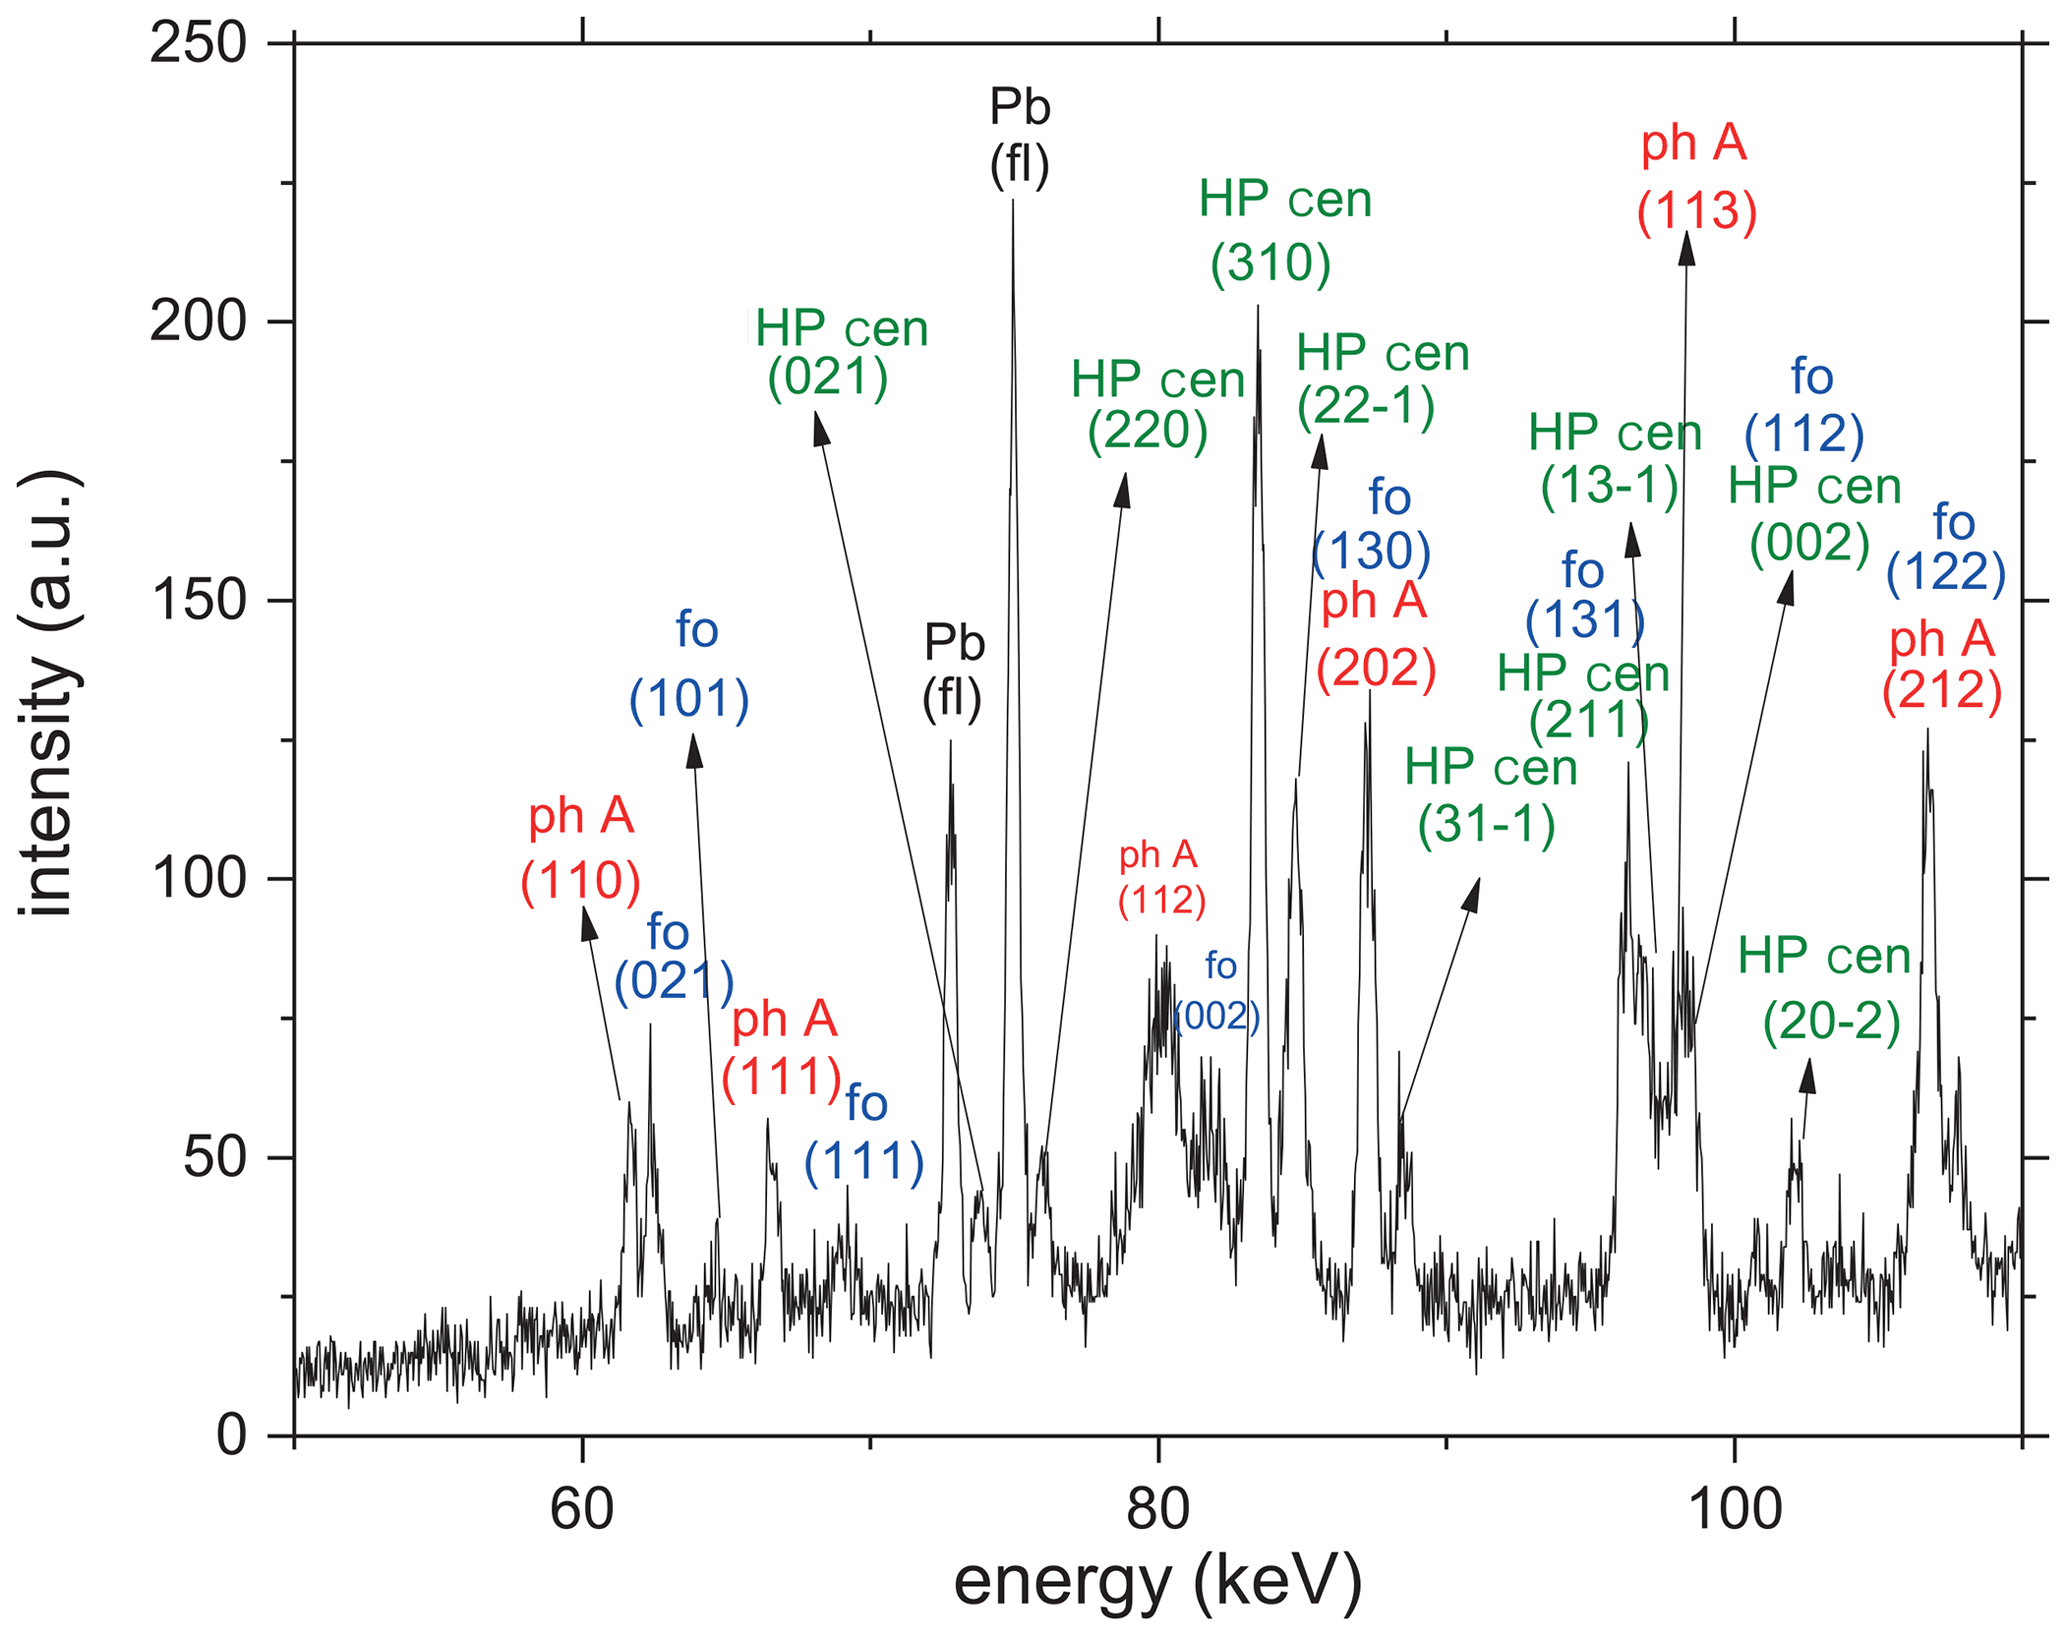
In Table 1, reversed and kinetic experiments are compiled, including their starting materials, experimental conditions, and the reaction progress. The results of all experiments in comparison to the previous studies are shown in Fig. 3. Under the P–T conditions investigated, clinoenstatite should occur in the high-pressure modification (HP cen; ), which, however, is not quenchable to ambient conditions (Ulmer and Stalder, 2001) but transforms back to the low-pressure modification (LP cen; ). In all the in situ experiments, the low P clinoenstatite transformed into the high P clinoenstatite. Figure 4 shows an example in which high P clinoenstatite is unambiguously identified.
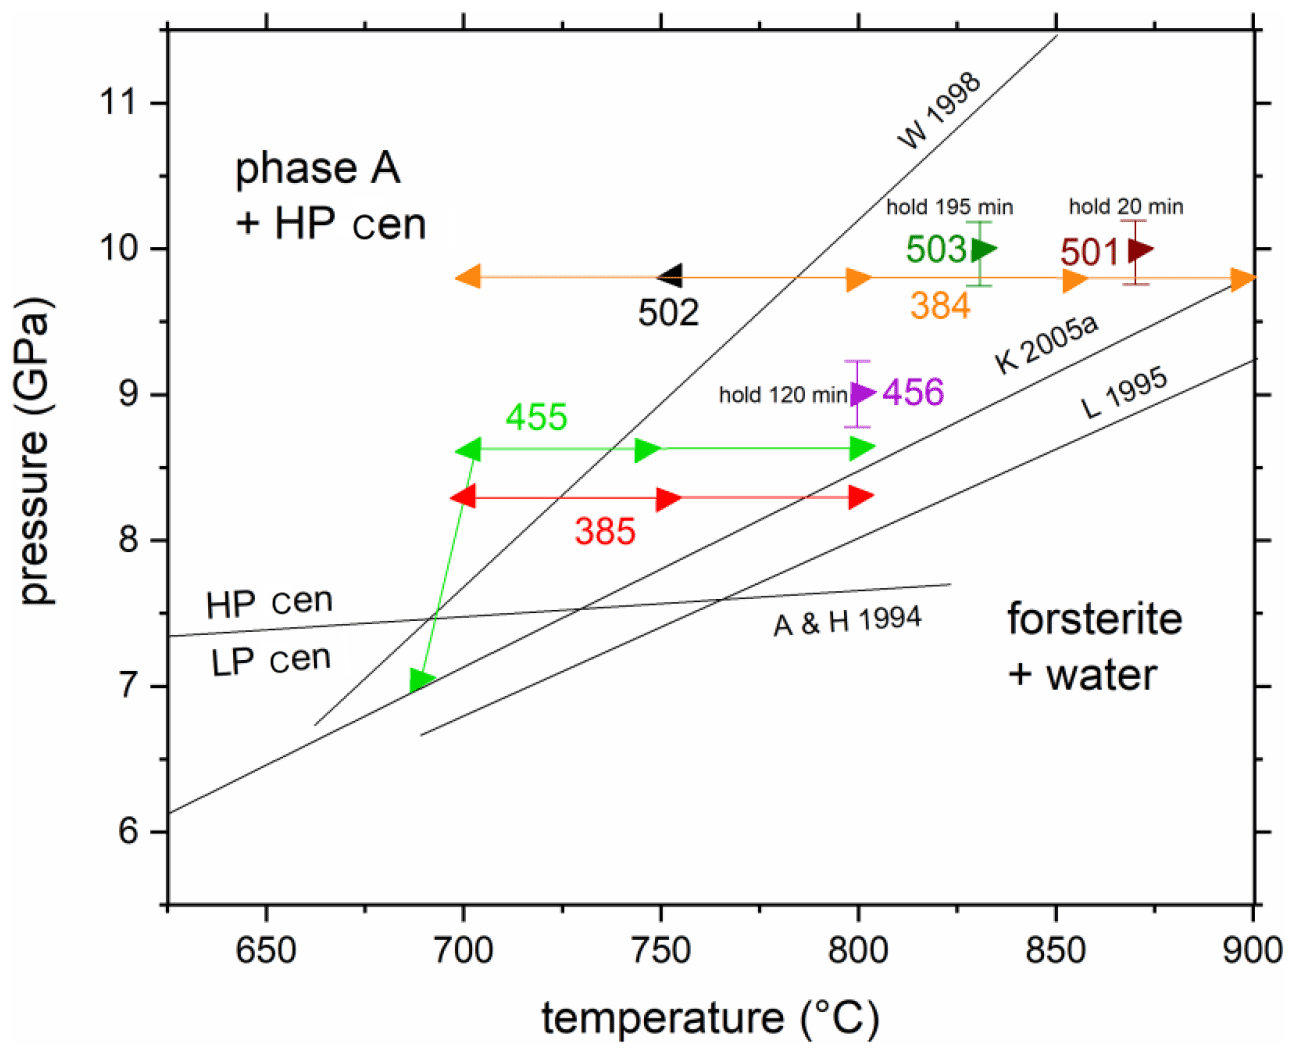
Figure 3Experimental results of in situ experiments on the reaction phase A + high P clinoenstatite = forsterite + water. The experiments 384, 385, 455, and 502 are reversal and 456, 501, and 503 are kinetic experiments (see Table 1). Triangles pointing left indicate the growth of ph A and high P clinoenstatite, while those pointing right indicate the growth of forsterite. The solid lines connecting symbols with the same colour show the P and T paths of the corresponding experiments (red – 385; green – 455; orange – 384). The former experimental studies on this reaction, in W 1998 (Wunder, 1998), K 2005a (Komabayashi et al., 2005a), and L 1995 (Luth, 1995), are shown for comparison. A & H 1994 is the low P/high P clinoenstatite transition after Angel and Hugh-Jones (1994).
3.2.1 Reversed in situ equilibrium experiments
The equilibrium of the Reaction (R1) phase A + 3 high P clinoenstatite = 5 forsterite + 3 water was determined by reversal brackets at 8.3 GPa (700–760 ∘C), 8.6 GPa (700–740 ∘C), and 9.8 GPa (750–800 ∘C); an additional experiment at 7.0 GPa (690 ∘C) showed the growth of forsterite at the expense of high P clinoenstatite and phase A (Fig. 3, Table 1). Thus, all 12 reversal experiments confirm the data reported by Wunder (1998). Reaction (R1), expressed in P–T coordinates, is much steeper compared to the results of Luth (1995) and Komabayashi et al. (2005a) and crosses the high P/low P clinoenstatite transition according Angel and Hugh-Jones (1994) at lower temperatures of about 670 ∘C (at about 7.45 GPa). Additionally, the three kinetic experiments also confirm these results (Fig. 3). In these three experiments, forsterite and not the assemblage phase A and high P clinoenstatite grew, as interpreted by Luth (1995) and Komabayashi et al. (2005a).
3.2.2 Kinetic experiments
The kinetic experiments were performed at 800, 830, and 870 ∘C, at pressures between 9 and 10 GPa (Table 1). At 800 (run 456) and 830 ∘C (run 503), the reaction was extremely sluggish and never completed – even after 195 min (Table 1). However, at the highest temperatures of 870 ∘C (run 501; Table 1), which exceeded the determined equilibrium the most, the reaction was already complete after 20 min. Detailed 3-D views of the reaction progress with times up to 120 min of run 456 (Table 1) are shown in Fig. 5a, for the energy range 60–70 eV, and Fig. 5b, for the energy range 74–86 eV, respectively. In both 3-D views, forsterite grew at the expense of the starting materials in phase A and clinoenstatite. Unfortunately, the first diffraction pattern was completed only after t=10 min. Remarkably, already after 10 min the first diffraction peaks of forsterite are visible, indicating that no significant barrier for forsterite nucleation exists. In Fig. 6, we show the progress of the reaction in run 456 (Table 1) by comparing the time-dependent intensity change of phase A (reflection 110) and forsterite (reflection 021). These results were nearly identical to the results using (111) phase A reflections and (111), (101), and (131) of forsterite (Table 1), indicating a lack of preferred orientations. Not shown here is the evolution of HP cen peaks, which follow the same observed time-dependent intensity change as phase A. For run 456, the reaction progressed fastest in the first 10–20 min, with phase A decomposing about 35 %, slowing down more or less linearly for the reminder run duration. For run 503 (Table 1), the reaction progress is shown in the Supplement (Fig. S6). In run 503, shortly after reaching 830 ∘C at 10.2 GPa, the synchrotron beam was dumped for 2 h. During this duration, the temperature of the experiment was turned down to 200 ∘C (at constant P of 10.2 GPa) and was increased to 830 ∘C, when the beam was available again, and held for 195 min.
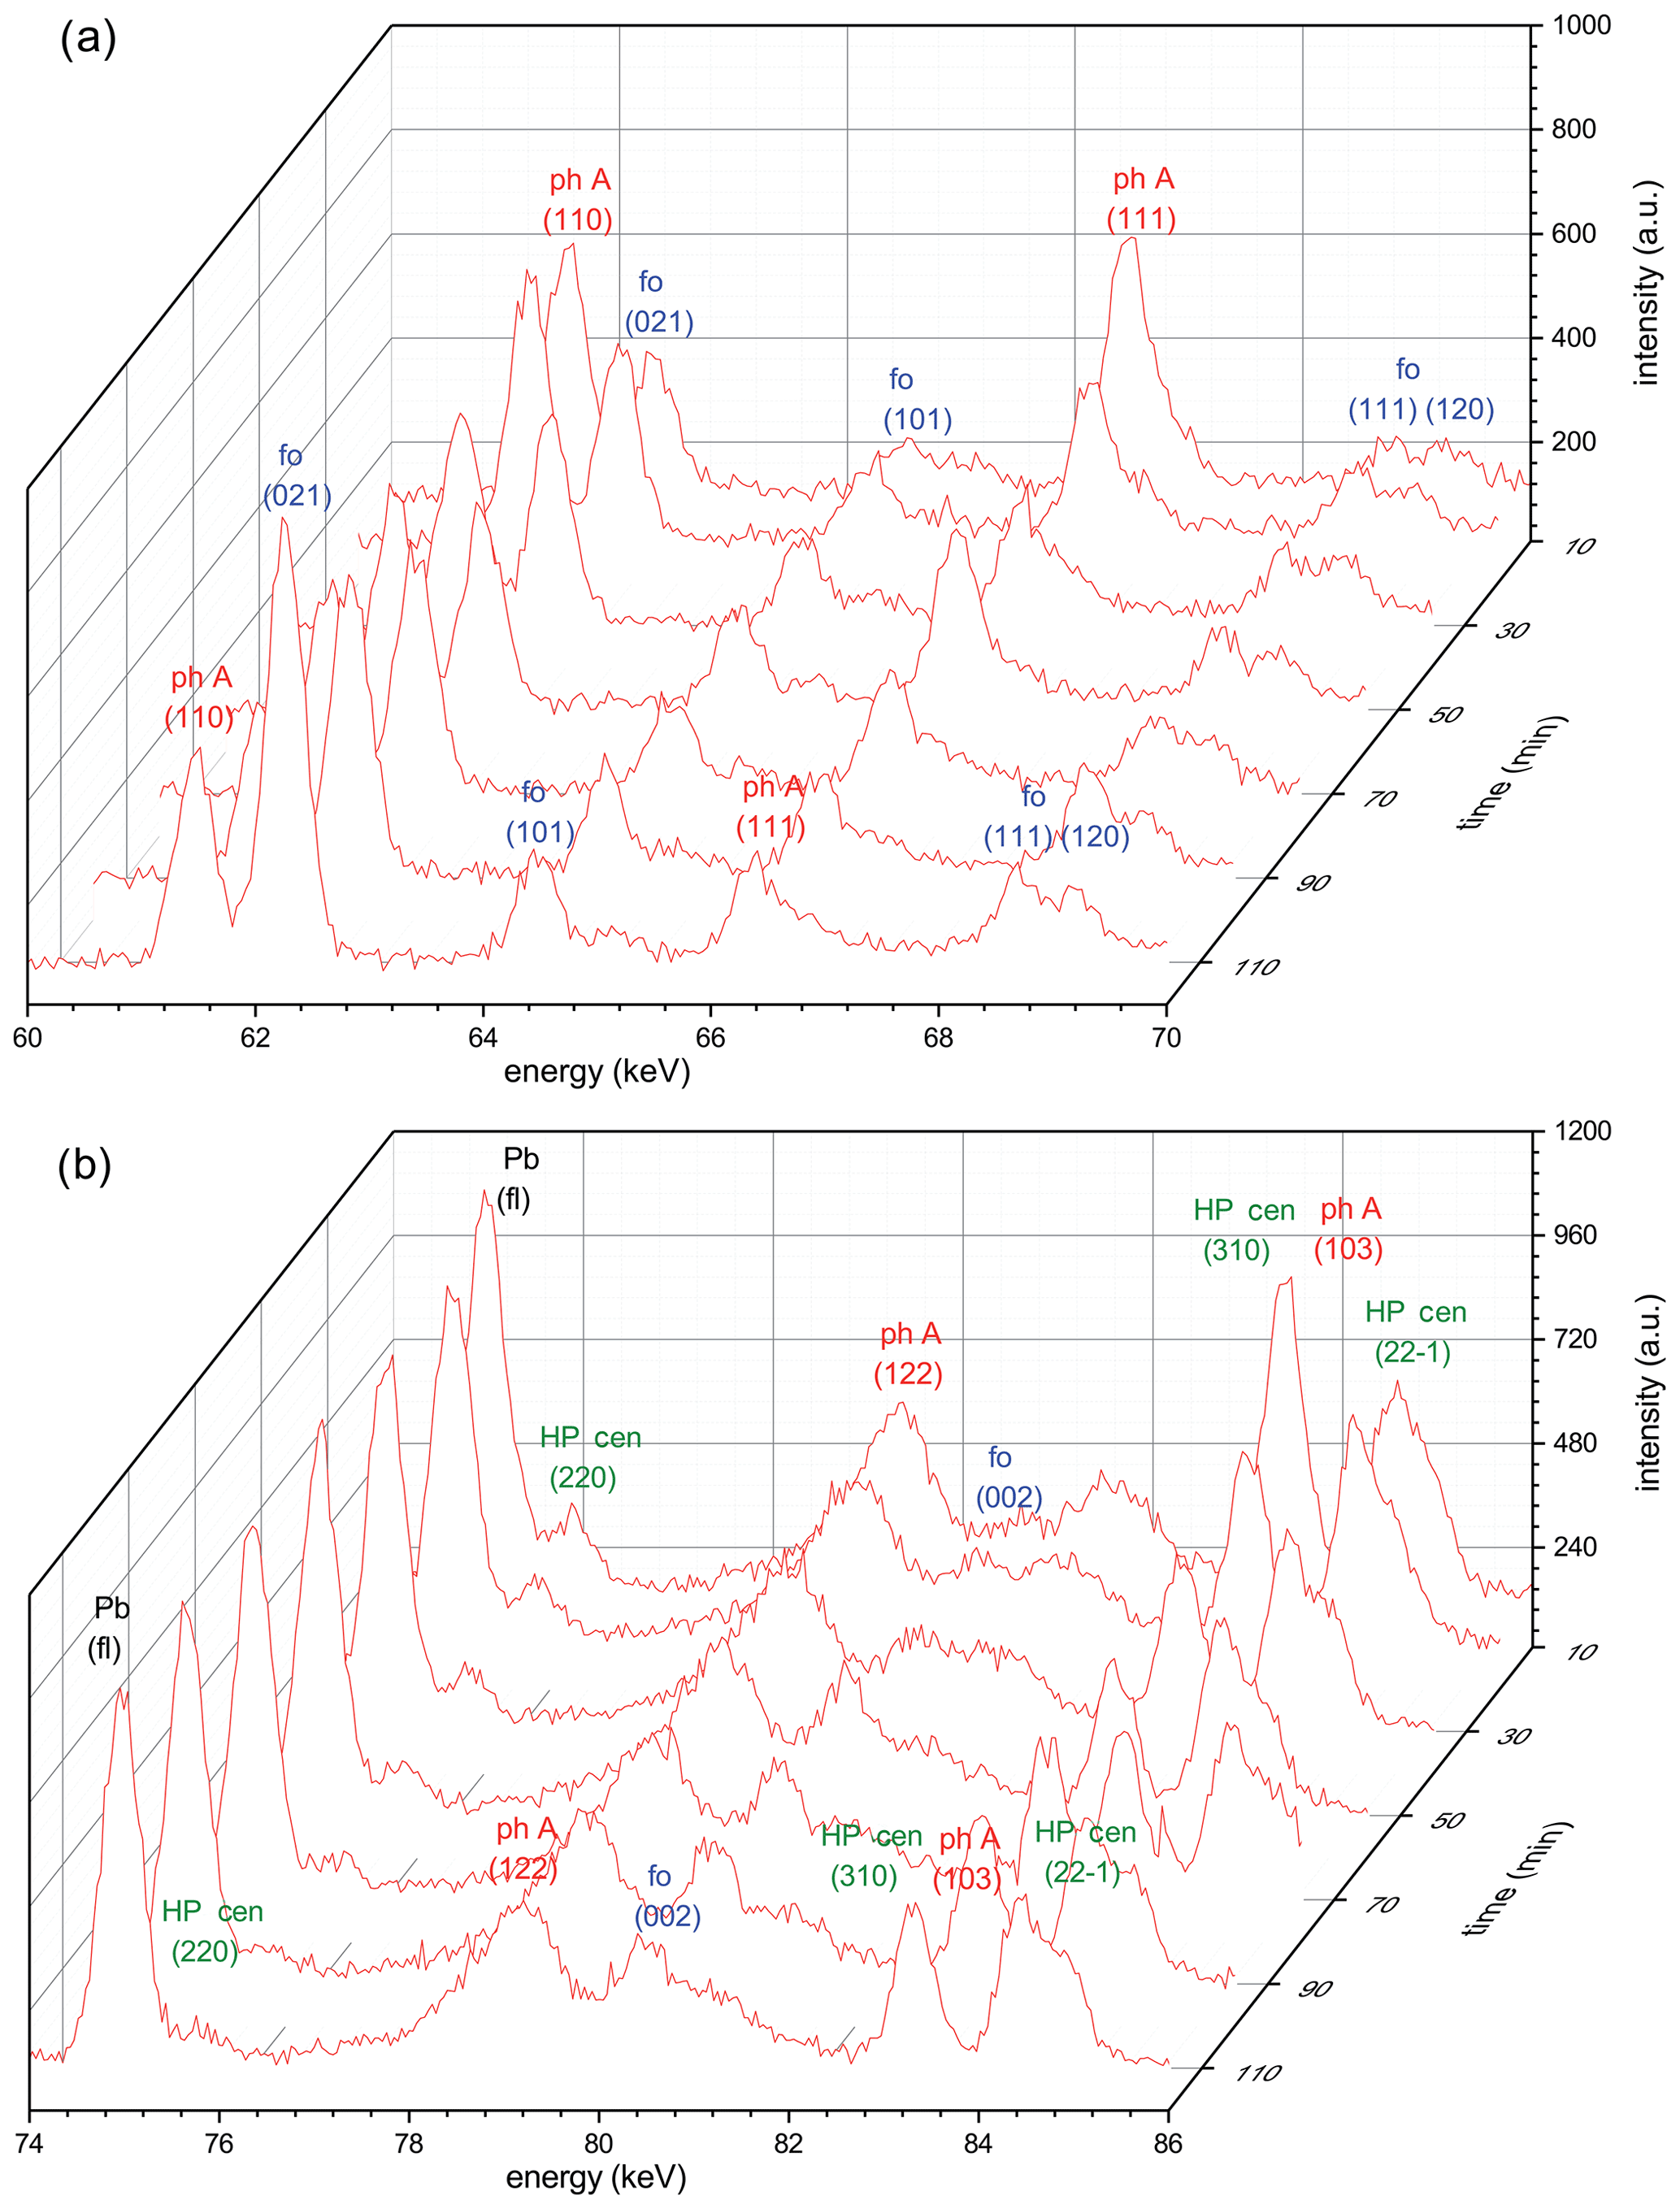
Figure 5(a) Reaction progress shown by time-dependent X-ray diagrams determined in the energy range 60–70 keV for run 456 (Table 1) in situ at 9.0 GPa (800 ∘C). In this energy range, no reflections of high P clinoenstatite are visible that do not overlap with those of other phases. (b) Time-dependent X-ray diagrams determined in the energy range 74–86 keV for run 456. In this energy range, non-overlapping reflections of high P clinoenstatite are visible. In both energy ranges, forsterite clearly grows, whereas phase A and high P clinoenstatite decompose; the reaction is not completed. Note: ph A – phase A; fo – forsterite; HP cen – high P clinoenstatite.

Figure 6Reaction progress in run 456 (Table 1) by exemplarily comparing the time-dependent intensity change in phase A (reflection 110), shown as black squares, and forsterite (reflection 021), shown as red circles. Time zero started at target P–T conditions; however, the first diffraction pattern was only completed after 10 min.
3.3 Grain size of run products
Cross section BSE images and EMP element maps of recovered experiments show that (i) during heating and annealing in the (phase A + high P clinoenstatite) stability field, grains of both these phases coarsened strongly, and that (ii) during annealing in the (forsterite + water) stability field, the newly formed forsterite shows an extreme small grain size from partial dehydration of the assemblage phase A + high P clinoenstatite. Process (i) is documented in Fig. S4, which shows a Si mapping of run 383 (Table 1), with clear growth and grain size coarsening of phase A and clinoenstatite after heating and short annealing (40 min) at temperatures below about 450 ∘C. The grain size of both phases is up to 200 µm. Process (ii) is documented in a BSE image (Fig. 7) and in a Si mapping (Fig. S5), both from the product phases of run 385 (Table 1), with clear growth of nano-sized forsterite. The grain size of phase A and clinoenstatite are up to 60 µm, respectively, and are larger compared to the starting material (< 20 µm) but smaller than those observed in run 383, which was performed solely in the (phase A + high P clinoenstatite) stability field.

Figure 7BSE image of a part of the cross section of product of run 385 (Table 1). The dark grey colour represents phase A; the light grey is cen (now quenched to LP cen), and the nano-sized light grey phase is newly formed forsterite.
4.1 Reversed experiments
Our new experiments on the reaction phase A + high P clinoenstatite = forsterite + water contradict the results of Luth (1995) and Komabayashi et al. (2005a) but confirm the data presented by Wunder (1998). What are the reasons for these discrepancies?
The water contents, though added in different forms, were given in excess in all three studies; however, the solid starting materials were quite different. Luth (1995) performed syntheses experiments in the MSH system using a multi-anvil press with oxides and hydroxides as starting materials, mixed in the proportions of the reaction, and the solid product phases were analysed after quenching. It is worth noticing that these additional experiments in chemical more complex systems did not yield any significant incorporation of Al and Ca in phase A. Komabayashi et al. (2005a) used (MSH) antigorite (with traces of talc), synthesised after the method described by Wunder et al. (1997), as the starting material for their multi-anvil press experiments at a synchrotron source. In their title, Komabayashi et al. (2005a) claimed to have performed “in situ X-ray pressure observations”, but indeed only one of their eight MSH experiments was performed in situ, and the others were conventional quench experiments with room temperature characterisation of the solid product phases. They used Ag capsules, which, however, produced a high X-ray absorbance and, thus, intensities that were too low to document the in situ reaction progress in most of their experiments. Wunder (1998) synthesised forsterite, low P clinoenstatite, and phase A as single phases in the MSH system, mixed them in the proportions of the reaction and performed water-saturated experiments in piston cylinder and multi-anvil presses. The progress of reaction was determined from the quenched solid product phases.
The obvious difference in these studies is the kind of starting material used. In our new study, and in Wunder (1998), the relevant phases of the reaction (phase A, clinoenstatite, forsterite, water) were already present as fine-grained crystals and were homogenously distributed in the capsule just from the beginning of the runs; thus, no nucleation or reaction problems occurred. Investigating silicate equilibria with oxides/hydroxides as starting material (Luth, 1995) can lead to overstepping the reaction temperature, which is not the case for reversed experiments, as performed in this study or in Wunder (1998). The situation is also not improved when using antigorite as starting material (Komabayashi et al., 2005a) for the equilibrium Reaction (R1). Possibly, there could be any of the many breakdown reactions of antigorite also with metastable precursor phases before forsterite is finally formed. Thus, in our opinion, both studies overstepped the reaction temperatures, resulting in erroneously pretended equilibrium curves at temperatures that were too high.
Due to the strong evolved compressibility of water, the investigated reaction must be curved. However, in analogy to the former experimental studies, we show here a simplified linear adjustment to our experimental results, which is approximated by the equation T [∘C] = 42 P [GPa] + 366 (R2= 0.99). Within the MSH system, the equilibrium phase A + high P clinoenstatite = forsterite + water determined here crosses the high P/low P clinoenstatite reaction (after Angel and Hugh-Jones, 1994) at about 675 ∘C (7.4 GPa) and forms the invariant point I1 (Fig. 8). In case the slope of the resulting equilibrium phase A + low P clinoenstatite = forsterite + water is unchanged, this reaction will cut the upper P limit of antigorite (after Bromiley and Pawley, 2003) in I2 at about 4.5 GPa (555 ∘C). However, at I1 the slope of the phase A + low P clinoenstatite, dehydration might slightly steepen to an unknown degree (grey field in Fig. 8), and thus, I2 will be shifted to lower pressure and higher temperatures. The experimental results of Luth (1995) and Komabayashi et al. (2005a) on the P and T position of Reaction (R1), even determined at higher T than in our study, did not show any discontinuity at the HP cen/LP cen transition, which might indicate that no or only a small change in slope emerges.
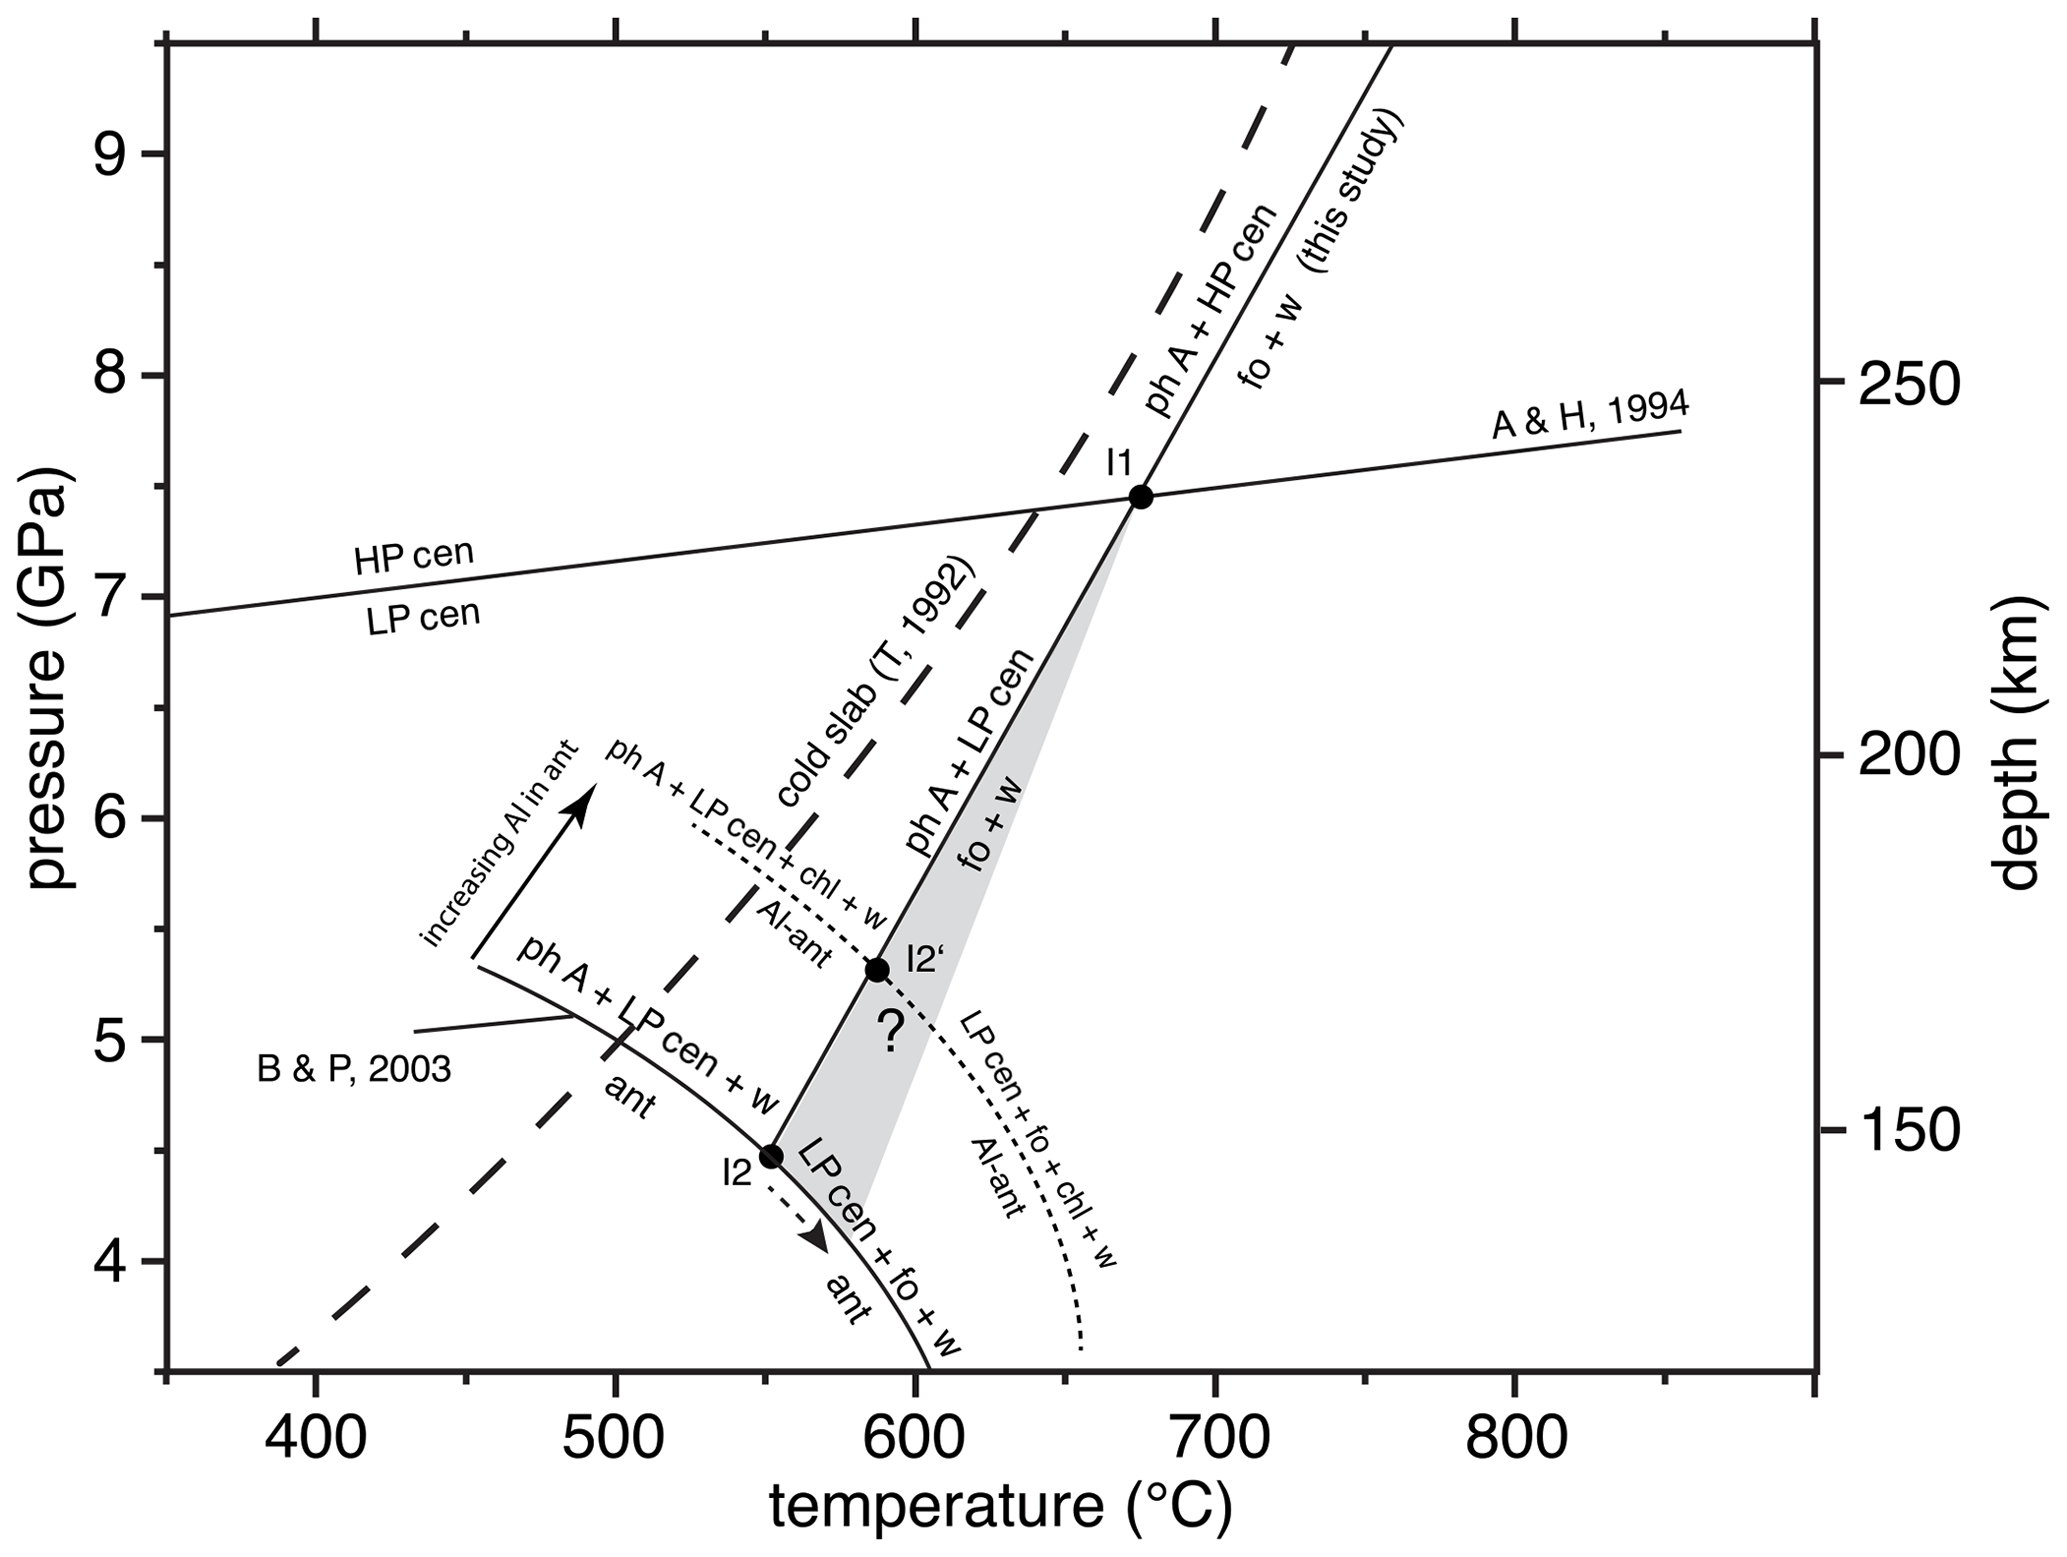
Figure 8P and T depth diagram showing the upper P stability of antigorite (ant) in the MSH system and that of Al-bearing antigorite (Al antigorite, containing about 3 wt % Al2O3), after Bromiley and Pawley (2003; B & P, 2003), the low P/high P clinoenstatite transition after Angel and Hugh-Jones (1994; A & H, 1994), and the position of the reaction phase A + high P clinoenstatite = forsterite + water, as determined in this study. At the invariant point I1, the slope of the phase A + low P clinoenstatite dehydration might slightly change to an unknown degree (grey field); thus, the invariant points at which antigorite (I2) or the Al antigorite stabilities (I2′) are crossed would both be shifted to lower P and higher T. The path of a cold subducting slab is shown after Thompson (1992; T, 1992). See the text for further explanations. Note: chl – chlorite; for others, see Table 1.
P–T conditions of MSH reactions are often strongly changed in more chemically complex systems. For example, if antigorite contains some Al2O3, then the antigorite stability in the (MASH, where MSH has Al2O3 added) system is shifted significantly to higher pressures and temperatures, and its breakdown assemblage includes the additional phase chlorite (Fig. 8). In the case of phase A, forsterite and low P clinoenstatite do not contain any significant amounts of Al, and the phase A + low P clinoenstatite = forsterite + water reaction is degenerated in the (MASH) system and crosses the Al antigorite stability at I2′ at about 590 ∘C and 5.4 GPa. With higher pressure, not shown in Fig. 8, the assemblage phase A + low P clinoenstatite + chlorite will become unstable due to reactions under the participation of pyrope (Bromiley and Pawley, 2003).
It is obvious that the assemblage phase A + clinoenstatite (+ chlorite) will only transport water into deeper levels of the mantle in the case of cold slabs (Fig. 8). At slightly warmer gradients, phase A + high P/low P clinoenstatite breakdown to forsterite + water might induce geochemical and geophysical processes, including the formation of low-velocity zones within the overlying mantle wedge from the huge amounts of fluid liberated by this water line reaction, as suggested by Liu (1987). However, in normal or hot subducted slabs, the temperatures are so high that this reaction will occur.
4.2 Kinetic experiments
The considerable growth in size of ph A and Cen during the annealing – at least as observed in runs 383 and 385 (Figs. S4, S5, and 7) – leads to a shielding effect. As shown in Figs. S4 and S5, in some spots we can observe, ph A plus HP cen were not in contact to each other anymore and could not react to forsterite. Thus, both relict phases, ph A, and HP cen are and stay visible in the diffraction pattern, even when forsterite is growing. Therefore, the kinetic data cannot be used to quantitatively analyse the kinetic behaviour. But we can interpret the experiments semi-quantitatively and use them to confirm our findings with respect to the phase stability fields.
Starting from a fine-grained (< 20 µm), homogenous, forsterite-free mixture of phase A and low P clinoenstatite, rapid formation of forsterite is obvious within the first 10–20 min in run 456 performed at 800 ∘C (9.0 GPa; Fig. 6). After this initial burst of forsterite nucleation (due perhaps to stress relaxation releasing some stored strain energy), the reaction slowed down and progressed fairly linearly, with a time at constant P and T. As indicated from our optical and EMP investigations, the first nucleated forsterite, which formed from the fine-grained starting material without any significant nucleation problems, was nano-sized and did not coarse during longer-run durations. On the contrary, we observe that both phase A and clinoenstatite performed strong grain-coarsening and may become separated from each other. Thus, even after a 120 min run duration, relict phase A and HP cen are still present. We observe for run 503 that, even though it was performed at a higher temperature (830 ∘C) and lasted longer (195 min) than run 456 (800 ∘C, 120 min), the reaction progressed much slower (see Table 1; Fig. S6). This can be explained by the different distance of these two runs in the P–T space to the equilibrium of the reaction phase A + high P clinoenstatite = forsterite + water, which is closer for run 503 than for run 456 (Fig. 3). Thus, this observation is a further indication for the accuracy of the here determined equilibrium. The different reaction progress in runs 456 versus 503 may also be a result of the unusual path taken in experiment 503 (beam dump and lowering of the temperature to 200 ∘C for 2 h; see Table 1). Due to these uncertainties, the kinetic evolution of run 503 is not further considered in the discussion.
The relevance for the existence of DHMSs depends on the constant transport of water into the mantle to depth levels at which they can form. In the case of cold subducting slabs, the assemblage of phase A and clinoenstatite might be transported to deeper parts of the mantle until, according to Burnley and Navrotsky (1996), at a depth below about 300 km where the DHMS phase B might be formed at water-saturated conditions. In a forth-going subduction, this phase might than be transformed into super-hydrous phase B (shy B) at depths below about 450 km; shy B might react to phase D at even deeper mantle P–T conditions (Frost and Fei, 1998). Thus, after serpentine dehydration, the assemblage phase A + clinoenstatite might act as a bridge, to bring water into depth levels of the mantle at which formation of further DHMSs becomes possible. Simplified, the water transport bridge for the subduction of cold (old) oceanic lithosphere might be described as follows: antigorite → phase A → phase B → shy B → phase D. Here only the processes in the simple MSH system are described, and of course, nature is chemically much more complex. For example, Al incorporation is known to increase the P–T stabilities of the discussed phases (e.g. Bromiley and Pawley, 2003), whereas Fe incorporation will decrease their P–T stabilities (e.g. Merkulova et al., 2016); thus, in nature, the depths of the bridge processes might significantly change or even be interrupted due to the formation of further phases, avoiding the formation of other DHMSs at deeper mantle regions.
The rationale for the cause of intermediate depth earthquakes in subducting slabs is the subject of a long-lasting discussion. Among the rationales is the formation of mechanical instabilities triggering seismicity in the down-going subducting slab by rapidly proceeding reactions that produce huge amounts of water (e.g. Chollet et al., 2011) or by the formation of extremely fine-grained material formed during dehydration reactions (Ferrand et al., 2017). From our kinetic study, we determined that the dehydration of the assemblage phase A + clinoenstatite is extremely sluggish, which would contradict the concept of earthquake initiation by fast dehydration reactions. However, the observed formation of nano-sized forsterite as dehydration products still may indicate the potential of this reaction to cause seismicity. Recent experimental observations (Koch-Müller et al., 2021) have shown that the grain size of phases formed in hydration reactions are significantly larger than those from dehydration reactions; perhaps this indicates a general rule, as we exactly made the same observation in this study.
All data derived from this research are presented in the enclosed tables, figures, and in the Supplement.
The supplement related to this article is available online at: https://doi.org/10.5194/ejm-34-201-2022-supplement.
CL performed and analysed the experiments. MKM and BW had the initial idea for the project and prepared the paper, with the contribution of all co-authors. OA did the electron microprobe measurements and analyses. SB and RF supported us during the experiments in Hamburg.
At least one of the (co-)authors is a member of the editorial board of European Journal of Mineralogy. The peer-review process was guided by an independent editor, and the authors also have no other competing interests to declare.
Publisher’s note: Copernicus Publications remains neutral with regard to jurisdictional claims in published maps and institutional affiliations.
The authors are extremely thankful to Andreas Ebert, for his support during the multi-anvil experiments in Potsdam and in Hamburg. The authors also thank Hans-Peter Nabein, for his technical help. The paper was improved the by comments and suggestions of the two anonymous referees. We acknowledge DESY (Hamburg, Germany), a member of the Helmholtz Association HGF, for the provision of experimental facilities. The authors also acknowledge the scientific exchange and support of the Centre for Molecular Water Science (CMWS).
Parts of this research were carried out at beamline P61B (proposal no. I-20200020), with support from the Federal Ministry of Education and Research, Germany (BMBF; grant nos. 05K16WC2 and 05K13WC2), and the funding programme of Open Access Publikationskosten, Deutsche Forschungsgemeinschaft (DFG, German Research Foundation; grant no. 491075472).
The article processing charges for this open-access publication were covered by the Helmholtz Centre Potsdam – GFZ German Research Centre for Geosciences.
This paper was edited by Stefano Poli and reviewed by two anonymous referees.
Anderson, O. and Bowen, N.L.: Das binäre System Magnesiumoxyd-Silicium-2-oxyd, Z. Anorg. Chem., 87, 283–299, 1914.
Angel, R. J. and Hugh-Jones, D. A.: Equations of state and thermodynamic properties of enstatite pyroxenes, J. Geophys. Res., 99, 19777-19783, https://doi.org/10.1029/94JB01750, 1994.
Angel, R. J., Frost, D. J., Ross, N. L., and Hemley, R.: Stabilities and equations of state of dense hydrous magnesium silicates, Phys. Earth Planet. In., 127, 181–196, https://doi.org/10.1016/S0031-9201(01)00227-8, 2001.
Armstrong, J. T.: CITZAF: A package of correction programs for the quantitative electron microbeam X-ray analysis of thick polished materials, thin films, and particles, Microb. Anal., 4, 177–200, 1995.
Bromiley, G. D. and Bromiley, F. A.: High-pressure phase transitions and hydrogen incorporation into MgSiO3 enstatite, Am. Mineral., 91, 1094–1101, https://doi.org/10.2138/am.2006.2020, 2006.
Bromiley, G. D. and Pawley, A. R.: The stability of antigorite in the systems MgO-SiO2-H2O (MSH) and MgO-Al2O3-SiO2-H2O (MASH): The effects of Al3+ substitution on high-pressure stability, Am. Mineral., 88, 99–108, https://doi.org/10.2138/am-2003-0113, 2003.
Burnley, P. C. and Navrotsky, A.: Synthesis of high-pressure hydrous magnesium silicates: observation and analysis, Am. Mineral., 81, 317–326, https://doi.org/10.2138/am-1996-3-405, 1996.
Chinnery, N. J., Pawley, A. R., and Clark, S. M.: In situ observation of the formation of 10 Å phase from talc + H2O at mantle pressures and temperatures, Science, 286, 940–942, https://doi.org/10.1126/science.286.5441.940, 1999.
Chollet, M., Daniel, I., Koga, K. T., Morard, G., and van de Moortèle, B.: Kinetics and mechanism of antigorite dehydration: Implications for subduction zone seismicity, J. Geophys. Res., 116, B04203, https://doi.org/10.1029/2010JB007739, 2011.
Cynn, H., Hofmeister, A. M., Burnley, P. C., and Navrotsky, A.: Thermodynamic properties and hydrogen speciation from vibrational spectra of dense hydrous magnesium silicates, Phys. Chem. Miner., 23, 361–376, https://doi.org/10.1007/BF00199502, 1996.
Ferrand, T. P., Hilairet, N., Incel, S., Deldicque, D., Labrousse, L., Gasc, J., Renner, J., Wang, Y., Green II, H. W., and Schubnel, A.: Dehydration-driven stress transfer triggers intermediate-depth earthquakes, Nat. Commun., 8, 15247, https://doi.org/10.1038/ncomms15247, 2017.
Frost, D. J. and Fei, Y.: Stability of phase D at high pressure and high temperature, J. Geophys. Res., 103, 7463–7474, https://doi.org/10.1029/98JB00077, 1998.
Gardés, E., Wunder, B., Marquardt, K., and Heinrich, W.: The effect of water on intergranular mass transport: new insights from diffusion-controlled reaction rims in the MgO-SiO2 system, Contrib. Mineral. Petrol., 164, 1–16, https://doi.org/10.1007/s00410-012-0721-0, 2012.
Getting, I. C. and Kennedy, G. C.: Effect of pressure on the emf of chromel-alumel and platinum-platinum 10 % rhodium thermocouples, J. Appl. Phys., 41, 4552, https://doi.org/10.1063/1.1658495, 1970.
Hacker, B., Abers, G., and Peacock, S.: Subduction factory 1. Theoretical mineralogy, densities and seismic wave speeds, and H2O contents, J. Geophys. Res., 108, 2029, https://doi.org/10.1029/2001JB001127, 2003.
Hamilton, D. L. and Henderson, C. M. B.: The preparation of silicate compositions by a gelling method, Mineral. Mag., 36, 832–838, https://doi.org/10.1180/minmag.1968.036.282.11, 1968.
Khisina, N. R. and Wirth, R.: Nanoinclusions of high-pressure hydrous silicates, Mg3Si4O10(OH)2 ⋅ nH2O (10 Å phase), on mantle olivine: Mechanisms of formation and transformation, Geochem. Int.+, 46, 319–327, https://doi.org/10.1134/S0016702908040010, 2008.
Koch-Müller, M., Rhede, D., Schulz, R., and Wirth, R.: Breakdown of hydrous ringwoodite to pyroxene and spinelloid at high P and T and oxidizing conditions, Phys. Chem. Miner., 36, 329–341, https://doi.org/10.1007/s00269-008-0281-z, 2009.
Koch-Müller, M., Appelt, O., Wunder, B., and Wirth, R.: New insights in the mechanisms of the reaction 3.65 Å phase = clinoenstatite + water down to nanoscales, Eur. J. Mineral., 33, 675–686, https://doi.org/10.5194/ejm-33-675-2021, 2021.
Komabayashi, T., Hirose, K., Funakoshi, K., and Takafuji, N.: Stability of phase A in antigorite (serpentine) composition determined by in situ X-ray pressure observations, Phys. Earth Planet. In., 151, 276–289, https://doi.org/10.1016/j.pepi.2005.04.002, 2005a.
Komabayashi, T., Omori, S., and Maruyama S.: Experimental and theoretical study of stability of dense hydrous magnesium silicate in the deep upper mantle, Phys. Earth Planet. In., 153, 191–209, https://doi.org/10.1016/j.pepi.2005.07.001, 2005b.
Larson, A. C. and Von Dreele, R. B.: Generalized structure analysis system, Los Alamos National Laboratory Report LAUR 86-748, 1987.
Lauterjung, J. and Will, G.: A fully automatic peak-search program for the evaluation of Gauss-shaped diffraction patterns, Nucl. Instrum. Methods, A239, 281–287, https://doi.org/10.1016/0168-9002(85)90727-2, 1985.
Li, X., Speziale, S., Glazyrin, K., Wilke, F. D. H., Liermann, H.-P., and Koch-Müller, M.: Synthesis, structure, and single-crystal elasticity of Al-bearing superhydrous phase B, Am. Mineral., 107, https://doi.org/10.2138/am-2022-7989, in press, 2022.
Liu, L. G.: Effects of H2O on the phase behavior of the forsterite-enstatite system at high pressures and temperatures and implications for the Earth, Phys. Earth Planet. Inter., 49, 142–167, https://doi.org/10.1016/0031-9201(87)90138-5, 1987.
Liu, L. G., Lin, C. C., Mernagh, T. P., and Irfune, T.: Raman spectra of phase A at various pressures and temperatures, J. Phys. Chem. Solids, 58, 2023–2030, 1997.
Luth, R. W.: Is phase A relevant to the Earth's mantle?, Geochim. Cosmochim. Ac., 59, 679–682, https://doi.org/10.1016/0016-7037(95)00319-U, 1995.
Matveev, S., O'Neill, H. S. C., Ballhaus, C., Taylor, W. R., and Green, D. H.: Effect of silica activity on OH- IR spectra of olivine: Implications for low-aSiO2 mantle metasomatism, J. Petrol., 42, 721–729, https://doi.org/10.1093/petrology/42.4.721, 2001.
Merkulova, M., Muñoz, M., Vidal, O., and Brunet, O.: Role of iron content on serpentine dehydration depth in subduction zones: Experiments and thermodynamic modelling, Lithos, 264, 441–452, https://doi.org/10.1016/j.lithos.2016.09.007, 2016.
Milke, R., Kolzer, K., Koch-Müller, M., and Wunder, B.: Orthopyroxene rim growth between olivine and quartz at low temperatures (750–950 ∘C) and low water concentration, Min. Petrol., 97, 223–232, https://doi.org/10.1007/s00710-009-0093-y, 2009.
Müller, J., Koch-Müller, M., Rhede, D., Wilke, F. D. H., and Wirth, R.: Melting relations in the system CaCO3-MgCO3 at 6 GPa, Am. Mineral., 102, 2440–2449, https://doi.org/10.2138/am-2017-5831, 2017.
Ohtani, E., Mizobata, H., and Yurimoto, H.: Stability of dense hydrous magnesium silicate phases in the system Mg2SiO4-H2O and MgSiO3-H2O at pressures up to 27 GPa, Phys. Chem. Miner., 27, 533–544, https://doi.org/10.1007/s002690000097, 2000.
Scambelluri, M., Müntener, O., Ottolini, L., Pettke, T. T., and Vannucci, R.: The fate of B, Cl and Li in the subducted oceanic mantle and in the antigorite breakdown fluids, Earth Planet. Sc. Lett., 222, 217–234, https://doi.org/10.1016/j.epsl.2004.02.012, 2004.
Shirey, S. B., Wagner, L. S., Walter, M. J., Pearson, D. G., and van Keken, P. E.: Slab transport of fluids to deep focus earthquake depths – thermal modelling constraints and evidence from diamonds, AGU Advances, 2, e2020AV000304, https://doi.org/10.1029/2020AV000304, 2021.
Thompson, A. B.: Water in the Earth's upper mantle, Nature, 358, 295–302, https://doi.org/10.1038/358295a0, 1992.
Toby, B. H.: EXPGUI, a graphical user interface for GSAS, J. Appl. Crystallogr., 34, 210–213, 2001.
Ulmer, P. and Stalder R.: The Mg(Fe)SiO3, orthoenstatite-clinoenstatite transitions at high pressures and temperatures determined by Raman spectroscopy on quenched samples, Am. Mineral., 86, 1267–1274, https://doi.org/10.2138/am-2001-1014, 2001.
Wunder, B.: Equilibrium experiments in the system MgO-SiO2-H2O (MSH): Stability fields of clinohumite-OH [Mg9Si4O16(OH)2], chondrodite-OH [Mg5Si2O8(OH)2] and phase A (Mg7Si2O8(OH)6), Contrib. Mineral. Petrol., 132, 111–120, https://doi.org/10.1007/s004100050410, 1998.
Wunder, B., Baronnett, A., and Schreyer, W.: Ab-initio synthesis and TEM confirmation of antigorite in the system MgO-SiO2-H2O, Am. Mineral., 82, 760–764, https://doi.org/10.2138/am-1997-7-814, 1997.
Xie, L., Chanyshev, A., Ishii, T., Bondar, D., Nishida, K., Chen, Z., Bhat, S., Farla, R., Higo, Y., Tange, Y., Su, X., Yan, B., Ma, S., and Katsura, T.: Simultaneous generation of ultrahigh pressure and temperature to 50 GPa and 3300 K in multi-anvil apparatus, Rev. Sci. Instrum., 92, 103902, https://doi.org/10.1063/5.0059279, 2021.
Zhan, Z.: Mechanisms and implications of deep earthquakes, Annu. Rev. Earth Planet. Sci., 48, 147–174, https://doi.org/10.1146/annurev-earth-053018-060314, 2020.