the Creative Commons Attribution 4.0 License.
the Creative Commons Attribution 4.0 License.
 | 23 Mar 2026
Mackinawite transformation into greigite at room temperature under anoxic and acidic conditions: a corrosion pathway?
Pierre Le Pape
Benoît Baptiste
Guillaume Radtke
Delphine Cabaret
Julie Aufort
Jessica Brest
Camille Baya
Erik Elkaim
Georges Ona-Nguema
Farid Juillot
Guillaume Morin
In surface soils and sediments, iron monosulfide (FeS) species, including nanocrystalline mackinawite, tend to quickly form in the presence of iron and sulfide in anoxic conditions. As such, FeS species are the main precursors for the formation of other iron sulfides such as Fe3S4 greigite and FeS2 pyrite, which are ubiquitous in surface sedimentary environments. It is known that, under prolonged aging under reducing conditions in a sulfidic aqueous medium, FeS species can evolve into crystalline mackinawite. However, the possible influence of pH on the evolution of mackinawite under such anoxic low-temperature conditions relevant to sedimentary (sub)surface environments has not been investigated yet. In this study, we used Rietveld refinement and pair distribution function analysis (PDF) of synchrotron-based X-ray powder diffraction (XRD) patterns to derive the mean coherent domain (MCD) size of mackinawite after aging under various pH conditions and X-ray absorption near-edge structure (XANES) spectroscopy at the S and Fe K-edges to study the structural and electronic properties. Moreover, in order to strengthen our interpretations, we confirmed the shape and relative energy of pre-edge features in the S K-edge XANES spectra of mackinawite (FeS) and pyrite (FeS2) model compounds via first-principle calculations. Our results show that, after FeS has precipitated from aqueous Fe(II) and in a saline medium at pH 7.1, aqueous aging at the same pH over 47 d results in the formation of nanocrystalline mackinawite (MCD nm; MCD nm). When Na2S is added into the solution to reach pH 9.7 after FeS has precipitated at pH 7.1, no other Fe sulfide is observed during the aging phase, and mackinawite particles are of smaller size (MCD nm; MCD nm). In this sample, an additional weak and broad peak appears at d=10.5 Å that could be interpreted as being due to either lattice expansion at the particle boundaries or a double-cell super-structure. When H+ is added as HCl to reach pH 5.1 before the aging phase, the size of mackinawite particles increases (MCD nm; MCD nm), and a fraction transforms into greigite (Fe3S4). This reaction is accompanied by a pH increase to 6.4, likely because of H+ consumption, which suggests that Fe(II) in FeS would serve as an electron donor and that H+ would serve as an electron acceptor. The calculated electronic structure of mackinawite shows partly filled Fe-3d states, which supports the fact that acidic aging conditions are favorable for Fe(II) to act as an electron donor. We propose and further discuss the fact that the formation of greigite from nanocrystalline mackinawite could result in H2 production as, for instance, observed for anoxic corrosion of zero-valent Fe at higher temperatures. Greigite has been designated in the literature either as an intermediate towards pyrite formation or as a mineralogical endmember in another reaction route. Our observations raise the question of the existence of such a reaction producing Fe3S4 and H2 in reducing sedimentary (micro)environments across geological times. In addition, the metallic character of mackinawite suggests that Fe(II) oxidation to Fe(III) by H+ in this mineral species could proceed without the need for another oxidizing agent. Although the possible formation of pyrite from greigite would require further studies on extended aging time and/or under more acid-sulfidic conditions, our findings could have implications for the understanding of the initial steps of the H2S pathway to pyrite.
- Article
(1851 KB) - Full-text XML
-
Supplement
(1232 KB) - BibTeX
- EndNote


Iron sulfides are ubiquitous minerals of sedimentary environments, precipitating under reducing anoxic or suboxic conditions at the redox boundary in the water column or during early diagenesis of sediments in the presence of sulfide-producing bacteria (Berner, 1970, 1984; Cornwell and Morse, 1987; Wilkin and Barnes, 1997; Rickard and Luther, 1997; Schoonen, 2004; Rickard and Morse, 2005; Rickard and Luther, 2007). Among them, pyrite (FeS2); nano-crystalline mackinawite (FeSNano); and, less commonly, greigite (Fe3S4) are mostly observed as relic minerals of the biologically mediated maturation and burial of marine and, to a lesser extent, continental sediments (Cornwell and Morse, 1987; Roberts, 1995; Emmings et al., 2022). From a technological point of view, iron sulfide minerals find their importance as semiconductor materials (e.g., Cabán-Acevedo et al., 2014) or for catalytic applications, including as potential green catalysts that would contribute to greenhouse gas mitigation (Roldan and De Leeuw, 2016; Santos-Carballal et al., 2018; Dzade et al., 2015) or organic pollutant degradation (Cheng et al., 2020). From a fundamental-knowledge point of view, owing to their catalytic properties, iron sulfide minerals are considered to be important substrates for condensing inorganic species in prebiotic reactions (Schoonen et al., 2004; Rickard et al., 2001; Mielke et al., 2011). This has been theorized within the framework of the iron–sulfur world theory (Wächtershäuser, 1988, 2000).
Several research works consider that iron sulfides could preserve evidence of the original deposition environments. In particular, criteria such as their abundance, morphology, mineralogy, and crystal chemistry depend on the local conditions prevailing at the time of precipitation (microbiology, elemental or molecular concentrations, physico-chemical conditions). This type of paleo-environmental information is then used to better understand the history of Earth and/or the development of life (Pósfai et al., 1998; Koonin and Martin, 2005; Wacey et al., 2011; Picard et al., 2019; Mukherjee et al., 2019). However, linking environmental factors to morphological and structural properties of iron sulfides requires gaining mechanistic-level information about the formation pathways of these minerals in environmental settings. Thus, the diversity of the morphology, mineralogy, and crystal chemistry of iron sulfides explains why the research concerning their formation mechanisms, particularly that of pyrite, the thermodynamically most stable iron sulfide phase, has been so intense in the past (Rickard, 2012, and references therein) and is still currently active (Matamoros-Veloza et al., 2018a, b; Baya et al., 2021). Briefly, three main pathways are usually designated for diagenetic pyrite formation: the H2S pathway, the polysulfide pathway, and the ferric-hydroxide-surface pathway. All three strongly depend, at first, on the relative abundance of sulfide, iron(II), and iron(III) in the precipitation media (Benning et al., 2000; Rickard and Luther, 2007; Peiffer et al., 2015; Picard et al., 2018). Additionally, some authors have raised the question of greigite involvement as an intermediate in pyrite formation (Schoonen and Barnes, 1991), and others have unequivocally proven its occurrence in several laboratory pyrite syntheses experiments (Hunger and Benning, 2007; Lin et al., 2018). In the literature, a moderate temperature (>50 °C) is often used to boost reaction kinetics (e.g., Benning et al., 2000), but low-temperature data, i.e., below 30 °C, are scarce despite being more representative of early diagenesis in sediments. Another old and important question is that of the chemical and structural nature of the low-solubility iron-monosulfide (FeS)-type compounds precipitating under anoxic–suboxic conditions and that are involved in the early stages of all FeS systems (Rickard and Morse, 2005; Rickard and Luther, 2007; Matamoros-Veloza et al., 2018a, b; Baya et al. 2021). In this regard, past research has predominantly focused on submicrometric FeS compounds, referred to as “amorphous FeS”, “nano-crystalline FeS”, or “freshly precipitated FeS” (Wolthers et al., 2003; Ohfuji and Rickard, 2006; Jeong et al., 2008; Csákberényi-Malasics et al., 2012; Matamoros-Veloza et al., 2018a, b; Michel et al., 2005), as these forms are, indeed, the most probable mineralogical precursors of crystalline mackinawite, greigite, and/or pyrite formation. They are also proposed to be mobile species under anoxic conditions, for instance, in sedimentary pore networks, due to their colloidal size (Noël et al., 2020). Thus, while most of the pathways to pyrite formation were explored in the laboratory starting from polymeric FexSx to nano-crystalline forms of FeS (Rickard and Morse, 2005; Rickard and Luther, 2007), alternative pathways, involving, for instance, a pre-stage of mackinawite maturation under strongly reducing conditions, were less studied.
Crystalline mackinawite has a tetragonal structure (space group P4/nmm) and is formed by layers of corner-sharing FeS4 tetrahedra distributed along the ab plane presenting almost no distortions (Lennie et al., 1995). Layers are stacked along the c axis, linked by van der Waals interactions, and no vacancies or variations in atom occupancy are usually reported (Lennie et al., 1995; Michel et al., 2005). The unit cell parameters are Å and c=5.0328(7) Å, as determined by Rietveld refinement of synchrotron-based powder X-ray diffraction patterns (Lennie et al., 1995). Only small deviations from these values were reported from pair distribution function refinement in the study by Michel et al. (2005), focusing on both wet and dry FeS particles precipitated at different pH. Because of its layered structure, Wolthers et al. (2003) and Matamoros-Veloza et al. (2018b) suggested that mackinawite could incorporate molecules such as water or polysulfides, possibly inserted in between the tetrahedral sheets, thus increasing the c parameter. Oxidation of dry mackinawite by O2 produces a gradual sequence of alteration minerals, starting from Fe3S4 and reaching to S(0), Fe3O4, and Fe-oxyhydroxides (Boursiquot et al., 2001). Interestingly, Bourdoiseau et al. (2011) brought forward additional evidence for Fe(III) occurrence within the mackinawite structure in an anoxic acidic solution at 80 °C, as shown from the appearance of specific Raman vibration bands not attributable to mackinawite or greigite minerals. Thus, they proposed that this type of Fe(III)-bearing mackinawite could be a transient mineralogical form, further evolving into greigite upon aging. A more recent study showed that mackinawite could be oxidized into greigite under anoxic acidic conditions (Lin et al., 2018), which raises the question regarding the identity of the oxidant involved in this Fe(II) to Fe(III) oxidation. Therefore, detailed mineralogical investigations into the transformations undergone by mackinawite when subjected to pH variations are needed to document its evolution in anoxic sedimentary environments.
In this study, we have performed FeS maturation experiments in aqueous solution using Fe(II) and H2S under strictly anoxic conditions, with the aim of better understanding mackinawite mineralogical transformations upon aging under various physico-chemical conditions representative of pore waters during early diagenesis of sediments. Indeed, gaining mechanistic insights into iron sulfide transformations helps better understand the important steps of the biogeochemical cycling of Fe and S in surface anoxic environments. During these experiments, various amounts of H+ (from HCl) or H2S (from Na2S) were added to mimic the environmental changes in pH that are potentially occurring in microbially controlled local micro-environments in sediments. As low-temperature data are scarce in the literature, all of the experiments have been conducted at room temperature. Rietveld and pair distribution function (PDF) analyses of synchrotron-based X-ray diffraction (XRD) data, together with X-ray absorption near-edge structure (XANES) measurements at both the S and Fe K edges, were performed on the recovered solids. This approach allowed us to characterize the mineralogical properties of the synthetic crystalline mackinawite particles and to reveal a room-temperature FeS corrosion pathway to greigite with water as the sole possible electron acceptor, likely producing H2.
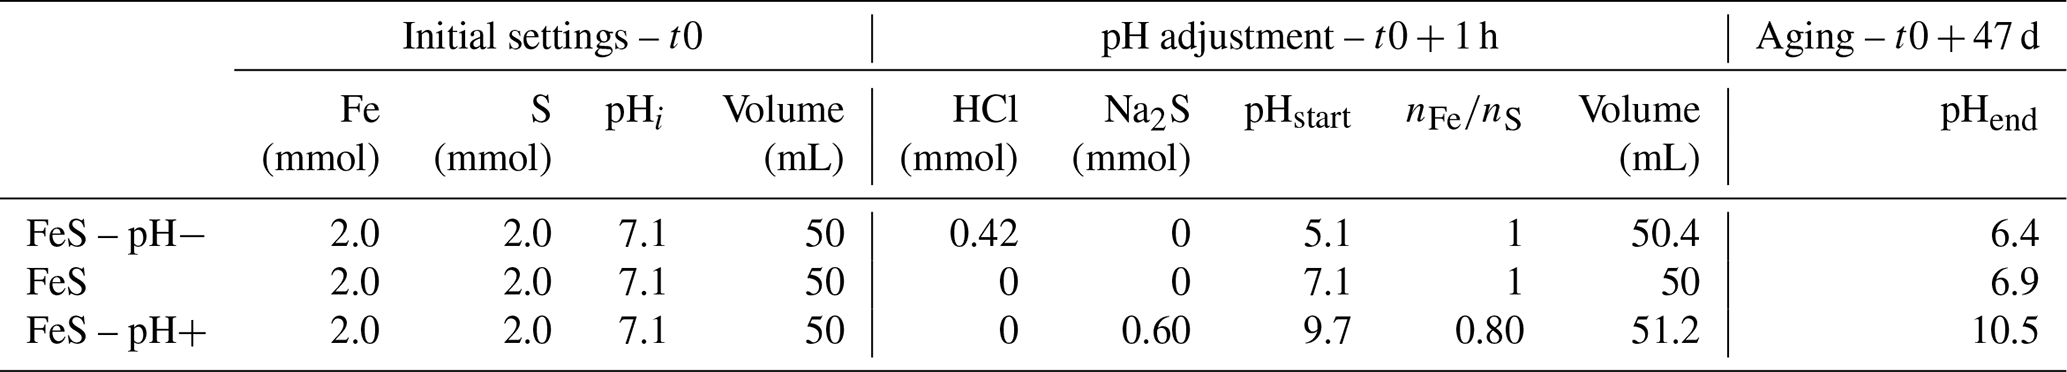
Table 1S and Fe theoretical molar ratio and pH measured for the three synthesis experiments performed in this study.
2.1 Synthesis experiments
The three solid samples studied were synthesized in aqueous media in glass vials in an anoxic N2-filled glove box, namely by mixing appropriate amounts of 0.5 M FeCl2⋅4H2O and 0.5 M Na2S⋅9H2O solutions, resulting in a 50 mL water solution (Table 1). In the three experiments, mixing of aqueous ferrous and sulfide ions resulted in the instantaneous precipitation of a black precipitate of iron sulfide with a pH spontaneously stabilizing at 7.1. For the control sample, named “FeS”, the initially precipitated solids were aged in the initial suspension with a 1.0 molar ratio (Table 1) for 47 d at pH 7.1 under vigorous stirring. For the “FeS–pH+” sample, the pH of the FeS suspension, initially precipitated and stabilized at pH 7.1, was increased to 9.7 by adding, dropwise, an anoxic Na2S.9H2O basic solution within 1 h after FeS precipitation. The resulting suspension with a 0.8 molar ratio (Table 1) was then vigorously stirred over 47 d. For the “FeS–pH−” sample, the pH of the FeS suspension, initially precipitated and stabilized at pH 7.1, was decreased from 7.1 to 5.1 by adding, dropwise, an anoxic 1 M HCl solution within 1 h after FeS precipitation. The resulting suspension with a 1.0 molar ratio (Table 1) was then vigorously stirred over 47 d. A visual description of the main steps of these experiments is shown in Fig. 1. After 47 d of suspension aging, the solids were recovered by centrifugation at 6000 rpm over 15 min within the glove box and washed with ultrapure water before being, once again, centrifuged at 6000 rpm for 15 min. Washed samples were finally dried under vacuum within the glove box and kept dry in closed glass vials under an anoxic atmosphere until mineralogical and spectroscopic analyses. All three samples were recovered in approximately the same amounts (around 150 mg) and dried over the same period of time in similar glass vials.
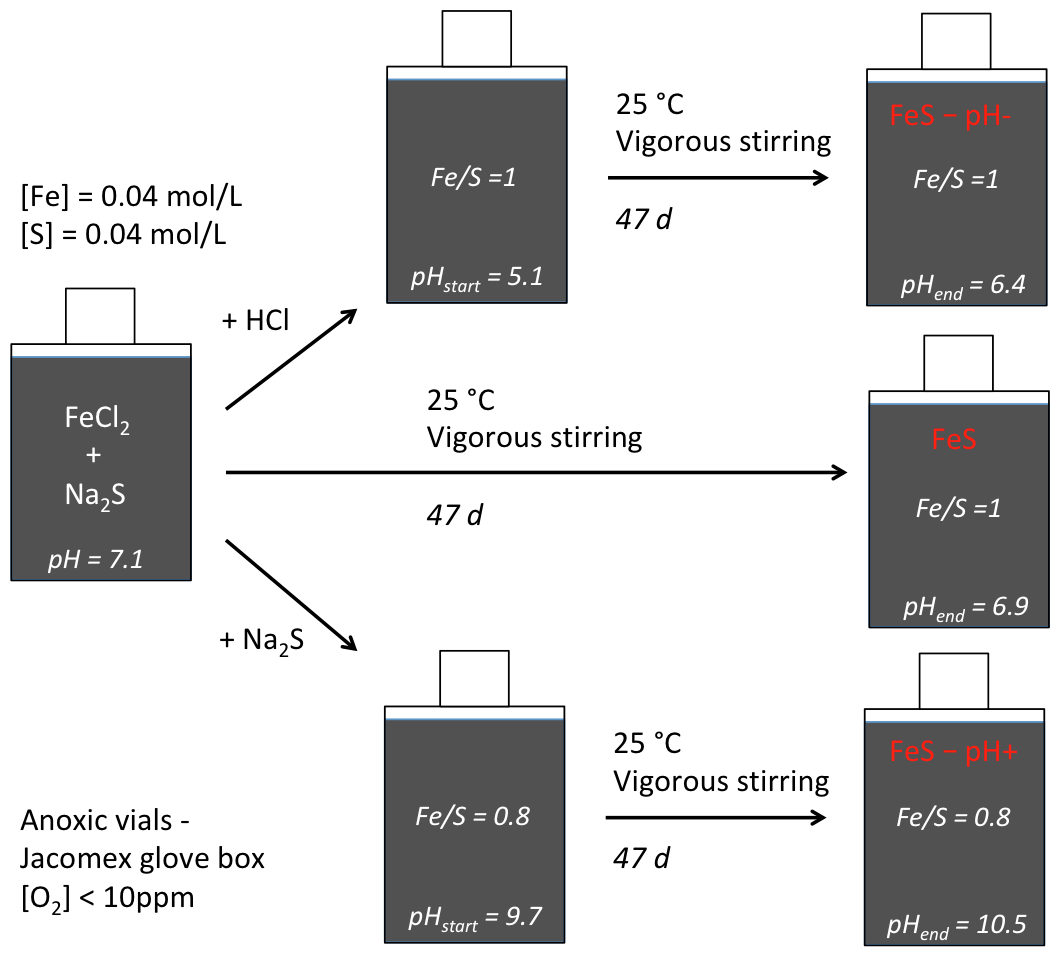
Figure 1Synthesis protocol for the three samples considered in this study. The control experiment, called “FeS”, consists of a simple aging experiment in aqueous solution of the solids initially precipitated from equimolar concentrations of Fe and S (ratio ), recovered after stirring over 47 d. In the FeS–pH− experiment, pH is initially lowered until pH 5.1 by adding anoxic HCl 1M. In the FeS–pH+ experiment, pH is initially increased until pH 9.7 by adding Na2S 0.625 M solution before the 47 d of aging, resulting in a final ratio of 0.8.
2.2 X-ray fluorescence
The samples were analyzed by X-ray fluorescence (XRF) using a Rigaku MM007HF Mo rotating anode equipped with a Si-drift KETEK™ detector with an acquisition time of 30 min per sample, keeping the detector dead time below 15 %. Samples were prepared as pellets of 3 mm in diameter, containing 4±0.1 mg of powder pressed to 1 t m−2. To improve the detection of the S Kα emission line, which is strongly absorbed by air, measurements were performed within a plastic bag under an He flux. All measurements were performed under the exact same geometric conditions, i.e., at the same distance from the source to the samples and from the samples to the detector, with an angle of 45° each. For comparison purposes, the X-ray fluorescence emission spectra obtained for all samples were normalized to the intensity of the Fe Kα emission line (Fig. S1 in the Supplement).
2.3 Synchrotron-based X-ray powder diffraction data acquisition
X-ray powder diffraction measurements were performed in the Debye–Scherrer geometry on the two-circle diffractometer of CRISTAL beamline at the SOLEIL synchrotron. Measurements were performed at 24 keV (λ=0.5141 Å) with a MYTHEN2 X 9K detector (DECTRIS). After fine hand-grinding in an agate mortar, the powder samples were inserted into a borosilicate capillary and sealed in an anoxic JacomexTM glove box using a cyanoacrylate-based glue. Data were recorded at room temperature for 15 min over the 2–125° 2θ range. The same data collection procedure was used for an empty capillary in order to subtract the contribution of the borosilicate from the signal prior to data analysis.
2.4 Rietveld refinement procedure
Rietveld analysis of the synchrotron-based XRD data (λ=0.5141 Å) was performed with the xnd_1.3 code (Berar and Baldinozzi, 1998) using pseudo-Voigt line shape profiles. The patterns were fitted over the 2–100° 2θ range, and fit quality was evaluated using the classical Rwp goodness-of-fit estimator (Fig. S2a). Starting unit cell parameters, atomic positions, and isotropic Debye–Waller factors values were taken from Lennie et al. (1995) and Stanjek and Schneider (2000) in the P4/nmm and Fd-3m space groups for the mackinawite FeS and greigite Fe3S4 structures, respectively. Scale factors, unit cell, and line shape parameters were refined for both phases, whereas atomic parameters were fixed to starting values. Refined scale factor values were used to derive relative weight fractions of the mineral phases in each sample using a classical quantitative mineralogical approach without an internal standard (Snyder and Bish, 1989). Crystallite size and strain effects were calculated by combining Lorentzian and Gaussian line shape functions with and tanθ angular dependence, respectively (Young, 1995), in addition to instrumental broadening functions calibrated on LaB6. Refined values for Lorentzian and Gaussian full-width-at-half-maximum (FWHM) parameters at 2θ=0 and 90° were used to calculate the mean coherent domain (MCD) size from the Scherrer equation, MCD = (0°), and the microstrains using FWHMGau (90°), respectively (Young, 1995). In the case of mackinawite, which is a platelet-type mineral, we used an anisotropic shape, thus obtaining size and strain results in both the ab and c directions.
2.5 X-ray scattering and pair distribution function (PDF) analysis
The synchrotron-based X-ray diffraction data (λ=0.5141 Å) were analyzed up to 125° 2θ, which allowed us to reach a Qmax value of 20.1 Å−1, where Q is the magnitude of the scattering vector, . The PDF G(r) gives the probability of finding a pair of atoms separated by a distance r. It is experimentally obtained from the sine Fourier transform of the scattering function S(Q) (Egami and Billinge, 2003; Farrow and Billinge, 2009), as shown in the following equation:
For each sample, the PDFgetX3 code (Juhás et al., 2013) was used to process the experimental powder diffraction intensity to generate the G(r). The experimental PDF G(r) was then fitted with a calculated one obtained from crystal structure models using the PDFgui code (Farrow et al., 2007). During this fitting procedure, the scale factor was the first parameter to be refined, followed by the unit cell parameters and the atomic displacement parameters, with the latter being constrained given the crystal symmetry. The atomic positions were not refined. To determine the Gaussian resolution dampening envelope due to limited Q resolution (Qdamp), depending mainly on the diffractometer configuration, a known well-crystallized compound (LaB6) was measured under the same conditions, and all of the parameters described above, including the Qdamp factor, were refined (Fig. S2b). The resulting Qdamp=0.0039 Å−1 was then used for PDF refinements of the studied samples. This allowed us to estimate the size of the coherent domain (Sp diameter factor) from the signal dampening of the PDF due to the decreasing number of pairs of atoms that contribute to the corresponding distances in the nanoparticle structure in an isotropic configuration. As mackinawite is a platelet-shaped anisotropic mineral, the particle diameter obtained considering a spherical shape with this approach stands as an approximation.
During the refinement procedure, the agreement between the calculated and the experimental PDF was characterized by the following reliability factor:
where Gobs is the PDF extracted from the diffraction data, and Gcalc is the PDF calculated from the model.
2.6 X-ray absorption near-edge structure at the S K-edge
Sulfur speciation of the synthetic samples was determined by using a synchrotron-based X-ray absorption near-edge structure (XANES) at the S K edge. Data were collected in fluorescence detection mode on the beamline 4–3 at the Stanford Synchrotron Radiation Light Source (SSRL, California, United States of America). The beamline was equipped with an Si(111) double-crystal monochromator and a PIPS (Passivated Implanted Planar Silicon) detector. Incident energy was calibrated by setting the energy position of the main edge of a thiosulfate reference at 2472 eV between each sample holder change during the session. Measurements were performed at room temperature in a sample chamber under He flow on pure powders shipped to SSRL within strictly anoxic containers, spread over sulfur-free tape, and mounted on-site into sample holders in a COY glove box ( atmosphere, <20 ppm O2). Two spectra were collected for each sample that were further calibrated, normalized, and averaged using the ATHENA code (Ravel and Newville, 2005). Systematic comparison between the first and second spectrum allowed us to rule out any possible redox change that could have been caused by the X-ray beam during data collection.
2.7 X-ray absorption near-edge structure at the Fe K-edge
Iron K edge data were collected in transmission mode at cryogenic temperature below 20 K in a liquid helium cryostat on the bending magnet SAMBA beamline at SOLEIL Synchrotron. The incident beam energy was monitored by an Si(220) double-crystal monochromator equipped with sagittal focusing of the second crystal. The incident beam energy was calibrated by measuring a Fe(0) foil reference in double transmission mode and by positioning the first inflection point of its absorption band at 7112 eV. For these measurements, sample pellets were prepared by pressing an appropriate amount of finely ground sample powder (2.5 mg) with 30 mg of cellulose in the JACOMEX™ glove box (<1 ppm) under an N2 atmosphere. The pellets were covered with Kapton™ tape and sealed in strictly anoxic containers that were transported to the synchrotron facility according to proven protocols (e.g., Baya et al., 2021). When taken out of the anoxic container, the kapton-covered pellets were quickly mounted on the cryostat sample rod and immersed in a liquid N2 bath before being transferred into the beamline liquid He cryostat. Two spectra were collected for each sample that were further calibrated, normalized, and averaged using the ATHENA code (Ravel and Newville, 2005). Systematic comparison between the first and second spectrum allowed us to rule out any possible redox change that could have been caused by the X-ray beam during XAS data collection.
2.8 Ab initio calculations of FeS band structure and X-ray absorption near-edge structure at the S K edge
Ab initio calculations were performed using the Quantum ESPRESSO suite of codes (Giannozzi et al., 2017), implementing density functional theory (DFT) using pseudo-potentials, plane waves, and periodic boundary conditions. Ultrasoft pseudo-potentials were directly taken from the GBRV database (Garrity et al., 2014) for iron or were generated using the PSLIBRARY (Dal Corso, 2014) for sulfur, removing one 1s core electron from its electronic configuration when generating the pseudo-potential of the absorber in XAS. All calculations were performed within the generalized gradient approximation of Perdew, Burke, and Ernzerhof (GGA-PBE, Perdew et al., 1996) and with energy cutoffs for the electronic wave function and the density of 100 and 800 Ry, respectively. Self-consistent calculation of the non-magnetic electronic band structure of tetragonal mackinawite was carried out using the experimental crystal structure determined using Rietveld refinement of the experimental XRD pattern, a uniform Monkhorst-Pack k-point grid, and a Gaussian smearing of 0.01 Ry. X-ray absorption spectra at the S K edge were calculated as a continued fraction using the XSPECTRA module (Taillefumier et al., 2002; Gougoussis et al., 2009; Bunău and Calandra, 2013) in the full core-hole approximation, i.e., modeling the photoelectron as a uniform negative background charge in the supercell. An energy-dependent arctangent-like broadening, as given in de Clermont Gallerande et al. (2018), with parameters ΓH=1 eV, ΓM=10 eV, AC=20 eV, and AM=30 eV, was used in the continued fraction to obtain the X-ray absorption cross-sections plotted in this article. For mackinawite, the absorbing atom was isolated in a supercell containing 108 atoms, ensuring a spatial separation of ∼11 Å between the absorber and its periodically repeated images. Unit cell parameters a=3.6784 and c=5.046 Å and internal coordinate for S atoms u=0.256 were employed. Self-consistent field and XANES spectra were calculated using a k-point grid. For pyrite, the absorbing atom was isolated in a cubic supercell containing 96 atoms, using the unit cell parameter a=5.44 Å and the internal coordinate for S atoms u=0.386 (Baya et al., 2021). Self-consistent field and XANES spectra were calculated using a k-point grid and a k-point grid, respectively. Finally, the relative energy position of the S K edge was estimated using the ΔSCF procedure described in Lelong et al. (2014) and de Clermont Gallerande et al. (2018).
3.1 Mineralogy of the synthesized iron sulfides
For the control experiment labeled FeS, the final pH of 6.9 was close to the initial one of 7.1, showing that only small variations occurred during the 47 d of mackinawite aging in aqueous solution (Table 1). In the case of FeS–pH−, the solution pH, initially set to 5.1 after HCl addition, was observed to re-equilibrate to 6.4 by the end of the experiment, which indicates H+ consumption (Table 1). In the case of FeS–pH+, the pH increased from 9.7 just after Na2S addition to 10.5 at the end of the experiment (Table 1). Given the molarity of Na2S introduced in excess (0.6 mmol, Table 1) to initially increase the pH in this experiment, the final pH value is expected to be 10.7, which is close to the final value measured. Thus, we observe a lag phase before the re-equilibration of pH close to the expected value after the 47 d of aging, possibly due to complex interactions between the added Na2S solution and FeS solids already present in the solution at the initial stage. The XRD powder patterns of the final solids, together with their corresponding Rietveld-refined patterns, are shown in Figs. 2 and S2a, while the PDF of the final solids and their associated refinements are shown in Fig. 3. All refined parameters are given in Table 2.
Table 2Refined parameters obtained for Rietveld and PDF refinements and associated calculated parameters. V is the unit cell volume, MCD values are the sizes of mean coherent domains, and ε denotes the calculated strain values. For mackinawite, dFe−S corresponds to the mean distance of Fe and S atoms in tetrahedron units, and dFe−Fe corresponds to the mean distance of two Fe atoms in the ab plane. For greigite, and are given, corresponding to the mean Fe S distances between Fe and S atoms for tetrahedral or octahedral coordinations, respectively.
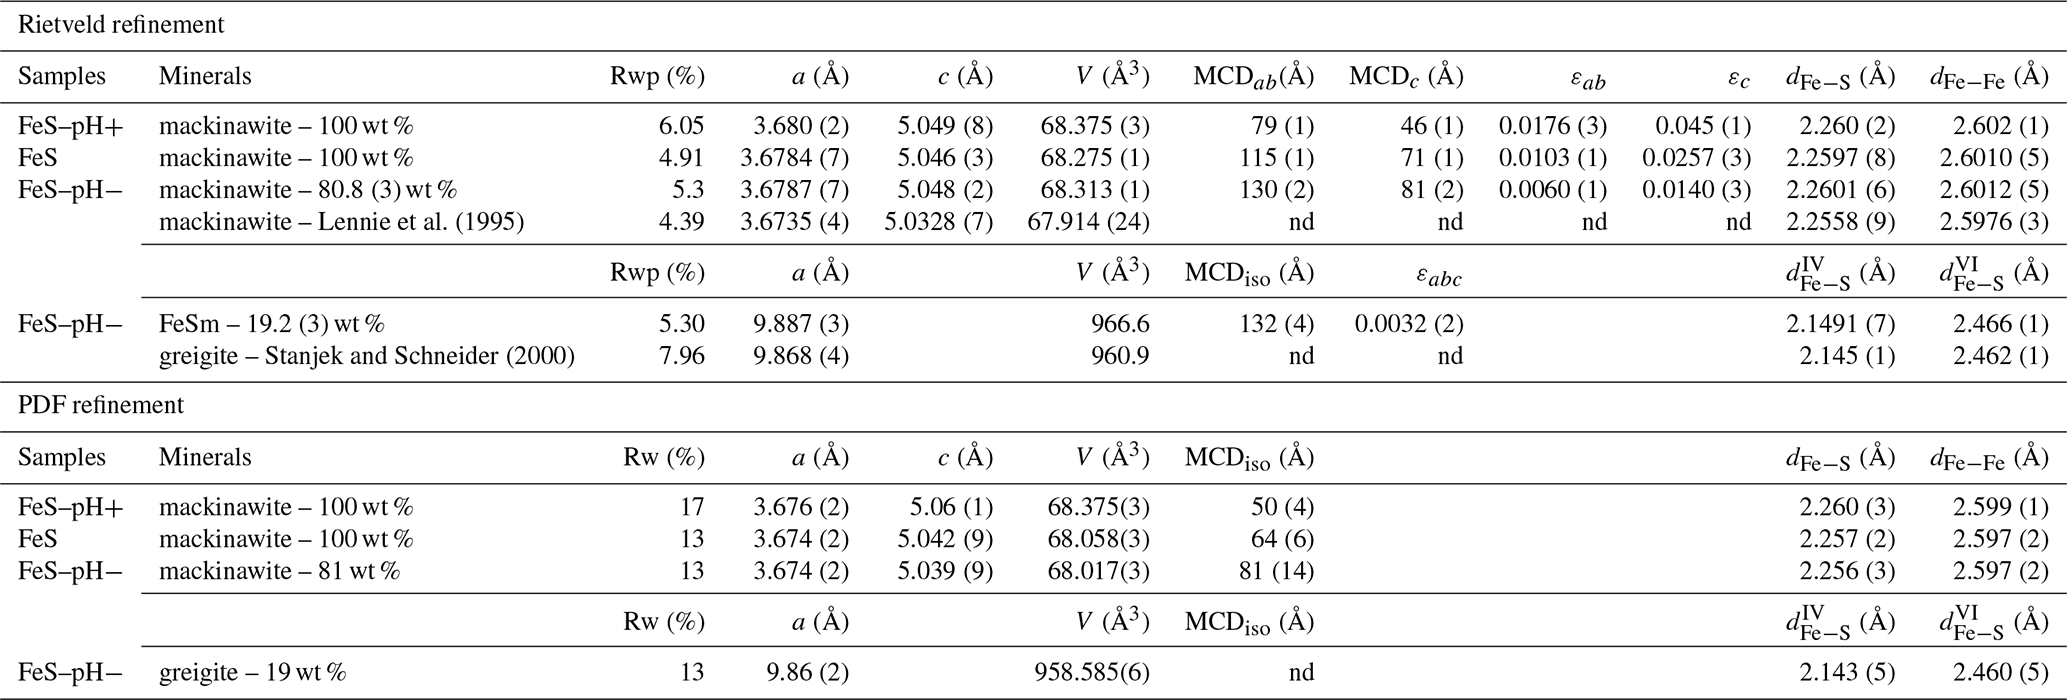
nd: not determined.
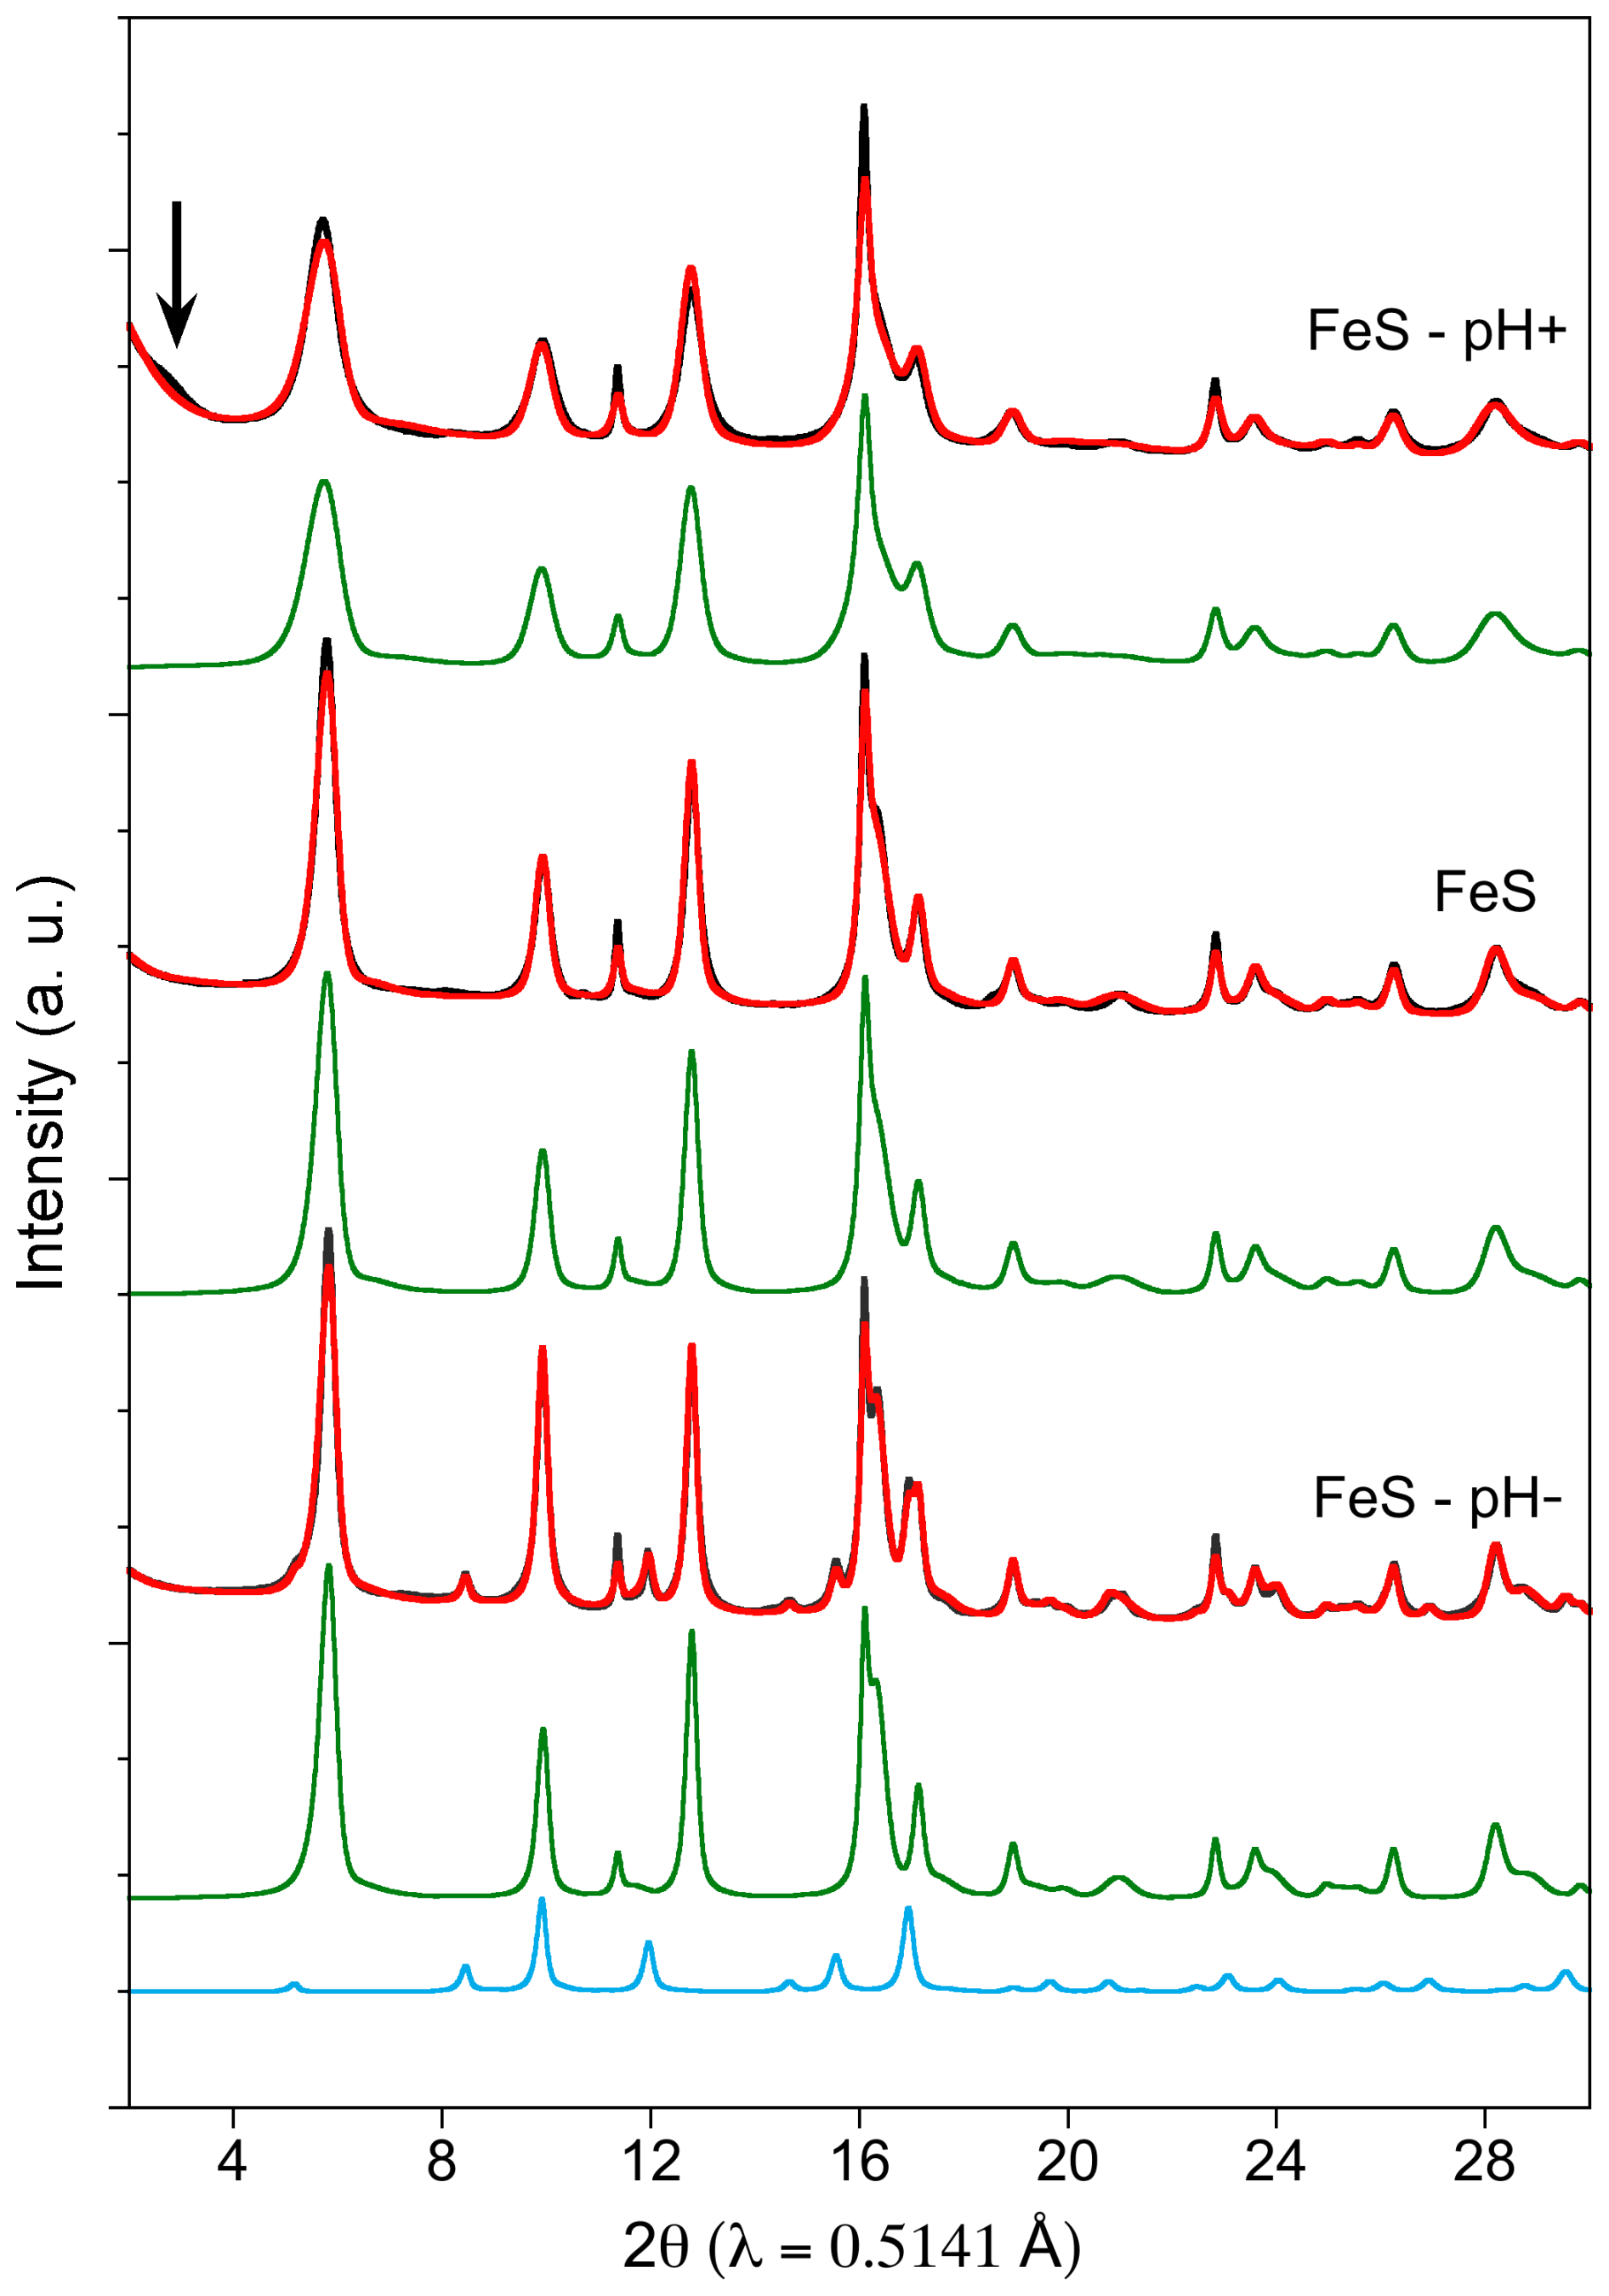
Figure 2Detailed view of the Rietveld refinement results, in the medium-angle region, of the powder X-ray diffraction (XRD) patterns obtained for the final solids of each experiment. Experimental and calculated patterns are represented in black and red color, respectively. Mackinawite and greigite components are displayed as green and blue curves respectively. Corresponding refinement parameters are reported in Table 2. Full-range patterns are displayed in Fig. S2a. The arrow points a broad superstructure at low angle in the FeS – pH+ sample (see text).
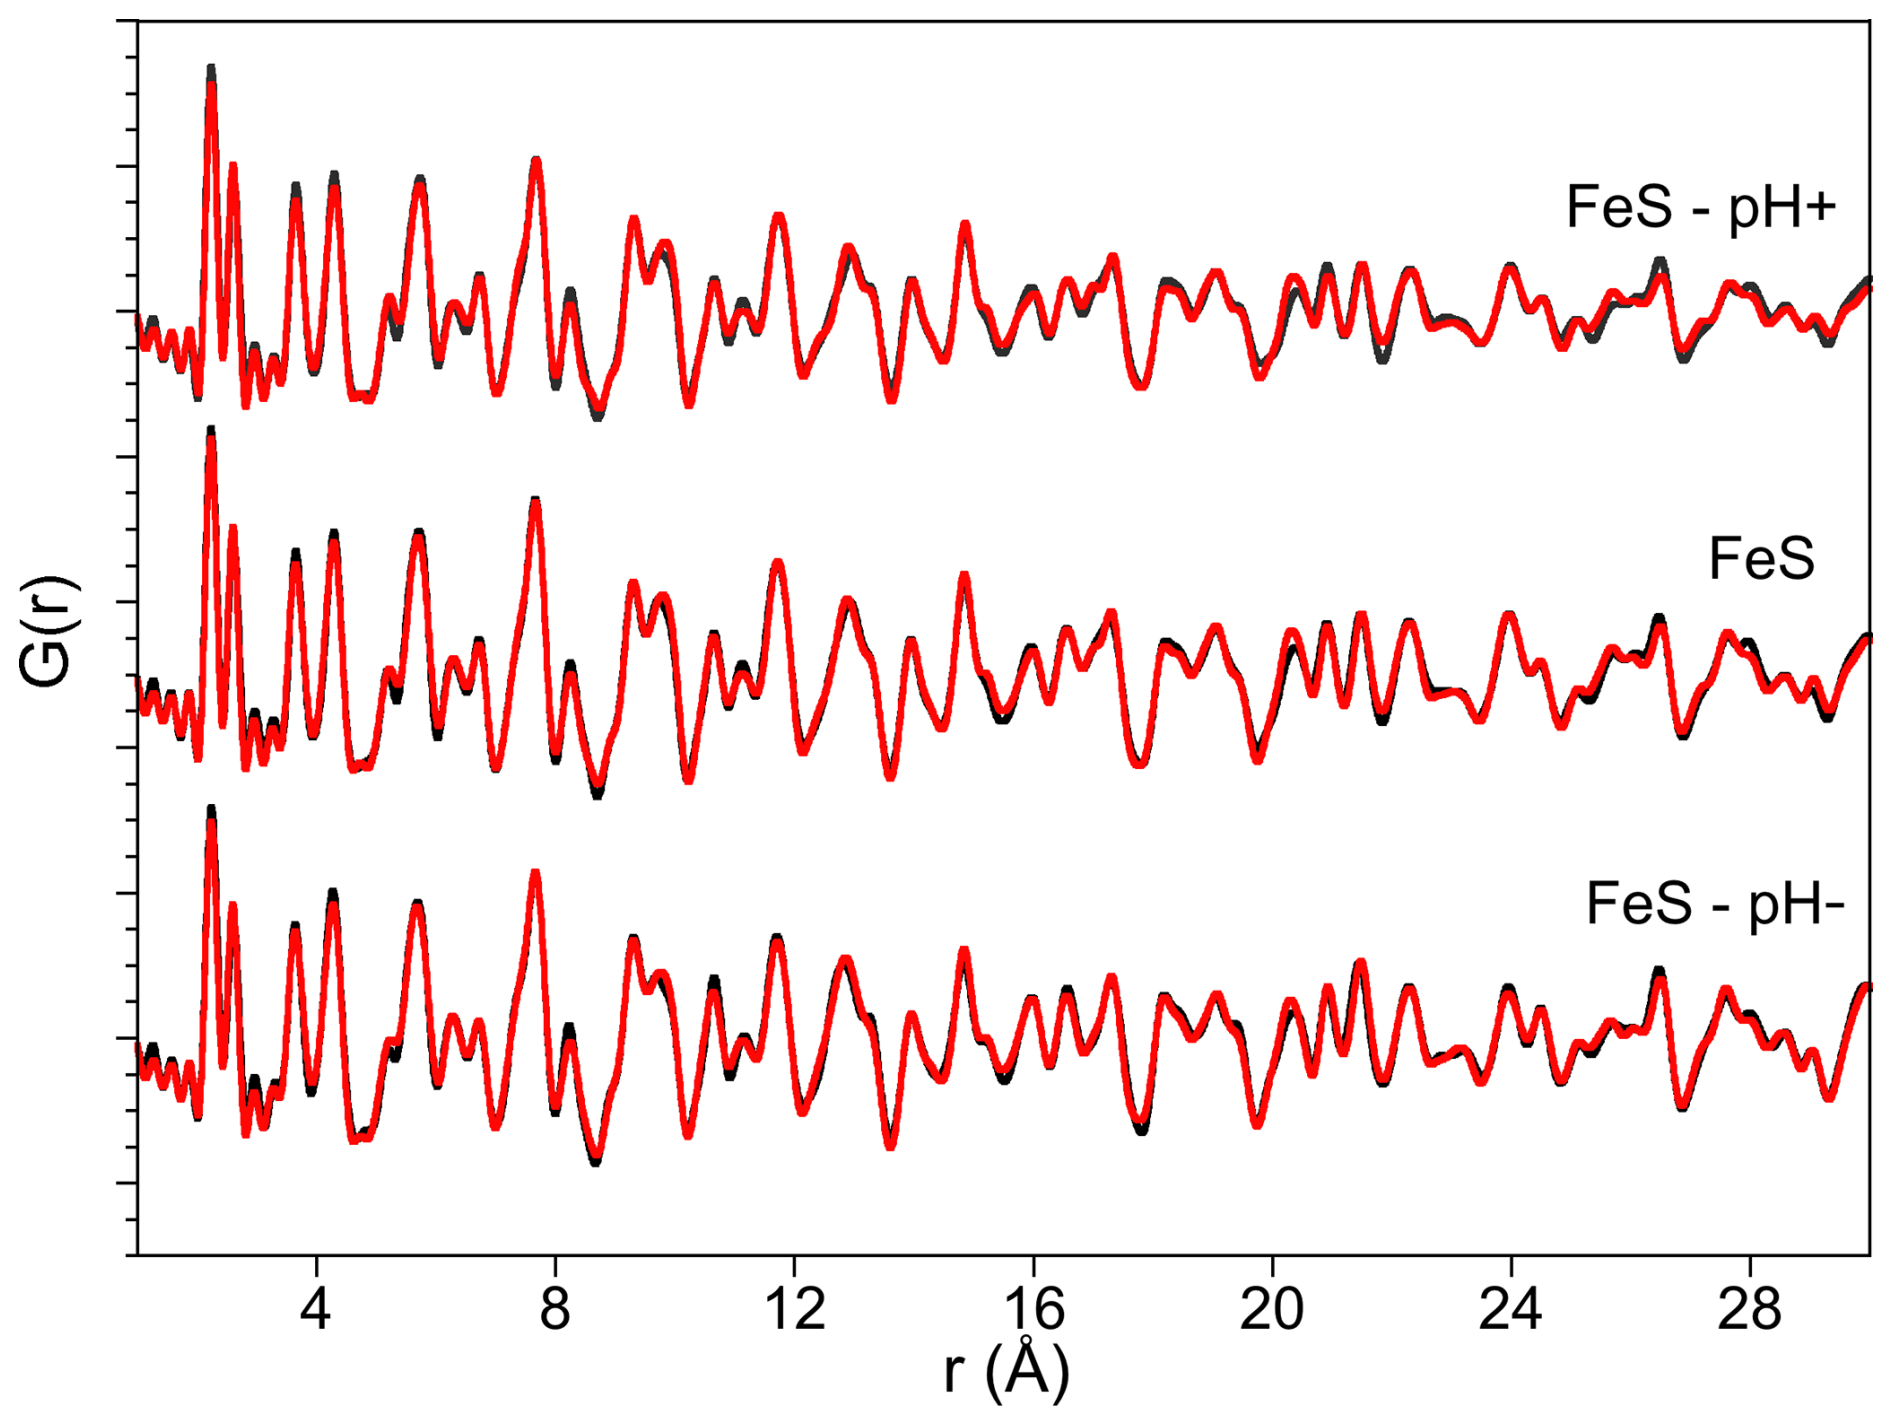
Figure 3Pair distribution function analysis obtained for the final solids of each experiment (black curves) and their associated refinement analysis (red curves) using mackinawite (Lennie et al., 1997) and greigite (Stanjek and Schneider, 2000) as starting mineralogical structures. Detailed results of the refinement are presented in Table 2.
Both Rietveld and PDF analyses show that crystalline mackinawite is the unique component of the FeS and FeS–pH+ samples. In the latter sample pattern, an additional broad peak is observed at approximately twice the mackinawite d(001) distance, around 10–10.5 Å, as discussed in the next section.
In contrast to the FeS and FeS–pH+ samples, the Rietveld and PDF analyses of the FeS–pH− sample reveal the additional occurrence of greigite. The Rietveld refinement indicates 19 wt % of greigite and 81 wt % of mackinawite (Table 2). These proportions are confirmed by the PDF analysis that also indicates no additional contribution of species not detectable by X-Ray diffraction in the samples (Fig. 3, Table 2). The X-ray fluorescence measurements performed on the three samples under strictly comparable conditions show that the FeS–pH− sample has a higher S content compared to the FeS and FeS–pH+ when all of the spectra are normalized to the Fe Kα emission line (Fig. S1). This chemical result is in agreement with the mineralogical results since a mixture of 19 wt % Fe3S4 and 81 wt % FeS is expected to show a lower Fe–S ratio than a sample made of 100 % FeS. This suggests a release of aqueous Fe(II) in the aging solution of the FeS–pH− sample.
3.2 Unit cell and texture parameters of FeS and Fe3S4 minerals
For all of the experiments, the unit cell parameters of the minerals were determined via both Rietveld and PDF refinements (Figs. 2 and 3, Table 2). Regarding mackinawite, the Rietveld-refined unit cell parameter values are close and comparable in the three experiments, with a=b ranging from 3.6784(7) to 3.680(2) Å and c ranging from 5.046(3) to 5.049(8) Å (Table 2). The size of the mean coherent domains (MCDs) calculated in both the ab and c directions from Rietveld-refined Lorentzian line width parameters using the Scherrer equation and assuming a platelet-like particle shape was observed to vary as a function of the initial pH of the solution and/or the initial ratio (Fig. S3). Mackinawite particles in the FeS–pH+ sample showed the smallest mean coherent domains (i.e., MCDab=79(1) Å and MCDc=46(1) Å), followed by those in the FeS control experiment (i.e., MCDab=115(1) Å and MCDc=71(1) Å) and those in the FeS–pH− sample (i.e., MCDab=130(1) Å and MCDc=81(1) Å). Consistently, in our PDF analysis, MCDiso values were found to be 50(4), 64(6), and 81(14) Å for the mackinawite particles in the FeS–pH+, FeS control, and FeS–pH− samples, respectively, assuming spherically shaped crystallites (Fig. S2b). Microstrain effects, characterized by local or extended atom displacements from their crystallographic positions, were determined from the width of the Gaussian line shape functions used to fit the XRD patterns. Microstrain values, calculated along the ab and c directions, were found to increase with decreasing MCD size from the FeS–pH− to the FeS–pH+ sample (Fig. S4). More precisely, the microstrains along the c axis (i.e., εc) showed higher values and increased faster than those in the ab direction (i.e., εab) when the mackinawite crystallite size decreased. This trend could be due to a variation in interplanar distances between the core and the surface of the particles, resulting in a gradual increase in the microstrains with decreasing particle sizes.
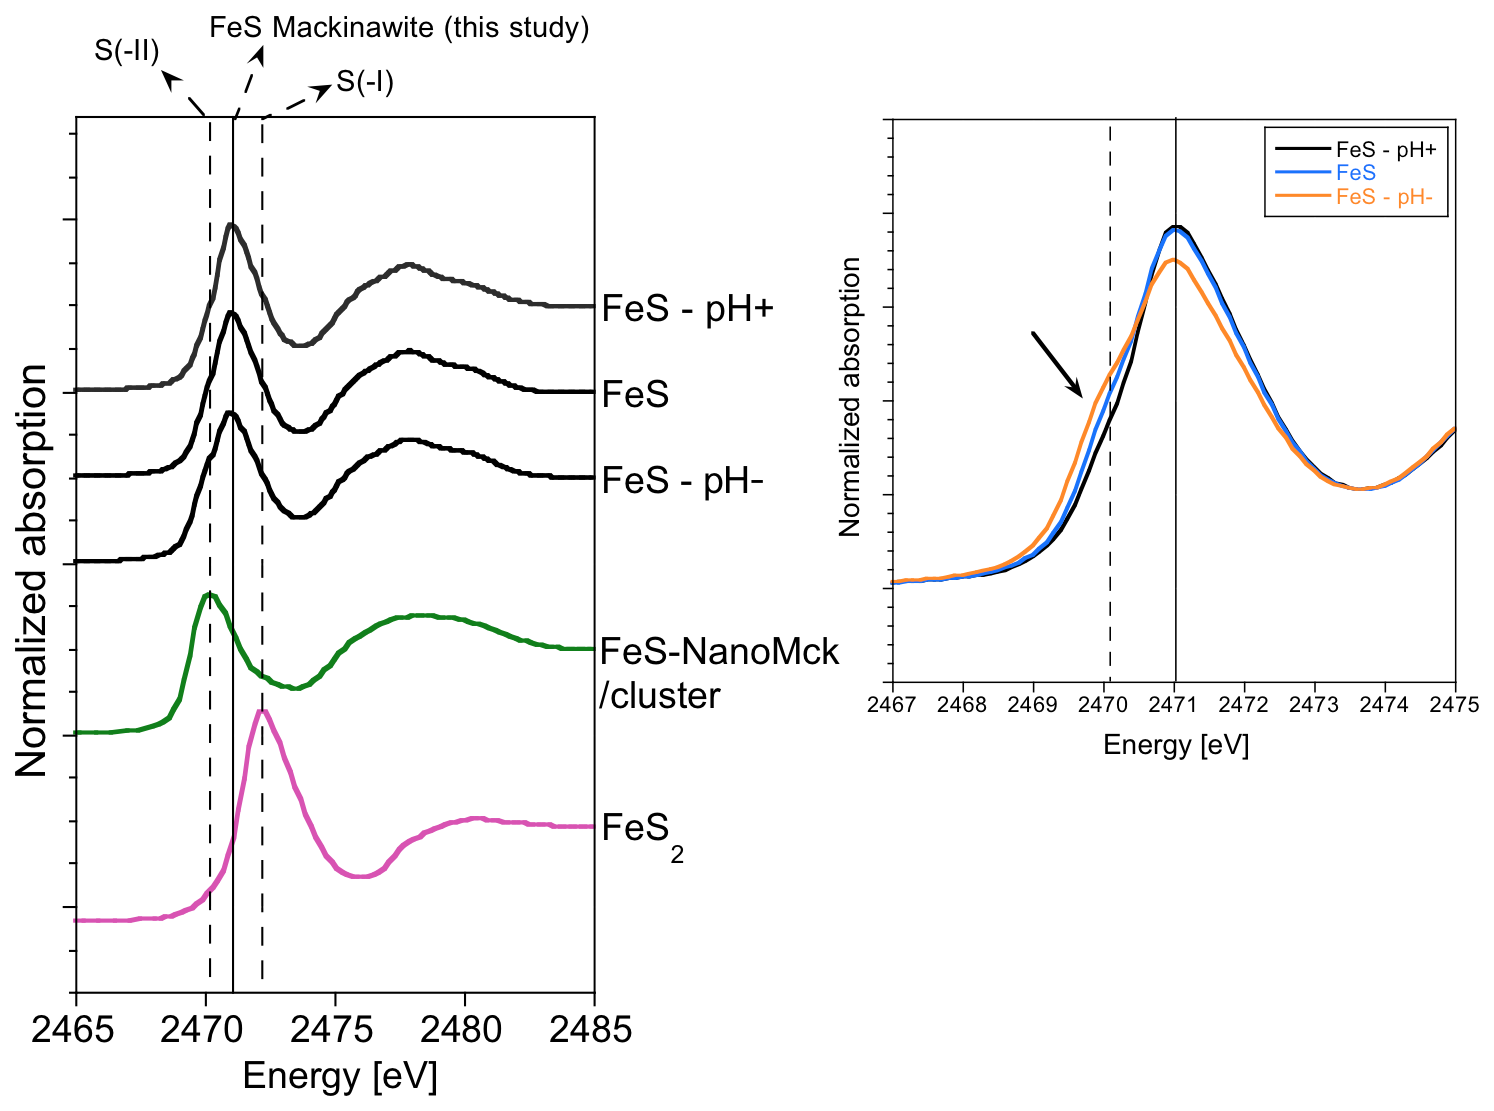
Figure 4XANES spectra at the S K edge for the three samples studied and for spectra of reference compounds corresponding to FeS (Ikogou et al., 2017) and nanocrystalline pyrite (Baya et al., 2021). A zoom on the pre-edge region shows a shoulder appearing in the pre-edge of the FeS–pH− sample, likely resulting from greigite contribution (19 wt %, Table 2).
3.3 S and Fe oxidation states probed by X-ray absorption spectroscopy at the S and Fe K-edges and comparison with DFT calculations
The S K-edge spectra of iron sulfides exhibit a pre-edge at low energy contrary to (poly)sulfides and other S-bearing compounds due to the electric dipole transitions from S 1s electrons to unoccupied S 3p antibonding states hybridized with Fe 3d states (Farrell et al., 2002). The position and intensity of this pre-edge depend on site geometry (e.g., octahedral vs. tetrahedral) and on Fe–S bond covalency (Solomon et al., 2005). Figure 4 displays the S K-edge spectra for the three samples studied and for two reference samples. The first reference sample is a biogenic FeS precipitate corresponding to the “FeS–1.5months” sample described in Ikogou et al. (2017), which contains a nanocrystalline mackinawite fraction with small crystallites (i.e., MCDab=5 nm and MCDc=2 nm; Table 2). This reference spectrum, referred to as FeS by Baya et al. (2021), was used to fit the S K-edge spectra of FeS samples (using a least-square linear combination fitting procedure) that consisted of a continuum between FexSx clusters and nanocrystalline FeS–mackinawite, with both of these components potentially containing undetermined amounts of Fe(III). In this iron sulfide sample, the sulfur oxidation state is expected to be close to the formal S(-II) valence state. The second reference sample is a synthetic pyrite FeS2 described in Baya et al. (2021), in which sulfur has an S(-I) formal oxidation state.
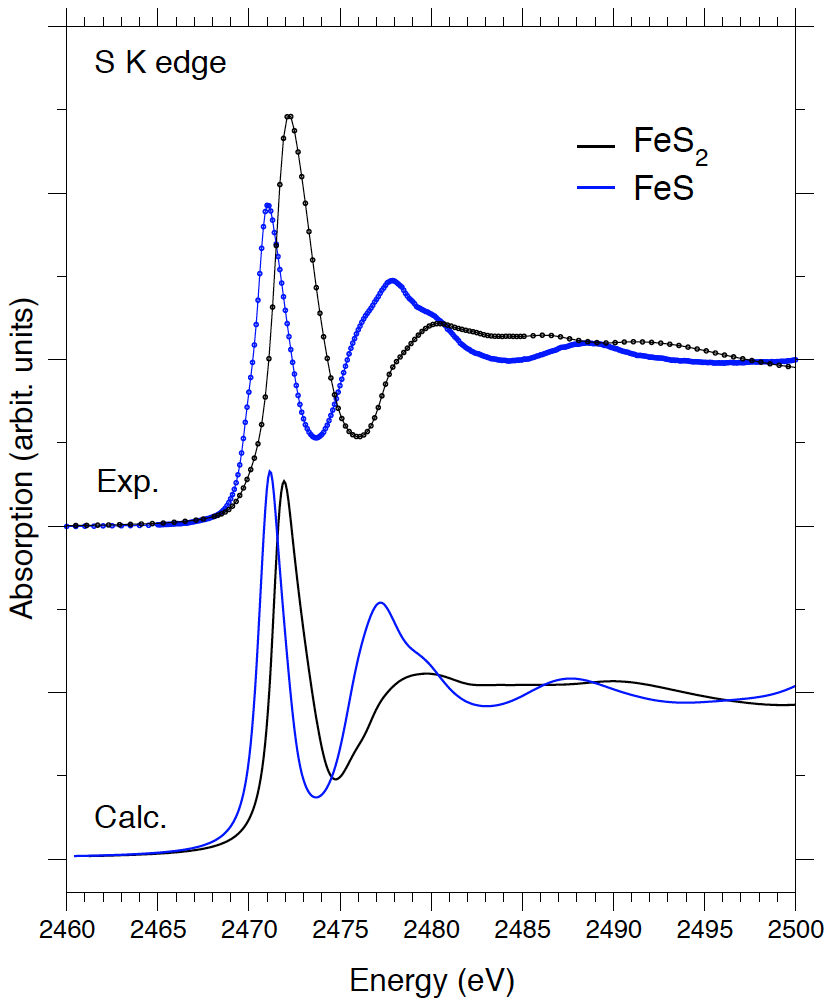
Figure 5Comparison between experimental and theoretical S K-edge of the FeS and FeS2 model compounds. A rigid energy shift has been applied to the theoretical spectra for a proper comparison with the experimental spectra.
Overall, the S K-edge XANES spectra for the three FeS samples synthesized in this study show a similar global shape (Fig. 4). They all exhibit a pre-edge peak at an intermediate position between that of the FeS and that of pyrite, which implies an effective S oxidation state between –II and –I for our nanocrystalline mackinawite samples. The pre-edge peak of the S K-edge XANES spectrum of the FeS–pH− sample exhibits a marked shoulder on the low-energy side that can be attributed to greigite Fe3S4 considering the proportion of 19 wt % of this mineral species quantified by XRD–Rietveld and PDF refinements in this sample. Interestingly, this contribution of greigite in the spectrum of the FeS–pH− sample occurs at the same energy as the pre-edge peak in the spectrum of the FeS reference (Ikogou et al., 2017; Baya et al., 2021) that is also expected to contain Fe(III). A weaker, but still significant, shoulder at the same energy position can also be observed on the XANES spectra of the FeS–pH+ and control samples (Fig. 4). Considering the lack of detection of greigite by XRD–Rietveld and PDF refinements in these samples, such a signal could be related to the occurrence of residual FeS precipitate that likely contained amorphous FexSx monosulfide. This reasoning is supported by DFT calculations of S K-edge XANES spectra in pyrite and mackinawite performed by considering the crystallographic parameters determined experimentally in this work (Table 2) and in Baya et al. (2021). Indeed, a good agreement between experimental and theoretical spectra is obtained regarding the overall spectral shape for both mineral structures (Fig. 5). In addition, the core-level shift calculated between mackinawite and pyrite is in qualitative agreement with the one measured experimentally (0.8 eV against 1.2 eV, respectively). The lower edge onset energy in mackinawite is indicative of a more efficient screening of the core-hole potential by the valence electrons. It is consistent with a higher charge density around S atoms in mackinawite compared to pyrite. These results further confirm that the experimental spectra recorded in our monosulfide FeS nano-compounds (Ikogou et al., 2017; Baya et al., 2021) differ significantly from the one expected theoretically in bulk mackinawite.
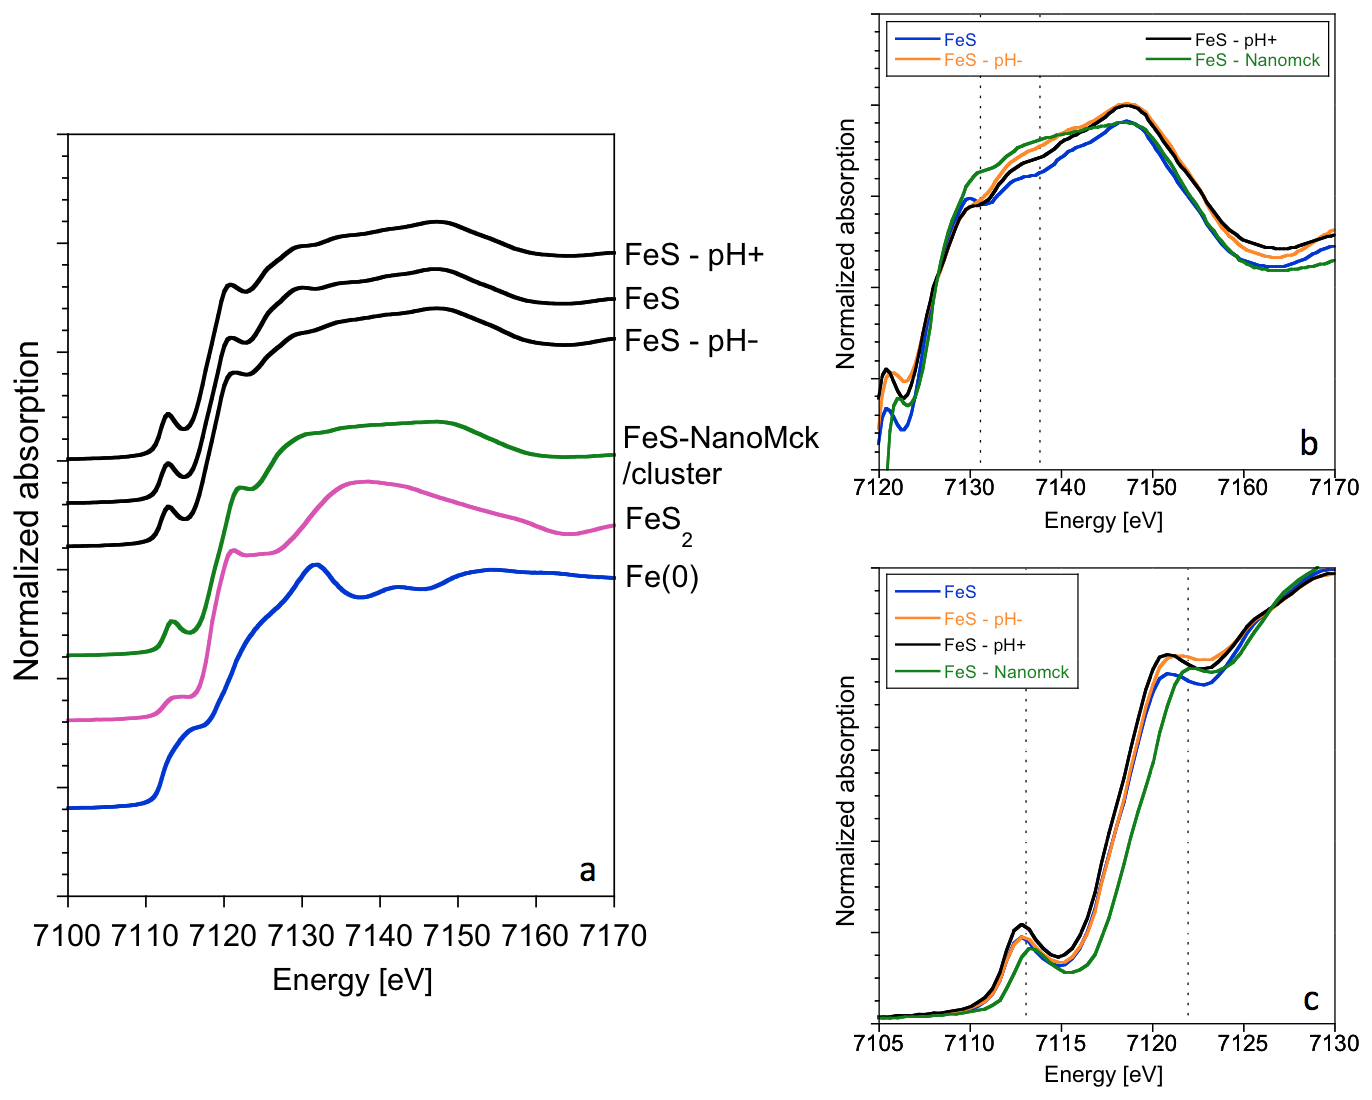
Figure 6(a) XANES spectra at the Fe K-edge for the three investigated samples and two reference compounds corresponding to FeS (Ikogou et al., 2017; Baya et al. 2021) and nanocrystalline pyrite (Baya et al., 2021). (b) Zoom on the 7120–7170 eV region of the edge and (c) zoom on the 7105–7130 eV region of the edge, showing that FeS–pH− has a close but different signal, likely due to the presence of greigite in the sample (19 wt %).
At the Fe K edge (Fig. 6), a general remark is that both the shape and position of the FeS spectra ressemble more to the one of a metal such as Fe(0) than to commonly measured Fe oxides. Differences are hardly noticeable between the three samples studied, most likely due to the presence of mackinawite as the main mineralogical component (>80 %). Figure 6b and c zoom into different regions of the Fe K-edge spectra to facilitate comparison with the reference compounds. The pre-edge feature, corresponding to transitions from the 1s core orbital to the localized 3d or 4p mixed to 3d orbitals, is sensitive to both the Fe oxidation state and the site geometry (Arrio et al., 2000). Here, in the Fe–S covalent system, only weak differences are observed in the pre-edge, with a slight shift towards the higher energy for the FeS–pH− sample as compared to the control FeS sample. The contribution from greigite, including Fe(III) in the structure, in the FeS–pH− sample is particularly visible on the first shoulder of the white line around 7120 eV. It is also visible on the second shoulder, showing a higher intensity between 7135 and 7145 eV, as already observed in a sample containing mostly greigite used as a reference in Gorlas et al. (2022). Such features, also observed in the Fe K-edge spectrum of the FeS reference compounds, were attributed elsewhere to the presence of Fe(III) in FeS iron sulfide precursors (Matamoros-Veloza et al., 2018a; Baya et al., 2021). Minor additional differences observed in the 7130–7150 eV range could be due to slight differences in the normalization process, in particular when comparing the FeS and FeS–pH+ samples.
4.1 Mineralogical and spectroscopic characteristics of nanocrystalline mackinawite synthesized at low temperature
In our experiments, the range of cell parameters determined by Rietveld refinement of XRD powder patterns are to 3.680(2) Å and c=5.046(3) to 5.049(8) Å for mackinawite precipitated from FeCl2 and Na2S (Table 2). In comparison, Lennie et al. (1995) determined Å and c=5.0328(7) Å for FeS precipitated from Fe(0) and Na2S.9H2O, and Michel et al. (2005) determined to 3.696(1) Å and c=5.037(4) to 5.089(3) Å for FeS precipitated from Mohr's salt and a solution with pH values ranging from 5.5 to 9.2. Thus, the a and b unit cell values of our mackinawite samples are, on average, comparable to those of previous studies, whereas a significant difference can be observed for the c parameter. In the study by Lennie et al. (1995), no information is given on the MCD size of mackinawite, even though we can expect a relatively high degree of crystallinity after observing the provided XRD patterns. In the study by Michel et al. (2005), the MCD sizes derived from PDF refinement by considering an isotropic medium are determined to be around 45 Å for a mackinawite sample hydrothermally aged over 7 d. This value is close to our range of MCD sizes of 50 to 81 Å determined by PDF analysis. In the study by Michel et al. (2005), the FeS bulk sample synthesized after starting from Fe(0) as in the study by Lennie et al. (1995) is the one that shows the closest size and cell parameters compared to our study (Table 2, Fig. S3). This indicates that our aging and drying procedures at ambient-temperature-produced solids with similar to higher crystallinity. The larger MCD size determined in our study compared to those previous studies could be related to the reported increase in crystallinity upon aging of mackinawite under aqueous conditions (Wolthers et al., 2003, and reference therein; Ikogou et al., 2017). In the present experiments, we observe that the increase in final crystallite sizes after aging is negatively correlated to pH. However, since all three experiments start from the same precipitated FeS solid at pH 7.1, the difference in crystal growth upon aging could be attributed to the contrasting saturation of aqueous species in the media and pH. Indeed, the FeS–pH+ sample is saturated with ions, while FeS–pH− is considered to be affected by the presence of Fe(II) in the solution due to the transformation of FeS into Fe3S4. Consequently, determining from which combination of factors the final size of crystallites is derived exactly remains challenging and falls out of the scope of the present study.
Interestingly, the S K-edge XANES data (Fig. 4) indicate that our crystalline mackinawite samples differ from the FeS reference corresponding to amorphous FeS or freshly precipitated FeS (Ikogou et al., 2017; Baya et al., 2021). The expected formal valence state of (-II) for sulfur in this reference is confirmed theoretically (Fig. 5). However, the edge onset of our crystalline mackinawite samples is clearly shifted towards higher energies, likely due to electron delocalization in the Fe atom layer of the ab plane, as already proposed by Vaughan and Ridout (1971) and modeled by Kwon et al. (2011) using DFT. Our XAS data also show that the nanometric size and/or the presence of Fe(III) impurities in the FeS strongly change the electronic properties compared to crystalline mackinawite, resulting in a pre-edge S K-XANES signature closer to a typical S(-II) signal in a Fe sulfide compound.
The fact that the occurrence of greigite in our FeS–pH− sample yields a shoulder at the same energy level as the main pre-edge peak energy of FeS (Fig. 4) suggests that this phase contains S atom sites with a XAS signature similar to that of FeS (i.e., with a formal valence of S(-II)). For instance, at the S K edge, this signature could be due to bonds with Fe(III) at tetrahedral A sites of greigite or bonds with mixed Fe(II)–Fe(III) at octahedral B sites, resulting in this covalent system in a fractional apparent oxidation state of between 2 and 3 for Fe (Pattrick et al., 2017). At the Fe K edge, the difference between our FeS–pH− and the two other samples is more subtle since this sample contains only 19 wt % Fe3S4. However, the comparison with the spectrum of Fe(III)-containing FeSNanoMck still stands, particularly considering the slight shift observed in the first maximum of the white line (Fig. 4).
The lack of studies reporting reliable S and/or Fe K-edge XAS data (i.e., supported by a full mineralogical and crystal chemistry characterization) for “pure” and “non-oxidized” greigite in the literature hinders a formal comparison with our S and Fe K-edge XAS data. This lack is likely explained by the fact that, when synthesized at ambient temperature, produced greigite can hardly be separated from other more or less crystalline persistent FeS monosulfide phases. In addition, the large variation expected in the stoichiometry of Fe at the A and B sites of greigite compared to that observed, for instance, for magnetite (Vaughan and Tossell, 1981; Pattrick et al., 2017; Roberts et al., 2011) suggests that Fe and S K-edge XAS spectra might change significantly from one sample to the other, depending on the reaction route employed and/or the sample preservation from oxidation. These considerations indicate that experimental synthesis of pure greigite with controlled stoichiometry at a low temperature would deserve further dedicated studies in order to set a stronger basis for interpreting S and/or Fe speciation through direct XAS measurements in complex environmental samples containing this type of Fe sulfide. Unfortunately, this lack of a reliable experimental dataset could not be easily overcome by atomistic modeling. Indeed, DFT calculations for this compound are particularly challenging due to intrinsic complexity and, consequently, fall out of the scope of the present study.
4.2 Effect of pH increase by H2S addition on mackinawite properties
Our XRD results indicate that the increase in pH by Na2S addition in the FeS–pH+ sample resulted in the smallest mackinawite crystallite size (i.e., MCDab=79(1) Å and MCDc = 46(1) Å) compared to the other samples (Fig. 2; Table 2). Detailed analysis of the XRD pattern also revealed the appearance of a weak and broad peak located at a low angle on the diffractogram (Fig. 2), corresponding to an inter-reticular distance of ∼10.5 Å. Such a peak could be interpreted as being due to partial lattice expansion directly affecting unit cell parameters, especially at the grain boundaries, which could be related to the small crystallite size of the mackinawite in this sample (Wolthers et al., 2003). Hence, the high strain observed along the c direction suggests that such lattice distortions could accumulate on the basal faces of the mackinawite particles. The observed low-angle broad peak could also be interpreted as a double-cell super-structure along the c direction, with the observed distance being approximately twice the basal spacing distance of mackinawite. Since the overall pattern is not affected by this modification, it would then result from a more-or-less regular alternate stacking of either mackinawite layers with slightly differing composition or spatial extension or of interlayer species. In a study on synthetic disordered mackinawite (i.e., FeSam), Wolthers et al. (2003) proposed that lattice expansion of mackinawite could also be related to intercalation of water molecules and trace elements, which has also been proposed in theoretical studies (Terranova and de Leeuw, 2016; Muñoz-Santiburcio et al., 2013). In a more recent FeS precipitation experiment at ambient temperature, similar additional Bragg reflections around 10 Å were interpreted as expanded planes of the initial FeSNano compound while transforming into mackinawite (Matamoros-Veloza et al., 2018b). In our study, considering the excess of S in the aging suspension, the high degree of defects at the edges of mackinawite particles in the FeS–pH+ sample could also be tentatively attributed to local perturbation of tetrahedral sheets due to the interactions and/or intercalations with residual molecules.
4.3 Mackinawite oxidation to greigite under anoxic conditions
The transformation of mackinawite into greigite has been studied in detail from a crystallographic point of view by Lennie et al. (1997). At the mechanistic level, these authors proposed a “solid-state transformation” by diffusion of Fe(II) atoms along the c axis of the FeS structure, which should imply the existence of a mineral interface with water. This same “solid-state mechanism” is further evoked in the study by Hunger and Benning (2007), reporting results from FeS– polysulfide mixing experiments. These latter authors additionally proposed a crystal growth model for greigite relying on oriented aggregation of mackinawite nanoparticles that would be further oxidized by polysulfides and would result in the accumulation of defects along the mackinawite–greigite interface. In another study on experimental Fe sulfide phase transformation, Bai et al. (2014) reported high-resolution TEM observations showing abundant crystal defects (translations and dislocations) in mackinawite during its transition to greigite. These authors interpreted these defects as the result of processes such as Fe diffusion and/or interstitial incorporation through S layers (Brgoch and Miller, 2012). In our study, such an epitaxial transformation, likely associated with Fe release in solution, would be supported by the similar size estimated for the MCDab of mackinawite (i.e., 130(2) Å) and the MCDiso of greigite (i.e., 132(4) Å) in the FeS–pH− sample (Table 2).
At the mechanistic level, the transformation of mackinawite into greigite could also proceed via a Fe(III)–mackinawite transient intermediate that would not have been caught in our experiment. This hypothesis relies on the occurrence of such species reported by Bourdoiseau et al. (2011) on the basis of Raman measurements or inferred by Matamoros-Veloza et al. (2018a) and Baya et al. (2021) on the basis of Fe K-edge XAS data. Recently, on the basis of high-temperature experiments (80 to 100 °C), Lin et al. (2018) proposed that, in acidic media, H2S could act as an oxidant towards Fe(II) in mackinawite, transforming it into Fe(III)-containing greigite. These authors concluded that acidic environments could favor rapid transformation of Fe sulfides.
Our results show the oxidation of solid-state Fe(II) in mackinawite in the presence of H+ only, provided by dissolved HCl (pH 5.1) instead of H2S. Moreover, we emphasize that FeS oxidation can proceed at room temperature in the absence of H2S–polysulfide addition, as generally proposed in pyrite formation pathways and with mackinawite formed prior to acidification. In summary, the reaction suggested here by mineralogical and pH results implies that H+ acts as an oxidant for solid-state Fe(II) in FeS, leading to its transformation into greigite Fe3S4 with putative H2 production at a low temperature (Eq. 1).
This reaction, which likely describes our mineralogical observations, can be tentatively compared with another chemical system, the one of anaerobic corrosion of zero-valent iron (Reardon, 1995, 2005; Beverskog and Puigdomenech, 1996; Xu et al., 2008; Ortiz et al., 2002; Ma et al., 2013; Filip et al., 2014; Robineau et al., 2021). Indeed, this process starts with the oxidation of iron by H+ (e.g., Reardon, 1995; Beverskog and Puigdomenech, 1996; Lantenois et al., 2005; Xu et al., 2008; Bourdelle et al., 2017) (Eq. 2).
This rewrites in an alkaline medium as follows:
This first step can be followed by Fe(OH)2 formation in near-neutral or alkaline media and by the so-called Schikorr reaction, in which Fe(OH)2 is observed to be oxidized by the protons of water into magnetite Fe3O4, producing molecular hydrogen at temperature typically above 80 °C in de-aerated water (Schikorr, 1929, 1933; Evans and Wanklyn, 1948; Schauzer and Guth, 1977; Reardon, 1995; Ma et al., 2013).
The latter reaction may actually proceed via the oxidation of aqueous Fe(II) species since Fe(OH)2 is not stable over 60 °C, thus providing an anoxic corrosion pathway from metallic iron to magnetite in dilute aqueous solutions, as proposed by Beverskog and Puigdomenech (1996), which can be summarized as follows (Ortiz et al., 2002; Xu et al., 2008; Qin et al., 2018):
This net reaction (Eq. 4) has been extensively studied in various anoxic geological and technological contexts since it has important implications for the long-term behavior of steel barriers in storage waste management (Ortiz et al., 2002; Xu et al., 2008; Schlegel et al., 2016; Smart et al., 2017), and it is also sought after as a key hydrogen evolution reaction (HER) (Evans and Wanklyn, 1948; Reardon, 1995, 2005; Qin et al., 2018).
Our results compare well with those from other chemical systems studied in the corrosion field, in particular in sulfide-rich systems, in which greigite, instead of magnetite, becomes a main product of the anoxic corrosion of carbon steel (Robineau et al., 2021). Importantly, we also show here that the peculiar electronic structure of mackinawite yields a direct pathway to anoxic corrosion of Fe(II) to Fe(III) by protons at room temperature under acidic conditions, while the Schikorr reaction, starting from hydroxylated ferrous species, operates under neutral or alkaline conditions at a temperature higher than 80 °C (Schikorr, 1929, 1933; Evans and Wanklyn, 1948; Reardon, 1995, 2005; Beverskog and Puigdomenech, 1996; Schauzer and Guth, 1977; Ma et al., 2013). In this regard, it is noteworthy that FeS layered structures are actively explored as potential candidates for HER (Zhou et al., 2019; Wang et al., 2020; Senthamaraikannan et al., 2025).
From these perspectives, our results would suggest that nanocrystalline mackinawite would behave in a strictly anoxic system like a metallic compound that could be corroded by H+. This assumption is supported by the shift observed in the S K pre-edge of nanocrystalline mackinawite compared to that of the FeS compound of S(-II) formal valence. In addition, such a corrosion pathway of mackinawite, comparable to that of Fe(0), is also supported by the conclusion of Kwon et al. (2011), who proposed, on the basis of Fe L2,3-edges XAS measurements, that Fe 3d electrons in mackinawite are delocalized, as in metallic iron.
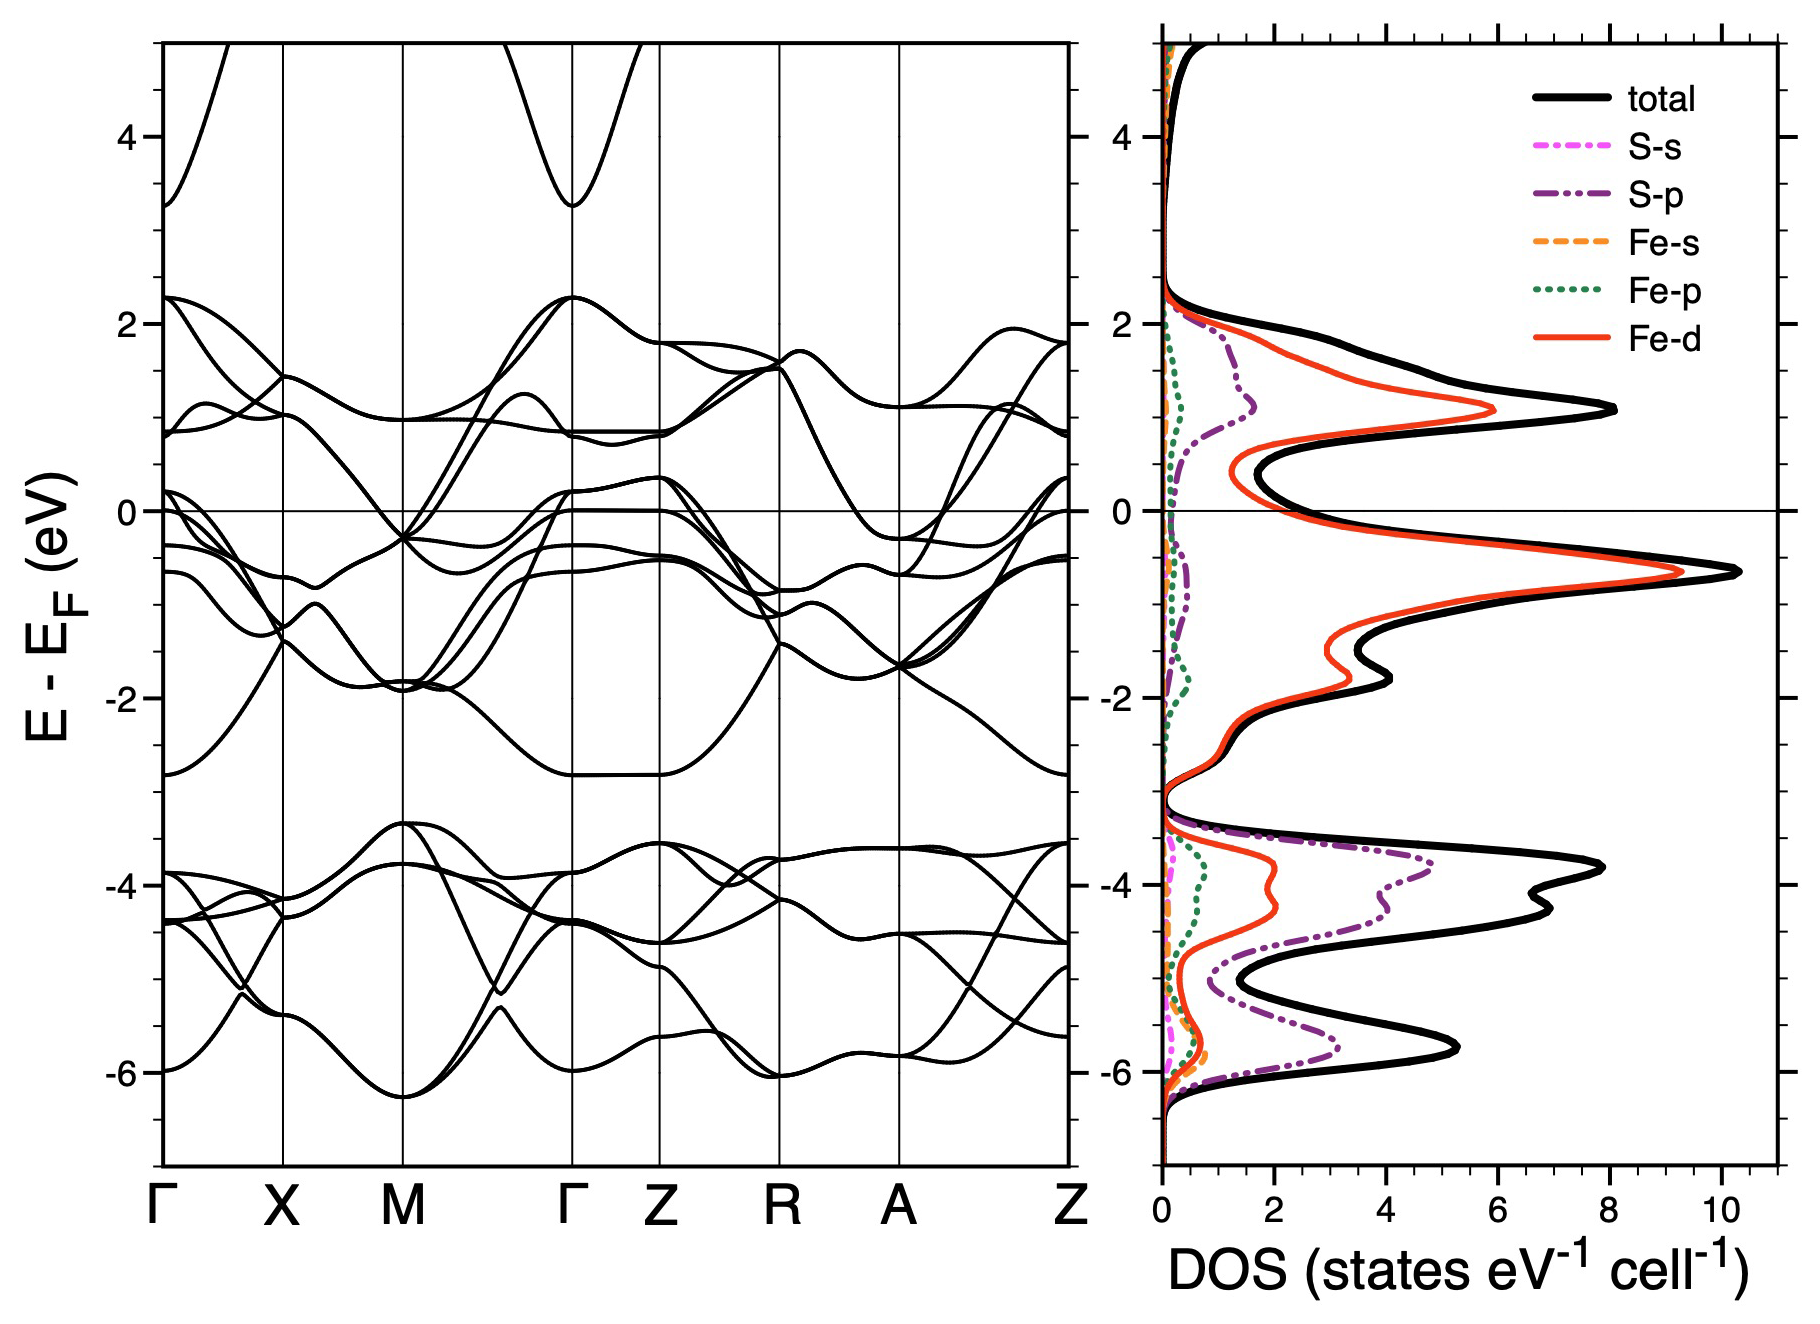
Figure 7Left panel: non-magnetic GGA-PBE band structure of FeS using the crystallographical data of Table 2 as inputs for FeS structure. Right panel: corresponding total, Fe, and S projected densities of states.
In Fig. 7, we report the non-magnetic GGA-PBE band structure of mackinawite calculated with our mackinawite crystallographic parameters. This figure shows a clear energy separation between low-lying bands derived from the S-3p states, located between 6 and 4 eV below the Fermi level and the network of higher-lying, partly filled Fe-3d bands, extending over 4.5 eV around the Fermi level. The metallic character of mackinawite arising at this level of theory is consistent with early non-magnetic DFT calculations (Welz and Rosenburg, 1987) and proved, more recently, to be a fairly stable feature of FeS in more advanced approaches accounting for spin polarization (Kwon et al., 2011) or local electron–electron correlations (Tresca et al., 2017). Note that the Fe-3d states dominating the first unoccupied electronic bands in FeS are indirectly probed in the S K-edge XANES spectra through their hybridization with the more delocalized S-3p states (see right panel of Fig. 7) and give rise to the first intense pre-edge peak visible in the experimental and theoretical spectra. This global picture of FeS therefore supports the fact that electrons are mostly given by Fe(II) and enforces the idea that Fe(II) can be oxidized to Fe(III) by H+ without implying S(-II) oxidation (Eq. 1), at least at the bulk mackinawite structure level. This could have implications for our understanding of the initial steps of the H2S pathway to pyrite initially proposed by Rickard and Luther (1997). Hence, one may infer from Eq. (1) that, in our experimental setup, adding more drop-by-drop H+ could possibly transform all FeS into Fe3S4. A question remaining is whether the addition of more H+ to Fe3S4 would result in its further transformation by corrosion into another mineral, for instance, pyrite FeS2, in which Fe is Fe(II) and S is S(-I). In line with this hypothesis, the reaction could be described with Eq. (2):
Equations (1) and (2) would then lead to the net reaction:
which exhibits some similarities with the reported net reaction of the H2S pathway to pyrite (Rickard and Luther, 1997).
Further research is needed to confirm whether pyrite could actually form via Eq. (6), particularly at ambient temperature, depending on the ability of greigite to be oxidized by H+ (Zhang et al., 2012) or to stand as the final end product under such anoxic conditions.
The greigite formation pathway derived from our observations, which likely proceeds via FeS corrosion associated with iron release in the solution, actually differs from the one generally proposed, for instance, by Hunger and Benning (2007). These authors invoke greigite precipitation from FeS in the presence of zero-valent sulfur (i.e., via the polysulfide pathway) under sulfur-limited conditions. In our study, the electronic band structure of mackinawite supports the fact that Fe atoms are the first to be oxidized before S atoms may eventually produce S(0) S, for instance, via oxidation of S(-II) by excess Fe(III) in greigite domains. From an environmental point of view, the evidence we provide here for the production of greigite from mackinawite under strongly reducing and strictly anoxic conditions, likely by oxidizing Fe(II) atoms of FeS first through the corrosion pathway, calls for further investigations regarding the production of this mineral in sedimentary environments. This idea echoes the recent findings by Turney et al. (2023) suggesting that micro-environments may be important for greigite formation and persistence in natural media (Lacroix et al., 2023). In particular, the possibility of existing acidic micro-environments in sediments subjected to active early diagenesis should be further examined in natural sediments. Finally, the fact that nanocrystalline mackinawite could be oxidized without an oxidizing agent other than water via the present corrosion pathway could have possible implications for (1) iron cycling through the release of Fe(II) in the local medium and (2) iron isotopic fractionation during transformation of low-spin tetrahedral Fe(II) mackinawite into high-spin greigite, thus possibly impacting the Fe isotope signature of deposited sedimentary archives. Additionally, the putative H2 production at a low temperature that is suggested from this reaction could feed specific bacterial metabolisms (Ortiz et al., 2002; Thiel et al., 2019) that would exert a significant control on both Fe and S biogeochemical cycles, as already shown in the process of biocorrosion (e.g., Xu et al., 2016).
Data can be made available upon request.
The supplement related to this article is available online at https://doi.org/10.5194/ejm-38-135-2026-supplement.
PLP conceptualized the research, designed the experiments, collected the data (XAS and XRD), performed the data processing, and wrote the original paper. BB collected the XRD and X-ray scattering PDF data, performed data processing, and reviewed and edited the paper. GR and DC performed the DFT analyses and reviewed and edited the paper. JA reviewed and edited the paper. JB participated in the mineral syntheses. CB participated in the synchrotron-based XAS and XRD experiments. EE participated in the synchrotron-based XRD and X-ray scattering experiments. GON and FJ provided the spectra of reference compounds at the Fe and S K-edges and reviewed and edited the paper. GM participated in the conceptualization of the research and in the XRD–Rietveld data processing and analysis and reviewed and edited the paper.
The contact author has declared that none of the authors has any competing interests.
Publisher's note: Copernicus Publications remains neutral with regard to jurisdictional claims made in the text, published maps, institutional affiliations, or any other geographical representation in this paper. The authors bear the ultimate responsibility for providing appropriate place names. Views expressed in the text are those of the authors and do not necessarily reflect the views of the publisher.
SOLEIL synchrotron is acknowledged for having provided beamtime on the SAMBA and CRISTAL beamlines (BAG proposal no. 20181347). In particular, Gautier Landrot is acknowledged for his support at the SAMBA beamline. SSRL synchrotron is acknowledged for having provided beamtime on the 4-3 beamline. Use of the Stanford Synchrotron Radiation Lightsource, SLAC National Accelerator Laboratory, is supported by the US Department of Energy, Office of Science, Office of Basic Energy Sciences under contract no. DE-AC02-76SF00515. The authors thank M. Morand and Y. Garino for their significant work on improving the control program of the Rigaku rotating anode diffractometer used for XRF analysis. Colleagues of the IMPMC, Philippe Sainctavit and Marie-Anne Arrio, are acknowledged for the fruitful discussions about spectroscopic properties of iron sulfides, and François Guyot is acknowledged for the interesting discussions about iron sulfide formation pathways.
This paper was edited by Giovanni De Giudici and reviewed by three anonymous referees.
Arrio, M.-A., Rossano, S., Brouder, Ch., Galoisy, L., and Calas, G.: Calculation of multipole transitions at the Fe K pre-edge through p-d hybridization in the Ligand Field Multiplet model, Europhys. Lett., 51, 454, https://doi.org/10.1209/epl/i2000-00515-8, 2000.
Bai, P., Zheng, S., Chen, C., and Zhao, H.: Investigation of the iron-sulfide phase transformation in nanoscale, Cryst. Growth Des., 14, 4295–4302, https://doi.org/10.1021/cg500333p, 2014.
Baya, C., Le Pape, P., Baptiste, B., Brest, J., Landrot, G., Elkaim, E., Noël, V., Blanchard, M., Ona-Nguema, G., Juillot, F., and Morin, G.: Influence of trace level As or Ni on pyrite formation kinetics at low temperature, Geochim. Cosmochim. Acta, 300, 333–353, https://doi.org/10.1016/j.gca.2021.01.042, 2021.
Benning, L. G., Wilkin, R. T., and Barnes, H. L.: Reaction pathways in the Fe-S system below 100 °C, Chem. Geol., 167, 25–51, https://doi.org/10.1016/S0009-2541(99)00198-9, 2000.
Berar, J. F. and Baldinozzi, G.: XND code: From X-ray laboratory data to incommensurately modulated phases. Rietveld modeling of complex materials, CPD Newsletter, 20, 3–5, 1998.
Berner, R. A.: Sedimentary pyrite formation, Am. J. Sci., 268, 1 LP – 23, https://doi.org/10.2475/ajs.268.1.1, 1970.
Berner, R. A.: Sedimentary pyrite formation: An update, Geochim. Cosmochim. Acta, 48, 605–615, https://doi.org/10.1016/0016-7037(84)90089-9, 1984.
Beverskog, B. and Puidomenech, I.: Revised pourbaix diagrams for iron at 25–300 °C, Corrosion Science, 38, 2121–2135, 1996.
Bourdelle, F., Mosser-Ruck, R., Truche, L., Lorgeoux, C., Pignatelli, I., and Michau, N.: A new view on iron-claystone interactions under hydrothermal conditions (90 °C) by monitoring in situ pH evolution and H2 generation, Chem. Geol., 466, 600–607, https://doi.org/10.1016/j.chemgeo.2017.07.009, 2017.
Bourdoiseau, J. A., Jeannin, M., Rémazeilles, C., Sabot, R., and Refait, P.: The transformation of mackinawite into greigite studied by Raman spectroscopy, J. Raman Spectrosc., 42, 496–504, https://doi.org/10.1002/jrs.2729, 2011.
Boursiquot, S., Mullet, M., Abdelmoula, M., Génin, J. M., and Ehrhardt, J. J.: The dry oxidation of tetragonal FeS1-x mackinawite, Phys. Chem. Miner., 28, 600–611, https://doi.org/10.1007/s002690100193, 2001.
Brgoch, J. and Miller, G. J.: Validation of Interstitial Iron and Consequences of Nonstoichiometry in Mackinawite (Fe 1+x S), https://doi.org/10.1021/jp206992z, 2012.
Bunău, O. and Calandra, M.: Projector augmented wave calculation of x-ray absorption spectra at the 2,3 edges, Phys. Rev. B, 87, 205105, https://doi.org/10.1103/PhysRevB.87.205105, 2013.
Cabán-Acevedo, M., Kaiser, N. S., English, C. R., Liang, D., Thompson, B. J., Chen, H. E., Czech, K. J., Wright, J. C., Hamers, R. J., and Jin, S.: Ionization of high-density deep donor defect states explains the low photovoltage of iron pyrite single crystals, J. Am. Chem. Soc., 136, 17163–17179, https://doi.org/10.1021/ja509142w, 2014.
Cheng, D., Neumann, A., Yuan, S., Liao, W., and Qian, A.: Oxidative Degradation of Organic Contaminants by FeS in the Presence of O2, Environ. Sci. Technol., 54, 4091–4101, https://doi.org/10.1021/acs.est.9b07012, 2020.
Cornwell, J. C. and Morse, J. W.: The characterization of iron sulfide minerals in anoxic marine sediments, Mar. Chem., 22, 193–206, https://doi.org/10.1016/0304-4203(87)90008-9, 1987.
Csákberényi-Malasics, D., Rodriguez-Blanco, J. D., Kis, V. K., Rečnik, A., Benning, L. G., and Pósfai, M.: Structural properties and transformations of precipitated FeS, Chem. Geol., 294–295, 249–258, https://doi.org/10.1016/j.chemgeo.2011.12.009, 2012.
Dal Corso, A.: Pseudopotentials periodic table: From H to Pu, Computational Materials Science, 95, 337–350, 2014.
de Clermont Gallerande, E., Cabaret, D., Lelong, G., Brouder, C., Attaiaa, M.-B., Paulatto, L., Gilmore, K., Sahle, C. J., and Radtke, G.: First-principles modeling of x-ray Raman scattering spectra, Phys. Rev. B, 98, 214104, https://doi.org/10.1103/PhysRevB.98.214104, 2018.
Dzade, N. Y., Roldan, A., and de Leeuw, N. H.: Activation and dissociation of CO2 on the (001), (011), and (111) surfaces of mackinawite (FeS): A dispersion-corrected DFT study, J. Chem. Phys., 143, 94703, https://doi.org/10.1063/1.4929470, 2015.
Egami, T. and Billinge, S. J.: Underneath the Bragg peaks: structural analysis of complex materials, vol. 16, Elsevier, Hardback ISBN 9780080971339, eBook ISBN 9780080971414, 2003.
Emmings, J. F., Poulton, S. W., Walsh, J., Leeming, K. A., Ross, I., and Peters, S. E.: Pyrite mega-analysis reveals modes of anoxia through geological time, Sci. Adv., 8, 1–16, https://doi.org/10.1126/sciadv.abj5687, 2022.
Evans, U. R. and Wanklyn, J. N.: Evolution of Hydrogen from Ferrous Hydroxide, Nature 3, 27–28, https://doi.org/10.1038/162027b0, 1948.
Farrell, S. P., Fleet, M. E., Stekhin, I. E., Kravtsova, A., Soldatov, A. V, and Liu, X.: Evolution of local electronic structure in alabandite and niningerite solid solutions [(Mn,Fe)S, (Mg,Mn)S, (Mg,Fe)S] using sulfur K- and L-edge XANES spectroscopy, Am. Mineral., 87, 1321–1332, https://doi.org/10.2138/am-2002-1007, 2002.
Farrow, C. L. and Billinge, S. J.: Relationship between the atomic pair distribution function and small-angle scattering: implications for modeling of nanoparticles, Acta Crystallogr. A, 65, 232–239, https://doi.org/10.1107/S0108767309009714, 2009.
Farrow, C. L., Juhas, P., Liu, J. W., Bryndin, D., Božin, E. S., Bloch, J., Proffen, T., and Billinge, S. J. L.: PDFfit2 and PDFgui: computer programs for studying nanostructure in crystals, J. Phys. Condens. Matter, 19, 335219, https://doi.org/10.1088/0953-8984/19/33/335219, 2007.
Filip, J., Karlický, F., Marušák, Z., Lazar, P., Černík, M., Otyepka, M., and Zbořil, R.: Anaerobic Reaction of Nanoscale Zerovalent Iron with Water: Mechanism and Kinetics, J. Phys. Chem. C, 118, 13817–13825, https://doi.org/10.1021/jp501846f, 2014.
Garrity, K. F., Bennett, J. W., Rabe, K. M., and Vanderbilt, D.: Pseudopotentials for high-throughput DFT calculations, Comput. Mater. Sci., 81, 446–452, https://doi.org/10.1016/j.commatsci.2013.08.053, 2014.
Giannozzi, P., Andreussi, O., Brumme, T., Bunau, O., Buongiorno Nardelli, M., Calandra, M., Car, R., Cavazzoni, C., Ceresoli, D., Cococcioni, M., Colonna, N., Carnimeo, I., Dal Corso, A., de Gironcoli, S., Delugas, P., DiStasio, R. A., Ferretti, A., Floris, A., Fratesi, G., Fugallo, G., Gebauer, R., Gerstmann, U., Giustino, F., Gorni, T., Jia, J., Kawamura, M., Ko, H.-Y., Kokalj, A., Küçükbenli, E., Lazzeri, M., Marsili, M., Marzari, N., Mauri, F., Nguyen, N. L., Nguyen, H.-V., Otero-de-la-Roza, A., Paulatto, L., Poncé, S., Rocca, D., Sabatini, R., Santra, B., Schlipf, M., Seitsonen, A. P., Smogunov, A., Timrov, I., Thonhauser, T., Umari, P., Vast, N., Wu, X., and Baroni, S.: Advanced capabilities for materials modelling with Quantum ESPRESSO, J. Phys. Condens. Matter, 29, 465901, https://doi.org/10.1088/1361-648X/aa8f79, 2017.
Gorlas, A., Mariotte, T., Morey, L., Truong, C., Bernard, S., Guigner, J.-M., Oberto, J., Baudin, F., Landrot, G., Baya, C., Le Pape, P., Morin, G., Forterre, P., and Guyot, F.: Precipitation of greigite and pyrite induced by Thermococcales: an advantage to live in Fe- and S-rich environments?, Environ Microbiol, 24, 626–642, https://doi.org/10.1111/1462-2920.15915, 2022.
Gougoussis, C., Calandra, M., Seitsonen, A. P., and Mauri, F.: First-principles calculations of x-ray absorption in a scheme based on ultrasoft pseudopotentials: From -quartz to high-T compounds, Phys. Rev. B, 80, 75102, https://doi.org/10.1103/PhysRevB.80.075102, 2009.
Hunger, S. and Benning, L. G.: Greigite: A true intermediate on the polysulfide pathway to pyrite, Geochem. Trans., 8, 1–20, https://doi.org/10.1186/1467-4866-8-1, 2007.
Ikogou, M., Ona-Nguema, G., Juillot, F., Le Pape, P., Menguy, N., Richeux, N., Guigner, J.-M., Noel, V., Brest, J., Baptiste, B., and Morin, G.: Long-term sequestration of nickel in mackinawite formed by Desulfovibrio capillatus upon Fe(III)-citrate reduction in the rpesence of thiosulfate, App. Geochem., 80, 143–154, https://doi.org/10.1016/j.apgeochem.2017.02.019, 2017.
Jeong, H. Y., Lee, J. H., and Hayes, K. F.: Characterization of synthetic nanocrystalline mackinawite: Crystal structure, particle size, and specific surface area, Geochim. Cosmochim. Acta, 72, 493–505, https://doi.org/10.1016/j.gca.2007.11.008, 2008.
Juhás, P., Davis, T., Farrow, C. L., and Billinge, S. J. L.: PDFgetX3: a rapid and highly automatable program for processing powder diffraction data into total scattering pair distribution functions, J. Appl. Crystallogr., 46, 560–566, https://doi.org/10.1107/S0021889813005190, 2013.
Koonin, E. V. and Martin, W.: On the origin of genomes and cells within inorganic compartments, Trends Genet., 21, 647–654, https://doi.org/10.1016/j.tig.2005.09.006, 2005.
Kwon, K. D., Refson, K., Bone, S., Qiao, R., Yang, W., Liu, Z., and Sposito, G.: Magnetic ordering in tetragonal FeS: Evidence for strong itinerant spin fluctuations, Phys. Rev. B, 83, 64402, https://doi.org/10.1103/PhysRevB.83.064402, 2011.
Lacroix, E. M., Aeppli, M., Boye, K., Brodie, E., Fendorf, S., Keiluweit, M., Naughton, H. R., Noël, V., and Sihi, D.: Consider the Anoxic Microsite: Acknowledging and Appreciating Spatiotemporal Redox Heterogeneity in Soils and Sediments, ACS Earth Sp. Chem., 7, 1592–1609, https://doi.org/10.1021/acsearthspacechem.3c00032, 2023.
Lantenois, S., Lanson, B., Muller, F., Bauer, A., Jullien, M., and Plançon, A.: Experimental study of smectite interaction with metal fe at low temperature: 1. smectite destabilization, Clays Clay Miner., 53, 597–612, https://doi.org/10.1346/CCMN.2005.0530606, 2005.
Lelong, G., Radtke, G., Cormier, L., Bricha, H., Rueff, J.-P., Ablett, J. M., Cabaret, D., Gélébart, F., and Shukla, A.: Detecting Non-bridging Oxygens: Non-Resonant Inelastic X-ray Scattering in Crystalline Lithium Borates, Inorg. Chem., 53, 10903–10908, https://doi.org/10.1021/ic501730q, 2014.
Lennie, A. R., Redfern, S. A. T., Schofield, P. F., and Vaughan, D. J.: Synthesis and Rietveld crystal structure refinement of mackinawite, tetragonal FeS, Mineralogical Mag., 59, 677–683, https://doi.org/10.1180/minmag.1995.059.397.10, 1995.
Lennie, A. R., Redfern, S. A. T., Champness, P. E., Stoddart, C. P., Schofield, P. F., and Vaughan, D. J.: Transformation of mackinawite to greigite: An in situ X-ray powder diffraction and transmission electron microscope study, Am. Mineral., 82, 302–309, https://doi.org/10.2138/am-1997-3-408, 1997.
Lin, M.-Y., Chen, Y.-H., Lee, J.-J., and Sheu, H.-S.: Reaction pathways of iron-sulfide mineral formation: an in situ X-ray diffraction study, Eur. J. Mineral., 30, 77–84, https://doi.org/10.1127/ejm/2017/0029-2681, 2018.
Ma, M., Zhang, Y., Guo Z., and Ning, Gu.: Facile synthesis of ultrathin magnetic iron oxide nanoplates by Schikorr reaction, Nanoscale Research Letters, 8, 16, https://doi.org/10.1186/1556-276X-8-16, 2013.
Matamoros-Veloza, A., Cespedes, O., Johnson, B. R. G., Stawski, T. M., Terranova, U., de Leeuw, N. H., and Benning, L. G.: A highly reactive precursor in the iron sulfide system, Nat. Commun., 9, https://doi.org/10.1038/s41467-018-05493-x, 2018a.
Matamoros-Veloza, A., Stawski, T. M., and Benning, L. G.: Nanoparticle Assembly Leads to Mackinawite Formation, Cryst. Growth Des., 18, 6757–6764, https://doi.org/10.1021/acs.cgd.8b01025, 2018b.
Michel, F. M., Antao, S. M., Chupas, P. J., Lee, P. L., Parise, J. B., and Schoonen, M. A. A.: Short- To medium-range atomic order and crystallite size of the initial FeS precipitate from pair distribution function analysis, Chem. Mater., 17, 6246–6255, https://doi.org/10.1021/cm050886b, 2005.
Mielke, R. E., Robinson, K. J., White, L. M., McGlynn, S. E., McEachern, K., Bhartia, R., Kanik, I., and Russell, M. J.: Iron-sulfide-bearing chimneys as potential catalytic energy traps at life's emergence, Astrobiology, 11, 933–950, https://doi.org/10.1089/ast.2011.0667, 2011.
Mukherjee, I., Large, R. R., Bull, S., Gregory, D. G., Stepanov, A. S., Ávila, J., Ireland, T. R., and Corkrey, R.: Pyrite trace-element and sulfur isotope geochemistry of paleo-mesoproterozoic McArthur Basin: Proxy for oxidative weathering, Am. Mineral., 104, 1256–1272, https://doi.org/10.2138/am-2019-6873, 2019.
Muñoz-Santiburcio, D., Wittekindt, C., and Marx, D.: Nanoconfinement effects on hydrated excess protons in layered materials, Nat. Commun., 4, 2349, https://doi.org/10.1038/ncomms3349, 2013.
Noël, V., Kumar, N., Boye, K., Barragan, L., Lezama-Pacheco, J. S., Chu, R., Tolic, N., Brown, G. E., and Bargar, J. R.: FeS colloids – formation and mobilization pathways in natural waters, Environ. Sci. Nano, 7, 2102–2116, https://doi.org/10.1039/C9EN01427F, 2020.
Ohfuji, H. and Rickard, D.: High resolution transmission electron microscopic study of synthetic nanocrystalline mackinawite, Earth Planet. Sci. Lett., 241, 227–233, https://doi.org/10.1016/j.epsl.2005.10.006, 2006.
Ortiz, L.,Volckaert, G., and Mallants, D.: Gas generation and migration in Boom Clay, a potential host rock formation for nuclear waste storage, Engineering Geology, 64, 287–296, https://doi.org/10.1016/S0013-7952(01)00107-7, 2002.
Pattrick, R. A. D., Coker, V. S., Akhtar, M., Malik, M. A., Lewis, E., Haigh, S., O'Brien, P., Shafer, P. C., and van der Laan, G.: Magnetic spectroscopy of nanoparticulate greigite, Fe3S4, Mineral. Mag., 81, 857–872, https://doi.org/10.1180/minmag.2016.080.114, 2017.
Peiffer, S., Behrends, T., Hellige, K., Larese-Casanova, P., Wan, M., and Pollok, K.: Pyrite formation and mineral transformation pathways upon sulfidation of ferric hydroxides depend on mineral type and sulfide concentration, Chem. Geol., 400, 44–55, https://doi.org/10.1016/j.chemgeo.2015.01.023, 2015.
Perdew, J. P., Burke, K., and Ernzerhof, M.: Generalized Gradient Approximation Made Simple, Phys. Rev. Lett., 77, 3865–3868, https://doi.org/10.1103/PhysRevLett.77.3865, 1996.
Picard, A., Gartman, A., Clarke, D. R., and Girguis, P. R.: Sulfate-reducing bacteria influence the nucleation and growth of mackinawite and greigite, Geochim. Cosmochim. Acta, 220, 367–384, https://doi.org/10.1016/j.gca.2017.10.006, 2018.
Picard, A., Gartman, A., Cosmidis, J., Obst, M., Vidoudez, C., Clarke, D. R., and Girguis, P. R.: Authigenic metastable iron sulfide minerals preserve microbial organic carbon in anoxic environments, Chem. Geol., 530, 119343, https://doi.org/10.1016/j.chemgeo.2019.119343, 2019.
Pósfai, M., Buseck, P. R., Bazylinski, D. A., and Frankel, R. B.: Reaction sequence of iron sulfide minerals in bacteria and their use as biomarkers, Science, 280, 880–883, https://doi.org/10.1126/science.280.5365.880, 1998.
Qin, H., Guan, X., Bandstra, J. Z., Johnson, R. L., and Tratnyek, P., G.: Modeling the Kinetics of Hydrogen Formation by Zerovalent Iron: Effects of Sulfidation on Micro- and Nano-Scale Particles, Environ. Sci. Technol., 52, 13887–13896, https://doi.org/10.1021/acs.est.8b04436, 2018.
Ravel, B. and Newville, M.: ATHENA, ARTEMIS, HEPHAESTUS: data analysis for X-ray absorption spectroscopy using IFEFFIT, J. Synchrotron Radiat., 12, 537–541, https://doi.org/10.1107/S0909049505012719, 2005.
Reardon, E. J.: Anaerobic Corrosion of Granular Iron: Measurement and Interpretation of Hydrogen Evolution Rates, Environ. Sci. Technol., 29, 2936–2945, https://doi.org/10.1021/es00012a008, 1995.
Reardon, E. J.: Zerovalent Irons: Styles of Corrosion and Inorganic Control on Hydrogen Pressure Buildup, Environ. Sci. Technol., 39, 7311–7317, https://doi.org/10.1021/es050507f, 2005.
Rickard, D.: Sulfidic sediments and sedimentary rocks, Developments in sedimentology, volume 65, 1–801, https://doi.org/10.1016/B978-0-444-52989-3.00002-x, 2012.
Rickard, D. and Luther, W. L.: Kinetics of pyrite formation by the H2S oxidation of iron (II) monosulfide in aqueous solutions between 25 and 125 °C: The rate equation, Geochim. Cosmochim. Acta, 61, 115–134, https://doi.org/10.1016/s0016-7037(96)00321-3, 1997.
Rickard, D. and Luther, G. W.: Chemistry of Iron Sulfides, Chem. Rev., 107, 514–562, https://doi.org/10.1021/cr0503658, 2007.
Rickard, D. and Morse, J. W.: Acid volatile sulfide (AVS), Mar. Chem., 97, 141–197, https://doi.org/10.1016/j.marchem.2005.08.004, 2005.
Rickard, D., Butler, I. B., and Oldroyd, A.: A novel iron sulphide mineral switch and its implications for earth and planetary science, Earth Planet. Sc. Lett., 189, 85–91, https://doi.org/10.1016/S0012-821X(01)00352-1, 2001.
Roberts, A. P.: Magnetic properties of sedimentary greigite (Fe3S4), Earth Planet. Sc. Lett., 134, 227–236, https://doi.org/10.1016/0012-821X(95)00131-U, 1995.
Roberts, A. P., Chang, L., Rowan, C. J., Horng, C.-S., and Florindo, F.: Magnetic properties of sedimentary greigite (Fe3S4): An update, Rev. Geophys., 49, https://doi.org/10.1029/2010RG000336, 2011.
Robineau, M., Deydier, V., Crusset, D., Bellefleur, A., Neff, D., Vega, E., Sabo, R., Jeannin, M., and Refait P.: Formation of Iron Sulfides on Carbon Steel in a Specific Cement Grout Designed for Radioactive Waste Repository and Associated Corrosion Mechanisms, Materials, 14, 3563, https://doi.org/10.3390/ma14133563, 2021.
Roldan, A. and De Leeuw, N. H.: Catalytic water dissociation by greigite Fe3S4 surfaces: Density functional theory study, Proc. R. Soc. A Math. Phys. Eng. Sci., 472, 20160080, https://doi.org/10.1098/rspa.2016.0080, 2016.
Santos-Carballal, D., Roldan, A., Dzade, N. Y., and De Leeuw, N. H.: Reactivity of CO2 on the surfaces of magnetite (Fe3O4), greigite (Fe3S4) and mackinawite (FeS), Philos. Trans. R. Soc. A Math. Phys. Eng. Sci., 376, 20170065, https://doi.org/10.1098/rsta.2017.0065, 2018.
Schauzer, G. N. and Guth, T. D.: Photolysis of water and photoreduction on titanium dioxide, J. Am. Chem. Soc., 99, 7189–7193, https://doi.org/10.1021/ja00464a015, 1977.
Schikorr, G.: Über die Reaktionen zwischen Eisen, Seinen Hydroxyden und Wasser, Zeitschrift für Elektrochemie und angewandte physikalische Chemie, 35, 65–70, https://doi.org/10.1002/bbpc.19290350204, 1929.
Schikorr, G.: Über das Rosten des Eisens bei Sauerstoffüberschuss, Zeitschrift für Elektrochemie und angewandte physikalische Chemie, 39, 409–414, https://doi.org/10.1002/bbpc.19330397102, 1933.
Schlegel, M. L., Martin, C., Brucker, F., Bataillon, C., Blanc, C., Chorro, M., and Jollivet, P.: Alteration of nuclear glass in contact with iron and claystone at 90 °C under anoxic conditions: Characterization of the alteration producs after two years of interaction, Applied Geochemistry, 70, 27–42, https://doi.org/10.1016/j.apgeochem.2016.04.009, 2016.
Schoonen, M. A. A.: Mechanisms of sedimentary pyrite formation, in: Special Paper of the Geological Society of America, vol. 379, edited by: Amend, J. P., Edwards, K. J., and Lyons, T. W., Geological Society of America, 117–134, https://doi.org/10.1130/0-8137-2379-5.117, 2004.
Schoonen, M. A. A. and Barnes, H. L.: Reactions forming pyrite and marcasite from solution: II. Via FeS precursors below 100 °C, Geochim. Cosmochim. Acta, 55, 1505–1514, https://doi.org/10.1016/0016-7037(91)90123-M, 1991.
Schoonen, M., Smirnov, A., and Cohn, C.: A perspective on the role of minerals in prebiotic synthesis, Ambio, 33, 539–551, https://doi.org/10.1579/0044-7447-33.8.539 , 2004.
Senthamaraikannan, T. G., Lim, D. H., and Han, Y. S.: First-principles investigation of hydrogen evolution reaction on doped 2D transition metal sulfides in mackinawite structures, International Journal of Hydrogen Energy, 97, 1461–1471, https://doi.org/10.1016/j.ijhydene.2024.12.014, 2025.
Smart, N. R., Reddy, B., Rance, A. P., Nixon, D. J., and Diomidis, N.: The anaerobic corrosion of carbon steel in saturated compacted bentonite in the Swiss repository concept. Corrosion Engineering, Science and Technology, 52, 113–126, https://doi.org/10.1080/1478422X.2017.1316088, 2017.
Solomon, E. I., Hedman, B., Hodgson, K. O., Dey, A., and Szilagyi, R. K.: Ligand K-edge X-ray absorption spectroscopy: covalency of ligand–metal bonds, Coord. Chem. Rev., 249, 97–129, https://doi.org/10.1016/j.ccr.2004.03.020, 2005.
Snyder, D. B. and Bish, D. L.: Quantitative analysis, Mineral. Soc. Am. Rev. Mineral., 20, 101–144, 1989.
Stanjek, H. and Schneider, J.: Anisotropic peak broadening analysis of a biogenic soil greigite (Fe3S4) with Rietveld analysis and single peak fitting, Am. Mineral., 85, 839–846, https://doi.org/10.2138/am-2000-5-626, 2000.
Taillefumier, M., Cabaret, D., Flank, A.-M., and Mauri, F.: X-ray absorption near-edge structure calculations with the pseudopotentials: Application to the K edge in diamond and -quartz, Phys. Rev. B, 66, 195107, https://doi.org/10.1103/PhysRevB.66.195107, 2002.
Terranova, U. and de Leeuw, N. H.: Structure and dynamics of water at the mackinawite (001) surface, J. Chem. Phys., 144, 94706, https://doi.org/10.1063/1.4942755, 2016.
Thiel, J., Byrne, J. M., Kappler, A., Schink, B., and Pester, M.: Pyrite formation from FeS and H2S is mediated through microbial redox activity, P. Natl. Acad. Sci. USA, 116, 6897–6902, https://doi.org/10.1073/pnas.1814412116, 2019.
Tresca, C., Giovannetti, G., Capone, M., and Profeta, G.: Electronic properties of superconducting FeS, Phys. Rev. B, 95, 205117, https://doi.org/10.1103/PhysRevB.95.205117, 2017.
Turney, J. N., Weiss, D., Muxworthy, A. R., and Fraser, A.: Greigite formation in aqueous solutions: Critical constraints into the role of iron and sulphur ratios, pH and Eh, and temperature using reaction pathway modelling, Chem. Geol., 635, 121618, https://doi.org/10.1016/j.chemgeo.2023.121618, 2023.
Vaughan, D. J. and Ridout, M. S.: Mossbauer studies of some minerals sulphide, J. Inorg. Nucl. Chem., 33, 741–746, 1971.
Vaughan, D. J. and Tossell, J. A.: Electronic structure of thiospinel minerals: results from MO calculations, Am. Mineral., 66, 1250–1253, 1981.
Wacey, D., Kilburn, M. R., Saunders, M., Cliff, J., and Brasier, M. D.: Microfossils of sulphur-metabolizing cells in 3.4-billion-year-old rocks of Western Australia, Nat. Geosci., 4, 698–702, https://doi.org/10.1038/ngeo1238, 2011.
Wächtershäuser, G.: Before enzymes and templates: theory of surface metabolism, Microbiol. Rev., 52, 452–484, https://doi.org/10.1128/mr.52.4.452-484.1988, 1988.
Wächtershäuser, G.: Life as We Don't Know It, Science, 289, 1307–1308, https://doi.org/10.1126/science.289.5483.1307, 2000.
Wang, L., Shan, Y., and Liu, L. : Enhancing hydrogen evolution reaction by strain engineering in free-standing doped FeS monolayer, Materials Chemistry and Physics, 239, 122046, https://doi.org/10.1016/j.matchemphys.2019.122046, 2020.
Welz, D. and Rosenburg, M.: Electronic band structure of tetrahedral iron sulphides, Journal of Physics C, 20, 3911–3924, https://doi.org/10.1088/0022-3719/20/25/018, 1987.
Wilkin, R. T. and Barnes, H. L.: Formation processes of framboidal pyrite, Geochim. Cosmochim. Acta, 61, 323–339, https://doi.org/10.1016/S0016-7037(96)00320-1, 1997.
Wolthers, M., Van Der Gaast, S. J., and Rickard, D.: The structure of disordered mackinawite, Am. Mineral., 88, 2007–2015, https://doi.org/10.2138/am-2003-11-1245, 2003.
Xu, D., Li, Y., and Gu, T.: Mechanistic modeling of biocorrosion caused by biofilms of sulfate reducing bacteria and acid producing bacteria, Bioelectrochemistry, 110, 52–58, https://doi.org/10.1016/j.bioelechem.2016.03.003, 2016.
Xu, T., Senger, R., and Finsterle, S.: Corrosion-induced gas generation in a nuclear waste repository: Reactive geochemistry and multiphase flow effects, Applied Geochemistry, 23, 3423–3433, https://doi.org/10.1016/j.apgeochem.2008.07.012, 2008.
Young, R. A.: The Rietveld Method, International Union of Crystallography Monographs on Crystallography, Oxford Sci. Pub., IUCr, ISBN 0-19-855577-6, 1995.
Zhang, B., de Wijs, G. A., and de Groot, R. A.: Switchable Fermi surface sheets in greigite, Phys. Rev. B, 86, 20406, https://doi.org/10.1103/PhysRevB.86.020406, 2012.
Zhou, G., Shan, Y., Wang, L., Hu, Y., Guo, J., Hu, F., Shen, J., Gu, Y., Cui, J., Liu, L., and Wu, X.: Photoinduced semiconductor-metal transition in ultrathin troilite FeS nanosheets to trigger efficient hydrogen evolution, Nat. Commun., 10, 399, https://doi.org/10.1038/s41467-019-08358-z, 2019.