the Creative Commons Attribution 4.0 License.
the Creative Commons Attribution 4.0 License.
 | 16 Dec 2025
Analyzing trace element distribution and purification of vein quartz: a case study of Qianqi Furong mine in Inner Mongolia
Shaoyiqing Qu
Xiaoyong Yang
Mei Xia
Zhenhui Hou
Yicun Wang
Quartz is the most abundant mineral in the Earth's crust, and with the growing demand for advanced materials, high-purity quartz (HPQ) derived from natural quartz-bearing rocks has become increasingly important. This study investigates the raw material potential and economic feasibility of HPQ from the Hua Tuo (HT) and Peng Xin (PX) pegmatite mining areas in the Qianqi Furong mining district, Inner Mongolia, China. Petrographic observations, X-ray diffraction (XRD), laser ablation inductively coupled plasma mass spectrometry (LA-ICP-MS), and bulk-solution inductively coupled plasma mass spectrometry (ICP-MS) were employed to characterize quartz before and after processing. Purification of the raw ore was carried out through high-temperature calcination, crushing and sieving, magnetic separation, gravity separation, flotation, and acid leaching. The results show that both HT and PX vein quartz contain secondary phases and fluid inclusions. After beneficiation and chemical purification, SiO2 contents reach 99.963 wt %–99.970 wt % for HT and 99.974 wt %–99.985 wt % for PX. Total trace element concentrations decrease significantly, from 322.96 to 18.72 µg g−1 in HT quartz and from 4944.73 to 114.56 µg g−1 in PX quartz. Variations in Al, Ti, Li, and Ge suggest that the pegmatites likely originated from the same parental magma, with differences in intrusion conditions controlling their present characteristics. Although the HT pegmatite shows stronger magmatic features, the limited resource scale constrains the overall economic value. Nevertheless, the integrated development of multiple pegmatite bodies in the district may offer considerable industrial potential.
- Article
(11920 KB) - Full-text XML
- BibTeX
- EndNote


Quartz and other silicate minerals are among the most important rock-forming minerals, abundantly found in igneous rocks, metamorphic rocks, and sedimentary rocks (Götze, 2012). Due to their stable physical and chemical properties, widespread distribution, and ease of mining, these minerals have become essential raw materials for traditional industrial sectors such as metallurgy, glass production, construction, the chemical industry, and optics (Yang et al., 2022).
With the continuous advancements of science and technology, high-purity quartz (HPQ) has become an indispensable raw material for the production of high-value-added quartz products used in various high-tech industries, including semiconductors, communications, precision optics, and microelectronics (Shen, 2006; Haus et al., 2012; Wang et al., 2014). High-purity quartz is characterized by harmful trace elements present in quantities of less than 50 µg g−1 (Harben, 2002; Müller et al., 2007) and possesses significant economic value, with its price approximately 20 times higher than that of ordinary quartz raw materials (Müller et al., 2012, 2015; Wu et al., 2025). High-purity quartz is typically produced from natural quartz, which undergoes purification and processing to meet industrial quality standards. However, the global reserves of high-grade natural quartz are gradually declining, leading to increasing production costs and the depletion of available resources (Liu et al., 1996; Tian, 1999; Jin et al., 2004). Consequently, it has become increasingly important to explore alternative sources of raw materials, such as vein quartz, quartzite, and quartz sandstone.
The theoretical chemical composition of quartz is SiO2; however, pure SiO2 quartz does not occur in nature. Quartz in nature contains trace elements (such as Al, Ti, K, Na, and Ge), and its type and content are related to melt or fluid during crystallization, the external environment, and post-crystallization transformations (Yang et al., 2022). In the interior of the quartz crystal, the occurrence forms of trace elements include (from small to large by scale) lattice trace elements (lattice scale), nanoscale inclusions (<100 nm), submicron inclusions (100 nm–1 µm), and microscopic inclusions (>1 µm) (Götze, 2012; Müller et al., 2012). Therefore, the removal of impurities from ordinary quartz to meet the standards of HPQ is of particular importance. To this end, many scholars have conducted in-depth research on quartz purification technologies. Today, the quartz processing industry employs several purification methods, including magnetic separation, flotation, calcination, acid leaching, microwave treatment, and chlorination (Haßler et al., 2005; Wang et al., 2011; Haus et al., 2012; Lei et al., 2014). However, existing purification technologies cannot effectively remove all trace elements, meaning that the quality of quartz raw materials, specifically the trace element content of raw ore, determines whether it can be processed and purified into HPQ.
In this study, we studied two pegmatite mining areas, Hua Tuo (HT) and Peng Xin (PX), located in the same region. Optical microscopy, scanning electron microscopy (SEM), cathodoluminescence microscopy (CL), and X-ray diffraction (XRD) were employed to obtain detailed petrographic features and identify the types of impurities present in the quartz samples. Additionally, laser ablation inductively coupled plasma mass spectrometry (LA-ICP-MS), inductively coupled plasma mass spectrometry (ICP-MS), and several conventional purification techniques were utilized to investigate the formation mechanism and distribution of trace elements in quartz. The SiO2 content and impurity level in quartz raw ore play a vital role in its quality, purification potential, economic value, and possible applications. These factors will significantly affect the overall value of quartz raw materials, and the trace element index of purified quartz will determine the economic potential and future application scope of raw ore (Khan et al., 2025). The analysis aims to provide insights for subsequent purification and processing strategies, as well as guidance for future evaluations of the metallogenic potential of HPQ based on trace element characteristics. Finally, an economic evaluation of these two mining areas as HPQ deposits was conducted to promote the comprehensive utilization of ore and to enhance the economic benefits of the mining operation.
The early Precambrian basement of the North China Craton is divided into three primary regions: the eastern land block, the western land block, and the central orogenic belt. The western land block is further subdivided into the Ordos land block in the south and the Yinshan land block in the north, separated by the Khondalite Belt (Zhao et al., 1999, 2001, 2005, 2010). The study area is located west of Baotou city, Inner Mongolia, in the central part of the Khondalite Belt along the northern margin of the North China Craton (Fig. 1).
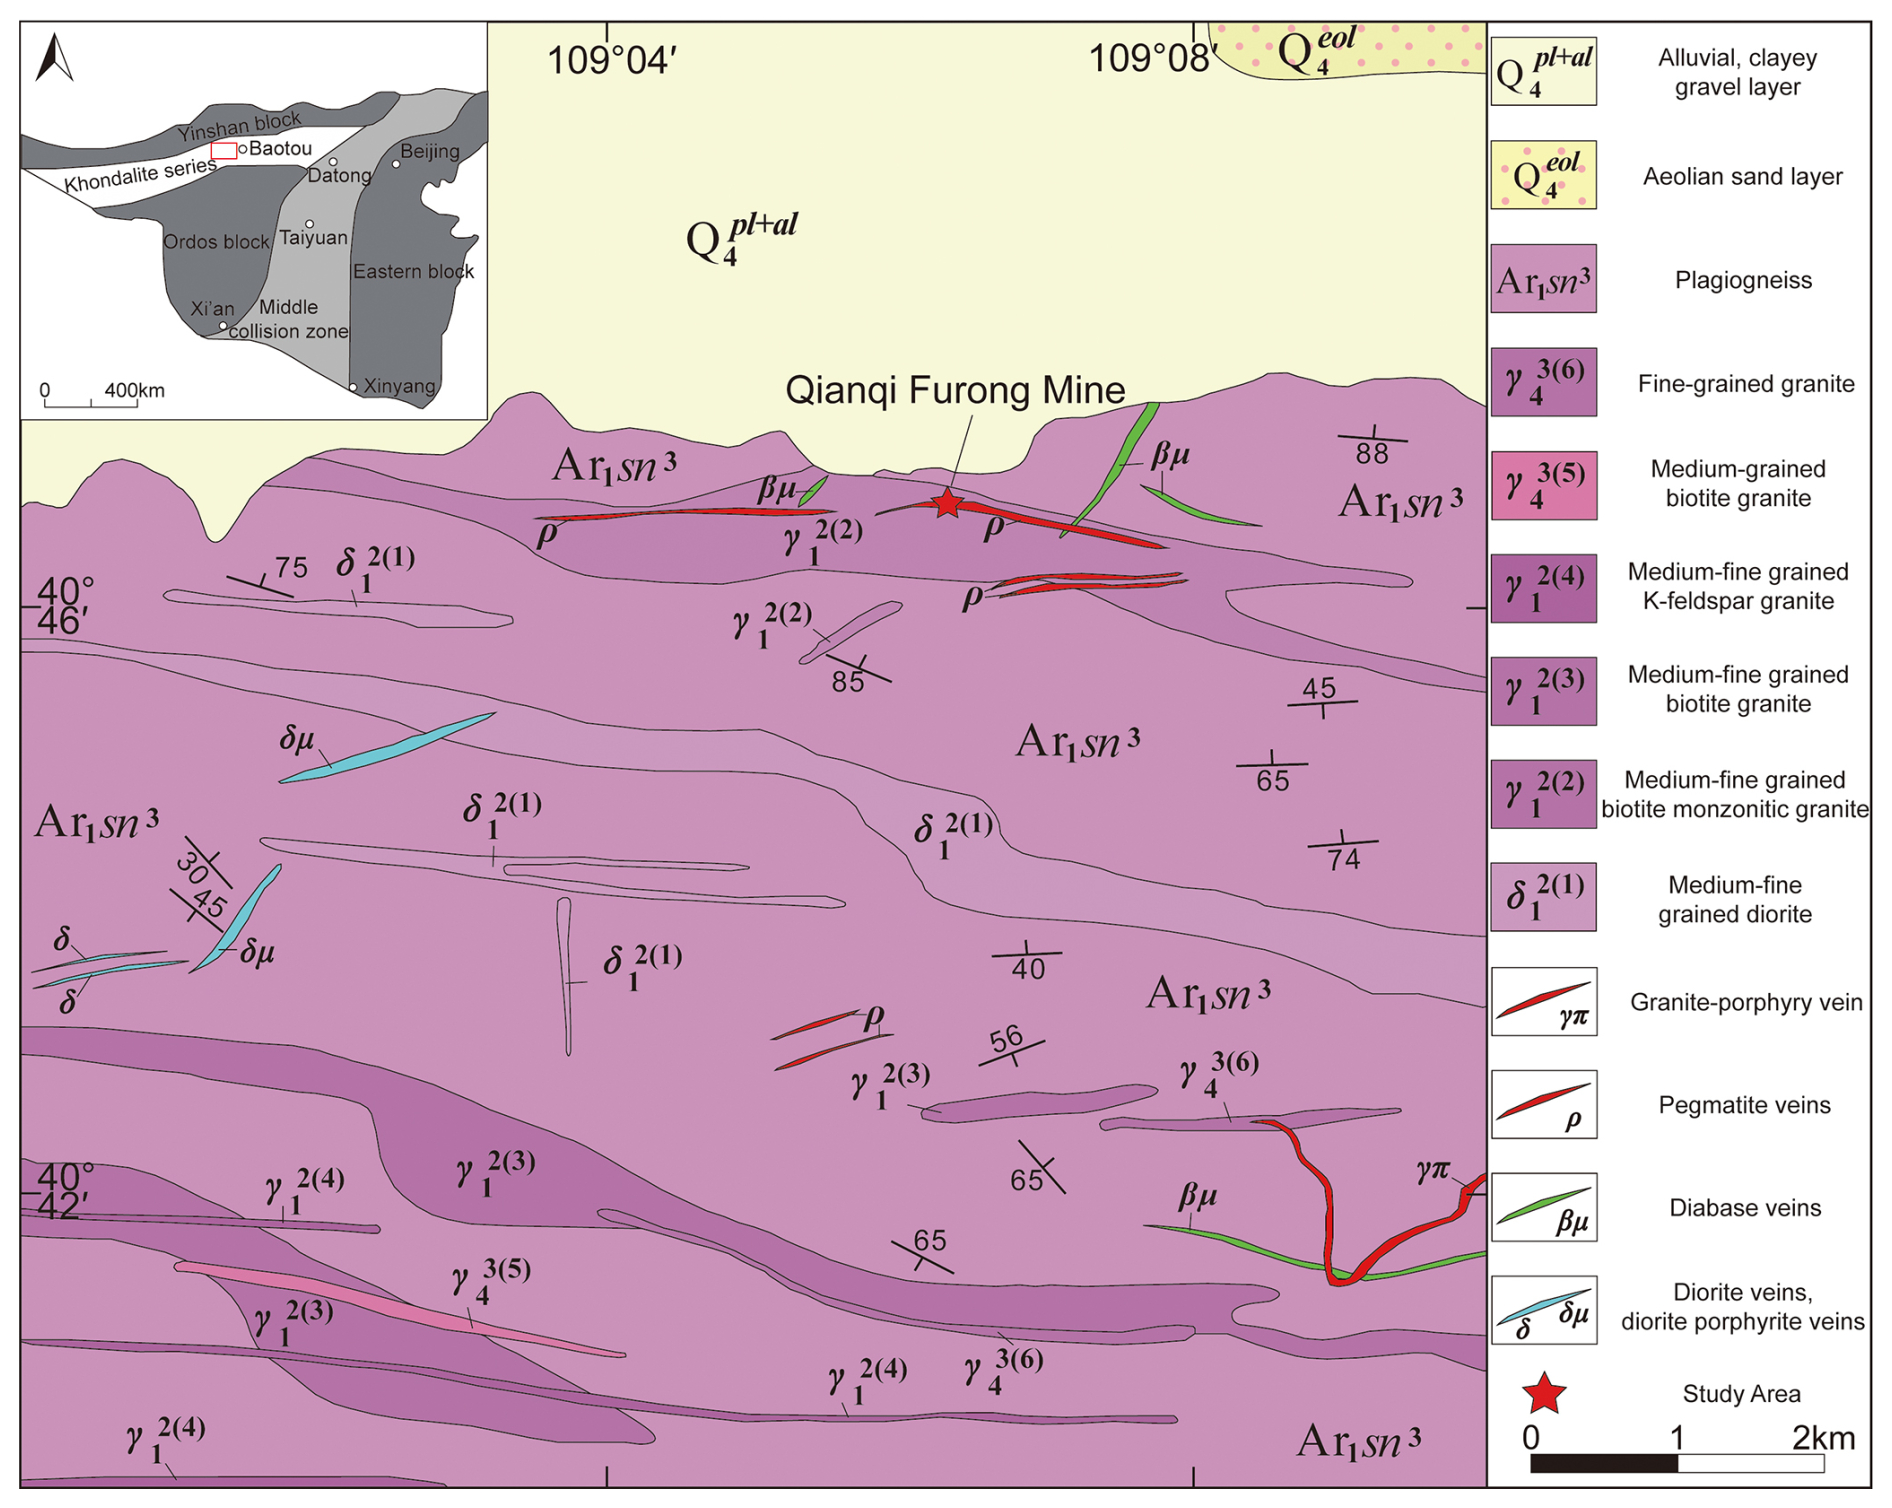
Figure 1Geological sketch map of the Qianqi Furong mine (modified from the Chinese Geological Archives: https://www.ngac.cn/125cms/c/qggnew/index.htm, last access: 7 April 2025).
The exposed rock strata in the study area consist of the Archean Sanggan Group, which occurs in irregular strips. The total exposed area is approximately 80 km2, and the predominant lithology is plagioclase gneiss, which includes migmatite and biotite-hornblende plagioclase gneiss. These rocks are interpreted as a suite of volcanic debris deposits formed along an active continental margin (Xu et al., 2001, 2002, 2005; Yang et al., 2000, 2003). Magmatic rocks of the same period are also exposed in the study area, including medium- to fine-grained gneissic diorite, gneissic biotite monzonitic granite, augen biotite granite, and K-feldspar granite. In addition, Late Variscan magmatic rocks, Quaternary sediments, and several pegmatite and diabase veins are also present. The Qianqi Furong mine is located in one of the pegmatite veins.
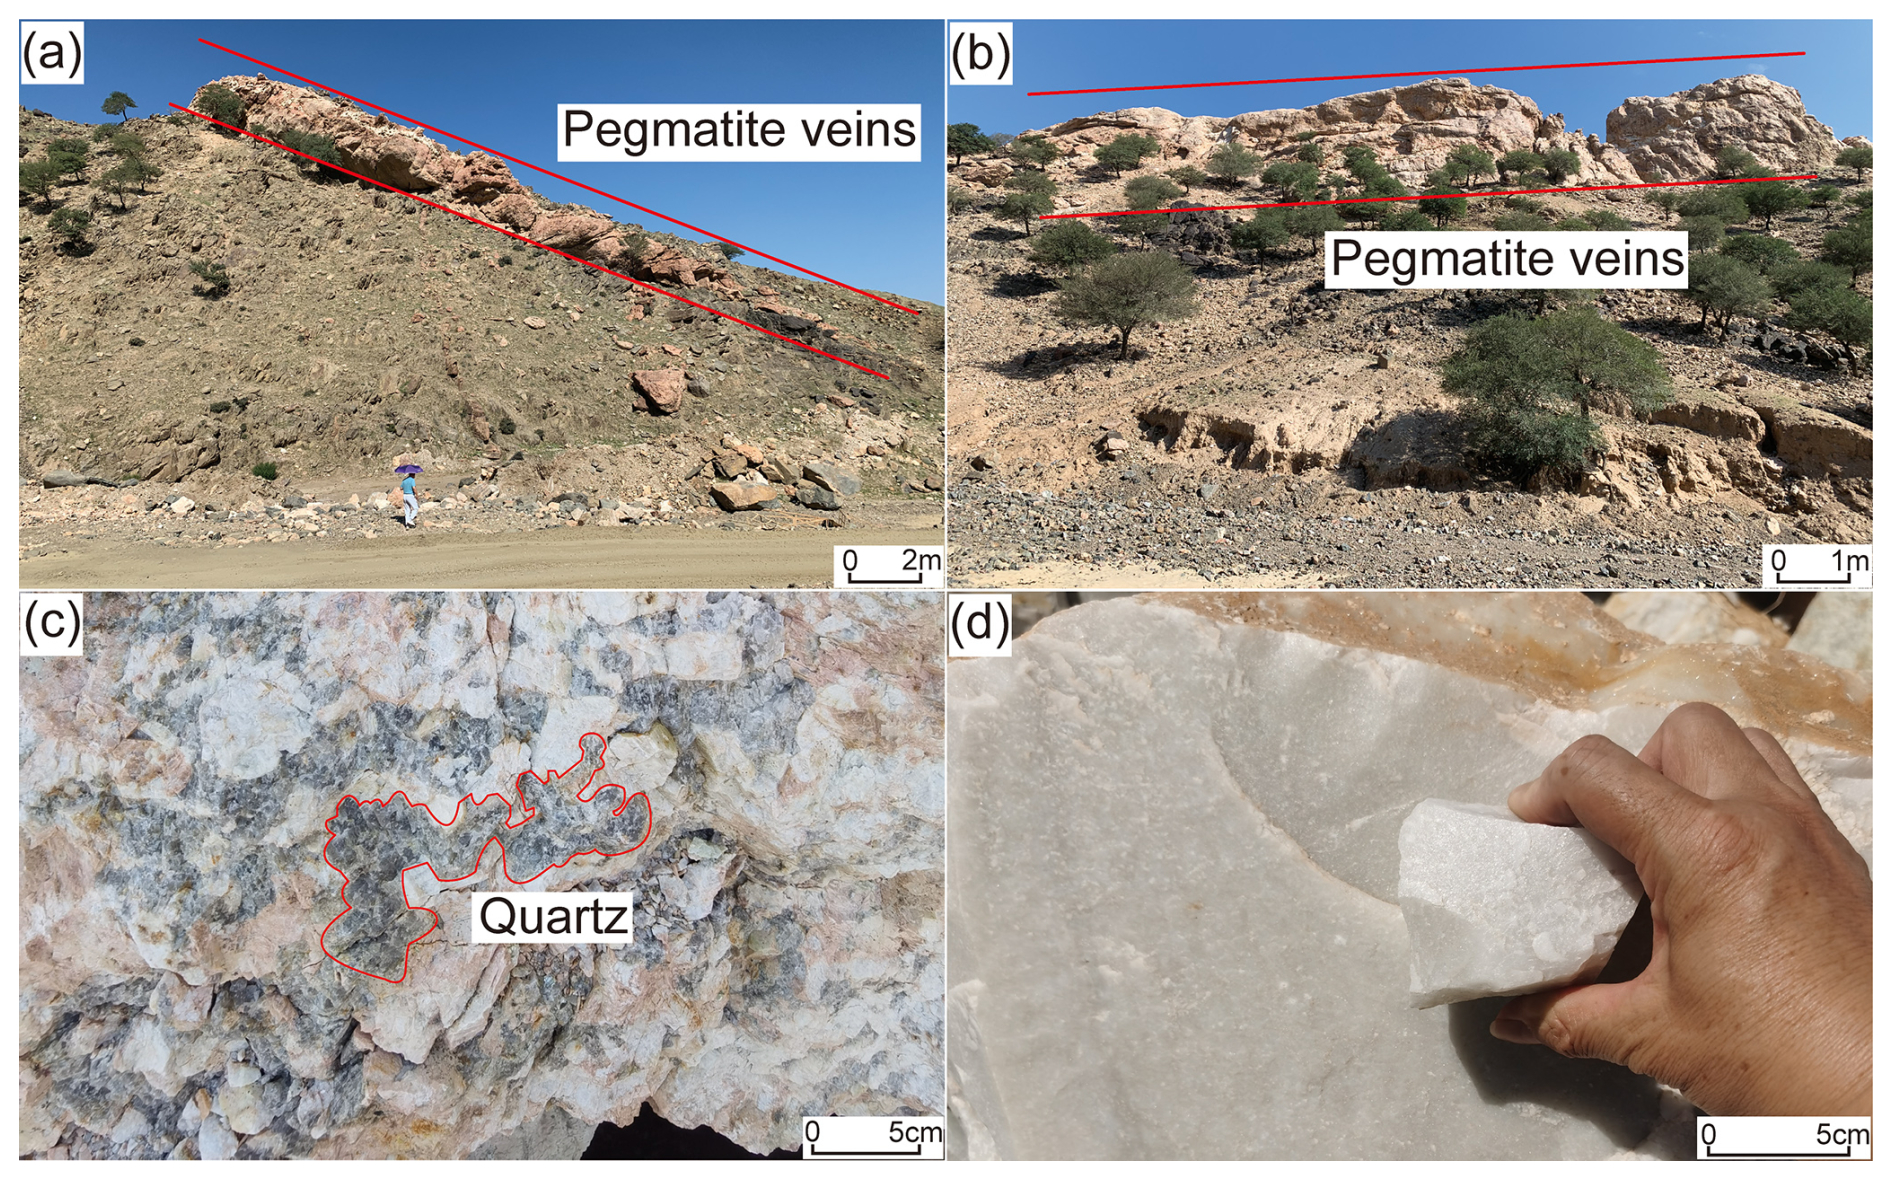
Figure 2(a) Outcrop of the dike-shaped HT pegmatite vein. Facing towards the SW, (b) outcrop of the dike-shaped PX pegmatite vein. Facing towards the SE, (c) giant-grained quartz in the intermediate zone of HT pegmatite veins, and (d) quartz in the inner core zone of PX pegmatite veins.
The distance between the HT and PX mining areas is approximately 20 km. According to geological survey reports for both areas, there are three pegmatite veins identified. Among them, one vein trends northeast and is located in the HT mining area (Fig. 2a), while two veins trend northwest and are located in the PX mining area (Fig. 2b). The pegmatite veins generally range from 6 to 76 m in width and from 70 to 440 m in length. Their color varies from flesh-red to pink, and they exhibit a massive structure. The main mineral components are microcline, quartz, and anorthite, with feldspar crystals primarily showing the polysynthetic twin. The total reserves of quartz in the pegmatite veins of the HT and PX mining areas are approximately 9834 and 100 000 metric tons, respectively. The pegmatite veins in both areas exhibit well-developed mineralogical zonation, characterized by a distinct intermediate zone composed of giant-grained feldspar and quartz (Fig. 2c), and a core zone consisting of large quartz crystals (Fig. 2d). Both pegmatites exhibit symmetric quartz core zonation typical of classic granitic pegmatites (Černý and Ercit, 2005), including a quartz core, a feldspar–quartz block zone, a medium- to coarse-grained pegmatite zone, and a finer-grained marginal zone.
The selected samples in this study were comprehensively evaluated for their suitability as raw materials for HPQ through a trace element analysis, metallogenic setting assessment, economic viability evaluation, and post-purification quality examination. All samples were collected exclusively from quartz core zones in pegmatite veins to minimize potential impurity effects from marginal regions.
3.1 Experimental reagents
The reagents used in the experiment were either analytically pure or of an excellent grade, including dodecylamine (CH3NH2, AR), sodium dodecyl benzene sulfonate (C18H29NaO3S, AR), hydrochloric acid (HCl, GR), nitric acid (HNO3, GR), and hydrofluoric acid (HF, GR). All reagents were purchased from Sinopharm Chemical Reagent Co., Ltd. (Shanghai, China). Ultrapure deionized water with a resistivity of 18.25 MΩ cm was used in all experiments.
3.2 Sample collection
Two representative pegmatites samples, HT and PX, were collected from pegmatite bodies exposed in the study area. Sampling focused on fresh unweathered pegmatites containing well-developed quartz-rich zones suitable for HPQ research. Portions of the pegmatite showing visible alteration or excessive intergrowths of feldspar, mica, or other accessory minerals were avoided. The HT sample represents a coarse-grained pegmatite, whereas the PX sample represents a medium- to fine-grained pegmatite, ensuring that the collected material captures the textural and compositional variability of quartz-bearing pegmatites for subsequent processing and analysis.
3.3 Purification process
All procedures were conducted using raw ore to better understand the concentration of trace element impurities in quartz and to further determine its potential as HPQ. Natural quartz typically contains various impurities, including associated minerals, melt and fluid inclusions, and lattice-bound impurities.
According to the characteristics of various types of impurities, different treatment methods are needed to purify distinct quartz samples. For instance, samples comprising pegmatite and quartz-bearing rocks containing magnetic or heavy minerals require the incorporation of corresponding beneficiation procedures, such as magnetic or gravity separation. The specific process flow used in this study is illustrated in Fig. 3.
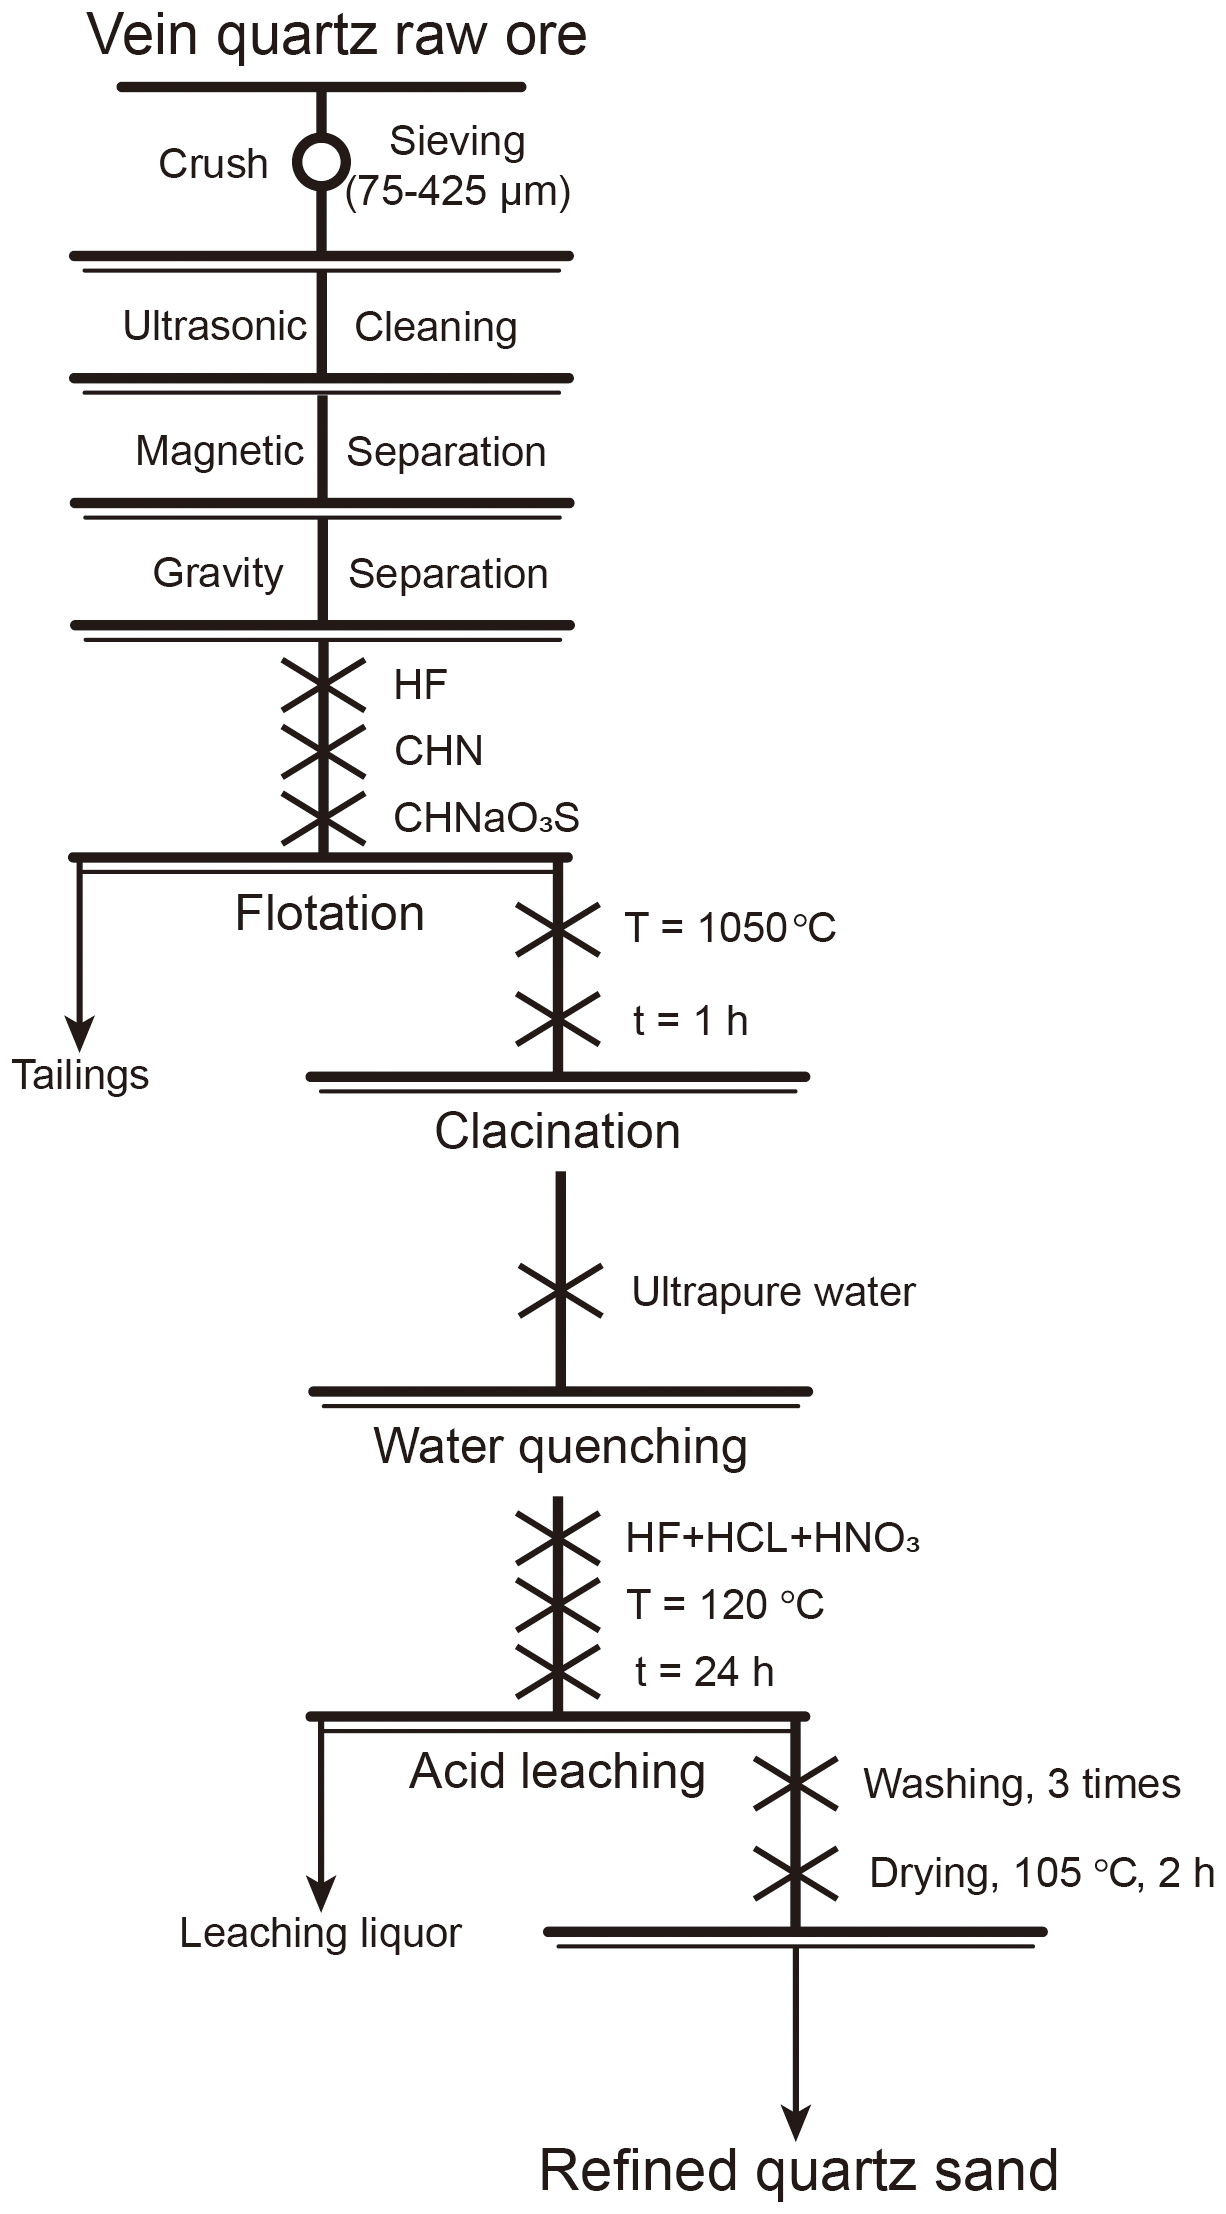
3.3.1 Crushing and screening
First, raw samples (1–2 kg) were rinsed with ultrapure water (18.25 MΩ cm) to remove soil, clay minerals, and iron oxide film from the rock surface. After air drying, the samples were placed in a crusher for crushing. Standard nylon sieves were then used to screen the quartz sand in the 40–200 mesh (75–420 µm) range.
3.3.2 Calcination and water quenching
The samples were subsequently placed in a muffle furnace and calcined at 1050 °C for 1 h, followed by water quenching in ultrapure water. Through this pretreatment process, impurities in the quartz can be exposed on the surface of particles or separated into individual particles, such as inclusions, lattice-bound impurities, and other associated mineral impurities. Additionally, water quenching may induce cracks on the surface of quartz particles, enhancing the effectiveness of subsequent acid leaching (Lin et al., 2020).
3.3.3 Flotation
A conventional fluorine–acid reverse flotation process was employed in this study. Flotation experiments were conducted using an XFD-12 laboratory flotation machine equipped with a 0.5 L flotation cell. The impeller speed was maintained at 1500 r min−1, with an aeration rate of approximately 0.25 L min−1. The flotation temperature was controlled between 40 and 50 °C, and the ore pulp density was adjusted to 16 %–17 %. The pH of the slurry was regulated to 2.5 using HF (Demir et al., 2003).
A 5 % dodecylamine solution (DDA) was used as the cationic collector, while a 5 % sodium dodecylbenzenesulfonate solution (SDBS) served as the anionic collector. Hydrofluoric acid (55 %) was used as the regulator. After flotation, the products were ultrasonically cleaned three times with deionized water to remove any residual reagents, followed by rinsing and low-temperature drying to obtain the flotation concentrate.
To minimize interference during flotation, magnetic and heavy minerals were first removed by magnetic or gravity separation, while feldspar was separated through flotation. This approach helps to prevent the minerals from having similar surface charges under acidic conditions.
After flotation, the flotation products were subjected to ultrasonic cleaning three times with deionized water to remove any residual reagents, followed by thorough rinsing and low-temperature drying to obtain the flotation concentrate.
3.3.4 Acid leaching
Quartz is practically insoluble in all acids except hydrofluoric acid, whereas impurities are soluble (Yuan and Wu, 2013). Utilizing this property, acid leaching can effectively remove iron films and impurities from the surface of quartz. First, 10 g of quartz sand was accurately weighed and placed in a polytetrafluoroethylene (PTFE) reactor that had been cleaned with ultrapure water. The solid-to-liquid ratio was 1:1, with the mass rations of HF, HCl, and HNO3 set at . The leaching process lasted for 24 h at a temperature of 120 °C.
3.4 Sample dissolution procedure
A 50.00 mg quartz sand sample and 20.00 mg GBW07837 quartz standard reference material (Liu et al., 2014) were accurately weighed and placed in a PTFE sample dissolution vessel. Several drops of ultrapure water were added to moisten the sample.
In the fume hood of the ultra-clean laboratory, 1.50 mL 65 % HNO3 and 1.50 mL 40 % HF were sequentially added. The mixture was then placed on an electric heating plate and evaporated to near dryness at 140 °C.
Subsequently, another 1.50 mL 65 % HNO3 and 1.50 mL 40 % HF were added, and the covered sample was heated in an oven at 200 °C for 4 h. After cooling, the sample was again evaporated on the electric heating plate at 140 °C to remove the residual HF.
Then, 2 mL of 30 % HNO3 was added, and the mixture was covered, sealed, and subjected to ultrasonic treatment for 15 min. The sample was subsequently placed on a 150 °C electric heating plate for 4 h to ensure complete extraction.
A small amount of ultrapure water (5–10 mL) was added to a clean polyethylene terephthalate (PET) bottle, followed by 1 mL of a 200 µg kg−1 indium internal standard solution. The cooled sample solution was then transferred to the PET bottle, and the dissolution vessel and inner wall of the lid were rinsed three times with ultrapure water. The final solution was then diluted to 20 g and prepared for ICP-MS analysis.
3.5 Analytical methods
3.5.1 Optical microscopy observation
Microscopic analysis of the HT and PX vein quartz samples was conducted using double-polished thin sections. A transmitted polarizing microscope (TPM, Nikon DS-RI2, Tokyo, Japan) was utilized to characterize the petrological features of the quartz samples, including grain size, mineral composition, fluid micro-inclusion assemblages, and micro-structure.
3.5.2 Scanning electron microscope (SEM) and cathodoluminescence (CL)
Backscattered electron (BSE) imaging, quartz cathodoluminescence (CL) imaging, and the identification of unknown minerals were performed using a TESCAN MIRA3 scanning electron microscope (SEM, TESCAN, Czech Republic) equipped with a Gatan Chromal CL2 system (CL, Gatan, England) and an EDAX GENESIS APEX Apollo System energy dispersive spectrometer (EDS, EDAX, USA) at the CAS Key Laboratory of Crust-Mantle Materials and Environments at the University of Science and Technology of China (USTC) in Hefei. The working conditions were set to 15 kV and 15 nA for BSE imaging and EDS, and 10 kV and 15 nA for CL imaging.
3.5.3 Spot chemical composition analysis by LA-ICP-MS
The impurity contents in quartz were measured using laser ablation inductively coupled plasma mass spectrometry (LA-ICP-MS) on polished samples at the in situ Mineral Geochemistry Lab, Ore Deposit and Exploration Centre (ODEC) at the Hefei University of Technology, China. The analyses were conducted using an Agilent 7900 Quadrupole ICP-MS coupled with a Photon Machines Analyte HE 193 nm ArF Excimer laser ablation system (Agilent, Santa Clara, California, USA). Argon served as the make-up gas and was mixed with the carrier gas via a T-connector before entering the ICP (Ning et al., 2017), maintaining high flow rates of He (0.9 L min−1) and Ar (0.9 L min−1). Each analysis was carried out with a uniform spot size of 30 mm at a frequency of 7 Hz, with an energy of approximately 7 J cm−2 for 40 s, following a gas blank measurement for 20 s.
Standard reference materials NIST 610, NIST 612, and BCR-2G were utilized as external standards for calibration. The preferred values of the element concentrations for the USGS reference glasses were sourced from the GeoReM database (http://georem.mpch-mainz.gwdg.de/, last access: 5 March 2025). Standard reference materials were analyzed after every 10 to 15 unknown samples, and detection limits were calculated for each element in each spot analysis. Offline data processing was conducted using an in-house MATLAB-based program known as Spotanalysis 1.0. Trace element compositions of silicate minerals were calibrated against multiple reference materials without the application of internal standardization. The sums of all element concentrations, expressed as oxide (according to their oxidation states in the silicate), were considered to constitute 100 % m m−1 for a given anhydrous silicate mineral (Liu et al., 2008).
3.5.4 Chemical composition analysis by ICP-MS
The impurity contents in quartz were measured at the CAS Key Laboratory of Crust-Mantle Materials and Environments, University of Science and Technology of China. The sample solution was then analyzed using an Agilent 7700e quadrupole ICP-MS, operating at an RF power of 1350 W with a nebulized gas flow rate of 1.0 L min−1. To mitigate interferences from polyatomic ion impurities, 3.5 mL min−1 of helium was introduced as the collision gas during the analysis. The standard correction curve solution for calculating the sample solution contents was prepared using the 13-element mixing standard solution NCS181036 from NCS Testing Technology Co., Ltd, Beijing, China.
3.5.5 X-ray powder diffraction (XRD)
The structure and phase composition of the two processed quartz sand samples were analyzed using X-ray powder diffraction (XRD) with a Japan Rigaku SmartLab X-ray diffractometer equipped with graphite-monochromatized Cu Kα radiation (λ=0.154056 nm), at a scanning rate of 0.02° s−1 in a 2θ range of 10–60 °.
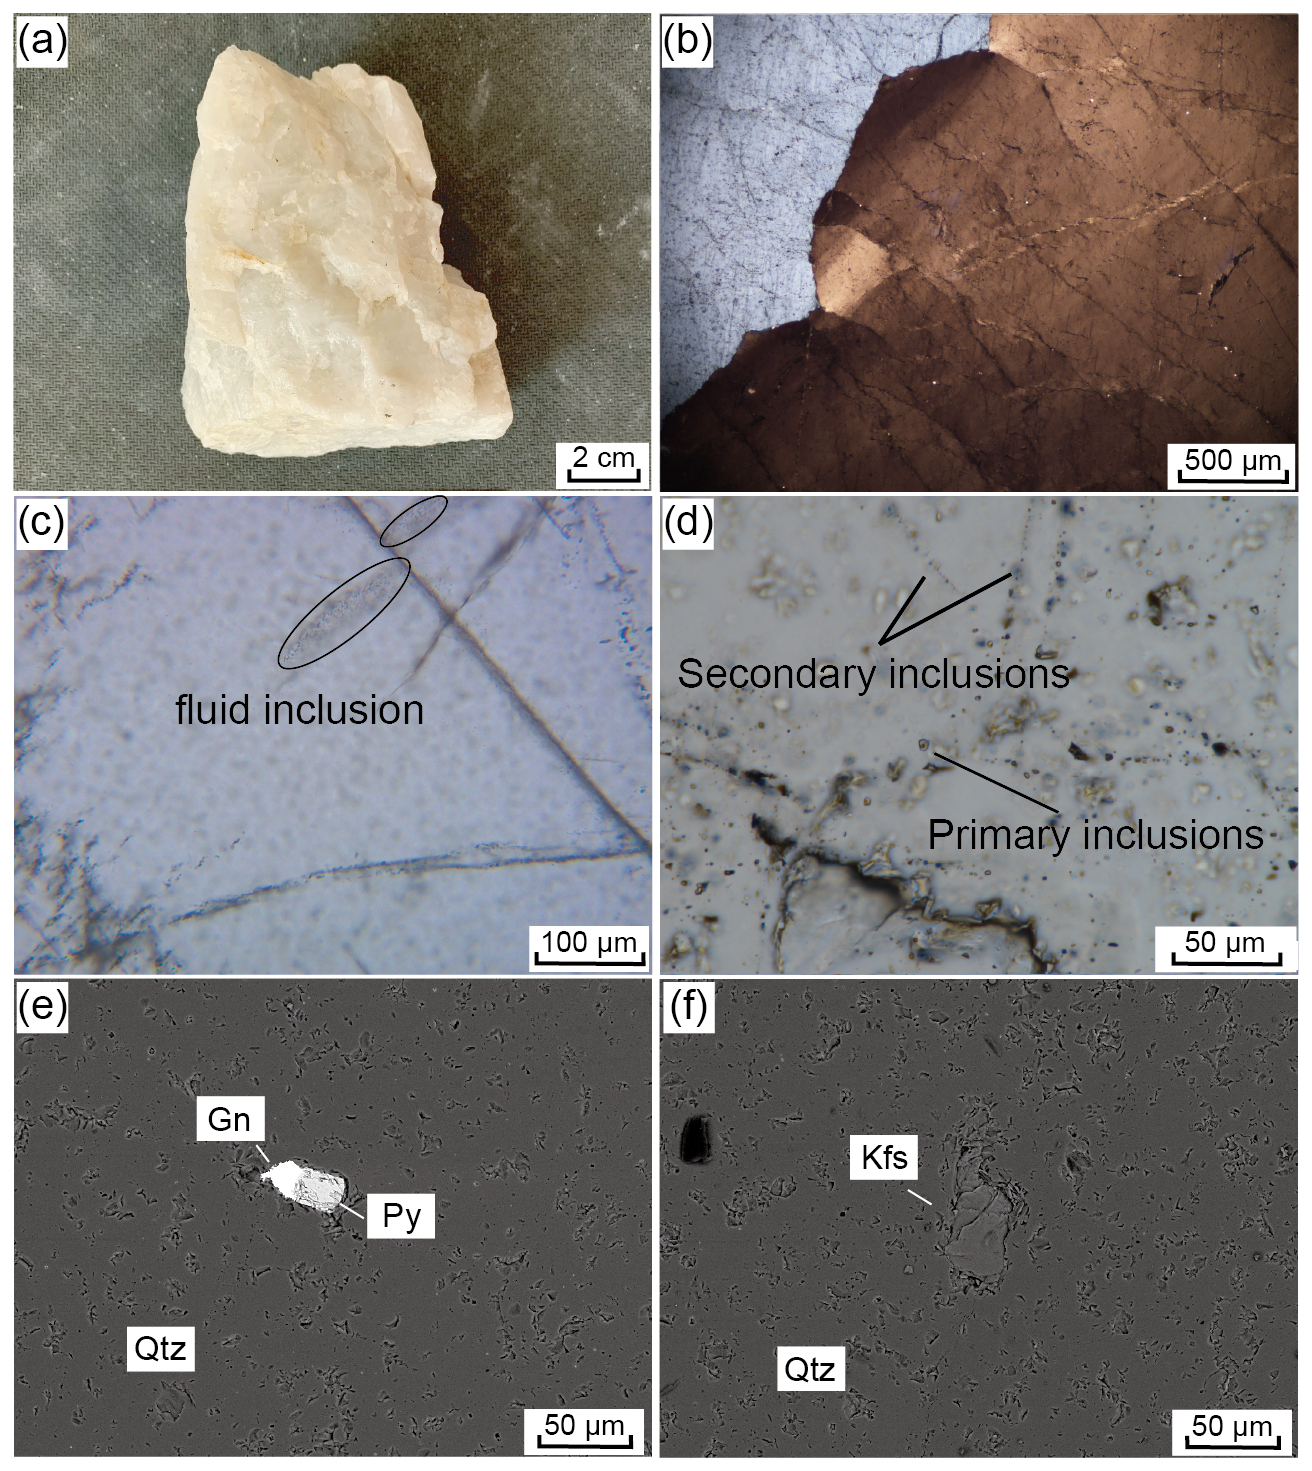
Figure 4Hand specimens, optical micrographs, and backscattered electron images of HT vein quartz. (a) HT vein quartz with a massive structure, coarse-grain structure, sooty white, no visible associated minerals; (b) quartz grains are mostly larger than 1000 µm and show wavy extinction under cross-polarized light; (c) fluid inclusions are linearly distributed along internal structures of the quartz grains under plane-polarized light; (d) under plane-polarized light, primary inclusions occur individually, whereas secondary inclusions are linearly arranged and mostly smaller than 5 µm; (e) assemblage of galena and pyrite inclusions embedded in quartz, and (f) a K-feldspar inclusion enclosed within quartz. Qtz: quartz, Gn: galena, Py: pyrite, Kfs: K-feldspar.
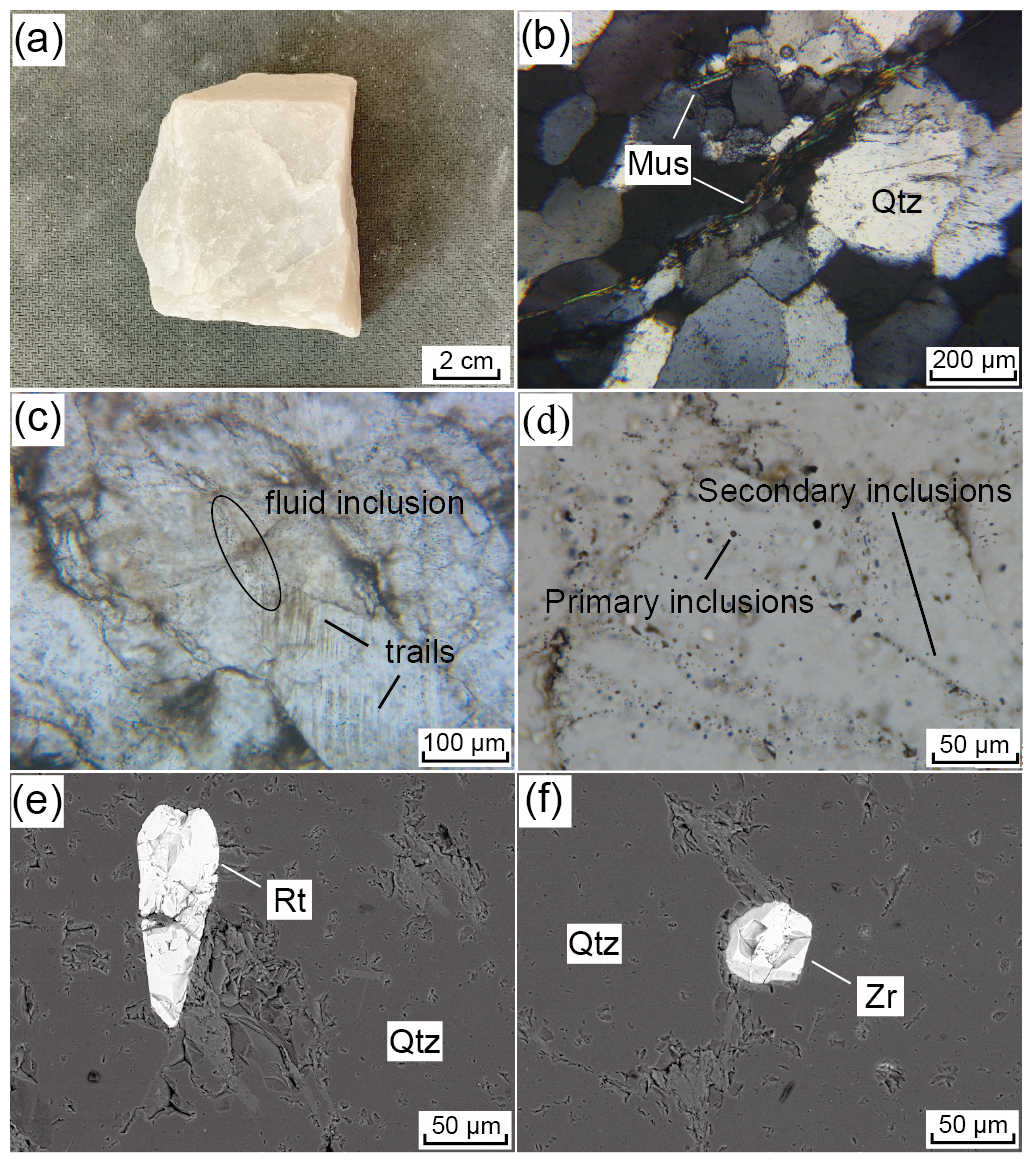
Figure 5Hand specimens, optical micrographs, and backscattered electron images of PX vein quartz. (a) PX vein quartz displays a massive texture, a medium- to coarse-grained structure, a sooty-white color, and no visible gangue minerals; (b) quartz grains exhibit wavy extinction under cross-polarized light, with most grain sizes ranging from 200 to 300 µm, and parallel flake-like muscovite (200–1000 µm) occurring between the quartz grains; (c–d) quartz containing individually distributed primary inclusions and linearly arranged secondary inclusions, mainly located within or along grain boundaries, with pseudo-secondary trails clearly visible under plane-polarized light; (e–f) rutile and zircon inclusion embedded in quartz. Qtz: quartz, Mus: muscovite, Rt: rutile, Zr: zircon.
4.1 Petrography
4.1.1 Qianqi Furong mine
The quartz particle size for the Qianqi Furong mine exhibits a wide range, with granular sizes of quartz crystals varying from <100 to >1000 µm. The particle size of the HT vein quartz is generally coarse grained, mostly exceeding 1000 µm (Fig. 4a, b), while the PX vein quartz is typically medium to fine grained, with an average grain size of 200–300 µm (Fig. 5a, b). The fine-grained nature of the quartz in the core zone is likely a result of late-stage crystallization, where rapid crystallization occurs from a silica-saturated melt under evolving cooling conditions. This is consistent with the typical behavior of pegmatites, where the core zone crystallizes at the final stage, forming smaller quartz crystals due to increased cooling rates and the progressive evolution of the melt (London and Cerny, 2008; Phelps et al., 2020). Under polarized light, the quartz particles from both samples exhibit a wavy extinction (Figs. 4b, 5b).
Among them, the crystals of HT vein quartz are relatively clear, with fewer fluid inclusions. The inclusions are primarily fluid pseudo-secondary trails, and, in some instances, secondary fluid inclusion trails can be seen traversing the crystal boundaries, indicating subsequent fluid alteration (Fig. 4c, d). In contrast, the PX vein quartz contains a greater number of fluid inclusions, both within the crystal and along the grain boundaries (Fig. 5c and d).
Various types of mineral inclusions are detected in the quartz from the Qianqi Furong mine. Galena (<20 µm), pyrite (>30 µm), and K-feldspar (>50 µm) are observed in the HT vein quartz, typically appearing as spotted or embedded within the quartz crystals (Fig. 4e and f). In contrast, the solid inclusions found in PX vein quartz include muscovite (200–1000 µm), rutile (>100 µm), and zircon (<50 µm). Flaky elongated muscovite is commonly located along the grain boundaries, while rutile and zircon are generally embedded within the crystal (Fig. 5b, e, and f).
In addition to mineral inclusions, the quartz also contains primary inclusions that are distributed individually and secondary inclusions that are linearly arranged. These inclusions are mostly located within or along the boundaries of quartz crystals, with pseudo-secondary trails clearly observable. Moreover, the fluid inclusions are mainly two-phase (liquid–vapor) inclusions, generally less than 5 µm in diameter (Fig. 4c and d and Fig. 5c and d).
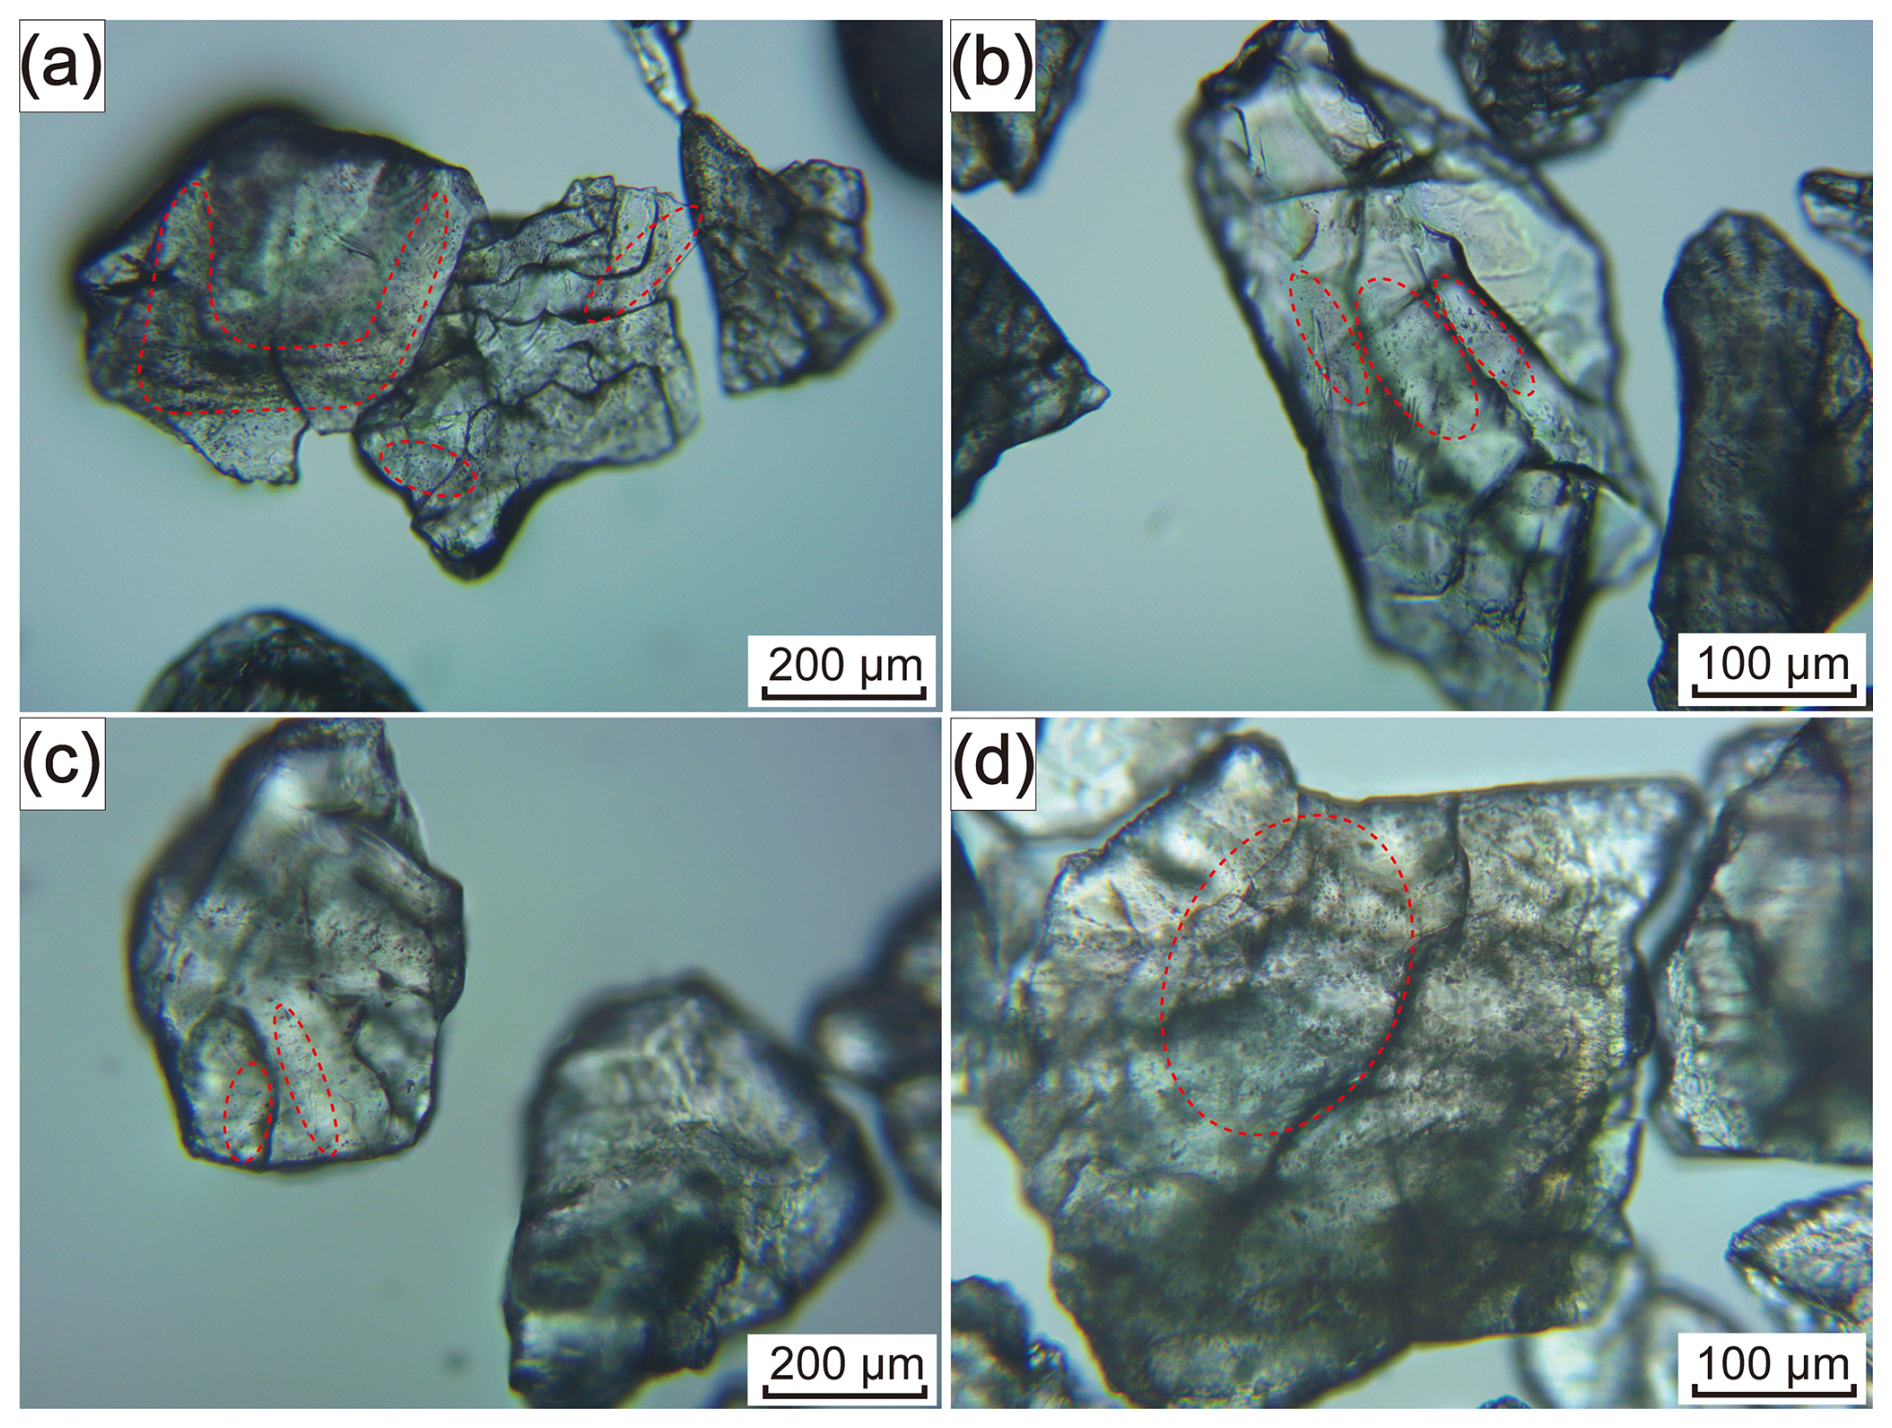
Figure 6Optical microphotographs of the HT (a, b) and PX (c, d) processed quartz sand samples.
4.1.2 Microstructure and XRD analysis of the Qianqi Furong quartz sand samples
The optical microscope images of the quartz sand samples processed by HT and PX are presented in Fig. 6. It is evident that there are numerous micro-cracks on the surface of processed samples, which are formed by high-temperature calcination and acid-leaching corrosion. The cracks are roughly parallel to each other, and it can be seen that some sands still contain many tiny inclusions. These inclusions may be due to the fact that the inclusions are too small to be removed by processing. After calcination, water quenching did not cause the quartz to burst, but, compared with the raw vein quartz, the fluid inclusions in the two processed quartz sand samples were significantly reduced.
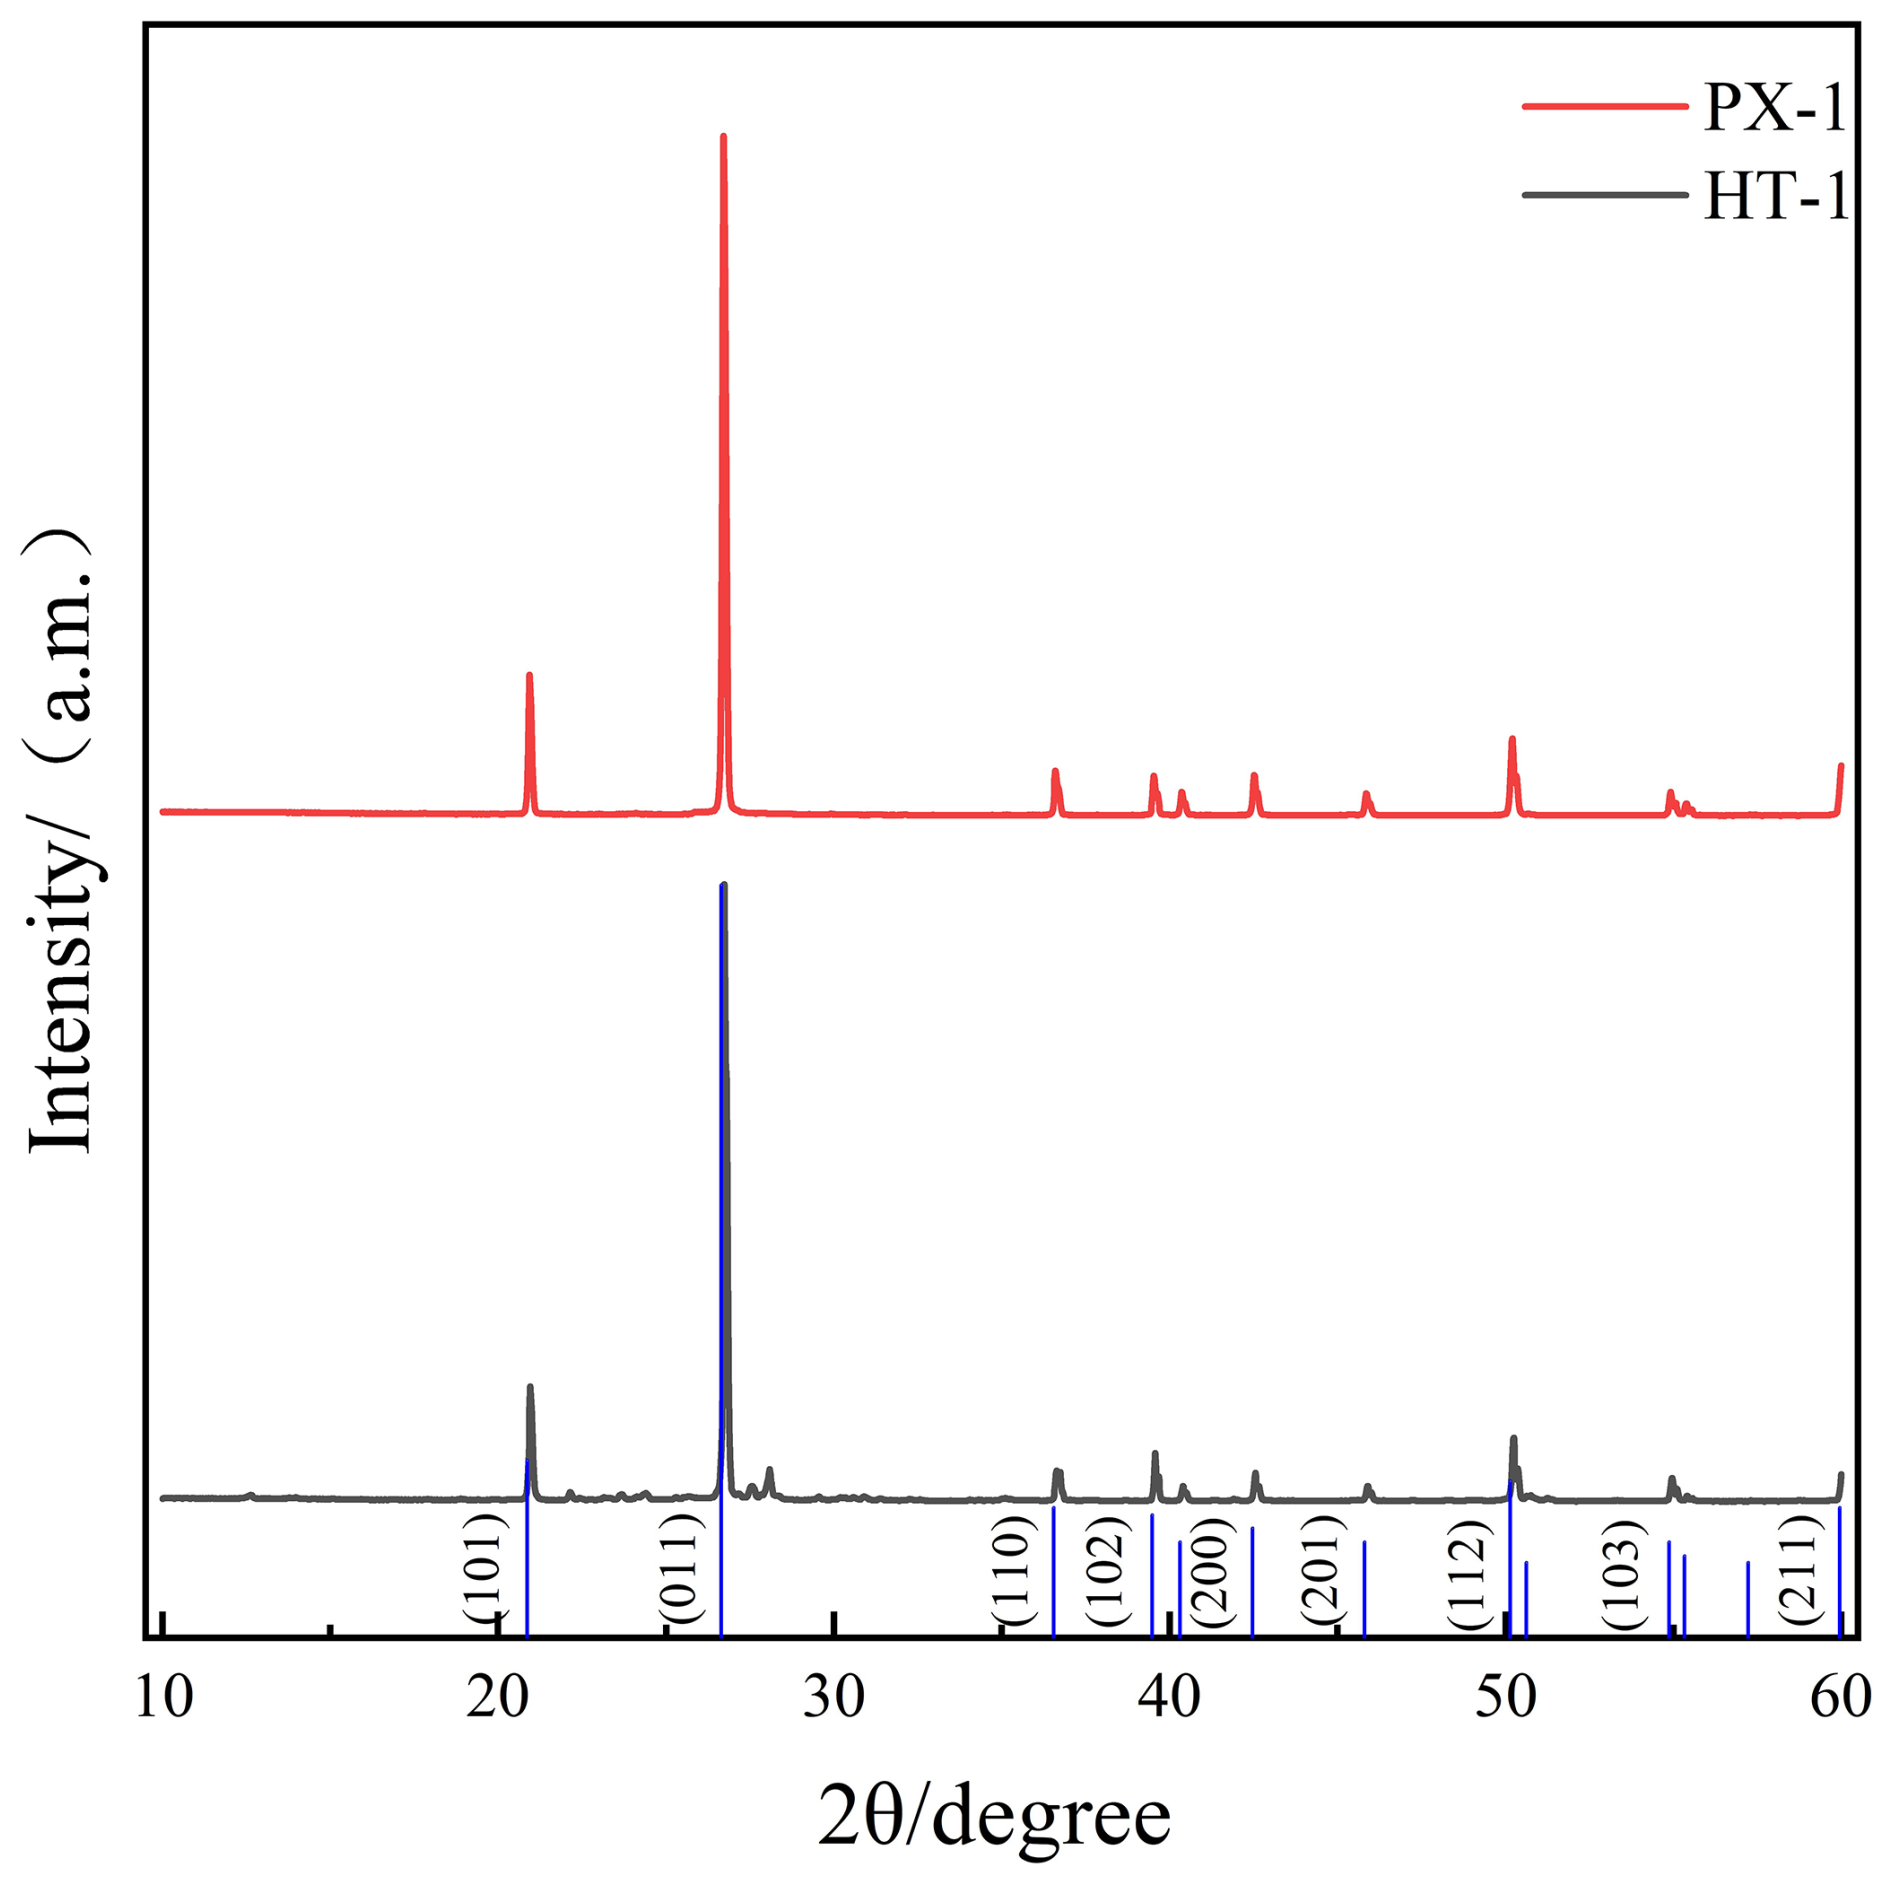
Additionally, the XRD results for the quartz align with the SiO2 standard powder diffraction file (PDF#46-1045) from the International Centre for Diffraction Data (ICDD), indicating that the two treated quartz sand samples are predominantly pure quartz (Fig. 7).
4.2 Cathodoluminescence (CL) of the HT and PX vein quartz
Cathodoluminescence imaging is an effective method for revealing the heterogeneity, intracrystalline micro-structure, and micro-inclusions in quartz samples. The micro-structures observed in the CL images (Fig. 8a) of the HT vein quartz indicate that it formed in a relatively stable environment, with uniform brightness, suggesting that the conditions during quartz crystal growth were more homogeneous. In addition, several small light spots can be seen within the lattice structure, which may represent gas–liquid inclusions (Fig. 8a).
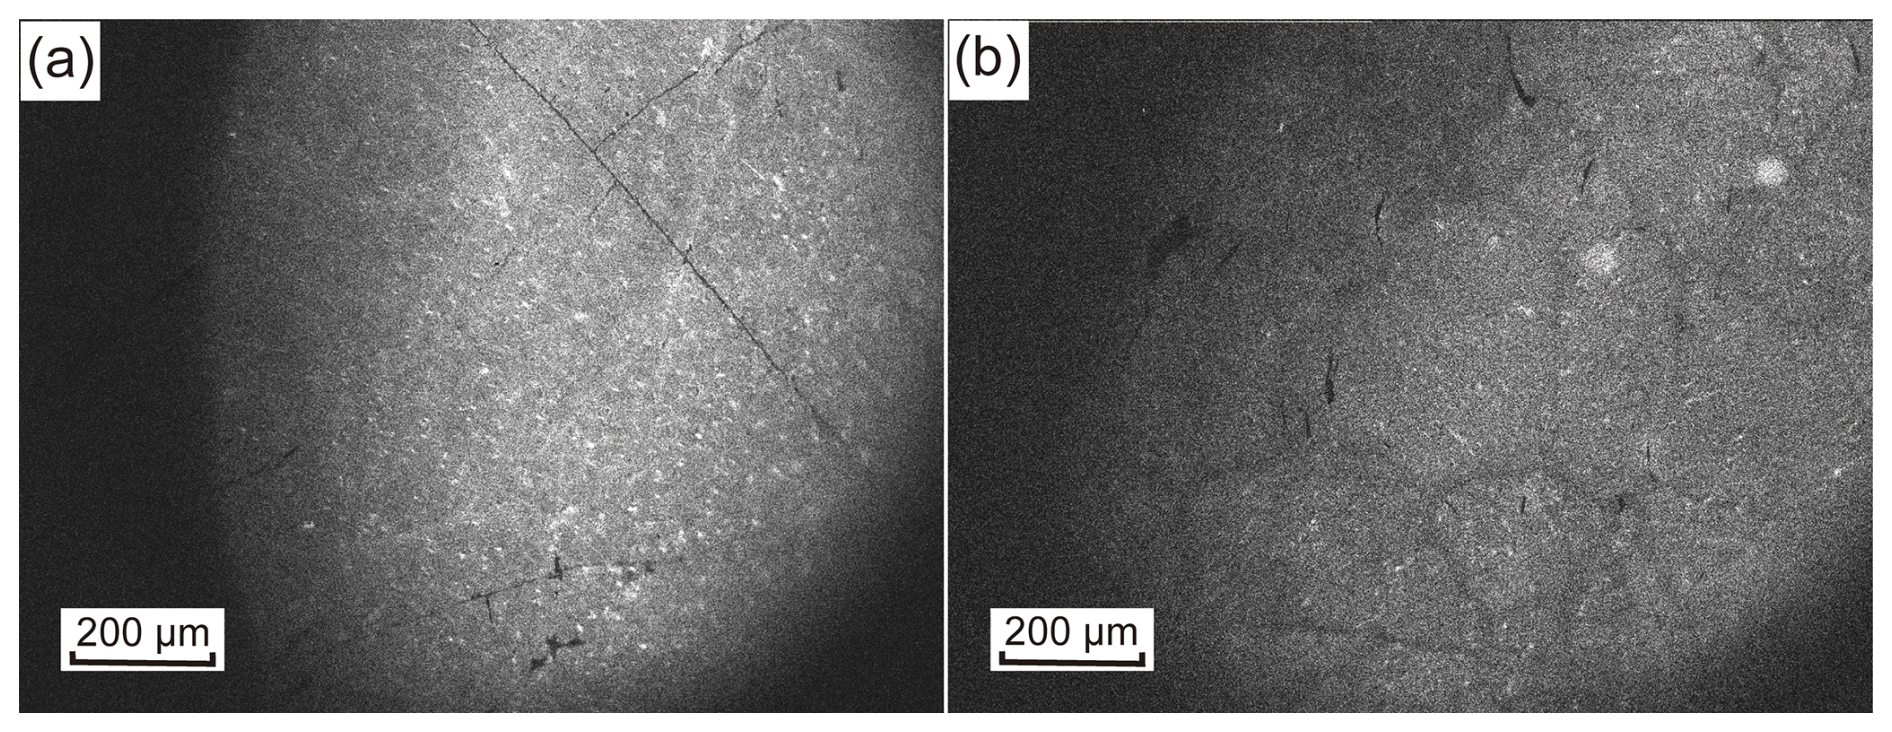
In contrast, the CL structure of PX vein quartz shows growth zoning and micro-cracks, which are indicative of dynamic hydrothermal conditions. The growth zoning reflects changes in temperature, pressure, or fluid composition, while the micro-cracks suggest stress after crystallization (Fig. 8b). These features are consistent with the weak hydrothermal activity occurring after the formation of the original quartz (Xia et al., 2023).
Table 1Trace element contents (µg g−1) of raw and processed Qianqi Furong vein quartz samples and the HPQ of Unimin Crop's IOTA series products.
Note: (1) IOTA-STD (standard product) is the main product of Unimin Corp. IOTA-CG is the standard of the photovoltaic crucible industry. All the data of IOTA products are cited from the official website of Unimin Corp.: http://www.iotaquartz.com (last access: 7 April 2025); (2) SiO2 (wt %) = ; (3) “< LOD” means under the detection limit, “–” means no data.
4.3 Chemical composition
The trace element compositions of the collected raw vein quartz samples were analyzed using LA-ICP-MS, while the processed quartz samples were examined using ICP-MS analysis. Five-point analyses of inclusion-free areas were conducted to determine the lattice-bound impurity contents, with the results summarized in Table 1. Significant differences were observed in the total concentrations of elemental impurities between the raw and processed vein quartz samples collected from the various mining sites.
We compared our samples to the international standard, the IOTA series of products of the Unimin Corp. The trace element contents of the IOTA products are shown in Table 1. According to this standard, the concentrations of 13 trace elements – Li, B, Na, Mg, Al, K, Ca, Ti, Cr, Mn, Fe, Ni, and Cu – should be the primary focus of detection. The purity or SiO2 content is determined by subtracting the total concentrations of these 13 trace elements (Table 1). Notably, for specialized products such as HPQ, the presence of these 13 trace elements adversely affects product quality. Therefore, their detection should not be arbitrary; otherwise, the results may lack reference value for research and application (Wang, 2022).
4.3.1 Spot chemical composition analyzed by LA-ICP-MS
Nine trace elements were identified in the quartz samples. The trace element concentrations in HT raw vein quartz are as follows: Li (0.72–2.05 µg g−1), Al (152–208 µg g−1), K (20–34 µg g−1), Ti (10–12 µg g−1), Fe (11.8–14.7 µg g−1), and Ge (0.906–1.13 µg g−1). The total trace element and SiO2 contents are 299.51–368.3 µg g−1 and 99.963 wt %–99.970 wt %, respectively.
In contrast, PX raw vein quartz displays the following concentrations: Li (0.47–0.64 µg g−1), Al (8.4–52 µg g−1), K (21–48 µg g−1), Ti (3.5–4.8 µg g−1), Fe (10.3–14 µg g−1), and Ge (0.79–1.08 µg g−1). The total trace element and SiO2 contents are 154.58–256.49 µg g−1 and 99.974 wt %–99.985 wt %, respectively. Notably, the concentrations of Al and K are significantly high in both of the raw vein quartz samples. Further details of the trace element compositions are presented in Table 1.
4.3.2 Bulk chemical composition analyzed by ICP-MS
In contrast to LA-ICP-MS, ICP-MS provides trace element concentrations throughout the entire quartz sample, rather than in a micro-area. ICP-MS was employed to analyze the 13 trace elements in both the original quartz sand and the treated quartz sand. The results are summarized in Table 1.
The concentrations of Na, Ca, and Al in the HT vein quartz of the original ore, analyzed by ICP-MS, are elevated, measuring 78.86, 85.3, and 118.19 µg g−1, respectively. This may be attributed to the presence of feldspar minerals. In contrast, the concentrations of Al and K in the PX vein quartz of the original ore are particularly high, at 3141.57 and 1406.23 µg g−1, respectively. This may be due to the presence of muscovite in the PX vein quartz.
After purification, the total trace element concentrations in HT vein quartz is 18.72 µg g−1, with the following concentrations: Li (0.11 µg g−1), B (undetected), Na (4.53 µg g−1), Mg (undetected), Al (undetected), K (0.12 µg g−1), Ca (4.81 µg g−1), Ti (1.11 µg g−1), Cr (0.53 µg g−1), Mn (0.1 µg g−1), Fe (2.4 µg g−1), Ni (undetected), and Cu (0 µg g−1). In comparison, the PX vein quartz exhibits a significantly higher total concentration of trace elements (114.56 µg g−1), including Li (0.32 µg g−1), B (0.08 µg g−1), Na (10.4 µg g−1), Mg (0.87 µg g−1), Al (26.9 µg g−1), K (23.98 µg g−1), Ca (6.88 µg g−1), Ti (36.93 µg g−1), Cr (0.14 µg g−1), Mn (0.07 µg g−1), Fe (7.59 µg g−1), Ni (0.17 µg g−1), and Cu (7.59 µg g−1). The SiO2 contents of the processed quartz sand are 99.998 wt % for HT and 99.989 wt % for PX.
5.1 Trace elements limit the metallogenic potential of HPQ
High-purity quartz (HPQ) has become a strategically critical resource for advanced industries, including semiconductors, optics, and photovoltaics (Yang et al., 2022). Studies on granitic pegmatites and hydrothermal quartz veins in the Froland and Evje-Iveland districts of Norway have demonstrated that the systematic trace element characterization of quartz can effectively reveal the magmatic differentiation and fluid evolution processes controlling HPQ formation (Larsen et al., 2000; Müller et al., 2015; Peterková and Dolejš, 2019; Zhao et al., 2024).
This study compares the trace element compositions of quartz from two pegmatite veins (HT and PX) in the Furong Qianqi mine, Inner Mongolia, with those from the world-class Spruce Pine pegmatite (USA) and the East Qinling pegmatite belt (China), both renowned HPQ sources (Zhang et al., 2022). The results offer valuable insights into the magmatic fractionation and metallogenic evolution of these pegmatites.
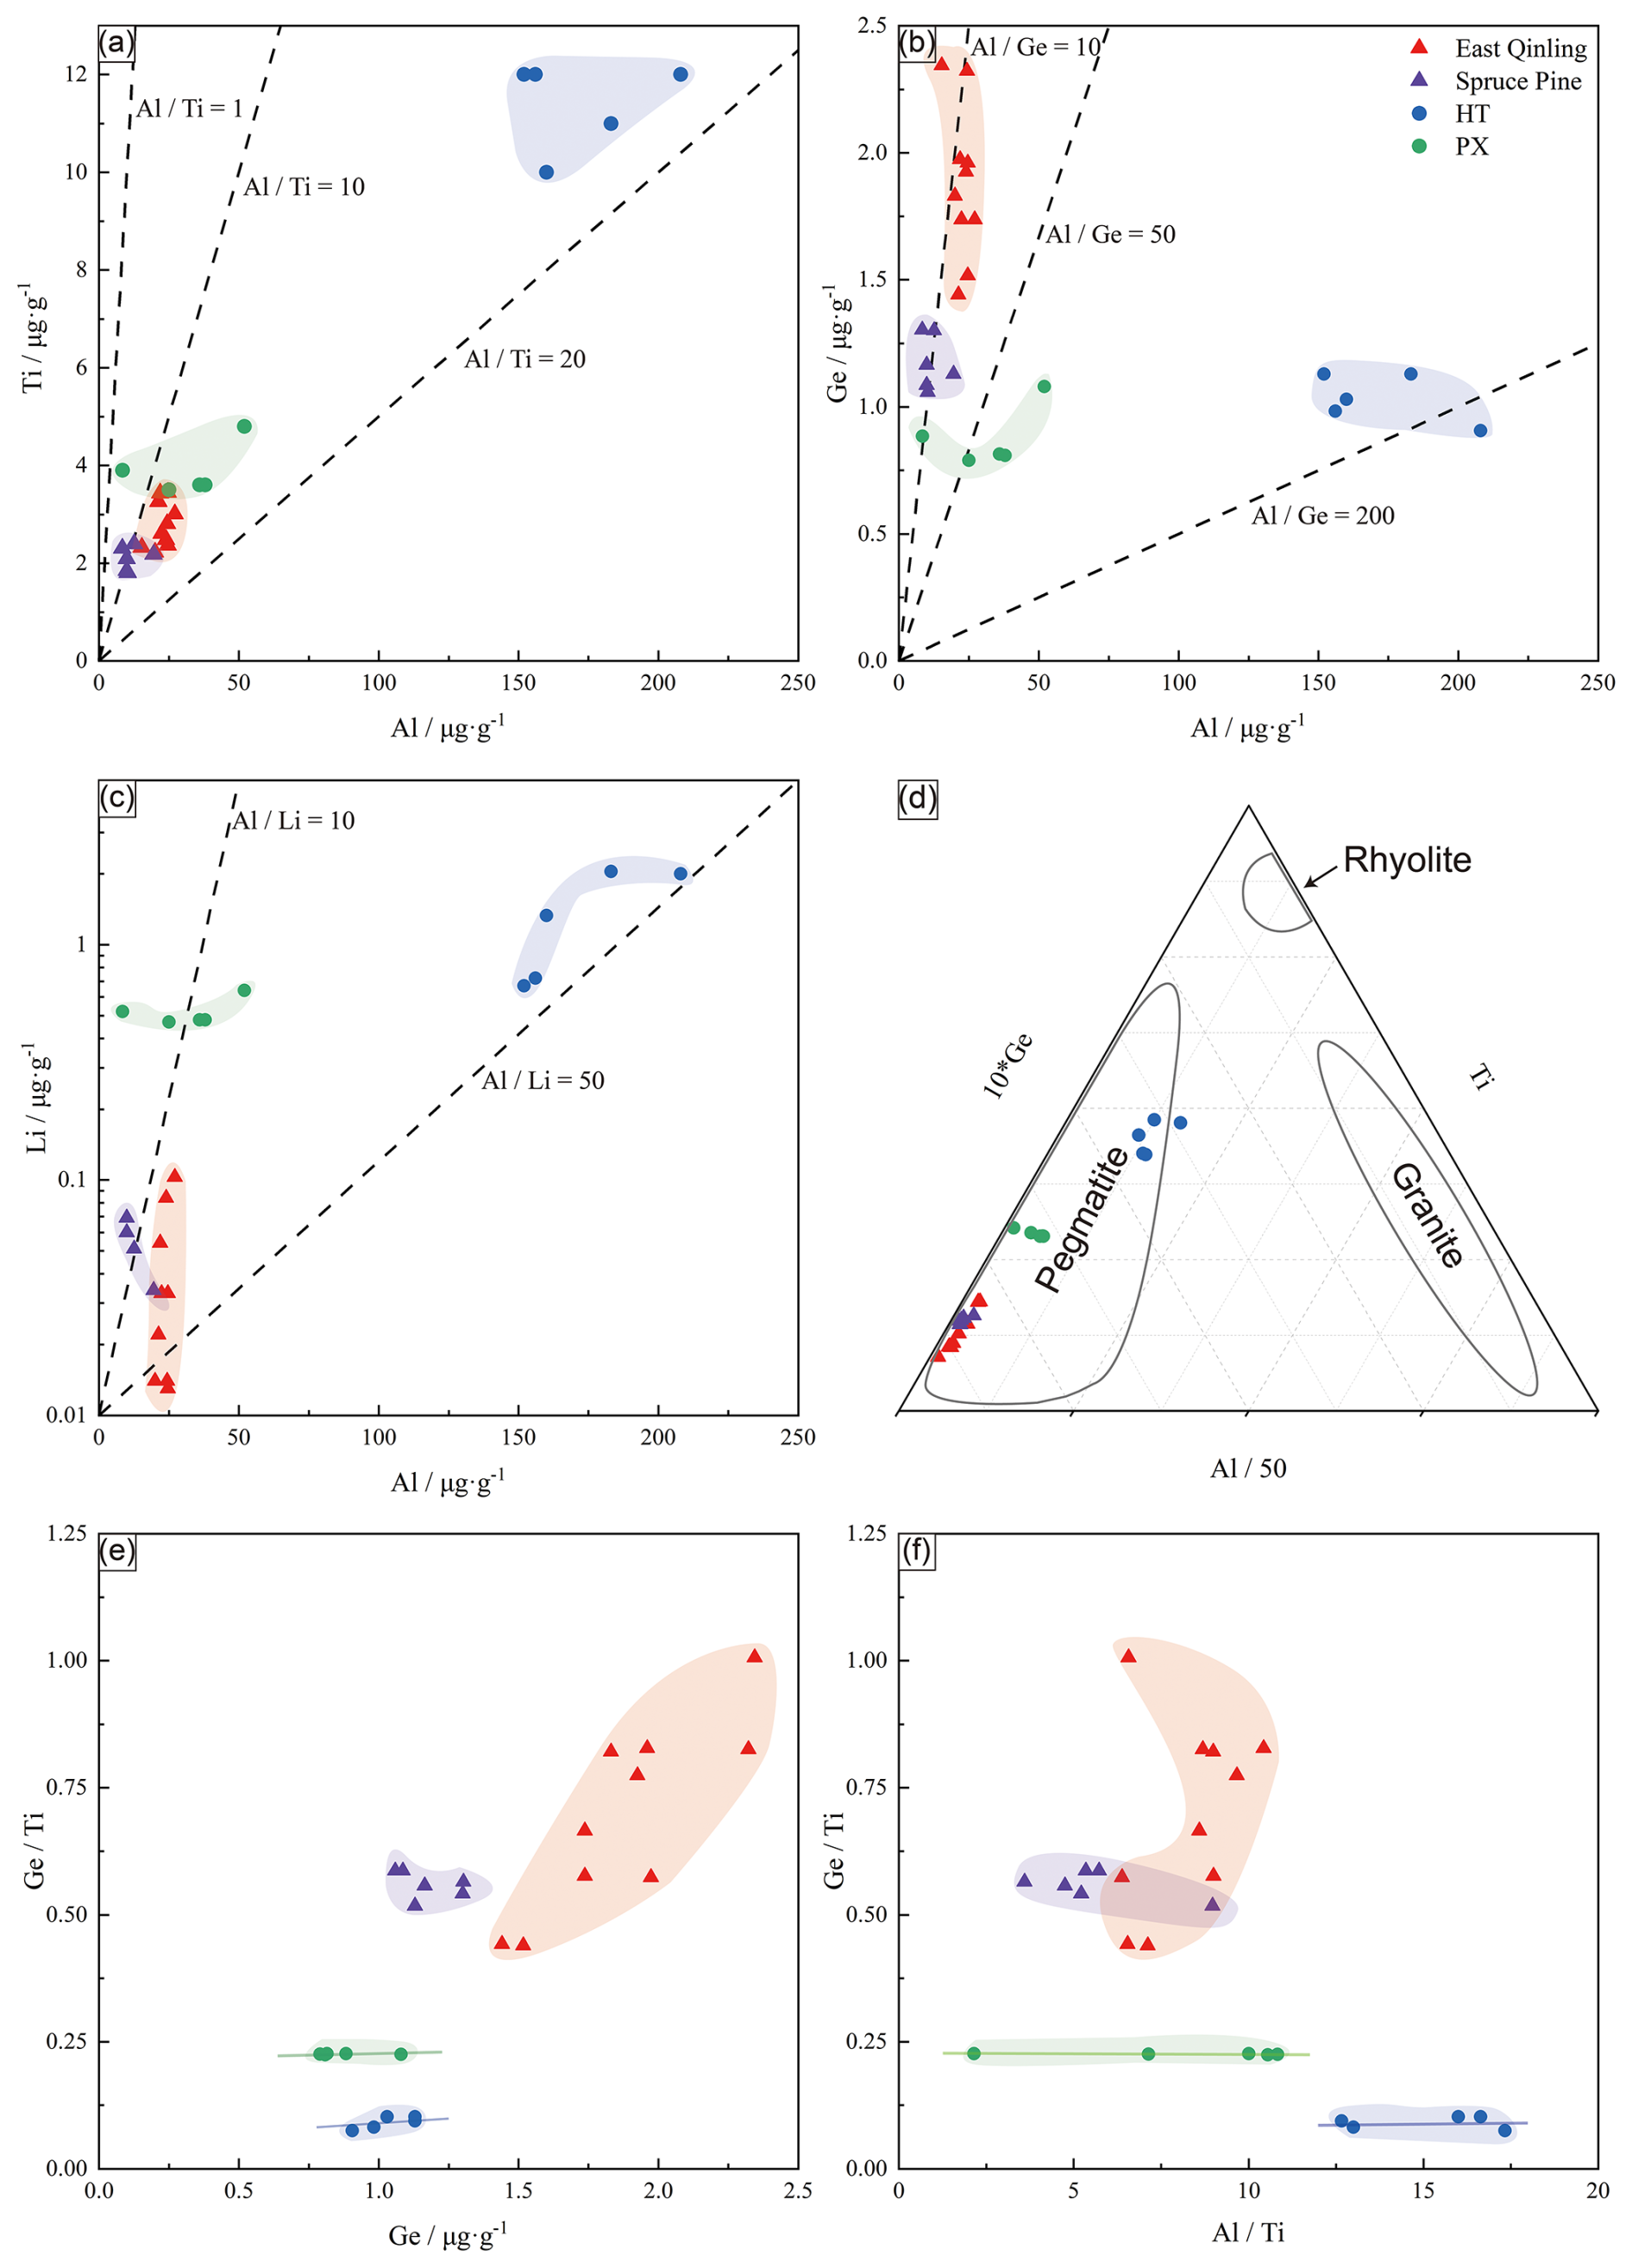
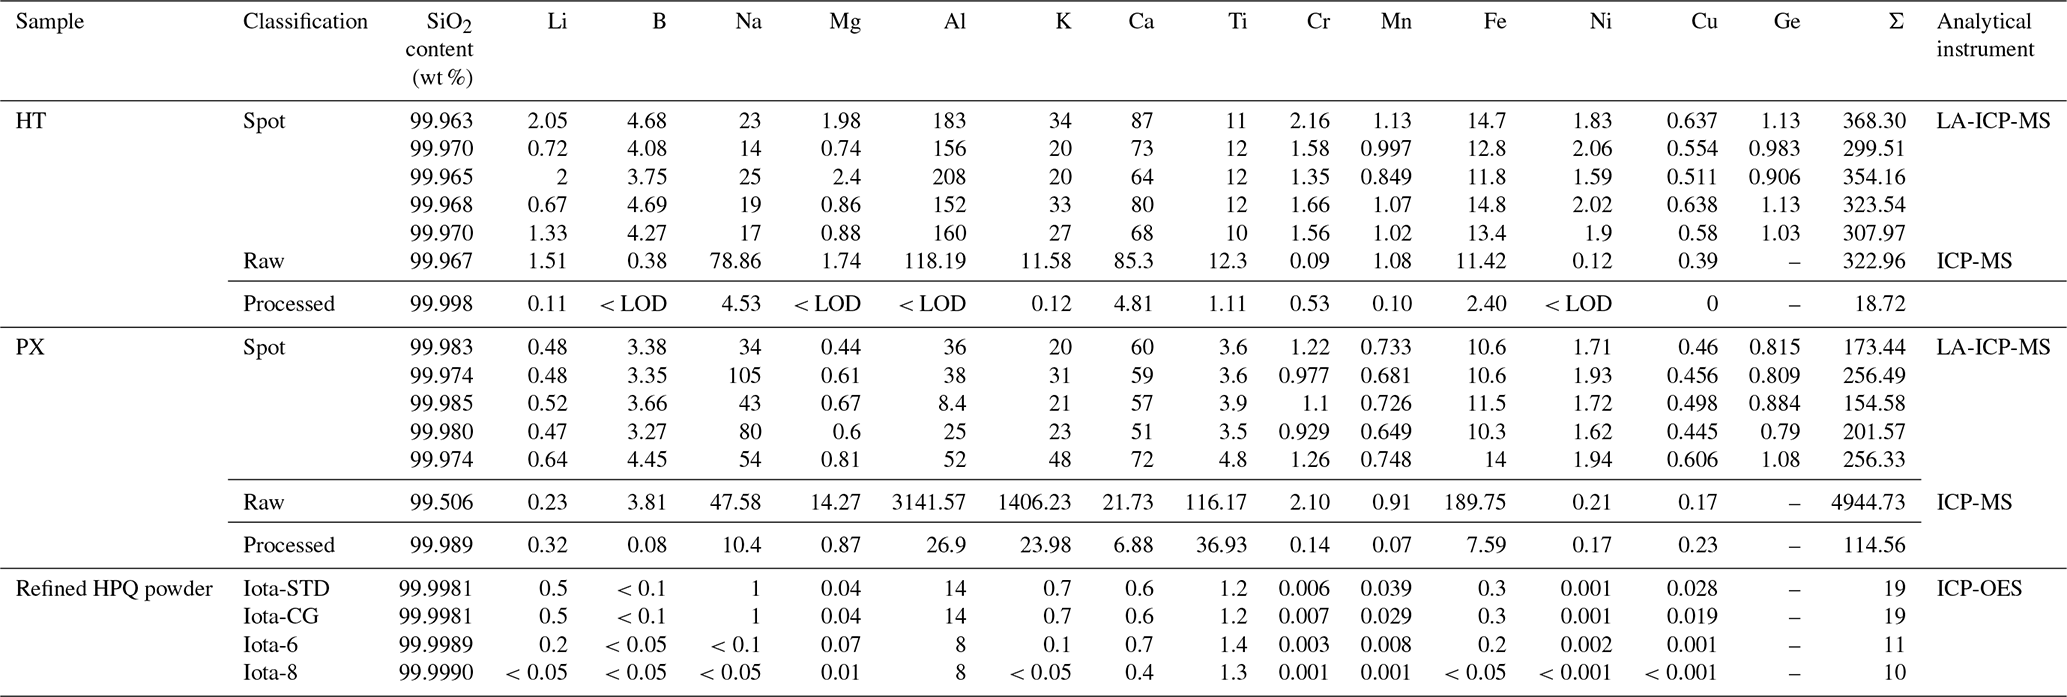
Figure 9Diagram showing the relationship between trace element concentrations in Spruce Pine, East Qinling, HT, and PX. (a) Al vs. Ti, (b) Al vs. Ge, (c) Al vs. Li, (d) diagram, (e) Ge vs. , and (f) vs. (data from Zhang et al., 2022).
The ratio in quartz is a robust indicator of melt fractionation (Jacamon and Larsen, 2009; Breiter et al., 2012), which varied from 12.67 to 17.3 in HT quartz and from 2.15 to 10.80 in PX quartz. A positive Al–Ti correlation (Fig. 9a) reflects continuous melt evolution under reducing conditions, where Ti incorporation decreases with decreasing temperature and increasing melt polymerization. The higher ratio in HT quartz, compared to PX, suggests more advanced fractionation and prolonged magmatic differentiation. This is likely influenced by differential cooling rates or volatile enrichment during late-stage crystallization.
Germanium, which substitutes for Si4+ in the quartz lattice, remains stable below the magmatic solidus and serves as a sensitive tracer of magmatic and hydrothermal evolution (Larsen et al., 2004; Müller et al., 2021). The comparable Ge concentrations in HT (0.906–1.13 µg g−1) and PX (0.79-1.08 µg g−1) quartz, but higher Ge in Spruce Pine quartz (1.059-1.303 µg g−1), indicate that the Furong Qianqi pegmatites represent moderately evolved systems.
Lithium, an incompatible element, increases in late magmatic and fluid phases. Its enrichment in HT quartz (Fig. 9b, c) suggests enhanced volatile activity during the final crystallization stage. The Ge– (Fig. 9c) and – (Fig. 9f) relationships show nearly parallel evolution trajectories for HT and PX quartz. This implies that the pegmatites are coeval yet independent bodies derived from a common parental magma – supporting a “sibling” rather than a “filiation” relationship (Chu et al., 2024). These parallel fractionation paths suggest that the separate magma batches underwent simultaneous differentiation under slightly different physicochemical conditions, likely driven by localized variations in temperature, pressure, and volatile saturation (London and Cerny, 2008; Černý and Ercit, 2005).
In addition to the trace element chemistry, the occurrence and characteristics of inclusions within quartz are critical in determining its purity and suitability for HPQ applications. Trace elements can also be incorporated within inclusions. For HPQ raw materials, the most critical factors influencing purity are the abundance, type, and size of these inclusions. Studies on the world-class Spruce Pine deposit indicate that quartz crystals contain very few inclusions (<3 %), mostly mineral inclusions, with two-phase fluid inclusions being extremely rare (typically <1–5 cm−2), which largely explains the superior quality of this material (Zhang et al., 2024). In contrast, quartz from the Furong Qianqi pegmatites contains both mineral and fluid inclusions, with the latter being relatively abundant and typically smaller than 5 µm.
The dominant inclusion types in the HT and PX samples also reflect their distinct geological histories. In HT quartz, galena, pyrite, and K-feldspar occur as mineral inclusions, while PX quartz contains rutile and zircon. Generally, the type of inclusions in quartz varies with rock type and crystallization stage: early-stage pegmatitic quartz tends to contain melt and mineral inclusions, mid-stage quartz often hosts coexisting melt and fluid inclusions, and late- or post-stage magmatic vein quartz is dominated by fluid inclusions (Yuan et al., 2021). Among these, two-phase fluid inclusions and mineral inclusions have the greatest impact on HPQ quality. During heating, gas–liquid inclusions may coalesce to form large bubbles, adversely affecting the optical and mechanical performance of HPQ products. Moreover, mineral inclusions containing Ti, Al, Li, Fe, K, and Na can lead to elevated impurity levels in the quartz matrix (Zhang et al., 2024).
Overall, the trace element systematics and inclusion characteristics indicate that HT pegmatite quartz crystallized from a more evolved, volatile-rich residual melt, leading to its higher degree of fractionation and greater potential for HPQ formation. In contrast, PX represents an earlier and less evolved pegmatite stage. These differences reflect the combined effects of melt evolution, volatile flux, and crystallization dynamics that ultimately control the metallogenic potential of HPQ deposits.
5.2 Purification of vein quartz HT and PX
As early as the 1970s, numerous scholars began exploring the technology for preparing HPQ sand from quartz-bearing rocks. For instance, Sato et al. (1997) and Kemmochi et al. (1999) successfully produced transparent HPQ from fine-grained pegmatite (Jin et al., 2004; Lei and Zheng, 2008). Additionally, researchers in Germany and Russia have sought HPQ in vein quartz and metamorphic quartzite (Jin et al., 2004). Today, quartz sand products produced by Unimin Corp. have evolved to the sixth generation, with a total trace element content of less than 10 µg g−1 and optical-grade transparency (Liu et al., 2007; Lei and Zheng, 2008). Purification technology for HPQ has reached a relatively mature stage, with three essential steps in the purification process: calcination, flotation, and acid pickling. Moreover, the presence of associated heavy or magnetic minerals necessitates the use of magnetic and gravity separation to effectively remove these gangue minerals.
During the high-temperature calcination of quartz, an increase in temperature causes the internal pressure of fluid inclusions to exceed the binding pressure of the quartz, resulting in the sudden bursting and release of internal impurities. This process, known as decrepitation, can be followed by dissolution through acid leaching. Although most fluid inclusions undergo decrepitation around the α to β transition temperature, some may not decrepitate even at a higher temperature. Water quenching after high-temperature calcination can effectively expose impurities in quartz, although it may also have some negative effects. Becker et al. (2000) noted that metal impurities in quartz at high temperatures can transform into metal oxides that are difficult to remove in the presence of N2 and O2. For instance, at 900 °C, MnO2 can transform into the more stable Mn3O4 in air or oxygen. In this study, the sample was calcined at 1050 °C for 2 h, followed by immediate quenching in pure water, causing tiny fluid inclusions to burst and release impurities. This approach facilitates subsequent purification steps for improved impurity removal.
The samples studied in this paper contain small amounts of pyrite, galena, zircon, and rutile. For these magnetic and heavy minerals, flotation alone is not sufficient for their effective removal. Therefore, prior to flotation, magnetic and heavy separation processes were employed to eliminate these minerals, ensuring that the sample contained only feldspar, mica, and quartz before flotation.
Flotation is a purification process that leverages the differences in crystal structures and surface properties between quartz minerals and its impurities, primarily feldspar silicate minerals. By adjusting the surface characteristics of both quartz and impurity minerals using various collectors and surface activators, it is possible to separate the impurity minerals from quartz (Sun and Yin, 2001; Peng et al., 2005; Wan and Wang, 2008). The effectiveness of flotation is influenced by several factors, including flotation temperature, choice of flotation agents, and pH control, all of which facilitate the physical separation of various minerals. Additionally, calcination and the water quenching of quartz can enhance the flotation process (Pang et al., 2020). The flotation reagents and conditions used in this study were specifically designed for feldspar and mica minerals. As a result, after flotation, feldspar and mica minerals were effectively removed. Given that only feldspar, mica, and quartz remained in the samples HT and PX after magnetic and gravity separation, quartz was the only mineral left after flotation.
A significant number of trace elements in quartz exist as mineral inclusions within quartz crystal or at the boundaries of crystal grains. Physically separating these mineral inclusions to effectively reduce impurity content is challenging. However, mixed acid dissolution can address this issue by exploiting the unique property that quartz can only be dissolved by various acids. Commonly used acids include sulfuric acid, hydrochloric acid, nitric acid, and hydrofluoric acid. Sulfuric acid is particularly effective for dissolving sulfide ores and pyrite, while nitric acid works well on pyrite, marcasite, and arsenopyrite. Hydrofluoric acid is effective for dissolving silicate minerals (Ma et al., 2019). Given the diverse and complex nature of impurities present in natural quartz minerals, the use of mixed acid treatment has proven to be the most effective method for purifying quartz sand (Terry, 1983).
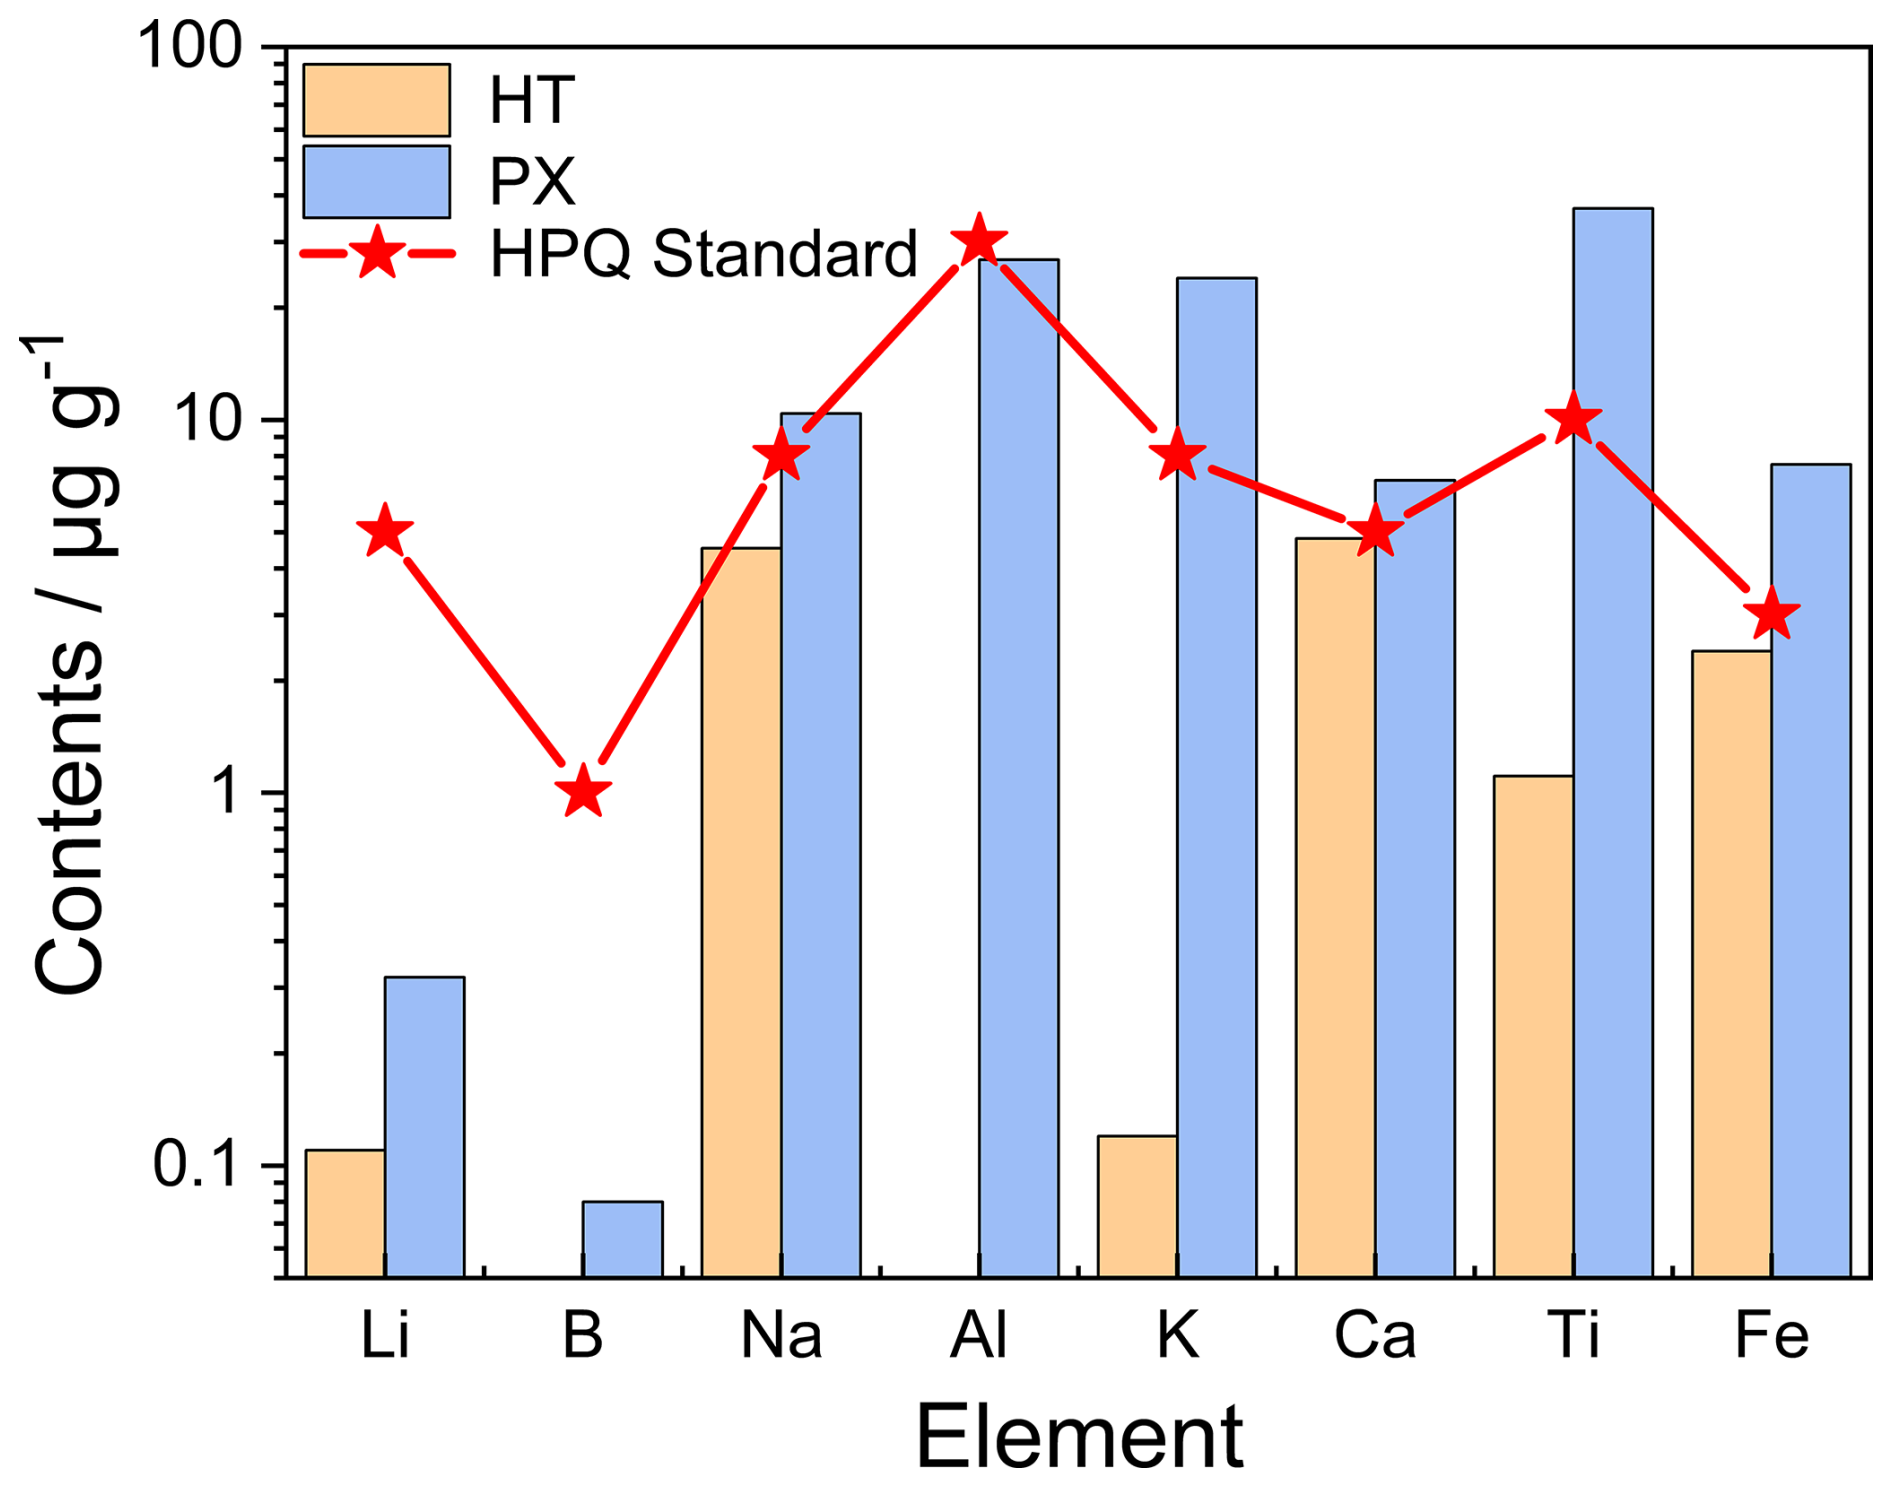
Figure 10Eight detrimental trace elements in HT and PX processed quartz sand samples along with the suggested upper limits of HPQ (modified after Müller et al., 2012). The contents of B and Al in HT processed quartz are below the detection limit of the instrument.
After purification, the HT vein quartz met the HPQ standard, indicating that the symbiotic minerals, such as pyrite, galena, and potassium feldspar, were successfully removed during the process. However, the PX vein quartz contains elevated levels of Na, K, Ca, Ti, and Fe, surpassing the upper limit for HPQ standards, and therefore does not meet the HPQ specifications (Fig. 10). The high concentrations of Fe and alkali metals (Na, K, Ca) may result from residual micron- and submicron-sized fluid inclusions and iron compounds that were not eliminated during purification. Additionally, the elevated Ti content may stem from the presence of rutile that was not removed during flotation, or it could exist as lattice impurities within the quartz crystals.
5.3 Economic assessment of HPQ potential
This section evaluates the industrial applications and economic potential of the Qianqi Furong mine as a source of HPQ. According to the criteria established by Harben (2002) and Müller et al. (2012), the maximum allowable concentrations of the nine critical detrimental elements in HPQ are as follows: Al <30 µg g−1, Ti <10 µg g−1, Na <8 µg g−1, K <8 µg g−1, Li <5 µg g−1, Ca <5 µg g−1, Fe <3 µg g−1, P <2 µg g−1, and B <1 µg g−1. Furthermore, the cumulative total of all these elements should not exceed 50 µg g−1.
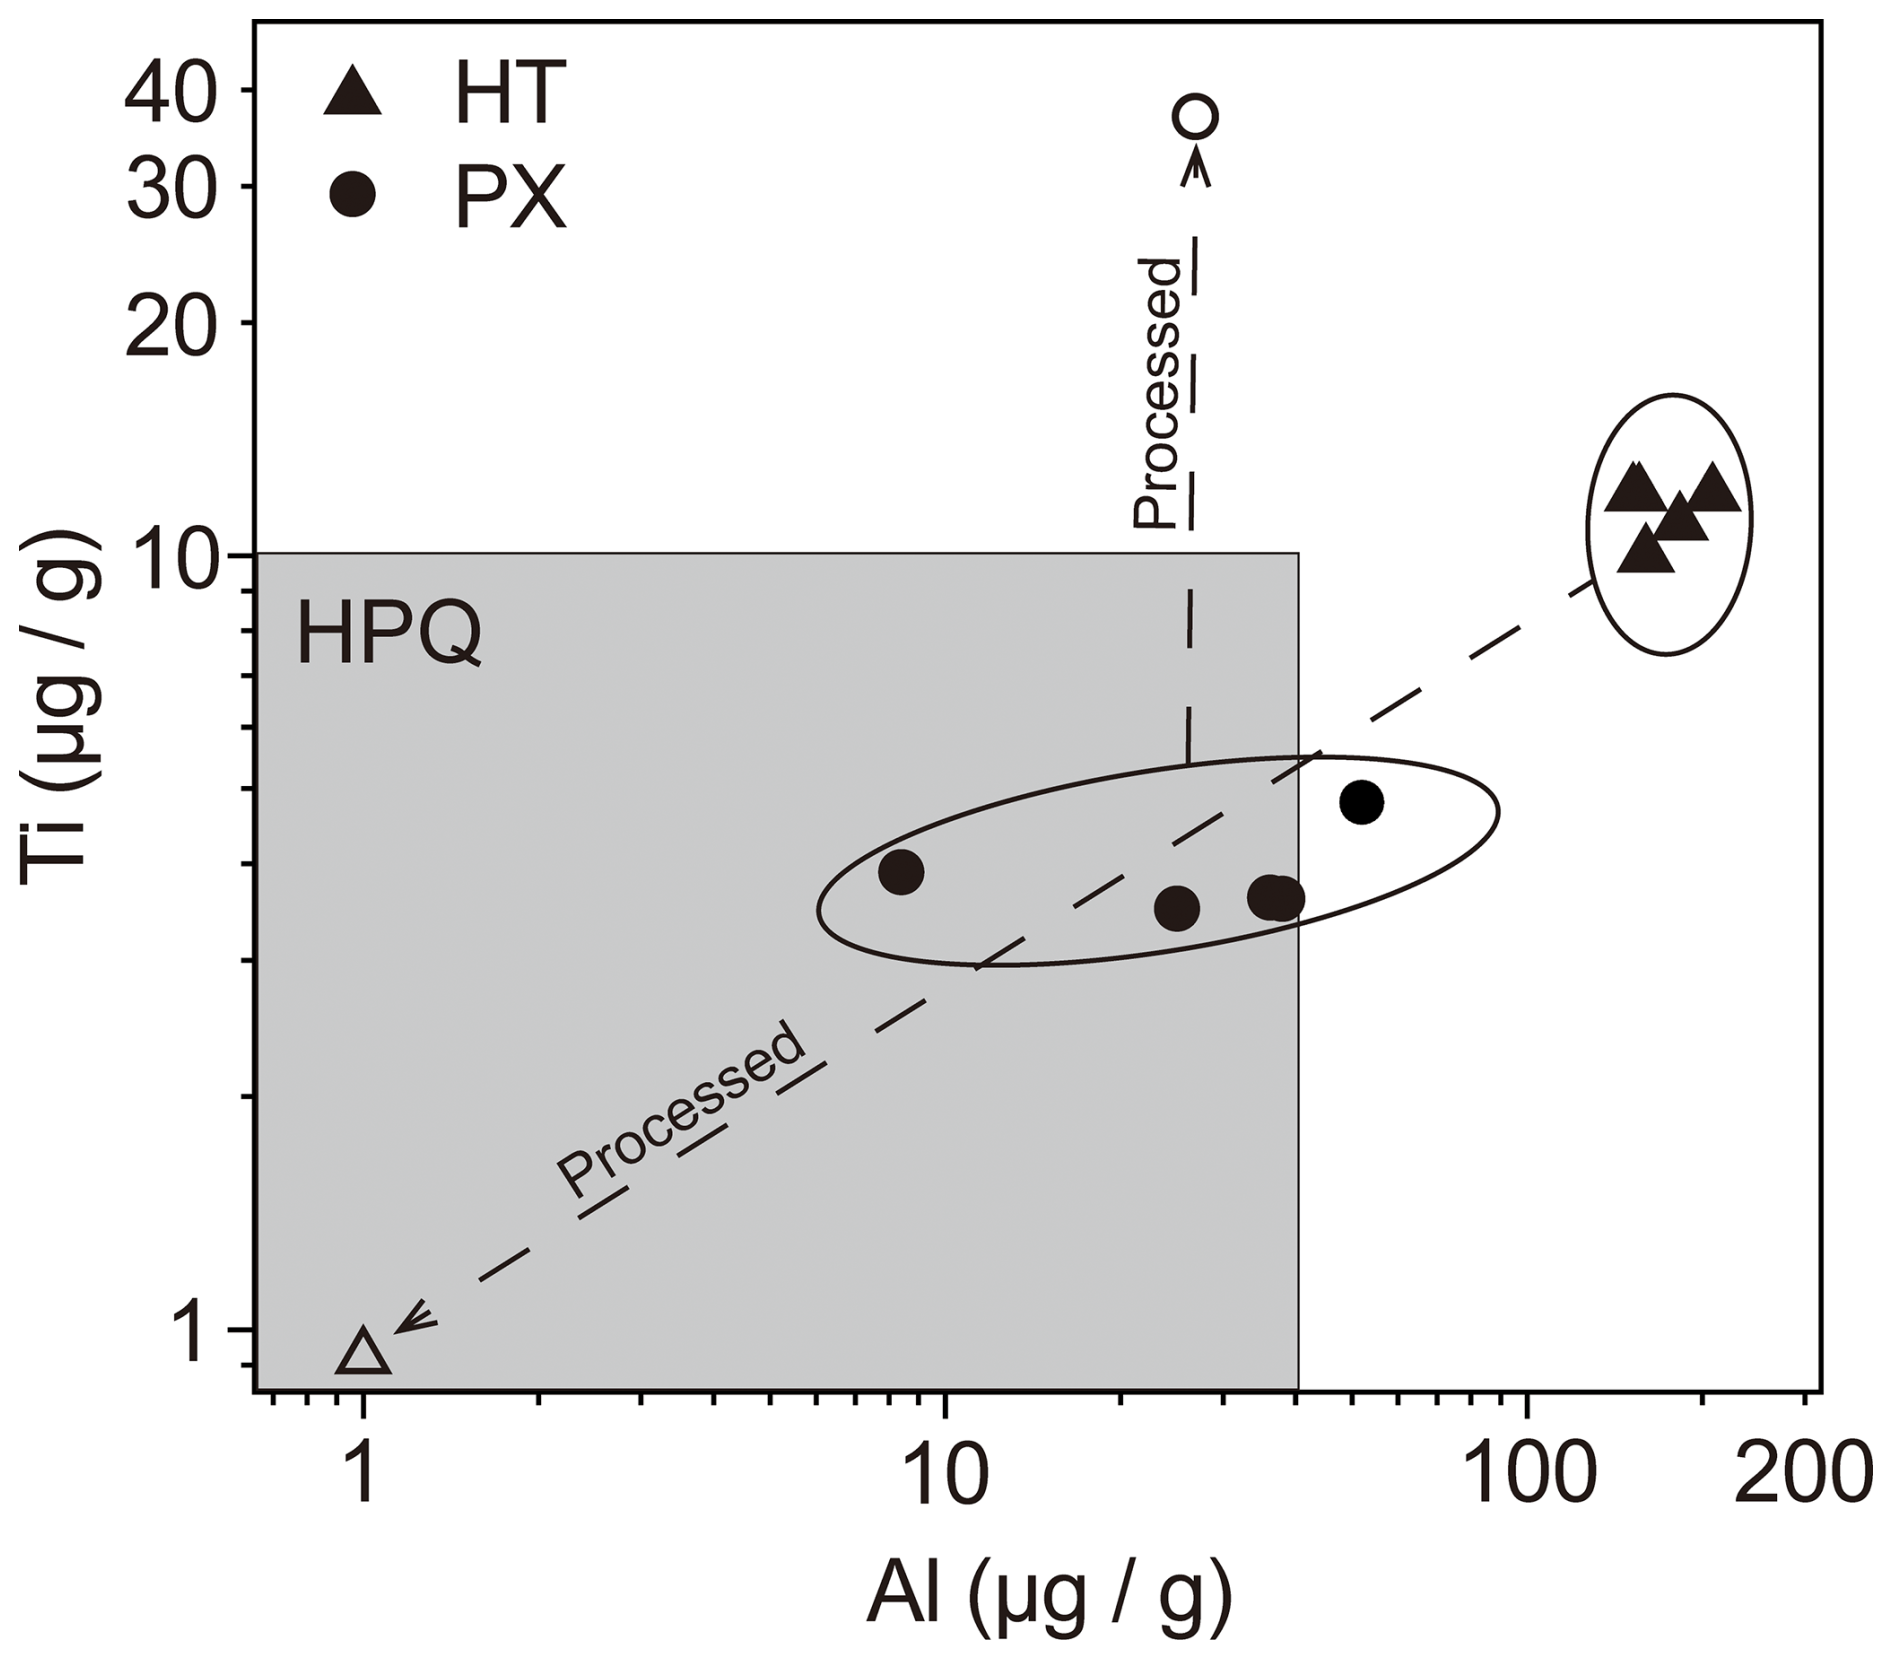
Figure 11Al and Ti concentrations from LA-ICP-MS analyses of raw quartz of HT and PX and from ICP-MS analyses of processed quartz of HT and PX plotted into the field of HPQ according to Harben (2002) and Müller et al. (2007).
Figure 11 displays the measured concentrations of Al and Ti in the vein quartz HT and PX. While the purified vein quartz HT falls within the HPQ field, the Ti content of the vein quartz PX increases after purification, exceeding the recommended Ti levels. This increase may be attributed to the nature of the LA-ICP-MS analysis, which targeted a relatively clean area with minimal inclusions, focusing solely on quartz and excluding associated minerals. In contrast, the purified quartz sand was analyzed using ICP-MS, which may have detected additional Ti from residual rutile or Ti incorporated within the quartz lattice. It is generally noted that Ti content in pegmatitic quartz is typically low, so if more advanced processing technologies such as chlorination are employed in the future, it is reasonable to expect that trace element levels could be further reduced.
The concentrations of processed quartz in the PX mining area present an unfavorable outlook. The total trace element concentration is 114.56 µg g−1, which exceeds the upper limit of 50 µg g−1. High levels of Na, K, and Ca may be attributed to residual muscovite inclusions, while Ti is likely present within the quartz lattice, making it difficult to remove by conventional methods. In contrast, the processed quartz from the HT mining area has a total trace element concentration of 18.72 µg g−1, which meets the HPQ requirement. As a result, the primary challenge remains the effective separation of quartz from other minerals in the PX mining area.
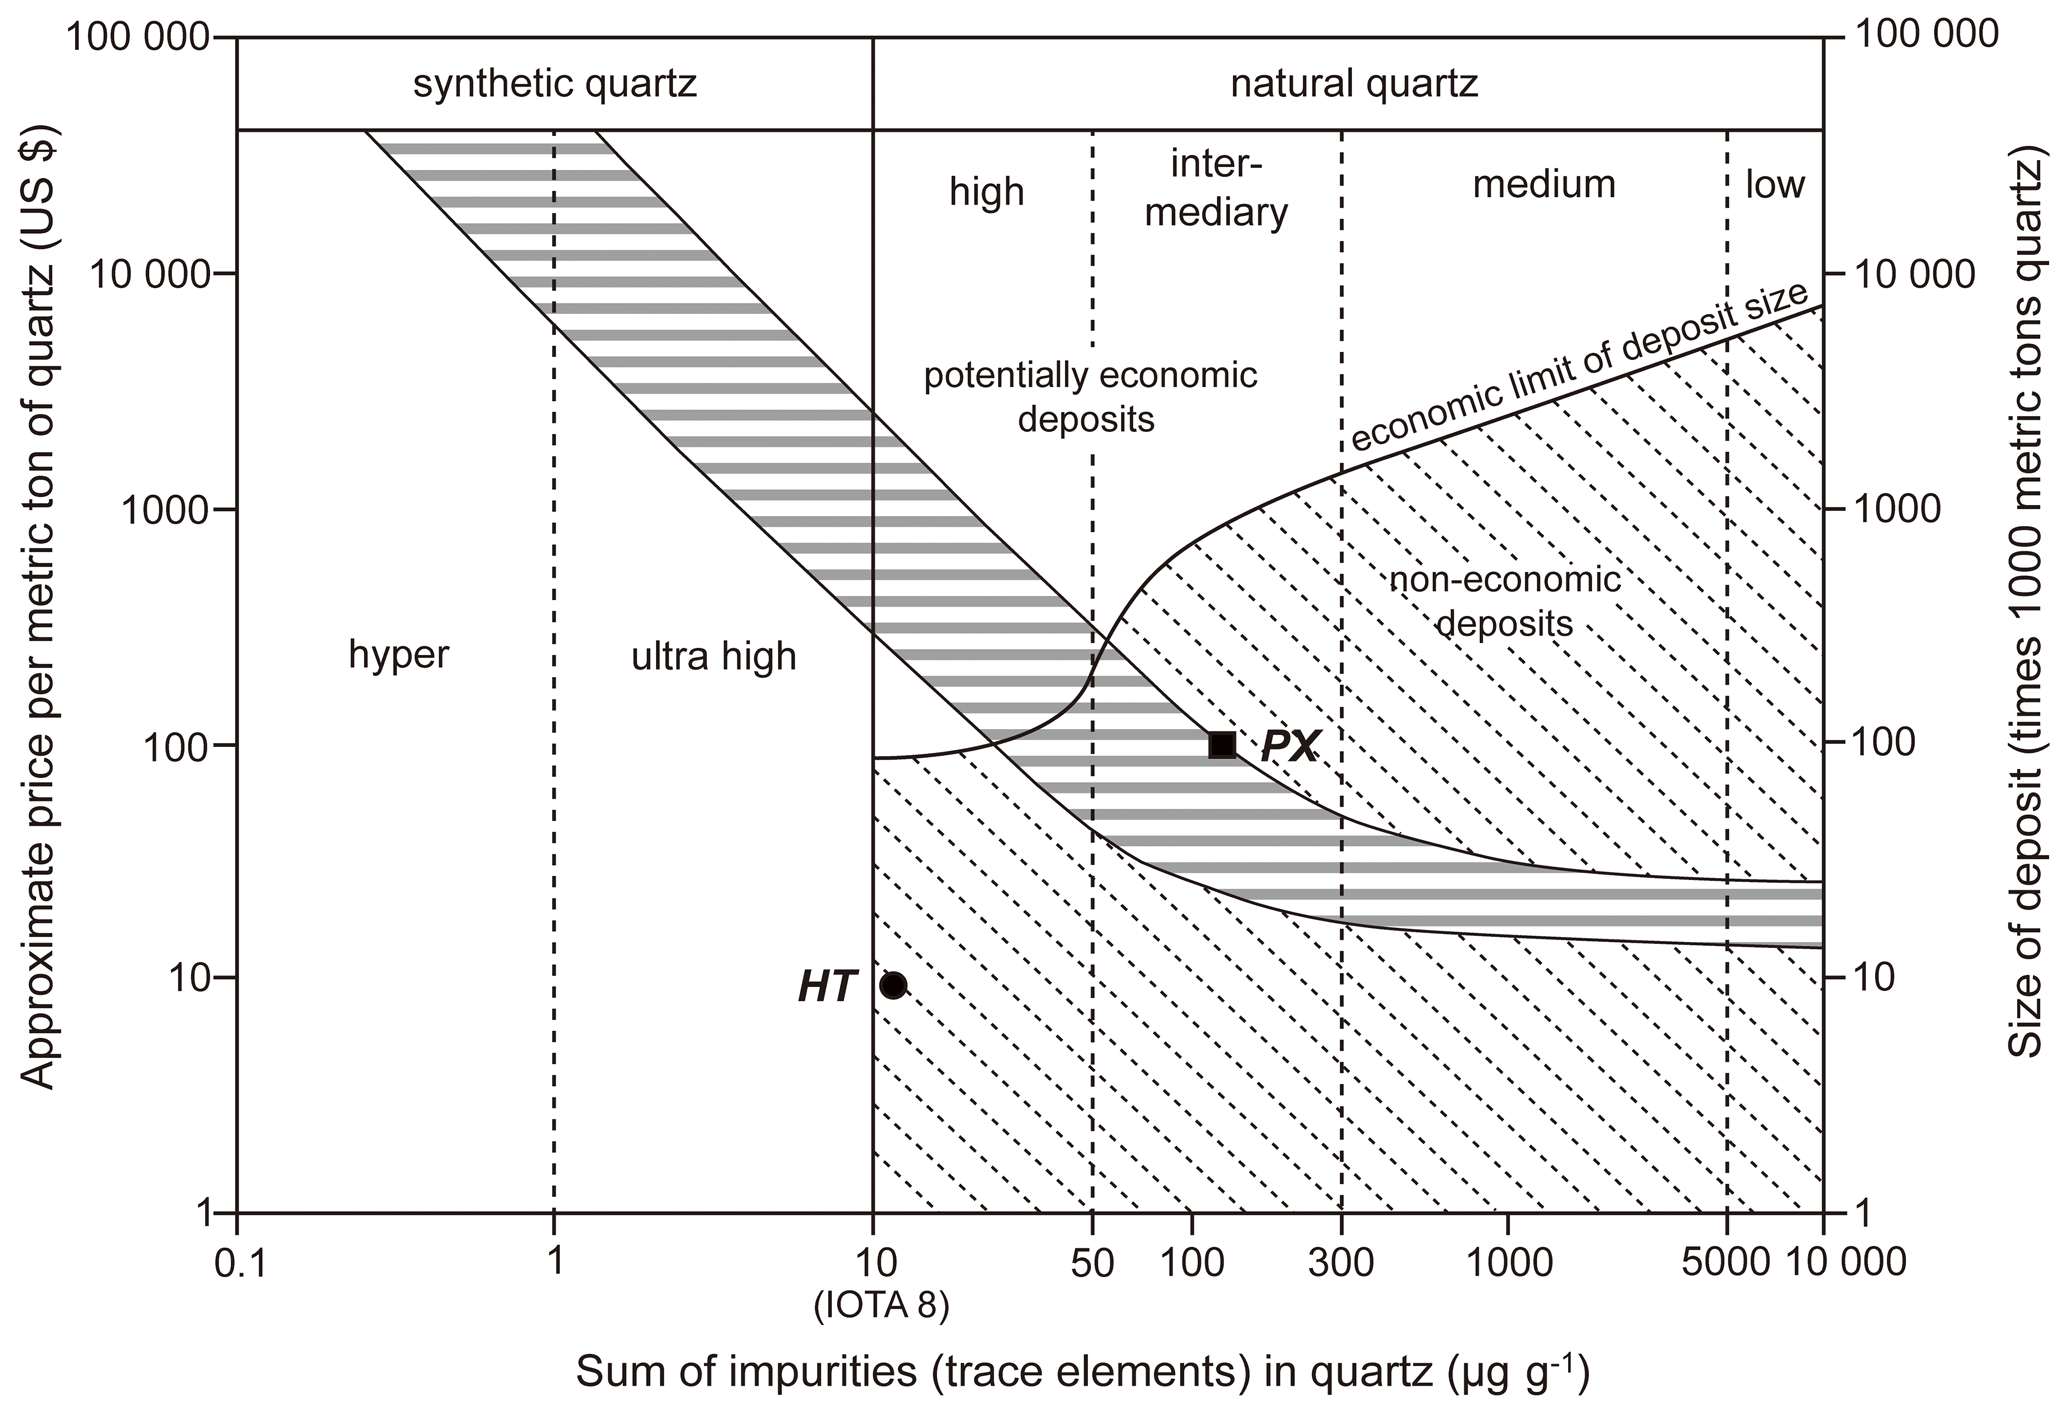
Figure 12Graph of deposit size, total element content, and price estimation range according to Harben (2002) and Müller et al. (2012), showing the economic potential of the Qianqi Furong mine.
Although the quartz in the HT mining area qualifies as HPQ after purification, the reserves are limited to 9834.2 metric tons. In contrast, the PX mining area has more substantial reserves, totaling 100 000 metric tons. However, due to the high trace element content, this quartz can only be classified as intermediary quality. Moreover, as illustrated in Fig. 12, both mining areas fall within the non-economic deposit category due to their limited reserves.
While the two mining areas investigated in this study have not been classified as potential economic deposits (Fig. 12), field investigations revealed that the Furong Qianqi mine encompasses several additional pegmatite mining sites that are currently being exploited. If these additional pegmatite mining areas are integrated into the overall resource management, the combined potential of the region still holds significant economic value.
In this study, we focused on the genesis of the PX and HT pegmatite mining areas, as well as their potential and economic evaluation as sources of high-purity quartz (HPQ). We investigated the petrological characteristics and trace element contents of quartz samples from pegmatites from both mining areas, both before and after processing. The main conclusions are as follows:
-
The primary associated minerals of quartz in the HT pegmatite vein include potassium feldspar, pyrite, and galena, along with some gas–liquid inclusions. In contrast, the main associated minerals in the PX vein quartz are muscovite, rutile, and zircon. Furthermore, fluid inclusions are also common in it.
-
LA-ICP-MS analysis revealed that the SiO2 content in raw quartz from both HT and PX was relatively low (HT: 99.963 wt %–99.970 wt %, PX: 99.974 wt %–99.985 wt %). However, the purity of quartz improved significantly after purification through calcination, flotation, and acid leaching, as demonstrated by ICP-MS analysis (HT: 99.998 wt %, PX: 99.989 wt %).
-
The genesis of the HT and PX pegmatite mining areas was analyzed based on trace element contents – specifically Al, Li, and Ge – as determined by LA-ICP-MS. Combined with petrographic analysis, it was found that both pegmatites formed under relatively stable hydrothermal conditions. They exhibit similar trace element characteristics, suggesting a possible common origin. However, differences in intrusion patterns and the external environment during their later formation processes have resulted in the distinctions observed today.
-
An economic evaluation of the HT and PX pegmatite mining areas indicated that their small reserves place them in the category of non-economic deposits. Nevertheless, our field investigations identified additional pegmatite mining areas in the Qianqi Furong mine region. Therefore, if these other pegmatite mining areas in Qianqi Furong are comprehensively utilized, they still possess significant economic potential.
All data derived from this research are presented in Figs. 1, 2, 3, 4, 5, 6, 7, 8, 9, 10, 11, and 12 and in Table 1.
SQ: conceptualization, methodology, and writing (original draft preparation). XY: supervision, methodology, writing (review and editing), and funding acquisition. MX: conceptualization, writing (review and editing), formal analysis, and investigation. ZH: formal analysis and investigation. YW: funding acquisition, formal analysis, and investigation.
The contact author has declared that none of the authors has any competing interests.
Publisher's note: Copernicus Publications remains neutral with regard to jurisdictional claims made in the text, published maps, institutional affiliations, or any other geographical representation in this paper. While Copernicus Publications makes every effort to include appropriate place names, the final responsibility lies with the authors. Views expressed in the text are those of the authors and do not necessarily reflect the views of the publisher.
We are grateful to Ibara Khan, Jamuna Thapa Magar, Li-ting Sun, and Yue Qiu for their help with the purification experiments.
This study was financially supported by grants from the National Key Research and Development Program on Strategic Mineral Resources Development and Utilization (grant no. 2024YFC2910101) and the National Natural Science Foundation of China (grant no. 42230801).
This paper was edited by Vincent van Hinsberg and reviewed by Alfons van den Kerkhof and one anonymous referee.
Becker, J., Ouml, R., and Nowak, J.: Method for purifying SiO2-particles, US Patent: 6746655B1, https://patents.google.com/patent/US6746655B1/en (last access: 11 December 2025), 2000.
Breiter, K., Svojtka, M., Ackerman, L., and Švecová, K.: Trace element composition of quartz from the Variscan Altenberg–Teplice caldera (Krušné hory/Erzgebirge Mts, Czech Republic/Germany): Insights into the volcano-plutonic complex evolution, Chemical Geology, 326–327, 36–50, https://doi.org/10.1016/j.chemgeo.2012.07.028, 2012.
Černý, P. and Ercit, T. S.: The classification of granitic pegmatites revisited, The Canadian Mineralogist, 43, 2005–2026, 2005.
Chu, X., Shen, P., Bai, Y., Feng, H., Luo, Y., and Li, C.: Quartz chemical composition and apatite thermochronology trace leucogranite evolution and thermal history in the Koktokay No. 3 rare metal deposit, Chinese Altai, Ore Geology Reviews, 167, 106008, https://doi.org/10.1016/j.oregeorev.2024.106008, 2024.
Demir, C., Gülgonul, I., Bentli, I., and Çelik, M. S.: Differential separation of albite from microcline by monovalent salts in HF medium, Mining, Metallurgy & Exploration, 20, 120–124, https://doi.org/10.1007/BF03403143, 2003.
Götze, J.: Classification, Mineralogy and Industrial Potential of SiO2 Minerals and Rocks, in: Quartz: Deposits, Mineralogy and Analytics, edited by: Götze, J. and Möckel, R., Springer Berlin Heidelberg, Berlin, Heidelberg, 1–27, https://doi.org/10.1007/978-3-642-22161-3_1, 2012.
Harben, P.: The Industrial Mineral Handy Book – A Guide to Markets, Specifications and Prices. 4th edn., Industrial Mineral Information, Worcester Park, England, 412 pp., ISBN 1904333044, 2002.
Haßler, S., Kempe, U., Monecke, T., and Götze, J.: Trace element content of quartz from the Ehrenfriedersdorf Sn-W deposit, Germany: Results of an acid-wash procedure, Berlin, Heidelberg, 397–400, https://doi.org/10.1007/3-540-27946-6_104, 2005.
Haus, R., Prinz, S., and Priess, C.: Assessment of High Purity Quartz Resources, in: Quartz: Deposits, Mineralogy and Analytics, edited by: Götze, J., and Möckel, R., Springer Berlin Heidelberg, Berlin, Heidelberg, 29–51, https://doi.org/10.1007/978-3-642-22161-3_2, 2012.
Jacamon, F. and Larsen, R. B.: Trace element evolution of quartz in the charnockitic Kleivan granite, SW-Norway: The ratio of quartz as an index of igneous differentiation, Lithos, 107, 281–291, https://doi.org/10.1016/j.lithos.2008.10.016, 2009.
Jin, D., Zhang, X., and Zou, W.: Study on the Processing Technology of High Purity Quartz, China Non-metallic Minerals Industry, 44–46+48, 2004.
Kemmochi, K., Miyazawa, H., Watanabe, H., Maekawa, K., Tsuji, C., and Saitou, M.: High-purity quartz glass and method for the preparation thereof, US Patent: 5968259A, https://patents.google.com/patent/US5968259A/en (last access: 11 December 2025), 1999.
Khan, I., Yang, X., Xia, M., and Hou, Z.: Analyzing petrographic characteristics and trace element distribution of high-purity quartz deposits from the Peshawar Basin, Pakistan: insights into processing and purification techniques, Eur. J. Mineral., 37, 151–167, https://doi.org/10.5194/ejm-37-151-2025, 2025.
Larsen, R., Polve, M., and Juve, G.: Granite pegmatite quartz from Evje-Iveland: Trace element chemistry and implications for high-purity quartz formation of high-purity quartz, Norges Geologiske Undersøkelse Bulletin, 436, 57–66, 2000.
Larsen, R. B., Henderson, I., Ihlen, P. M., and Jacamon, F.: Distribution and petrogenetic behaviour of trace elements in granitic pegmatite quartz from South Norway, Contributions to Mineralogy and Petrology, 147, 615–628, 2004.
Lei, Q. and Zheng, D.: A review of preparation methods and applications for high-purity quartz, Jiangxi Sci., 26, 915–918, https://doi.org/10.13990/j.issn1001-3679.2008.06.016, 2008.
Lei, S., Pei, Z., Zhong, L., Ma, Q., Huang, D., and Yang, Y.: Study on the Technology and Mechanism of Reverse Flotation and Hot Pressing Leaching with Vein Quartz, NonMetallic Mines, 02, 40–43, 2014.
Lin, M., Liu, Z., Wei, Y., Liu, B., Meng, Y., Qiu, H., Lei, S., Zhang, X., and Li, Y.: A Critical Review on the Mineralogy and Processing for High-Grade Quartz, Mining, Metallurgy & Exploration, 37, 1627–1639, https://doi.org/10.1007/s42461-020-00247-0, 2020.
Liu, G., Zhang, W., Ma, Z., and Yong, L.: Present situation of researching on purifying silica by mineral processing, Non-Ferrous Mining and Metallurgy, 6, 26–30, 2007.
Liu, L., Gao, H., and Zhang L.: Study on Mineral Processing Technology of High Purity Quartz Sand, Non-Metallic Mines, 39–41+14, 1996.
Liu, Y., Hu, Z., Gao, S., Günther, D., Xu, J., Gao, C., and Chen, H.: In situ analysis of major and trace elements of anhydrous minerals by LA-ICP-MS without applying an internal standard, Chemical Geology, 257, 34–43, https://doi.org/10.1016/j.chemgeo.2008.08.004, 2008.
Liu, Z., Ma, L., Shi, X. and Zha, L.: Preparation of quartzite reference materials for chemical composition analysis, Rock and Mineral Analysis, 33, 849–856, https://doi.org/10.15898/j.cnki.11-2131/td.2014.06.015, 2014.
London, D., Cerny, P., and Martin, R. F.: Pegmatites, Mineralogical Association of Canada, edited by: Martin, R. F., Québec, Canada, 347 pp., ISBN 9780921294474, 2008.
Ma, C., Feng, A., Liu, C., Shao, W., and Zhao, P.: Mineralogical characteristics and progress in processing technology of raw materials of high purity quartz, Conserv. Util. Miner. Resour, 39, 48–57, https://doi.org/10.13779/j.cnki.issn1001-0076.2019.06.008, 2019.
Müller, A., Ihlen, P. M., Wanvik, J. E., and Flem, B.: High-purity quartz mineralisation in kyanite quartzites, Norway, Mineralium Deposita, 42, 523–535, https://doi.org/10.1007/s00126-007-0124-8, 2007.
Müller, A., Wanvik, J. E., and Ihlen, P. M.: Petrological and Chemical Characterisation of High-Purity Quartz Deposits with Examples from Norway, in: Quartz: Deposits, Mineralogy and Analytics, edited by: Götze, J., and Möckel, R., Springer Berlin Heidelberg, Berlin, Heidelberg, 71–118, https://doi.org/10.1007/978-3-642-22161-3_4, 2012.
Müller, A., Ihlen, P. M., Snook, B., Larsen, R. B., Flem, B., Bingen, B., and Williamson, B. J.: The Chemistry of Quartz in Granitic Pegmatites of Southern Norway: Petrogenetic and Economic Implications, Economic Geology, 110, 1737–1757, https://doi.org/10.2113/econgeo.110.7.1737, 2015.
Müller, A., Keyser, W., Simmons, W. B., Webber, K., Wise, M., Beurlen, H., Garate-Olave, I., Roda-Robles, E., and Galliski, M. Á.: Quartz chemistry of granitic pegmatites: Implications for classification, genesis and exploration, Chemical Geology, 584, 120507, https://doi.org/10.1016/j.chemgeo.2021.120507, 2021.
Ning, S., Wang, F., Xue, W., and Zhou, T.: Geochemistry of the Baoshan pluton in the Tongling region of the Lower Yangtze River Belt, Geochimica, 46, 397–412, https://doi.org/10.19700/j.0379-1726.2017.05.001, 2017.
Pang, Q., Shen, J., Cheng, C., Guo, H., Sun, X., and Li, W.: Processing technology and application of high purity quartz, Jiangsu Ceram. Acad. Res., 53, 43–46, https://doi.org/10.16860/j.cnki.32-1251/tq.2020.04.013, 2020.
Peng, L., Cao, X., and Du, P.: The Studies of Collectors to Catch Aluminum Silicate Minerals, Journal of Guangxi University For Nationalities (Natural Science Edition), 02, 90–93, https://doi.org/10.16177/j.cnki.gxmzzk.2005.02.023, 2005.
Peterková, T. and Dolejš, D.: Magmatic-hydrothermal transition of Mo-W-mineralized granite-pegmatite-greisen system recorded by trace elements in quartz: Krupka district, Eastern Krušné hory/Erzgebirge, Chemical Geology, 523, 179–202, https://doi.org/10.1016/j.chemgeo.2019.04.009, 2019.
Phelps, P. R., Lee, C.-T. A., and Morton, D. M.: Episodes of fast crystal growth in pegmatites, Nature communications, 11, 4986, https://doi.org/10.1038/s41467-020-18806-w, 2020.
Sato, T., Watanabe, H., and Ponto, W.: Process for continuous refining of quartz powder, US Patent: 5637284A, https://patents.google.com/patent/US5637284A/en (last access: 11 December 2025), 1997.
Shen, S.: The actuality of study and manufacture in higher purity quartz, China Non-Met. Miner. Ind. Her., 5, 13–16, 2006.
Sun, C. and Yin, W.: Review on research status on flotation principles of silicate minerals, Conserv. Util. Miner. Resour, 3, 17–22, https://doi.org/10.13779/j.cnki.issn1001-0076.2001.03.007, 2001.
Terry, B.: The acid decomposition of silicate minerals part I. Reactivities and modes of dissolution of silicates, Hydrometallurgy, 10, 135–150, 1983.
Tian, J. X.: Researches of extraction technology of high-grade quartz sand, China Mining Magazine, 03, 59–62, 1999.
Wan, P. and Wang, Z.,: Study of flotation technology of feldspar and quartz, Mining Engineering, 2, 32–35, 2008.
Wang, L., Li, C., Wang, Y., and Yin, D.: China technologies present of high-purity quartz processing and the development propositions, J. Mineral. Petrol., 31, 110–114, 2011.
Wang, L., Dang, C., Li, C., Wang, Y., Wei, Y., Xia, J., and Pan, J.: Technology of high-purity quartz in China: Status quo and prospect, Earth Science Frontiers, 21, 267–273, 2014.
Wang, L.: Concept of high purity quartz and classification of its raw materials, Conservation and Utilization of Mineral Resources, 42, 55–63, https://doi.org/10.13779/j.cnki.issn1001-0076.2022.05.009, 2022.
Wu, F. Y., Liu, X. C., Wang, J. M., Chen, H. B., Hu, F. Y., and Liu, Z. C.: Highly fractionated granite and high-purity quartz, Acta Petrologica Sinica, 41, 3243–3277, 2025.
Xia, M., Sun, C., Yang, X., and Chen, J.: Assessment of Gold-Bearing Quartz Vein as a Potential High-Purity Quartz Resource: Evidence from Mineralogy, Geochemistry, and Technological Purification, Minerals, 13, 261, https://doi.org/10.3390/MIN13020261, 2023.
Xu, Z., Liu, Z., and Yang, Z.: The composition and characteristics of the Early Precambrian metamorphic strata in Daqingshan region, Inner Mongolia, Global Geology, 20, 209–218, 2001.
Xu, Z., Liu, Z., and Yang, Z.: The strata texture of khondalite in Daqingshan area, Inner Mongolia, Journal of Jilin University (Earth Science Edition), 32, 313–318, 2002.
Xu, Z., Liu, Z., and Yang, Z.: Structures of early metamorphic strata in the khondalite series in the Daqingshan-Wulashan area, Inner Mongolia: Results of the sub-horizontal bedding-parallel detachment deformation in the lower crust, Journal of Stratigraphy, 29, 423–432, 2005.
Yang, Z., Xu, Z., and Liu, Z.: Khondalite event and Archean crust structure evolvement, Progress in precambrian research, 23, 206–212, 2000.
Yang, Z., Xu, Z., Liu, Z., and Peng, X.: Consideration and practice of the construction of litho stratigraphic systems in high-grade metamorphic terrains – A case study in the Daqingshan-Wulashan area, Geology in China, 30, 343–351, 2003.
Yang, X., Sun, C., Cao, J., and Shi, J.: High purity quartz: Research progress and perspective review, Earth Science Frontiers, 29, 231, https://doi.org/10.13745/j.esf.sf.2021.8.1, 2022.
Yuan, X. and Wu, X.: Gaoxiang Du,, Purifying Technology of Preparing High Purity Quartz Sands from Vein Quartz Ore, China Powder Science & Technology, 19, 52–27, 2013.
Yuan, Y., Moore, L. R., McAleer, R. J., Yuan, S., Ouyang, H., Belkin, H. E., Mao, J., Sublett, D. M., and Bodnar, R. J.: Formation of miarolitic-class, segregation-type pegmatites in the Taishanmiao batholith, China: The role of pressure fluctuations and volatile exsolution during pegmatite formation in a closed, isochoric system, American Mineralogist, 106, 1559–1573, https://doi.org/10.2138/am-2021-7637, 2021.
Zhang, L., Liu, L., Zhu, L., Wang, H., and Yuan, Y.: Discussion on the geological evaluation for high purity quartz raw material, Acta Petrologica Sinica, 40, 1311–1326, 2024.
Zhang, Y., Zhao, H., Liu, L., Pan, J., Zhu, L., Liu, G., and Zhang, X.: Timing of granite pegmatite-type high-purity quartz deposit in the Eastern Qinling, China: constraints from in-situ LA-ICP-MS trace analyses of quartz and monazite U–Pb dating, Acta Geochimica, 41, 197–207, https://doi.org/10.1007/s11631-021-00505-y, 2022.
Zhao, G., Wilde, S. A., Cawood, P. A., and Lu, L.: Thermal evolution of two textural types of mafic granulites in the North China craton: evidence for both mantle plume and collisional tectonics, Geological Magazine, 136, 223–240, https://doi.org/10.1017/S001675689900254X, 1999.
Zhao, G., Wilde, S. A., Cawood, P. A., and Sun, M.: Archean blocks and their boundaries in the North China Craton: lithological, geochemical, structural and P–T path constraints and tectonic evolution, Precambrian Research, 107, 45–73, https://doi.org/10.1016/S0301-9268(00)00154-6, 2001.
Zhao, G., Sun, M., Wilde, S. A., and Sanzhong, L.: Late Archean to Paleoproterozoic evolution of the North China Craton: key issues revisited, Precambrian Research, 136, 177–202, https://doi.org/10.1016/j.precamres.2004.10.002, 2005.
Zhao, G., Wilde, S. A., Guo, J., Cawood, P. A., Sun, M., and Li, X.: Single zircon grains record two Paleoproterozoic collisional events in the North China Craton, Precambrian Research, 177, 266–276, https://doi.org/10.1016/j.precamres.2009.12.007, 2010.
Zhao, H., Zhang, Q., and Zhang, Y.: A review of the impurity element chemistry and textures of natural quartz and its application to the prospect of high purity quartz deposit, Northwestern Geology, 57, 106–119, 2024.