the Creative Commons Attribution 4.0 License.
the Creative Commons Attribution 4.0 License.
 | 25 Nov 2025
Ordering of tetrahedral and octahedral layers in synthetic lepidolites and Li-muscovites: two-dimensional {1H} → 29Si ∕ 27Al CPMAS HETCOR and {19F} → 29Si ∕ 27Al CPMAS HETCOR spectroscopy
Michael Fechtelkord
Lara Sulcek
Cationic ordering in the octahedral and tetrahedral sheets of synthetic lepidolites with composition K(LixAl3−x)[Si2xAl4−2xO10](OH)yF2−y and Li-muscovites with K(LixAl[Si3AlO10](OH)yF2−y has been investigated using two-dimensional (2-D) cross-polarisation magic-angle-spinning (CPMAS) heteronuclear correlation (HETCOR) solid-state nuclear magnetic resonance (NMR) spectroscopic experiments. The nominal composition ranged between (x=1.5–2.0; y=0.0–2.0) and (x=0.0–1.5; y=0.0–2.0), respectively. {1H}→29Si CPMAS HETCOR solid-state NMR spectra show a clear preferred neighbourhood of the octahedral Li2Al-OH environments close to tetrahedral Si(OSi)3. On the other hand, the LiAl2-OH group shows a preference to be close to Si(OSi)3 and Si(OAl)(OSi)2 environments in the tetrahedral sheet. {19F}→29Si CPMAS HETCOR solid-state NMR spectra show similar results of the Li2Al-F environments close to Si(OSi)3 and LiAl2-F groups to be close to the Si(OSi)3 and Si(OAl)(OSi)2 environments. However, each 19F NMR signal is split into two signals. One component of the Li2Al-F signal shows a slightly stronger correlation to the Si(OAl)2(OSi) groups. Signals resulting from the LiAl2-F groups show much lower signal-to-noise ratio, as F prefers to be coordinated by Li2Al. {1H}→27Al 2-D CPMAS HETCOR NMR spectroscopy shows a direct neighbourhood of OH groups to both octahedral and tetrahedral Al but only for OH coordinated by LiAl2. For Li2Al coordinations, only a correlation to octahedral Al is visible. In the {19F}→27Al CPMAS HETCOR experiments, the splitting of the Li2Al-F signal can be also observed here with a stronger correlation to the [4]Al sites. All results show an ordering of the tetrahedral sheets depending on the octahedral composition. The distribution shows a tendency of an incorporation of F− next to Li-rich environments and of OH− anions next to Al-rich environments.
- Article
(3251 KB) - Full-text XML
- Companion paper
- BibTeX
- EndNote


Fluorine is often present in silicic magmas in only minor amounts, but it can be strongly enriched in the melt during ongoing crystallisation because of its incompatible behaviour. Only a few minerals formed from the melt are able to incorporate F. Even small amounts of F influence the physical properties of the melt. An increasing F content causes an increase in the water solubility (Holtz et al., 1993) and a decrease in the solidus temperature (Manning, 1981) and viscosity (Dingwell et al., 1993). Therefore, it is necessary to understand the partitioning processes of F between every instance of the mineral and the co-existing melt, including, on the one hand, studies of phase equilibria and partition coefficients and to obtain thermal stability of mica, but on the other hand also investigations of the local F environment of the melt and the F-containing crystal structures. The structural integration of F in layered silicates and aluminosilicate glasses has been the subject of only a small number of solid-state nuclear magnetic resonance (NMR) investigations, but they have significantly advanced our knowledge of the structural compositions. Kohn et al. (1991) and Schaller et al. (1992) determined AlF complexes in F-containing glasses by NMR spectroscopy. The formation of AlF complexes in melts explains the increasing depolymerisation and thus the decreasing viscosity of the melt with increasing F content (e.g., Dingwell et al., 1987). Usually, Al is bonded to O atoms at the tetrahedral sites within the glass framework. When F complexes are introduced, they displace the Al atoms from the framework.
The micas phlogopite (K(Mg)3[Si3AlO10](OH, F)2), biotite (K(Mg, Fe)3[Si3AlO10](OH, F)2), and lepidolite (K(Li, Al)3[(Si, Al)4O10](OH, F)2) are phyllosilicates of particular interest as they can incorporate large amounts of F (Fleet, 2003). Robert et al. (1993), Papin et al. (1997), and Boukili et al. (2001) found that F strongly prefers micas with trioctahedral environments. In this case, hydroxyl groups with high OH bond strengths can be easily substituted by F. In contrast, in dioctahedral environments, the hydroxyl group is involved in H bonds with O atoms from the adjacent tetrahedral sheet. As it is acting as a dipole rather than a sphere-like anion, a replacement by F is difficult (Robert et al., 1993). In their IR spectroscopic study, Papin et al. (1997) demonstrated that the distribution in Al-rich phlogopite is not statistically random, but that the F− anions prefer Mg2Al coordination, and the OH− groups prefer Mg3 coordination. These findings agree with the 19F, 1H, and 29Si magic-angle-spinning (MAS) NMR study of Langner and Fechtelkord (2012). Boukili et al. (2002) investigated the relationship between F content and cation distribution over octahedral cation sites coordinated by four layer-oxygens and two . They concluded that F–OH substitution is controlled in micas by the geometric adjustment of tetrahedral and octahedral layers, not by Al-F or Fe-F bond strength.
It can be shown that the mere presence of F achieves a tremendous loss of capability to incorporate Al into the phlogopite structure. Fluorine is usually located in Mg-rich octahedral and Si-rich tetrahedral clusters of the phlogopite structure, while OH groups are located in Al-rich octahedral and tetrahedral clusters as derived from cross-polarisation magic-angle-spinning (CPMAS) NMR spectroscopies (Fechtelkord and Langner, 2013). The ordering effect in these two basic structural clusters can also be proven by a smaller 29Si linewidth in the {19F}→29Si CPMAS NMR experiments compared to the usual 29Si MAS NMR experiment showing a stronger ordering of Si environments near the two different anion types of F− and OH− (Fechtelkord and Langner, 2013).
Within the group of mica minerals, the Li-mica lepidolite, which belongs to the polylithionite-trilithionite series, is able to incorporate the largest amounts of F (Foster, 1960). The possibility of exchanging cations and anions in the tetrahedral as well as in the octahedral layers leads to complex minerals. All micas consist of interconnected tetrahedral-octahedral-tetrahedral layers forming TOT blocks that are stacked along the c axis and are separated from each other by interlayer cations (Fleet, 2003). The T sites of the tetrahedral layers are occupied with Si or Al, the octahedral layers contain Li and Al or a vacancy, and the interlayer cation is potassium. Each octahedral position is coordinated by four O atoms belonging to the tetrahedral layer and two OH− or F− anions either in cis- or trans-coordination. The end members trilithionite K(Li1.5Al1.5)[Si3AlO10](OH, F)2 and polylithionite K(Li2Al)[Si4O10]F2 exhibit a trioctahedral structure with every octahedral position being occupied. Muscovite K(Al2□)[Si3AlO10](OH)2 is a dioctahedral mineral, which contains a vacancy on one out of three octahedral positions (Fleet, 2003).
The overall composition of the synthesised lepidolites and Li-muscovites used in this study consist of two polytypes and were already characterised by 29Si, 1H, and 19F MAS NMR spectroscopy in a previous study (Sulcek et al., 2023). The ratio in the tetrahedral layers and thus the content of [4]Al was calculated by analysing the signal intensities of the 29Si MAS NMR experiments. The Li content xest was calculated from the measured tetrahedral ratio of the 29Si MAS NMR signals. The calculated Li contents xest of samples between polylithionite and trilithionite agree with the expected values. F-rich samples show slightly increased values and the hydroxyl-rich sample lower values. The 19F and 1H MAS NMR experiments show that F− and OH− are not distributed statistically, but local structural preferences exist. Fluorine is attracted by Li-rich and OH by Al-rich environments (Sulcek et al., 2023).
CPMAS NMR experiments can help to clarify whether the degree of ordering in the octahedral sheets is related to that in the tetrahedral layers. The cross-polarisation (CP) experiment is a double resonance experiment that uses the strong magnetic polarisation of nuclei with high natural abundance and a high magnetogyric ratio such as 1H or 19F to transfer magnetisation on nuclei with low sensitivity such as 29Si and 13C via heteronuclear dipolar interaction (Pines et al., 1971; Pines et al., 1973). On account of this correlation, CPMAS experiments are able to indicate a direct neighbourhood of Si- Al sites in the tetrahedral sheets to anions in the octahedral sheets and, thus, a relationship between the ordering of ions in both sheets. Usually, the experiment is a 2-D heteronuclear correlation (HETCOR) experiment with the frequency on one axis and the frequency on the second axis, useful for the determination of site connectivities between different nuclei. Moreover, the analysis of contact-time-dependent CP and depolarisation experiments (Pines et al., 1971, 1973; Wu et al., 1988; Kolodziejski and Klinowski, 2002) provide relaxation, spin diffusion, and CP parameters, which contain valuable information on dynamics and the local neighbourhood between anions and Si atoms.
In a previous own study, {1H}→27Al 2-D CPMAS HETCOR NMR experiments at short contact times showed information about the local configuration of [4]Al sites and Mg3OH as well as Mg2AlOH sites of phlogopites, whereas magnetisation was only transferred to the [6]Al sites from OH groups in Mg2AlOH sites (Fechtelkord et al., 2003). The {19F}→27Al 2-D CPMAS HETCOR NMR spectrum in Fechtelkord et al. (2003) was dominated by [4]Al sites coupled to the Mg3F complex in phlogopite. Resonances from Mg2AlF complexes were not observed.
In another work (Langner et al., 2012), we showed that different ordering schemes can be found in the tetrahedral and octahedral sheets of phlogopite: in the tetrahedral sheet, ordering patterns are dominated by short-range ordering in order to avoid the formation of Al-O-Al linkages following Loewenstein's rule (Loewenstein, 1954). Long-range ordering is only present at Al contents close to , with Al and Si occupying the tetrahedra alternately. For the octahedral sheet, an Al-O-Al avoidance similar to that of the tetrahedral sheets has been found, and Al is always surrounded by six Mg ions in the neighbouring octahedra. There is a relationship between the ordering in both types of sheets in that Al atoms in the octahedral and the tetrahedral sheets tend to be located next to each other, forming Al-rich clusters in the structure. The ensemble of 27Al-27Al double-quantum single-quantum (DQ-SQ) MAS NMR data suggests a similar preference for [4]Al in the tetrahedral sheet to occupy positions close to the [6]Al of the octahedral sheets in phlogopites and lepidolites (Sulcek et al., 2020).
Other authors (Alba et al., 2005) have used {1H}→29Si and {1H}→27Al HETCOR MAS NMR to show that it is likely that the interlayer space of the beidellite part of a synthetic mica-montmorillonite is composed of ammonium ions, whereas ammonium and Al ions are responsible for the charge balance in the mica-type layer.
In this work, {1H 2-D CPMAS HETCOR and {19F CPMAS HETCOR experiments were performed to investigate the ordering of the octahedral layers related to the tetrahedral layers of lepidolites and Li-muscovites. Samples along the binary line between polylithionite trilithionite and trilithionite muscovite were synthesised by a gelling method in combination with hydrothermal synthesis and then examined by HETCOR experiments. Four different correlations have been investigated. The neighbourhood of OH− anions to tetrahedral Si and Al as well as to octahedral Al has been looked at and that of the F− anions to the same neighbours. The investigations give a good overview of the preferred neighbourhoods of F− and OH− anions to tetrahedral Si or Al and octahedral Al.
2.1 Synthesis
Polylithionite-trilithionite solid solutions (lepidolites) with nominal compositions K(LixAl3−x)[Al4−2xSi2xO10](OH)yF2−y (; ) and Li-muscovites with nominal compositions K(LixAl[AlSi3O10](OH)yF2−y (; ) (composition of the oxidic start mixtures) were synthesised by a gelling method following Hamilton and Henderson (1968) in combination with hydrothermal synthesis. High reactive oxide mixtures were prepared with one molar solution of KNO3 (NORMAPUR, 26869.291), Al(NO3)3⋅9H2O (Merck, 1.01086.1000), Li(NO3) (abcr, AB203314, 99 %), and NH4F (Merck, 1.01164.0250) and filled in Teflon containers according to the required composition. Tetraethyl orthosilicate was added as a source of silicon. A homogenous solution was achieved by adding ethanol (Fisher chemical, E/0650DF/17) and distilled water. Ammonia solution (Sigma Aldrich, 05002-1L, 30 %–33 % NH3 in H2O) started the gel process until the solution became alkaline. This solution was stirred for a further 15 min and then placed under a fume hood for 24 h. The samples were stirred again after 24 h and dried in an oven at 353.15 K for 1 d to volatilise the ethanol and residual ammonia. After that, the solution was stirred again and dried for 72 h at 393.15 K to volatilise the added water. The resulting platelets were crushed and heated in a platinum crucible at about 1073.15 K over a Bunsen burner until no further smoke was detected to drive off water, ethanol, ammonia, and nitrogen oxides. The oxides were resorbed, and X-ray diffraction (XRD) experiments were made to test for possible crystalline phases. XRD results of lepidolites and Li-muscovites, as well as the experimental setup, has been published elsewhere (Sulcek et al., 2023). Only oxides, revealed to be amorphous under XRD analysis, were used in the synthesis, filled, and sealed in gold capsules with 9 wt % to 11 wt % distilled water. The correct sealing was controlled by placing the capsule at 393 K in an oven and checking for weight losses. The capsules are 4 cm long, possess an outer diameter of 4 mm, and have a wall thickness of 0.25 and 0.2 mm. A vertical hydrothermal system was used for the synthesis with Tuttle-type pressure vessels (Tuttle, 1949; Luth and Tuttle, 1963) and an external oven. The capsules were placed in the pressure vessels and fixed with an NiCr fill bar. This prevents the circulation of water and minimises the amount of water needed as the pressure medium. An thermocouple measured the temperature during the synthesis. The samples were synthesised at p=2 kbar and T=873 K over a week (error: Δp=50 bar and ΔT=20 K along the capsules). After the run duration, samples were quenched by removing them from the furnace and cooling in the air at a constant pressure. Isobaric heat-up and quenching times were about 1 h, which is assumed to be negligible compared to the overall run durations. The value of fO2 was close to that imposed by the Ni–NiO buffer. The synthesised samples were dried in an oven at 393 K for 24 h.
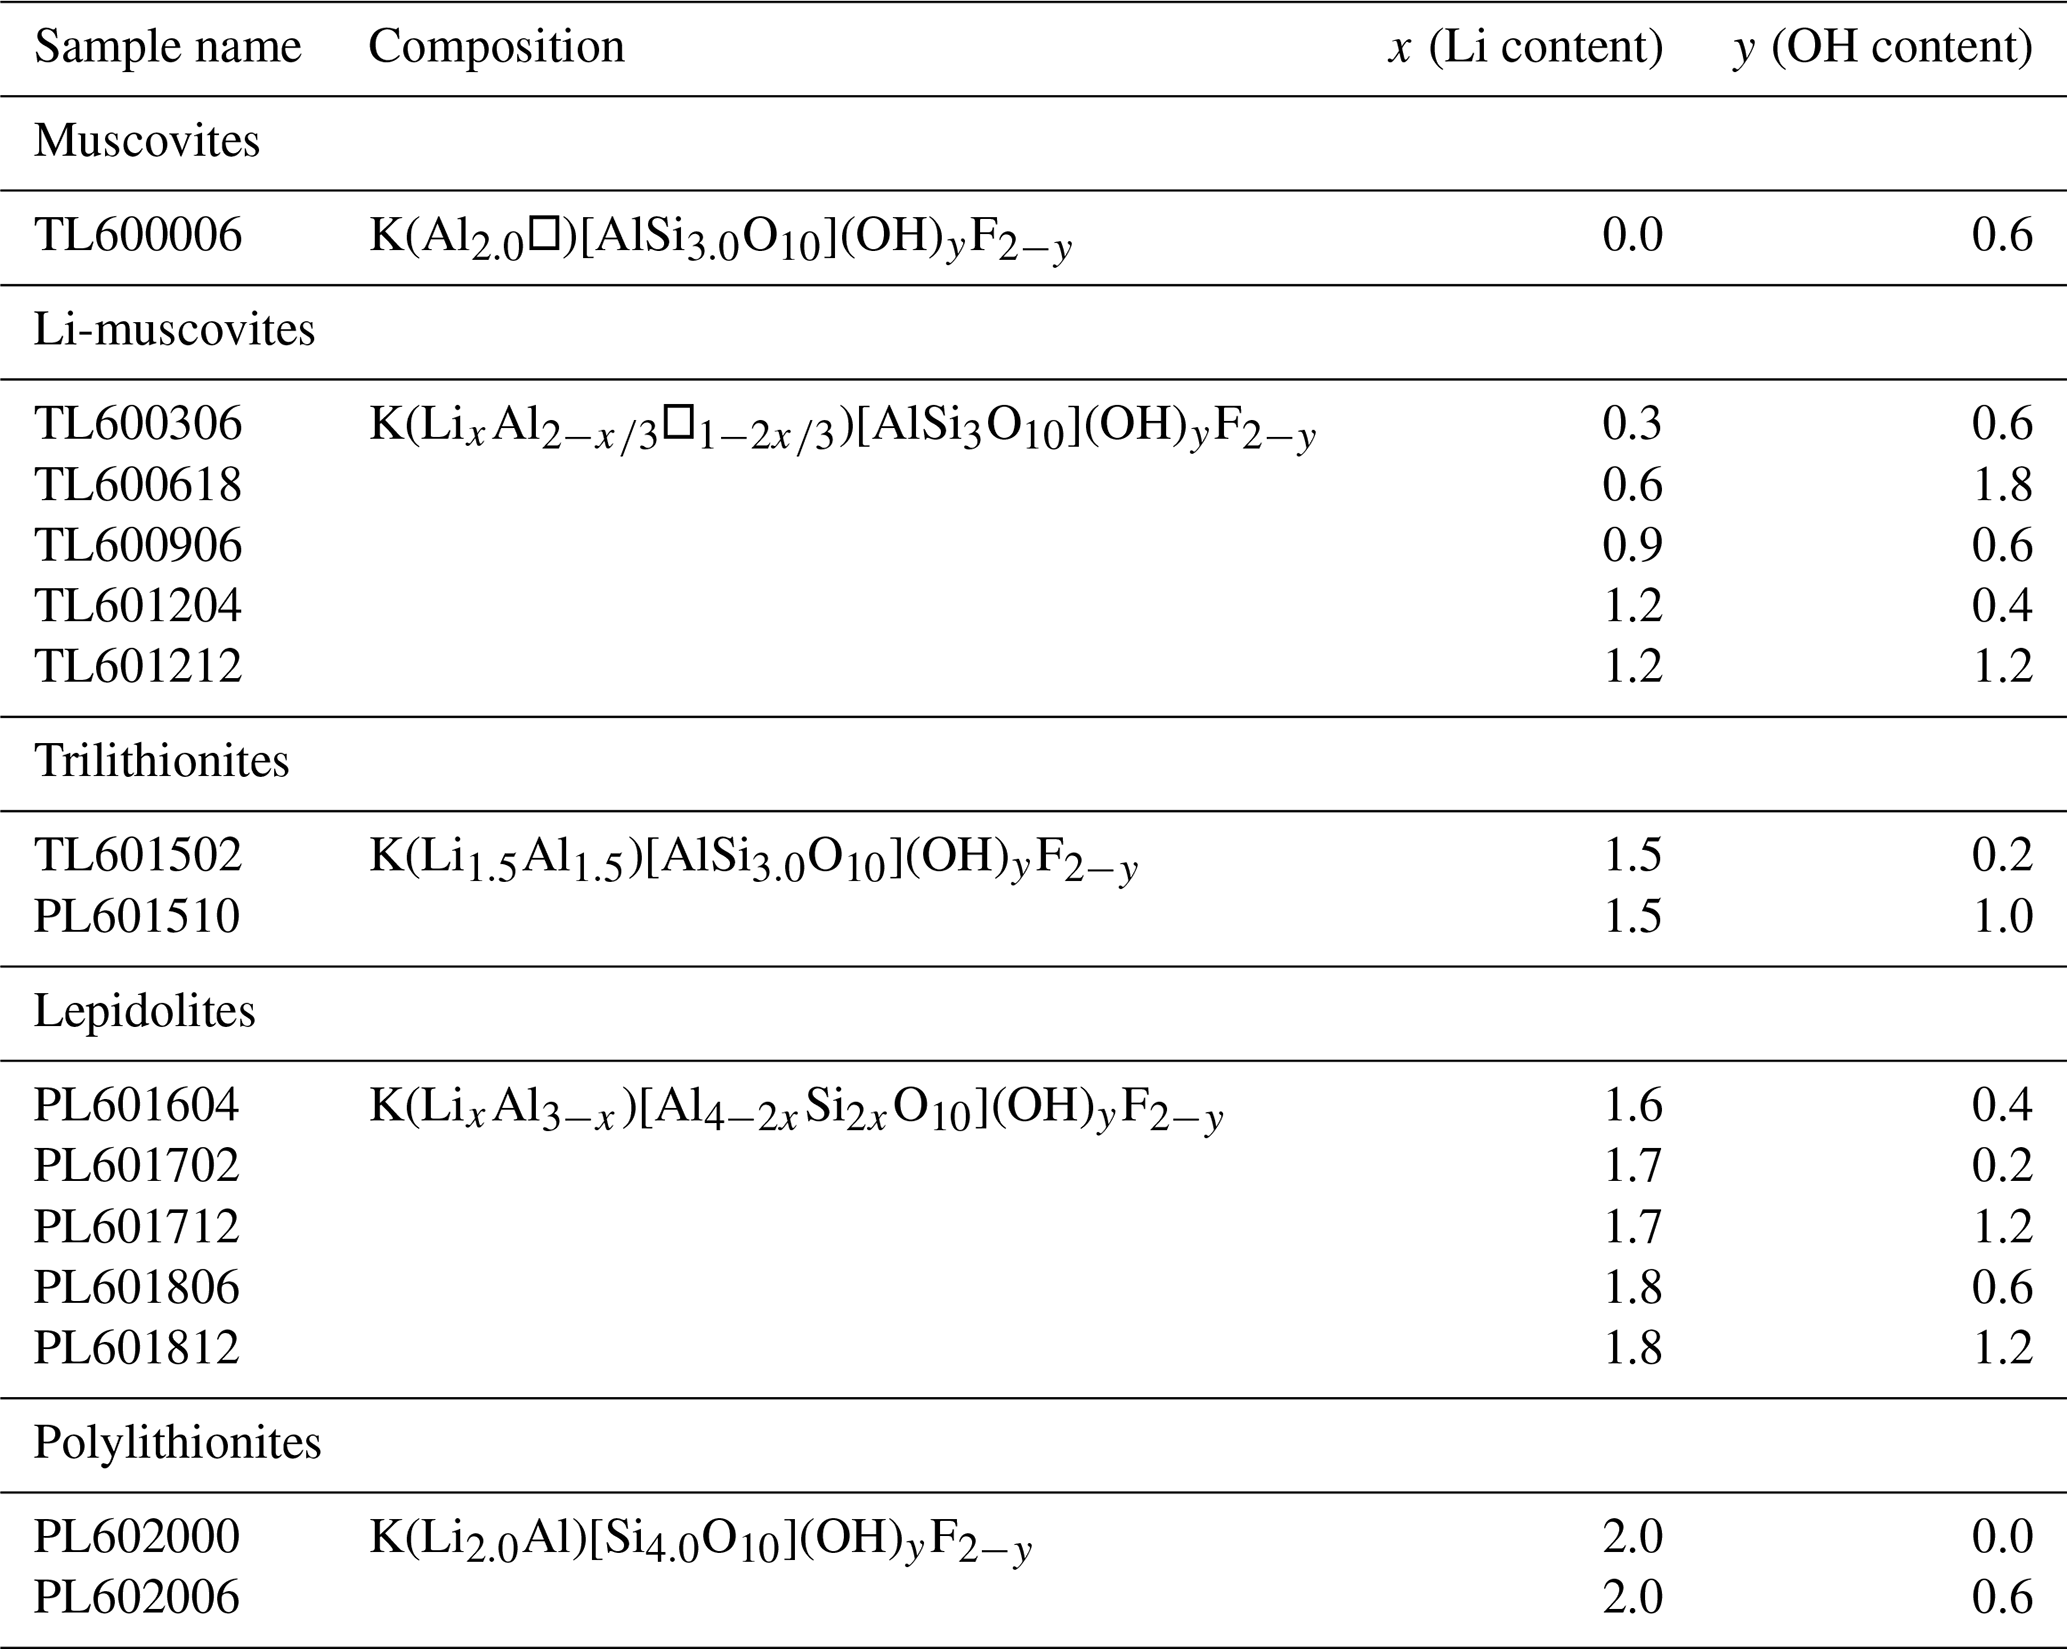
A large number of different compositions, along the binary lines between polylithionite-trilithionite and trilithionite-muscovite, were mixed according to the required composition. The samples used in this study are listed in Table 1.
Table 1The nominal chemical composition of the synthesis products with variable content.
2.2 Nuclear magnetic resonance
The NMR spectra were recorded on a Bruker Avance NEO 400 NMR spectrometer. The 29Si MAS NMR measurements have been performed at 79.49 MHz with a standard Bruker 7 mm MAS probe and a sample rotation frequency of 4 kHz. The experiments were carried out with a single-pulse duration of 4 µs (the length of the 90° pulse was 6.5 µs), a 10 s recycle delay, and a spectral width of 20 kHz, and 700–30 000 scans were accumulated. Selected spectra were measured with longer repetition times to ensure that the short times are sufficient in obtaining the desired signals. Tetramethylsilane (TMS) was used as the reference standard for 29Si.
HETCOR investigations were recorded using a linear ramp on the channel to transfer magnetisation to (Metz et al., 1994). Instead of a constant output on the channel, the output power is increased from 50 % to 100 %.
The {1H}→29Si HETCOR NMR experiments have been performed at transmitter frequencies of 400.35 and 79.53 MHz for 1H and 29Si, respectively, and with a t1 increment of 20 µs. A standard 4 mm probe was used and a rotation frequency of 8 kHz. The reference standard for both nuclei was TMS, and 400 scans were accumulated. The 90° pulse length for 1H was 2.5 µs, the recycle delay 5 s, and the contact time 2 ms.
The {1H}→27Al HETCOR NMR experiments were carried out using a standard 4 mm probe and a rotation frequency of 12.5 kHz. The transmitter frequencies were 400.35 and 104.32 MHz, respectively; the t1 increment was 20 µs; the 90° pulse length for 1H was 2.5 µs; and the recycle delay was 5 s. The contact time was set to 0.6 ms, and the used standard materials were TMS and a 1M AlCl3 aqueous solution. Short contact times and fast MAS spinning were used to ensure efficient spin locking and a good magnetisation transfer from 1H to the 27Al quadrupolar nucleus (Vega, 1992a, b).
For the {19F}→29Si CPMAS HETCOR experiments, the 4 mm Bruker probe was also used, at rotation frequencies of 7 kHz and transmitter frequencies of 79.49 and 376.45 MHz for 29Si and 19F, respectively. Tetramethylsilane was used as the reference standard for 29Si and p-C6H4F2 ( ppm) for 19F. The selected samples were measured, with a recycle delay of 5 s and a 90° pulse length for 19F of 2.6 µs. For the 2-D cross-polarisation experiments (HETCOR), a t1 increment of 20 µs and a contact time of 10 ms were applied. For each measurement, 400 scans were recorded and accumulated for each spectrum.
{19F}→27Al CPMAS HETCOR investigations were carried out at a rotational frequency of 14 kHz to avoid the overlapping of rotation sidebands and signals. 1 M AlCl3 aqueous solution and p-C6H4F2 ( ppm) were used as reference standards for 27Al and 19F. Transmitter frequencies of 104.27 and 376.45 MHz were applied, and 400 scans were recorded and accumulated for each experiment, with a recycle delay of 5 s. The t1 increment was 20 µs, the contact time was 0.6 ms, and the 19F 90° pulse length was 2.6 µs. Short contact times and fast MAS spinning were used to ensure efficient spin locking and a good magnetisation transfer from 19F to the 27Al quadrupolar nucleus (Vega, 1992a, b).
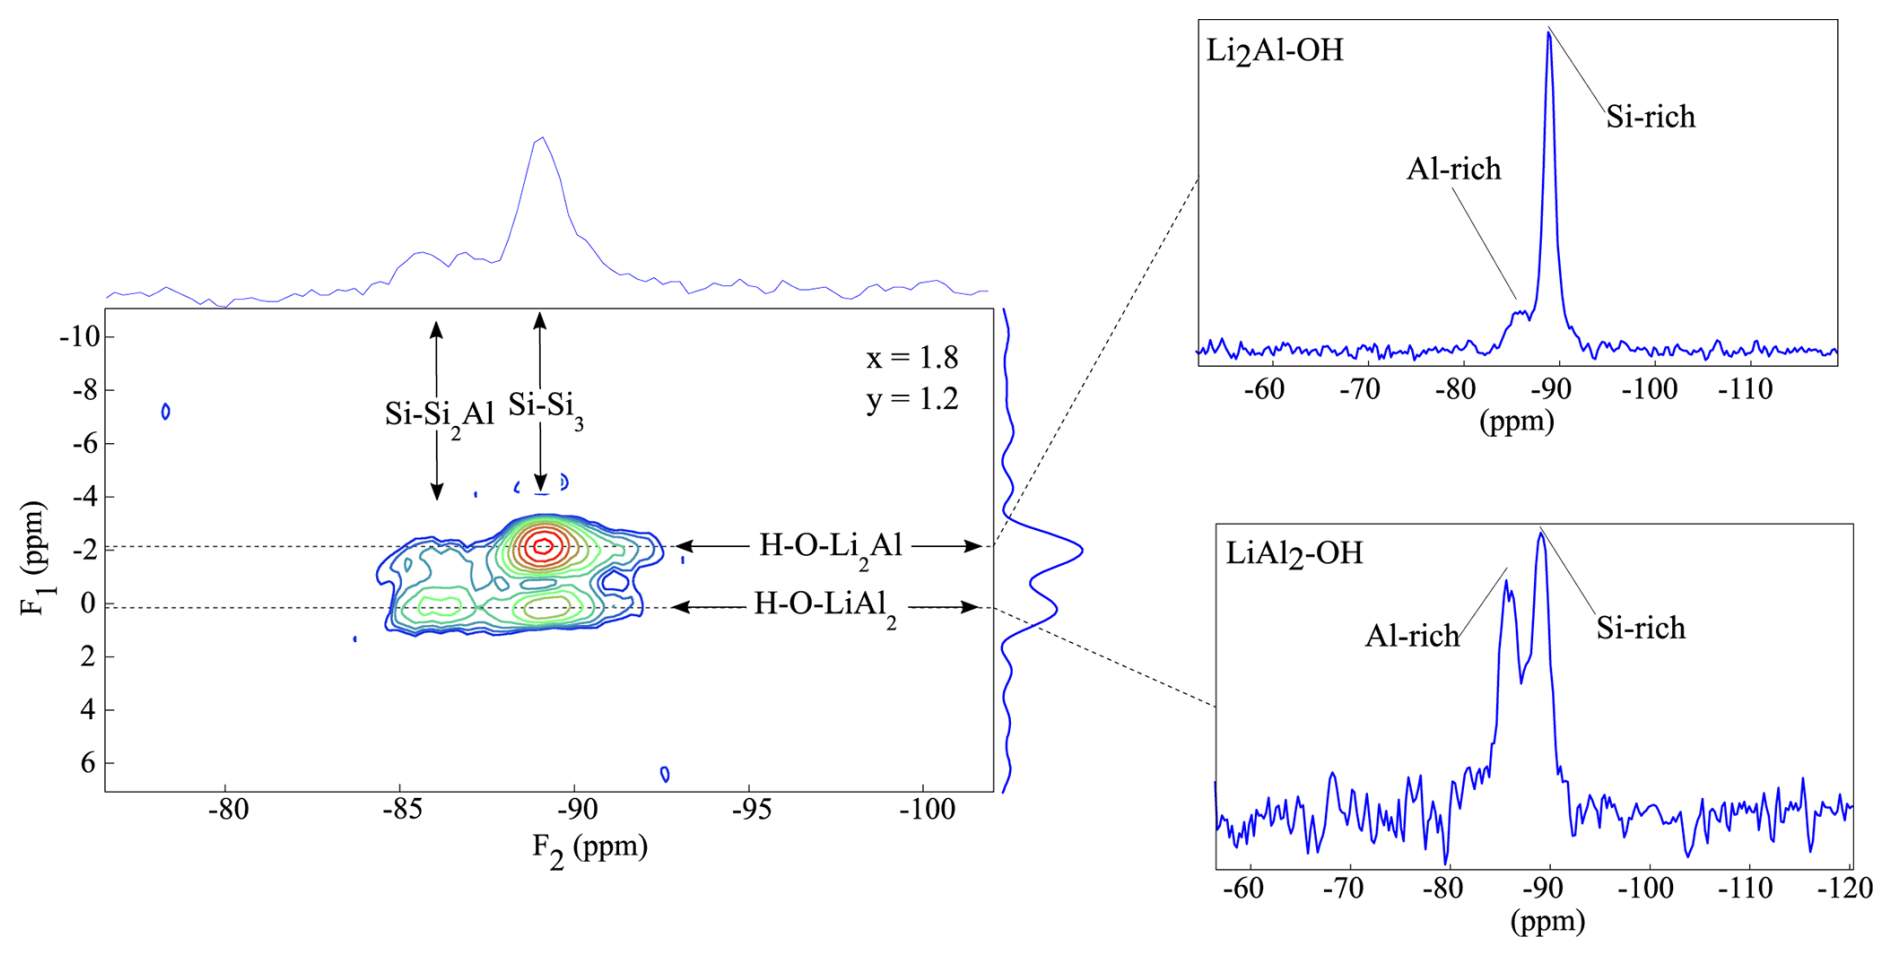
Figure 1{1H}→29Si CPMAS HETCOR spectrum of the sample with nominal composition K(Li1.8Al1.2)[Si3.6Al0.4O10](OH)1.2F0.8. Two spectra were extracted along the dotted lines. The upper spectrum represents the Si signals belonging to the Li2Al-OH environment, and the lower spectra are the Si signals belonging to the LiAl2-OH environment.
3.1 {1H}→29Si 2-D CPMAS HETCOR NMR spectroscopy
Table 1 presents the composition of oxidic reaction mixtures used as samples for the HETCOR experiments from the different synthesis experiments of mica phases along the binary lines muscovite-trilithionite and trilithionite-polylithionite.
{1H}→29Si 2-D CPMAS HETCOR NMR spectroscopy supplies additional information about site connectivity between H and Si atoms. The magnetisation is transferred from the H atom to Si by cross-polarisation to accomplish a 2-D correlation. Figure 1 shows a {1H}→29Si 2-D CPMAS HETCOR NMR spectrum of an Li-rich lepidolite (Pl601812: x=1.8, y=1.2). Two different signals regarding the hydroxyl group environments are expected. Each hydroxyl group is bonded to three octahedral sites which can be occupied by two Li and one Al (δ(Li2Al-OH) = −1 to 0 ppm) or one Li and two Al (δ(LiAl2-OH) = 1 to 2 ppm). The two signals from the H environment, Li2Al-OH and LiAl2-OH, occur in the F1 direction. The environments correlate with different Si environments. Each Si tetrahedron in the tetrahedral sheet is connected to three other tetrahedra which can be occupied by three Si (Q3(0Al)), two Si, and one Al (Q3(1Al)) and one Si and two Al (Q3(2Al)). The sample Pl601812 contains all three Si environments with a ratio of (Q3(2Al) : Q3(1Al) : Q3(0Al)) obtained from the 29Si MAS NMR spectrum (Sulcek et al., 2023). Two sections were extracted along the dotted lines to visualise the correlation between the NMR signals originating from H and those from Si. The resulting 1-D spectra in Fig. 1 show the 29Si environments in the neighbourhood of the H environments. F2 correlates to the 29Si, with the two signals belonging to Q3(0Al) and Q3(1Al). The Q3(2Al) signal is not visible in the 2-D spectrum. The intensity is too low, and the HETCOR spectra show a lower spectral resolution than the normal 29Si MAS NMR spectra.
The upper 1-D spectrum in Fig. 1 shows a strong correlation between the Li2Al-OH and the Q3(0Al) but none or only less neighbouring between Li2Al-OH and Q3(1Al). The Li2Al-OH signal at the δ(F ppm environment shows a clear relation to the Q3(0Al) environment signal at δ(F ppm. The LiAl2-OH group at δ(F1)=0 ppm is connected to the Q3(0Al) and the Q3(1Al) Si at δ(F ppm. In a recent study (Sulcek et al., 2020), it was shown that the tetrahedral Al atoms are always close to octahedral Al cations. The {1H}→29Si 2-D CPMAS (HETCOR) NMR spectrum in Fig. 1 supports these findings. The OH groups with an [6]Al-rich environment are coupled with the Si-Si2Al environments of the tetrahedral layer. Since the OH-Al2Li groups prefer the proximity of the tetrahedral Al sites, the OH-Li2Al groups show correlations with the remaining Si-rich sites. It can thus be shown indirectly that the octahedral Al is located near the tetrahedral Al and the octahedral Li near the tetrahedral Si. Thus, there is a clear distribution based on the order of the structure. The Li atoms are incorporated near the Si-rich sites and the hydroxyl groups near the Al-rich environments.
It can also be observed that the 1H signal in the HETCOR spectrum is not the same as the 1H signal in the typical MAS NMR spectrum (Sulcek et al., 2023) in terms of intensity, but it does correlate with the strength of the Si environment. It seems that there are clusters in the structure that differ due to the chemical composition.
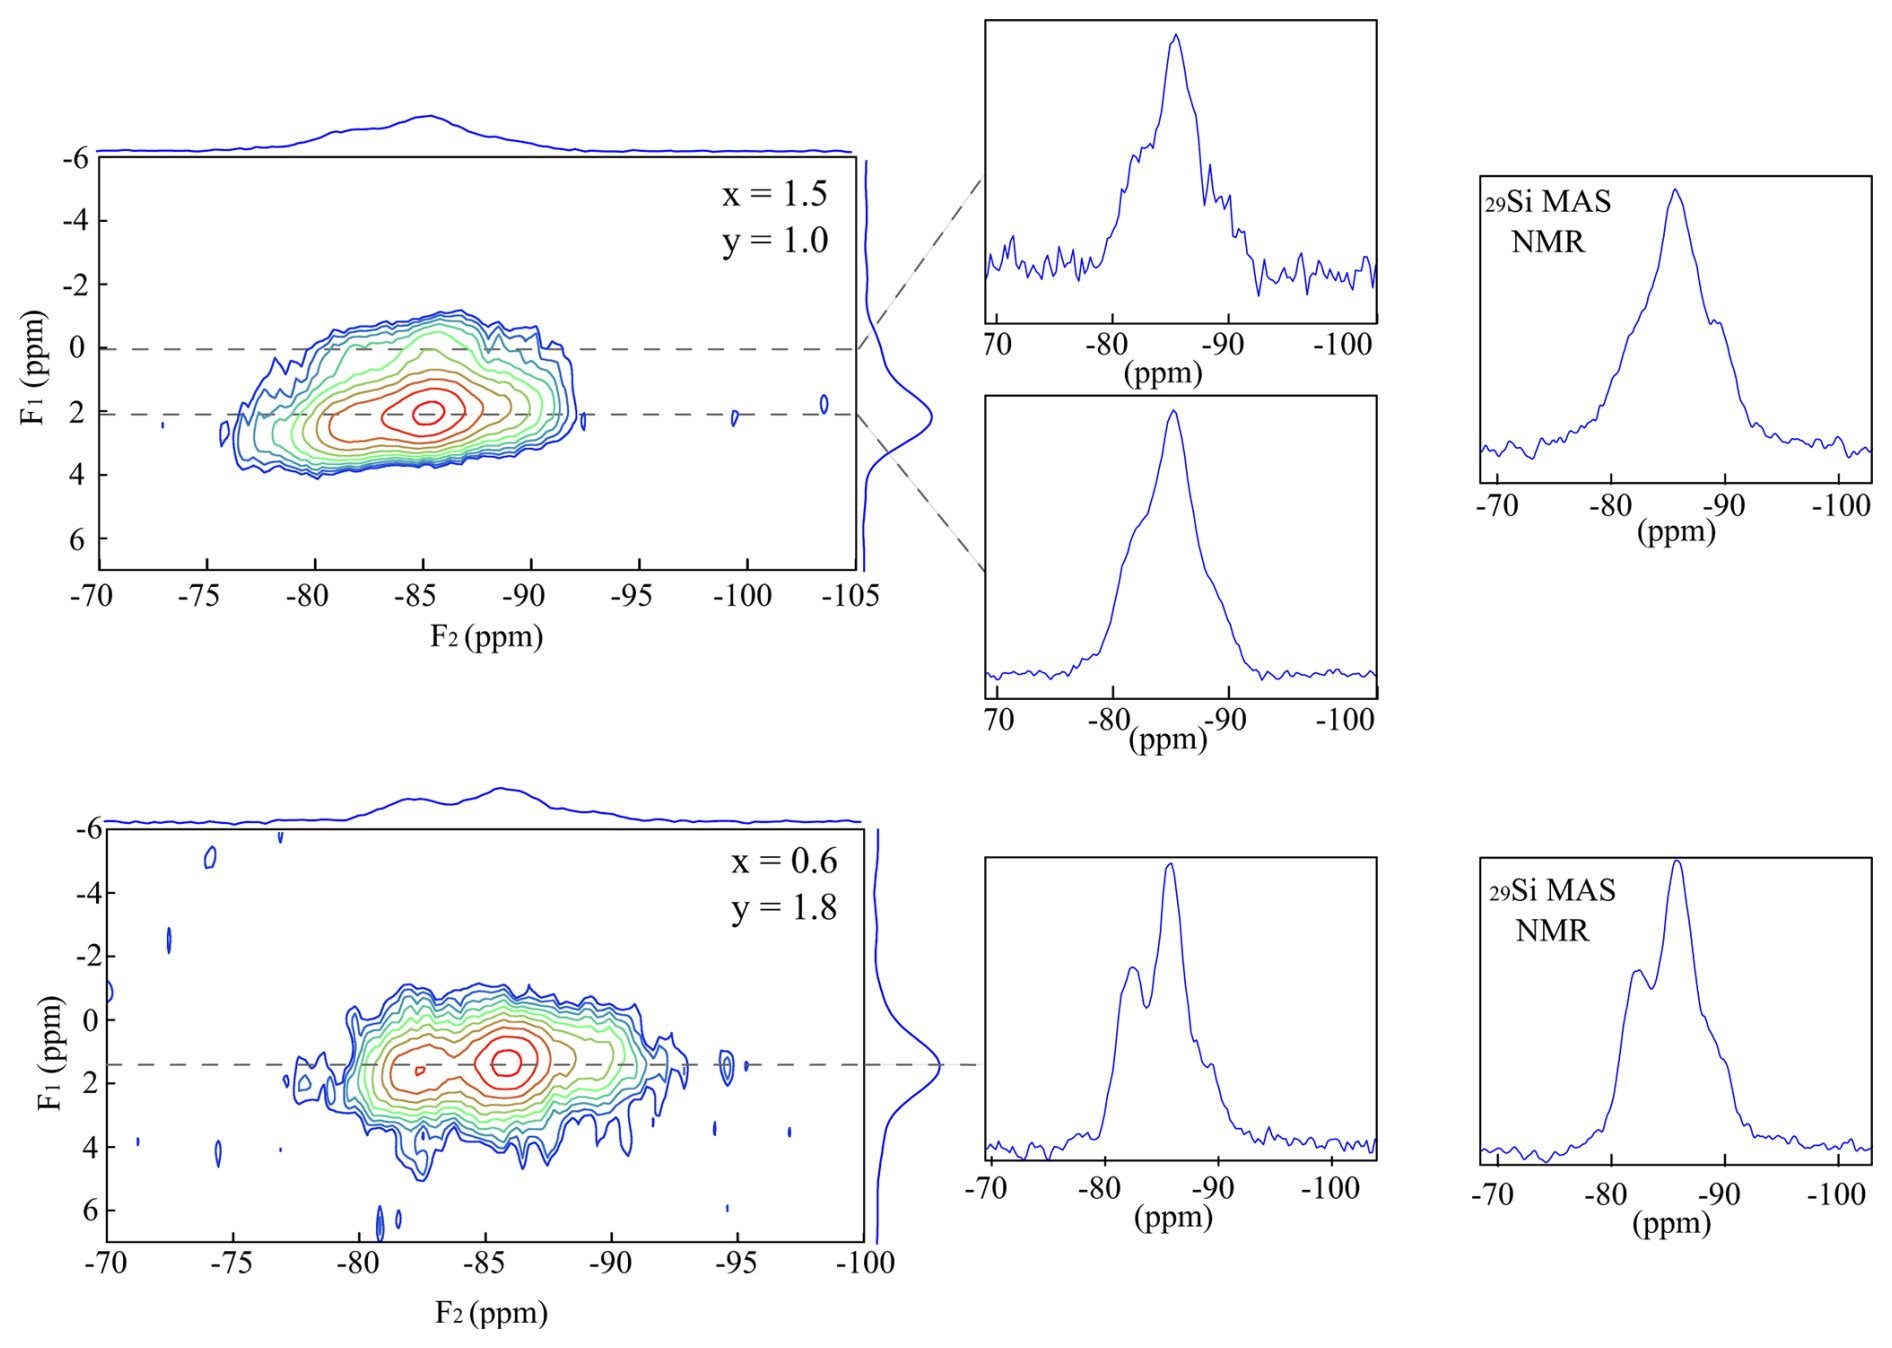
Figure 2{1H}→29Si CPMAS HETCOR investigations of the samples Pl601510 (upper spectrum) and Tl600618 (lower spectrum). The extracted 1-D spectra along the dotted lines are shown in the middle. The two 29Si MAS NMR spectra of samples are shown on the right.
The spectra of a trilithionite (PL601510: x=1.5 and y=1.0) and a Li-muscovite sample (TL600618: x=0.6 and y=1.8) are shown in Fig. 2. The signal intensity referring to the Li2Al-OH environment (δ(F ppm) is significantly lower than the signal at δ(F1)=2 ppm (LiAl2-OH). This means that the available F− anions prefer the occupation next to Li-rich octahedral sites and the OH− anions next to Al-rich environments. The signal distribution to the three different Si signals shows the same behaviour as the spectrum in Fig. 1. However, the extracted 1-D spectra show deviations from the recorded 29Si MAS NMR spectra (shown on the right in Fig. 2) since only Si environments with OH nearby show up in the HETCOR spectrum. The two selected 29Si slices, which were extracted along the dotted lines, are very similar. The Li2Al-OH environment shows a slightly higher correlation to the Si-richer environment (−90 ppm) than the LiAl2-OH neighbourhood. In contrast, the resonance referring to the Q3(2Al) environment (−83 ppm) is slightly higher at the lower spectrum, the LiAl2-OH environment. The signal-to-noise ratio is better in the lower spectrum. The OH− anions prefer the Al-richer environments, and only a few OH− anions are bonded to the Li2Al environment. Therefore, the number of anions that transmit the magnetisation is lower, and the signal-to-noise ratio decreases. The Q3(0Al) signal (−90 ppm) intensity is much lower in the 29Si MAS NMR spectrum, shown on the upper right in Fig. 2, than the intensity in the HETCOR experiment. Only the Si atoms in the neighbourhood of H are considered in the HETCOR experiment due to the magnetisation transfer. As the magnetisation is transferred from H to Si, only Si atoms are visible that are close to the OH groups. Incorporated F atoms are bonded next to the Q3(0Al) environment, which is thus not visible in the HETCOR experiment. The OH− anions prefer the Q3(2Al) and Q3(1Al) environments.
The spectrum of the Li-muscovite (Fig. 2, bottom) exhibits much broader 1H MAS NMR signals due to the smaller crystallite sizes. It is not possible to distinguish between the two different octahedral environments. The 1-D spectra, which were extracted along the dotted line, correlate to all three 29Si signals. The OH is incorporated next to all three Si environments. However, no distinction can be made between the Li2Al-OH and the LiAl2-OH environment. The 29Si MAS NMR resonance (Fig. 2, bottom right) shows a slightly weaker Q3(0Al) signal intensity but still a very similar spectrum. The fewer F atoms (y=1.8) prefer incorporating next to the Q3(0Al) environment. The hydroxyl group occupies the remaining sites.
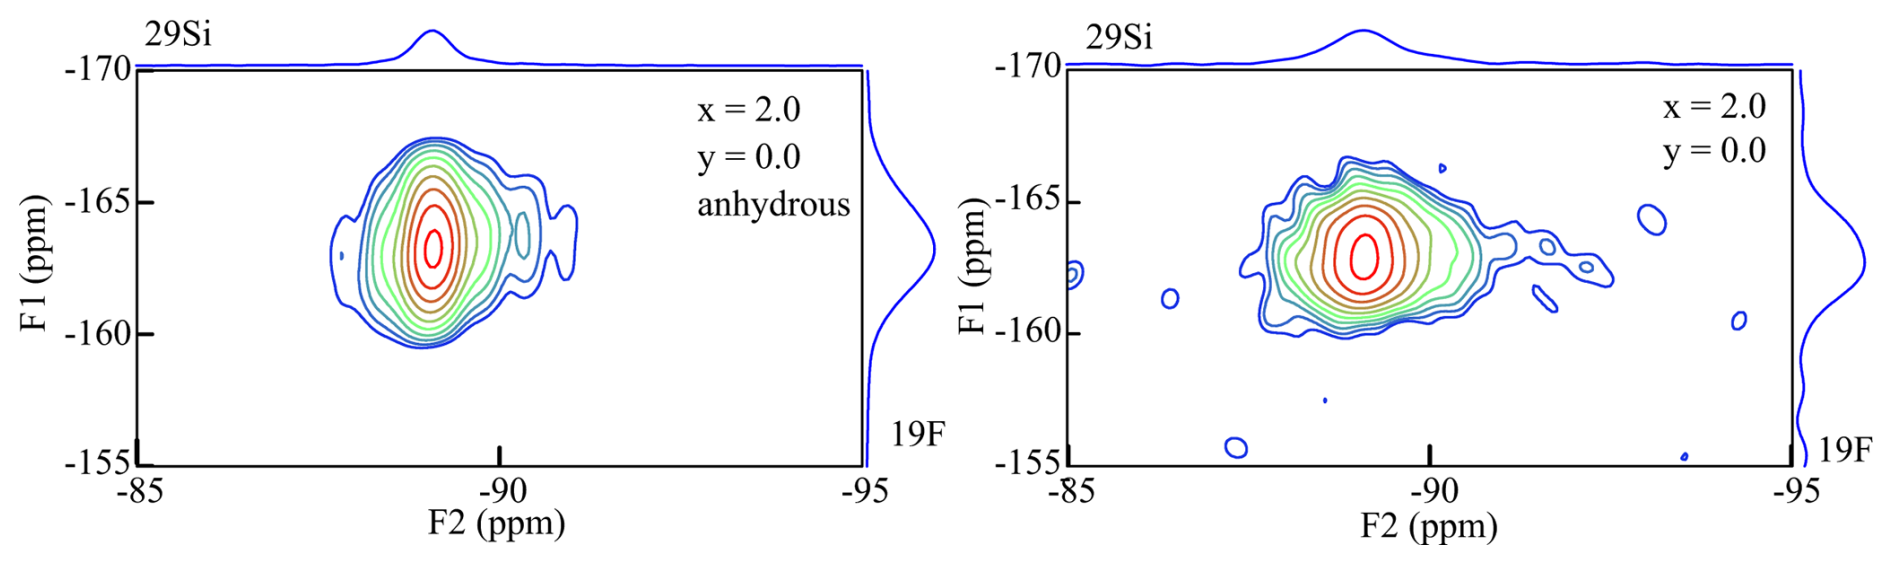
Figure 3{19F}→29Si HETCOR spectra of the anhydrous (left) and the “normal” (right) polylithionite (x=2.0, y=0.0) samples. The F1 axis refers to the 19F NMR signals and the F2 axis to the 29Si NMR signals.
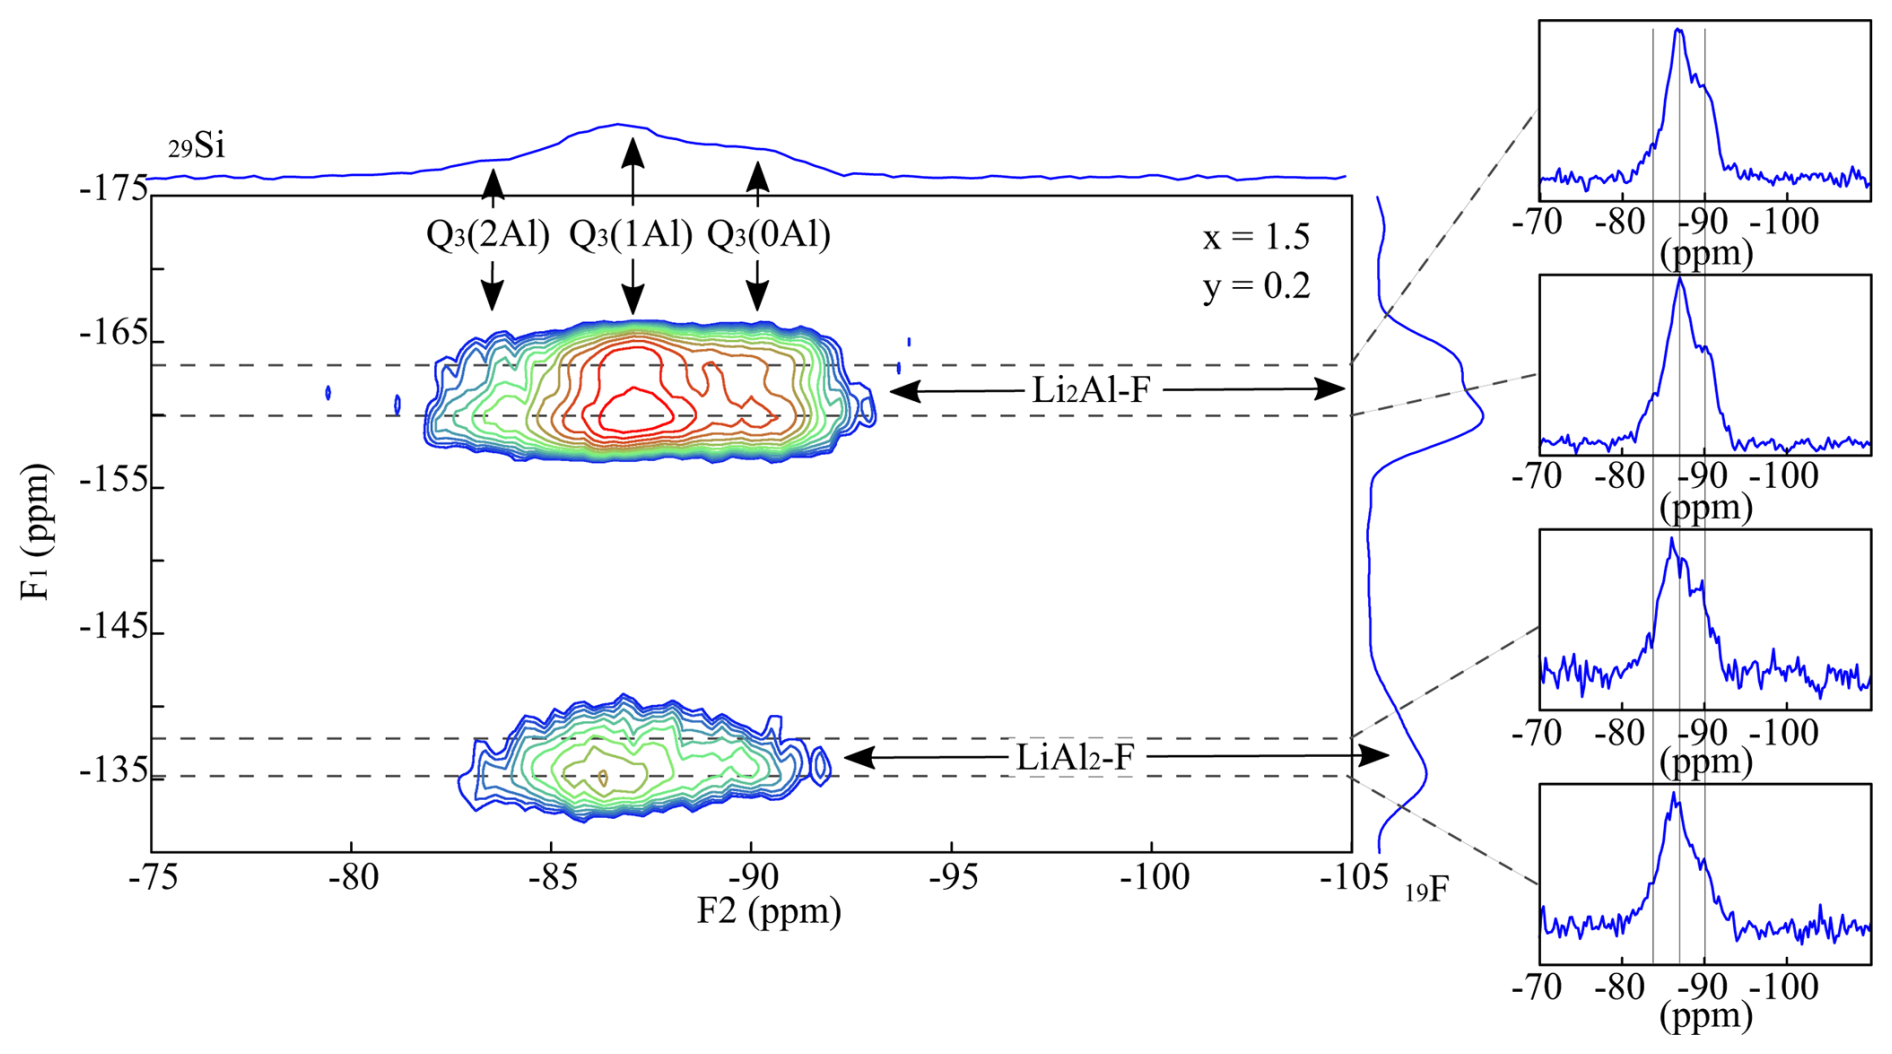
Figure 4{19F}→29Si HETCOR spectrum of a trilithionite sample (x=1.5, y=0.2). Four 1-D spectra were extracted along the dotted lines. The F1 axis refers to the 19F signals and the F2 axis to the 29Si signals.
3.2 {19F}→29Si 2-D CPMAS HETCOR NMR spectroscopy
19F MAS NMR spectra show two signals belonging to the Li2Al-F and LiAl2-F environments, analogous to the 1H MAS NMR experiments (Sulcek et al., 2023). Interestingly, the two signals are very asymmetric, and it seems that they are split into several signals. They may be explained by different distributions in the next coordination sphere. Then there should be four different F environments with in cis- and in trans-coordination and with OH or F in cis- and F or OH in trans-coordination (Griffin et al., 2010). A polylithionite sample (PL602000: x=2.0, y=0.0) was synthesised with or without adding water during the synthesis. The {19F}→29Si 2-D CPMAS (HETCOR) NMR spectrum of the polylithionite sample with added water during the synthesis shows one asymmetric signal (F1) at −163 ppm (Fig. 3, right). The synthesis of this sample was repeated without water as a synthesis medium, and the spectrum is shown in Fig. 3 on the left. The 19F signal is slightly sharper and more symmetrical. Thus, it is possible that the incorporation of OH− or F− in the cis- or trans-coordination influences the environment and thus the chemical shift. Both samples exhibit one Si signal referring to the Q3(0Al) environment.
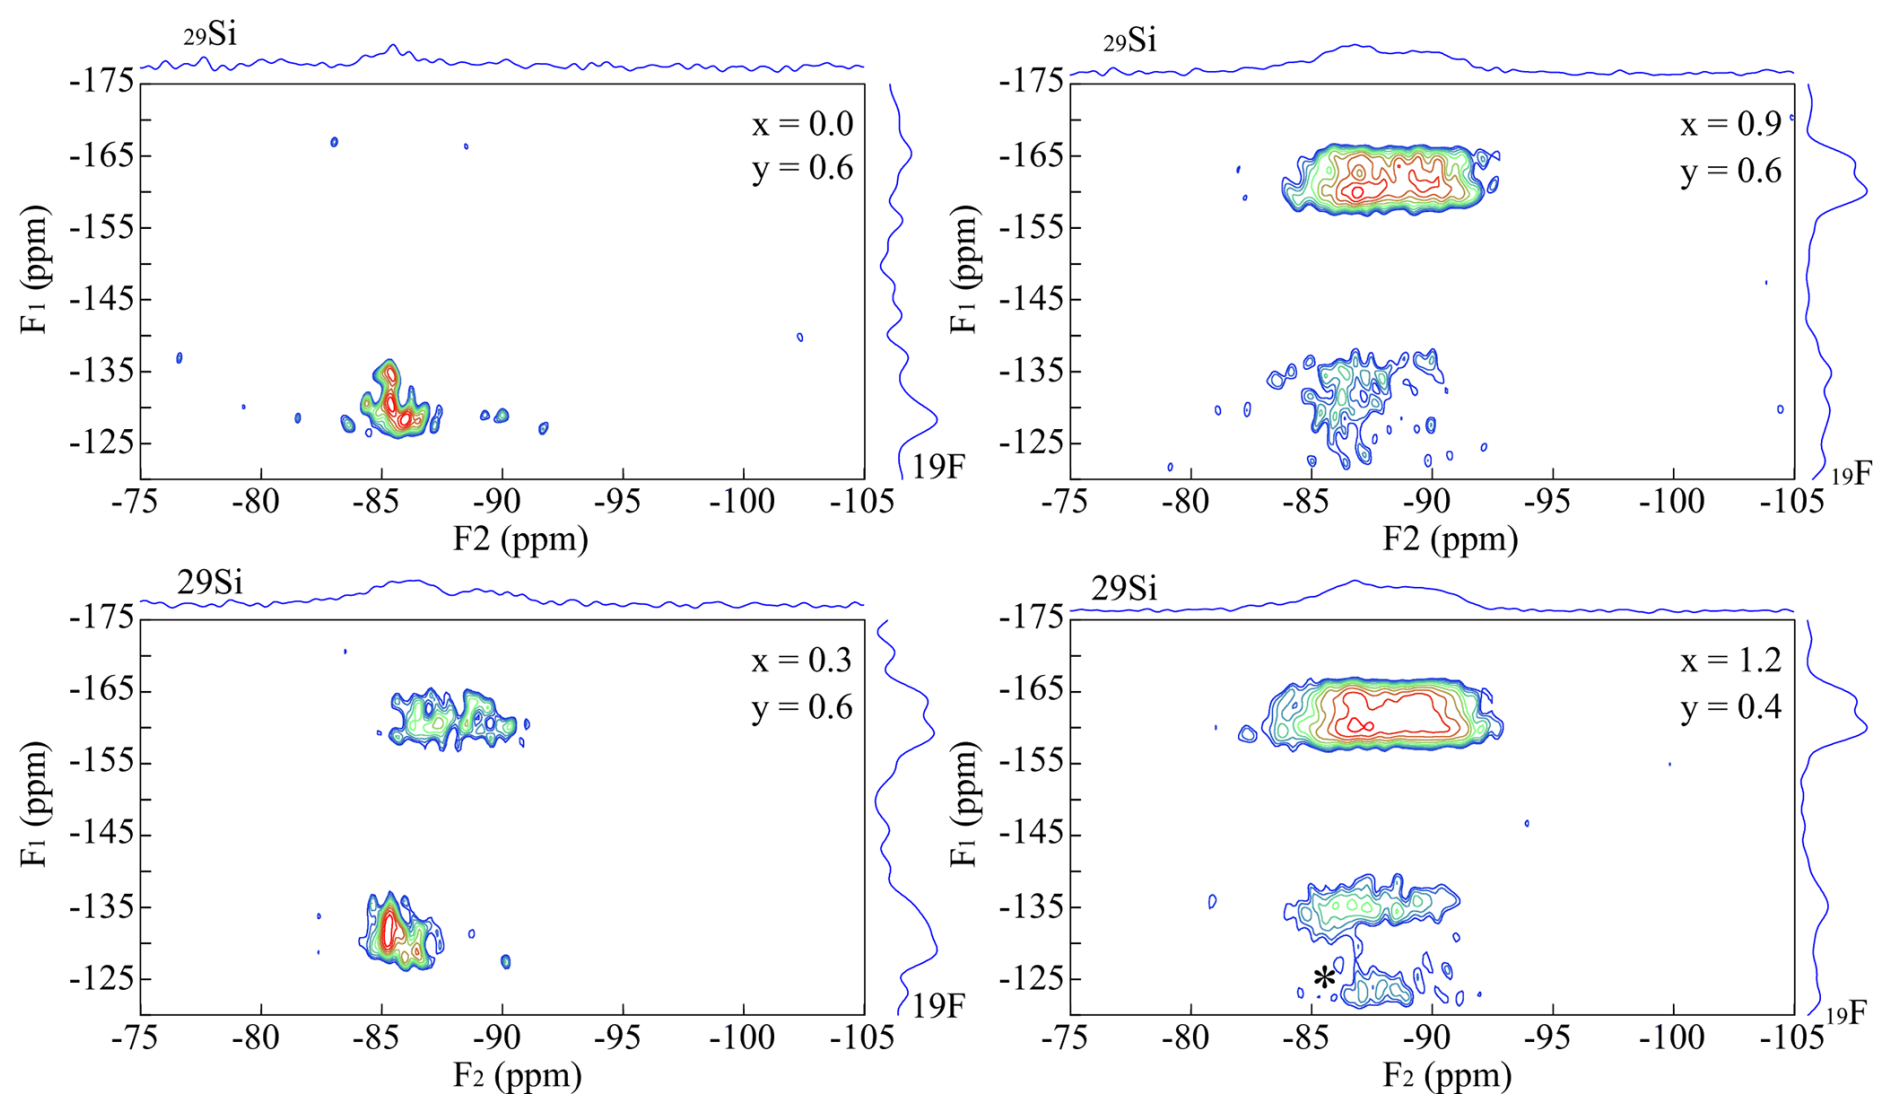
Figure 5Four {19F}→29Si CPMAS HETCOR spectra of Li-muscovites with nominal composition: x=0.0, y=0.6 (upper left); x=0.3, y=0.6 (bottom left); x=0.9, y=0.6 (upper right); and x=1.2, y=0.4 (bottom right). The signal at −160 ppm (Li2Al-F environment) increases with increasing Li content and is split into two different signals, analogous to the lepidolites. Rotational sidebands are marked with an asterisk (*).
Figure 4 represents a {19F}→29Si HETCOR spectrum of the trilithionite sample Pl601502 (x=1.5, y=0.2). The 29Si MAS NMR spectrum shows three different signals, and the 19F MAS NMR spectrum displays several signals (not shown; Sulcek et al., 2023). The signal belonging to the Li2Al-F environment at −160 ppm shows a correlation to all three Si sites. The ratio is different to the 29Si MAS NMR spectrum. The signal is split into two different ones at −160 and −163 ppm. The cross-correlation to 29Si is slightly different. The signal at −160 ppm shows a stronger correlation to the Q3(2Al) environment. Otherwise, the two signals do not show any apparent differences. All three Si environments can be found next to the Li-rich environment.
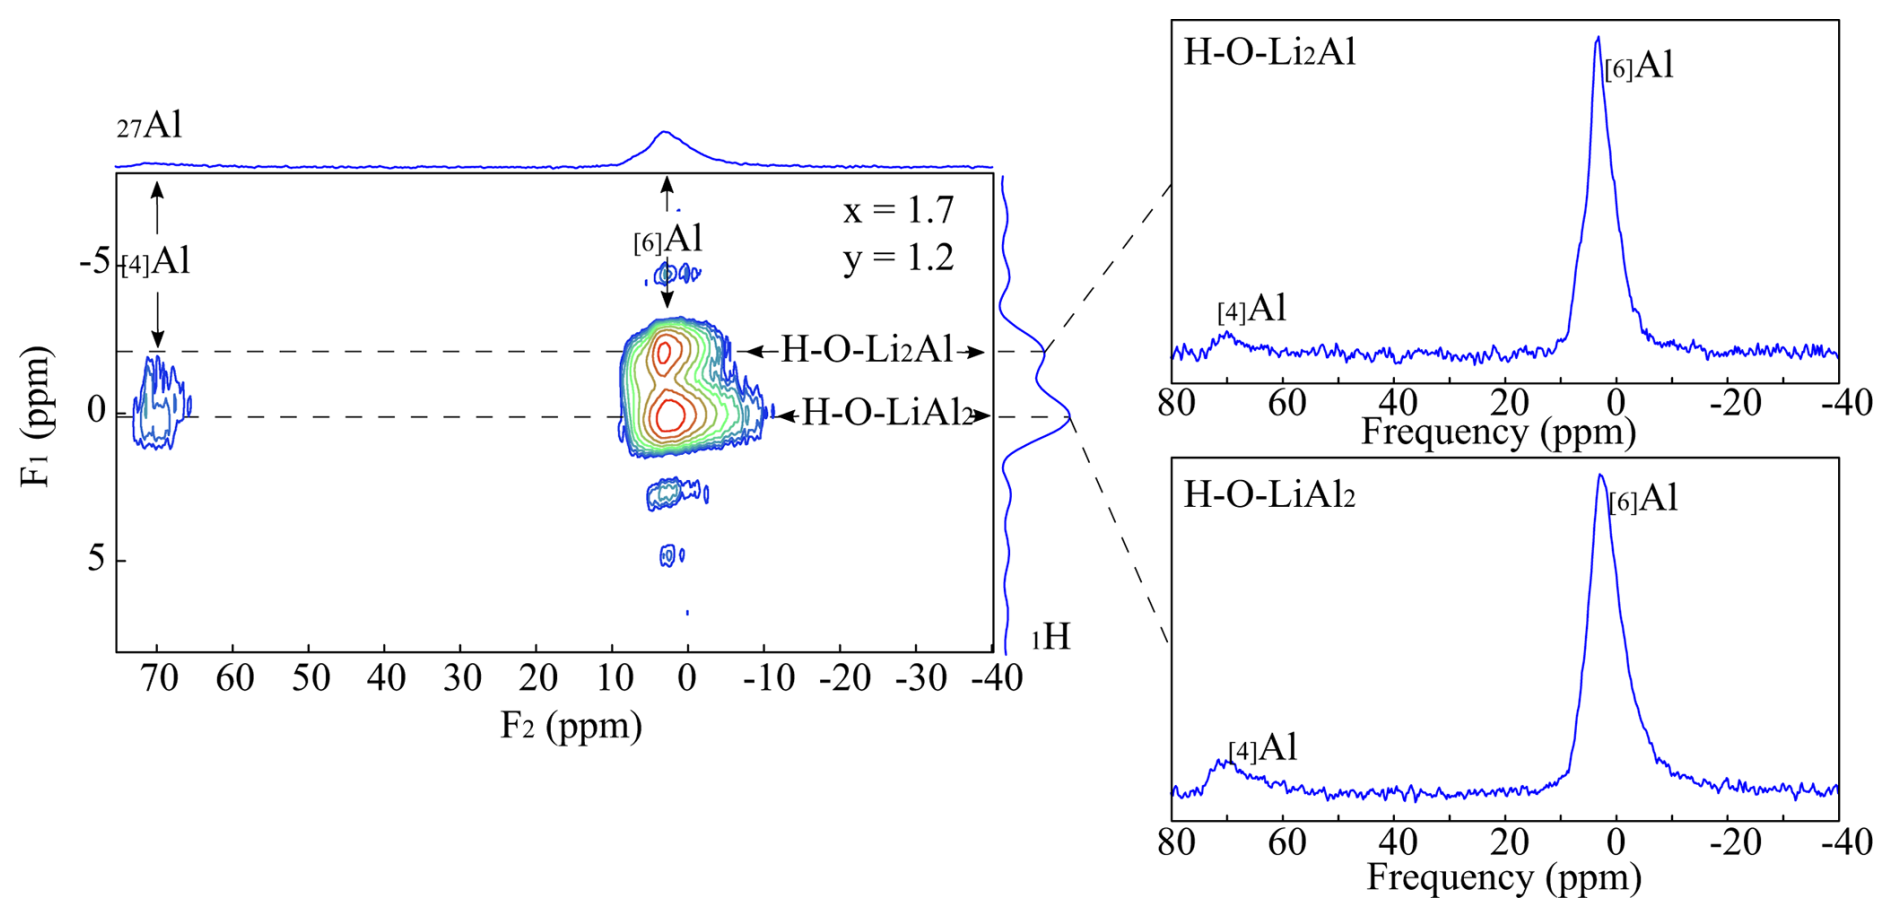
Figure 6{1H}→27Al CPMAS HETCOR spectra of the sample with nominal composition K(Li1.7Al1.3)[Si3.4Al0.6O10](OH)1.2F0.8. The 1-D spectra were extracted along the dotted lines.
The resolution of the 19F LiAl2 signal is low due to the lower abundance compared to the Li2Al environment. The OH− anion prefers the incorporation near the LiAl2 environments, and the F− anions fill up the remaining sites. It is hard to resolve different signals at −135 ppm. The LiAl2 environment prefers the incorporation near to Al-rich clusters. This behaviour could already be seen in the {1H}→29Si CPMAS HETCOR NMR experiments (Figs. 1 and 2).
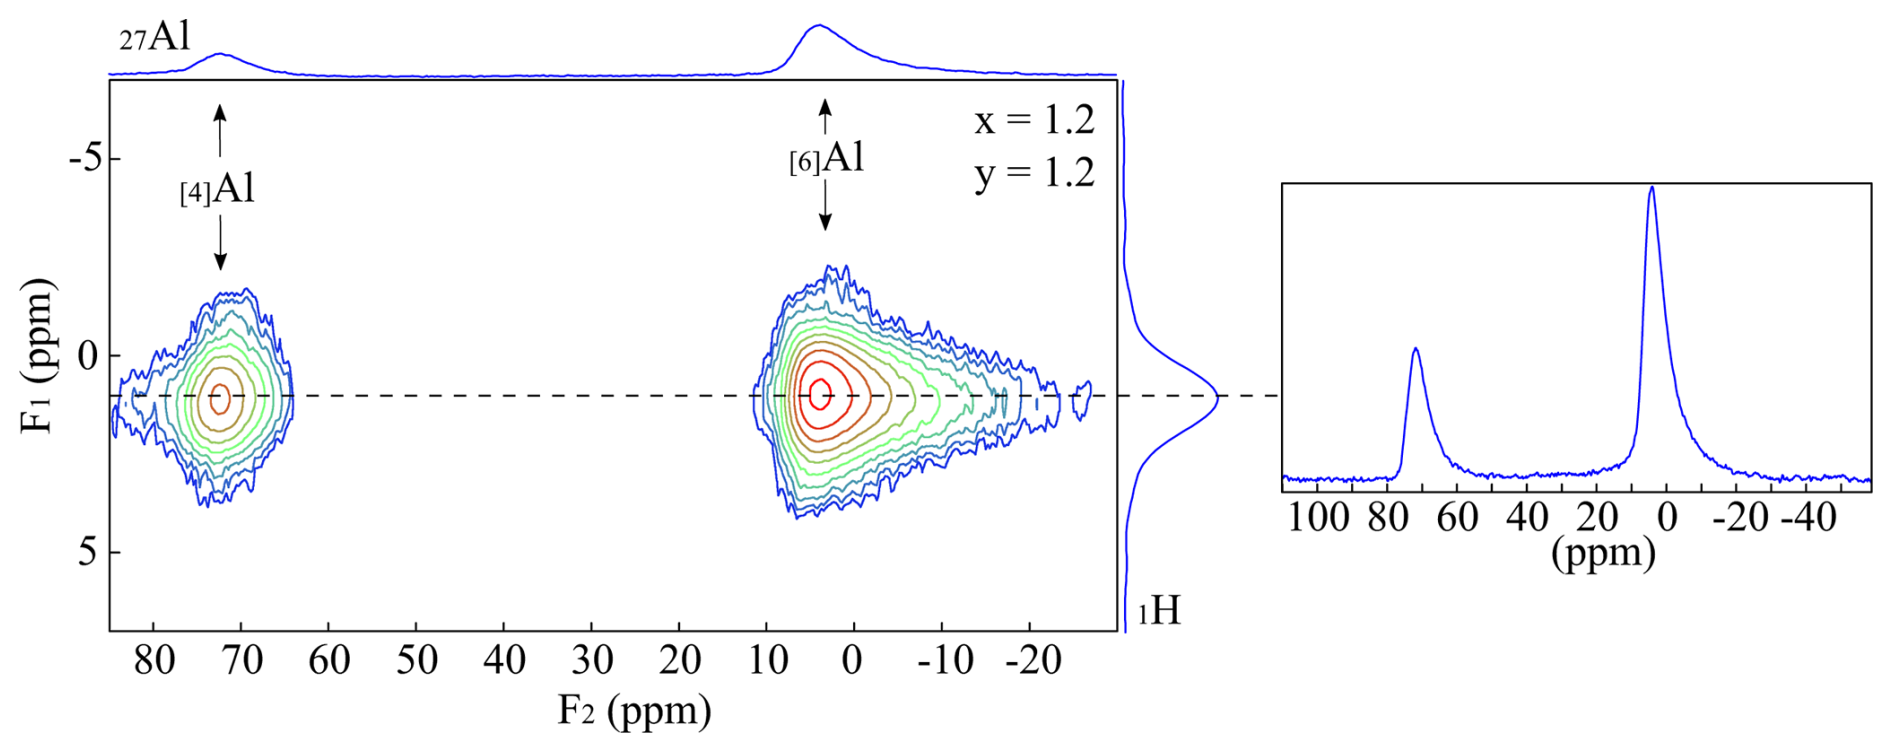
Figure 7{1H}→27Al CPMAS HETCOR spectrum of the sample Tl601212. The sample exhibits much broader 1H MAS NMR signals, which could not be separated.
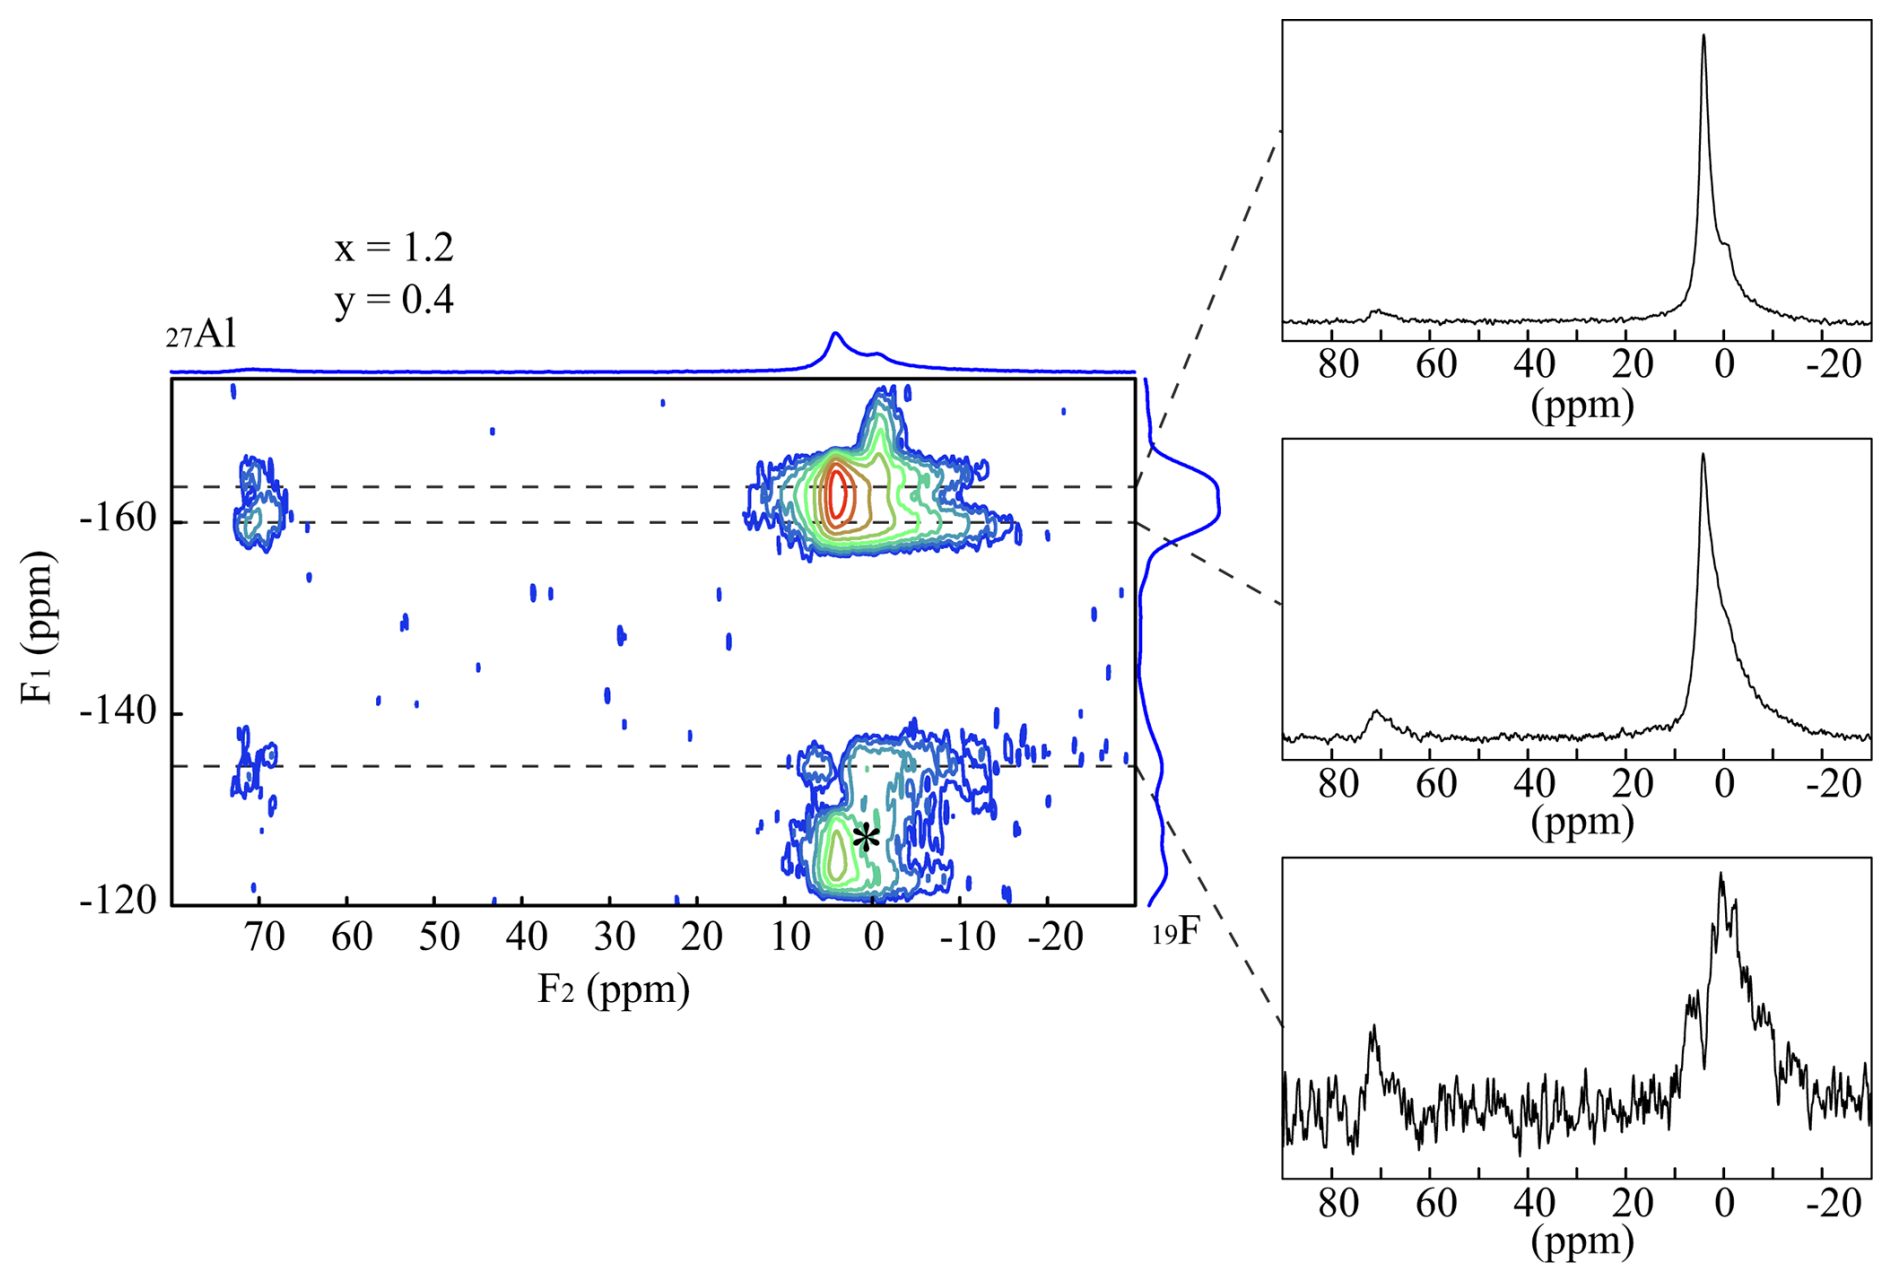
Figure 8{19F}→27Al CPMAS HETCOR experiments of the sample Tl601204. Three 1-D spectra were extracted along the dotted lines. Rotational sidebands are marked with an asterisk (*).
The 19F MAS NMR spectra of the muscovite samples show several signals at −160 ppm, which cannot be identified (Sulcek et al., 2023). These signals are not visible in the four {19F}→ 29Si CPMAS HETCOR spectra of TL6000006 (x=0.0, y=0.6), TL6000306 (x=0.3, y=0.6), TL6000906 (x=0.9, y=0.6), and TL6001204 (x=1.2, y=0.4), (Fig. 5) and thus do not refer to any F atoms which are next to incorporated Si. In conclusion, they do not relate to the muscovite but rather to secondary phases. The muscovite incorporates only tiny amounts of F visible through the comparatively low signal intensity. The intensity of both signals at −160 ppm (Li2Al-F) and −135 ppm (LiAl2-F) increases with increasing Li content. Thus, the incorporated amount of F increases. The signal at −160 ppm (Li2Al-F) is split into two different ones at −160 and −163 ppm, analogous to the lepidolites. The signal at −160 ppm shows a stronger cross-correlation to the Q3(2Al) environment. The intensity of the LiAl2-F signal is too low for a visible separation. The fact that the intensity of the LiAl2-F signal is lower compared to the trilithionite is unusual as the environments occur more frequently. Consequently, the Li-muscovites prefer the incorporation of OH− anions, which prefer the bonding next to the LiAl2 environments. Only small amounts of F were incorporated into the mica structure; the excess F atoms accumulate in the impurity phases.
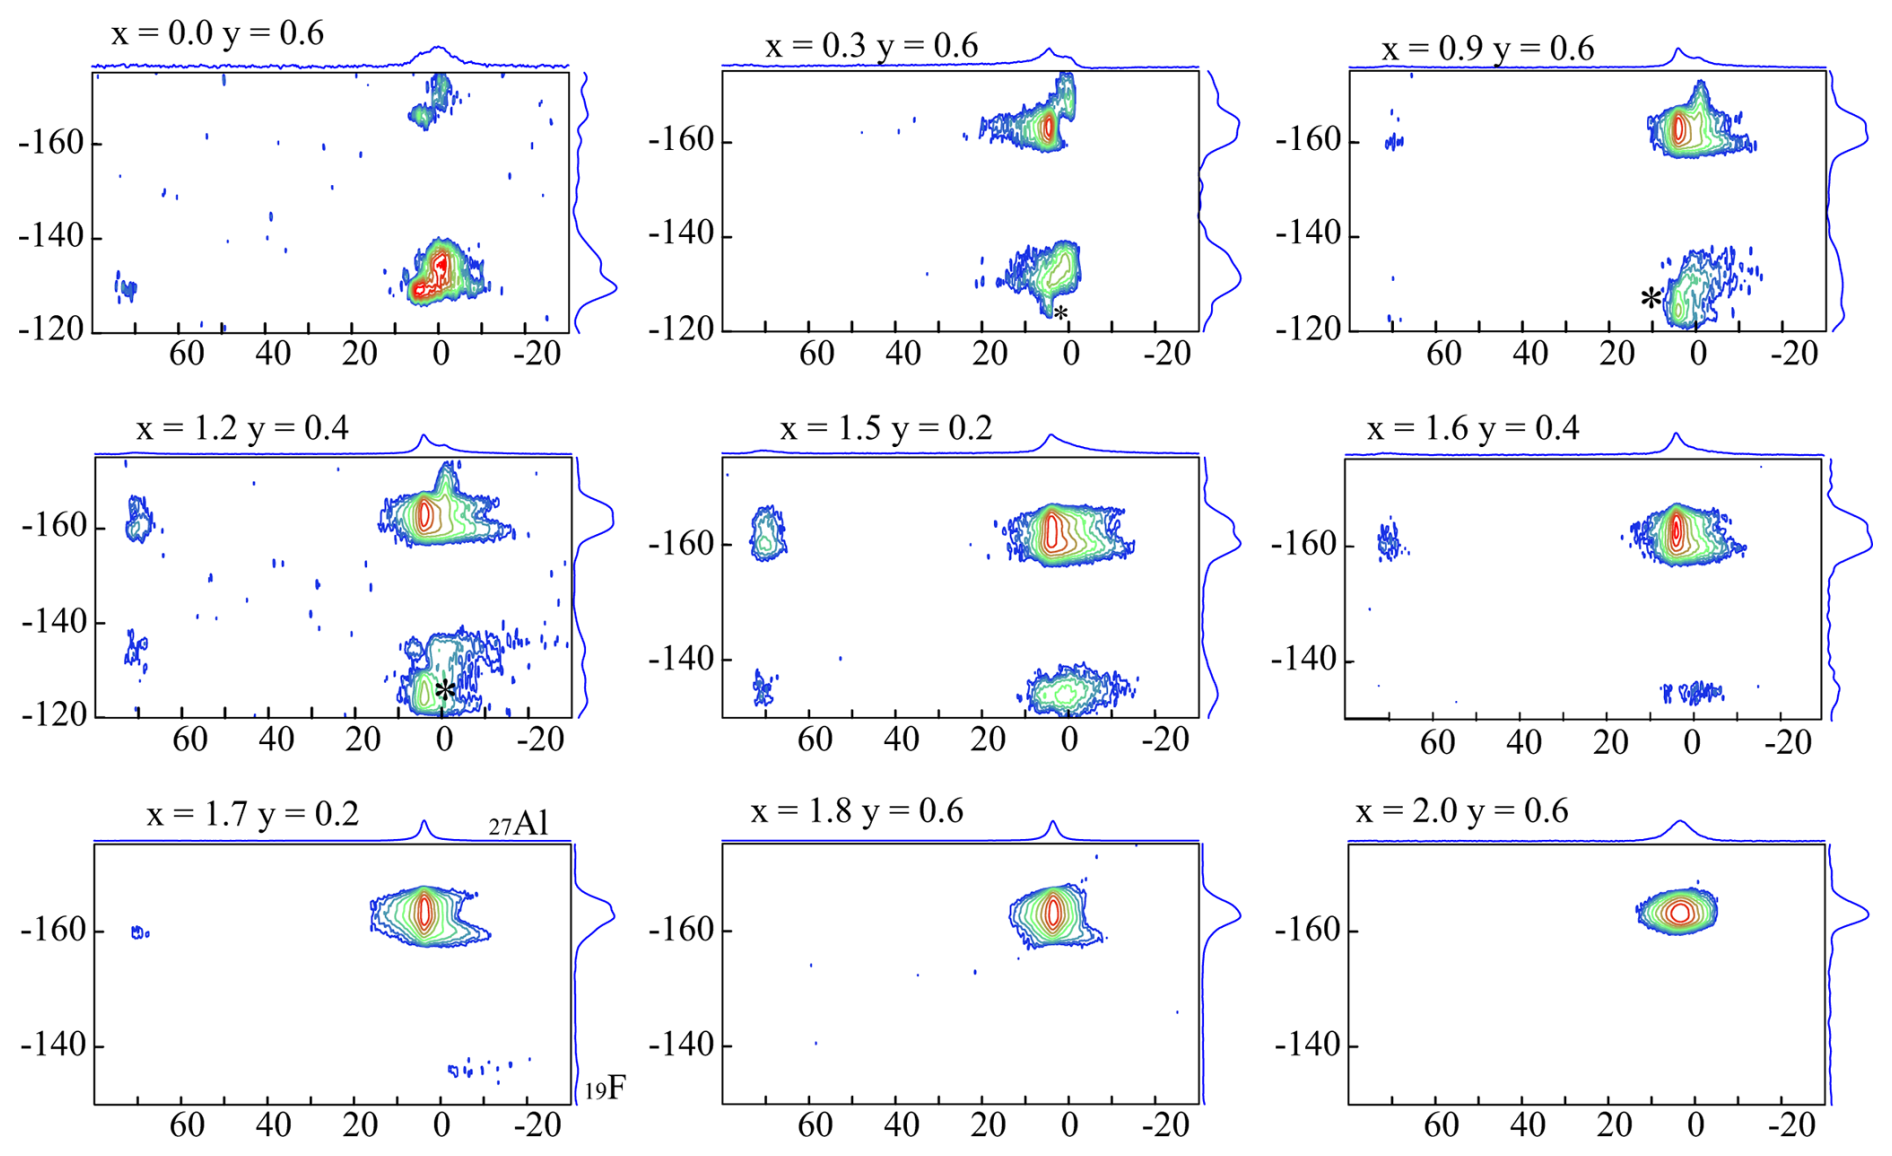
Figure 9{19F}→27Al CPMAS HETCOR spectra of nine different samples with nominal composition varying from muscovite (top left) to polylithionite (bottom right). Rotational sidebands are marked with an asterisk (*).
3.3 {1H}→27Al 2-D CPMAS HETCOR NMR spectroscopy
The {1H}→27Al 2-D CPMAS (HETCOR) NMR spectroscopy combines the information of the local 1H environment with the nearest tetrahedral and octahedral 27Al environments. The experiments are non-quantitative since the intensities of the signals depend on the number of H atoms in the neighbourhood. A spectrum is shown in Fig. 6 for a composition of x=1.7 and y=1.2 (PL601712). The 1H NMR signals in the F1 direction can be assigned to the Li2Al-OH (−2 ppm) and the LiAl2-OH (1 ppm) environment as already assigned in the 1-D single-pulse 1H MAS NMR experiments (Sulcek et al., 2023). These signals are correlated to the 27Al MAS NMR signals of the F2 direction being located at 70 ppm ([4]Al) and 3 ppm ([6]Al). A strong correlation between the LiAl2-OH environment and the tetrahedrally coordinated Al exists. The Li2Al-OH environment is close to Si-rich tetrahedral positions. In addition, the 2-D spectra show two different [6]Al signals with a quite similar chemical shift (Fig. 6). One shows a correlation with the Li2Al-OH and the other with the LiAl2-OH environment. The signals are very similar and close to each other. They cannot be distinguished in the single pulse 27Al MAS NMR spectra. The signal at −2.0 ppm correlates to the OH groups, with two Li and one Al as nearest neighbours. The chemical shift changes to 0.0 ppm when the OH is bonded to one Li and two Al. The electronegativity values explain the chemical shift differences between the two signals. The value for Al with 1.5 is much larger than the one of Li with 1.0. Due to the low electronegativity of Li, the shielding of the F nucleus increases and leads to a displacement of the signals to more negative values with increasing Li content (Huve et al., 1992). The experiments show a clear distribution based on the order analogous to the {1H}→29Si 2-D CPMAS (HETCOR) NMR measurements in this study. The OH groups bonded to the Li2Al environment show only weaker correlation to tetrahedrally coordinated Al. They are located near Si-rich sites. The OH groups bonded to the Al2Li environment completely occupy the sites near the [4]Al.
Figure 7 shows a {1H}→27Al 2-D CPMAS (HETCOR) NMR spectrum of a Li-muscovite (TL601212: x=1.2 and y=1.2). Analogous to the {1H}→29Si 2-D CPMAS (HETCOR) NMR spectra in this study, the broader 1H signals cannot be distinguished due to the smaller crystallite sizes and thus impossible to refer them to the Li2Al and LiAl2/Al2□ environments. This signal represents the averaged environment and strongly correlates with the [6]Al and the [4]Al. Compared to the Pl601712 sample, the cross-correlation with the tetrahedral Al is much stronger. The Li-muscovites incorporate more Al in the tetrahedral position than the lepidolites.
3.4 {19F}→27Al 2-D CPMAS HETCOR NMR spectroscopy
{19F}→27Al CPMAS HETCOR experiments were recorded to investigate the order in the mica structure. Figure 8 shows a 2-D spectrum of the sample TL601214 with a nominal composition of x=1.2 and y=0.4. Three 1-D spectra were extracted along the dotted lines. F1 represents the 19F signals and F2 represents the 27Al ones. Both tetrahedral (73 ppm) and octahedral (6 ppm) Al is incorporated next to F in the structure. A strong cross-correlation occurs between Li2Al-F and [6]Al.
The signal belonging to the Li2Al-F (−163 ppm) environment is split into two different ones. One at −163 ppm appears with a strong cross-correlation to [6]Al and a weak one to [4]Al. The other one, at −160 ppm, shows a similar behaviour, but the correlation to [4]Al is stronger. Since F especially prefers Li-rich environments, the Li2Al position has a higher intensity. A small amount of F is also incorporated on the LiAl2 site. This environment shows correlations with both [6]Al and [4]Al but with a stronger correlation to [6]Al.
The Al content decreases, and the ability to incorporate F in the crystal structure increases from muscovite to polylithionite. Figure 9 shows nine different samples with variable compositions (compositions are given in the figure). The polylithionite sample at the bottom right shows one F signal at −163 ppm, representing the Li2Al-F environment with a cross-correlation to the [6]Al at 6 ppm. A second F signal appears and increases with increasing Al content at −160 ppm with a strong cross-correlation to [6]Al and a weak one to [4]Al. All samples show the signal of the Li2Al-F environment except for the muscovite. Below a Li content of x=1.7, the signal of the LiAl2-F environment with a cross-correlation to the octahedral coordinated Al becomes visible. A cross-correlation between tetrahedral Al appears in the spectra of the samples Pl601502, Tl601204, and Tl600006.
It should be noted that the HETCOR spectra do not allow for a quantitative assessment of their components. The signal intensity depends on the incorporated F in the next neighbourhood. The F atoms prefer the incorporation next to Li2Al. The incorporated OH− anions first occupy the LiAl2 sites, which are only occupied with F when no more OH− anions are available. Previous experiments show that the Al-rich octahedral clusters prefer a localisation next to Al-rich tetrahedral clusters (Sulcek et al., 2020, 2023). Thus, samples with a higher OH content should show no cross-correlation to the tetrahedral coordinated Al, e.g., Tl600306 or Tl600906.
Synthetic lepidolites with composition
K(LixAl3−x)[Si2xAl4−2xO10] (OH)yF2−y and Li-muscovites with
K(LixAl[Si3AlO10](OH)yF2−y have been investigated using 2-D CPMAS HETCOR solid-state NMR spectroscopic experiments. The nominal composition ranged between (x=1.5–2.0; y=0.0–2.0) and (x=0.0–1.5; y=0.0–2.0), respectively.
Experiments show either Li2Al-OH and LiAl2-OH signals for 1H or Li2Al-F and LiAl2-F signals for 19F in the F1 dimension. The octahedral Li2Al groups are located close to Si-rich regions in the tetrahedral sheets, while the LiAl2 groups are located close to Al-rich regions of the same sheet. Each 19F NMR signal of Li2Al-F and LiAl2-F groups is split into two, one showing a slight stronger correlation to Al-rich tetrahedral regions. Both {1H}→27Al CPMAS NMR and {19F}→27Al CPMAS NMR show direct neighbourhoods for [4]Al and [6]Al close to the LiAl2 groups.
All results show a limited and mutual ordering of the tetrahedral and octahedral sheets with Al-rich tetrahedral regions clustering close to the Al-rich octahedral sites preferably coordinated by OH− anions and Si-rich tetrahedral regions close to Li-rich octahedral sites preferably coordinated by F− anions.
The data used for this article are available from Sulcek (2023, https://doi.org/10.13154/294-9641). Additional data are available upon request from the corresponding author.
MF initiated the project. The NMR experiments and syntheses were performed by LS. The NMR data evaluation and interpretation were carried out by LS and MF. MF prepared the paper, with contributions from LS. All authors participated in the discussion and interpretation of the results. Funding was acquired by MF.
The contact author has declared that neither of the authors has any competing interests.
Publisher's note: Copernicus Publications remains neutral with regard to jurisdictional claims made in the text, published maps, institutional affiliations, or any other geographical representation in this paper. While Copernicus Publications makes every effort to include appropriate place names, the final responsibility lies with the authors. Views expressed in the text are those of the authors and do not necessarily reflect the views of the publisher.
Nina Becker is acknowledged for providing some of the samples used. The authors thank two anonymous referees for helpful comments which improved the quality of the paper.
This research has been supported by the Deutsche Forschungsgemeinschaft (grant nos. Fe 486/8-1 and Fe 486/8-2).
This paper was edited by Giovanni De Giudici and reviewed by two anonymous referees.
Alba, M. D., Castro, M. A., Chain, P., Naranjo, M., and Perdigo, A. C.: Structural study of synthetic mica–montmorillonite by means of 2D MAS NMR experiments, Phys. Chem. Minerals, 32, 248–254, 2005.
Boukili, B., Holtz, F., Beny, J.-M., and Robert, J.-L.: “Fe-F and Al-F avoidance rule” in ferrous-aluminous (OH,F) biotites, Schweiz. Miner. Petrog., 82, 549–559, 2002.
Boukili, B., Robert, J.-L., Beny, J.-M., and Holtz, F.: Structural effects of OH – F substitution in trioctahedral micas of the system: K2O-FeO-Fe2O3-Al2O3-SiO2-H2O-HF, Schweiz. Mineral. Petrogr. Mitt., 81, 55–67, 2001.
Dingwell, D. B., Scarfe, C. M., and Cronin, D. J.: The effect of fluorine on viscosities in the system Na2O-Al2O3-SiO2: Implications for phonolites, trachytes and rhyolites, Am. Min., 70, 80–87, 1987.
Dingwell, D. B., Knoche, R., and Webb, S. L.: The effect of F on the density of haplogranite melt, American Mineralogist, 78, 325–330, 1993.
Fechtelkord, M. and Langner, R.: Aluminum ordering and clustering in Al-rich synthetic phlogopite: The influence of fluorine investigated by 29Si CPMAS NMR spectroscopy, Am. Min., 98, 120–131, 2013.
Fechtelkord, M., Behrens, B., Holtz, F., Bretherton, J. L., Fyfe, C. A., Groat, L. A., and Raudsepp, M.: Influence of F content on the composition of Al-rich synthetic phlogopite: Part II. Probing the structural arrangement of aluminum in tetrahedral and octahedral layers by 27Al MQMAS and -27Al HETCOR and REDOR experiments, Am. Min., 88, 1046–1057, 2003.
Fleet, M. E.: Sheet Silicates: Micas, in: Rock-forming Minerals, 2nd edition, edited by: Deer, W. A., Howie, R. A., and Zussman, J., The Geological Society, Bath, United Kingdom, ISBN 1-86239-142-4, 2003.
Foster, M. D.: Interpretation of the Composition of Lithium Micas, Geolog. Surv. Prof. Paper, 354, 115–147, 1960.
Griffin, J. M., Yates, J. R., Berry, A. J., Wimperis, S., and Ashbrook, S. E.: High-resolution 19F MAS NMR spectroscopy: structural disorder and unusual Jcouplings in a fluorinated hydroxy-silicate, J. Am. Chem. Soc., 132, 15651–15660, https://doi.org/10.1021/ja105347q, 2010.
Hamilton, D. L. and Henderson, C. M. B.: The preparation of silicate compositions by a gelling method, Mineral. Mag., 36, 832–838, https://doi.org/10.1180/minmag.1968.036.282.11, 1968.
Holtz, F., Dingwell, D. B., and Behrens, H.: Effects of F, B2O3 and P2O5 on the solubility of water in haplogranite melts compared to natural silicate melts, Contrib. Mineral. Petrol., 113, 492–501, 1993.
Huve, L., Delmotte, L., Martin, P., Le Dred, R., Baron, J., and Saehr, D.: 19F MAS NMR study of structural fluorine in some natural and synthetic 2:1 layer silicates, Clays and Clay Min., 40, 186–191,1992.
Kohn, S. C., Dupree, R., Mortuza, M. G., and Henderson, C. M. B.: NMR evidence for five- and six-coordinated aluminum fluoride complexes in F-bearing aluminosilicate glasses, Am. Min., 76, 309–312, 1991.
Kolodziejski, W. and Klinowski, J.: Kinetics of Cross-Polarization in Solid-State NMR: A Guide to Chemists, Chem. Rev., 102, 613–628, 2002.
Langner, R. and Fechtelkord, M.: Aluminium ordering and clustering in synthetic phlogopite: influence on the Al-content of phlogopite studied by NMR spectroscopy, Eur. J. Mineral., 24, 798–814, https://doi.org/10.1127/0935-1221/2012/0024-2227, 2012.
Langner, R., Fechtelkord, M., Garcia, A., Palin, E. J., and Lopez-Solano, J.: Aluminum ordering and clustering in Al-rich synthetic phlogopite: {1H}→29Si CPMAS HETCOR spectroscopy and atomistic calculations, Am. Min., 97, 341–352, 2012.
Loewenstein, W.: The distribution of aluminum in the tetrahedra of silicates and aluminates, Am. Min., 39, 92–96, 1954.
Luth, W. C. and Tuttle, O. F.: Externally heated cold-seal pressure vessels for use to 10,000 bars and 750 °C, Am. Min., 48, 1401–1403, 1963.
Manning, D. A. C.: The effect of fluorine on liquidus phase relationships in the system Qz-Ab-Or with excess water at 1 kb, Contrib. Mineral. Petrol., 76, 206–215, 1981.
Metz, G., Wu, X. L., and Smith, S. O.: Ramped-Amplitude Cross Polarization in Magic-Angle-Spinning NMR, J. Magn. Reson., 110, 219–227, 1994.
Papin, A., Sergent, J., and Robert, J.-L.: Intersite OH-F distribution in an Al-rich phlogopite, Eur. J. Mineral., 9, 501–508, https://doi.org/10.1127/ejm/9/3/0501, 1997.
Pines, A., Gibby, M. G., and Waugh, J. S.: Proton-enhanced nuclear induction spectroscopy. A method for high resolution NMR of dilute spins in solids, J. Chem. Phys., 56, 1776–1777, 1971.
Pines, A., Gibby, M. G., and Waugh, J. S.: Proton-enhanced NMR of dilute spins in solids, J. Chem Phys., 59, 569–590, 1973.
Robert, J.-L., Beny, J.-M., Della Ventura, G., and Hardy, M.: Fluorine in micas: crystal-chemical control of the OH-F distribution between trioctahedral and dioctahedral sites, Eur. J. Mineral., 5, 7–18, https://doi.org/10.1127/ejm/5/1/0007, 1993.
Schaller, T., Dingwell, D. B., Keppler, H., Knöller, W., Merwin, L., and Sebald, A.: Fluorine in silicate glasses: A multinuclear nuclear magnetic resonance study, Geochim. Cosmochim. Act., 56, 701–707, 1992.
Sulcek, L.: Cation and anion ordering and clustering in the system muscovite, trilithionite and polylithionite, PhD thesis, Ruhr-Universität Bochum, https://doi.org/10.13154/294-9641, 2023.
Sulcek, L., Langner, R., Werner-Zwanziger, U., Zwanziger, J. W., Martineau-Corcos, C., and Fechtelkord, M.: Solid-state nuclear magnetic resonance investigation of synthetic phlogopite and lepidolite samples, Magn. Reson. Chem., 58, 1099–1108, 2020.
Sulcek, L., Marler, B., and Fechtelkord, M.: Cation and anion ordering in synthetic lepidolites and lithian muscovites: influence of the and ratios on the mica formation studied by NMR (nuclear magnetic resonance) spectroscopy and X-ray diffraction, Eur. J. Mineral., 35, 199–217, https://doi.org/10.5194/ejm-35-199-2023, 2023.
Tuttle, O. F.: Two pressure vessels for silicate-water studies, Bull. Geol. Soc. Am., 80, 1727–1729, 1949.
Vega, A. J.: MAS NMR spin locking of half-integer quadrupolar nuclei, J. Magn. Reson., 96, 50–68 1992a.
Vega, A. J.: CPMAS of quadrupolar nuclei, Solid State NMR, 1, 17–32, 1992b.
Wu, X., Zhang, S., and Wu, X.: Two-stage feature of Hartmann-Hahn cross relaxation in magic-angle spinning, Physical Review B, 37, 9827–9829, 1988.