the Creative Commons Attribution 4.0 License.
the Creative Commons Attribution 4.0 License.
 | 30 Mar 2023
Cation and anion ordering in synthetic lepidolites and lithian muscovites: influence of the OH ∕ F and Li ∕ Al ratios on the mica formation studied by NMR (nuclear magnetic resonance) spectroscopy and X-ray diffraction
Lara Sulcek
Bernd Marler
Michael Fechtelkord
A large number of lepidolites K(LixAl3−x)[Si2xAl4−2xO10](OH)yF2−y and Li-muscovites K(LixAl)[Si3AlO10](OH)yF2−y were synthesised by a gelling method in combination with hydrothermal syntheses at a pressure of 2 kbar and a temperature of 873 K. The nominal composition ranged between and , i.e. from polylithionite K[Li2.0Al][Si4.0O10](OH)yF2−y over trilithionite K[Li1.5Al1.5][AlSi3.0O10](OH)yF2−y to muscovite K[Al2.0□][AlSi3.0O10](OH)yF2−y. 1H, 19F, 29Si and 27Al magic-angle spinning nuclear magnetic resonance (MAS NMR) and 27Al multiple-quantum magic-angle spinning (MQMAS) NMR spectroscopy has been performed to investigate the order and/or disorder state of Si and Al in the tetrahedral layers and of Li, Al, OH and F in the octahedral layer. The synthetic mica crystals are very small, ranging from 0.1 to 5 µm. With increasing Al content, the crystal sizes decrease. Rietveld structure analyses on 12 samples showed that nearly all samples consist of two mica polytypes (1M and 2M1) of varying proportions. In the case of lepidolites, the 1M 2M1 ratio depends on the ratio of the reaction mixture. The refinement of the occupancy factors of octahedral sites shows that lepidolites () represent a solid solution series with polylithionite and trilithionite as the endmembers. In the case of the Li-muscovites (), the 1M 2M1 ratio depends on the number of impurity phases like eucryptite or sanidine depleting the reaction mixture of Li or Al. There is no solid solution between trilithionite and muscovite; instead, the Li-muscovite crystals consist of domains differing in the relative proportions of muscovite and trilithionite.
The overall composition of the synthesised micas which consist of two polytypes can be characterised by 29Si, 1H and 19F MAS NMR spectroscopy. The ratio in the tetrahedral layers and thus the content of [4]Al were calculated by analysing the signal intensities of the 29Si MAS NMR experiments. The Li content xest was calculated from the measured tetrahedral ratio of the 29Si MAS NMR signals. The calculated Li contents xest of samples between polylithionite and trilithionite agree with the expected values. The F-rich samples show slightly increased values and the OH samples lower values. Lepidolites with only F (x = 1.5 to 2.0, y = 0.0), but not lepidolites with only OH (x = 1.5 to 2.0 and y = 2.0), were observed after synthesis. With decreasing Li content, x≤1.2, Li-muscovites containing mostly hydroxyl (y>1.0) are formed. It was possible to synthesise fluorine containing micas with a Li content as low as 0.3 and y = 0.2 to 1.8. The 19F and 1H MAS NMR experiments reveal that F and OH are not distributed statistically but local structural preferences exist. F is attracted by Li-rich and OH by Al-rich environments. The quadrupolar coupling constant which represents the anisotropy of the Al coordination is low for polylithionite with CQ=1.5 MHz and increases to CQ=3.8 MHz for trilithionite. For tetrahedral Al a smaller increase of CQ from 1.7 to 2.8 MHz is observed. Advancing from trilithionite to muscovite both quadrupolar coupling constants decrease to 2.5 MHz for octahedral and 1.5 MHz for tetrahedral Al. In polylithionite there is the most isotropic environment for octahedral Al; there are only Li2Al sites coordinated by F in the octahedral sheets and O from the tetrahedral sheets which are regular, containing only Si. The distortion and anisotropy for Al in tetrahedral as well as octahedral sheets increases with rising Al content. The most anisotropic environment can be found in trilithionite, especially for octahedral Al.
- Article
(6343 KB) - Full-text XML
- Companion paper
-
Supplement
(773 KB) - BibTeX
- EndNote


Micas are widespread minerals that are formed under various conditions and occur in almost all types of rocks. A special feature is the ability to incorporate considerable amounts of fluorine into the crystal structure. Fluorine is an incompatible element that accumulates during continuous crystallisation in the melt. Even small amounts of fluorine influence the physical properties of the melt. An increasing F content causes an increase in water solubility (Holtz et al., 1993) and a decrease in solidus temperature (Manning, 1981). Therefore, it is necessary to gain a deeper understanding of the partitioning processes of fluorine between the mineral and the co-existing melt. This includes not only studies of phase equilibria, partition coefficients and thermal stability of mica, but also investigations of the local F environment in F-bearing phases.
The mica mineral phlogopite shows a notable ability to take up fluorine in the division of phyllosilicate minerals. This property is only surpassed by the lepidolites within the class of mica minerals (Foster, 1960). The fluorine incorporation in micas is dependent on the Al content of the mineral: the less aluminium is present in the crystal structure, the higher the ability to replace OH with F (Langner and Fechtelkord, 2012). Therefore, it is necessary to investigate the capability of fluorine incorporation into the crystal structure of the lepidolites and lithium muscovites.
Robert et al. (1993), Papin et al. (1997) and Boukili et al. (2001) found that F strongly prefers micas with trioctahedral environments. Hydroxyl groups with high OH bond strengths can be easily substituted by F. In contrast, in dioctahedral sites the hydroxyl proton is involved in hydrogen bonds with O atoms from the adjacent tetrahedral sheet. As it is acting as a dipole rather than a sphere-like anion, a replacement by fluorine is difficult (Robert et al., 1993). In their IR spectroscopic study, Papin et al. (1997) demonstrated that the distribution in Al-rich phlogopite is not statistically random but that the F atoms prefer Mg2Al coordination and the hydroxyl groups prefer Mg3 coordination. These findings agree with the 19F, 1H and 29Si magic-angle spinning nuclear magnetic resonance (MAS NMR) study of Langner and Fechtelkord (2012). Boukili et al. (2002) investigated the relationship between F content and cation distribution over octahedral sites. They concluded that F–OH substitution is controlled in micas by the geometric adjustment of tetrahedral and octahedral layers, not by Al–F or Fe–F bond strength.
Solid-state NMR spectroscopy is an ideal tool to obtain structural data, complementing X-ray diffraction studies. Although only a few solid-state NMR studies have dealt with the structural incorporation of F in aluminosilicate glasses and layered silicates, they have made a large contribution to the understanding of the structural compositions. Kohn et al. (1991) and Schaller et al. (1992) determined AlF complexes in F-containing glasses by NMR spectroscopy. As a result, the formation of AlF complexes explains the increasing depolymerisation and thus the decreasing viscosity of the melt with increasing F content (e.g. Dingwell et al., 1987). Usually, Al is bonded to O atoms at the tetrahedral sites within the glass framework. When F complexes are introduced, they displace the Al atoms from the framework.
Langner et al. (2012) showed that different ordering schemes can be found in the tetrahedral and octahedral sheets of phlogopite: in the tetrahedral sheet ordering patterns are dominated by short-range ordering in order to avoid the formation of Al–O–Al linkages following Loewenstein's rule (Loewenstein, 1954). Long-range ordering is only present at Al content close to = 1 : 1, with Al and Si occupying the tetrahedra alternately. For the octahedral layer an Al–O–Al avoidance similar to the tetrahedral layers has been found, and Al is always surrounded by six Mg ions in the neighbouring octahedra. There is a relationship between the ordering in both types of sheets in that Al atoms in the octahedral and the tetrahedral sheets tend to be located next to each other, forming Al-rich clusters in the structure.
Although the amount of F in the initial oxide mixture did not change the Al content of the synthesised phlogopites, it had a strong influence on the number of impurity phases formed during synthesis. It has been found that high amounts of F prevented extensive formation of Al-rich phlogopites and vice versa, resulting in a formation of K3AlF6 • 0.5H2O instead of phlogopite (in addition to Al2O3). This effect has been observed not only for F-rich samples and higher Al contents, but also for extremely Al-rich compositions even if the amount of F was very low (Langner and Fechtelkord, 2012).
In this study, we continued our previous studies of the influence of the content on the formation of Al-rich phlogopites (Langner and Fechtelkord, 2012; Langner et al., 2012), focussing on Li-rich micas. A large number of synthetic lepidolites and Li-muscovites have been synthesised with a composition ranging from Li-rich polylithionites and trilithionites to Al-rich muscovites. The synthesis of lepidolites and Li-muscovites along the two corresponding binary lines and the subsequent X-ray diffraction (XRD) investigation revealed miscibility gaps and allowed us to identify occurring polytypes. The influence of incorporated anions was checked by modifying the nominal content in the synthesis mixture. To investigate the local ordering of cations and anions in the octahedral and tetrahedral layers according to the chemical composition, NMR spectroscopic investigations have been performed. It is possible to determine the composition of the synthesised micas by 29Si, 1H and 19F MAS NMR spectroscopy. 29Si MAS NMR experiments allowed us to calculate the ratio of tetrahedral sheets of the crystalline product (Langner and Fechtelkord, 2012). The Li content xest can be calculated from the determined tetrahedral ratio of the 29Si MAS NMR signals. The ordering of and in the octahedral sheets was investigated using 19F, 1H and 27Al MAS NMR spectroscopy to determine whether the preference of F for Mg and of OH for Al reported in phlogopite (Langner and Fechtelkord, 2012) also applies to lepidolite and lithium muscovite. In addition, 27Al multiple-quantum magic-angle spinning (MQMAS) NMR experiments helped to resolve the aluminium signals more precisely and identify possible emerging secondary phases.
Furthermore, X-ray diffraction experiments enabled the identification of impurity phases and polytypes and the analysis of stacking disorder of the mica phases. Scanning electron microscopy gave information about the crystal sizes of the mica phases and the impurities.
Background
Lepidolite and lithium muscovite belong to the phyllosilicates. All micas consist of interconnected tetrahedral–octahedral–tetrahedral layers forming TOT blocks which are stacked along the c axis and which are separated from each other by interlayer cations. The T sites of the tetrahedral layers are occupied with silicon and aluminium and the octahedral layers contain lithium and aluminium or a vacancy, while the interlayer cation is potassium. Each octahedral position is coordinated by four oxygen atoms belonging to the tetrahedral layer and two OH− or F− anions in either cis- or trans-coordination. The structure is shown in Fig. S1 in the Supplement. The endmembers trilithionite and polylithionite exhibit a trioctahedral structure with every octahedral position being occupied. Muscovite is a dioctahedral mineral, which contains a vacancy on one out of three octahedral positions.
Micas show a large number of different polytypes according to the stacking sequence of the TOT layers. According to Smith and Yoder (1956), there are six different ways to stack the layers along the c axis, always rotated by 60∘ relative to each other due to the hexagonal symmetry. The different polytypes can be divided into two subgroups A and B (Nespolo and Durovic, 2002; Ferraris and Ivaldi, 2002). The layers can be stacked with 2n × 60∘ (n=0, 1, 2) rotations of the TOT layers against each other. This results in subgroup A, while subgroup B includes the polytypes with (2m+1) × 60∘ (m=0, 1, 2). Smith and Yoder (1956) found six different polytypes 1M, 2M1, 2M2, 3T, 2O and 6H. Subgroup A containing the polytypes 1M (n=0), 2M1 (n=1 and 2) and 3T (n=1 or 2) and subgroup B 2O (m=1), 2M2 (m=0 and 2) and 6H (m=0 or 2).
Natural and synthetic micas are characterised by different chemical compositions and structures that comprise several polytypes. Early researchers suggest a simple correlation between the Li content and the occurrence of polytypes (Levinson, 1953; Foster, 1960). Natural lepidolites crystallise in the polytypes 1M, 2M2, 3T, 3M2 and 2M1 (Foster, 1960; Koval' et al., 1975; Bailey and Christie, 1978; Černý et al., 1970); the frequency of occurrence for the most important polytypes is (1M, 2M2) > 3T ≫ 2M1 (Pandey et al., 1982). The polytypes described for synthetic micas involve 1M and 2M1 and 2M2 type mixed with 2M1 (Munoz, 1968). Systematic studies of natural lithium micas from different locations show no direct relationship between the occurrence of polytypes and mica composition, besides the two exceptions of a high proportion of the 2M1 polytype in the dioctahedral lithium muscovite and 1M and 2M2 polytypes in the trioctahedral lepidolite (Heinrich, 1967; Chaudry and Howie, 1973; Černý and Burt, 1984). It indicates that not only the mica composition but also P–T conditions, volatile phases, degree of saturation and rate of cooling are determining the stability and occurrence of lepidolite polytypes (e.g. Sartori, 1976; Swanson and Bailey, 1981; Chaudry and Howie, 1973). Structural aspects regarding compositions of the octahedral and tetrahedral sheets, polytypes and possible miscibility gaps along the substitutions in the polylithionite–trilithionite–muscovite binary line are still unclear.
Muscovite has already been synthesised several times using different methods. Noll (1932) produced OH-bearing muscovite using gel close to the required composition. The synthesis was accomplished at 225–300 ∘C and 26–90 bar with a duration of 5 d. Gruner (1939, 1944) synthesised muscovite from a reaction mixture of Al(OH)3, silica and KCl in HCl solutions (400 ∘C, 350 bar, duration 5 d). Another successful synthesis of muscovite is the recrystallisation from its decomposition products reported by Gruner (1929) and Rov (1949). Gruner (1929) obtained “kaliophilite” with muscovite grown on it by decomposing natural muscovite with 0.5 M KOH in a bomb at 400 ∘C. Rov (1949) heated muscovite up to 1050 ∘C until only α-Al2O3 or spinel was observed. By treating the sample at 400–650 ∘C and 69–690 bar for 12–100 h, muscovite could be observed.
Only a few syntheses of lepidolite have been reported. Munoz (1968) synthesised the endmembers polylithionite and trilithionite using oxide–fluoride mixes and gels containing KHCO3, Li2CO3, LiF, γ-Al2O3 and SiO2 (250–800 ∘C, 2–5 kbar and 3–90 d). Rov (1949) tried to synthesise specific lepidolites by decomposition of lepidolites at 800–850 ∘C and a subsequent recrystallisation. However, the experiments were not successful.
Only a few solid-state nuclear magnetic resonance (NMR) studies were conducted. B-bearing polylithionite-2M1 was investigated using 11B, 27Al and 29Si magic-angle spinning (MAS) NMR spectroscopy (Novák et al., 1999). The results were close to those for boromuscovite from the same location.
2.1 Synthesis
Polylithionite–trilithionite solid solutions (lepidolites) with nominal compositions K(LixAl3−x)[Al4−2xSi2xO10](OH)yF2−y (; ) and lithium muscovites with nominal compositions K(LixAl[AlSi3O10](OH)yF2−y (; ) (Fig. 1) (composition of the oxidic start mixtures) were synthesised by a gelling method following Hamilton and Henderson (1968) in combination with hydrothermal syntheses. Figure 1 shows the phase diagram of the dioctahedral muscovite, the trioctahedral trilithionite and the trioctahedral polylithionite and oxidic ternary diagram containing the synthesised sample compositions. The starting compositions are listed in Table 1. High reactive oxide mixtures were prepared with 1 M solution of KNO3 (NORMAPUR, 26869.291), Al(NO3)3 • 9H2O (Merck, 1.01086.1000), Li(NO3) (abcr, AB203314, 99 %) and NH4F (Merck, 1.01164.0250) and filled in Teflon containers according to the required composition. Tetraethylorthosilicate was added as a source of silicon. A homogenous solution was achieved by adding ethanol (Fisher chemical, E/0650DF/17) and distilled water. Ammonia solution (Sigma-Aldrich, 05002-1L, 30 %–33 % NH3 in H2O) starts the gel process until the solution became alkaline. This solution was stirred for a further 15 min and then placed under a fume hood for 24 h. The samples were stirred again after 24 h and dried in an oven at 353.15 K for 1 d to volatilise the ethanol and residual ammonia. After that, the solution was stirred again and dried for 72 h at 393.15 K to volatilise the added water. The resulting platelets were crushed and heated in a platinum crucible at about 1073.15 K over a Bunsen burner until no further smoke was detected to drive off water, ethanol, ammonia and nitrogen oxides. The oxides were resorbed, and XRD experiments were made to test for possible crystalline phases. Only oxides, which were X-ray amorphous, were used in the syntheses, filled, and sealed in gold capsules with 9 wt % to 11 wt % distilled water. The correct sealing was controlled by placing the capsule at 393 K in an oven and checking for weight losses. The capsules are 4 cm long, possess an outer diameter of 4 mm, and have a wall thickness of 0.25 and 0.2 mm. A vertically hydrothermal system was used for the synthesis with Tuttle-type pressure vessels (Tuttle, 1949; Luth and Tuttle, 1963) and an external oven. The capsules were placed in the pressure vessels and fixed with a NiCr fill bar. This prevents circulation of water and minimises the amount of the water needed as the pressure medium. A Ni/NiCr thermocouple measured the temperature during the synthesis. The samples were synthesised at p=2 kbar and T=873 K over a week (error: Δp=50 bar and ΔT=20 K along the capsules). After the run duration, samples were quenched by removing them from the furnace and cooling in air at constant pressure. Isobaric heat-up and quenching times were about 1 h, which is assumed to be negligible compared to the overall run durations. The value of fO2 was close to that imposed by the Ni–NiO buffer. The synthesised samples were dried in an oven at 393 K for 24 h.
Table 1The nominal chemical composition of the synthesis products with variable content.
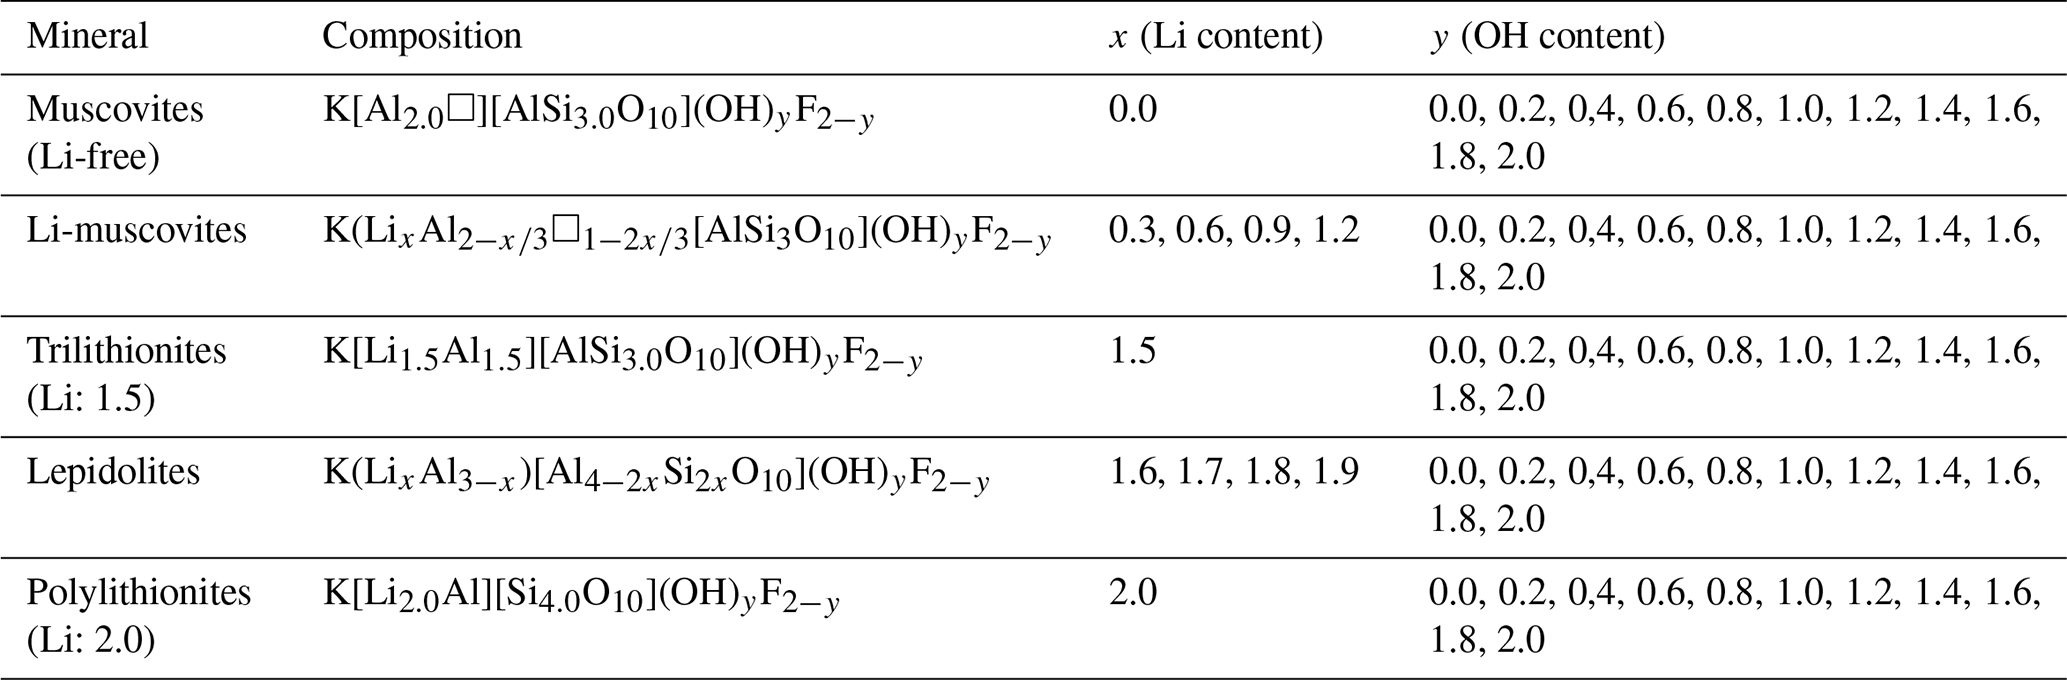
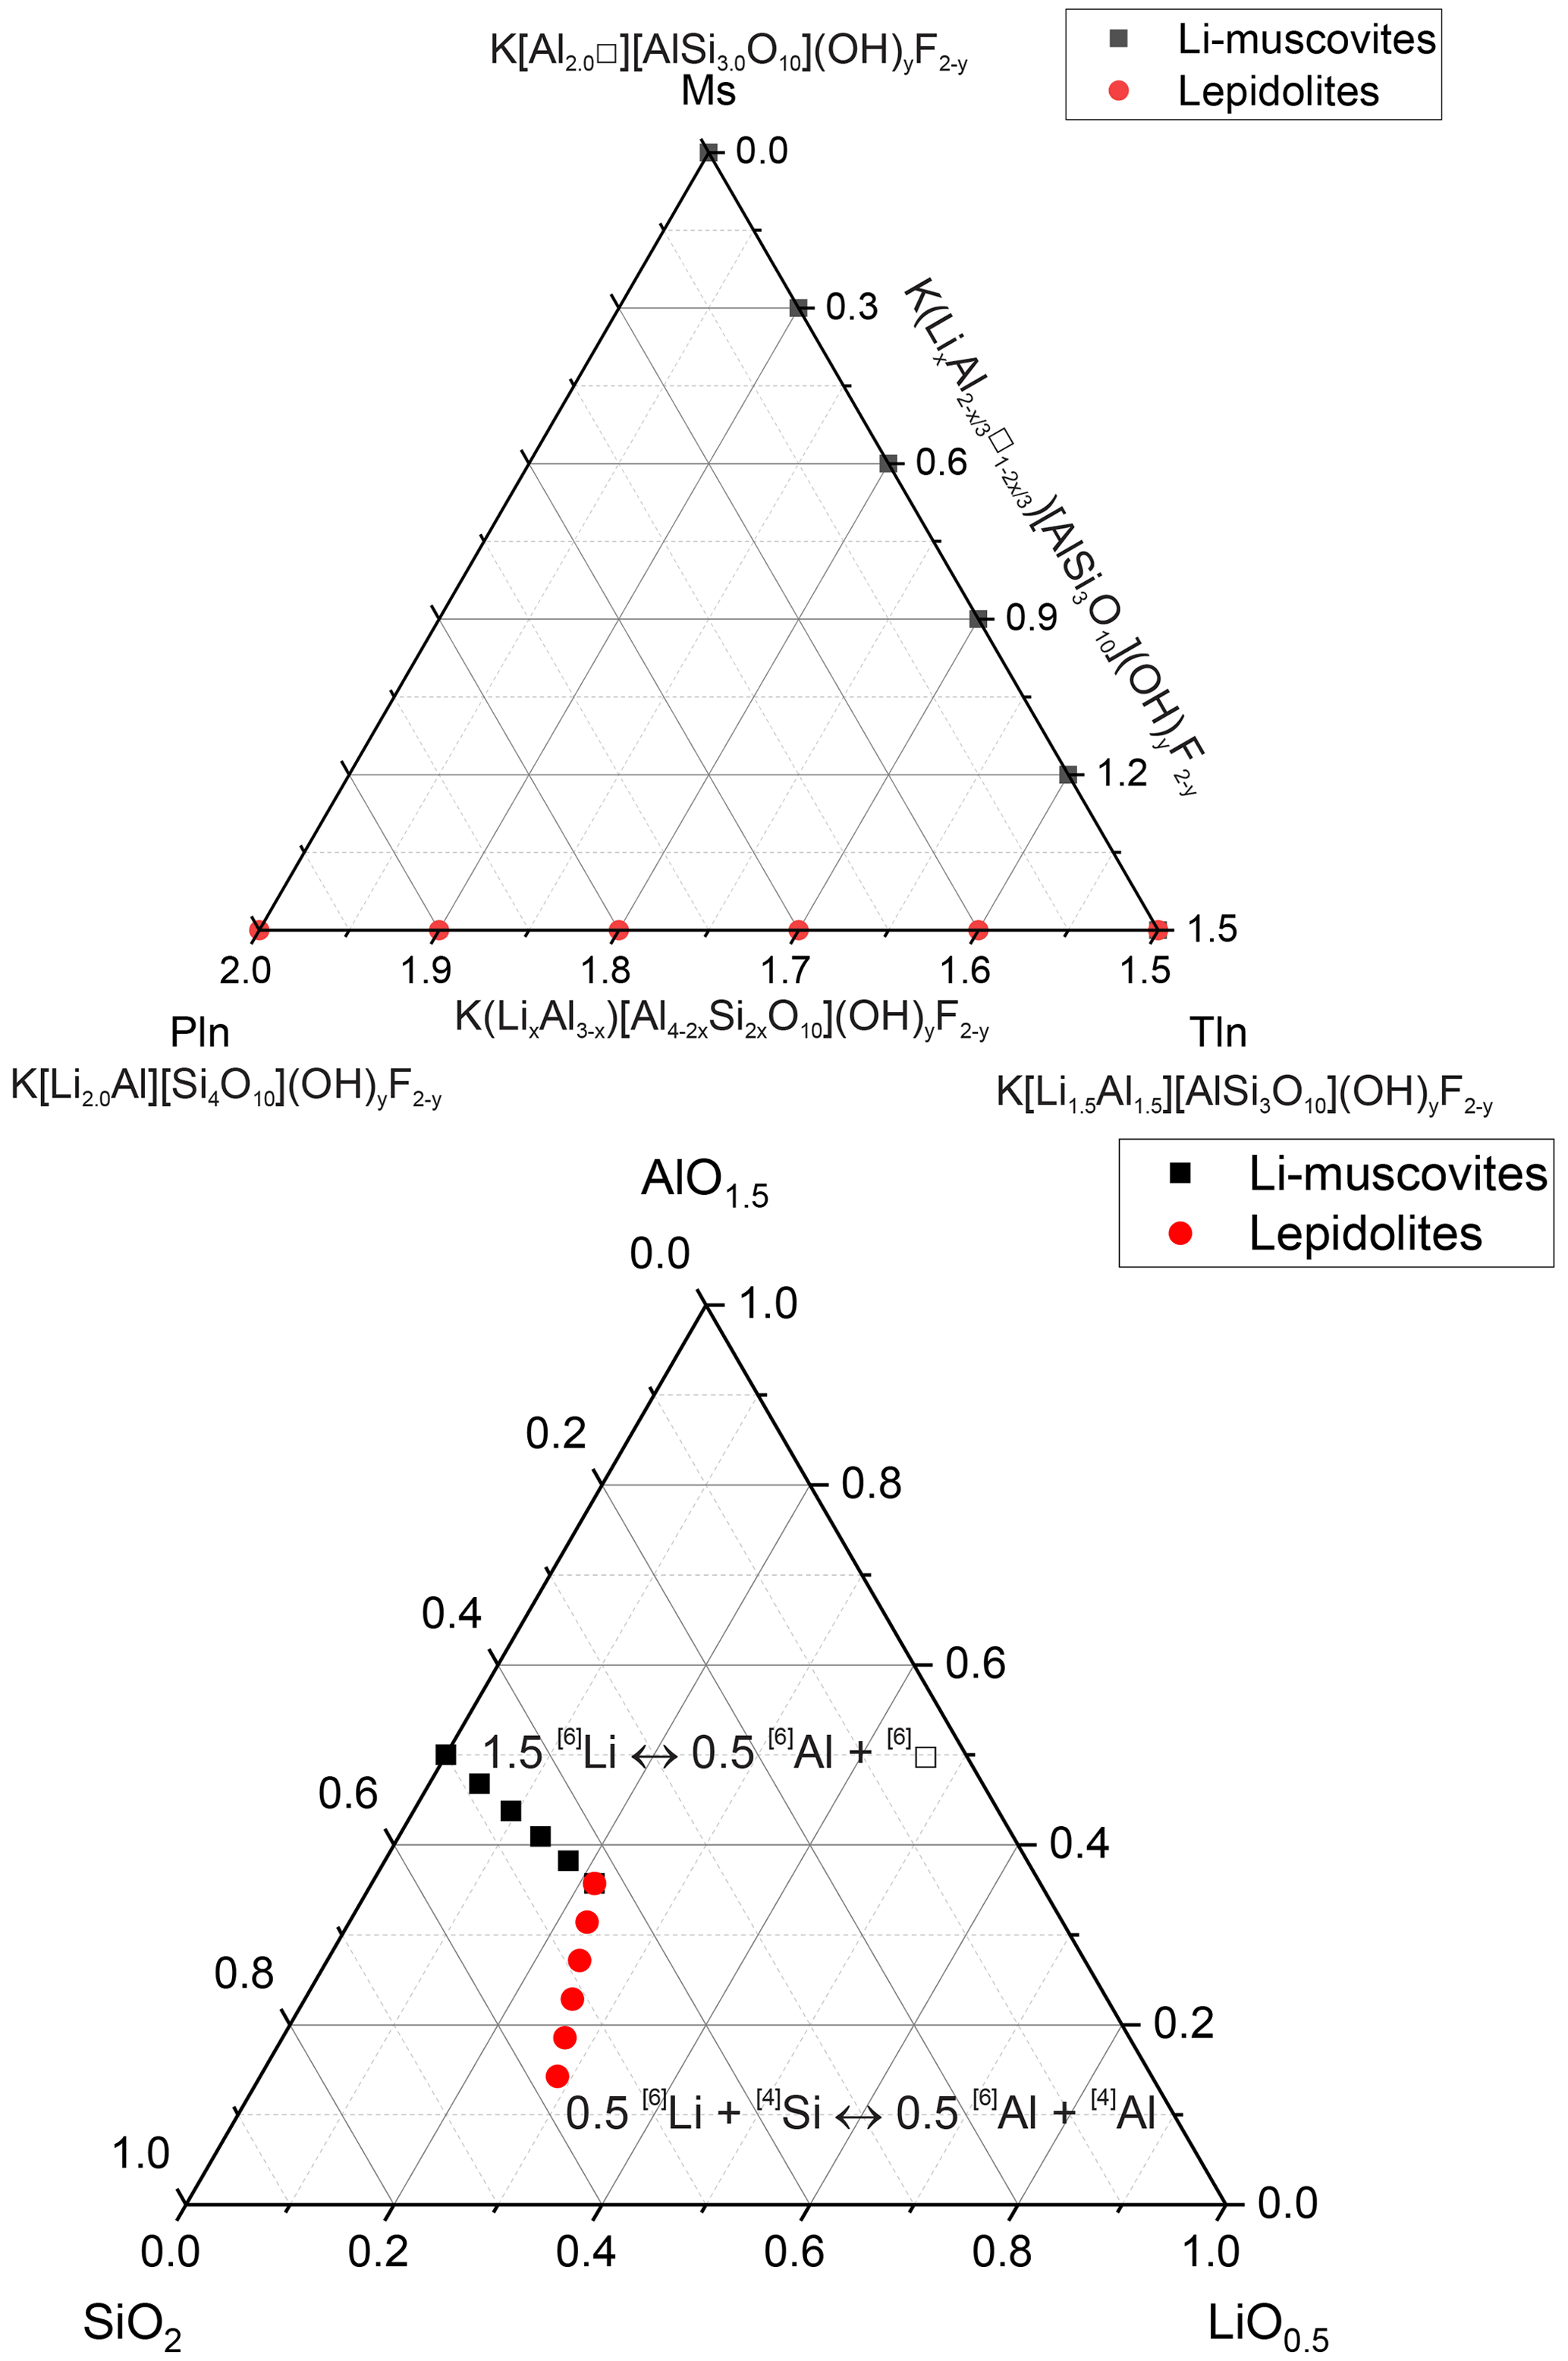
Figure 1Phase diagram of the dioctahedral muscovite, the trioctahedral trilithionite and the trioctahedral polylithionite and ternary diagram in terms of oxides showing the compositions of the samples used in the syntheses.
A large number of different compositions, along the binary lines between polylithionite–trilithionite and trilithionite–muscovite, were mixed according to the required composition (Table 1). Since the composition of the solid product may depend on the synthesis time, three experiments were performed, in addition, to explore the influence of the synthesis time. Reaction mixtures of identical composition were heated for 3, 7 and 14 d, respectively.
2.2 X-ray diffraction
For phase identification, powder X-ray diffraction (XRD) experiments were carried out on a PANalytical theta–theta powder diffractometer equipped with a Cu Kα radiation source (λ=1.5418 Å) in a 2θ range of 4 to 65∘ with a step size of 0.013∘ 2θ.
For structural studies, high-resolution XRD patterns were recorded using a Siemens D5000 diffractometer with Cu Kα1 radiation (λ = 1.54060 Å, 45 kV, 40 mA), a Johansson Ge(111) monochromator and a Braun position-sensitive detector (6∘ coverage). The measured range was 4 to 90∘ 2θ with a step size of 0.0078∘ 2θ. Additionally, a STOE STADI MP diffractometer equipped with a Johansson Ge(111) monochromator (wavelength: 1.54060 Å, 40 kV, 40 mA) and a Mythen K1 position-sensitive detector (18∘ coverage) was used. The measured range was 5 to 95∘ 2θ, with a step size of 0.015∘ 2θ. The samples were prepared in borosilicate glass capillaries with a diameter of 0.03 mm to prevent preferred orientation of the micas for both diffractometers.
To analyse the samples with respect to the presence of impurity phases and of several structurally closely related mica polytypes, the samples were measured using synchrotron radiation at the beamline P08 at PETRA III, DESY, Hamburg, Germany. The wavelength for the experiment was λ=1.378 Å. The intense synchrotron beam is in particular suitable to detect even very weak reflections.
The three samples obtained after different synthesis times have also been measured using synchrotron radiation.
2.3 Structure refinement
The structures were refined using the FullProf 2K program (Rodríguez-Carvajal, 1993, 2001) with scattering factors as implemented there. No absorption correction was necessary. For the Rietveld refinement, soft distance restraints were used: d(Si[4]–O) = 1.62(1) Å, d(Si[4]⋯Si[4])=3.03(2) Å, d(Al[6] Li[6]⋯Al[6] Li[6]) = 2.98(2) Å d(O⋯O) = 2.65(3) Å, d(Al[6] Li[6]–O/OH/F, large octahedron) = 2.08(3) Å, d(Al[6] Li[6]–O/OH/F, small octahedron) = 1.92(3) Å, d(K–O) = 3.00(4) Å; nine additional parameters had to be used to describe the anisotropic peak widths. To obtain informative occupancy factors of Li and Al atoms from samples containing structurally closely related mica polytypes which, in addition, are somewhat disordered, specific care had to be taken. Since displacement parameter and occupancy factor of an atom are highly correlated in a structure refinement based on powder data, isotropic displacement parameters were fixed for cations (Li, Al, Si, K) and anions (O, OH, F) at crystal chemically meaningful values: Biso(cations) = 0.9 Å2, Biso(anions) = 1.8 Å2.
2.4 Scanning electron microscopy
To investigate the crystal shapes and sizes of the samples and to characterise the impurity phases, scanning electron microscopy (SEM) measurements in combination with energy-dispersive X-ray spectroscopy (EDX) analyses have been performed. For the experiments, a ZEISS – Gemini2 – Merlin HR-FESEM (high-resolution–field emission scanning electron microscopy) microscope with an acceleration voltage of 4 to 20 kV was used. The samples were gold-coated before investigation.
2.5 Nuclear magnetic resonance
The NMR spectra were recorded on a Bruker ASX 400 NMR spectrometer and a Bruker Avance NEO 400 NMR spectrometer. The 29Si MAS NMR measurements have been performed at 79.49 MHz with a standard Bruker 7 mm MAS probe and a sample rotation frequency of 4 kHz. The experiments were carried out with a single pulse duration of 4 µs (the length of the 90∘ pulse was 6.5 µs (Bruker Avance Neo) and 5.8 µs (Bruker ASX)), 10 s recycle delay and a spectral width of 20 kHz. A total of 700–30 000 scans were accumulated. Tetramethylsilane was used as the reference standard for 29Si and 1H MAS NMR measurements, which were taken at 400.13 MHz, with a pulse length of 2 µs (90∘ pulse length 5.3 µs (Bruker ASX) and 90∘ pulse length 3.0 µs (Bruker Avance Neo)) with a repetition time of 10 s. Selected spectra were measured with longer repetition times to ensure that the short times are sufficient to obtain the desired signals. The spectral width was 125 kHz, and a total of 128 scans were added up.
In 19F MAS NMR experiments, 300 scans were recorded at 376.51 MHz and a rotation frequency of 12.5, 15 and 35 kHz. The faster speeds were chosen due to overlaps of a signal in the MAS NMR measurement with the rotation sidebands. The spectral width was 125 kHz and the pulse length was 4 µs (90∘ pulse length 4.0 µs (Bruker ASX)) and 2.08 µs (90∘ pulse length 7.1 µs (Bruker Avance Neo)). The repetition time was 10 s (Bruker ASX) and 15 s (Bruker Avance Neo). As an external standard, p-C6H4F2 was used, and the parts per million scale was calibrated to −120 ppm.
In the case of 19F and 1H MAS NMR investigation, the empty rotor was measured, and the spectra were subtracted as a background measurement from the sample spectra due to extensive background signals. As a result, the broad signal from the rotor environment was eliminated. It was based on, for example, cables and glue and on the probe head stator, a BN stator containing hydrogen atoms and a Teflon heat shield containing fluorine.
The 27Al MAS NMR experiments were taken at 104.27 MHz and a rotation frequency of 12.5 kHz. A molar aqueous solution of AlCl3 (aq) was used as the external standard. A total of 25 000 scans were performed with a spectral width of 125 kHz, a pulse length of 0.6 µs (90∘ pulse length 3.5 µs (Bruker Avance Neo) and 3.8 µs (Bruker ASX)) and a repetition time of 0.1 s.
The 27Al MQMAS investigations were evaluated as split-t1–whole-echo experiments. The spectral width has been reduced to 50 kHz for the F2 direction. The 90∘ pulse lengths were 3.3 µs for the excitation pulse and 10 µs for the double-frequency sweep (DFS) conversion pulse. An initial delay between the two pulses of 1 µs was chosen. After the conversion pulse, a delay of 2.79 ms was chosen to allow the full echo to build up after the 20 µs selective 180∘ soft pulse. For each experiment, an F1 increment of 40 µs was selected, and 192 scans were added with 96 transients. The DFS started at an offset of 50 kHz and ended at 1 MHz; the frequency resolution was 50 ns. The labelling of the F1 axis follows Cz but is inverted due to the echo acquisition convention (Millot and Man, 2002).
2.6 Fitting of NMR spectra
All NMR spectra were fitted with mixed Lorentzian–Gaussian lineshapes including convolution using the Dmfit 2022 program (Massiot et al., 2002). Some 27Al MAS NMR lineshapes partially show a distribution of quadrupolar parameters in their signal components. These resonances were fitted by the introduction of a Gaussian distribution of the quadrupolar coupling (dispersion) and a subsequent summation of the computed weighted signal components (amorphous Cz simple model). Tolerances (estimated standard deviations) were estimated by varying the line position and linewidth in the fit function, observing the statistical χ2 function until a distinct change of χ2 took place.
3.1 Characterisation of samples and impurity phases by X-ray powder diffraction and scanning electron microscopy
Table 1 presents the composition of oxidic reaction mixtures used to perform a large number of different synthesis experiments of mica phases along the binary lines muscovite–trilithionite and trilithionite–polylithionite:
A detailed analysis of the sample compositions was possible on the basis of the XRD powder data. The presence and the total number of impurity phases give a first hint at the “willingness” of the mica phases to crystallise from a particular reaction mixture. Moreover, the knowledge of the phase composition of each sample is helpful to interpret the corresponding NMR spectra.
The phase composition and the crystallisation of impurity phases may depend on the synthesis time. Thus, the synthesis time of a selected experiment (x=0.0, y=1.6) was diversified from a standard of 7 to 3 or 14 d, respectively. The three corresponding diffraction patterns present no significant differences. It only seems that the crystallinity is slightly better after 14 d. The reflections are slightly sharper, and several very weak reflections that appear in the other two diagrams are missing. However, the differences are not significant enough to justify doubling the synthesis time. All other samples were prepared with a synthesis time of 7 d.
No additional phases occur with increasing Li and F content , , and . It seems that there is an optimal composition for a Li content and a corresponding F content.
Prior to the structure analyses, synchrotron powder diffraction diagrams of eight selected samples were recorded to get a first impression of the complexity of the envisaged analyses shown in Fig. S2. In nearly all cases, a series of weak reflections are visible, which indicate that either several mica polytypes are present or the mica phase is characterised by a stacking disordered structure. Reflections originating from a secondary mica are marked by ↓ in the upper and lower diagram. The main phase is always polytype 1M. The small additional reflections can be assigned to the polytype 2M1. The intensity of the small reflections shows no correlation to the chemical composition.
The samples exhibit very small sizes of the mica crystals, ranging from 0.1 up to 5 µm (Fig. 2). The polylithionite samples show the largest crystals. With increasing Al content, the crystal sizes decrease. Muscovite yields larger crystals. The crystals show, typical for micas, the cleavage along the (001) plane and a platy habit. SEM images (e.g. Fig. 2) show that some platelets have a pseudo-hexagonal outline and that the platelets are more commonly aggregated into clusters.
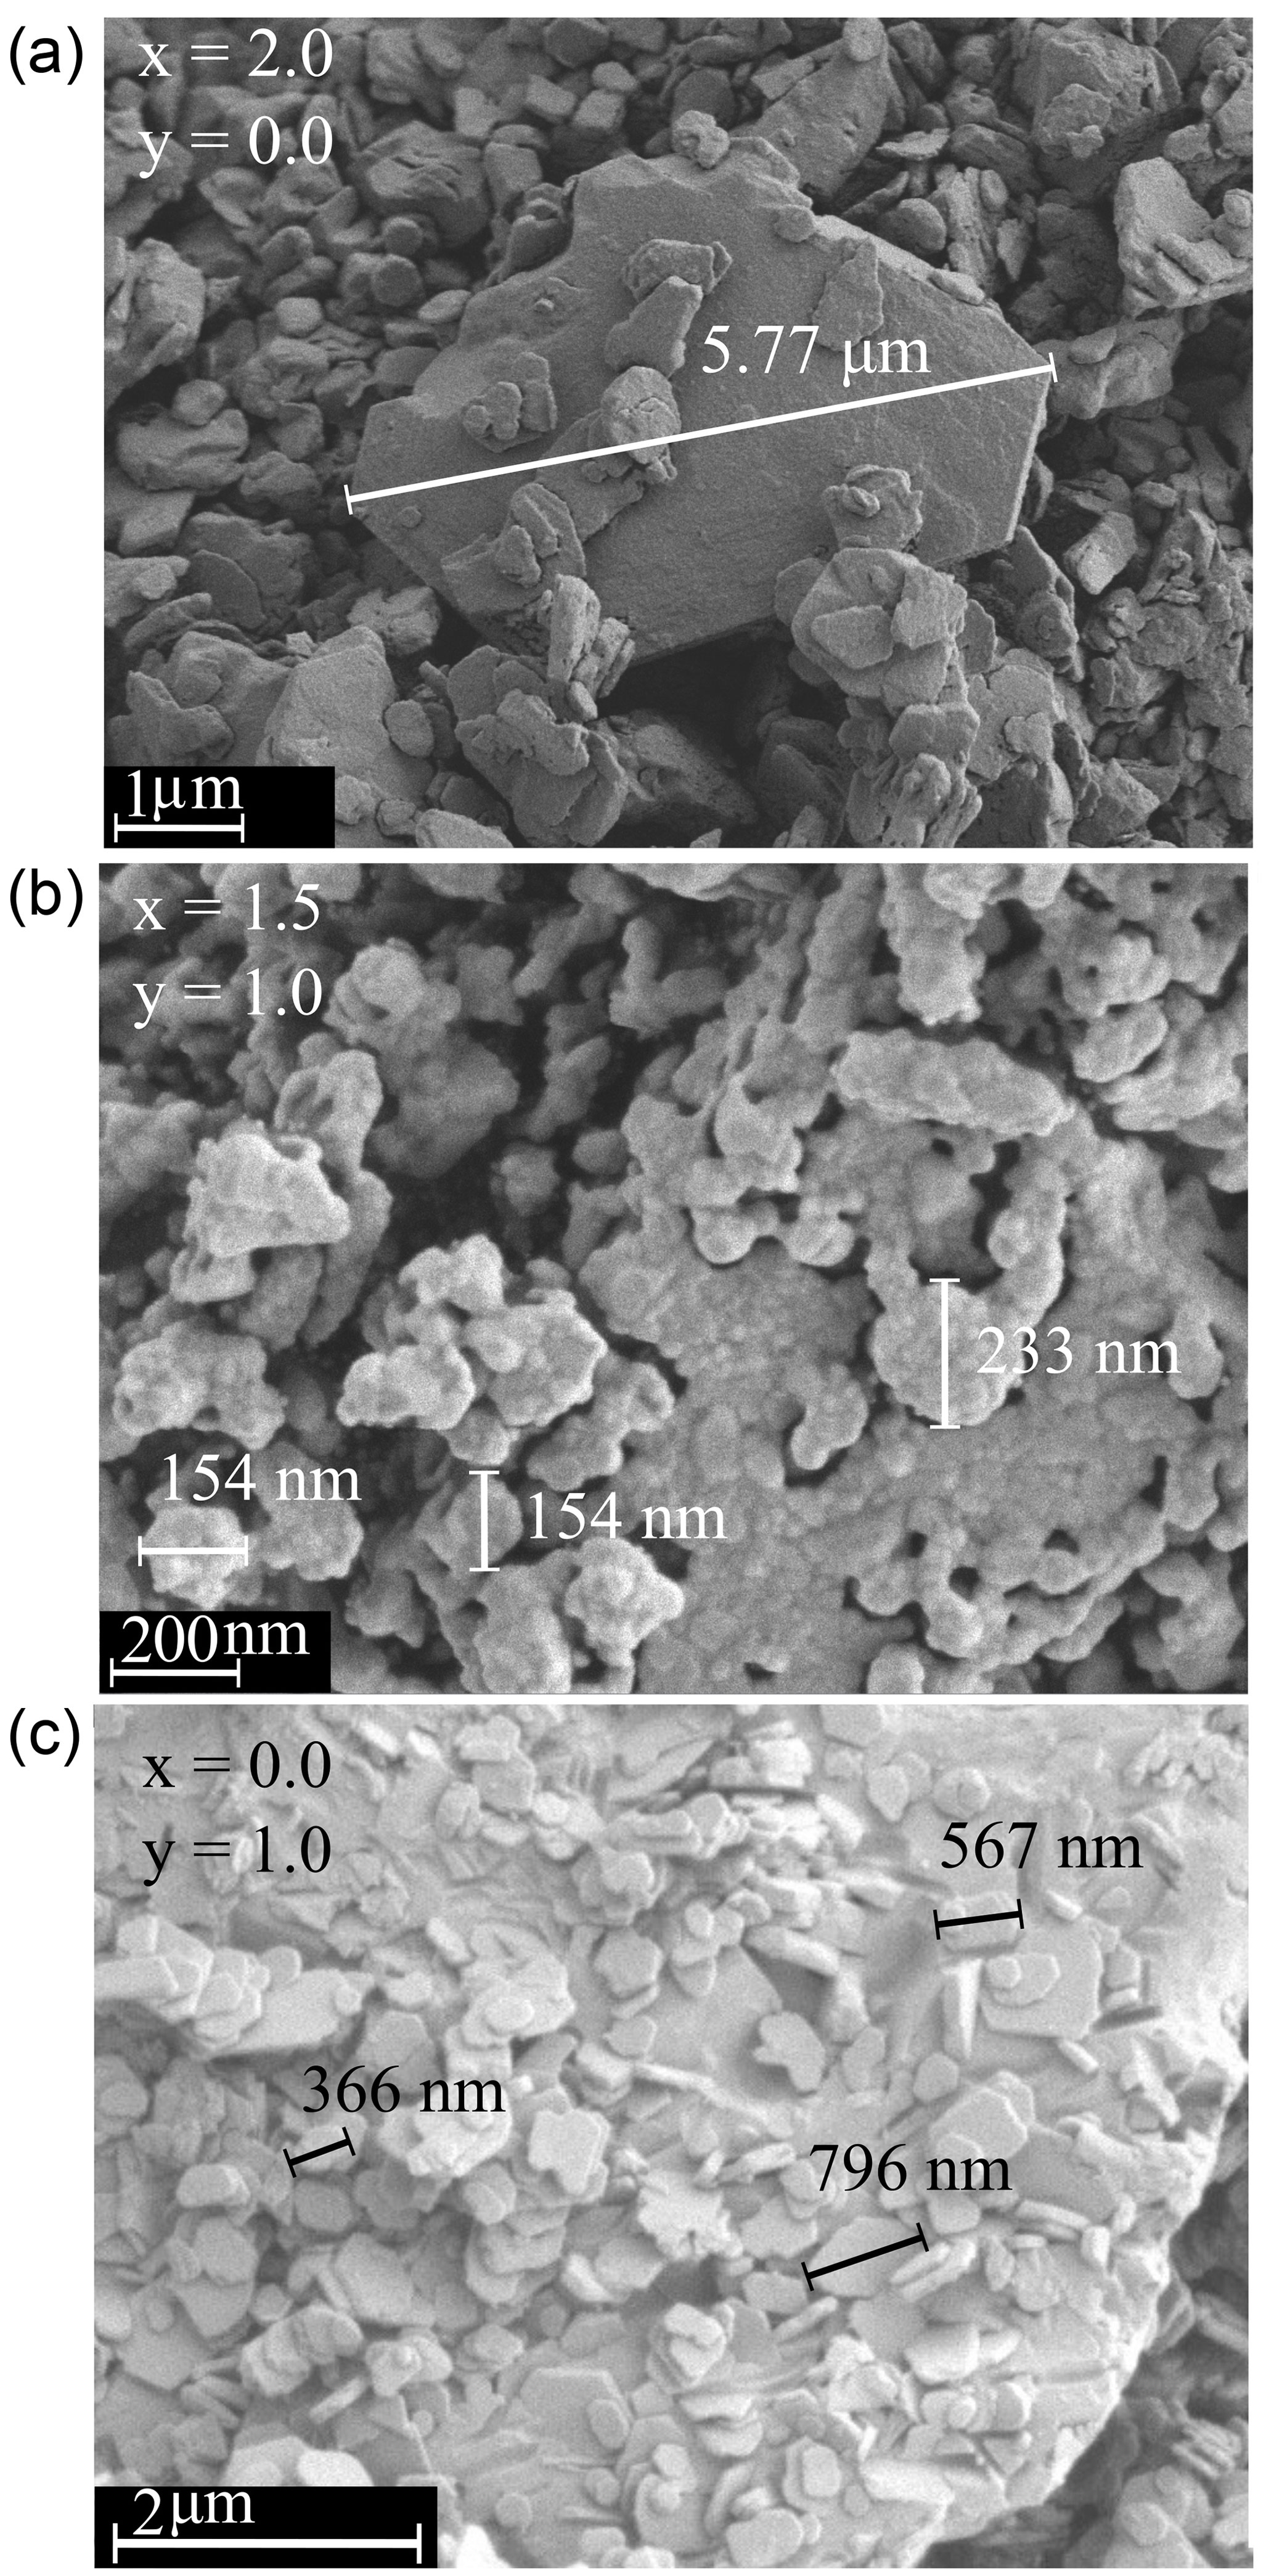
Figure 2SEM images of three samples (a: polylithionite, b: trilithionite and c: muscovite). The crystallite sizes decrease with increasing disorder in the structure.
It was possible to distinguish between the micas and some impurity phases. The crystallite sizes of the impurity phases were larger (up to 130 µm) and were finally identified with EDX measurements (energy-dispersive X-ray spectroscopy) and X-ray diffraction analysis. A list of the phase compositions of the samples is given in Tables 2 and 3. Figure 3 illustrates the optimal, sufficient and inadequate oxide compositions of the reaction mixture to form micas. Seemingly, there is an optimal chemical composition for the mica synthesis. Fewer additional phases occur with a lithium content between 2.0 and 1.5, combined with a high F content. The trilithionite samples can be synthesised without any additional phases up to an OH content of y=0.6. With decreasing Li content (x≤1.2) and increasing OH content, the proportion of impurity phases decreases. The muscovite samples without Li show fewer impurity phases with an OH content y≥1.6.
Figure 3Diagram of phases as determined by X-ray diffraction for compositions along the trilithionite–muscovite (Li-muscovites) and the trilithionite–polylithionite join (lepidolites). Optimal compositions of the nominal oxide mixtures are plotted in brown dots, sufficient nominal compositions are plotted in red dots and inadequate compositions are displayed in orange dots.
Table 2List of phases as determined by X-ray diffraction for the nominal compositions of the reaction mixtures along the polylithionite (Pln)–trilithionite (Tln) join. The various phases are listed in order of relative quantity. Products with mica as major phase are printed in bold letters. Symbols – Qz: SiO2 (quartz), Ecp: eucryptite, Sa: sanidine, l2s: Li2SiO3, Lct: leucite, l2s2: Li2Si2O5 (lithium disilicate). Some impurity phases which could not be identified are marked with (?).

Table 3List of phases as determined by X-ray diffraction for the nominal compositions of the reaction mixtures along the trilithionite–muscovite join. The various phases are listed in order of relative quantity. Products with mica as major phase are printed in bold letters. Symbols – Qz: SiO2 (quartz), Ecp: eucryptite, Sa: sanidine, Lct: leucite, l2s2: Li2Si2O5 lithium disilicate, tpz: topaz. Some impurity phases which could not be identified are marked with (?).
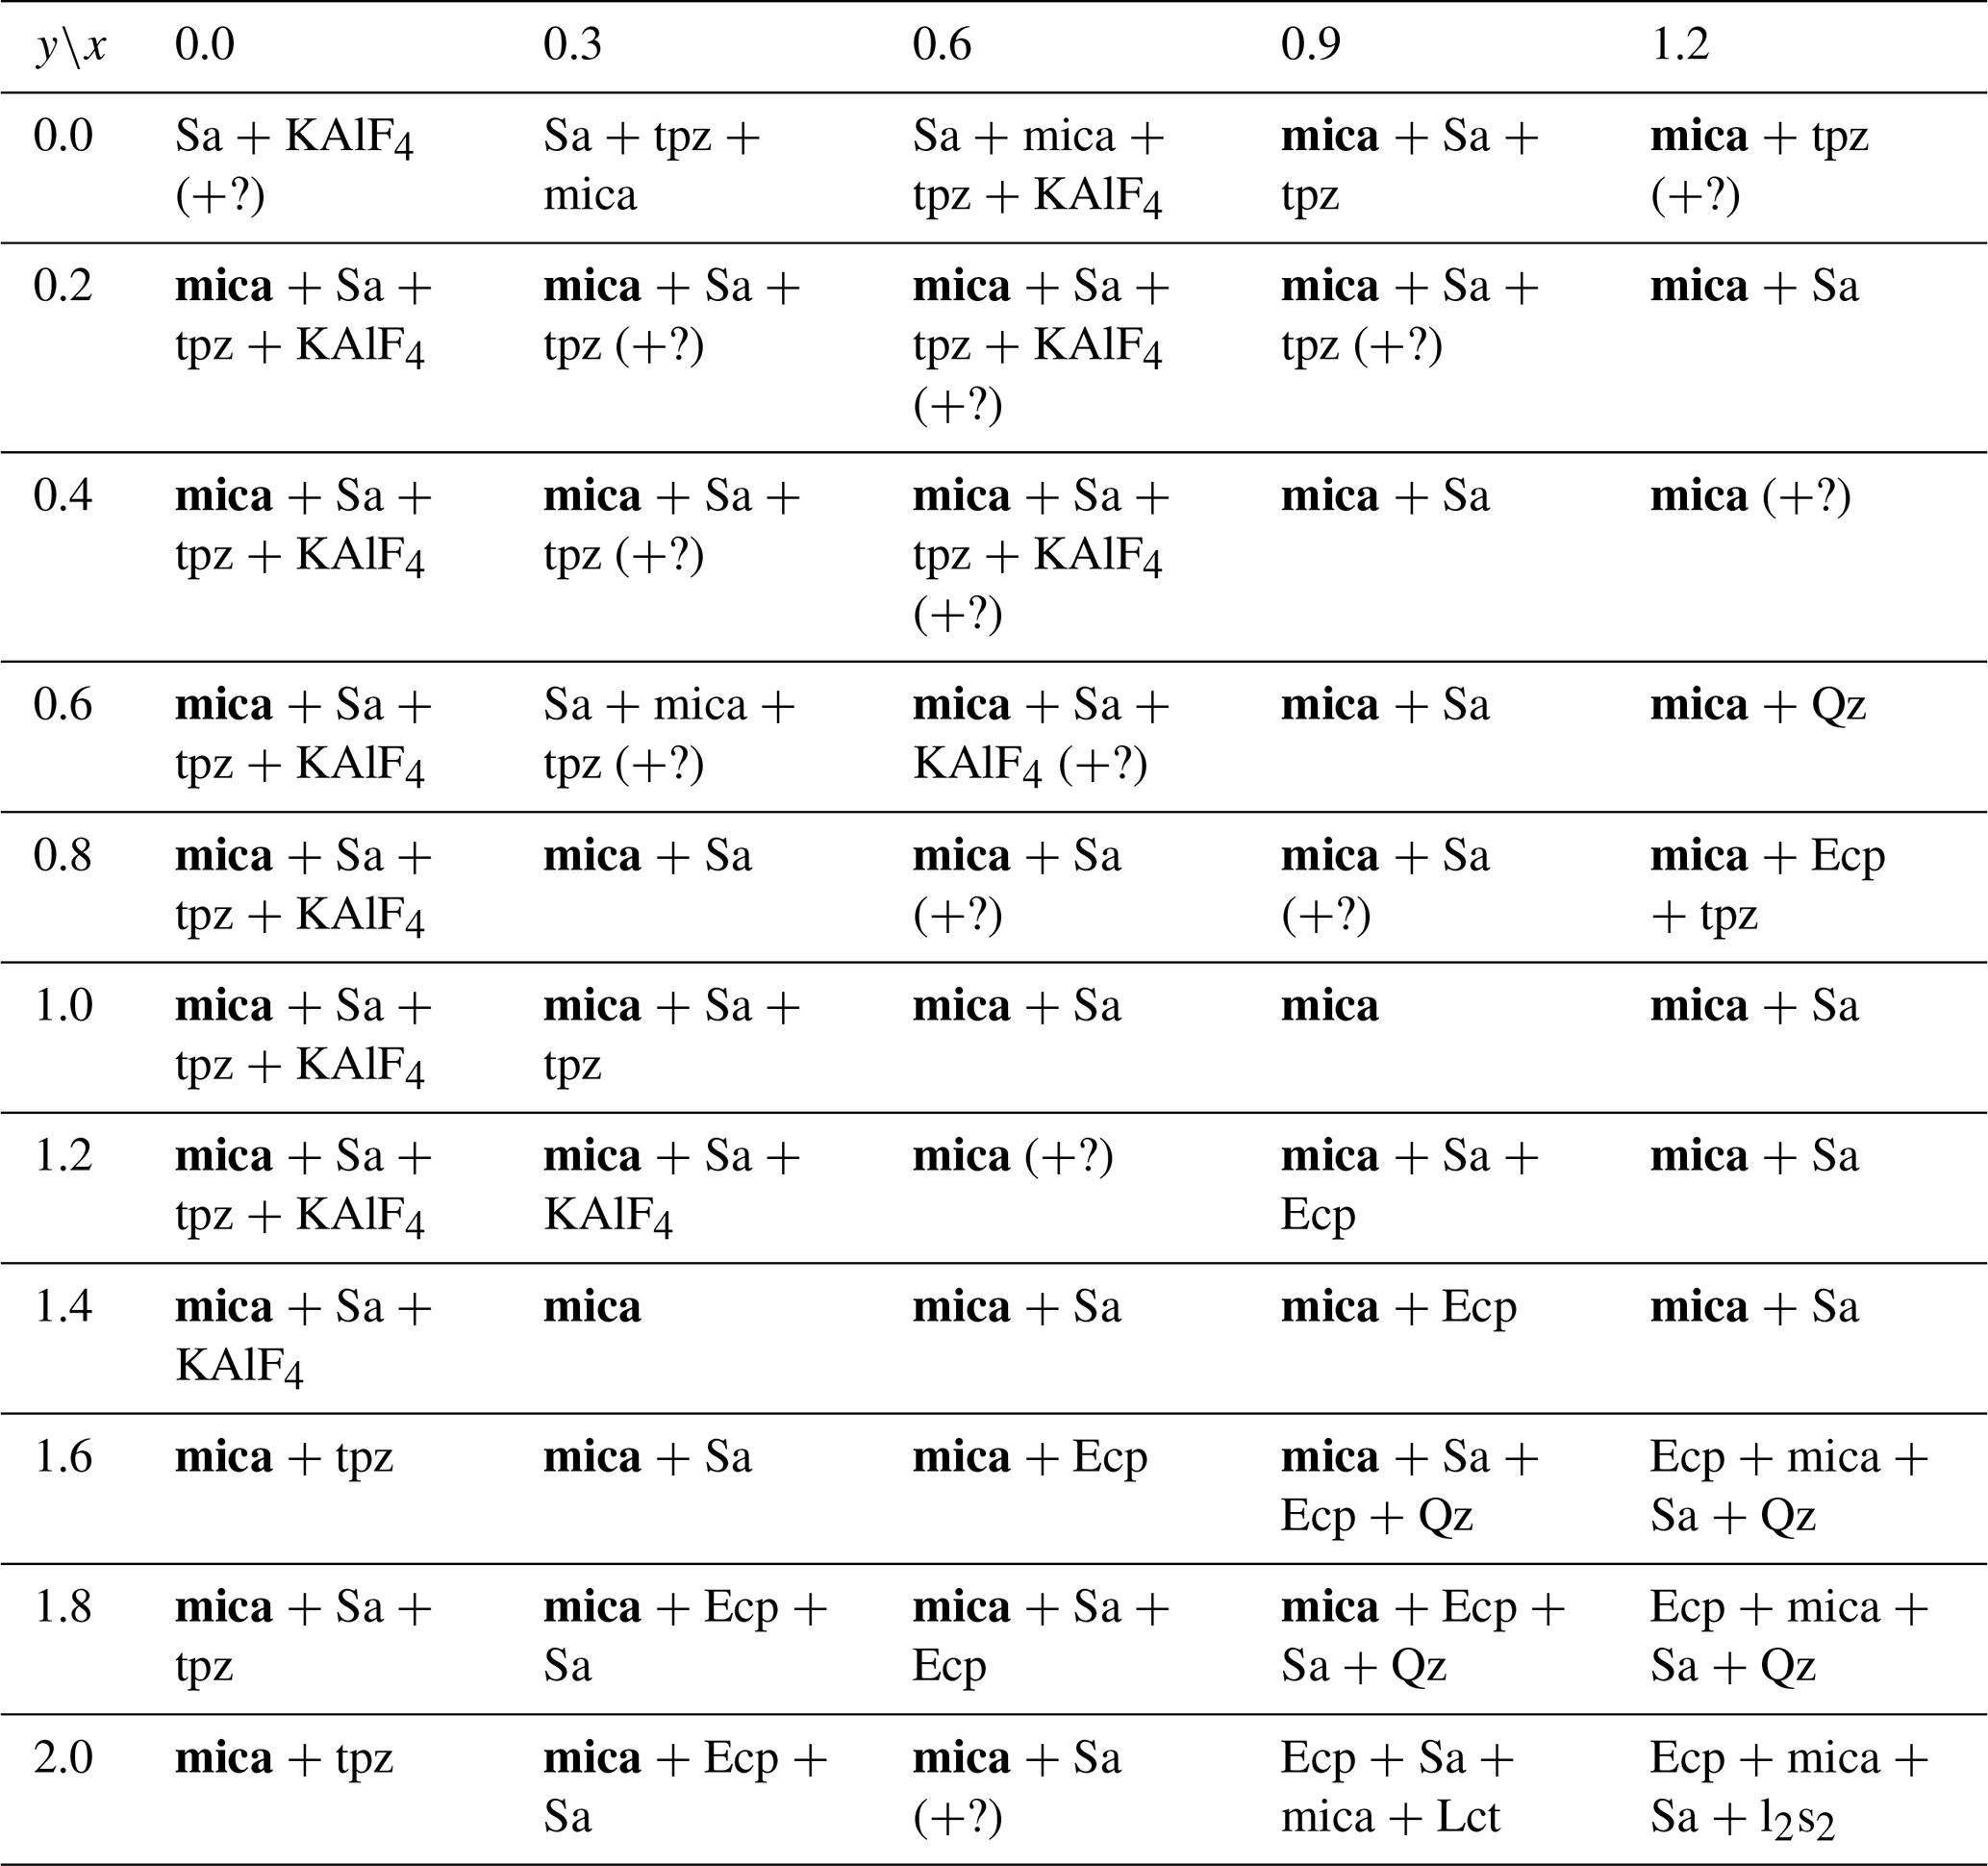
Along the trilithionite–polylithionite line (K(LixAl3−x)[Al4−2xSi2xO10](OH)yF2−y; ), fewer secondary phases are observed with a higher fluorine content (y=0.0 and 0.2). At ratios higher than y=0.2, eucryptite and sanidine are the most common impurity phases. Additionally, quartz, leucite, lithium metasilicate and lithium disilicate are present in lower amounts (Table 2). With increasing OH content, the number of additional phases increases. In this work, synthesised trilithionites can occur up to y=0.6 without additional phases in agreement with experiments of Munoz (1968). With an increasing Li content, the impurity phases are present even at lower OH contents (e.g. x=1.6, y=0.4; x=1.7, y=0.2). Polylithionite without any impurity phases crystalises only without any OH content. In contrast, no mica phases are present along the binary line between trilithionite and polylithionite without F content. Small amounts of fluorine (y=1.8) are sufficient to produce mica phases.
The Li-muscovites (K(LixAl)[AlSi3O10](OH)yF2−y; ) show the opposite behaviour due to their dioctahedral structure (Table 3); the incorporation of hydroxyl groups is energetically more favourable for Li-muscovites than for lepidolites since the OH bond can point to the vacancy of the structure. The muscovite crystallises without additional phases with an OH content of y=2.0. The addition of fluorine to the synthesis mix leads to the additional formation of sanidine and KAlF4.
Nevertheless, it is possible to synthesise the phyllosilicates under the specified conditions for most compositions. Only the lepidolites without any fluorine and muscovites without any OH could not be synthesised. The results are consistent with Munoz (1968), who reported the successful synthesis of polylithionite and polytrilithionite in a fluorine-rich system, but no polylithionite or polytrilithionite, when fluorine is completely substituted by hydroxyl.
Eucryptite, sanidine and quartz are the most common impurity phases; Li2SiO3, Li2Si2O5, KAlF4, topaz and leucite rarely occur, in agreement with Munoz (1968).
3.2 Structure refinements
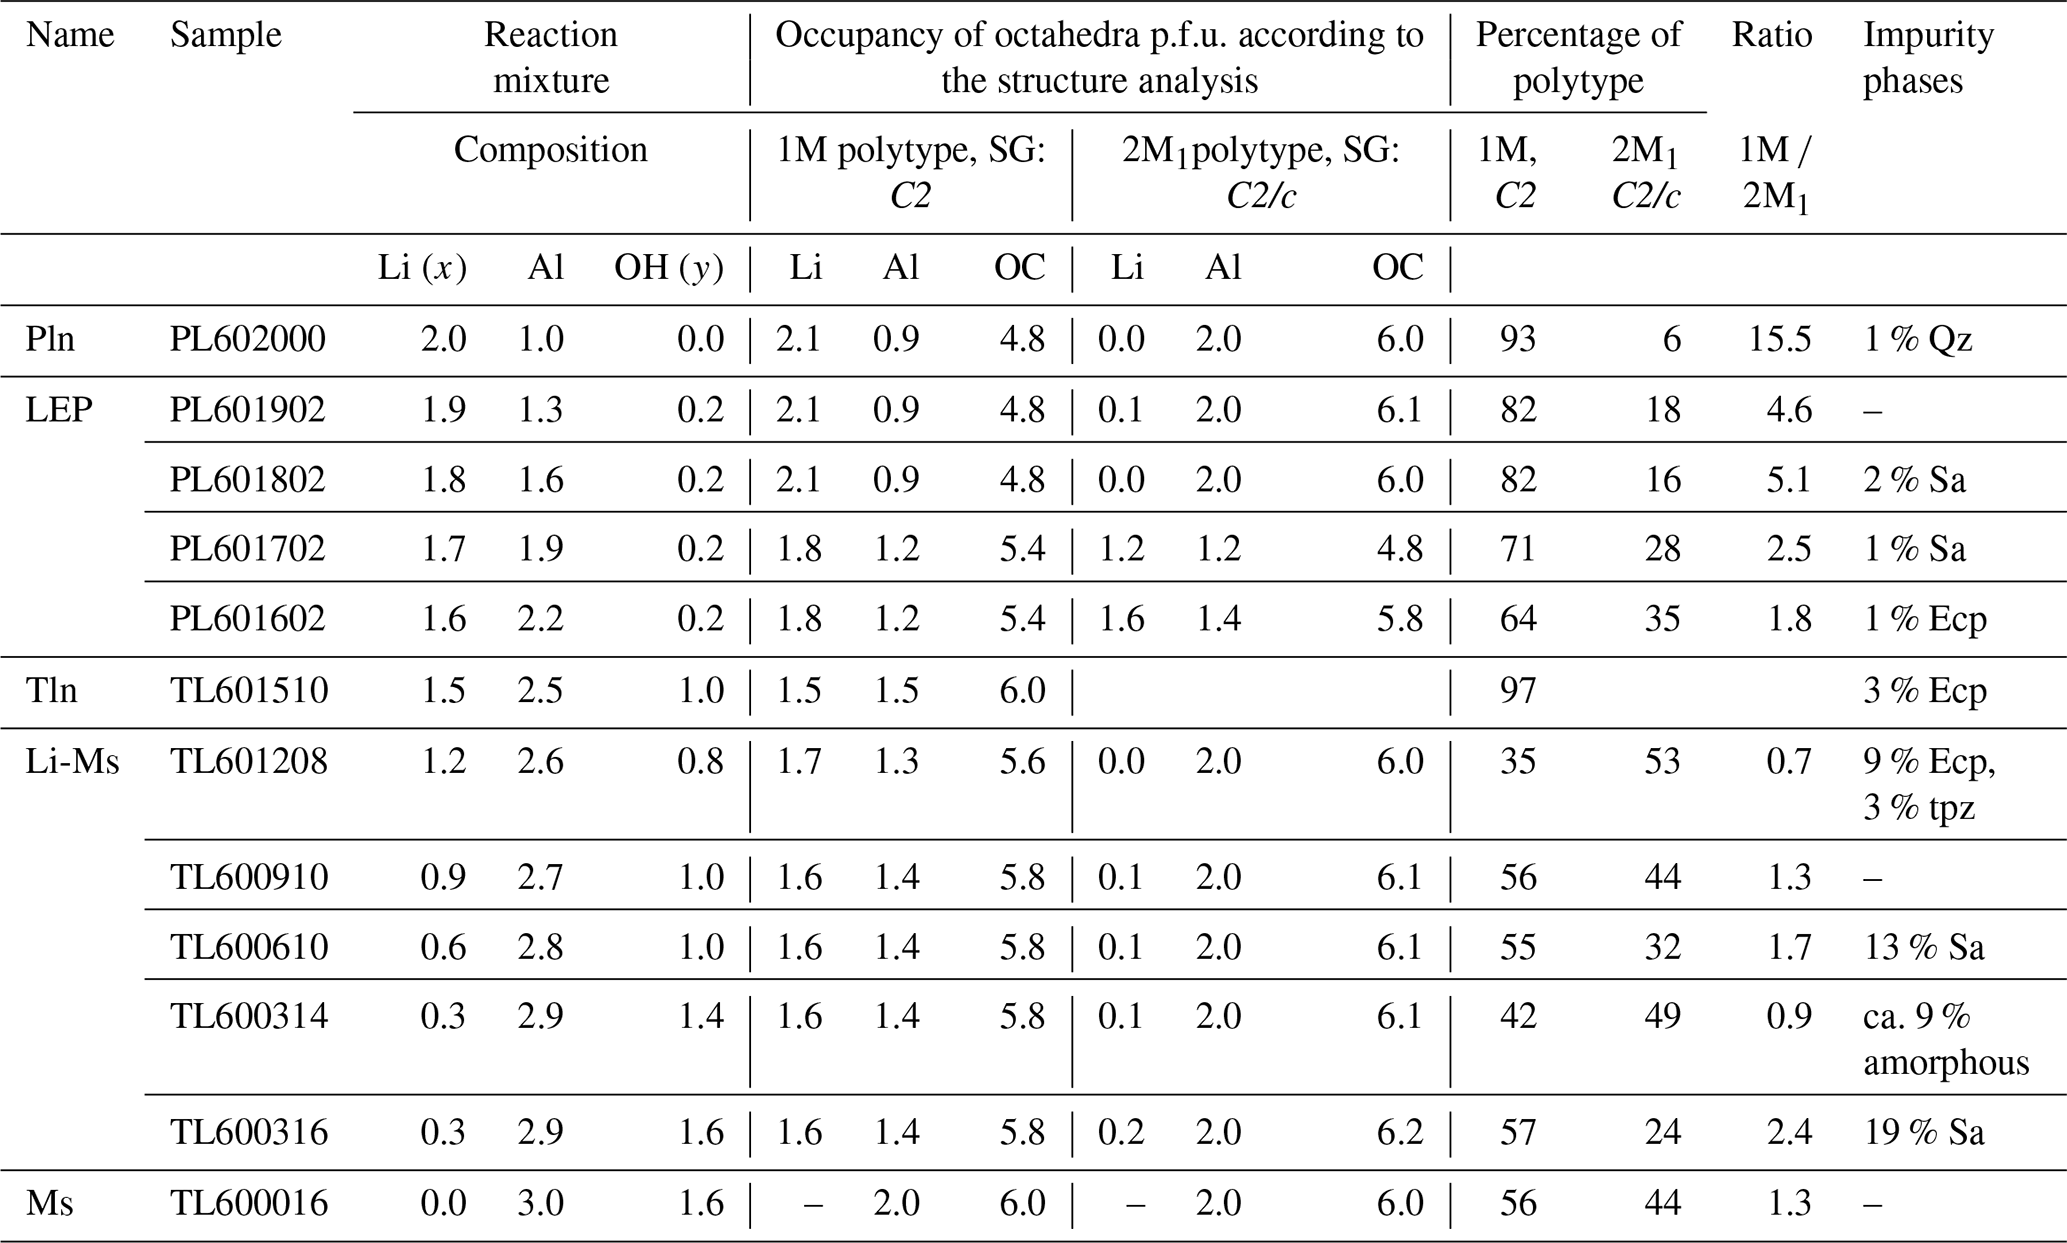
Structure refinements of the Li-muscovites and lepidolites were carried out to investigate structural changes, to investigate the occurrence of different polytypes, and to obtain reliable occupancy factors for octahedrally coordinated Al and Li. It was, however, not possible to distinguish between OH− and F− and between tetrahedrally coordinated Al and Si due to very similar scattering curves. Occupancy factors of OH−, F−, [4]Al and [4]Si were fixed at values which reflect the composition of the reaction mixture. Almost all investigated samples exhibit weak reflections in addition to the ones of polytype 1M, indicating that two different polytypes 1M and 2M1 are present. These weak reflections are marked by black arrows in Figs. S2 and 4 (right). Twelve Rietveld refinements were carried out, taking into account a mixture of two mica phases (and additional impurity phases if necessary). The structure refinement was performed assuming that the domains of the 1M and the 2M1 polytypes are large enough to consider them as separate crystals. In this case, two calculated diffractograms add up to the observed one. The anisotropic halfwidths of the reflections, however, indicate that some stacking disorder exists. This was covered in the refinement by using nine additional profile parameters. It was necessary to refine the 1M structure in space group C2 due to three different occupancies of octahedral sites M1, M2 and M3; the related centrosymmetric space group C2/m allows only for two independent M sites.

Figure 4Structure refinement of the sample with nominal composition K(Li1.5Al1.5)[AlSi3O10](OH)1F1 (a) and K(Li2Al)[Si4O10]F2 (b). The left diffractogram contains two different phases, 1M and eucryptite. The χ2 of the refinement is 1.57. The intensity (arb. units) is plotted against 2θ (∘) in the range of 8 to 90∘. Three distinguishable phases are present in the right diffractogram: the two polytypes 1M and 2M1 and quartz as minor phase.
In total, the structures of six lepidolites were refined including the octahedral occupancy of both polytypes (see Table 4). With the exception of trilithionite, all lepidolites crystallise as a mixture of two different polytypes with distinctly different chemical compositions. The samples show a clear distribution between a Li-rich 1M polytype and an Al-rich 2M1 polytype. According to the refined occupancy factors, the compositions of both polytypes change with the changing ratio of the reaction mixture. Starting from a polylithionite composition (polytype 1M with = 2.0 1.0 and polytype 2M1 with = 0.0 2.0) the distribution of lithium and aluminium approaches the composition of trilithionite with idealised = 1.5 1.5. This indicates that the lepidolites represent a solid solution series with polylithionite and trilithionite as the endmembers.
Table 4Results of the Rietveld refinements. OC: total charge of the three octahedral sites, SG: space group, p.f.u.: per formula unit, Qz: SiO2 (quartz), Ecp: eucryptite, Sa: sanidine, Pln: polylithionite, Tln: trilithionite, LEP: lepidolite, Ms: muscovite, Li-Ms: lithium muscovite, tpz: topaz.
The amorphous phase of sample TL600314 was simulated as a highly disordered cristobalite to calculate an approx. relative percentage.
In addition, the ratios of polytypes vary. The higher the Al content of the reaction mixture, the higher the portion of Al-rich polytype 2M1 (see Table 1). It is noticeable that the lepidolite samples contain hardly any impurity phases (Table 4), probably because lepidolite crystals of various compositions can form.
The octahedral sites M1 and M2 of the 1M polytype of the lepidolites are preferentially occupied by lithium, while the M3 site is preferentially occupied by aluminium. The 2M1 polytype incorporates Li predominantly at the octahedral site M1 and Al at M2.
The trilithionite sample K(Li1.5Al1.5)[AlSi3O10](OH)1F1 is an exception, as it exhibits only one polytype 1M (97 %) and a small amount of eucryptite (3 %) as an impurity phase (Fig. 4a). The sample having a nominal composition of x=1.5 and y=1.0 shows no additional peaks which would reflect considerable stacking disorder or a second polytype 2M1.
Furthermore, Rietveld refinements of six Li-muscovite samples were carried out. In the series of Li-muscovites, the occupancy factor of Al at the octahedral site M2 in polytype 2M1 refined for all samples to slightly higher values than 1 (two Al per formula unit). The occupancy factor was, therefore, fixed to the maximum of 1.0. Still, the refinement showed also a little electron density at site M1. Since the potassium site was in all samples not fully occupied, it is assumed that some Li+ occupies site M1 for charge compensation leading to formula K1−z(LizAl2)(Si3AlO10)(OH)yF2−y, with z about 0.1.
All samples from x=0.0 to x=1.2 consist of both polytypes 1M and 2M1 with ratios from 0.9 to 2.4 (Table 4). For those samples that did not contain impurity phases the ratio is 1.3. In the case of the Li-muscovites the ratio depends obviously on the number of impurity phases depleting the reaction mixture of Li (eucryptite) or Al (sanidine or amorphous). It is important to note that there is no solid solution between trilithionite and muscovite; instead, the crystals of the Li-muscovites consist of domains of muscovite and trilithionite of different ratios (see Table 4). Grew et al. (2018) illustrated fine layering in lepidolite at high magnification. That might be a natural analogue of our findings for synthetic micas. The refinements of the occupancy factors of the individual octahedrally coordinated sites show that lithium prefers the M1 and M2 sites in polytype 1M and contains aluminium preferentially at M3. The polytype 2M1 includes hardly any lithium and possesses M2 sites fully occupied by aluminium.
It is noticeable that higher numbers of additional phases occur in samples with a chemical composition between muscovite and trilithionite because the crystallisation of layered silicates was effectively blocked (Table 3).
These structure refinements are only good approximations. The fact that nine additional profile parameters had to be used to describe the anisotropy of peak halfwidths leads to the conclusion that the different layers show noticeable stacking disorder, which is a common phenomenon of layered silicates. The Rietveld refinements of the Li-muscovites exhibit higher χ2 values (see Table S1 in the Supplement), indicating that stacking disorder is more pronounced, and the assumption of two different crystalline domains of the 1M and the 2M1 polytypes is, therefore, justified to a lesser extent.
The lattice metrics of all samples are shown in Tables S1 (1M) and S2 (2M1). The refined lattice parameters fit well compared to literature values. Analysing the lattice metrics in more detail a different behaviour of lepidolites and Li-muscovites becomes obvious: the lattice parameters a and b and the β angle of the Li-muscovites (x = 0.0 to 1.2) vary in a non-uniform way and do not show a systematic change with chemical composition of the materials as shown in Figs. 5 and 6 for the Li-muscovites. Also, there is no systematic change of the unit cell volume of the Li-muscovites with chemical composition of the mica crystals.

Figure 5Lattice metric of the polytype 1M of selected lepidolite and Li-muscovite samples adapted from Table S1. The error margins are less than the width of the data symbols.
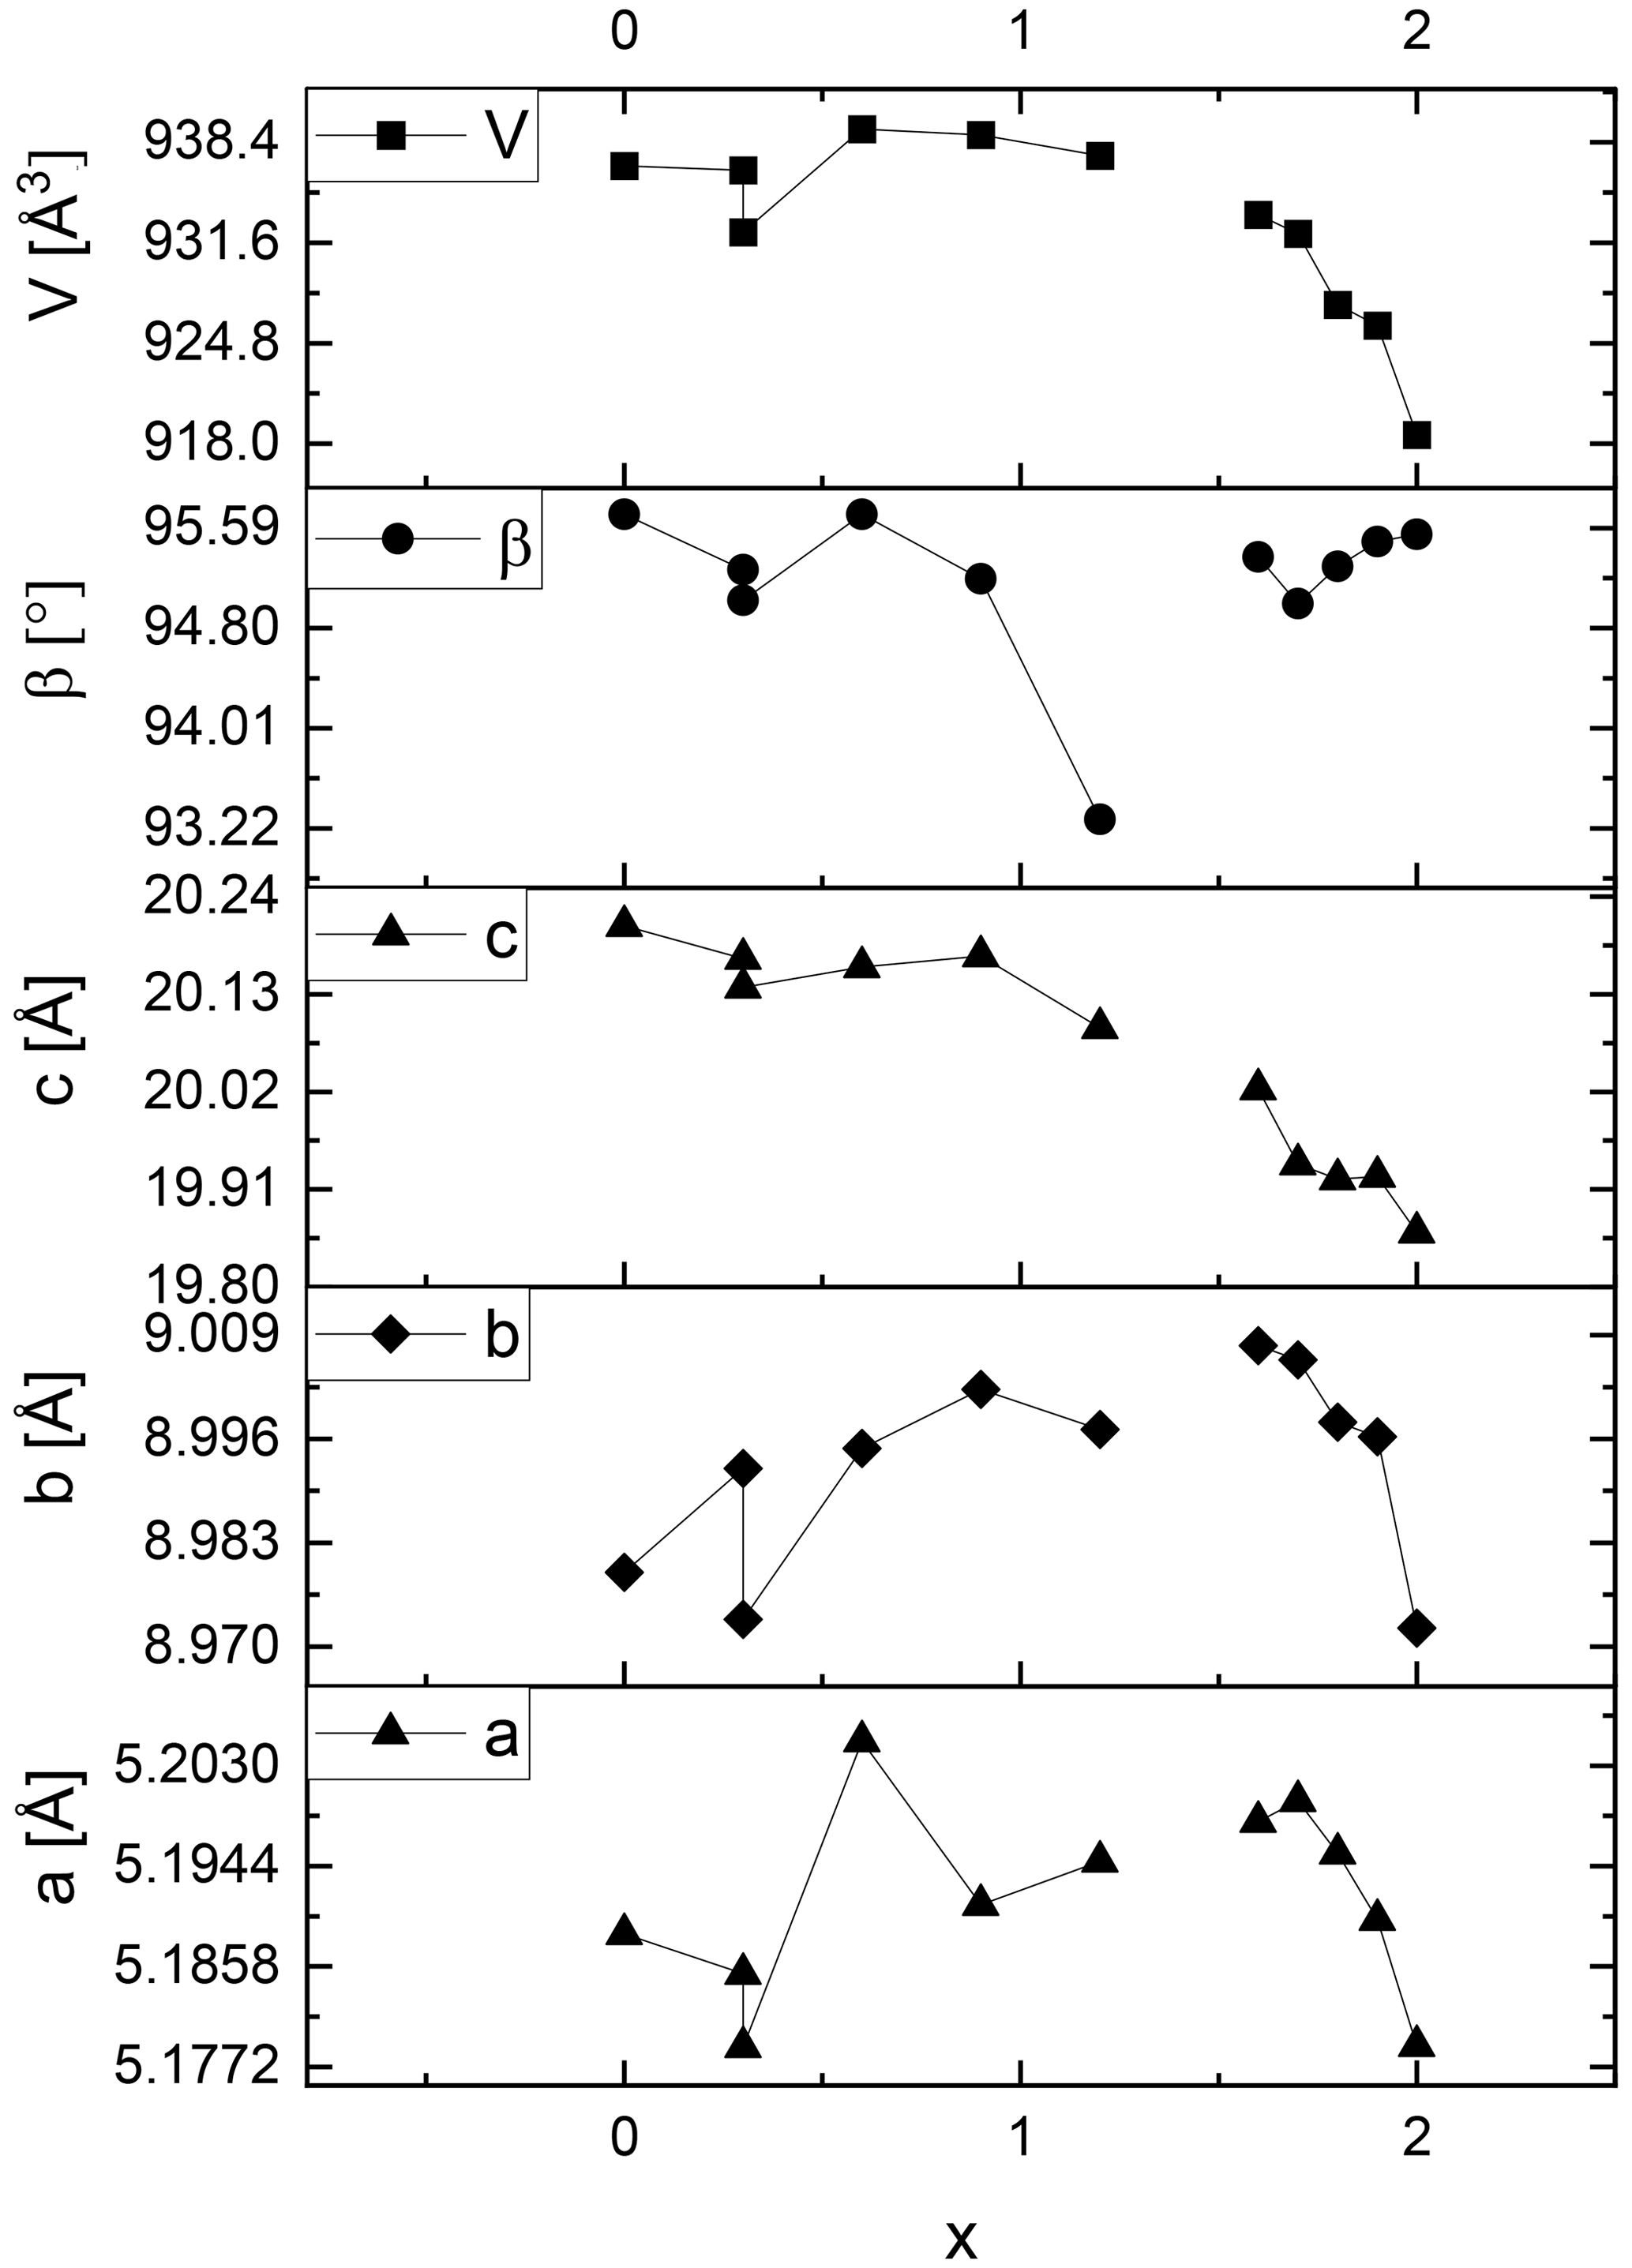
Figure 6Lattice metric of the polytype 2M1 of selected lepidolite and Li-muscovite samples adapted from Table S1. The error margins are less than the width of the data symbols.
In contrast, the lattice parameters a, b and c of the lepidolites (x = 1.5 to 2.0) decrease systematically from trilithionite (x = 1.5) to polylithionite (x = 2.0) for both polytypes (see Figs. 5 and 6 and Tables S1 and S2, upper part). As a result, the unit cell volumes of the lepidolites shrink with increasing Li content.
These findings can be rationalised as follows: for OH-richer samples (trilithionite) the lattice parameter c is higher than for F-rich samples (polylithionite). In OH-rich samples, the proton directly points towards the interlayer cation K+ leading to a strong repulsion and a widening of the distance between adjacent layer packages. In the tetrahedral layers, aluminium is substituted by silicon. Due to the smaller ionic radius of silicon (Si–O bond 1.62 Å) compared to aluminium (Al–O bond 1.76 Å), the lateral dimensions of the whole structure decrease within the a, b plane. Therefore, the volume of the unit cell of both polytypes decreases with increasing Li content. This agrees well with the fact that the lepidolites form solid solutions (see above) while Li-muscovites do not.
3.3 29Si MAS NMR experiments
29Si MAS NMR spectra of all samples were recorded to investigate the local environments of the Si atoms in the structure. According to the mica structure, there are three possible silicon environments for the lithium muscovites and lepidolites and thus up to three 29Si MAS NMR signals: the Si-(O–Si)3, Si-(O–Al)(O–Si)2 and Si-(O–Al)2(O–Si) environment exhibit a Q3(0Al), Q3(1Al) and Q3(2Al) signal. Signals are assigned using the Qn(xAl) nomenclature, where n is equal to the number of bonded oxygens between silicon atoms and next neighbours (n=3 for layer silicates), and x is the number of Al atoms bonded to silicon. Along the binary line between muscovite and trilithionite (see Fig. 1), the tetrahedral composition is [Si3Al]. The relative proportion of Q3 types should be 25 % Q3(0Al), 50 % Q3(1Al) and 25 % Q3(2Al) and is reflected by the intensities of the NMR signals. Between trilithionite and polylithionite, the ratio changes from [Si3Al] to [Si4]. Consequently, the polylithionite samples should show only one signal belonging to the Q3(0Al) environment.
The 29Si MAS NMR spectra show the three expected signals (Fig. 7). The polylithionite spectra exhibit one defined signal at −89 ppm belonging to the Q3(0Al) environment. When the lithium content decreases, a second signal at −86 ppm and a third signal at −83 ppm appear and increase according to the Q3(1Al) environment and the Q3(2Al) environment, respectively. Thus, the ratio of the three samples in the trilithionite sample is 1 : 2 : 1 in line with expectations.
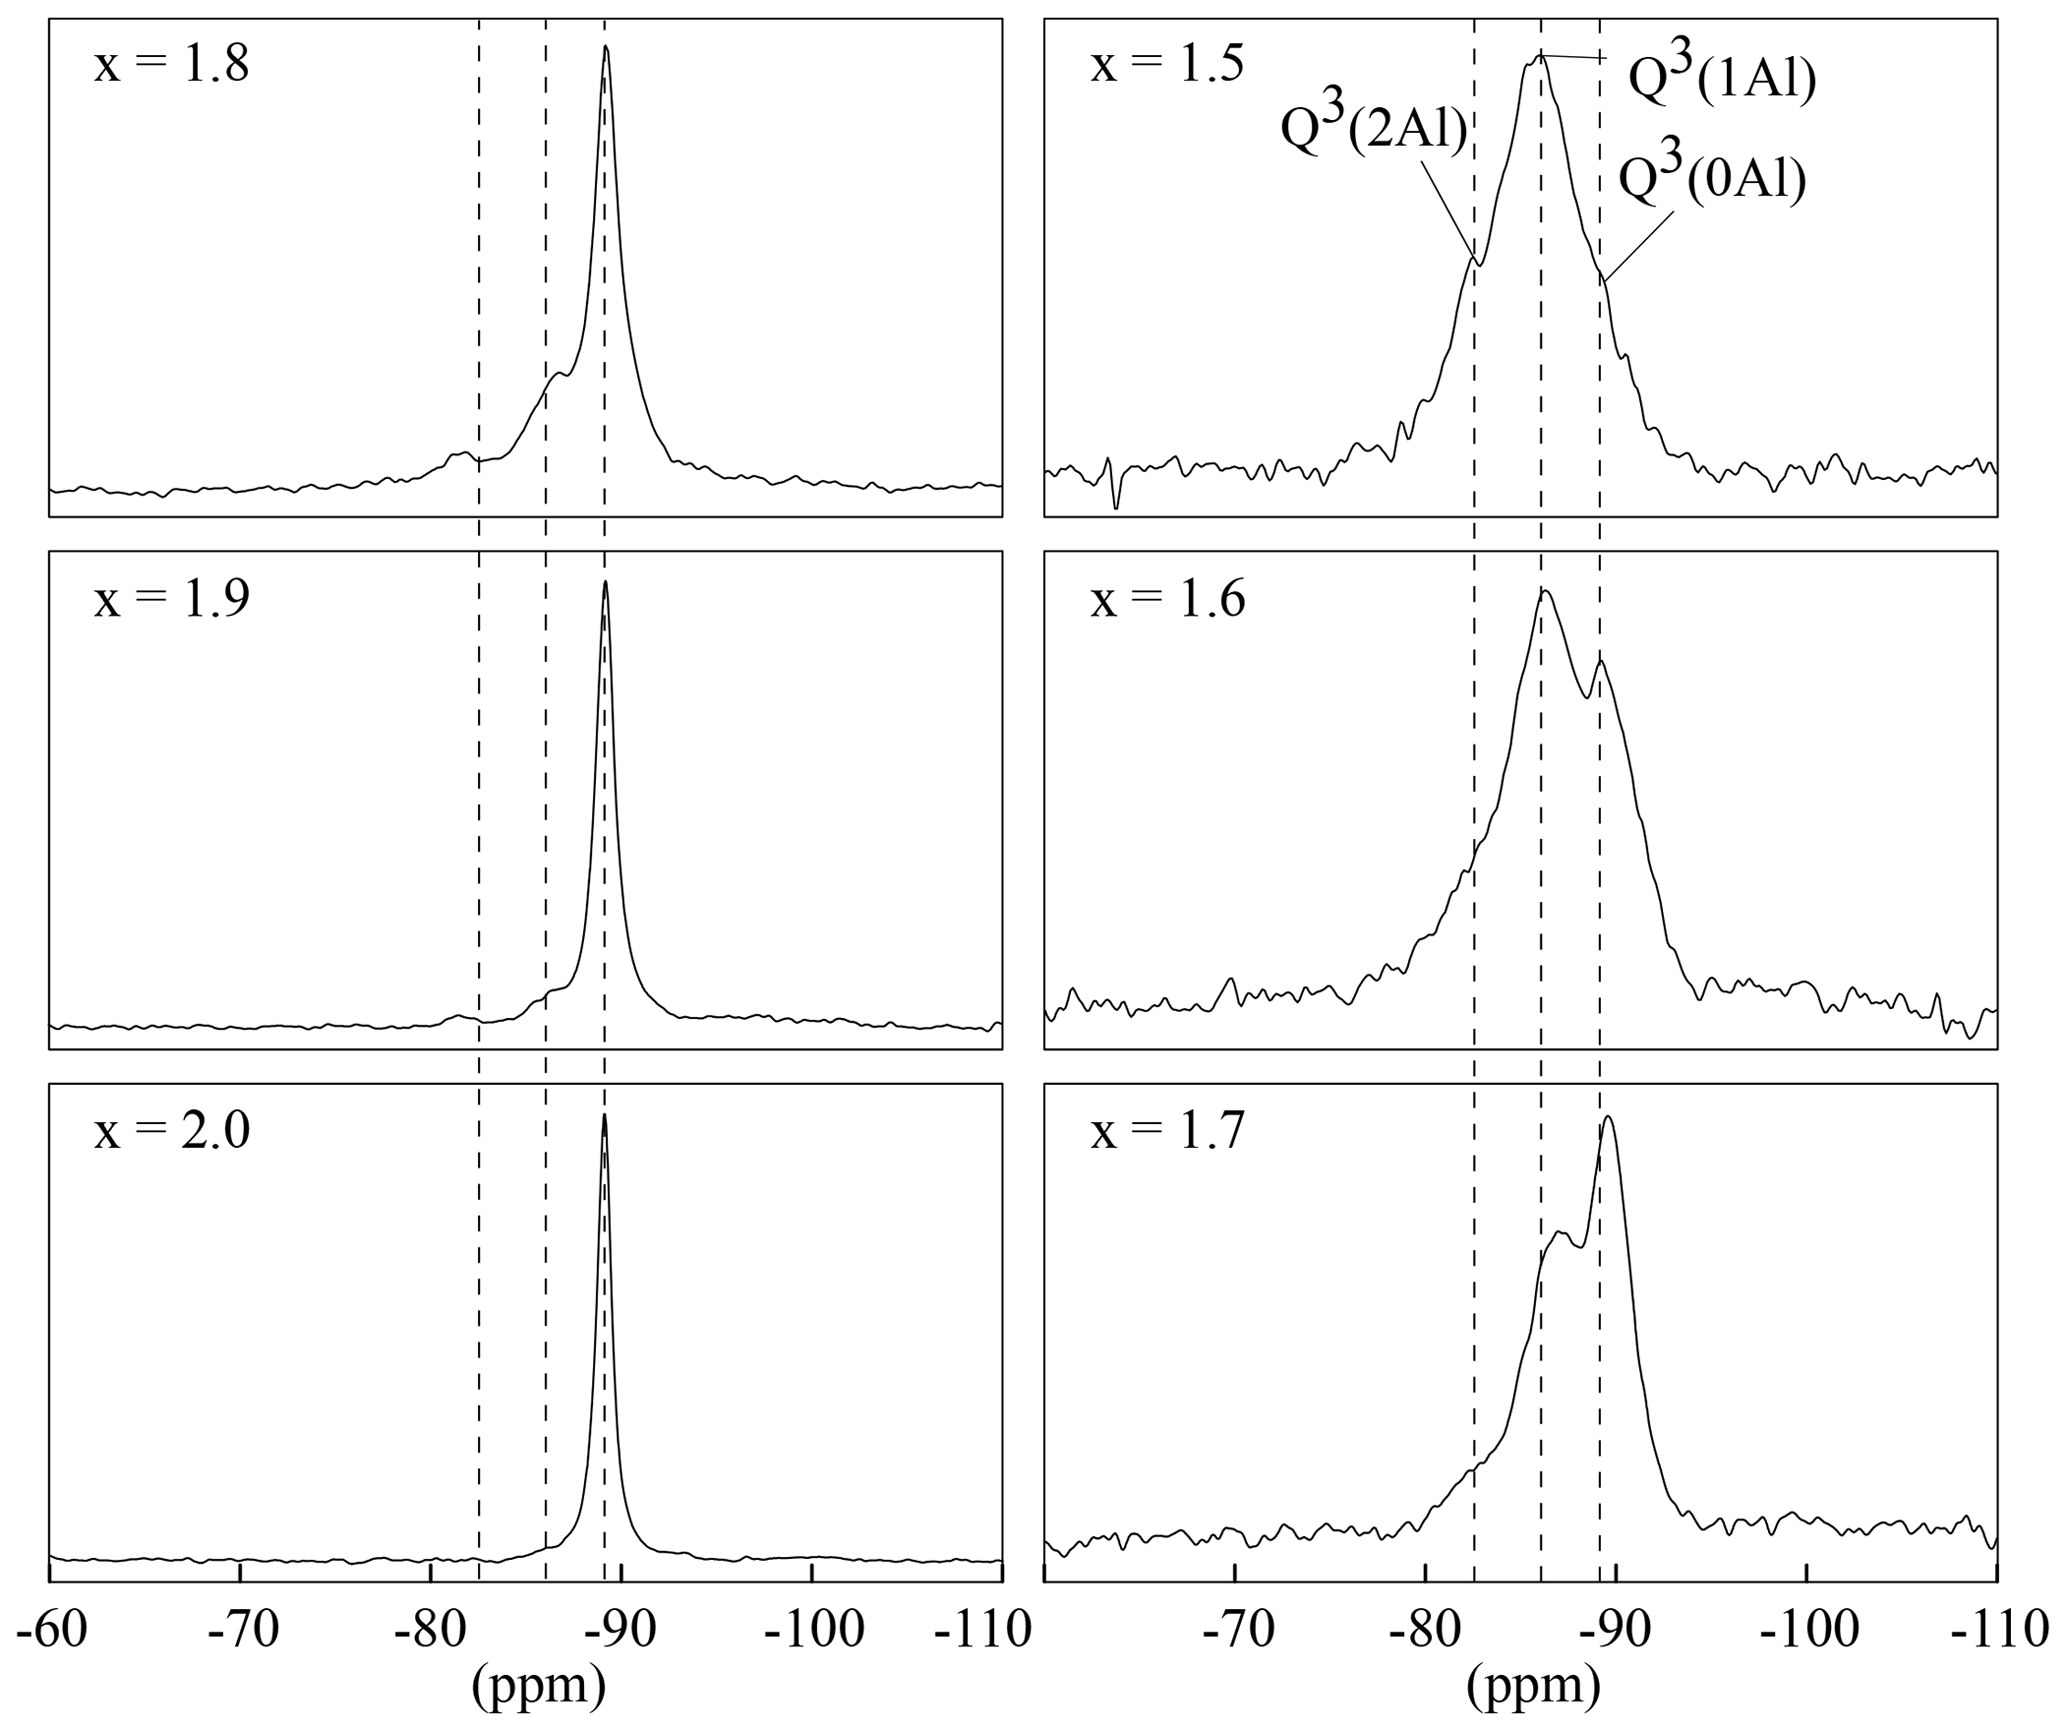
Figure 729Si MAS NMR spectra with different x content (1.5 to 2.0) and constant OH content with y=0.8. The polylithionite shows one defined signal for the Q3(0Al) environment. The second, belonging to the Q3(1Al) environment, and the third signal, belonging to the Q3(2Al) environment, appear and increase with decreasing Li content. The position of the signals is marked by the dashed lines.
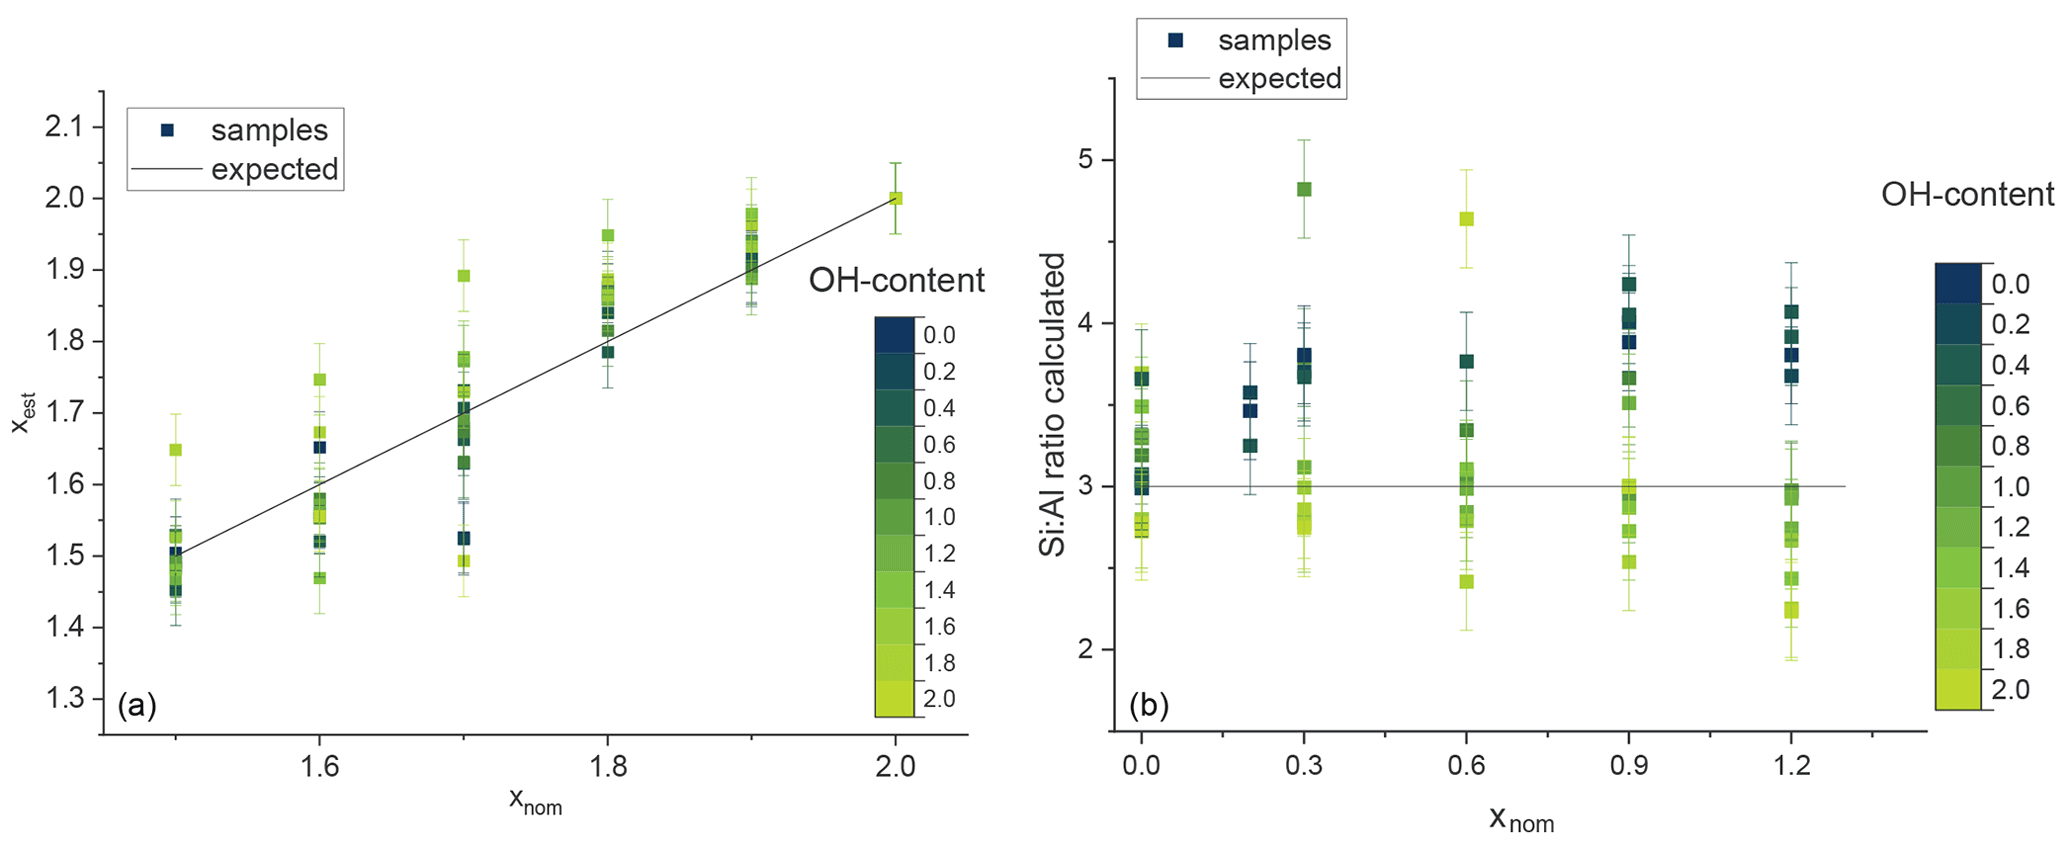
Figure 8The estimated Li content plotted against the nominal composition given in the synthesis (a) and the ratio plotted against the nominal x content (b). The OH content is given by the blue and green colours. The black line shows the expected statistical value.
The content of [4]Al and thus the ratio of the tetrahedral sheets can be determined indirectly from the subsequent 29Si signals. The Li content in the octahedral layer of lepidolites (between trilithionite and polylithionite) depends on the ratio. Therefore, it is possible to calculate the Li content xest from the determined ratio of the 29Si MAS NMR spectra with
which gives the experimental compositions of the lepidolites.
The calculated Li contents xest of samples between polylithionite and trilithionite agree with the expected values. F-rich samples show slightly increased values and the OH-richer samples lower values (Fig. 8a).
The composition of the tetrahedral layer is constant between trilithionite and muscovite. Thus, the ratio of the three signals in the 29Si MAS NMR spectra should not change. The exact Li content cannot be determined. The estimated ratio plotted against the nominal x content is also given in Fig. 8b. Li-muscovite samples with a high fluorine content show a higher ratio than expected in contrast to the OH-rich samples with lower values. F-rich lepidolites indicate higher Li contents and OH-rich samples lower Li contents, which can be explained by the preference of Al to OH and F to Li as described in the 1H and 19F MAS NMR section.
Interestingly, the content has influence on the 29Si MAS NMR signals (Fig. S3). The spectra of lepidolites with a nominal Li content of x=1.7 show no large deviation from . With increasing OH content the 29Si MAS NMR Q3(1Al) and Q3(2Al) signals of the lepidolite decrease and disappear; only the Q3(0Al) remains and vanishes also at high OH contents. Several signals referring to impurity phases occur. The fluorine anions prefer the incorporation next to Si- and Li-rich environments. The remaining Q3(0Al) signal indicates the formation of pure polylithionite (K(Li2Al)[Si4O10]F2) for the remaining fluorine. The incorporation of OH in a trioctahedral structure is energetically unfavourable. While a high fluorine content of the reaction mixture led predominantly to mica phases with the expected ratio, an increase of OH led to the crystallisation of impurity phases like sanidine, eucryptite and Li2SiO3, and the less available fluorine will be incorporated near Si-rich environments in polylithionite.
3.4 1H and 19F MAS NMR experiments
Each OH anion is coordinating three octahedral cations, either Li or Al. In trioctahedral micas, the OH bond is nearly perpendicular to (001), but it can be tilted in lepidolites (Robert et al., 1989). Thus, three signals should emerge, the Li2Al environment, the LiAl2 and the Al2□ environment. The 1H MAS NMR spectra show several different signals with three signals according to the mica structure: Li2Al–O–H, LiAl2–O–H and Al2□–O–H (Fig. 9). The polylithionite samples show only one signal at −1.0(3) ppm according to the Li2Al–O–H environment. This signal decreases with increasing Al content, and a second signal at 1.1(3) ppm appears, which can be assigned to the LiAl2–O–H or the Al2□–O–H environment, respectively. This assignment is in agreement with Alba et al. (2000), who assigned the signal at 2.0 ppm to dioctahedral micas and the signal at 0.5 ppm to trioctahedral micas. There is no significant difference between the di- and trioctahedral signals. The positions of the signals from Al2□–O–H and LiAl2–O–H environments are very close to each other and cannot be distinguished. The overlap results in broad signals. In addition, water signals are present, either from water inclusions (4.5 to -5.0 ppm) or crystal water from accompanying phases in the synthesis product (2.0 to 2.5 ppm).
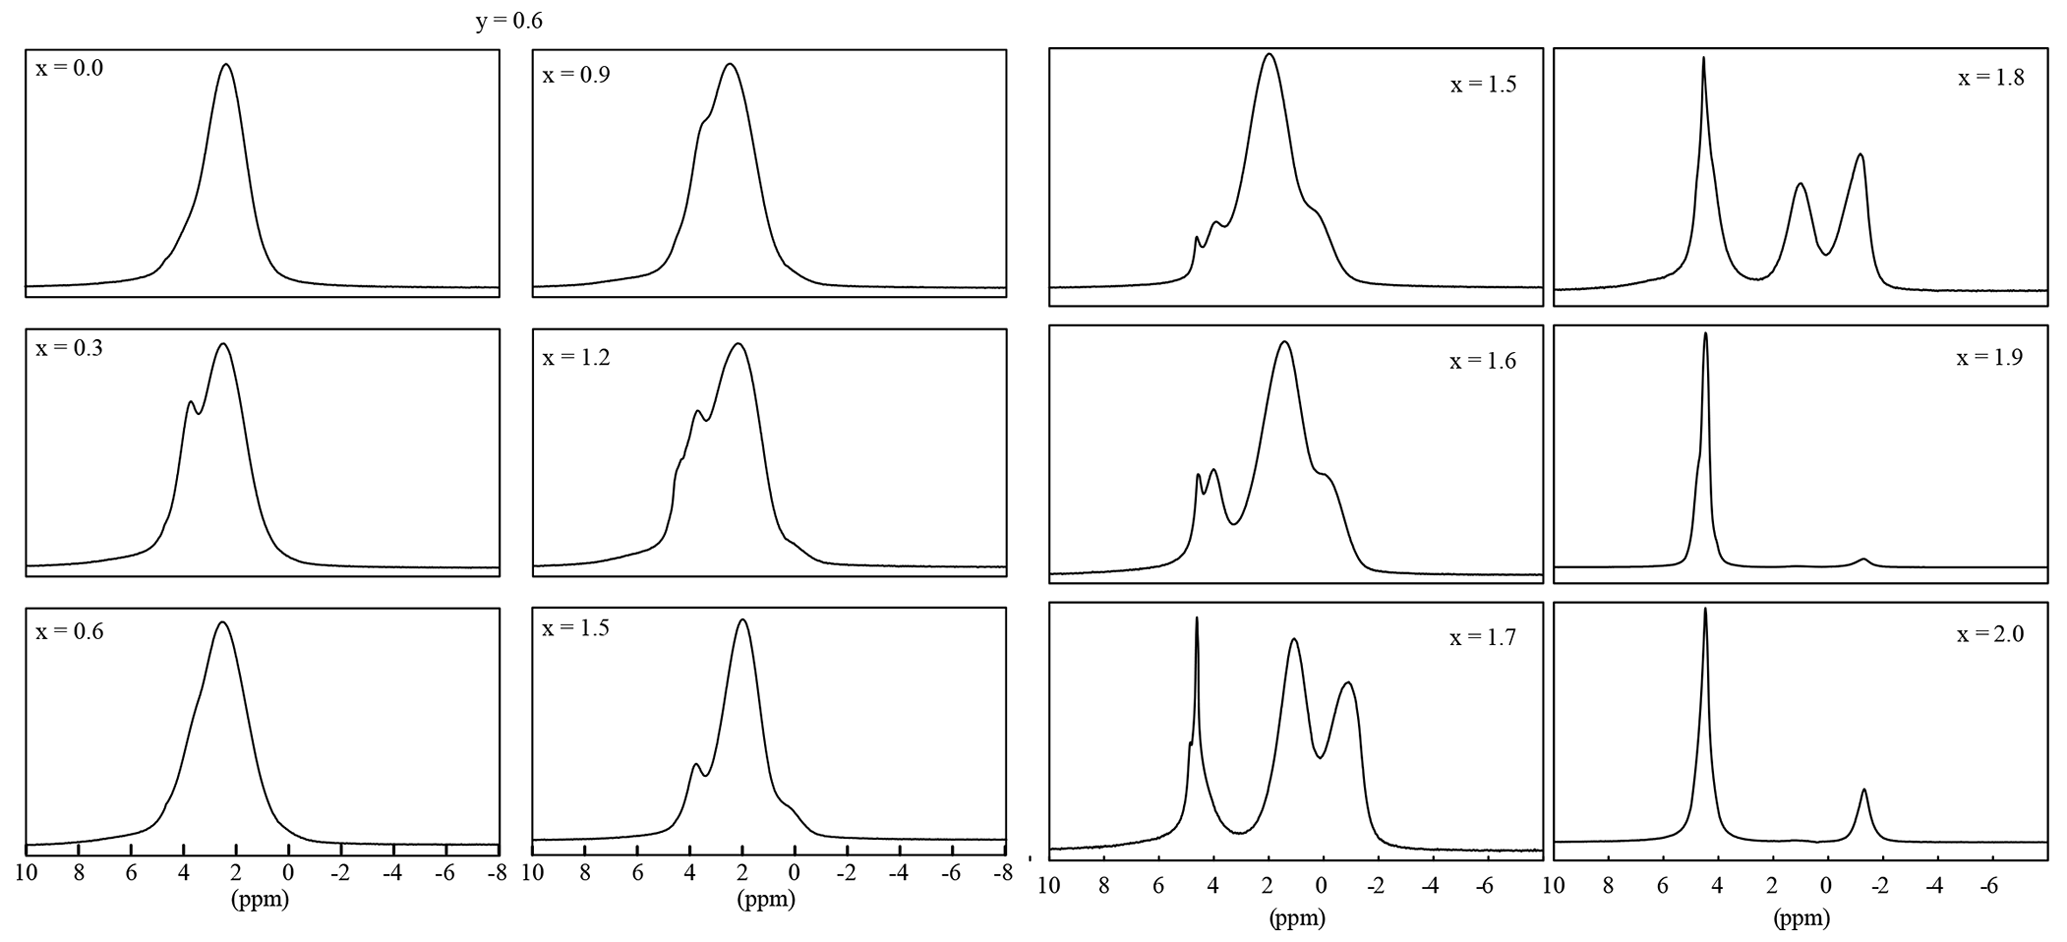
Figure 91H MAS NMR spectra of samples with 0.0 , y=0.6 (left two rows) and ), and y=1.2 (right two rows).
The position of the signals shifts from −1 ppm (polylithionite) to 0 ppm (muscovite) and 1 ppm (polylithionite) to 2 ppm (muscovite). The bond length and angle slightly change due to the variation in the chemical composition. This change in the coordination sphere leads to the shift of the signal position. The signal for the Li2Al–OH environment disappears below a lithium content of x=0.6.
The fluorine environment is very similar to the OH environment. Each fluorine anion is coordinating three octahedral cations which can be Li or Al. According to the structure, two different fluorine signals are expected: one referring to the Li2Al–F content and the other to LiAl2–F.
The 19F MAS NMR spectra show these two different signals (Fig. 10). The spectra of the polylithionite samples (x=2.0) exhibit one defined signal at −164 ppm according to the Li2Al environment. With increasing Al content, a second signal appears and increases at −135 ppm belonging to the LiAl2 environment (Fig. 10b). Both signals are split up into several signals, which cannot be assigned exactly. They may refer to the disorder in the structure (see Griffin et al., 2010). Each fluorine anion is coordinating three cation sites, which on the other hand are coordinated by F or OH. This leads to four different fluorine environments: in cis- and trans-coordination and in cis- and in trans-coordination. These small changes may implicate small changes in the local structure and thus changes in the chemical shift values.
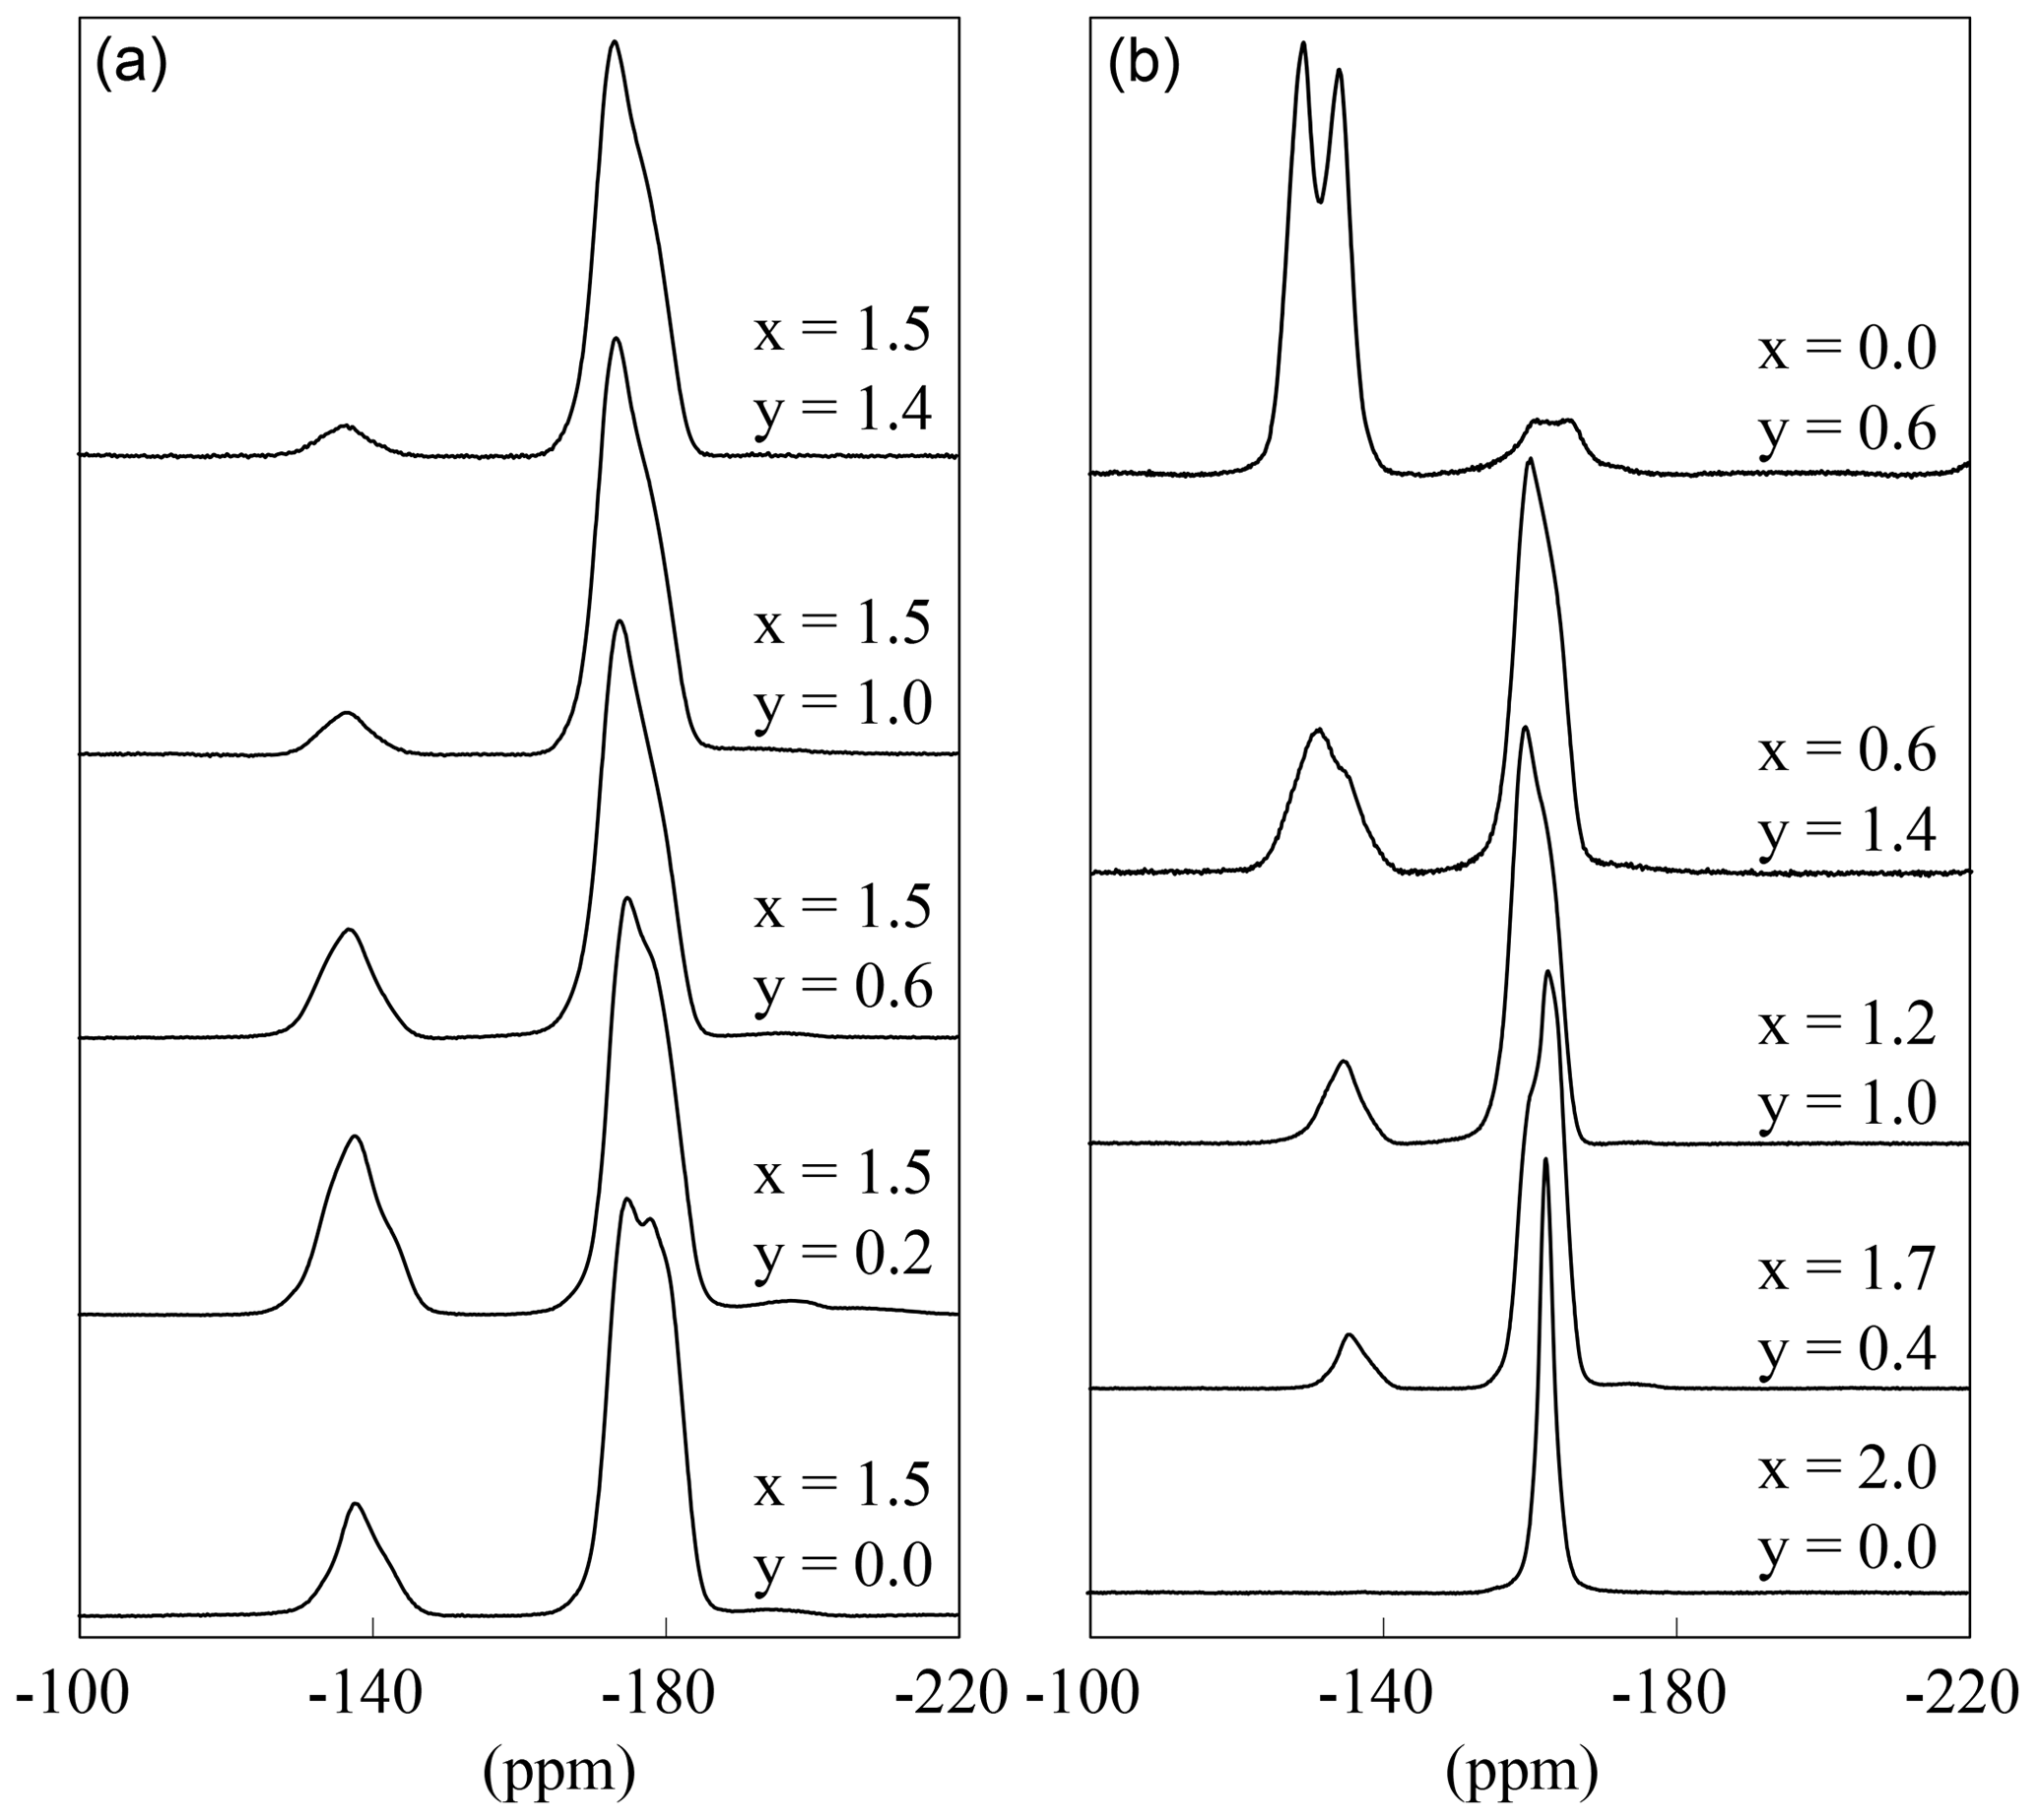
Figure 1019F MAS NMR spectra of several samples with constant x=1.5 content and increasing OH content (a) and with decreasing Li content (b).
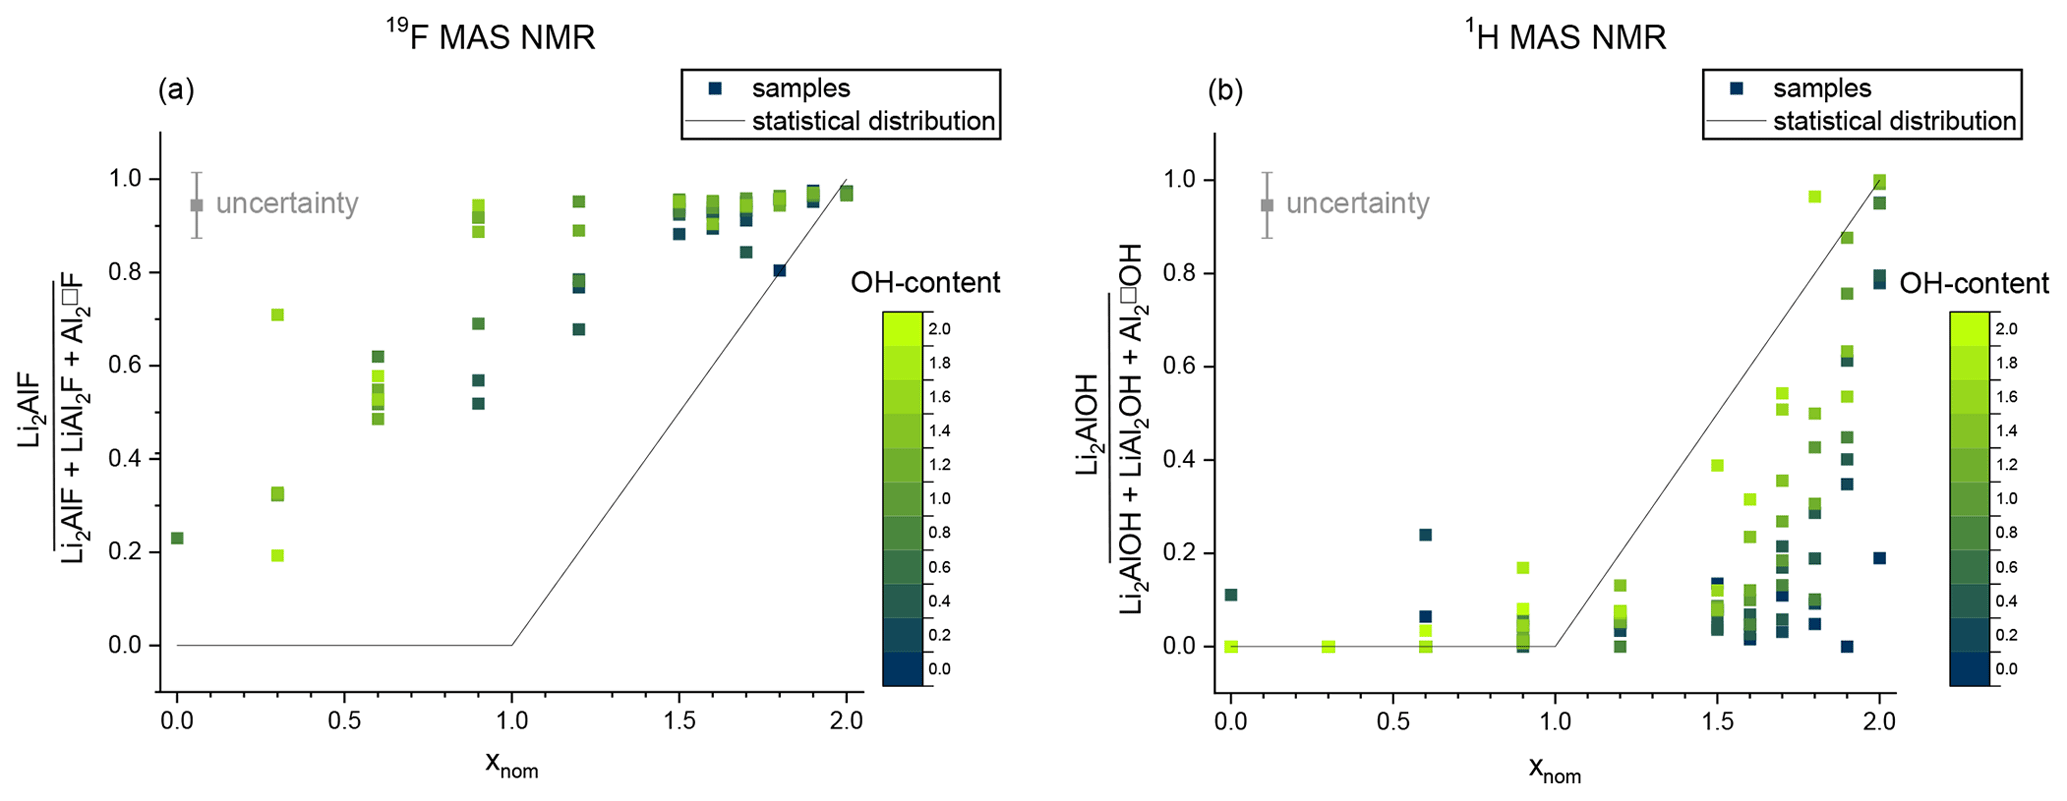
Figure 11Non-statistical distribution of the F anion (a) and the OH anion (b). The signal intensity of the Li2Al environment is plotted against the sum of signals originating from the octahedral sites (Li2Al, LiAl2, Al2). The OH content is given by the blue and green colours. The black line shows the expected statistical value.
If only the spectra with the same Li but different OH content are considered, it is noticeable that the intensity of the LiAl2 signal decreases with increasing OH content, although the ratio between Li2Al and LiAl2 environment should be constant (Fig. 10a). This is analogous to the 1H MAS NMR results. The OH anions prefer an Al-rich environment and occupy the Li–Al2 sites and the fluorine anions the Li2Al sites.
The 1H MAS NMR and 19F MAS NMR spectra show a non-statistical distribution of the OH and F anion incorporated in the structure (Fig. 11). The obtained values of the area of the Li2Al signal concerning the three mica signals are below the expected value of the statistical distribution in the 1H MAS NMR spectra (Fig. 11b). The OH anion prefers an Al-rich environment instead of a Li-rich environment as already indicated in the 29Si MAS NMR measurements. With increasing Li content, the values approach the statistical distribution. The estimated values show larger deviations with increasing F content. The few OH anions prefer the incorporation near LiAl2 or Al2□ sites and initially occupied them exclusively. With increasing OH content the values approach the statistical distribution since no other positions can be occupied. The contrary trend can be observed in the 19F MAS NMR spectra: the obtained values of the area of the Li2Al signal concerning the three mica signals are above the expected value of the statistical distribution (Fig. 11a). The F anion prefers a Li-rich environment. As already observed for 1H with increasing Al content, the values approach the statistical distribution. Similarly, the estimated values show larger deviations with increasing OH content.
3.5 27Al MAS NMR and 27Al MQMAS NMR experiments
The 27Al MAS NMR experiments should show two different signals according to the mica structure: one for the tetrahedral Al and one for the octahedral aluminium. In the spectra of the polylithionite samples, one defined signal at 7(3) ppm appears, which can be assigned to the octahedral environment. A second signal at 73(3) ppm appears and increases with rising Al content (Fig. 12). This signal refers to the tetrahedrally coordinated aluminium. The other signals in the spectra represent the impurity phases sanidine (60(2) ppm) and eucryptite (62(2) ppm). 27Al MQMAS NMR experiments can be used to assign the signals correctly (Fig. 13). The two-dimensional experiment is able to separate signals with different quadrupolar interaction parameters in the second dimension. The upper left spectrum shows only signals from a lepidolite at δ(F2) = 73 ppm, δ(F1) = 95 ppm for tetrahedral aluminium and δ(F2) = 7 ppm, δ(F1) = 0 ppm for the octahedral site. The upper right spectrum shows an additional tetrahedral signal from sanidine at δ(F2) = 60 ppm, δ(F1) = 78 ppm (Zhou et al., 1997). In the lower left spectrum, the α-eucryptite shows two signals at δ(F2) = 60 ppm, δ(F1) = 95 ppm and δ(F2) = 85 ppm, δ(F1) = 82 ppm beneath the lepidolite and sanidine. The correct assignment was checked by a 27Al MQMAS spectrum of pure α-eucryptite. The assignments do also agree with the X-ray diffraction results shown in Table 3.
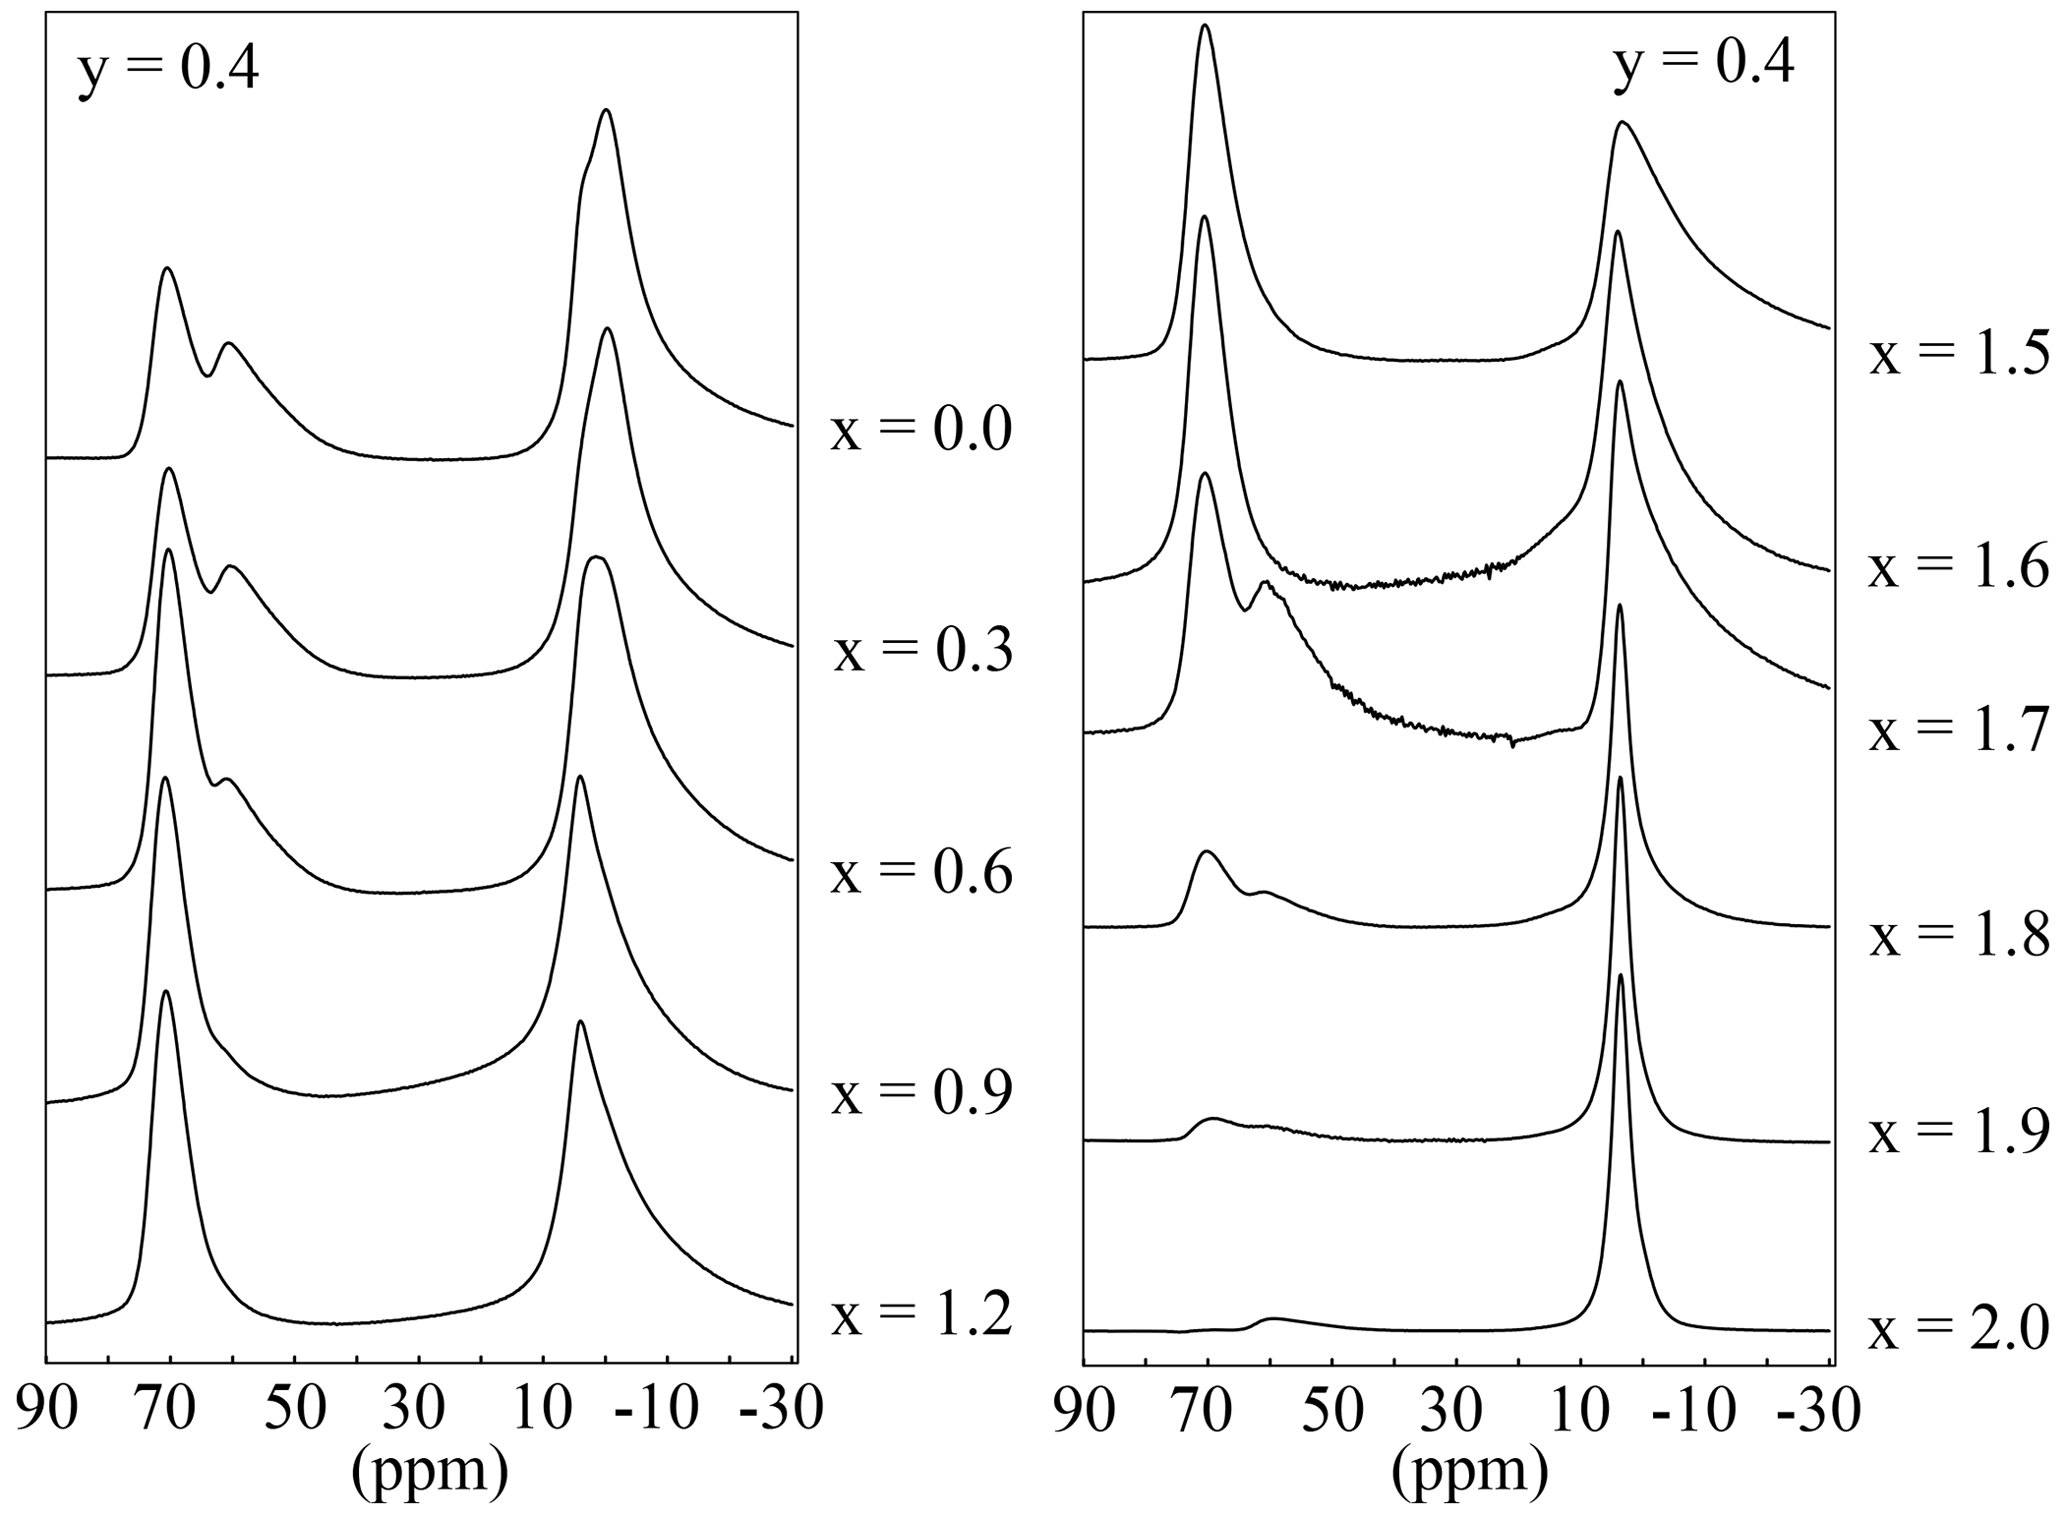
Figure 1227Al MAS NMR spectra with variable Li content and an OH content of y=0.4. The position of the tetrahedral signal is at 73(3) ppm and that of the octahedral at 7(3) ppm.
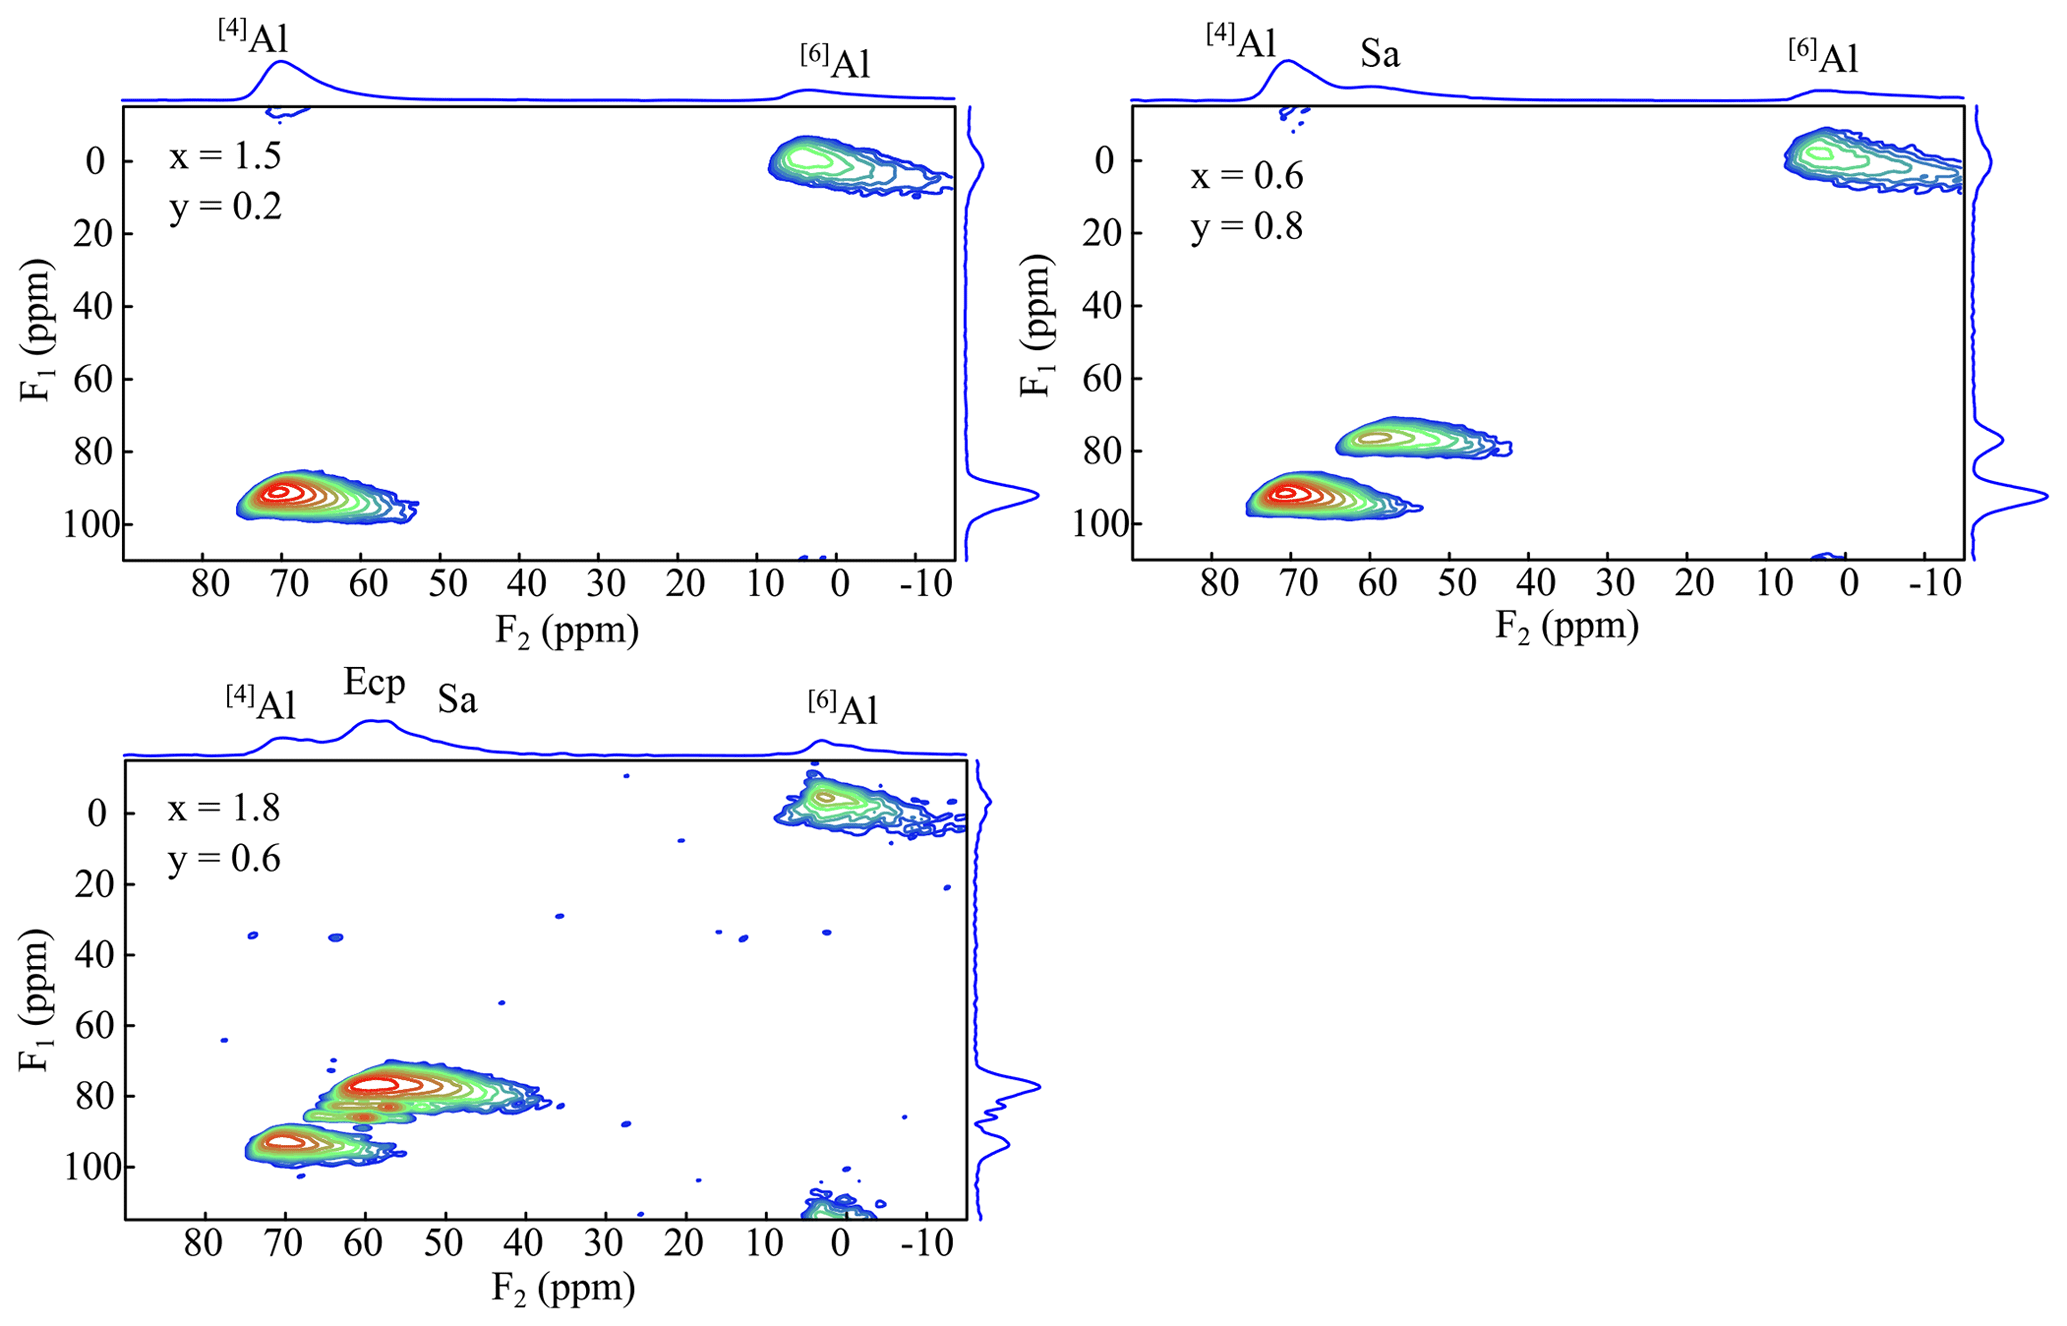
Figure 1327Al MQMAS spectra of the samples x=0.9, y=1.4, and x=1.7 and y=1.0. The spectra show two signals belonging to the tetrahedral Al (73 ppm) and the octahedral Al (6 ppm). Ecp/Sa indicates the secondary phases eucryptite and sanidine, respectively.

Figure 14Quadrupolar coupling constants of the 27Al MAS NMR tetrahedral and octahedral mica resonances with selected nominal compositions of K(LixAl[AlSi3O10](OH)yF2−y with and and K(LixAl3−x)[Al4−2xSi2xO10](OH)yF2−y with and .
The 27Al MAS NMR lineshapes show a distribution of quadrupolar parameters in their signal components. These resonances were fitted by introduction of a Gaussian distribution of the quadrupolar coupling (dispersion) and a subsequent summation of the computed weighted signal components (amorphous Cz simple model). Table S3 contains the tetrahedral and octahedral CQ values of the mica resonances for selected samples from polylithionite (x=2.0) to trilithionite (x=1.5) to pure muscovite, always with different contents (y) for compositions containing lepidolites or Li-muscovites as major phase. The values of the tetrahedral and octahedral CQ values are plotted in Fig. 14. For polylithionite there exists only the octahedral Al. The quadrupolar coupling constant which represents the anisotropy of the Al coordination is low with CQ=1.5 MHz. The tetrahedral sheet consists of SiO4 only. With decreasing Li content and rising Al content in tetrahedral and octahedral sheets, the tetrahedral signal appears, and the octahedral signal affects a broad asymmetry. The quadrupolar coupling constant of the octahedral Al increases to CQ=3.8 MHz. The tetrahedral Al affects only a slighter increase of CQ from 1.7 to 2.8 MHz. Advancing from trilithionite to muscovite, both quadrupolar coupling constants decrease to 2.5 MHz for octahedral and 1.5 MHz for tetrahedral Al. In polylithionite there is the most isotropic environment for octahedral Al; there are only Li2Al sites coordinated by F in the octahedral sheets and O from the tetrahedral sheets which are regular, containing only Si. The distortion and anisotropy for Al in tetrahedral as well as octahedral sheets increases with rising Al content. In addition, mixed anion occupancies are more favourable. The most anisotropic environment can be found in trilithionite, especially for octahedral Al. Here, LiAl2 and Al2Li environments exist with mixed occupation. Advancing to muscovite the Al environment in the tetrahedral sheet does not change much anymore (AlSi3O10). The octahedral sheet consists more and more of Al2 and a vacancy and becomes dioctahedral. The OH content of the mica increases. The site anisotropy thus decreases. Interestingly it can be observed that CQ values are always lowest for a given x value with the most favourable content (e.g. for x=2.0, y=0.0; x=1.5, y=1.0; x=0.0, y=2.0). It must be noted that a distinction of the Al sites of the different polytypes 1M and 2M1 is not possible in the 27Al NMR spectra due to the local signal detection and the similarity of the 27Al crystallographic site coordination.
In a very comprehensive study on Li-mica phases it could be shown that it was possible to synthesise lepidolites (K(LixAl3−x)[Al4−2xSi2xO10](OH)yF2−y); and Li-muscovites (K(LixAl)[AlSi3O10](OH)y,F2−y); with variable Li content and (OH)y F2−y ratio in a wide compositional range. The successful formation of micas for a certain Li content is very sensitive to the applied ratios in synthesis. The muscovites do not crystallise without any OH content. In compositions without fluorine (y=2.0), muscovite and Li-muscovites occur up to x=1.2. Low amounts of fluorine (y=1.8) are necessary to obtain the expected lepidolites, but several impurity phases are formed. Both Li content and content influence the occurrence of the impurity phases. The lepidolite samples () with a high F content show fewer impurity phases. In contrast to this, the Li-muscovites () are formed with fewer impurity phases at high OH content. Rietveld structure analyses on 12 selected samples showed that nearly all samples consist of two mica polytypes (1M and 2M1) of varying proportions. The refinement of the occupancy factors of octahedral sites showed that lepidolites () represent a solid solution formation series with polylithionite and trilithionite as the endmembers, while no solid solution formation exists between trilithionite and muscovite. The lepidolite solid solution formation can be understood as structural assembly in small domains with different polytypes. The lattice parameters a, b and c and the unit cell volume of the lepidolites decrease systematically from trilithionite (x=1.5) to polylithionite (x=2.0) for both polytypes.
The overall composition of the synthesised micas can be characterised by 29Si, 1H and 19F MAS NMR spectroscopy. The ratio of the tetrahedral sheets and thus the content of [4]Al as well as the Li content could be calculated using the signal intensities of the 29Si MAS NMR spectra. The values agree with the expected values. Deviations at certain ratios can be attributed to the crystallisation of impurity phases. 1H and 19F MAS NMR investigations indicate that there is a preference for incorporating fluorine near Li-rich environments and for OH groups near Al-rich environments. The distribution of OH and F in the micas is not statistical. The 27Al MAS NMR spectra show two different signals belonging to [4]Al and [6]Al in the structure. The 27Al MQMAS NMR spectra finally enable us to clearly distinguish the 27Al signals of the micas from additional signals of the secondary phases eucryptite and sanidine. The octahedral Al experiences the most anisotropic environment and thus the highest quadrupolar coupling constant in trilithionite (x=1.5), containing both LiAl2 and Al2Li environments with mixed occupation.
Software codes used are Dmfit 2022 (Massiot et al., 2002; complete program and documentation can be obtained at https://nmr.cemhti.cnrs-orleans.fr/dmfit/default.aspx) and FullProf 2K (Rodríguez-Carvajal, 1993, 2001; complete program and documentation can be obtained at http://www.ill.eu/sites/fullprof/).
The data used for this article are available in the Supplement, and additional data can be found in Sulcek (2023, https://doi.org/10.13154/294-9641).
The supplement related to this article is available online at: https://doi.org/10.5194/ejm-35-199-2023-supplement.
MF and BM initiated the project. The NMR experiments, syntheses and XRD measurements were performed by LS. The MQMAS NMR experiments and NMR data evaluation and interpretation were carried out by SL and MF. Rietveld refinements, lattice parameter evaluation and XRD data interpretation were done by SL and BM. MF and SL prepared the paper with contributions from BM. All authors participated in the discussion and interpretation of the results. Funding was acquired by MF and BM.
The contact author has declared that none of the authors has any competing interests.
Publisher’s note: Copernicus Publications remains neutral with regard to jurisdictional claims in published maps and institutional affiliations.
The authors thank Hartmut Mammen for performing the XRD experiments and René Hoffmann for accomplishing the SEM investigations. Volker Kahlenberg and Hannes Kröger, Innsbruck, Austria, kindly contributed some high-resolution XRD powder data. Nina Becker is acknowledged for providing some of the samples used. We acknowledge DESY (Hamburg, Germany), a member of the Helmholtz Association HGF, for the provision of experimental facilities. Parts of this research were carried out at PETRA III, and we would like to thank Florian Bertram and Chen Shen for their assistance in using the Kohzu 6-circle diffractometer at beamline P08. Beamtime was allocated for proposal I-20200173. The authors thank Edward S. Grew and the anonymous referee for their helpful comments which allowed us to improve the quality of the paper.
This research has been supported by the Deutsche Forschungsgemeinschaft (grant nos. Fe 486/8-1, Fe 486/8-2, Ma 6641/2-1 and Ma 6641/2-2).
This open-access publication was funded by Ruhr-Universität Bochum.
This paper was edited by Qun-Ke Xia and reviewed by Edward Grew and one anonymous referee.
Alba, M. D., Becerro, A. I., Castro, M. A., and Perdigón, A. C.: High-resolution 1H MAS NMR spectra of 2 : 1 phyllosilicates, Chem. Commun., 37–38, https://doi.org/10.1039/a906577f, 2000.
Bailey, S. W. and Christie, O.: Three-layer monoclinic lepidolite from Tordal, Norway, Am. Mineral., 63, 203–204, 1978.
Boukili, B., Robert, J.-L., Beny, J.-M., and Holtz, F.: Structural effects of OH – F substitution in trioctahedral micas of the system: K2O-FeO-Fe2O3-Al2O3-SiO2-H2O-HF, Schweiz. Miner. Petrog., 81, 55–67, 2001.
Boukili, B., Holtz, F., Beny, J.-M., and Robert, J.-L.: “Fe-F and Al-F avoidance rule” in ferrous-aluminous (OH,F) biotites, Schweiz. Miner. Petrog., 82, 549–559, 2002.
Černý, P. and Burt, D. M.: Paragenesis, crystallochemical characteristics, and geochemical evolution of the micas in granite pegmatites, Rev. Mineral. Geochem., 13, 257–297, 1984.
Černý, P., Rieder, M., and Povondra, P.: Three polytypes of lepidolite from Czechoslovakia, Lithos, 3, 319–325, 1970.
Chaudry, M. N. and Howie, R. A.: Lithium-aluminium micas from the Meldon aplite, Devonshire, England, Mineral. Mag., 39, 289–296, 1973.
Dingwell, D. B., Scarfe, C. M., and Cronin, D. J.: The effect of fluorine on viscosities in the system Na2O-Al2O3-SiO2: Implications for phonolites, trachytes and rhyolites, Am. Mineral., 70, 80–87, 1987.
Ferraris, G. and Ivaldi, G.: Structural Features of Micas, in: Micas: Crystal Chemistry and Metamorphic Petrology, edited by: Mottana, A., Sassi, F. P., Thompson, J. B., and Guggenheim, S., De Gruyter, Inc., Boston, 117–153, 2002.
Foster, M. D.: Interpretation of the Composition of Lithium Micas, Geol. Surv. Prof. Paper., 354, 115–147, 1960.
Grew, E. S., Bosi, F., Ros, L., Kristiansson, P., Gunter, M. E., Hålenius, U., Trumbull, R. B., and Yates, M. G.: Fluor-elbaite, lepidolite and Ta–Nb oxides from a pegmatite of the 3000 Ma Sinceni Pluton, Swaziland: evidence for lithium–cesium–tantalum (LCT) pegmatites in the Mesoarchean, Eur. J. Mineral., 30, 205–218, 2018.
Griffin, J. M., Yates, J. R., Berry, A. J., Wimperis, S., and Ashbrook, S. E.: High-resolution 19F MAS NMR spectroscopy: structural disorder and unusual Jcouplings in a fluorinated hydroxy-silicate, J. Am. Chem. Soc., 132, 15651–15660, https://doi.org/10.1021/ja105347q, 2010.
Gruner, E.: Untersuchungen an Alkali-Aluminium-Silicaten: 1. Synthetische Studien an Nephelin, Z. Anorg. Allg. Chem., 182, 319–331, https://doi.org/10.1002/zaac.19291820130, 1929.
Gruner, J. W.: Formation and Stability of Muscovite in Acid Solutions at Elevated Temperatures, Am. Mineral., 24, 624–628, 1939.
Gruner, J. W.: The Hydrothermal Alteration of Feldspars in Acid Solutions between 300∘ and 400 ∘C, Econ. Geol., 39, 578–589, 1944.
Hamilton, D. L. and Henderson, C. M. B.: The preparation of silicate compositions by a gelling method, Mineral. Mag., 36, 832–838, https://doi.org/10.1180/minmag.1968.036.282.11, 1968.
Heinrich, E. W.: Micas of the Brown Derby Pegmatites, Gunnison County, Colorado, Am. Mineral., 52, 1110–1121, 1967.
Holtz, F., Dingwell, D. B., and Behrens, H.: Effects of F, B2O3 and P2O5 on the solubility of water in haplogranite melts compared to natural silicate melts, Contrib. Mineral. Petr., 113, 492–501, 1993.
Kohn, S. C., Dupree, R., Mortuza, M. G., and Henderson, C. M. B.: NMR evidence for five- and six-coordinated aluminum fluoride complexes in F-bearing aluminosilicate glasses, Am. Mineral., 76, 309–312, 1991.
Koval', P. V., Bazarova, S. B., and Kashagev, A, A.: Polytypism of muscovite, biotite and lithium mica types as a function of composition and genesis, Doklady Akademii Nauk SSSR, Earth Sci. Sec., 225, 125–128, 1975.
Langner, R. and Fechtelkord, M.: Aluminium ordering and clustering in synthetic phlogopite: influence on the Al-content of phlogopite studied by NMR spectroscopy, Eur. J. Mineral., 24, 798–814, https://doi.org/10.1127/0935-1221/2012/0024-2227, 2012.
Langner, R., Fechtelkord, M., Garcia, A., Palin, E. J., and Lopez-Solano, J.: Aluminum ordering and clustering in Al-rich synthetic phlogopite: {1H}→29Si CPMAS HETCOR spectroscopy and atomistic calculations, Am. Mineral., 97, 341–352, 2012.
Levinson, A. A.: Studies in the mica group; relationship between polymorphism and composition in the muscovite-lepidolite series, Am. Mineral., 38, 88–107, 1953.
Loewenstein, W.: The distribution of aluminum in the tetrahedra of silicates and aluminates, Am. Mineral., 39, 92–96, 1954.
Luth, W. C. and Tuttle, O. F.: Externally heated cold-seal pressure vessels for use to 10,000 bars and 750 ∘C, Am. Mineral., 48, 1401–1403, 1963.
Manning, D. A. C.: The effect of fluorine on liquidus phase relationships in the system Qz-Ab-Or with excess water at 1 kb, Contrib. Mineral. Petr., 76, 206–215, 1981.
Massiot, D., Fayon, F., Capron, M., King, I., Le Calvé, S., Alonso, B., Durand, J.-O., Bujoli, B., Gan, Z., and Hoatson, G.: Modelling one- and two-dimensional solid-state NMR spectra, Magn. Reson. Chem., 40, 70–76, 2002 (code available at: https://nmr.cemhti.cnrs-orleans.fr/dmfit/default.aspx, last access: 23 March 2023).
Millot, Y. and Man, P. P.: Procedures for labeling the high-resolution axis of two-dimensional MQ-MAS NMR spectra of half-integer quadrupole spins, Solid State Nucl. Mag., 21, 21–43, https://doi.org/10.1006/snmr.2001.0043, 2002.
Munoz, J. L.: Physical Properties of Synthetic Lepidolites, Am. Mineral., 53, 1490–1512, 1968.
Nespolo, M. and Durovic, S.: Crystallographic basis of Polytypism and Twinning in Micas, in: Micas: Crystal Chemistry and Metamorphic Petrology, edited by: Mottana, A., Sassi, F. P., Thompson, J. B., and Guggenheim, S., De Gruyter, Inc, Boston, 155–279, https://doi.org/10.2138/rmg.2002.46.04, 2002.
Noll, W.: Hydrothermale Synthese des Muscovits.: Ein Beitrag zur Frage der Serizitbildung in Tonschiefern, Nachr. Ges. Wiss. Göttingen, Math.-Phys KL., 122–134, 1932.
Novák, M., Černý, P., Cooper, M., Hawthorne, F. C., Ottolini, L., Xu, Z., and Liang, J.-J.: Boron-bearing 2M1 polylithionite and 2M1 + 1M boromuscovite from an elbaite pegmatite at Řečice, western Moravia, Czech Republic, Eur. J. Mineral., 11, 669–678, 1999.
Pandey, D., Baronnet, A., and Krishna, P.: Influence of the stacking faults on the spiral growth of polytype structures in mica, Phys. Chem. Miner., 8, 268–278, 1982.
Papin, A., Sergent, J., and Robert, J.-L.: Intersite OH-F distribution in an Al-rich phlogopite, Eur. J. Mineral., 9, 501–508, 1997.
Robert, J.-L., Beny, J.-M., Beny, C., and Volfinger, M.: Characterization of Lepidolites by Raman and infrared spectometries. I. Relationships between OH-stretching wavenumbers and composition, Can. Mineral., 27, 225–235, 1989.
Robert, J.-L., Beny, J.-M., Della Ventura, G., and Hardy, M.: Fluorine in micas: crystal-chemical control of the OH-F distribution between trioctahedral and dioctahedral sites, Eur. J. Mineral., 5, 7–18, 1993.
Rodríguez-Carvajal, J.: Recent Developments of the Program FULLPROF, in: Commission on Powder Diffraction (IUCr), Newsletter 26, 12–19, http://journals.iucr.org/iucr-top/comm/cpd/Newsletters/ (last access: 23 March 2023), 2001 (code available at: http://www.ill.eu/sites/fullprof/, last access: 23 March 2023).
Rodríguez-Carvajal, J.: Recent Advances in Magnetic Structure Determination by Neutron Powder Diffraction, Physica B, 192, 55–69, 1993 (code available at: http://www.ill.eu/sites/fullprof/, last access: 23 March 2023).
Rov, R.: Decomposition and resynthesis of micas, J. Am. Ceram. Soc., 32, 202–209, https://doi.org/10.1111/j.1151-2916.1949.tb19769.x, 1949.
Sartori, F.: The crystal structure of a 1M lepidolite, Tscher. Miner. Petrog., 23, 65–75, 1976.
Schaller, T., Dingwell, D. B., Keppler, H., Knöller, W., Merwin, L., and Sebald, A.: Fluorine in silicate glasses: A multinuclear nuclear magnetic resonance study, Geochim. Cosmochim. Ac., 56, 701–707, 1992.
Smith, J. V. and Yoder, H. S.: Experimental and theoretical studies of the mica polymorphs, Mineral. Mag., 31, 209–235, 1956.
Sulcek, L.: Cation and anion ordering and clustering in the system muscovite, trilithionite and polylithionite, PhD thesis, Ruhr-Universität Bochum, https://doi.org/10.13154/294-9641, 2023.
Swanson, T. H. and Bailey, S. W.: Redermination of the lepidolite-2M1 structure, Clay. Clay Miner., 29, 81–90, 1981.
Tuttle, O. F.: Two pressure vessels for silicate-water studies, Bull. Geol. Soc. Am., 80, 1727–1729, 1949.
Zhou, L., Guo, J., Yang, N., and Li, L.: Solid-state nuclear magnetic resonance and infrared spectroscopy of alkali feldspars, Sci. China Ser. D, 40, 159–165, https://doi.org/10.1007/BF02878374, 1997.