the Creative Commons Attribution 4.0 License.
the Creative Commons Attribution 4.0 License.
 | 17 Jun 2025
Non-conventional pressure estimates by using transmission electron microscopy coupled with energy-dispersive spectroscopy (TEM-EDS): testing on submicrometer white mica from low-grade metapelites
Edoardo Sanità
Maria Di Rosa
Enrico Mugnaioli
Chemical compositions of mineral phases obtained using a common electron probe micro-analyzer are generally used in many fields of geosciences, like the reconstruction of pressure–temperature paths, because their accuracy ensures high-quality data. However, on submicrometric mineral phases, mostly present in low-grade rocks, the chemical analysis can be contaminated by the surrounding. Energy-dispersive X-ray spectroscopy coupled with a transmission electron microscope is demonstrated to be a valid alternative approach to get high-quality data on submicrometric phases. In this work, we use this approach for geobarometric application on white mica-rich low-grade metapelites from the Internal Ligurian Units (Northern Apennines). Our pressure estimates gave satisfactory results supporting previously geobarometric constraints performed on the same rock samples. The innovative methodological procedure used in this work confirms the tectonic scenario proposed for the Internal Ligurian Units.
- Article
(4886 KB) - Full-text XML
-
Supplement
(225 KB) - BibTeX
- EndNote


Forward (e.g., isopleths thermobarometry; Evans, 2004) and inverse (e.g., multi-equilibrium thermobarometry; Vidal and Parra, 2000) thermodynamic modeling are robust methods to retrieve the equilibrium conditions achieved by a rock. In particular, inverse modeling considers the composition of mineral phases in a rock micro-domain, which is supposed to form together at thermodynamic equilibrium. This method is based on calibrated temperature (T)-dependent (Vidal et al., 2005; Inoue et al., 2009, 2018; Bourdelle et al., 2013; Lanari et al., 2014, Bourdelle, 2021) and pressure (P)-dependent (Massone and Schreyer, 1987; Parra et al., 2002; Dubacq et al., 2010; Kamzolkin et al., 2016) reactions that involve the mineral phases of interest and that produce elemental fractionation. Accurate experimental measurements of mineral composition are crucial for applying these techniques. Wavelength-dispersive X-ray spectroscopy (WDS) by using an electron probe micro-analyzer (EPMA) is the technique mostly used to perform chemical analysis on mineral phases after a proper calibration with mineral standards of known composition. However, the use of an EPMA-WDS on submicrometer grains may be controversial, because its relatively large beam size (up to 1 µm) can produce mixed analysis. Since low-grade rocks (term used here to indicate T<350 °C; sensu Bucher and Grapes, 2011) show very fine-grained textures, the reconstruction of their P–T paths by inverse modeling based on EPMA-WDS data is challenging. Innovative approaches aiming to investigate the compositions of minerals by means of quantitative EPMA-WDS compositional mapping (e.g., Lanari et al., 2019; Lanari and Duesterhoeft, 2019; Lanari and Hermann, 2021; Lardeaux, 2024) were applied to low-grade rocks so far (e.g., Lanari et al., 2012; Scheffer et al., 2016; Airaghi et al., 2017; Sanità et al., 2022a, b, 2024a; Frassi et al., 2023; Meneghini et al., 2023; De Cesari et al., 2024). However, these approaches cannot be applied in all cases in which the incipient blastesis typical of the low-grade metamorphism only produce very small white mica crystals.
The energy-dispersive X-ray spectroscopy (EDS) technique to collect submicrometer-scale chemical data by using transmission electron microscopy (TEM) is widely advancing (e.g., Tarantola et al., 2009; Bourdelle et al., 2018). TEM-EDS has the crucial advantage to retrieve chemical data from areas as small as a few nanometers, but the so-obtained analyses are generally considered semiquantitative or barely qualitative, because no correction for absorption is applied. Notwithstanding, TEM-EDS chemical data have been tentatively used by previous authors to improve the comprehension of the chemical variability of chlorite and illite (Jahren and Aagaard, 1989; Jahren, 1991; Tarantola et al., 2009) and to estimate their temperature of formation after a calibration procedure (Bourdelle et al., 2013, 2018). Recently, an innovative procedure for data reduction has been proposed for improving the accuracy of TEM-EDS data (the absorption correction method; see Conconi et al., 2023) without possible chemical and structural damage. This procedure is based on the fine calibration of the k factor and sample thickness, obtained with the measurement of standards of known composition, and on the calculation of a correction polynomial function aimed to preserve the overall electroneutrality of the compound formula (van Cappellen and Doukhan, 1994). Although the reliability of such a correction procedure has been demonstrated from an analytical point of view (Conconi et al., 2023), its application to solve geological problems, such as the pressure conditions recorded by subducted rocks, has not been tested yet. This is because a dataset consisting of pressure estimations based on EPMA-WDS chemical analyses is needed to make a comparison and to evaluate the quality of the TEM-EDS data. In this paper, we use the TEM-EDS chemical dataset of Sanità et al. (2024b), corrected according to the procedure of Conconi et al. (2023), taken from submicrometric white mica grains. These grains have been studied in detail by previous authors (Meneghini et al., 2023; Sanità et al., 2024c) and belong to the ocean-derived Internal Ligurian Units exposed in the Northern Apennines (Fig. 1), which are characterized by low blueschist to phrenite-pumpellyte metamorphic facies conditions. Such a TEM-EDS dataset is used to perform P estimates for four samples of metapelites collected from several tectonic units that have been recorded at different pressure ranges. We make a comparison between the pressure ranges obtained using the two different datasets, discussing the limitations and the strengths that prove the use of TEM-EDS chemical analysis as a valid alternative to EPMA-WDS analysis for geobarometric applications.
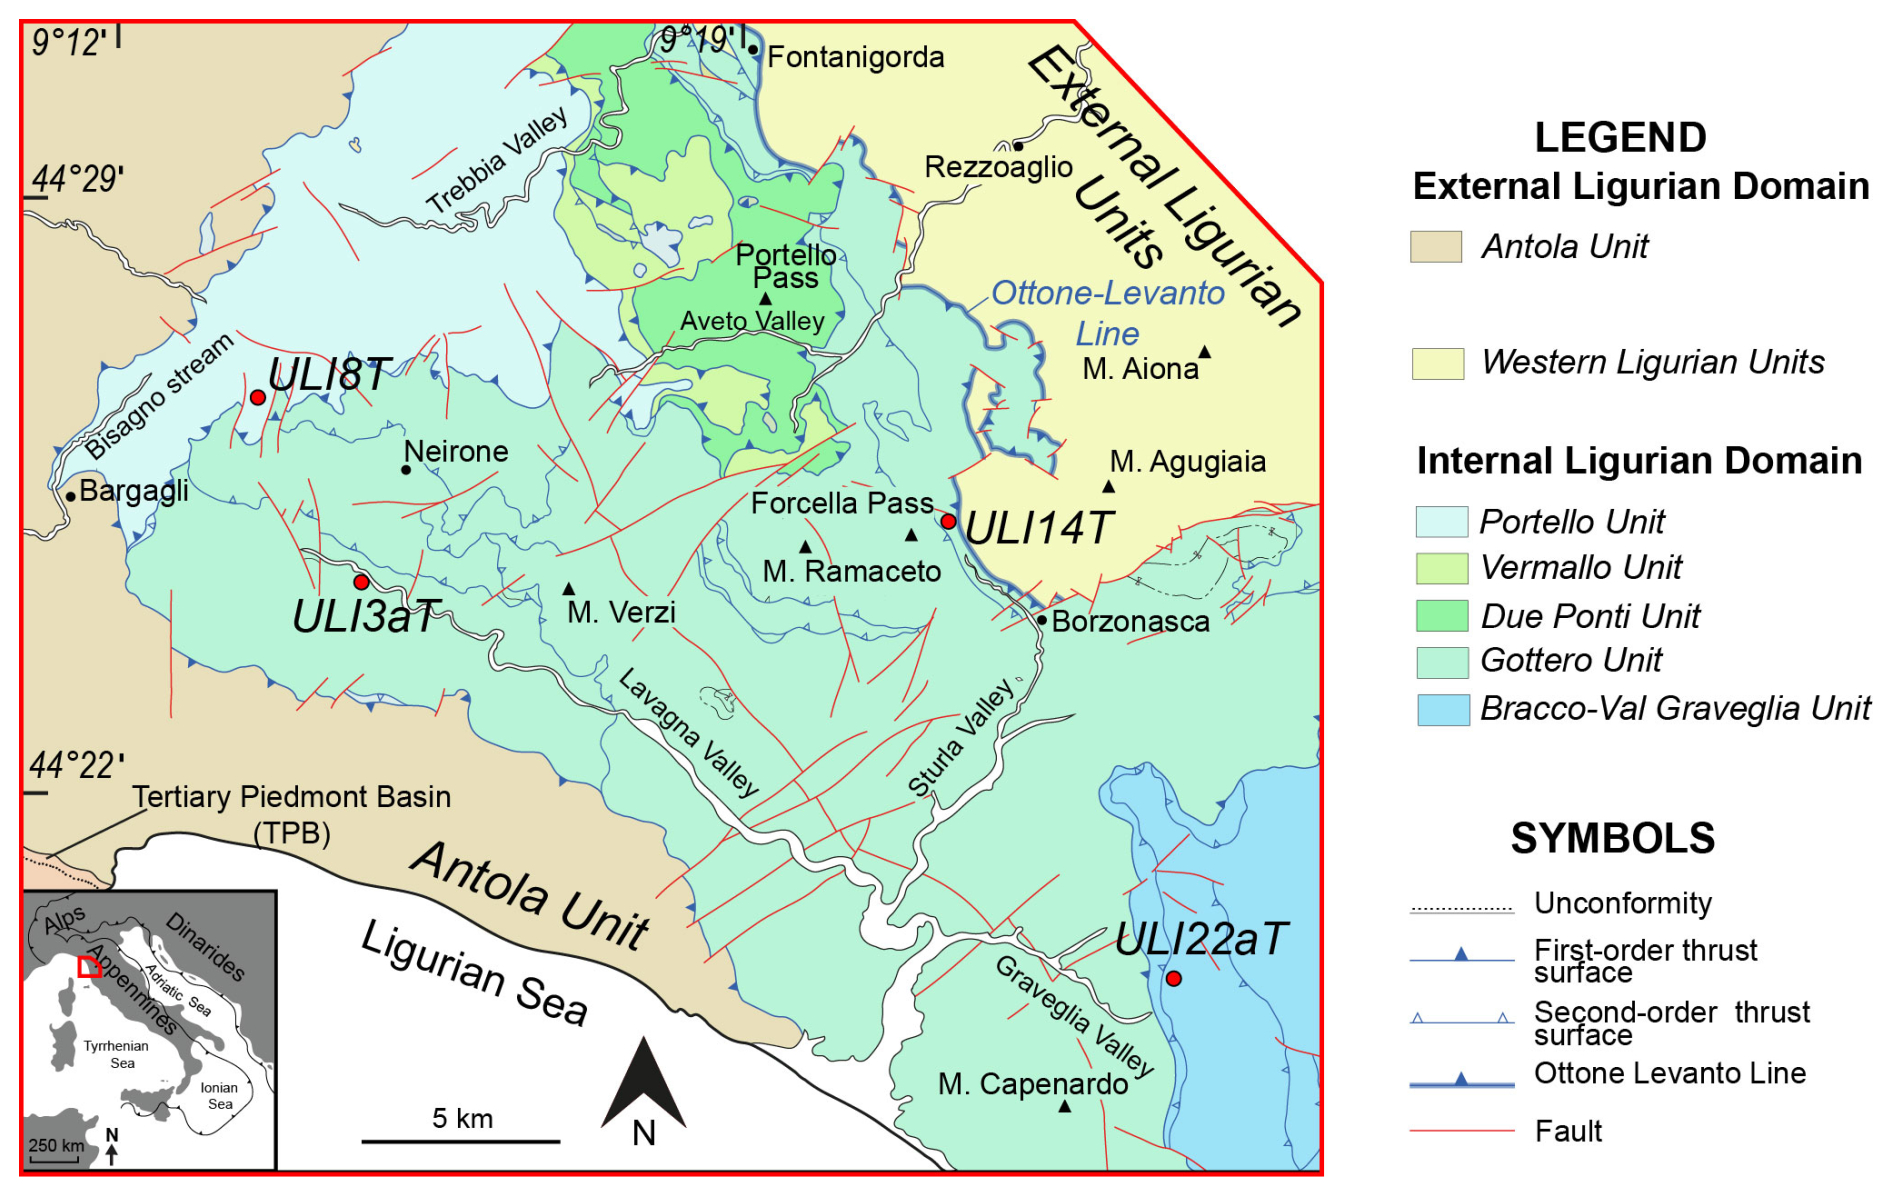
Figure 1Simplified sketch of the Internal Ligurian Units stack in the Northern Apennines (after Marroni et al., 2004, 2010, 2017; Meneghini et al., 2020). On the bottom left, the geographic location of the study area is also reported.
These units are considered fragments of the Ligure-Piemontese oceanic lithosphere (Marroni et al., 2017). Most of the Internal Ligurian Units include the Palombini Shale Formation (Fm.), which are hemipelagic deposits consisting of pelites alternated with limestones (Marroni et al., 2010, 2017). Since the metamorphic degree of these deposits varies in the three tectonic units studied in this work (i.e., Portello Unit, Gottero Unit, and Bracco-Val Graveglia Unit; Meneghini et al., 2023; Sanità et al., 2024c), they are the ideal candidate for testing the calibration of TEM-EDS analysis to estimate the P conditions. In the samples, the white mica grains, formed during high pressure and low-temperature (HP–LT) metamorphism, have a typical grain size that never exceeds 5 µm. The reliability of the obtained results will be tested by comparison with P estimates obtained on the basis of EPMA-WDS data taken from exceptionally large grains (8–10 µm) present on the same samples.
The data processing performed in this work is based on the TEM-EDS dataset (Supplement File S1) of Sanità et al. (2024b), which includes four samples of metapelites from the Palombini Shale Fm. (i.e., samples ULI3aT and ULI14T – Gottero Unit; ULI8T – Portello Unit, and ULI22aT – Bracco-Val Graveglia Unit; Fig. 1). Additional information about the acquisition setting is provided in Supplement File S2. P–T estimates for the samples (Meneghini et al., 2023; Sanità et al., 2024c) indicated a low blueschist metamorphic imprint. The analyzed samples are characterized by a pervasive syn-metamorphic S1 slaty cleavage developed during underthrusting and accretion into the Alpine wedge (Marroni and Pandolfi, 1996; Sanità et al., 2024b) and marked by (Fig. 2a, b) chlorite (Chl) + white mica (Wm) + quartz (Qz) ± albite (Ab) and ± calcite (Cc) (mineral abbreviations of Warr, 2021). Phyllosilicates show sizes that never exceeds 10 µm (Fig. 2a, b). Both syn-metamorphic Chl and Wm growing along the S1 foliation show sharp edges, with no evidence of chemical zoning (e.g., Sanità et al., 2024b). Detrital phases (phyllosilicates and feldspars) up to 50–60 µm in size are also documented. Sample preparation for TEM-EDS investigation was performed following Lezzerini et al. (1995) and Leoni et al. (1996) to obtain <2 µm Wm-rich rock powder for each metapelite. This ensures that the Wm grain population in the powders is the smallest (Fig. 2c–f), which, as demonstrated by Sanità et al. (2024b), would correspond to that grown along the S1 slaty cleavage. These grains appear as thin foils apparently homogeneous with no evidence of intergrowth lamellae (Fig. 2c–f).
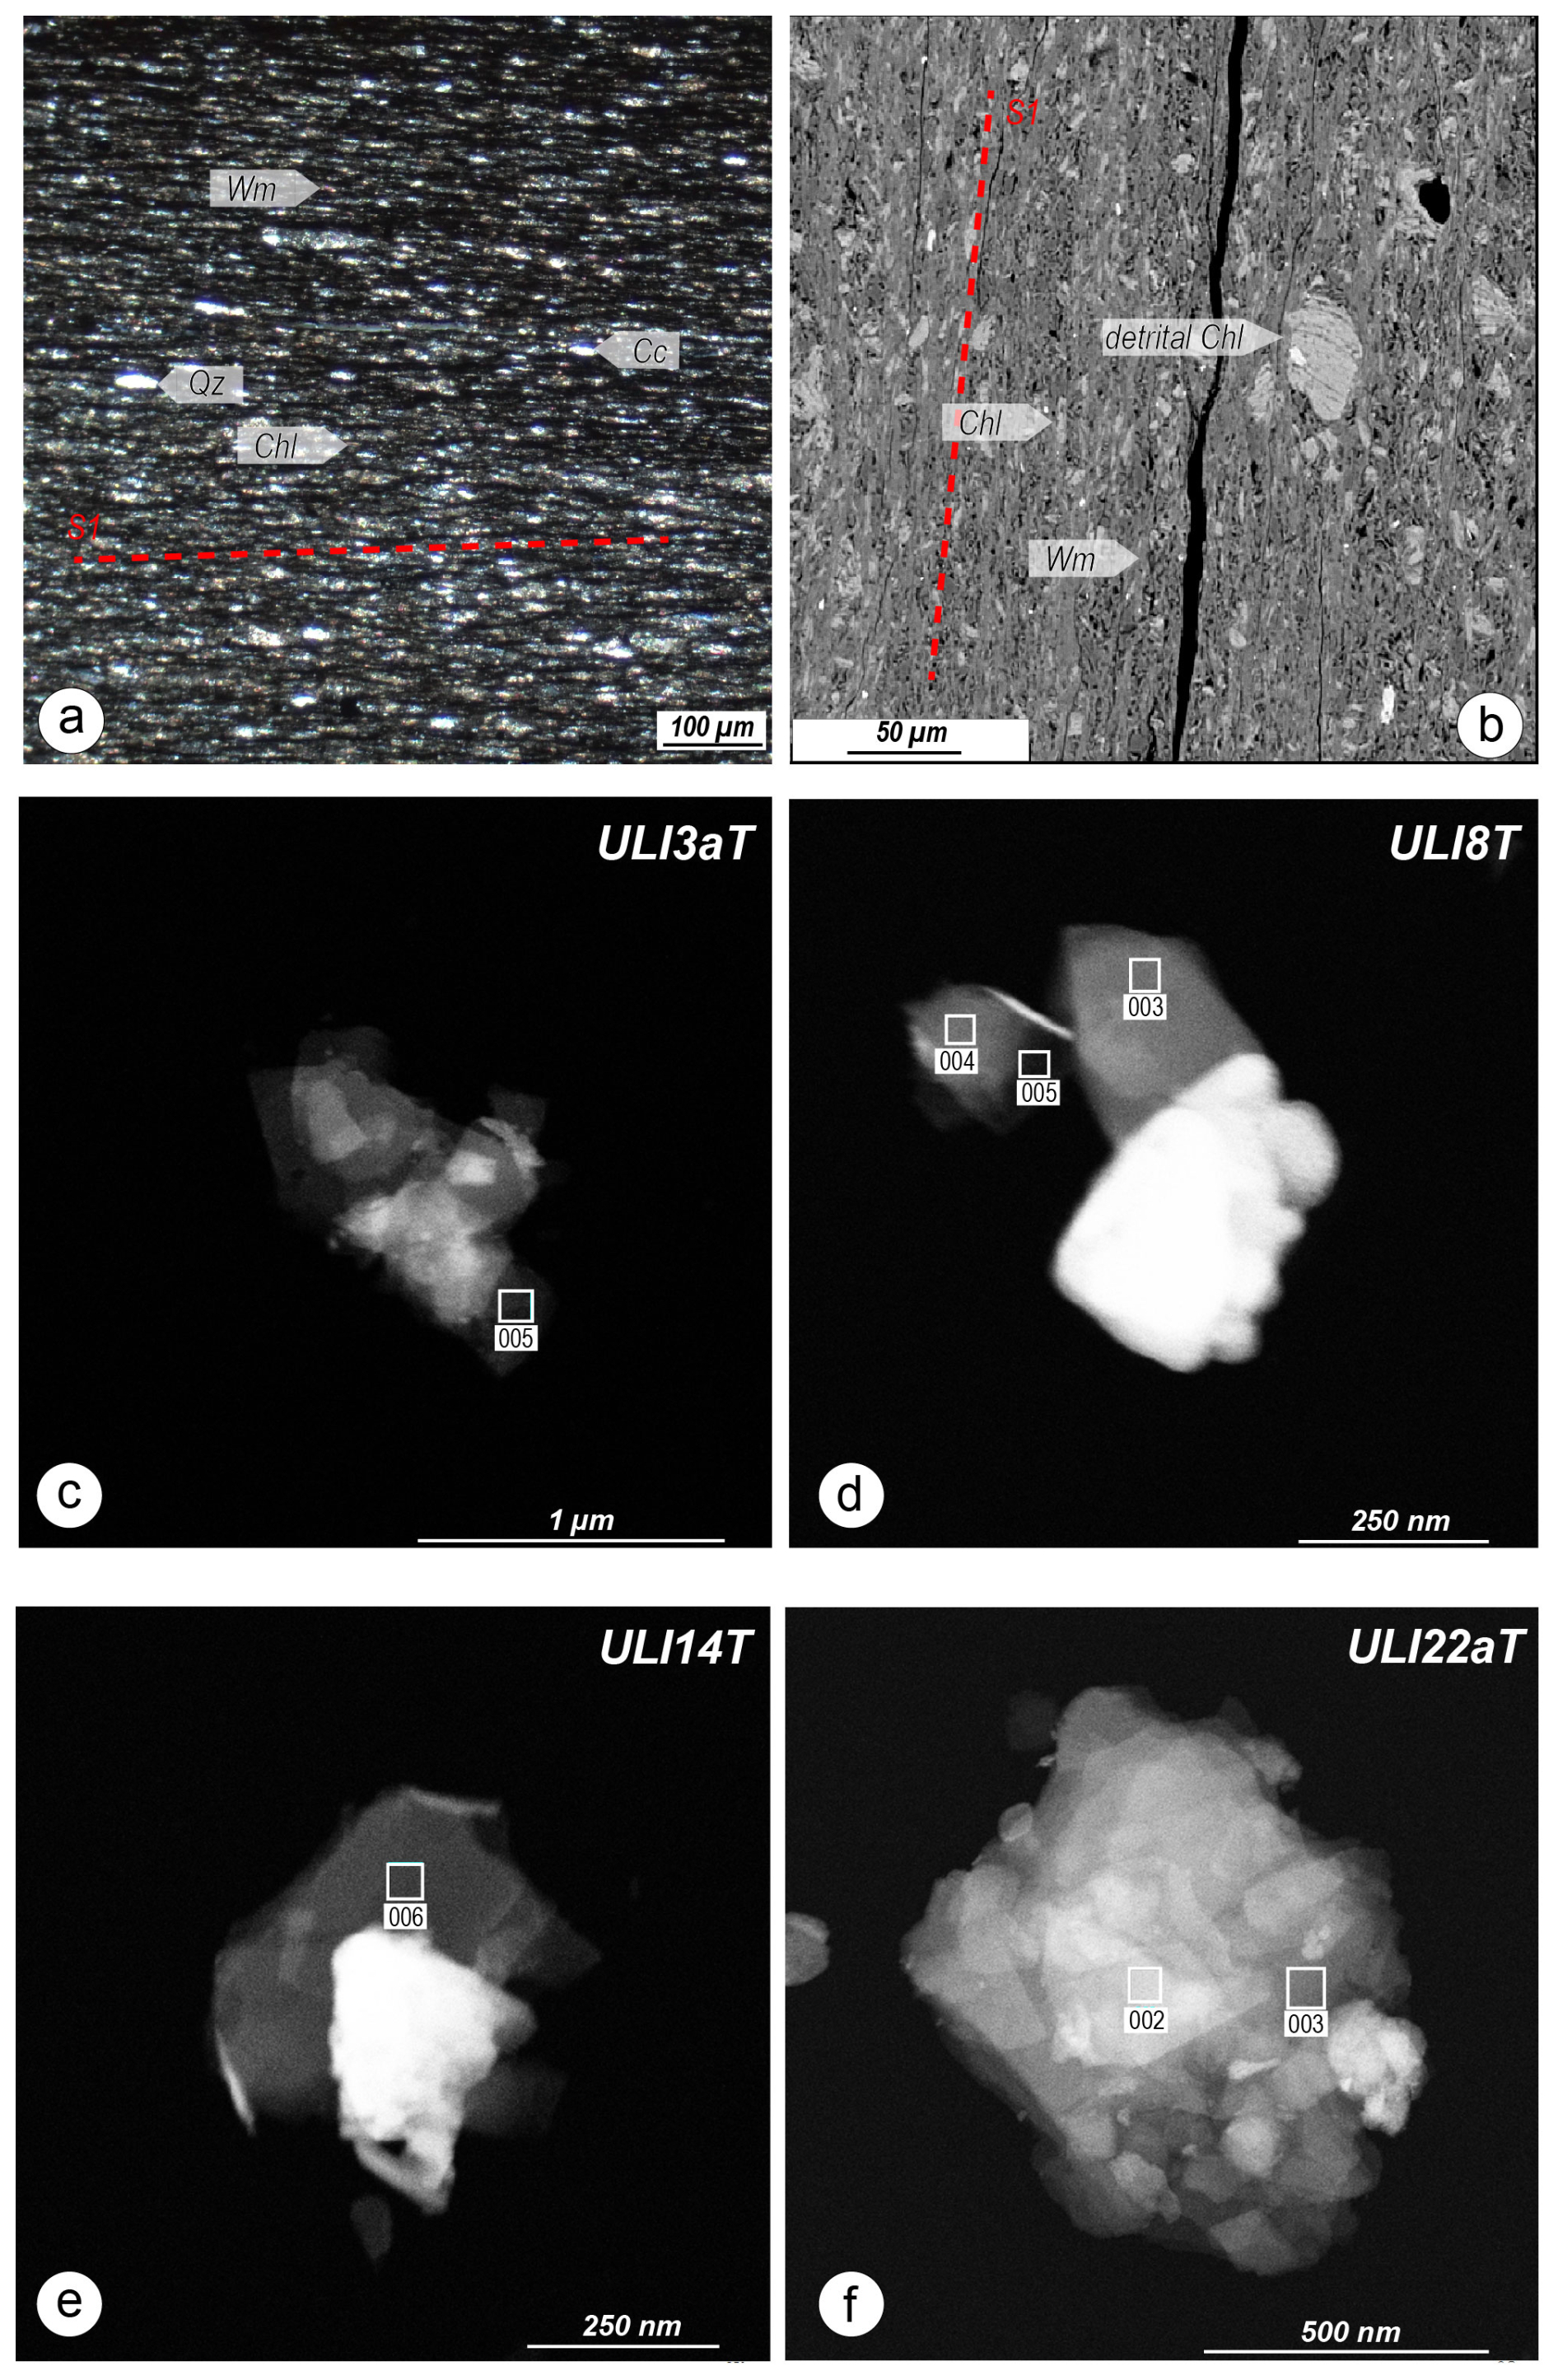
Figure 2Microscale and nanoscale structural features of the Wm grains of interest. (a) Detail of S1 foliation (dashed red line, sample ULI3a) marked by pressure solution surfaces and syn-metamorphic phyllosilicates (e.g., Chl and Wm), Qz, and calcite (Cc). (b) Backscattered electron image of the S1 foliation (dashed red line, sample ULI14). Detrital grain (e.g., detrital Chl) appears bigger with frayed edges than the syn-metamorphic one. (c–f) Nanoscale dark-field images of submicrometer Wm grains pictured at the TEM in scanning transmission electron microscopy (STEM) mode. White boxes indicate the EDS analyzed areas.
The chemical analysis of this Wm population was used for P estimates. The data reduction of the raw TEM-EDS analysis was performed using the correction procedure of Conconi et al. (2023) after the update for the absorption correction method of Sanità et al. (2024b). Such an approach paid attention to hydrated minerals accounting for the contribution of hydrogen using a reduced net valence of each oxygen and neglectable amounts of fluoride and chloride anions. The quality check for each analysis has been performed through a stoichiometric approach using 12 oxygens by Sanità et al. (2024b). The chemical analysis is considered corrected if the electroneutrality is maintained with an error of ±0.04. This procedure ensures an improvement of the quality of the analysis with standard deviation lower than those of EPMA-WDS (Sanità et al., 2024b). A detailed list of the chemical analysis successfully corrected is reported in Supplement File S1. The Wm composition used in this work is shown in Figs. 3 and 4, and they were used for pressure estimates. In this paper, we expressed the final structural formulas as dry white mica, i.e., with 11 oxygen atoms (see Supplement File S1), to favor the comparison with the EPMA-WDS analysis reported in the previous papers (Meneghini et al., 2023; Sanità et al., 2024c).
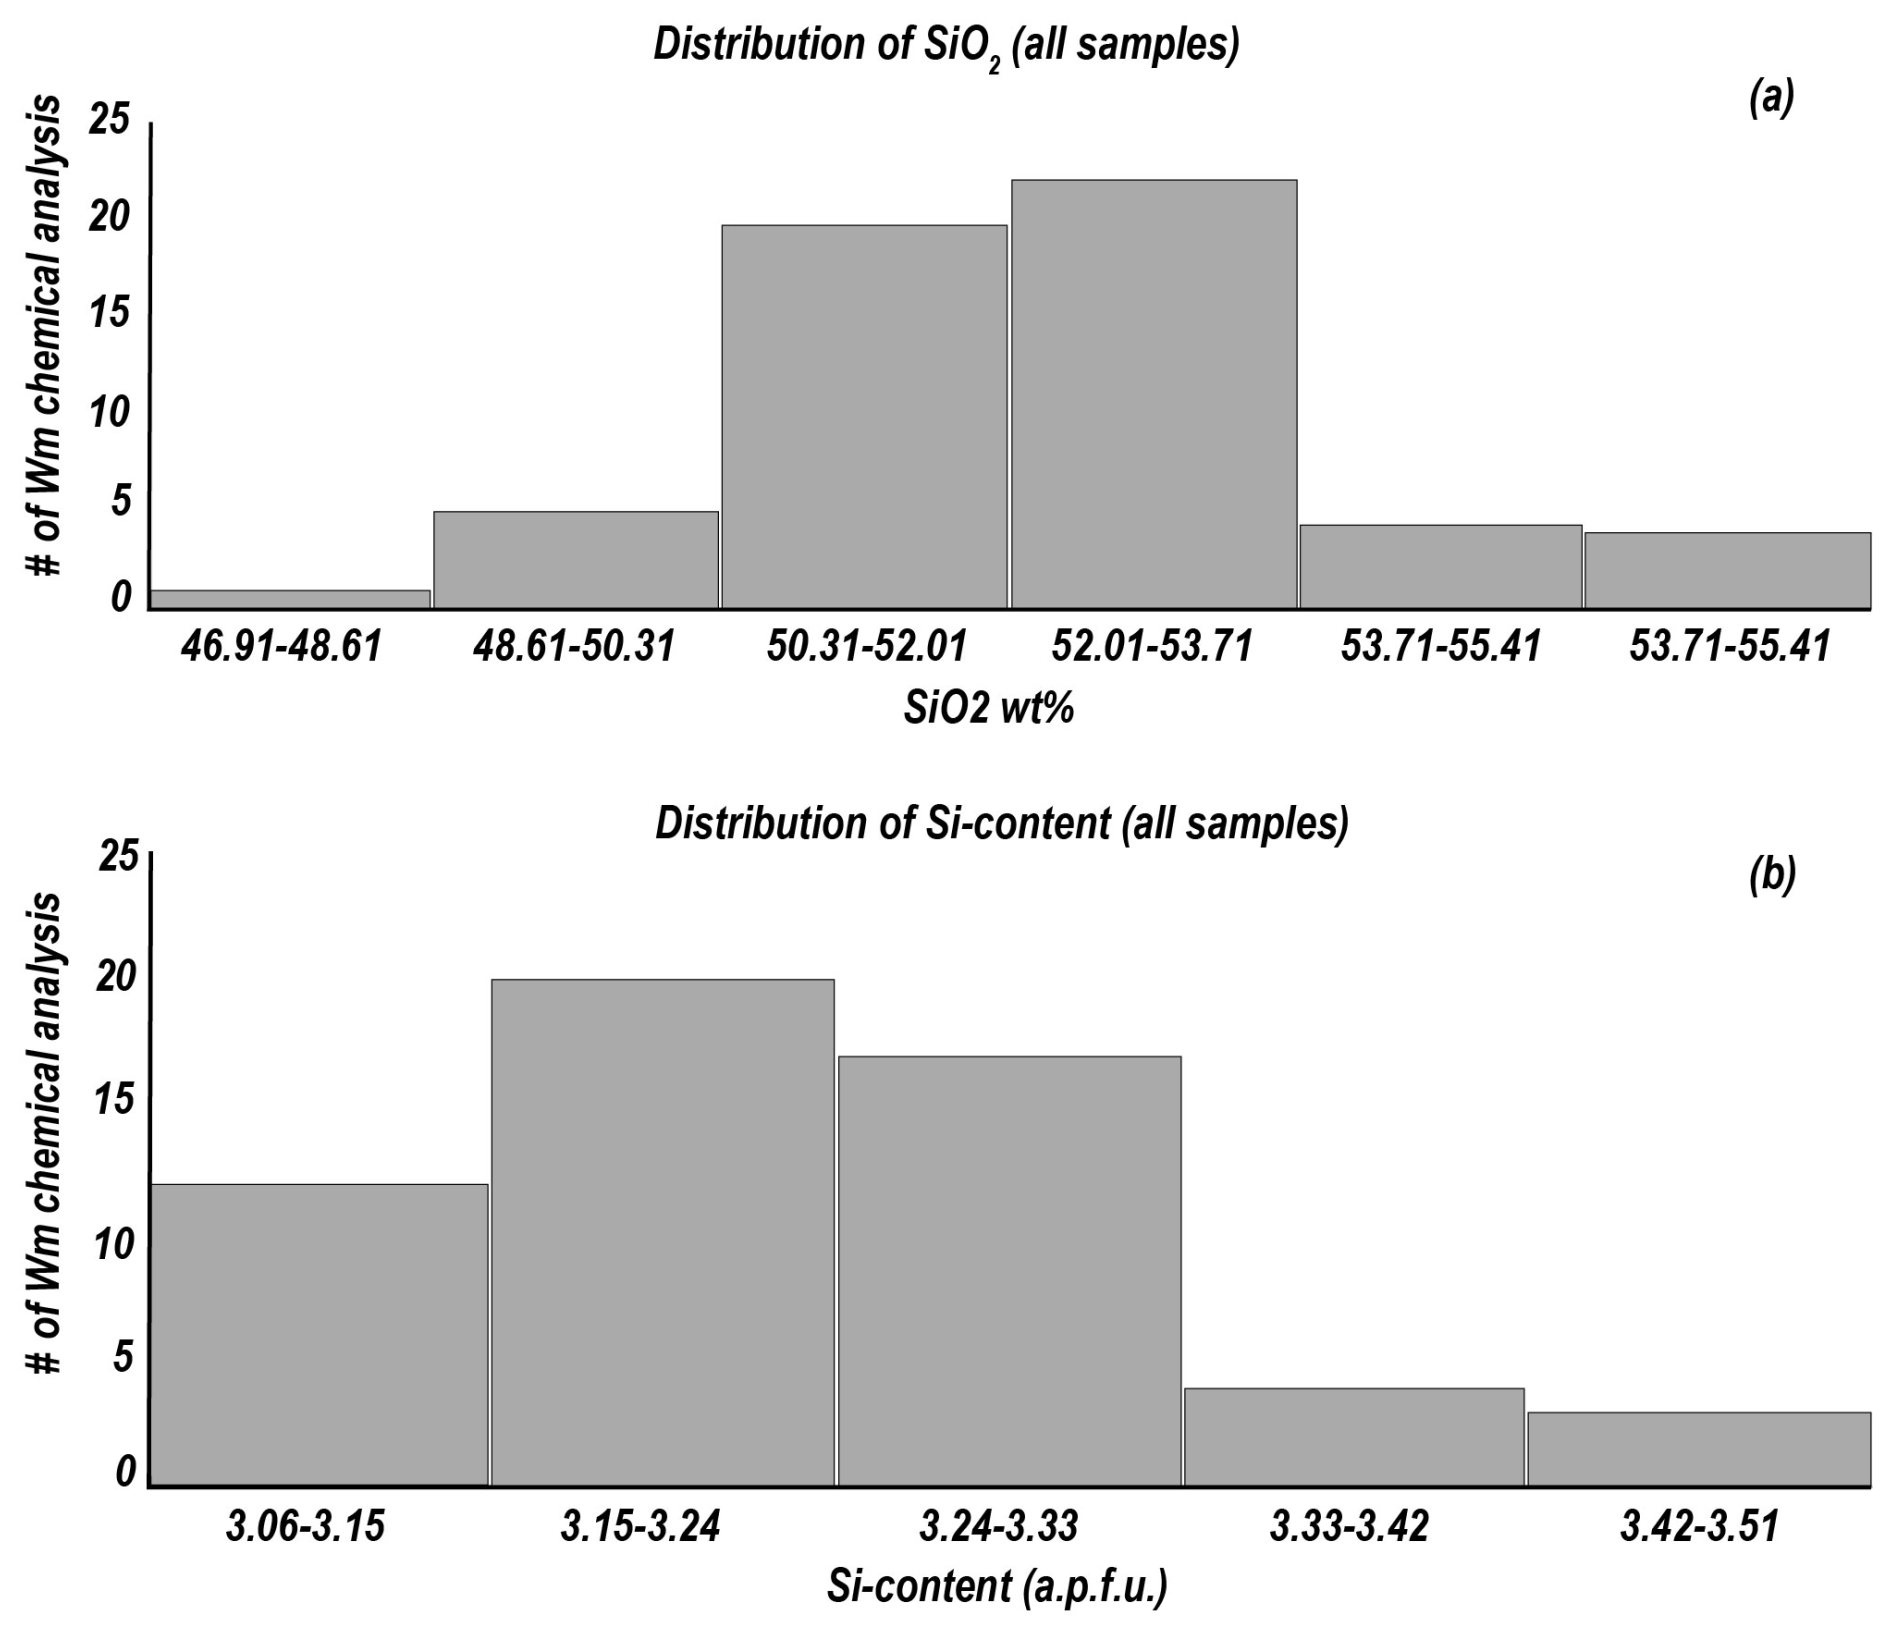
Figure 3(a) Histogram showing the distribution of the SiO2 wt % values of the white mica compositions from all studied samples. (b) Histogram showing the distribution of the Si content expressed in a.p.f.u. of the white micas from all studied samples.
The white mica (Phg)-Qz-H2O method (Dubacq et al., 2010) is used for P estimates. It is based on the dehydration of white mica to refine the thermodynamic status of water content in the A site, which is mainly a T-sensitive reaction: pyrophyllite(H) = pyrophyllite + H2O
However, the reactions are also P dependent, and, for fixed T, the percentage of Fe3+ can be optimized and the P value can be estimated (Lanari, 2012; Lanari et al., 2012, 2019; Scheffer et al., 2016; Sanità et al., 2022a, b; 2024a; Frassi et al., 2023; De Cesari et al., 2024). The procedure of Dubacq et al. (2010) was used to estimate the P conditions of the white mica grains by using the ChlMicaEqui software (Lanari, 2012). The results are represented in the P–T space (Fig. 5) as equilibrium lines, representative of the abovementioned reactions. Along each line, empty circles represent the hydration state of Wm, which decreases moving from LP–LT to HP–HT conditions (further details are given in Supplement File S2).
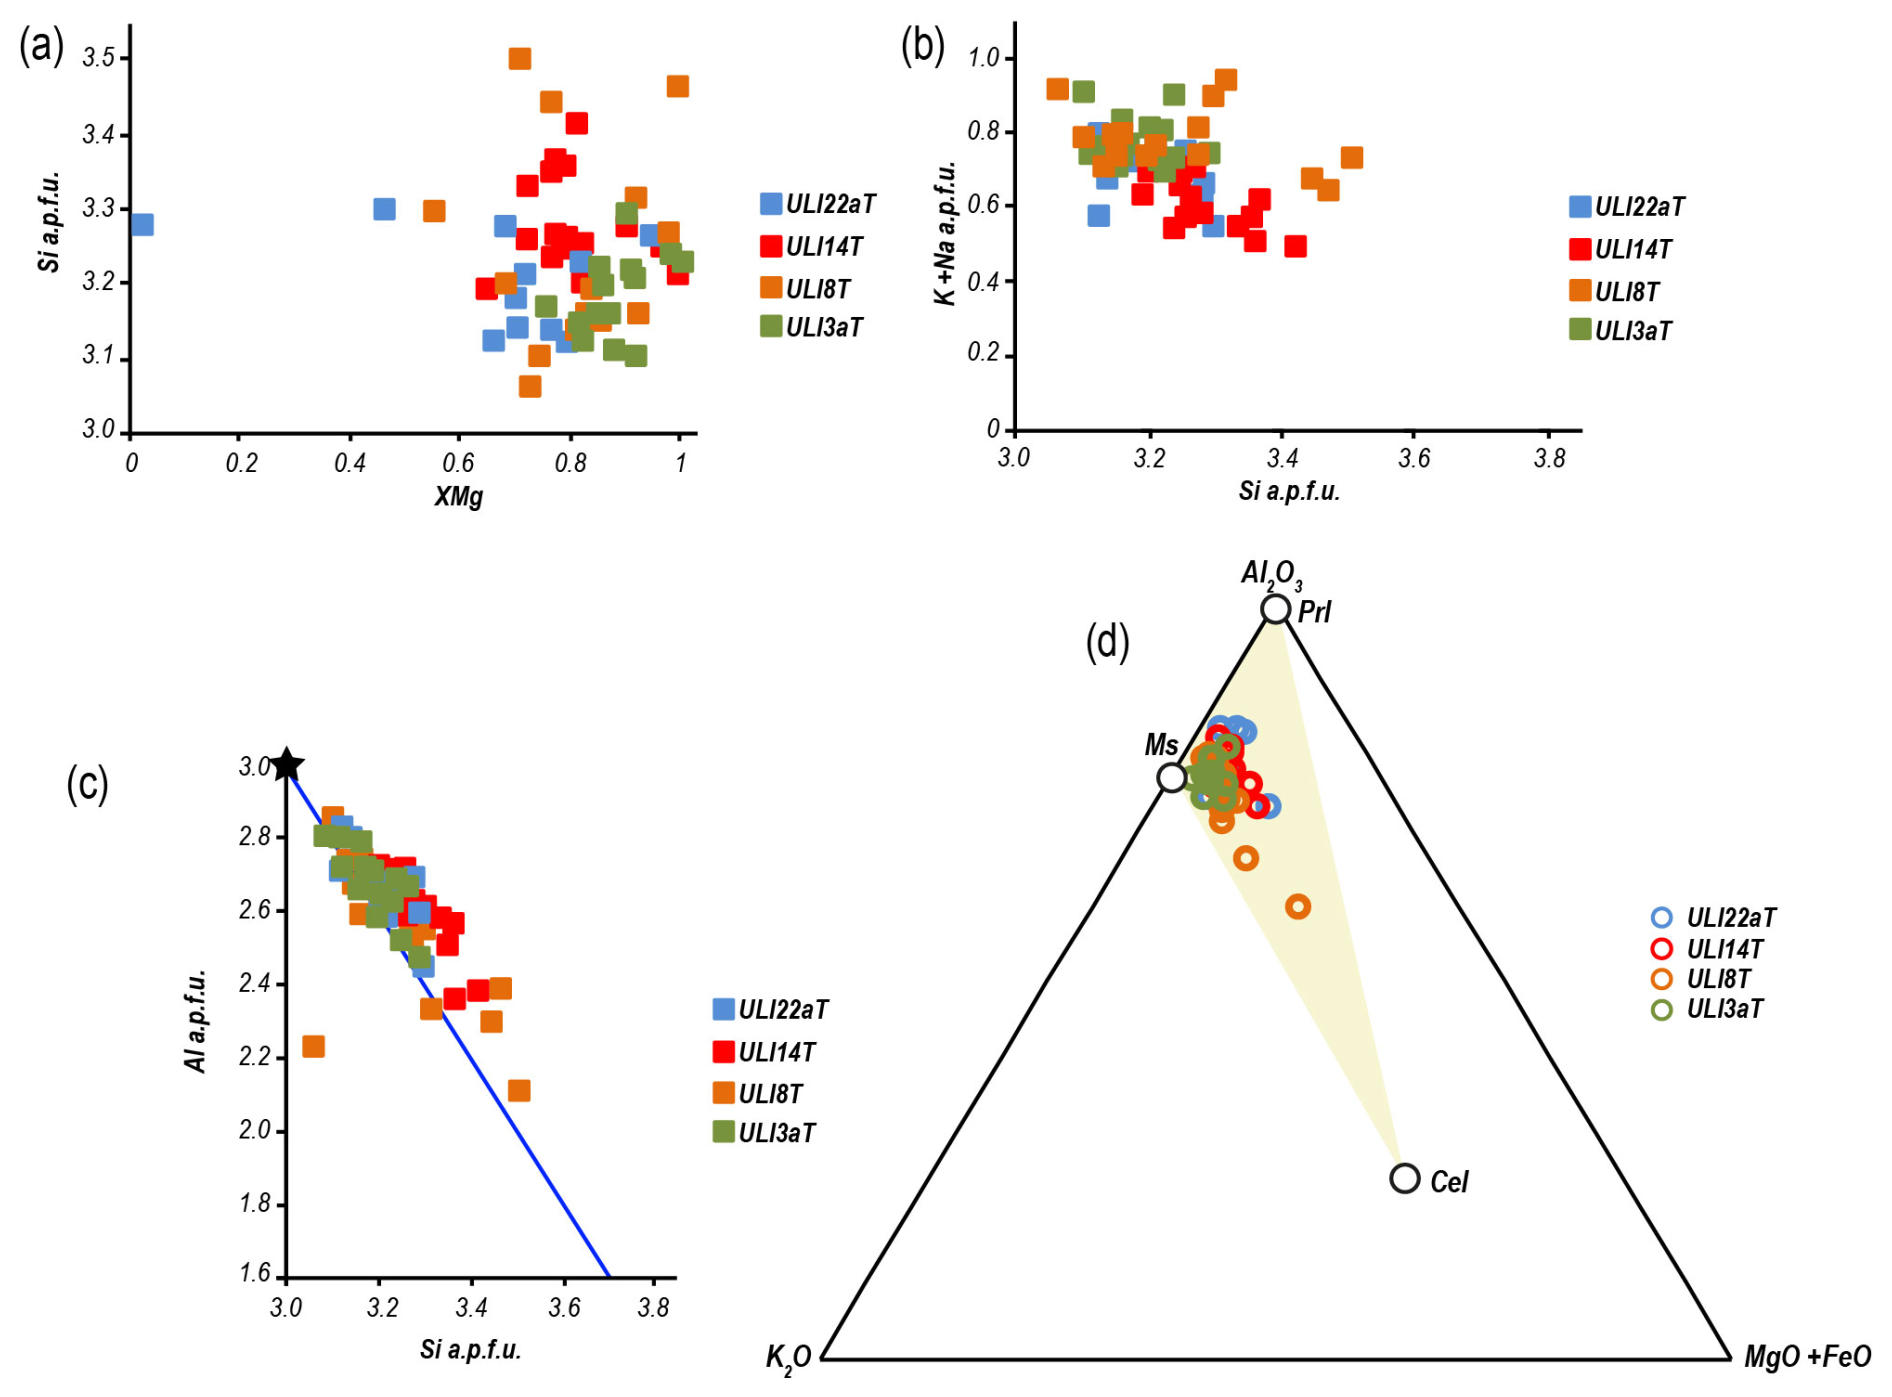
Figure 4Mineral chemistry of Wm grains acquired by TEM-EDS. (a) Si–XMg plot; (b) K–Si plot; (c) Altot–Si plot. The blue line marks the Tschermak substitution, while the black star indicates the theoretical muscovite composition; (d) triangular plot for endmember composition (from Vidal and Parra, 2000). It is clear that the Wm grains exhibit a composition lying in the celadonite–muscovite–pyrophyllite space.
3.1 Wm mineral chemistry
The SiO2 content of the white mica analyzed in this work ranges from 50.31 wt % to 53.71 wt % (Fig. 3a), which correspond to a Si content between 3.15–3.33 a.p.f.u. (atoms per formula unit, Fig. 3b). Minor white micas with a Si content >3.40–3.50 a.p.f.u, (14 % of total, Fig. 3) attributed to detrital grains are also documented. Sample ULI3aT shows the highest XMg, ranging between ca. 0.8–1.0 (Fig. 4a and Supplement File S2), while samples ULI14T and ULI22aT show less-scattered values (0.7–0.8 and 0.6–0.8, respectively). XMg in the ULI8T sample ranges between 0.55 and 1.0 (Fig. 4a). The ULI14 sample shows the highest Si contents (3.20–3.38 a.p.f.u.) and the lowest Altot contents (2.50–2.70 a.p.f.u.). Overall, the K + Na content (Fig. 4b) ranges between 0.55 and 0.95 in all samples, with higher values for samples ULI8T and ULI3aT. By contrast, samples ULI3aT and ULI22aT show high Altot and low Si values (2.60–2.80 and 3.10–3.25 a.p.f.u., respectively). Sample ULI8T shows Altot and Si contents of 2.10–2.85 and 3.06–3.50 a.p.f.u., respectively (Fig. 4c). Besides, Altot–Si and K + Na–Si plots show no clear evidence for alkaline cation loss (Abad et al., 2006). Regarding the Wm endmember proportion (Fig. 4d), all samples show high Al2O3 wt %, shifting toward the muscovite (Ms) composition (XMs > 60 %, Fig. 4d), with minor contents of XPrl (peak: 25 %–33 % and 13 %–26 % for samples ULI14T and ULI8T, respectively). The highest XPrl and XTri values are observed for sample ULI22aT (peak: 23 %–31 % and 6 %–14 %, respectively) and for sample ULI3aT (13 %–29 % and 3 %–10 %, respectively – see Supplement File S1). The XCel proportion is neglectable in all investigated samples.
3.2 P estimates based on TEM-EDS data
Figure 5 displays the input parameters and the setup used for each simulation, as well as the related P estimates obtained for each sample. Computations for the ULI3aT sample were performed with a Fe3+ content ranging between 0 % and 30 %, and the best results (i.e., a single solution of XH2O value) were obtained for an optimized ferric iron value of 10 % (Fig. 5a) for a XH2O value of 0.96. Under these conditions, an overall P range of 1.1–0.6 GPa was detected. However, taking into account the XH2O value of 0.96, it is also possible to detect a consistent cluster in the P–T space, which relates to a main P range of 1.05–0.7 GPa (red ellipse in Fig. 5a).
The P range for sample ULI8T was estimated with a ferric iron content ranging between 5 % and 15 % of FeOtot. The best output (Fig. 5b), obtained with a Fe %, is for XH2O of 0.96. With these parameters, the model predicts P values between 1.43 and 0.75 GPa. Also, a main cluster corresponding to a P value of 1.03–0.9 GPa can be observed.
For sample ULI14T, a Fe3+ content ranging around 20 % of the FeOtot was chosen (Fig. 5c), and the model predicts an XH2O value of 0.95 in the A site for the investigated Wm compositions. The estimated P ranges between 1.4 and 0.8 GPa with a main cluster at 1.0–0.82 GPa.
In sample ULI22aT, the ferric iron content shows the highest values (30 %–50 % of FeOtot), with an optimized value at 50 % of Fe3+content. This XFe3+ value is coherent with a modeled XH2O of 0.95 (A site), yielding an overall P range of 0.8–0.2 GPa (Fig. 5d) with a main cluster at 0.6–0.4 GPa.
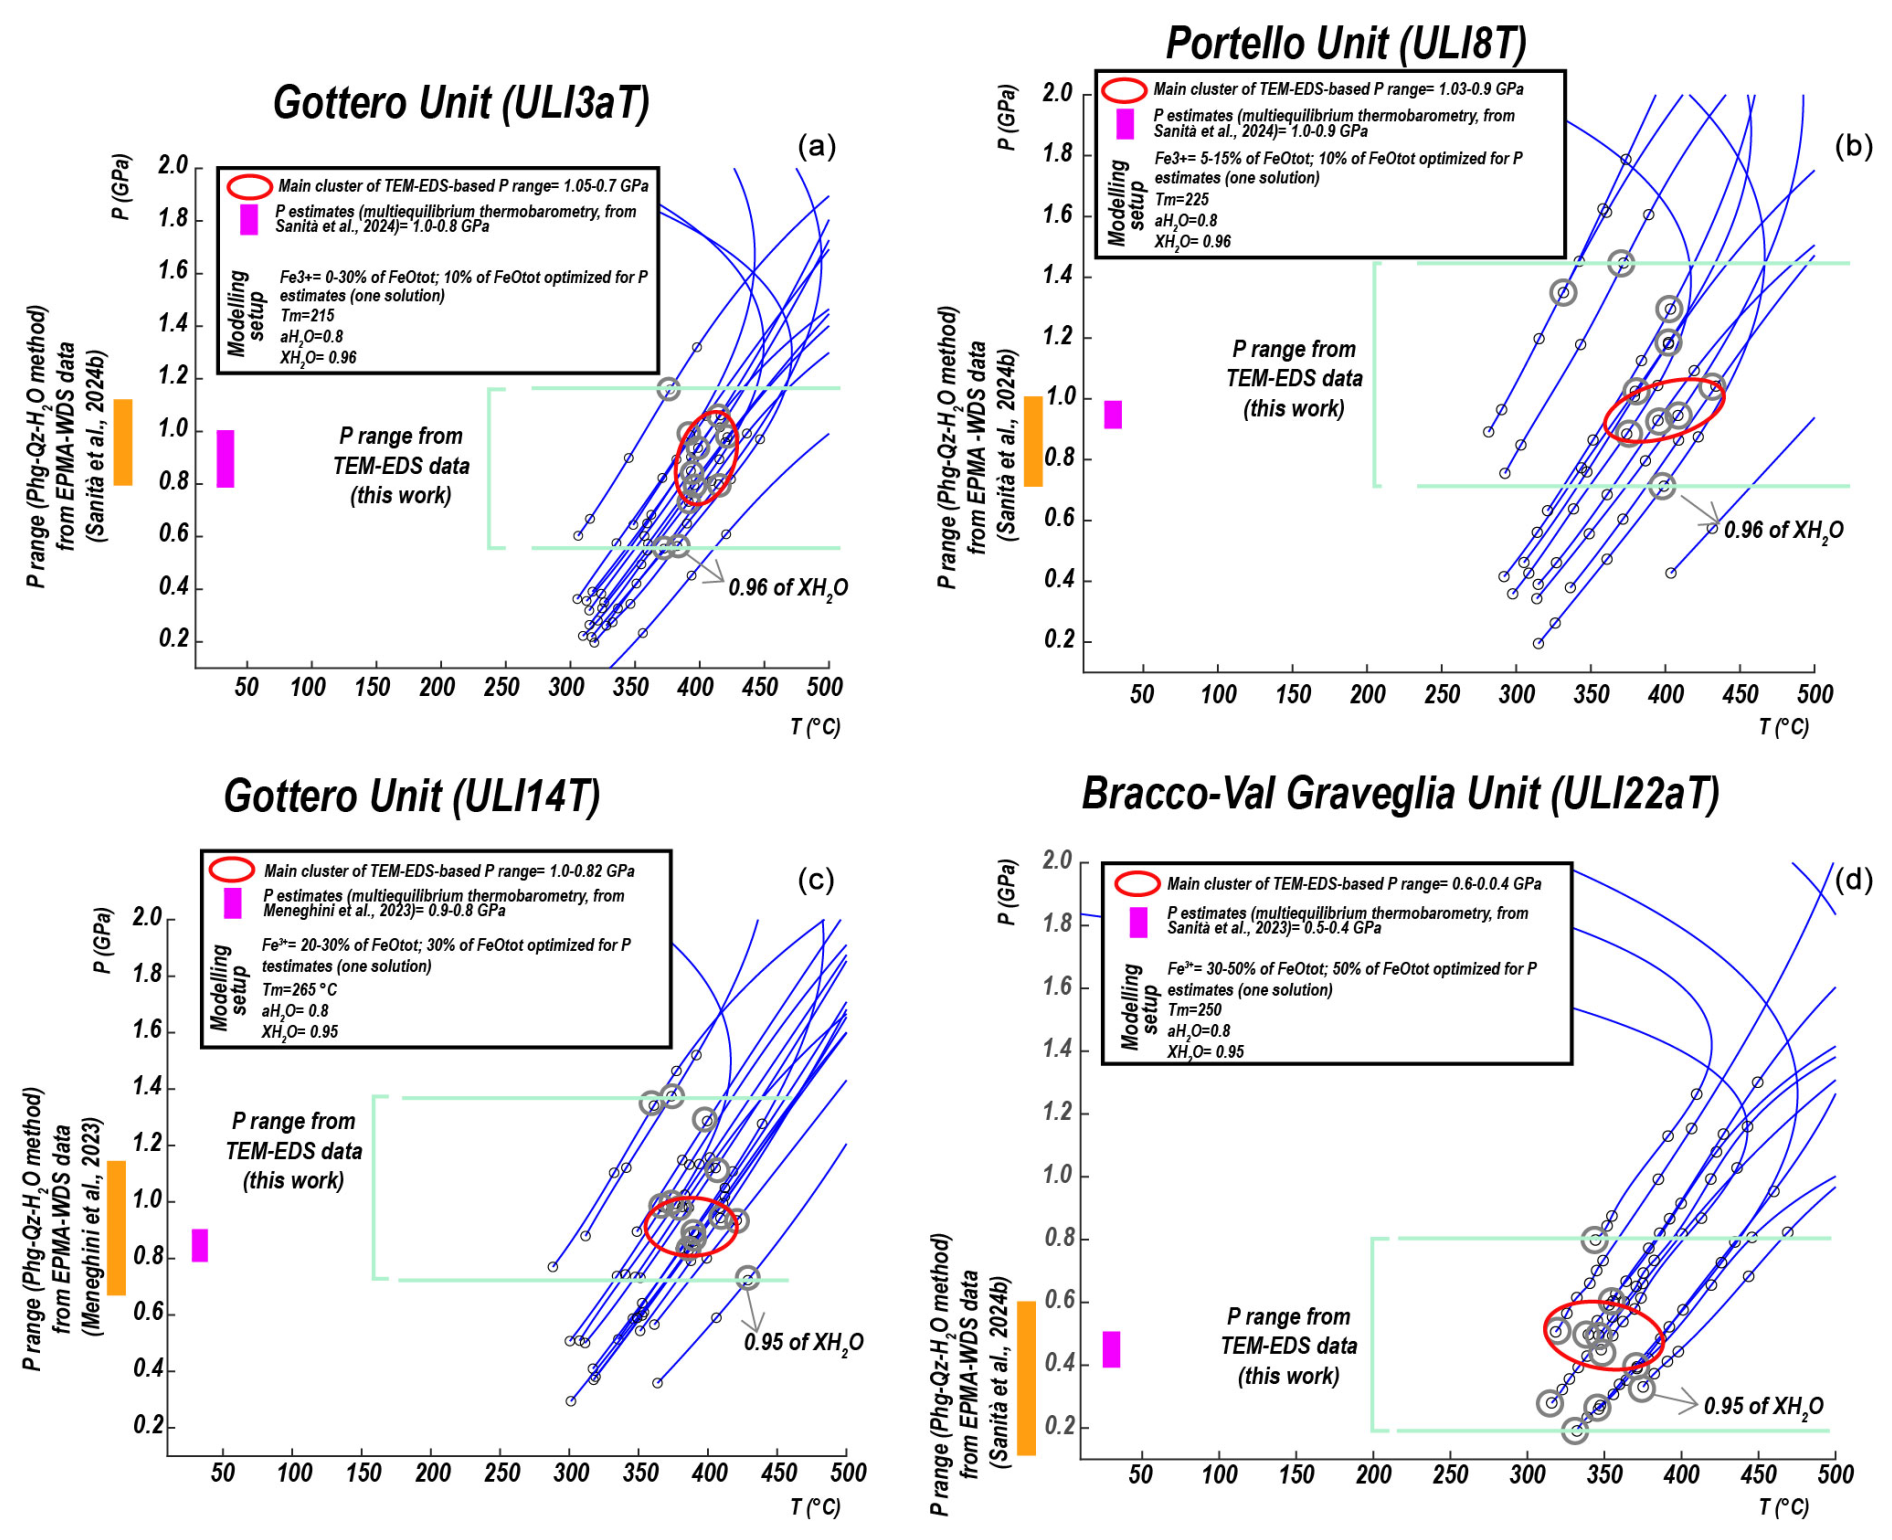
Figure 5Geobarometric results obtained for (a) the Gottero Unit, (b) the Portello Unit, (c) the Gottero Unit, and (d) the Bracco-Val Graveglia Unit. The P–T space shows the results of the Phg-Qz-H2O method. In each diagram, blue lines mark the equilibrium reactions (see the main text) used for the Phg-Qz-H2O method. Along the lines, the empty circle indicates the interlayer H2O content progressively decreasing from low-temperature and low-pressure conditions to high-temperature and high-pressure conditions. The gray circles indicate the XH2O content used during the modeling. The green lines indicate the whole P range estimated with the TEM-EDS technique, including the main clusters (red ellipsis). The P range estimated from previous studies with the Chl-Wm-Qz-H2O approach (Vidal and Parra, 2000) is reported in the inserts (purple bars), as well as the modeling parameters for each sample. Here, the parameters and settings used for the modeling for each studied sample are shown. Along the y axes, the P ranges obtained with the Phg-Qz-H2O method from EPMA-WDS data (from Meneghini et al., 2023 and Sanità et al., 2024c) are also reported (orange rectangular bars). Those comparisons shown in the figure reinforce the robustness of P estimates performed in this work (see the main text for details).
4.1 Comparison with the P estimates based on EPMA-WDS chemical data
In Fig. 5, the P ranges obtained with the Phg-Qz-H2O method applied on EPMA-WDS chemical data are reported. The XH2O values and the optimized XFe3+ ranges used during computations are shown in the inserts. The recalculation of the TEM-EDS analysis on white mica obtained in this paper corroborate with that of Meneghini et al. (2023) and Sanità et al. (2024c), detected with the EPMA-WDS technology. Overall, P estimates (Phg-Qz-H2O method) obtained from the EPMA-WDS analysis systematically show a slightly more restricted range than TEM-EDS (orange boxes in Fig. 5). However, the most statistically reliable TEM-EDS-based P values are clustered within more restricted ranges (red ellipses in Fig. 5). These estimates clearly overlap the P ranges obtained using the EPMA-WDS analysis for all the investigated samples, and, in a few cases, they are almost equivalent (see samples ULI8T and ULI22aT). Also indicated in Fig. 5 are P conditions (purple boxes) estimated by Meneghini et al. (2023) and Sanità et al. (2024c) using the multiequilibrium thermobarometry approach of Vidal and Parra (2000). These estimates show a good match with the clustered TEM-EDS-based P ranges, although the former result is more accurate than the latter. However, such differences are within ±0.2 GPa, the error associated with Vidal and Parra's approach.
4.2 Reliability of P estimates
The sample preparation procedure used in this work allowed us to get a Wm-rich population for each sample and, as stated by Sanità et al. (2024b), the data correction procedure provided reliable chemical analysis from a statistical and chemical point of view. Wm chemistry shows that there are few differences among the investigated Wm grains. The major differences concern the Si contents, with the lowest values for sample ULI22aT, which has a relatively higher Prl content. Such differences reflect those described by Meneghini et al. (2023) and Sanità et al. (2024c). The mineral chemistry presented in this work (Figs. 3, 4) is that of white micas recrystallized in the lower blueschist facies conditions (e.g., Papeschi et al., 2024; De Cesari et al., 2024; Sanità et al., 2024a) and predicted to be stable by forward and inverse thermodynamic modeling.
TEM-EDS analyses have been used to perform P estimates by exploiting the Phg-Qz-H2O method (Dubacq et al., 2010). Such P ranges, estimated for a fixed T and by optimizing the Fe3+ content and XH2O values, gave robust results. The amount of Fe3+ optimized for the investigated Wm grains is within the theoretical range indicated by Forshaw and Pattison (2021), justifying its usage in the models. Overall, the P range estimated for each sample falls within a large area (Fig. 5). However, clusters corresponding to 95 % of confidence indicated more restricted P ranges (1.05–0.7, 1.03–0.9, 1.0–0.82, and 0.6–0.4 GPa for ULI3aT, ULI8T, ULI14T, and ULI22aT, respectively). These values show a clear overlap with the EPMA-WDS-based P values estimated by applying the same geobarometer (Fig. 5).
Interestingly, there is a good fit between our data and the P values estimated with the multiequilibrium thermobarometry method (Vidal and Parra, 2000) applied by Meneghini et al. (2023) and Sanità et al. (2024c) on the same samples. As stated by Vidal and Parra (2000), a proper usage of their method leads to an error of ±0.2 GPa for P. Although the TEM-EDS-based P ranges within 95 % of confidence are slightly more scattered, they are within the error associated with this approach. The P ranges estimated in this work (main clusters) from TEM-EDS data are perfectly coherent with those proposed by previous authors. Therefore, the results described in this work confirm the HP–LT metamorphic imprint of the Internal Ligurian Units.
4.3 Thoughts on the adopted strategy
The good fit between EPMA-WDS- and TEM-EDS-based P estimates confirms the robustness of our approach. The results documented in this paper impact on both the methodology and the data processing:
-
From a statistical point of view, the clusters related to TEM-EDS-based P estimates are referring to Wm, reflecting the main population in each studied rock powder. This implies that the sample preparation proposed by Lezzerini et al. (1995) is an efficient procedure to obtain syn-kinematic Wm-rich powders of low-grade rocks. The procedure and the analytical strategy adopted in this work ensure an accurate investigation of the chemical compositions of submicrometer Wm grains. These grains can be investigated using non-conventional methods, i.e., TEM-EDS, which can be better controlled for sampling very fine grained minerals compared to the EPMA-WDS.
-
Our strategy combined with the data reduction described by Conconi et al. (2023), after accounting for the H contribution (Sanità et al., 2024b), provides a statistically reliable amount of data.
Eventually, the obtained results promote the TEM-EDS protocol as a key tool to get reliable and reproducible chemical data of submicrometer minerals, after a proper correction procedure. This is a major step forward for the geoscience community with a huge impact in many fields. In this paper, we tested a possible application of the TEM-EDS apparatus for geobarometric estimates. The usage of corrected TEM-EDS analysis to perform P estimates on Wm is clearly shown to be a way worth pursuing. This could open up new perspectives for geobarometric applications on low-grade metamorphic rocks characterized by submicrometer minerals, e.g., phyllosilicates, which have been difficult to study so far.
We estimated the P conditions recorded by low-grade metapelites belonging to Internal Ligurian Units (Northern Apennines) using corrected TEM-EDS analysis on syn-metamorphic Wm grains. The estimated P values are coherent with those obtained for the same samples using EPMA-WDS data, confirming the HP–LT metamorphism for the Internal Ligurian Units and supporting the tectonic reconstruction proposed by previous authors. The usage of a robust data reduction technique for TEM-EDS analysis opens new perspectives for the study of low-grade rocks.
The data that support the findings of this study are available from the corresponding author upon reasonable request.
The supplement related to this article is available online at https://doi.org/10.5194/ejm-37-343-2025-supplement.
ES performed sample preparation and the TEM-EDS data reduction procedure; ES and EM carried out the TEM-EDS chemical analysis; ES and MDR planned the sampling and performed the pressure estimates; ES wrote the manuscript; ES, MDR, and EM reviewed and edited the manuscript.
The contact author has declared that none of the authors has any competing interests.
Publisher’s note: Copernicus Publications remains neutral with regard to jurisdictional claims made in the text, published maps, institutional affiliations, or any other geographical representation in this paper. While Copernicus Publications makes every effort to include appropriate place names, the final responsibility lies with the authors.
Michele Marroni and Luca Pandolfi are thanked for making available the samples investigated in this work. A special thanks to Michele Alderighi for his technical support during TEM-EDS data acquisition. Authors thank the Centre for Instrument Sharing of the University of Pisa (CISUP) for allowing the use of the TEM-EDS apparatus for this study.
This research has been supported by the PRIN Project “POEM” (grant no. 2020542ET7), responsible person: Michele Marroni.
This paper was edited by Qun-Ke Xia and reviewed by three anonymous referees.
Abad, I., Nieto, F., Gutiérrez-Alonso, G., Campo, M. D., López-Munguira, A., and Velilla, N.: Illitic substitution in micas of very low-grade metamorphic clastic rocks, Eur. J. Mineral., 18, 59–69, https://doi.org/10.1127/0935-1221/2006/0018-0059, 2006
Airaghi, L., Lanari, P., de Sigoyer, J., and Guillot, S.: Microstructural vs compositional preservation and pseudomorphic replacement of muscovite in deformed metapelites from the Longmen Shan (Sichuan, China), Lithos, 282, 262–280, https://doi.org/10.1016/j.lithos.2017.03.013, 2017.
Bourdelle, F.: Low-temperature chlorite geothermometry and related recent analytical advances: a review, Minerals, 11, 130, https://doi.org/10.3390/min11020130, 2021.
Bourdelle, F., Parra, T., Chopin, C., and Beyssac, O.: A new chlorite geothermometer for diagenetic to low-grade metamorphic conditions, Cont. Min. Petrol., 165, 723–735, https://doi.org/10.1007/s00410-012-0832-7, 2013.
Bourdelle, F., Beyssac, O., Parra, T., and Chopin, C.: Nanoscale chemical zoning of chlorite and implications for low-temperature thermometry: Application to the Glarus Alps (Switzerland), Lithos, 314, 551–561, https://doi.org/10.1016/j.lithos.2018.06.030, 2018.
Bucher, K. and Grapes, R.: Petrogenesis of metamorphic rocks (Vol. 428), Springer, Berlin, https://doi.org/10.1007/978-3-031-12595-9, 2011.
Conconi, R., Ventruti, G., Nieto, F., and Capitani, G.: TEM-EDS microanalysis: Comparison among the standardless, Cliff & Lorimer and absorption correction quantification methods, Ultramicroscopy, 254, 113845, https://doi.org/10.1016/j.ultramic.2023.113845, 2023.
De Cesari, F., Di Rosa, M., Sanità, E., Pandolfi, L., and Marroni, M.: Long-lived sedimentation in the Western Tethys oceanic basin: revisiting the metasediments of Bagliacone-Riventosa Formation (Corsica, France), Int. Geol. Rev., 67, 906–932, https://doi.org/10.1080/00206814.2024.2411537, 2024.
Dubacq, B., Vidal, O., and De Andrade, V.: Dehydration of dioctahedral aluminous phyllosilicates: thermodynamic modelling and implications for thermobarometric estimates, Cont. Min. Petrol., 159, 159–174, https://doi.org/10.1007/s00410-009-0421-6, 2010.
Evans, T. P.: A method for calculating effective bulk composition modification due to crystal fractionation in garnet-bearing schist: Implications for isopleth thermobarometry, J. Met. Geol., 22, 547–557, https://doi.org/10.1111/j.1525-1314.2004.00532.x, 2004.
Forshaw, J. B. and Pattison, D. R.: Ferrous/ferric () partitioning among silicates in metapelites, Cont. Min. Petrol., 176, 63, https://doi.org/10.1007/s00410-021-01814-4, 2021.
Frassi, C., Di Rosa, M., Farina, F., Pandolfi, L., and Marroni, M.: Anatomy of a deformed upper crust fragment from western Alpine Corsica (France): insights into continental subduction processes, Int. Geol. Rev., 65, 40–60, https://doi.org/10.1080/00206814.2022.2031315, 2023.
Inoue, A., Meunier, A., Patrier-Mas, P., Rigault, C., Beaufort, D., and Vieillard, P.: Application of chemical geothermometry to low-temperature trioctahedral chlorites, Clay. Clay Miner., 57, 371–382, https://doi.org/10.1346/CCMN.2009.0570309, 2009.
Inoue, A., Inoué, S., and Utada, M.: Application of chlorite thermometry to estimation of formation temperature and redox conditions, Clay Miner., 53, 143–158, https://doi.org/10.1180/clm.2018.10, 2018.
Jahren, J. S.: Evidence of Ostwald ripening related recrystallization of diagenetic chlorites from reservoir rocks offshore Norway, Clay Miner., 26, 169–178, https://doi.org/10.1180/claymin.1991.026.2.02, 1991.
Jahren, J. S. and Aagaard, P.: Compositional variations in diagenetic chlorites and illites, and relationships with formation-water chemistry, Clay Miner., 24, 157–170, 1989.
Kamzolkin, V. A., Ivanov, S. D., and Konilov, A. N.: Empirical phengite geobarometer: Background, calibration, and application, Geol. Ore Dep., 58, 613–622, https://doi.org/10.1134/S1075701516080092, 2016.
Lanari, P.: Micro-cartographie P–T-” dans les roches métamorphiques. Applications aux Alpes et à l'Himalaya, PhD Thesis, University of Grenoble, 544 pp., https://theses.hal.science/tel-00799283v1 (last access: 14 June 2025), 2012.
Lanari, P. and Duesterhoeft, E.: Modeling metamorphic rocks using equilibrium thermodynamics and internally consistent databases: Past achievements, problems and perspectives, J. Petrol., 60, 19–56, https://doi.org/10.1093/petrology/egy105, 2019.
Lanari, P. and Hermann, J.: Iterative thermodynamic modelling – part 2: tracing equilibrium relationships between minerals in metamorphic rocks, J. Metamorph. Geol., 39, 651–674, https://doi.org/10.1111/jmg.12575, 2021.
Lanari, P., Guillot, S., Schwartz, S., Vidal, O., Tricart, P., Riel, N., and Beyssac, O.: Diachronous evolution of the alpine continental subduction wedge: evidence from P–T estimates in the Briançonnais Zone houillère (France–Western Alps), J. Geod., 56, 39–54, https://doi.org/10.1016/j.jog.2011.09.006, 2012.
Lanari, P., Wagner, T., and Vidal, O.: A thermodynamic model for di-trioctahedral chlorite from experimental and natural data in the system MgO–FeO–Al2O3–SiO2–H2O: Applications to P–T sections and geothermometry, Cont. Min. Petrol., 167, 968, https://doi.org/10.1007/s00410-014-0968-8, 2014.
Lanari, P., Vho, A., Bovay, T., Airaghi, L., and Centrella, S.: Quantitative compositional mapping of mineral phases by electron probe micro-analyser, Geological Society, London, Special Publications, 478, 39–63, https://doi.org/10.1144/SP478.4, 2019.
Lardeaux, J. M.: Metamorphism and linked deformation in understanding tectonic processes at varied scales, C. R. Géosci., 356, 525–550, https://doi.org/10.5802/crgeos.204, 2024.
Leoni, L., Marroni, M., Sartori, F., and Tamponi, M.: Metamorphic grade in metapelites of the internal liguride units (Northern Apennines, Italy), Eu. J. Min., 8, 35–50, https://doi.org/10.1127/ejm/8/1/0035, 1996.
Lezzerini, M., Sartori, F., and Tamponi, M.: Effect of amount of material used on sedimentation slides in the control of illite “crystallinity” measurements, Eu. J. Min., 7, 819–823, https://doi.org/10.1127/ejm/7/4/0819, 1995.
Marroni, M. and Pandolfi, L.: The deformation history of an accreted ophiolite sequence: the Internal Liguride units (Northern Apennines, Italy), Geodin. Acta, 9, 13–29, https://doi.org/10.1080/09853111.1996.11417260, 1996.
Marroni, M., Meneghini, F., and Pandolfi, L.: From accretion to exhumation in a fossil accretionary wedge: a case history from Gottero Unit (Northern Apennines, Italy), Geodin. Acta, 17, 41–53, https://doi.org/10.3166/ga.17.41-53, 2004.
Marroni, M., Meneghini, F., and Pandolfi, L.: Anatomy of the Ligure-Piemontese subduction system: evidence from Late Cretaceous–middle Eocene convergent margin deposits in the Northern Apennines, Italy, Int. Geol. Rev., 52, 1160–1192, https://doi.org/10.1080/00206810903545493, 2010.
Marroni, M., Meneghini, F., and Pandolfi, L.: A revised subduction inception model to explain the Late Cretaceous, double-vergent orogen in the precollisional western Tethys: Evidence from the Northern Apennines, Tectonics, 36, 2227–2249, https://doi.org/10.1002/2017TC004627, 2017.
Massone, H. J. and Schreyer, W.: Phengite geobarometry based on the limiting assemblage with K-feldspar, phlogopite, and quartz, Cont. Min. Petrol., 96, 212–224, https://doi.org/10.1007/BF00375235, 1987.
Meneghini, F., Pandolfi, L., and Marroni, M.: Recycling of heterogeneous material in the subduction factory: evidence from the sedimentary mélange of the Internal Ligurian Units, Italy, J. Geol. Soc., 177, 587–599, https://doi.org/10.1144/jgs2019-081, 2020.
Meneghini, F., Di Rosa, M., Marroni, M., Raimbourg, H., and Pandolfi, L.: Subduction signature in the Internal Ligurian units (Northern Apennine, Italy): Evidence from P–T metamorphic peak estimate, Terra Nova, 36, 182–190, https://doi.org/10.1111/ter.12694, 2023.
Papeschi, S., Rossetti, F., and Walters, J. B.: Growth of kyanite and Fe-Mg chloritoid in Fe2O3-rich high-pressure–low-temperature metapelites and metapsammites: A case study from the Massa Unit (Alpi Apuane, Italy), J. Metam. Geol., 41, 1049–1079, https://doi.org/10.1111/jmg.12736, 2024.
Parra, T., Vidal, O., and Agard, P.: A thermodynamic model for Fe-Mg dioctahedral K white micas using data from phase-equilibrium experiments and natural pelitic assemblages, Cont. Min. Petrol., 143, 706–732, https://doi.org/10.1007/s00410-002-0373-6, 2002.
Sanità, E., Di Rosa, M., Lardeaux, J. M., Marroni, M., and Pandolfi, L.: Metamorphic peak estimates of the Marguareis Unit (Briançonnais Domain): New constrains for the tectonic evolution of the south-western Alps, Terra Nova, 34, 305–313, https://doi.org/10.1111/ter.12592, 2022a.
Sanità, E., Di Rosa, M., Lardeaux, J. M., Marroni, M., and Pandolfi, L.: The Moglio-Testico Unit (Ligurian Alps, Italy) as Subducted Metamorphic Oceanic Fragment: Stratigraphic, Structural and Metamorphic Constraints, Minerals, 12, 1343, https://doi.org/10.3390/min12111343, 2022b.
Sanità, E., Di Rosa, M., Lardeaux, J. M., Marroni, M., Tamponi, M., Lezzerini, M., and Pandolfi, L.: Deciphering the pressure-temperature path in low-grade metamorphic rocks by combining crystal chemistry, thermobarometry and thermodynamic modelling: an example in the Marguareis Massif (Western Ligurian Alps, Italy), Min. Mag, 1–22, https://doi.org/10.1180/mgm.2024.80, 2024a.
Sanità, E., Conconi, R., Lorenzon, S., Di Rosa, M., Capitani, G., and Mugnaioli, E.: Application of an improved TEM-EDS protocol based on charge balance for accurate chemical analysis of sub-micrometric phyllosilicates in low-grade metamorphic rocks, Clay. Clay Miner., 72, e31, https://doi.org/10.1017/cmn.2024.32, 2024b.
Sanità, E., Di Rosa, M., Marroni, M., Meneghini, F., and Pandolfi, L.: Insights into the Subduction of the Ligure-Piemontese Oceanic Basin: New Constraints from the Metamorphism in the Internal Ligurian Units (Northern Apennines, Italy), Minerals, 14, 64, https://doi.org/10.3390/min14010064, 2024c.
Scheffer, C., Vanderhaeghe, O., Lanari, P., Tarantola, A., Ponthus, L., Photiades, A., and France, L.: Syn-to post-orogenic exhumation of metamorphic nappes: Structure and thermobarometry of the western Attic-Cycladic metamorphic complex (Lavrion, Greece), J. Geod., 96, 174–193, https://doi.org/10.1016/j.jog.2015.08.005, 2016.
Tarantola, A., Mullis, J., Guillaume, D., Dubessy, J., de Capitani, C., and Abdelmoula, M.: Oxidation of CH4 to CO2 and H2O by chloritization of detrital biotite at 270 ± 5 °C in the external part of the Central Alps, Switzerland, Lithos, 112, 497–510, https://doi.org/10.1016/j.lithos.2009.04.008, 2009.
van Cappellen, E. and Doukhan, J. C.: Quantitative transmission X-ray microanalysis of ionic compounds, Ultramicroscopy, 53, 343–349, https://doi.org/10.1016/0304-3991(94)90047-7, 1994.
Vidal, O. and Parra, T.: Exhumation paths of high-pressure metapelites obtained from local equilibria for chlorite–phengite assemblages, Geol. J., 35, 139–161, https://doi.org/10.1002/gj.856, 2000.
Vidal, O., Parra, T., and Vieillard, P.: Thermodynamic properties of the Tschermak solid solution in Fe-chlorite: Application to natural examples and possible role of oxidation, Am. Mineral., 90, 347–358, https://doi.org/10.2138/am.2005.1554, 2005.
Warr, L. N.: IMA–CNMNC approved mineral symbols, Min Mag., 85, 291–320, https://doi.org/10.1180/mgm.2021.43, 2021.