the Creative Commons Attribution 4.0 License.
the Creative Commons Attribution 4.0 License.
Average structure and microstructure of synchysite-(Ce) from Cuasso al Monte (Varese, Italy)
Roberto Conconi
Marco Merlini
Patrizia Fumagalli
Enrico Mugnaioli
Luigi Folco
Giancarlo Capitani
Microscopic, prismatic single crystals of synchysite-(Ce) from Cuasso al Monte (typical average composition Ca1.01Ce0.37Nd0.20Y0.17La0.09Pr0.05Sm0.05Gd0.03Th0.03(CO3)2F0.72) have been investigated by a variety of techniques, including single-crystal X-ray diffraction, Raman spectroscopy, scanning and transmission electron microscopy, and precession-assisted three-dimensional electron diffraction. The synchysite crystals are affected by an extraordinary abundance of diverse defects, such as stacking faults (polytypic disorder), core–rim chemical zoning, fluid and solid (hematite) inclusions, and metamict damage. Notwithstanding these faults, reliable X-ray crystal structure refinements have been obtained, which may enrich the currently scarce database. On the other hand, electron diffraction data, while remaining within acceptable limits, evidenced some challenges in refinement, even applying dynamical theory, potentially due to the impact of defects on data quality at the nanometre scale or absorption effects in such dense compounds, even in thin foils.
The apparent polytypic disorder affecting the studied synchysite actually disguises an ordered superstructure, suggesting a crystal growth by screw dislocation. The nanostructural relationships between inclusions and host suggest that the crystals trapped a large number of fluid inclusions during growth, while hematite inclusion formed later, filling voids or fractures. The studied crystals are chemically zoned, with the core enriched in Ce, La and Nd; the rim enriched in Y; and the outer rim enriched in Th. The latter, undergoing α decay, induced radiation damage to the outer rim structure of the crystals.
- Article
(6199 KB) - Full-text XML
- BibTeX
- EndNote
Synchysite-(Ce) (CaCe(CO3)2F) is a mineral containing light rare earth elements (LREEs) and the Ca-rich end-member of the CaREE-fluorcarbonate polysomatic series (Capitani, 2019, 2020, and references therein). The REE-rich end-member of the series is bastnäsite (REE(CO3)F), the most important ore for LREEs.
Synchysite-(Ce), like all other members of the series, has a layered topology, with planar carbonate groups “standing on edge” with respect to the overall structural layering (Grice et al., 2007). The most striking consequence of the structural layering is the formation of syntaxial intergrowths and, therefore, the presence of ordered and disordered domains with polysomatic and polytypic connections. Briefly, polytypism is due to the different stacking structures of equal layers, while polysomatism is due to different sequences of compositionally and structurally different layers (e.g. Donnay and Donnay, 1953; Wang et al., 1994; Ni et al., 2000; Capitani, 2019, 2020). For a long time, the existence of syntaxial intergrowths and related disorder has hindered the solution of the crystal structure of CaREE-fluorcarbonates. Whereas the crystal structure of bastnäsite-(Ce), the Ca-free end-member with the highest symmetry (P2c), was obtained quite early (Donnay and Donnay, 1953) and was later replicated by Ni et al. (1993), that of synchysite-(Ce) was obtained relatively recently (Wang et al., 1994) and that of parisite-(Ce), the only intermediate member whose structure has been correctly refined, somewhat later (Ni et al., 2000). As far as we know, those mentioned above are the only correct structure refinements of CaREE-fluorcarbonates known at the moment.
Synchysite-(Ce) at Cuasso al Monte occurs within miarolitic cavities of a post-Hercynian granophyre (Bakos et al., 1990; Pinarelli et al., 2002), commercially known as “red porphyry”, a dimension stone appreciated by the building industry for its reddish–pinkish colour and high hardness. Well-crystallized synchysite-(Ce) occurs as hexagonal prisms that are generally less than 100 µm in diameter, often forming aggregates. The hexagonal prisms are frequently zoned, with a light-reddish rim and a dark-brownish core (Fig. 1), and can be found at the rims of K-feldspar, quartz or fluorite and associated with other minerals such as chamosite, sphalerite, anatase, aeschynite and zircon. The red porphyry underwent hydrothermal alteration and albitization after emplacement; synchysite-(Ce) formed during these late stages (Capitani et al., 2018).
In this study, we made use of a multi-methodological approach, namely single-crystal X-ray diffraction (SCXRD), Raman spectroscopy, scanning electron microscopy (SEM) and transmission electron microscopy (TEM), energy-dispersive X-ray spectroscopy (EDS), and precession-assisted three-dimensional electron diffraction (3DED), to get the structure and microstructure of synchysite-(Ce). The study has several objectives: (i) to compare structural and microstructural data of synchysite-(Ce) from Cuasso al Monte with the few available literature data; (ii) to compare SCXRD and 3DED structural data, the latter obtained for the first time for this mineral group; and (iii) to get information on crystal growth and REE fractionation.
The synchysite-(Ce) crystals from Cuasso al Monte (Varese, Italy) show a hexagonal prismatic morphology, are microscopic in size and have a reddish colour with evident zoning (Fig. 1). Apparent single-crystal hexagonal prisms were picked up from the miarolitic cavities, mounted on glassy fibres and studied at the SCXRD diffractometer. Afterward, they were embedded separately in epoxy resin, polished with alumina (final step 0.3 µm) parallel to the basal (001) section and studied by Raman spectroscopy. The same samples were then carbon-coated with a 20 nm C film for SEM–EDS investigations and finally used to extract TEM lamellae with a focused-ion-beam (FIB) instrument. Overall, five crystals were prepared and studied. A table reporting the type of analysis performed for each individual crystal is provided in Appendix A (Table A1).
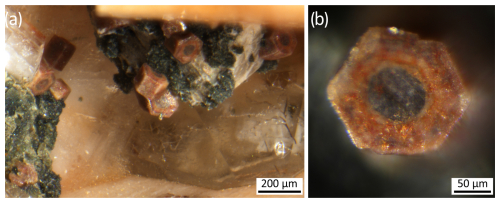
Figure 1(a) Optical micrographs showing hexagonal prisms of synchysite-(Ce) in a miarolitic cavity. The vitreous crystals in the lower right and upper left are quartz; the dark-green aggregates are chamosite; the background pinkish crystal is K-feldspar. (b) A synchysite-(Ce) hexagonal prism showing core–rim zoning.
Four different crystals (FCBN1 to FCBN4) were collected at the Department of Earth Sciences “Ardito Desio” of the University of Milan using a Rigaku Synergy instrument, equipped with a Mo microsource and hybrid photon-counting X-ray detector. Data collection consisted of ω scans, with steps of 0.5°, at variable ϕ and κ angles, ensuring reciprocal space coverage with average redundancy of a factor of 5, based on monoclinic Laue symmetry. Data reduction was performed with CrysAlis RED software (Rigaku Oxford Diffraction, 2018).
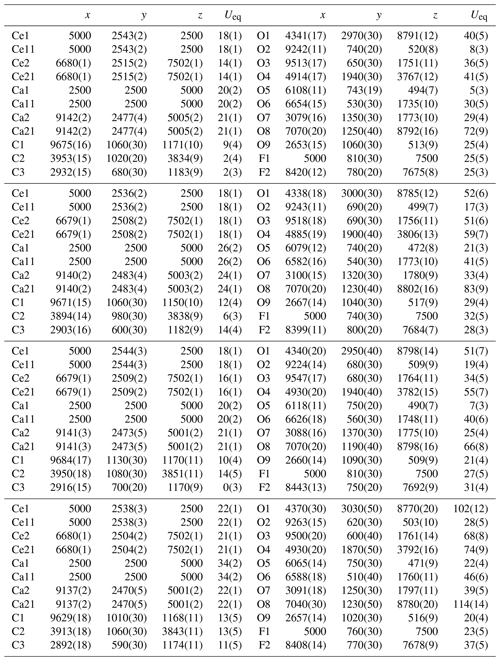
Structure refinement was attained by the method of full-matrix least squares on F2 implemented in the SHELX (version 2018/3) program (Sheldrick, 2015). The refinement was done in the C2/c space group using the structure of Wang et al. (1994) as the initial guess. The synchysite structure comprises two symmetrically distinct sites for Ca atoms (Ca1 in a special and Ca2 in a general position) and two for Ce atoms (Ce1 in a special and Ce2 in a general position). The occupancies of these sites were refined as Ca vs. Yb and Ca vs. Ce for Ca sites and Ce sites, respectively, to take into account the exceeding electron density compared to the ideal value, and the occupancy was constrained to one atom per site. Ce and Ca (and Yb) were refined anisotropically; C, O and F were refined isotropically. Soft restraints were used only for the C–O bond distances.
Raman spectroscopy analyses were performed at the Department of Earth Sciences “Ardito Desio” of the University of Milan. Spectra were collected using a LabRAM HR Evolution instrument at room temperature. The spectrometer is equipped with an Olympus BX series optical microscope, a diffraction grating of 1800 grooves per millimetre and a Si-based Peltier-cooled CCD detector. Spectra were excited with a He–Ne laser (633 nm) using a long focal length 50× objective and an acquisition time of 3×30 s.
SEM–EDS analyses were performed at the Platform of Microscopy of the University of Milano-Bicocca (PMiB) with a field emission gun (FEG) ZEISS GeminiSEM 500, operating at 15 keV and equipped with a Bruker XFlash EDS instrument. The standard method and φ(ρz) correction were used for quantitative analysis (Newbury and Ritchie, 2015, 2019). The following natural minerals, synthetic compounds and pure metals were used as standards: CeO2 (Ce), LaF3 (La, F), NdSi2 (Nd), Sm, Y, PrSi2 (Pr), Gd, ThF4 (Th), hematite (Fe) and synchysite (Ca). Wave-dispersive spectroscopy (WDS) was only used for REE identification in energy scan mode, since for quantitative analysis a current 1 order of magnitude higher compared to EDS was required (∼20 nA), which caused sample instability and led to worse results. However, in previous studies on other CaREE-fluorcarbonate samples (i.e. Capitani, 2019; Conconi et al., 2023a), it has been demonstrated that EDS analysis compares very well with WDS analysis.
Focused-ion-beam (FIB) lamellae were prepared at the Center for Instrument Sharing of the University of Pisa (CISUP) with a ZEISS Crossbeam 550 FIB-SEM instrument. The lamellae were extracted with the lift-out technique (Hyun Jung et al., 2012) from the (001) synchysite surface to have the c* axis on the observation plane at the TEM instrument. Two lamellae were extracted from areas with different element distribution, guided by SEM–EDS maps. In particular, one lamella (thin foil 1, TF01) was extracted halfway between the Ce-rich core and the Y-rich rim of the FCBN5 sample and a second lamella (thin foil 2, TF02) was extracted halfway between the Y-rich rim and the Th-rich outer rim of the same crystal (Appendix A, Fig. A1). The thickness of the lamellae is between approximately 60 and 100 nm.
TEM–EDS analyses were conducted at the PMiB using a JEOL JEM-2100Plus, supplied by a LaB6 source and operated at 200 kV. The instrument is equipped with an Oxford SDD Ultim Max EDS system and a Gatan Rio 9 CMOS camera. The analyses were quantified with the standardless method and corrected for absorption (Conconi et al., 2023b).
At CISUP, 3DED data (Mugnaioli and Gemmi, 2018; Gemmi et al., 2019) were acquired with a JEOL JEM-F200 TEM instrument, operating at 200 kV and equipped with a Schottky FEG, a JEOL SDD EDS detector and an ASI CheeTah hybrid pixel detector (512×512 pixel, 24 bit) for diffraction data acquisition. FIB lamellae were mounted on a tomographic sample holder able to be tilted up to ±65°. The sample was rotated within a maximum angle range of 120°, by constant steps of 1°. After each tilt step, a precession-assisted diffraction pattern was acquired with an exposure time of 0.2 s. Nanobeam electron diffraction (NED) was performed in scanning-transmission electron microscopy (STEM) mode, using the largest probe size (10) and the smallest C2 condenser aperture (10 µm). A parallel beam of about 30 nm in width was obtained by relaxing the C3 lens by the Free Lens Control panel. The precession semi-angle was kept at 1°. Sample tracking was performed in high-angle annular dark-field (HAADF) STEM.
Several data sets were obtained in different areas of the lamellae, with the aim of covering the chemical zoning detected by SEM–EDS. Ab initio structure solutions attempted with the Sir2019 program (Burla et al., 2015) lead to approximate synchysite structures, with heavy atoms at their expected place but lacking some C and O atoms. For this reason, the structure refinement, as well as the SCXRD refinement, was performed using the structure of Wang et al. (1994) as the initial guess. The program Jana2020 (Petříček et al., 2023) was used for dynamical structure refinement. Soft restraints were used for C–O bonds and O–C–O angles. Moreover, CO3 groups were constrained to be planar. Several refinement schemes were attempted for the occupancy of Ca and Ce sites, but satisfactory results were obtained by fixing the Ca content at 0.90 and that of Th at 0.10 in both Ca sites and the Ce content at 0.90 and that of Th at 0.10 in both Ce sites.
3.1 Average structure: single-crystal X-ray diffraction
All four SCXRD structure refinements lead to acceptable and similar results. Relevant experimental and crystallographic data, along with data from Wang et al. (1994) and 3DED data for comparison, are reported in Table 1. While the polytypic disorder posed the primary challenge during structure refinements, additional factors such as chemical zoning, fluid and solid inclusions, and partial metamictization also played a role. Despite these complexities, the refinements provide valuable insights into structural parameters.
According to the chemical analyses, the Ca sites should be occupied entirely by Ca and the Ce sites by REE and Th, since Ca is almost constant and close to its ideal value of 1 a.p.f.u., whereas Ce, La and Nd are directly correlated among themselves and inversely correlated with Y, which in turn is inversely correlated with Th at the outer rim of the crystals. However, from the first refinement cycles, it was clear that the apparent electron density at the Ca sites was higher than expected (∼20 electrons) and that at the Ce sites was larger than expected (∼58 electrons). Therefore, in order to manage the apparent electron density, fictitious Ca vs. Yb and Ca vs. Ce were refined for both Ce sites and both Ca sites, respectively. The refinement converged to similar values for the Ca1 and Ca2 sites and Ce1 and Ce2 sites and led to the values reported in Table 1, namely 30–31 electrons for the Ca sites and 59–65 electrons for the Ce sites. Although these values clearly do not perfectly align with the measured chemical composition, the discrepancy is likely correlated with crystal defects.
Table 1Crystal and SCXRD structure refinement data for the four crystals refined (FCBN1–FCBN4) along with the reference (REF) sample (Wang et al., 1994) and 3DED data (TF01, Ce-rich core, FCBN5).

GooF denotes goodness of fit, which equals , where w is the weight, n the number of reflections and p the total number of parameters refined; ; for all data; R4σ=R1 for Fo>4σ(Fo); Fc denotes calculated structure factors; Fo denotes observed structure factors.
Overall, the four refined crystals are very similar in terms of crystal geometry and are also similar to the reference sample (Table 2), although the latter shows slightly larger cell and longer bond lengths, in particular C1–O, Ca1–O, Ce1–F and Ce2–O bonds, probably due to the different compositions. Indeed, according to Wang et al. (1994), their refined crystal from Mont Saint-Hilaire (Quebec) has the composition Ca0.94Ce0.62La0.32Th0.01Eu0.008Y0.02C1.96O6F0.64, whereas the crystals studied here are core–rim-zoned (Table 3) with average compositions of Ca1.04Ce0.39Nd0.18La0.15Y0.08Pr0.05Sm0.04Gd0.03Th0.04
(CO3)2F0.70 (FCBN2) and Ca1.01Ce0.37Nd0.20Y0.17La0.09Pr0.05Sm0.05
Gd0.03Th0.03 (CO3)2F0.72 (FCBN3). IXCe3+ (ionic radius 1.196 Å) and IXLa3+ (1.216 Å), which are more abundant in the reference sample, have ionic radii larger than IXNd3+ (1.163 Å) and IXY3+ (1.075 Å), which are more abundant in the samples studied here, therefore explaining the difference.
The CO3 bond length distribution is comparable among the four refined structures, but the CO3 polyhedra are slightly more distorted than in the reference structure, with one systematically longer and one systematically shorter distance (Table 2). This difference may be due to the polytypic disorder affecting the samples from Cuasso al Monte, since polytypic disorder mostly involves the shifting of CO3 layers (see ahead).
The Ca1–O bond length distribution is very similar in the four refined structures and also similar to the reference, with one systematically longer, one systematically shorter and two intermediate distances (Table 2). The Ca2–O bond length distribution is also very similar in the four refined structures but differs from the reference, where it is reported as 7-fold coordinated, whereas it is 8-fold coordinated in our structures. However, the average bond length matches perfectly.
The Ce1–O bond length distribution is similar among the four refined structures and similar to the reference, with one systematically shorter distance. The Ce1–F bond distances are all similar within 2 standard deviations for the four refined structures, as they are for the reference, although on average they are slightly longer for the latter. The Ce2–O bond length distribution is similar for the four refined structures and similar to the reference, with two systematically shorter distances. The Ce2–F bonds show one systematically shorter distance, whereas bond distances are all similar in the reference. However, the average values of both Ce1–F and Ce1–O bonds are similar to the average values of the reference.
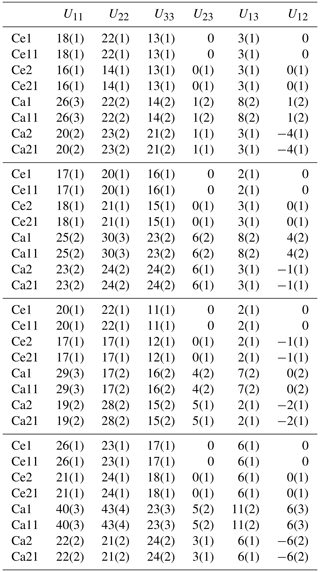
As regards the atomic displacement factors, considering the high level of disorder, all are within normal values for all atomic species in all four refined crystals. Atomic positions and atomic displacement factors are reported in Appendix A (Tables A2 and A3).
Table 2Bond lengths (Å) and angles (°) for the four crystals refined here with SCXRD (FCBN1–FCBN4). For comparison, the structure refinement from 3DED data (TF01, Ce-rich core, FCBN5) and the reference (REF) sample (Wang et al., 1994) are reported.
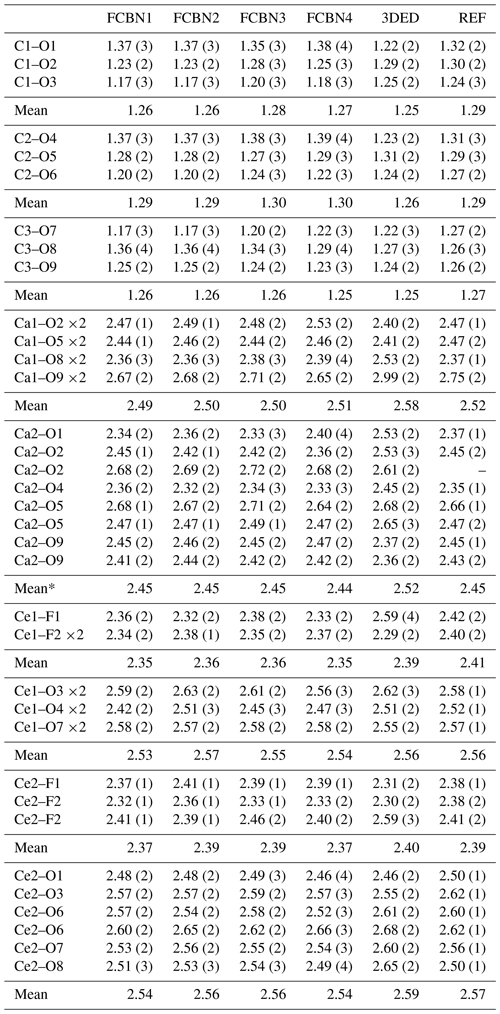
* For comparison with the reference, the average does not consider the longest Ca2–O2 bond distance.
3.2 Microstructure: SEM–EDS and Raman spectroscopy
SEM–EDS analysis of synchysite-(Ce) (Table 3) reveals distinct core–rim chemical zoning, discriminating between three different areas: (i) a core enriched in Ce, La and Nd; (ii) a rim enriched in Y; and (iii) an outer rim enriched in Th (Fig. 2a). Moreover, micro-inclusions of hematite (confirmed by Raman) and thorite (ThSiO4) were detected at the rim. The Ca-content and the ratio are very close to the ideal values for synchysite, i.e. 1.00 a.p.f.u. and 0.50, respectively, suggesting very low polysomatic disorder. The amount of F, significantly below the ideal value of 1 a.p.f.u., is probably due to diffusion of this element under the highly focused electron beam.
Table 3SEM–EDS analysis of CaREE-fluorcarbonate major elements normalized on the basis of two cations (number of averaged spot analyses in brackets) and related standard deviations (SDs).
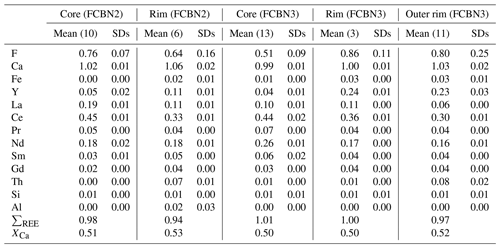
. Analyses with Fe content higher than 0.03 a.p.f.u., especially present at the rim, were interpreted as being contaminated by hematite and were excluded from the average.
Raman identification of CaREE-fluorcarbonate minerals was performed looking at the symmetric stretching vibration of the carbonate group ν1(CO3), since it is diagnostic of the different polysomes of the bastnäsite–synchysite series. Indeed, the number of bands and their height ratios vary according to the content and the resulting type of CO3 layers, i.e. if they are located between two REE layers or between one REE and one CaF layer. The number of bands is one for bastnäsite, two for synchysite and three for intermediate polysomes (Conconi et al., 2023a). The Raman spectra collected show that the ν1(CO3) symmetric stretching vibration has two bands at 1082 and 1099 cm−1, which are indicative of synchysite (Fig. 2c).
It is well known that Raman spectroscopy is sensitive to the degree of metamictization, as demonstrated, for instance, in zircon (Nasdala et al., 1995) and in titanite (Heller et al., 2019). In the case of the CaREE-fluorcarbonates studied, we found that spectra collected along different core–rim transects show differences in the ν1(CO3) stretching vibration. In particular, moving towards the rim, the bands become broader and the relative heights between the two bands also change (Fig. 2f). This evidence, linked to the greater background noise that characterizes the data collected at the rim, suggests a reduction in crystallinity at the rim compared to the core, probably due to metamictic damage caused by α decay of Th.
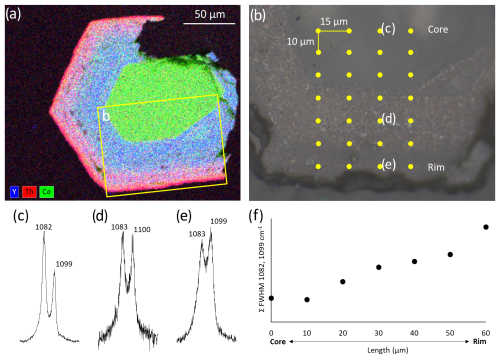
Figure 2Sample FCBN3. (a) SEM–EDS map showing the chemical zoning and the area where Raman analysis was performed (yellow rectangle). (b) Optical micrograph showing the points where Raman spectra were collected. (c, d, e) Raman spectra of the symmetric stretching vibration of the carbonate group ν1(CO3) collected at the centre (Ce-rich part), in the rim (Y-rich part) and in the outer rim (Th-rich part), respectively. Note how bands broaden approaching the rim. Indeed, the sum of the full width at half maximum (FWHM) of the two bands increases from core to rim, suggesting metamictic damage induced by Th decay (f).
3.3 Nanostructure and local structure: TEM and 3DED
TEM observations on FIB lift-out lamellae revealed a complex nanostructure of synchysite-(Ce) crystals. Indeed, stacking faults and solid and fluid inclusions are clearly visible in bright-field (BF) images. Fluid inclusions appear to be aligned along stacking faults and even to be confined within major stacking faults (Fig. 3a, b). On the contrary, solid inclusions, which EDS spectra and selected area diffraction (SAED) patterns identify as hematite, are agglomerates of randomly oriented lamellar precipitates, ∼200 nm in length, that in most cases cross-cut stacking faults and fluid inclusion alignments at right angles and are therefore circa parallel to c*.
SAED patterns of synchysite taken along [130], [−130] and [100] (and Friedel opposites), other than being undistinguishable, are less informative than SAED patterns taken along [110], [−110] and [010]. For this reason, the former are grouped as 〈130〉 type patterns and the second as 〈110〉 type (Capitani, 2019, 2020). The 〈130〉 and 〈110〉 type patterns alternate every 30° rotation around c*. In order to consistently index the diffraction patterns, in the following we assumed the 〈130〉 type pattern to be [100] and the 〈110〉 type to be [110].
The [100] SAED patterns appear perfectly ordered, whereas when rotating the crystal by 30° around c*, the corresponding [110] patterns show hhl rows with h≠3n affected by diffuse streaks (Fig. 3d). The described picture is typical of polytypic disorder (Capitani, 2019, 2020). However, what appears as continuous streaking at short camera lengths, once observed at longer camera lengths (higher magnification), shows a certain regularity in intensity modulation, suggesting a kind of superstructural order with periodicity of ∼93 Å. Not surprisingly, this value is commensurate with the synchysite quarter cell, ∼4.6 Å (∼4.6 Å × 20 ≅ 93 Å), whose diffraction spots appear strengthened in the diffraction pattern (Fig. 3e).
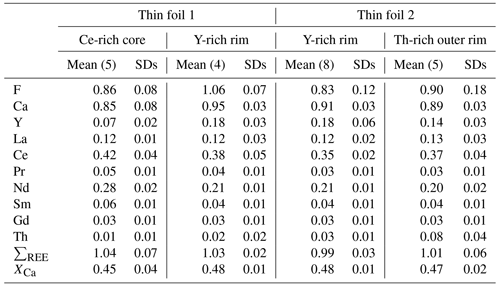
TEM–EDS analyses are reported in Table 4. Although they cannot be directly compared with SEM–EDS analyses because they were acquired in a different crystal (FCBN5) and quantified with a different method (standardless), they confirm the chemical zoning detected by SEM–EDS and the relative REE abundances. The REE sum (up to 1.04 a.p.f.u.) and the ratio (0.45–0.48) are slightly different from the ideal values, 1.00 and 0.50, respectively, but are well within the experimental error in the standardless TEM–EDS analysis (Conconi et al., 2023b), even if an excess of Ca-free, bastnäsite-like lamellae along the long-range sequence cannot be excluded.
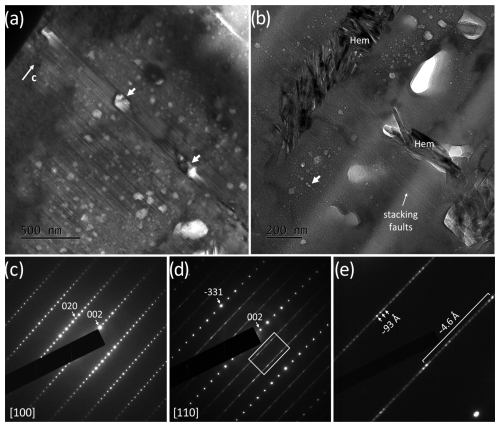
Figure 3Sample FCBN5 (TF01). (a, b) BF images showing stacking faults, fluid inclusions (arrows) and hematite (Hem) nano-crystals. (c, d) SAED pattern seen (c) down [100] and (d) down [110]. Note the streaking along hhl rows with h≠3n, indicating polytypic disorder. At longer camera lengths (higher magnification), what appears as a continuous streak in (d) reveals a supercell periodicity of ∼93 Å (e).
The lower crystallinity of the Th-rich outer rim of synchysite as compared to the innermost Th-poor areas detected by Raman spectroscopy was confirmed by TEM. In Fig. 4, SAED patterns taken along [100] from the Th-rich and Th-poor area are compared. Assuming that beam damage induced by FIB operations and the thickness is constant across the boundary, the observed larger FWHM and lower peak-to-background ratio of the Th-rich area may be attributed to the lower crystallinity of the latter, due to α decay of Th.
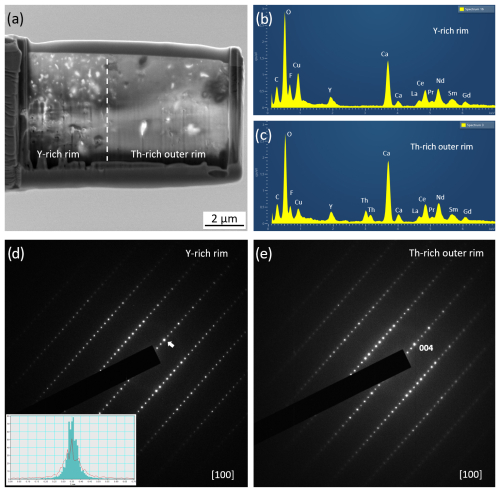
Figure 4Sample FCBN5. (a) Low-magnification TEM image of the thin foil (TF02) extracted halfway between the Y-rich rim and the Th-rich outer rim of the sample. The dashed line approximately indicates the boundary. (b, c) EDS spectra taken (b) from the Y-rich area and (c) from the Th-rich area. (d, e) SAED patterns along [100] taken (d) in the Y-rich area and (e) in the Th-rich area. The inset in (d) shows line scan profiles across the 004 spot: cyan-filled profile from the Y-rich area; red-line profile from the Th-rich area. Note the larger FWHM of the latter and the lower peak-to-background ratio.
Table 4TEM–EDS analysis (a.p.f.u.), normalized on the basis of two cations, of the Ce-rich core, Y-rich rim and Th-rich outer rim of the synchysite sample FCBN5. Standard deviations (SDs) are in brackets.
XCa = .
Ten 3DED data sets were obtained from two lamellae extracted from the FCBN5 sample. The best of these (no. 7, from the Ce-rich core) in terms of Rint and provisional R factors was selected for dynamical structural refinement. Relevant crystallographic and collection data are reported in Table 1 and bond length distances in Table 2, along with data from Wang et al. (1994) and from the SCXRD study for comparison. The general R indices are significantly worse compared to both SCXRD indices from this study and those reported by Wang et al. (1994). Similarly, the bond geometry, obtained by imposing soft restraints for C–O bonds and angles and constraining the CO3 groups to be planar, although still within acceptable limits, is slightly worse (e.g. Ca1–O2 = 2.99(2) Å). The refined 3DED cell parameters and volume are slightly larger than those refined by SCXRD data, even if the difference is well within the possible error affecting TEM data (∼2 %–3 %), unless the latter are acquired without an internal standard (e.g. Capitani et al., 2016). The larger volume resulting from 3DED data (if real) and the much higher (unreliable) electron density refined with SCXRD lead to a density calculated from 3DED data (3.915 g cm−3) that is lower than that for SCXRD data (4.463–4.640 g cm−3) but more closely approaches the expected density.
It is well known that synchysite crystals are often affected by polytypic disorder, as also confirmed by this study. The structure of synchysite can be described as alternating (001) CaCe(CO3)2F half cells (∼9 Å thick each, leading to the ∼18.6 Å c parameter) shifted on (001) along [−1, 1, 0] and [−1, −1, 0] by in a systematic way. The stacking vectors, once projected on the (001) plane, are therefore related by +60 and −60° rotations (Wang et al., 1994; Capitani, 2020). However, shifts along [0, 1, 0] and [−1, −1, 0] (or random ±60° rotations) are also possible, leading to polytypic disorder. The disorder does not affect the Ca and Ce atoms, which maintain their sub-hexagonal symmetry, while C and F atoms remain aligned along c*, although in a random sequence. As for the CO3 groups, these exhibit random in-plane orientations (Fig. 5). This observation may explain the distortion of CO3 polyhedra of the average structure obtained by SCXRD. On the contrary, the high deviation from the expected values of the electron density at Ca and Ce sites cannot be easily explained, except by invoking an indirect effect of the polytypic disorder and other defects on the overall data quality and consequently on the site occupancy.
In addition to polytypic disorder, the studied synchysite crystals show other types of microstructural defects and inhomogeneities, such as chemical zoning, hematite inclusions and fluid inclusions. Chemical zoning, other than involving local differences in the scattering power and X-ray absorption, also causes partial metamictization of the structure in the case of high Th concentration, as demonstrated by Raman spectroscopy and SAED, leading to inelastic scattering. Similarly, solid and fluid inclusions contribute to local differences in the scattering and absorption of X-rays and, as regards the latter, to inelastic scattering. All together, these defects negatively affect the peak-to-background ratio, the reliability of the measured intensities and the overall data quality. Considering that the studied crystal is far from ideal, the structural refinements obtained are surprisingly good and may contribute to the limited crystal structure database for CaREE-fluorcarbonates.
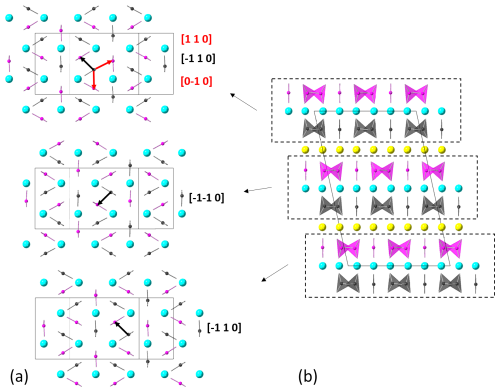
Figure 5Structure of synchysite as seen along [001]* (a) and along [010] (b). Diagrams in (a) correspond to the dashed portions in (b). Operating stacking vectors in ordered synchysite that relate the shift of one layer with respect to the next are indicated in black; additional allowed stacking vectors operating in disordered synchysite are in red (grey and violet: CO3 polyhedra; sky blue: Ca; yellow: Ce; F atoms are omitted for clarity).
In the red porphyry of Cuasso al Monte are present a variety of CaREE-fluorcarbonates with different morphologies and compositions, including the synchysite-(Ce) hexagonal prisms studied here. These minerals formed from a hydrothermal fluid fractionating upon cooling (Conconi et al., 2025). The microstructure detected in this study provides more clues about the crystal growth conditions of synchysite-(Ce) from Cuasso al Monte.
What appears to be a polytypic disordered structure at first glance might actually be a superstructure with ∼93 Å (∼4.6 Å ×20) periodicity. If this is the case, it cannot have a thermodynamic stability field and must have formed through a screw dislocation mechanism, as suggested, for instance, for long-range polytypes of mica (Pandey et al., 1982) and moissanite (Pandey and Krishna, 1975).
The growth by screw dislocation, however, is not fully consistent with the observed core–rim zoning (Figs. 1 and 2). A disordered sequence along the c axis may form as a consequence of the fast kinetics and is made periodic by a screw mechanism. Assuming that the screw dislocation affected the whole crystal and the crystal grew by the screw mechanism along the c axis, any change in the fluid composition during growth would have been recorded along the c axis, not radially to it. Therefore, we tentatively suggest that the screw mechanism affected the core of the crystal and that the rim grew in a second stage, epitaxially, under changed Y-richer fluid composition. This hypothesis seems sustained by the TEM observation of fluid inclusions concentrated at the rim of the crystals (Fig. 3), suggesting that the later stages of crystallization were from a more diluted aqueous solution enriched in Y. The gradual increase in Th towards the outer rim of the crystal, instead, seems compatible with solid-state diffusion after crystallization (Jessell, 2004), which therefore would represent a third stage. Finally, hematite inclusions cross-cut polytypic faults, suggesting that they filled voids or later fractures formed after crystallization (fourth stage). Hematite is recurrent in the mineralization of the Cuasso al Monte granophyre. It has also been found as nanoparticles along with phyllosilicates and bastnäsite-(Nd) forming “rosette-like” aggregates (Conconi et al., 2025), and hematite inclusions are believed to be the cause of the pink-reddish colour of K-feldspar (Putnis et al., 2007). Moreover, an Fe3+-rich phase, chamosite, occurs in the same miarolitic cavities where CaREE-fluorcarbonates are also found. Therefore, iron-rich fluids characterized the late crystallization events at Cuasso al Monte and may have also interacted with synchysite-(Ce).
The reliability of electron diffraction intensities may be partially compromised by dynamical effects and the excitation error (i.e. reflections that are measured out of their exact Bragg conditions), which lead to underestimated intensities. However, these problems are mostly mitigated by precession and dynamical refinement (Palatinus et al., 2015; Gemmi and Lanza, 2019). For synchysite-(Ce), 3DED data refinement converged to a reasonable model only after the CO3 geometry was restrained and constrained, and even in this case we observed at least one unreliable value for Ca–O distances. The model obtained by SCXRD data appears more reliable than the one obtained with 3DED data, in terms of both R indices and bond geometry. However, other reasons should be considered. First of all, diffuse scattering is very strong even in electron diffraction data, showing that defects, in particular stacking faults, occur at a nanometre scale, as confirmed by BF images. In this case, a few defects may have an enormous impact on diffraction data coming from nm3 of material (Mugnaioli and Gorelik, 2019). Moreover, synchysite contains heavy elements, such as lanthanides and actinides mixed with light elements such as carbon and oxygen, which may lead to uncompensated absorption phenomena. Indeed, 3DED data reduction does not include absorption correction because the thickness of the sample is so thin that absorption is generally considered negligible. This may not be the case for FIB lamellae, where the thickness increases significantly at high tilt angles.
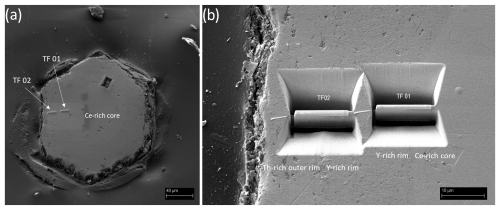
Figure A1(a) Secondary electron SEM image of sample FCBN5 showing the Pt strips deposited on the sites were the two thin foils were extracted. A third one, at the centre top of the hexagonal prism, were lost. (b) The two lamellae seen at higher magnification after FIB excavation and before extraction.
Table A2Atomic coordinates (×104) and equivalent isotropic displacement parameters (Å2×10³) for (from top to bottom) samples FCBN1 to FCBN4. Ueq is defined as one-third of the trace of the orthogonalized Uij tensor.
The FCF files of the crystal structures studied here are available upon request.
GC supervised and conceptualized the work; GC, RC, PF, MM, EM and LF prepared the samples and performed the analyses; GC and RC prepared the manuscript with contributions from all co-authors.
The contact author has declared that none of the authors has any competing interests.
Publisher's note: Copernicus Publications remains neutral with regard to jurisdictional claims made in the text, published maps, institutional affiliations, or any other geographical representation in this paper. While Copernicus Publications makes every effort to include appropriate place names, the final responsibility lies with the authors.
This article is part of the special issue “Celebrating the outstanding contribution of Paola Bonazzi to mineralogy”. It is not associated with a conference.
Michele Alderighi and Gabriele Paoli (both from CISUP) are acknowledged for support with the JOEL JEM-F200 and ZEISS Crossbeam 550 FIB-SEM instruments, respectively. Paolo Gentile provided the red porphyry samples and guided us in Cuasso al Monte field trips. Suggestions and comments from the associate editor, Bernard Grobéty and the anonymous reviewer helped to improve the manuscript.
This research has been supported by the University of Milano-Bicocca 2022-ATEQC-0016 grant “Carbon REE-cycle” to Giancarlo Capitan. The PMiB has been co-funded by “Dipartimenti di Eccellenza” 2018–2023 and 2023–2027.
This paper was edited by Marco Pasero and reviewed by Bernard Grobéty and one anonymous referee.
Bakos, F., Del Moro, A., and Visonà, D.: The Hercynian volcano-plutonic association of Ganna (Lake Lugano, Central Southern Alps, Italy), Eur. J. Mineral., 2, 373–383, https://doi.org/10.1127/ejm/2/3/0373, 1990.
Burla, M. C., Caliandro. R., Carrozzini, B., Cascarano, G. L., Cuocci, C., Giacovazzo, C., Mallamo, M., Mazzone, A., and Polidori, G.: Crystal structure determination and refinement via SIR2014, J. Appl. Crystallog., 48, 306–309, https://doi.org/10.1107/S1600576715001132, 2015.
Capitani, G.: HRTEM investigation of bastnaesite–parisite intergrowths from Mount Malosa (Malawi): Ordered sequences, polysomatic faults, polytypic disorder, and a new parisite-(Ce) polymorph, Eur. J. Mineral., 31, 429-442, https://doi.org/10.1127/ejm/2019/0031-2824, 2019.
Capitani, G.: Synchysite-(Ce) from Cinquevalli (Trento, Italy): Stacking Disorder and the Polytypism of (Ca,REE)-Fluorcarbonates, Minerals, 10, 77, https://doi.org/10.3390/min10010077, 2020.
Capitani, G., Mugnaioli, E., and Guastoni, A.: What is the actual structure of samarskite-(Y)? A TEM investigation of metamict samarskite from the garnet codera dike pegmatite (Central Italian Alps), Am. Mineral., 101, 1679–1690, https://doi.org/10.2138/am-2016-5605, 2016.
Capitani, G., Mugnaioli, E., and Gentile, P.: Submicrometer yttrian zircon coating and arborescent aeschynite microcrystals on truncated bipyramidal anatase: An electron microscopy study of miarolitic cavities in the Cuasso al Monte granophyre (Varese, Italy), Am. Mineral, 103, 480–488, https://doi.org/10.2138/am-2018-6242, 2018.
Conconi, R., Fumagalli, P., and Capitani, G.: A multi-methodological study of the bastnäsite-synchysite polysomatic series: Tips and tricks of polysome identification and the origin of syntactic intergrowths, Am. Mineral., 108, 1658–1668, https://doi.org/10.2138/am-2022-8678, 2023a.
Conconi, R., Ventruti, G., Nieto, F., and Capitani, G.: TEM-EDS microanalysis: Comparison among the standardless, Cliff & Lorimer and absorption correction quantification methods, Ultramicroscopy, 254, 113845, https://doi.org/10.1016/j.ultramic.2023.113845, 2023b.
Conconi, R., Gentile, P., Fumagalli, P., Nieto, F., and Capitani, G.: CaREE-fluorcarbonates: A variety of morphologies, compositions and nanostructures with insights into REE partitioning and mobility, Lithos, 504–505, 108033, https://doi.org/10.1016/j.lithos.2025.108033, 2025.
Donnay, G. and Donnay, J. D. H.: The crystallography of bastnaesite-(Ce), parisite-(Ce), roentgenite-(Ce) and synchisite-(Ce), Am. Mineral., 38, 932–963, 1953.
Gemmi, M. and Lanza, A. E.: 3D electron diffraction techniques, Acta Crystallogr. B, 75, 495–504, https://doi.org/10.1107/S2052520619007510, 2019.
Gemmi, M., Mugnaioli, E., Gorelik, T. E., Kolb, U., Palatinus, L., Boullay, P., Hovmöller, S., and Abrahams J. P.: 3D Electron Diffraction: The Nanocrystallography Revolution, ACS Central Science, 5, 1315–1329, https://doi.org/10.1021/acscentsci.9b00394, 2019.
Grice, J. D., Maisonneuve, V., and Leblanc, M.: Natural and synthetic fluoride carbonates, Chem. Rev., 107, 114–132, https://doi.org/10.1021/cr050062d, 2007.
Heller, B., Lünsdorf, N., Dunkl, I., Molnár, F., and Eynatten, H.: Estimation of radiation damage in titanites using Raman spectroscopy, Am. Mineral., 104, 857–868, https://doi.org/10.2138/am-2019-6681, 2019.
Hyun Jung, K., Sang, H. C., Hung-Bin, B., and Tae Woo, L.: Transmission Electron Microscopy (TEM) Sample Preparation of Si1-XGex in c-Plane Sapphire Substrate, NASA Tech. Memo, NASA/TM 2012–217597, https://ntrs.nasa.gov/citations/20120013304 (last access: 24 March 2023), 2012.
Jessell, M.: Geometries of Mineral Zonation, the Characteristic Geometries of Mineral Zonation, in: Numerical Modeling of Microstructures, edited by: Köhn, D. and Malthe-Sørenssen, A., Journal of the Virtual Explorer, Electronic Edition, vol. 15, paper 3, 2004.
Mugnaioli, E. and Gemmi, M.: Single-crystal analysis of nanodomains by electron diffraction tomography: mineralogy at the order-disorder borderline, Z. Kristallogr.-Cryst. Mater., 233, 163–178, https://doi.org/10.1515/zkri-2017-2130, 2018.
Mugnaioli, E. and Gorelik, T. E.: Structure analysis of materials at the order-disorder borderline using three-dimensional electron diffraction, Acta Crystallogr. B, 75, 550–563, https://doi.org/10.1107/S2052520619007339, 2019.
Nasdala, L., Irmer, G., and Wolf, D.: The degree of metamictization in Zircons: a Raman spectroscopic study, Eur. J. Mineral., 7, 471–478, https://doi.org/10.1127/ejm/7/3/0471, 1995.
Newbury, D. E. and Ritchie, N. W. M.: Performing elemental microanalysis with high accuracy and high precision by scanning electron microscopy/silicon drift detector energy-dispersive X-ray spectrometry (SEM/SDD-EDS), J. Mater. Sci., 50, 493–518, https://doi.org/10.1007/s10853-014-8685-2, 2015.
Newbury, D. E. and Ritchie, N. W. M.: Electron-Excited X-ray Microanalysis by Energy Dispersive Spectrometry at 50: Analytical Accuracy, Precision, Trace Sensitivity, and Quantitative Compositional Mapping, Microsc. Microanal., 25, 1075–1105, https://doi.org/10.1017/S143192761901482X, 2019.
Ni, Y., Hughes, J. M., and Mariano, A, N.: The atomic arrangement of bastnasite-(Ce), Ce(CO3)F, and structural elements of synchysite-(Ce), rontgenite-(Ce), and parisite-(Ce), Am. Mineral., 78, 415–418, 1993.
Ni, Y., Post, J. E., and Hughes, J. M.: The crystal structure of parisite-(Ce), Am. Mineral., 85, 251–258, https://doi.org/10.2138/am-2000-0126, 2000.
Palatinus, L., Petríček, V., and Correâ, C. A.: Structure refinement using precession electron diffraction tomography and dynamical diffraction: theory and implementation, Acta Crystallogr. A, 71, 235–244, https://doi.org/10.1107/S2053273315001266, 2015.
Pandey, D. and Krishna, P.: Influence of stacking faults on the growth of polytype structures. II – Silicon carbide polytypes, Philos. Mag., 31, 1133–1148, https://doi.org/10.1080/00318087508226832, 1975.
Pandey, D., Krishna, P., Baronnet, A., and Krishna, P.: Influence of Stacking Faults on the Spiral Growth of Polytype Structures in Mica, Phys. Chem. Miner., 8, 268–278, https://doi.org/10.1007/BF00308248, 1982.
Petříček, V., Palatinus, L., Plášil, J., and Dušek, M.: Jana2020 – a new version of the crystallographic computing system Jana, Z. Kristallogr.-Cryst. Mater., 238, 271–282, https://doi.org/10.1515/zkri-2023-0005, 2023.
Pinarelli, L., Del Moro, A., Boriani, A., and Caironi, V.: Sr, Ni, isotope evidence for an enriched mantle component in the origins of the Hercynian gabbro-granite series of the “Serie dei Laghi” (Southern Alps, NW Italy), Eur. J. Mineral., 14, 403–415, https://doi.org/10.1127/0935-1221/2002/0014-0403, 2002.
Putnis, A., Hinrichs, R., Putnis, C. V., Golla-Schindler, U., and Collins, L. G.: Hematite in porous red-clouded feldspars: Evidence of large-scale crustal fluid–rock interaction, Lithos, 95, 10–18, https://doi.org/10.1016/j.lithos.2006.07.004, 2007.
Rigaku Oxford Diffraction: CrysAlisPro, version 1.171.38.46, Rigaku Corporation, Oxford, UK, 2018.
Sheldrick, G. M.: Crystal structure refinement with SHELXL, Acta Crystallogr. C, 71, 3–8, https://doi.org/10.1107/S2053229614024218, 2015.
Wang, L., Ni, Y., Hughes, J.M., Bayliss, P., and Drexler, J. W.: The atomic arrangement of synchysite-(Ce), Can. Mineral., 32, 865–871, 1994.


