the Creative Commons Attribution 4.0 License.
the Creative Commons Attribution 4.0 License.
 | 18 Sep 2024
Mineralogical characterization of magnesium-based nanoparticles recovered from a swirl-stabilized magnesium flame by analytical and scanning/transmission electron microscopy
Ruggero Vigliaturo
Giulia Pia Servetto
Erica Bittarello
Quentin Wehrung
Jean-François Brilhac
Gwenaëlle Trouvé
The current climate emergency and the related energy transition require the development of technology producing zero-carbon energy. One viable option entails the utilization of recyclable metal fuels. The primary energy stored by the reduction in metal oxides can be transported and later released by metal combustion. Mg is among the most promising metal as a regenerable energetic vector, having an energy density of 25 MJ kg−1. The exploitation of the Mg oxidation and reduction loop has recently been demonstrated, and the loop combustion products are made of metal oxides. The mineralogical characterization of the MgO crystals generated by the Mg combustion is of utter importance for the optimization of the particle trapping capacity in the combustion system during the closed oxidation and reduction loop. In this paper we characterize MgO particles generated in a swirl-stabilized Mg flame by using powder X-ray diffraction, transmission electron microscopy and selected area electron diffraction, and atomic-resolution microscopy combined with energy-dispersive X-ray spectroscopy and dual-electron energy-loss spectroscopy. The MgO combustion products were chemically homogeneous at this level of investigation. Three representative morphologies (cubic, truncated octahedron, and spherical) and two isostructural phases were identified in the MgO combustion product. These findings may contribute to the optimization of system development, particularly in terms of the collection efficiency of the combustion end product.
- Article
(8881 KB) - Full-text XML
-
Supplement
(998 KB) - BibTeX
- EndNote


The current climate emergency requires the development of new ways of producing zero-carbon energy. Various approaches are possible in this context (nuclear, biomass, sustainable alternative fuels, etc.), and the use of primary energy sources (solar, wind) is one of the preferred options. However, the intermittency of these energies requires the development of energy storage (Bergthorson, 2018). In this context, the adoption of recyclable metal fuels emerges as a highly promising approach (Bergthorson et al., 2015). Indeed, primary energy can be stored by the reduction in metal oxides by electrolysis (Beck, 2013; Lee et al., 2021) or by solar carbo-reduction (Berro and Balat-Pichelin, 2022). The primary energy stored can then be transported and released through metal combustion. This oxidation–reduction loop, if fully closed, allows the metals to be used for the storage and transportation of primary energy. Metals can thus be regarded as regenerable fuels and new energetic vectors. Al, Fe, and Mg are among the most promising metals for regenerable energetic vectors. The energy density of Mg is close to that of conventional fossil fuels: 43 MJ L−1 for Mg in comparison with 38.6 MJ L−1 for diesel fuel (Bergthorson et al., 2015). Furthermore, Mg is abundant in the Earth's crust, but it has nonetheless been listed as a critical metal by the EU since 2011 (European Commission, 2011). In 2020, global magnesite mine production was about 28 million metric tons (U.S. Geological Survey, 2021; Karimi and Brouwers, 2023), and the magnesia production industry has an expected growth of 5% when comparing the 2021 data to the 2031 projections (Karimi and Brouwers, 2023; Future Market Insights, 2021). For instance, Mg can be obtained from minerals such as magnesite (MgCO3) and dolomite ((Mg,Ca)CO3), which represent 2 wt % of the Earth's crust, or by Mg chloride (MgCl2), which represents 0.1 wt % in seawater. Extraction of Mg from MgCO3–CaCO3 is performed by thermal reduction (the Pidgeon process). The energy penalty for this process is high, at 133 MJ kg, and it produces 25 kg kg. From MgCl2, Mg is extracted by electrolysis (100 MJ kg and 18 kg kg). Solar carbo-reduction in MgO allows for the reduction in the CO2 penalty (Puig and Balat-Pichelin, 2016). Recent studies have demonstrated the feasibility of such an oxidation and reduction loop (Halter et al., 2023) with Al and Mg. The combustion products are metal oxides in solid form. The particles of the produced metal oxide are composed of spherical or cubic crystals whose size varies from a few nanometers to a few hundred nanometers (Lomba et al., 2016; Laraqui et al, 2020; Andrieu et al., 2023). All the metal oxides formed have to be trapped in the combustion system to have a completely closed oxidation and reduction loop. The particles emitted from Mg combustion are in the form of aggregates of Mg-based crystals (Laraqui et al., 2020; Andrieu et al., 2023). To optimize the particle trapping capacity, it is necessary to characterize the MgO crystals to understand their formation mechanism and their growth. The research work presented in this paper aims to characterize the Mg-based crystals produced by the combustion of Mg in a pilot burner using optical microscopy (OM), powder X-ray diffraction (PXRD), transmission electron microscopy (TEM) combined with selected area electron diffraction (SAED), and atomic-resolution microscopy (ARM) combined with dual-electron energy-loss spectroscopy (dual-EELS) and energy-dispersive X-ray spectroscopy (EDXS).
2.1 Pilot system and sample collection
The MgO sample characterized through this investigation was collected in the pilot device presented in previous studies (Laraqui et al., 2020; Andrieu, 2022) and is depicted in Fig. 1.
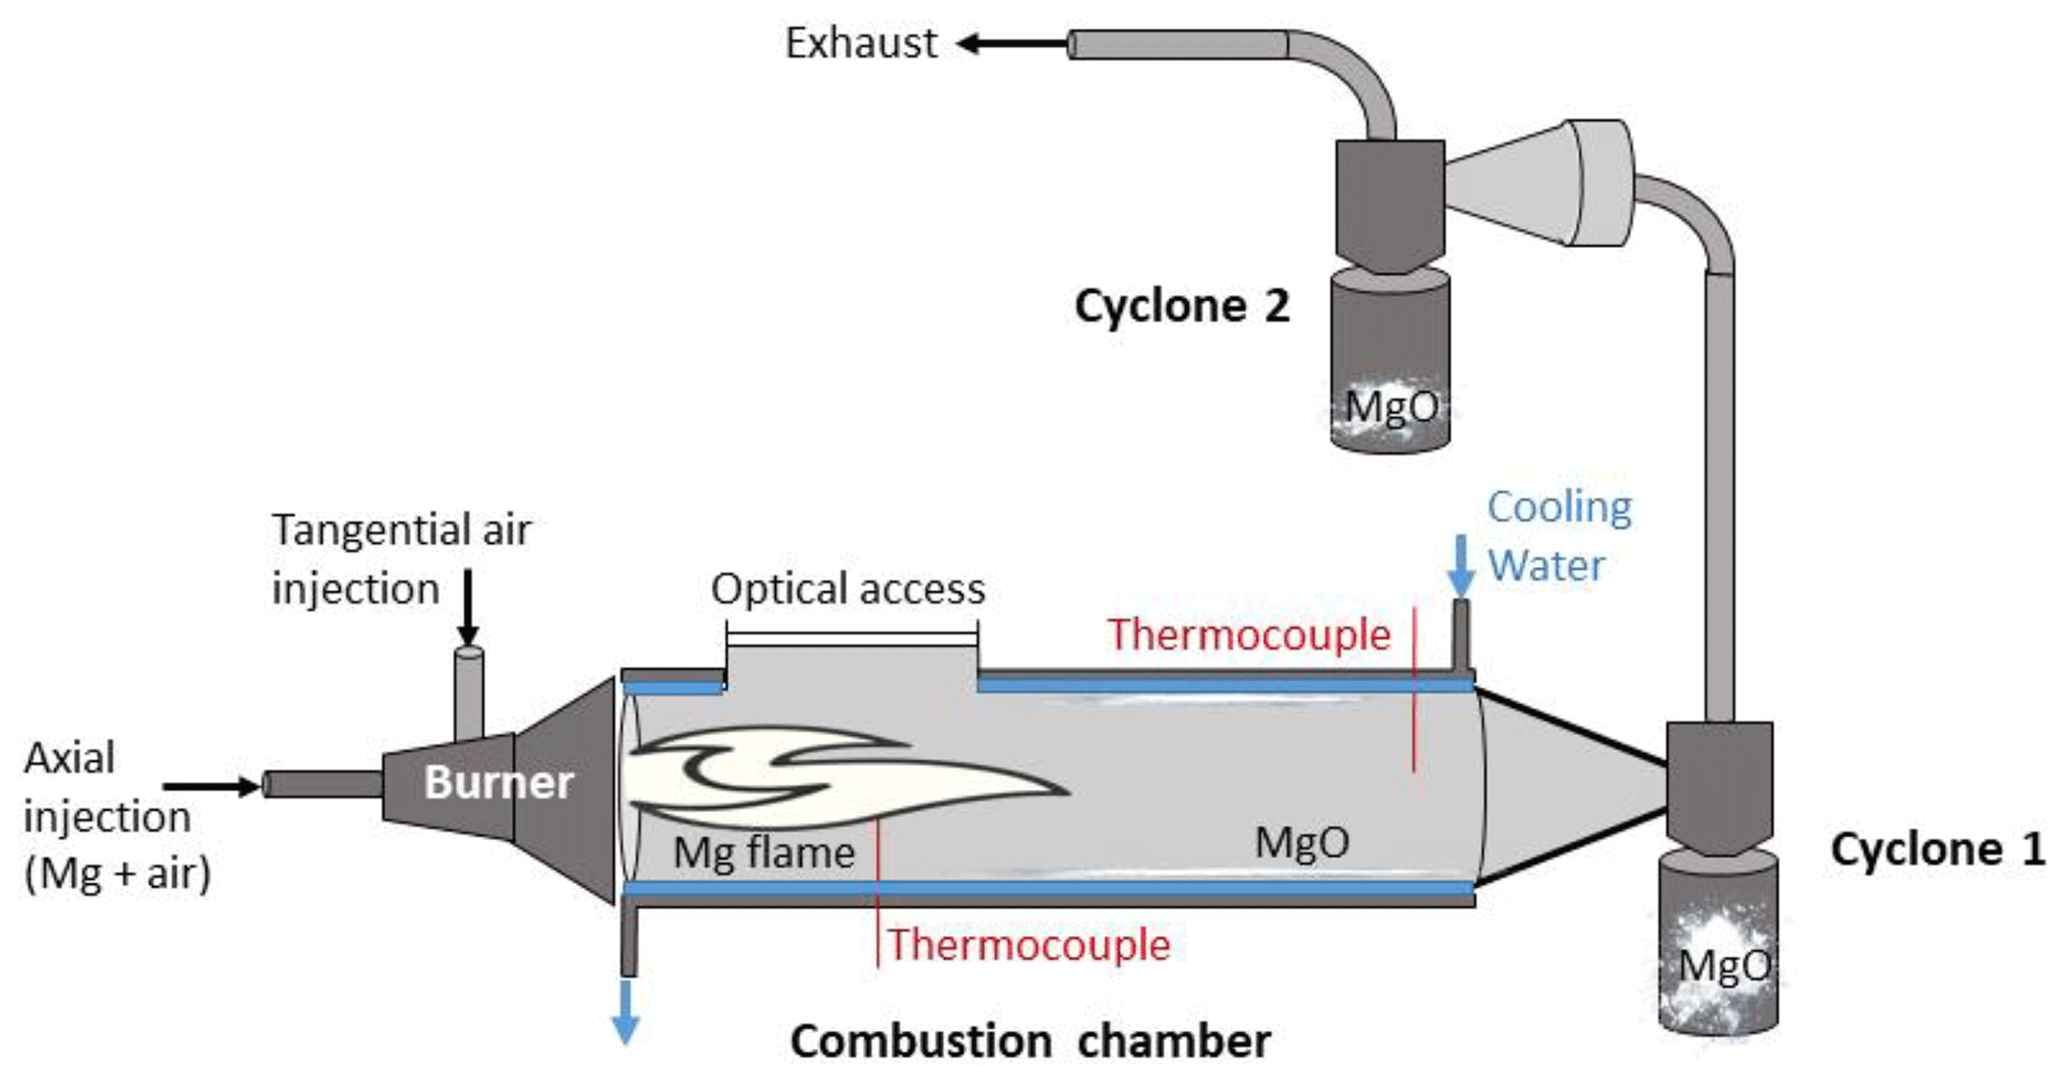
It is a combustion system that allows for the investigation of heat generation from a swirl-stabilized metal flame of Mg, with a trapping system for the combustion products in cyclones. The pilot device is composed of four parts. The burner is a key part of the system. The air/Mg aerosol is generated with a BEG 1000 (Palas) and is injected through the primary line of the burner. The secondary injection is tangential in order to promote a swirled flow inside the combustion chamber. The overall volume of the combustion chamber is 5 L. The combustion chamber is water-cooled to reduce heating of the wall of the chamber and to obtain an energy balance of the system (Laraqui et al., 2020). At the chamber outflow, two cyclones placed in series allow us to trap the magnesia particles which are not trapped in the combustion chamber.
The metallic fuel used was a commercial Mg powder (reference CP 20.2 provided by Carl Roth) sieved to a size of 50–70 µm. A total airflow rate of 8.6 Nm3 h−1 was injected through a primary axial flow (3.6 Nm3 h−1) and a secondary swirled flow (5 Nm3 h−1). The geometric swirl number was equal to 7.3. The global equivalence ratio of the Mg/air mixture was 0.6. The experiments were performed at atmospheric pressure. The overpressure in the combustion chamber was always lower than 20 mbar.
The gas temperature, measured at different locations on the axis of the cylindrical combustion chamber, ranged from 1200 to 1280 °C in the flame area and decreased to 780 °C at the chamber outflow (Andrieu et al., 2022). When injected, the Mg particles are rapidly heated by the high radiation of the metal flame and then quickly vaporized, as the Mg melting temperature is low (1093 °C) compared to the flame temperature in the combustion chamber. Indeed, the theoretical flame temperature is equal to 3157 °C, which is the MgO vaporization temperature (Glassman and Yetter, 2008). MgO is therefore produced in the gas phase from the oxidation of Mg. MgO then recondenses very quickly in a solid state because its vaporization temperature is higher than the temperature of the combustion products (2027 °C), as previously measured in the flame area using a bi-color infrared pyrometer (Andrieu et al., 2023).
The MgO trapping device was composed of two cyclones placed in series at the exit of the combustion chamber. The cut-off diameter of the cyclones is approximately 1 µm. Up to 93 % of the mass of MgO generated by the combustion of Mg was trapped in the collection system (Andrieu, 2022). The sample of MgO used for the present investigation was collected inside the second cyclone. The gas temperature at the inlet of this cyclone was approximately 400 °C. From a macroscopic point of view, one can observe that MgO particles trapped in the cyclone are particles that form aggregates. The current study is focused on the micro- and nanoscale particles that form the observed aggregates. More information about the macroscale level is given by Laraqui et al. (2020).
2.2 Optical microscopy
A series of pictures at various magnifications were collected with an optical microscope (Optika, Bergamo, Italy) equipped with an Optikam B10 digital camera to get a general idea of the sample appearance (see Supplement S1).
2.3 Powder X-ray diffraction
The PXRD data were collected on the sample using a MiniFlex 600 diffractometer (Rigaku) equipped with a Cu–Kα1 radiation source (λ=1.54055 Å, 40 mA, 45 kV), fixed divergence slits, and a multistrip D/teX Ultra detector with a resolution of <200 eV. A divergent-slit width of 2 mm and a scatter-slit width of 4 mm were used for the incoming beam, whereas a receiving-slit width of 0.5 mm and scatter-slit width of 0.2 mm were used for the diffracted beam. The data were collected on the sample in step-scan mode in the 3–70° 2θ range, with a step size of 0.02° 2θ and a counting time of 2 s per step.
2.4 SEM-EDXS
A SEM Tescan Vega3 was used for a preliminary observation of the sample and to confirm the sample chemistry. The investigation was conducted under high-vacuum conditions and at a voltage of 15 keV. The microscope was equipped with an energy-dispersion X-ray detector (EDXS) Xplore 15 (Oxford, Abingdon, UK) managed by AZtecONE software. The MgO powder was transferred onto a carbon tape attached to an Al stub (Media System Technologies) (see Supplement Sect. S2).
2.5 TEM and ARM sample preparation and analytical setup
The received sample was suspended in 2-propanol and thoroughly shaken. Meanwhile, a 200-mesh TEM lace carbon copper grid was positioned within inverted tweezers to allow for the collection of all the material suspended within the 2-propanol droplet. A pipette was used to transfer a droplet of the suspension onto the TEM grid. Once transferred, the droplet was left to dry before mounting the grid on the TEM holder. The sample preparation was identical for the TEM and ARM observations. The TEM grid used for ARM observations was used together with a Be ring to improve the sample stability.
The preliminary observation of the sample was conducted using a CM12 TEM working at 120 kV and equipped with an EDXS detector. The goal of this preliminary analysis was to study the particle morphometry and obtain initial information on its chemistry, crystallography, and degree of crystallinity. The images (both bright-field micrographs and SAED) were collected on photographic film exposed to the beam within the CM12 TEM and then developed and fixed in a dark room, scanned, and digitalized for further data elaboration and measuring.
The following nanoscale and chemical investigations were conducted using an aberration-corrected scanning/transmission electron microscope (acSTEM), the ARM200CF model equipped with a high-brightness cold-field emission gun (CFEG) operating at 80 kV, an energy-dispersive X-ray spectroscopy (EDXS) system (Centurio 100 mm2, JEOL), and an energy filter (GIF Quantum, Gatan, USA). The recording of dual-range EELS spectra was performed with a collection semi-angle of 60.39 mrad, a convergence semi-angle of 24.00 mrad, and using an aperture of 5 mm. The collection of EELS spectra in the region of interest (ROI) was performed in dual mode with a dispersion of 0.25 eV per channel. Both the low-loss region and the core-loss region (including the O K edge and Mg K edge) were recorded by summing up three frames, allowing for an initial screening of the energy-loss near-edge structures (ELNESs) for the possible presence of artifacts due to the exposure of the sample to the electron beam (e.g., the eventual O pre-peak height increase or decrease and eventual disappearance) (Vigliaturo et al., 2019). Each frame of the low-loss region was recorded over a period of 0.001 s, whereas each frame of the core-loss regions (including for both the O K edge and the Mg K edge) was recorded over a period of 30 s. The HQ dark correction was applied to reduce the noise originating when working with summed spectra.
2.6 Particle sizes, shapes, and modeling
The particle sizes recorded at the ARM were measured with ImageJ software with Fiji distribution (Schindelin et al., 2012) using a polygon selection and launching the “measure” command to obtain several dimensional parameters. Among these parameters, area, perimeter, width, height, and circularity (a circularity equal to 1 corresponds to a perfect circle) were selected as the most relevant parameters for describing the dimension and the shape of the particles. Starting from these measurements, the size swh (Eq. 1), sa (Eq. 2), and the Dev (Eq. 3) (equivalent volume diameter) were calculated according to the following equations:
The parameter swh is reliable for perfect rectangular-shaped particles, but, more generally, the sa parameter can be used as a relevant size for particles with different shapes, since it is not dependent on the 2-D particle shape (Kouropis-Agalou et al., 2014; O'Shea et al., 2021). The parameter sa does not depend on the particle shapes but only on the particle area, and it is a mono-dimensional descriptor of the projected area of the particle (Kouropis-Agalou et al., 2014; Vigliaturo et al., 2019). The calculated Dev was used to determine the dimensional distribution of the particle population and to assign the particles to a certain particulate matter (PM) category. The use of Dev was chosen over the use of the geometric diameter, since the latter is strongly dependent on the particle orientation with respect to the airflow (CEN, 1992; ICRP, 1994; ISO, 1995; Sturm, 2009).
The particle shape simulations were performed using Vesta software (Momma and Izumi, 2011), starting from the images recorded with the ARM in both TEM and STEM modes. The models obtained with the software (Vesta) were also used to assist in interpreting SAED patterns, inverse fast Fourier transform (IFFT) images, and high-resolution (HR) TEM images (ARM200CF).
2.7 BET surface area
Specific surface area (SSA) analysis was performed using a Micromeritics ASAP 2020 instrument employing the Brunauer–Emmett–Teller (BET) method with N2 adsorption at −196 °C. Prior to the measurement, samples underwent degassing at 150 °C for 240 min.
3.1 Powder X-ray diffraction
The PXRD spectrum highlighted the presence of two structures with different cell parameters but both corresponding to periclase (Fig. 2). The first detected phase (green arrows in Fig. 2) corresponds to the 00-900-7059 card of the Crystallography Open Database (COD) (Merli et al., 2002). The second detected phase (blue arrows in Fig. 2) corresponds to the 00-901-3250 card of the COD (Jacobsen et al., 2008).
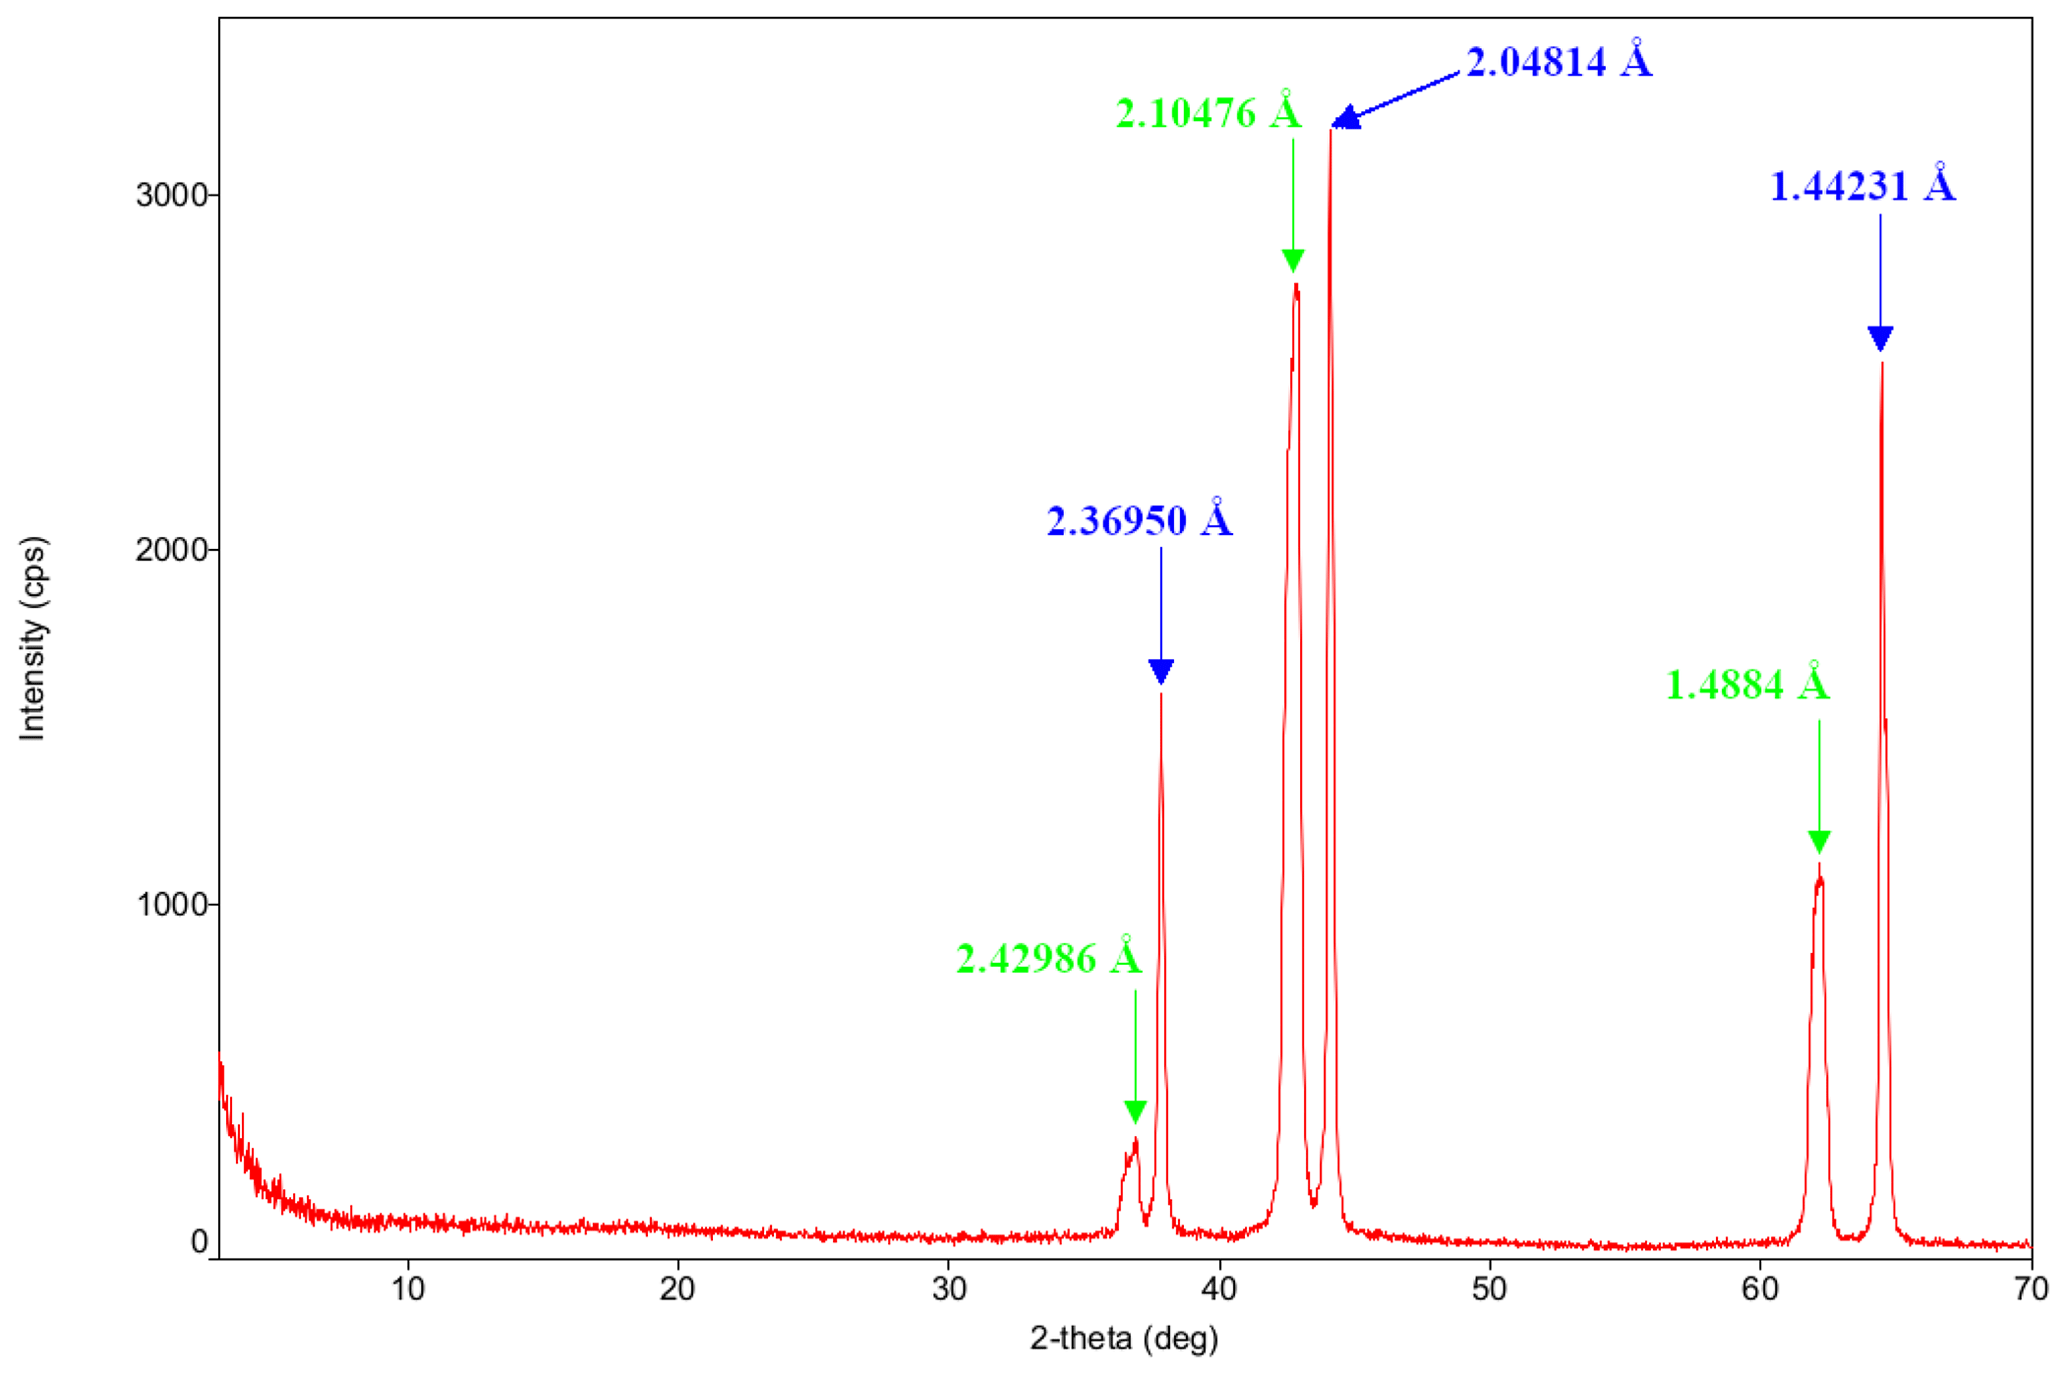
Figure 2PXRD spectrum of the MgO particles. The green arrows indicate the peaks corresponding to Merli et al. (2002), while the blue arrows indicate the peaks corresponding to Jacobsen et al. (2008).
3.2 Preliminary TEM investigation: dimensional features and morphology
The dimensional parameters of the measured MgO particles are summarized in Table 1 (see “Data availability” section; Vigliaturo et al., 2024). Many particles appear to form aggregates with Dev ranging from 424.77 to 4906.38 nm (Table 1). The dimensional distribution of single MgO particles was calculated using Dev. The individual particles were all classified as PM1, while particle aggregates were assigned to different PM categories, namely 14 aggregates to PM1, 4 aggregates to PM2.5, and 1 aggregate to PM10 (see “Data availability” section; Vigliaturo et al., 2024).
Table 1Summary of the descriptive statistics of Mg-based particles and aggregates observed at the TEM (n=400 for single particles and n=19 for agglomerates).
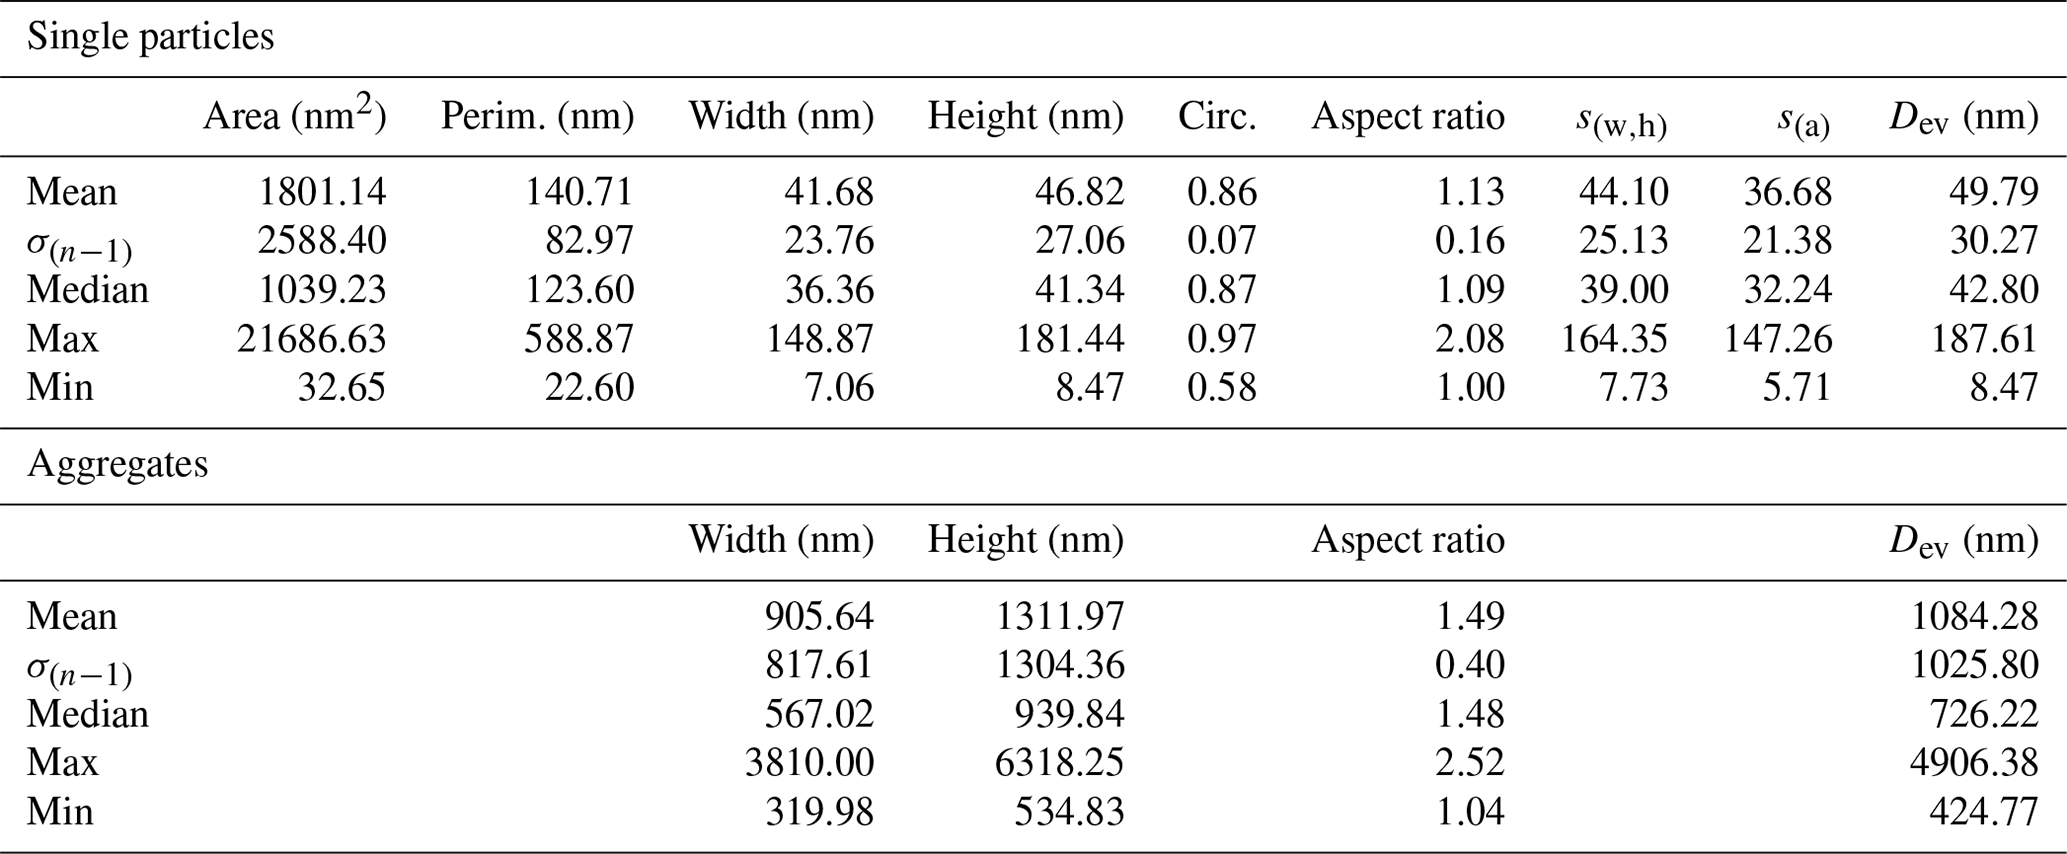
Most of the detected particles had a projected shape that was categorized as squared rectangular, hexagonal, or rounded (Fig. 3a and b). The squared-rectangular particle projections correspond to a nearly cubic shape, the hexagonal particle projections to a truncated octahedron shape, and the rounded particle projections to irregular spheres (Fig. 3b). There is also a large number of irregular particles that have a poorly defined shape or shapes that can be identified as in between one of the above-listed categories. The irregular particle category also includes particles with substantial evidence of dissolution and re-precipitation or melting. Additionally, the irregular particles are also those that are misoriented or superimposed and thus poorly distinguishable. The recalculations of the dimensional distribution and the descriptive statistics of particle dimensions according to the three main recognizable shapes (i.e., cubic, truncated octahedron, and irregular spheres) highlight that cubic and truncated octahedron particles have similar Dev values (62.02.15 nm – and 54.57 nm – , respectively), while spherical particles are smaller (38.36 nm – ) (see “Data availability” section; Vigliaturo et al., 2024). The observation of more than 400 particles and literature information on similar compounds (Chae et al., 2017) allowed us to propose a model of the two most frequent morphologies in which they occur (Fig. 3c and d).
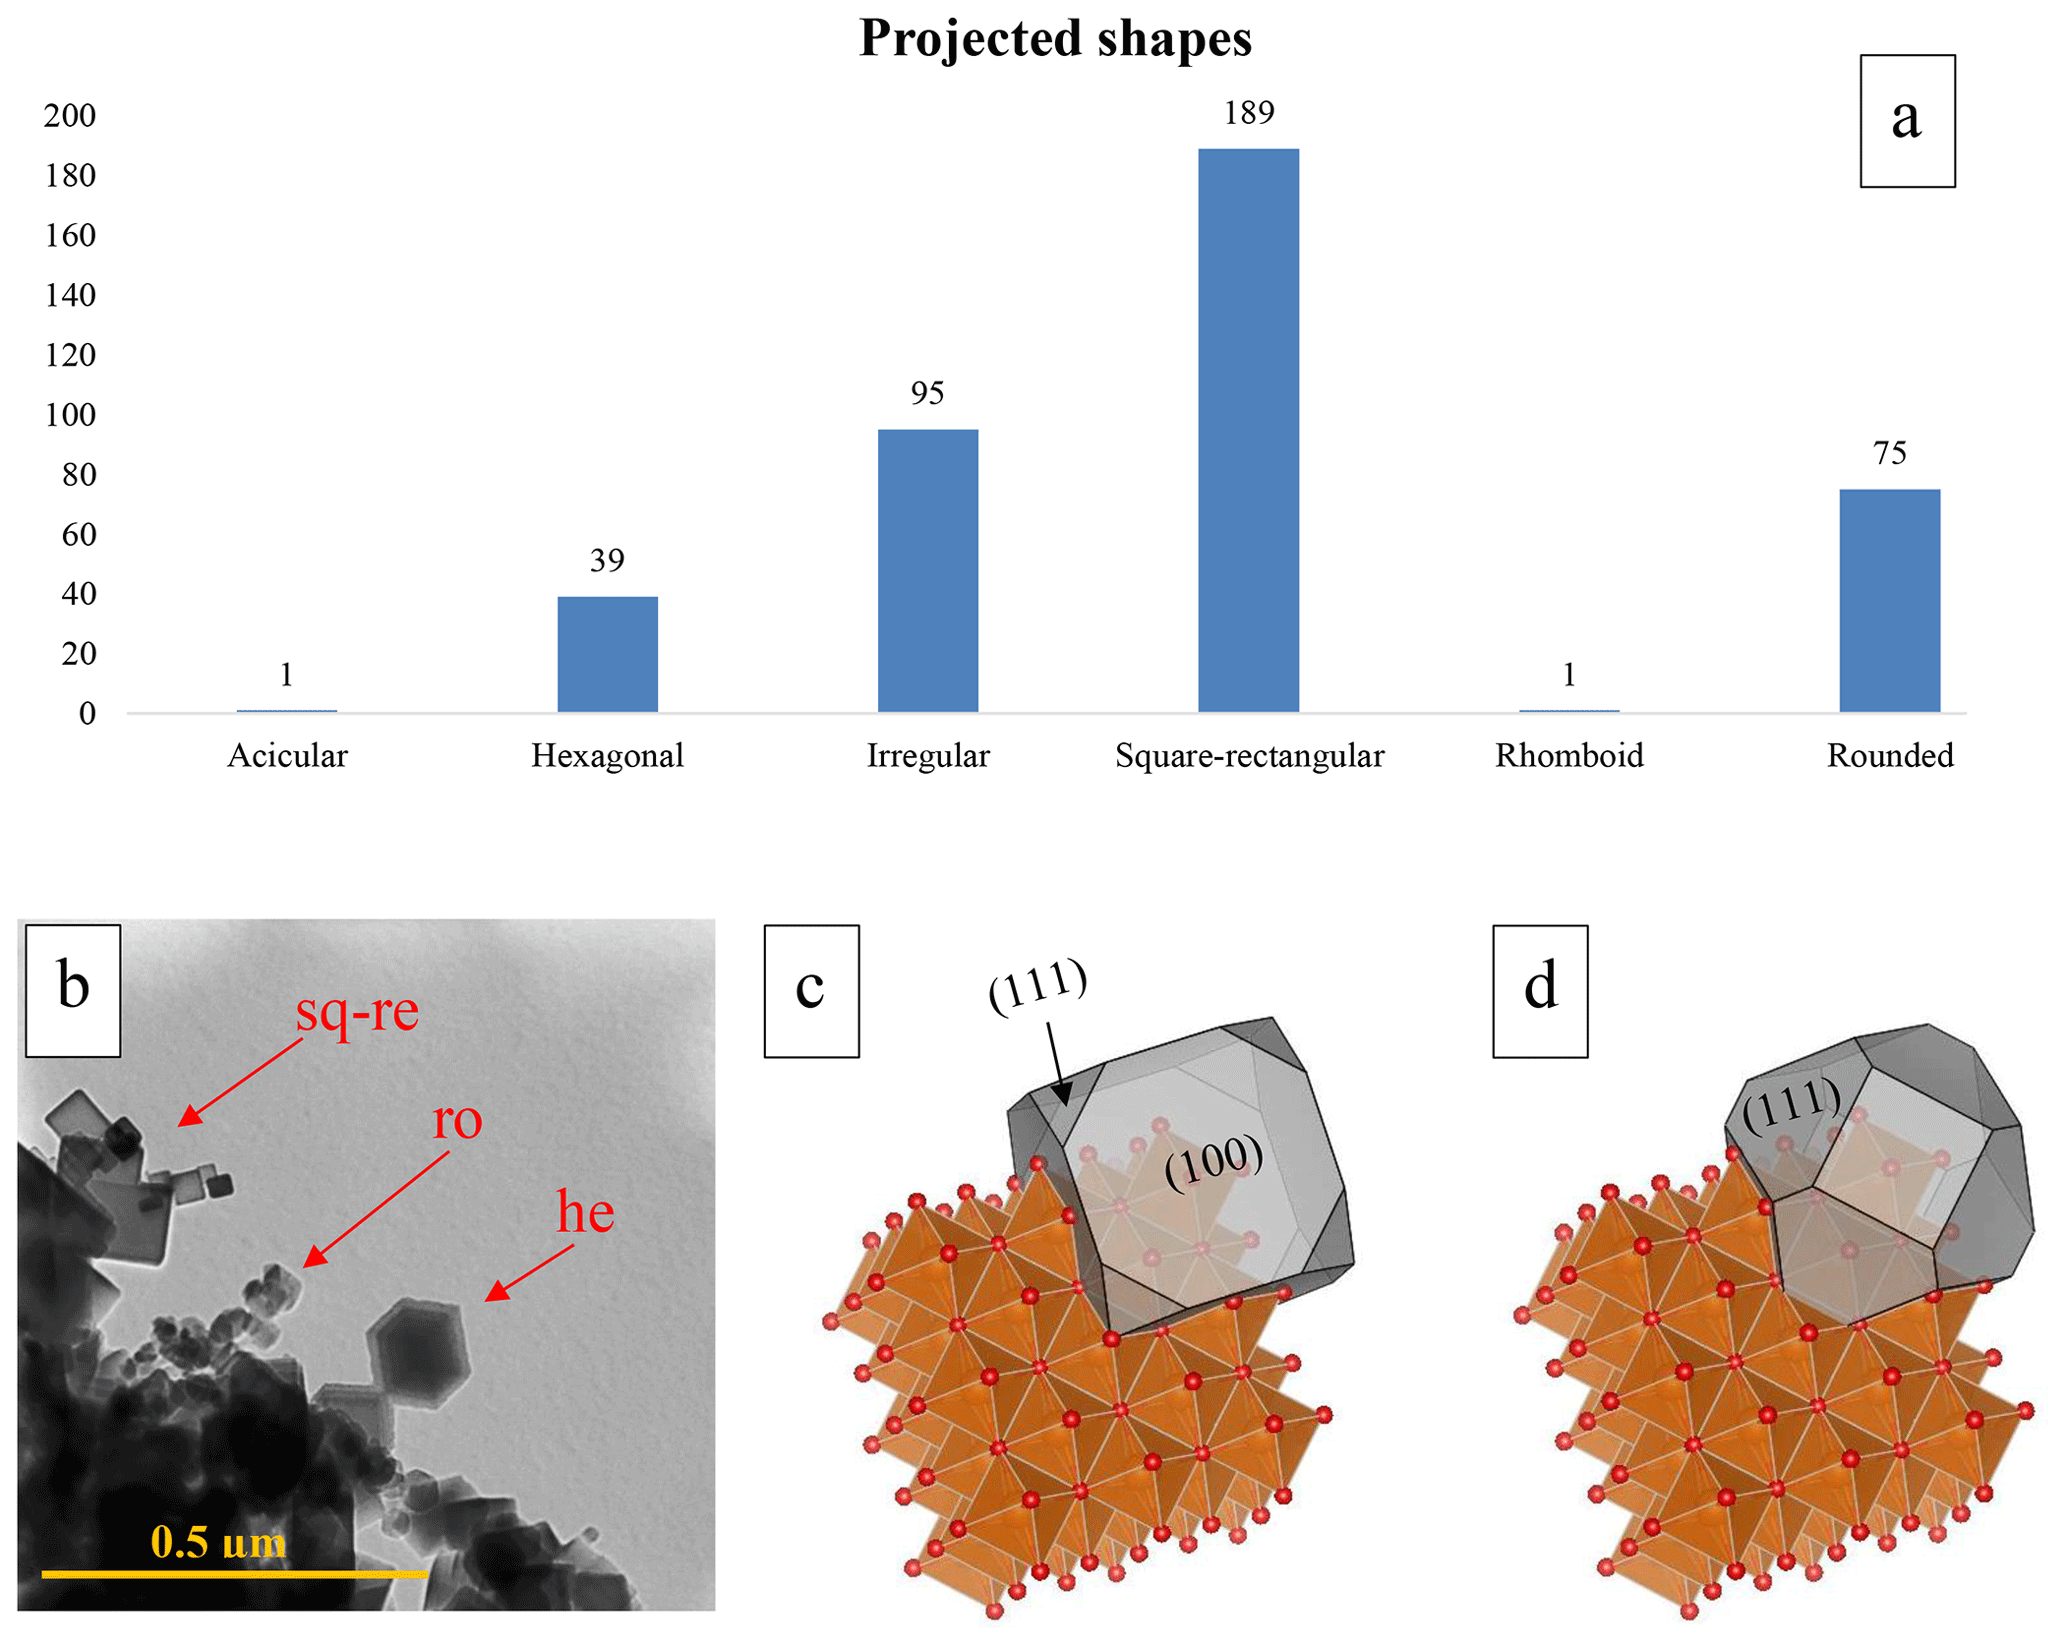
Figure 3(a) The chart summarizes the more frequent projected shapes observed in the aggregates that were present in the studied samples. (b) Representative picture (TEM-BF) showing the commonly observed shapes in the studied sample, namely rectangular squared (re-sq), hexagonal (he), and rounded (ro). Reconstruction of the possible crystallographic orientations of particles with different shapes performed using Vesta software in (c) the model of a cubic particle that appears as a square in 2-D observations and (d) the section of a truncated octahedron particle with a hexagonal shape in 2-D observations. In (c) and (d), the crystal shape that projects a square and a hexagonal image, respectively, is depicted in gray shading. The coordination octahedra of Mg is in orange, and the O atoms are in red.
The observed particles were usually oriented with a squared-rectangular (for cubic particles) or hexagonal (truncated octahedron) projection perpendicular to the electron beam (thus planar with respect to the field of view), as shown in Fig. 3b. In this arrangement, the electron beam would mainly hit the (100) facet (Fig. 3c) for cubic particles projecting a rectangular-squared shape in 2-D and the (111) and (100) facets (Fig. 3d) for truncated octahedron particles projecting a hexagonal shape in 2-D. In rare cases, some aggregates allowed us to highlight the actual cubic shape of the crystals in 3-D (Fig. 4).
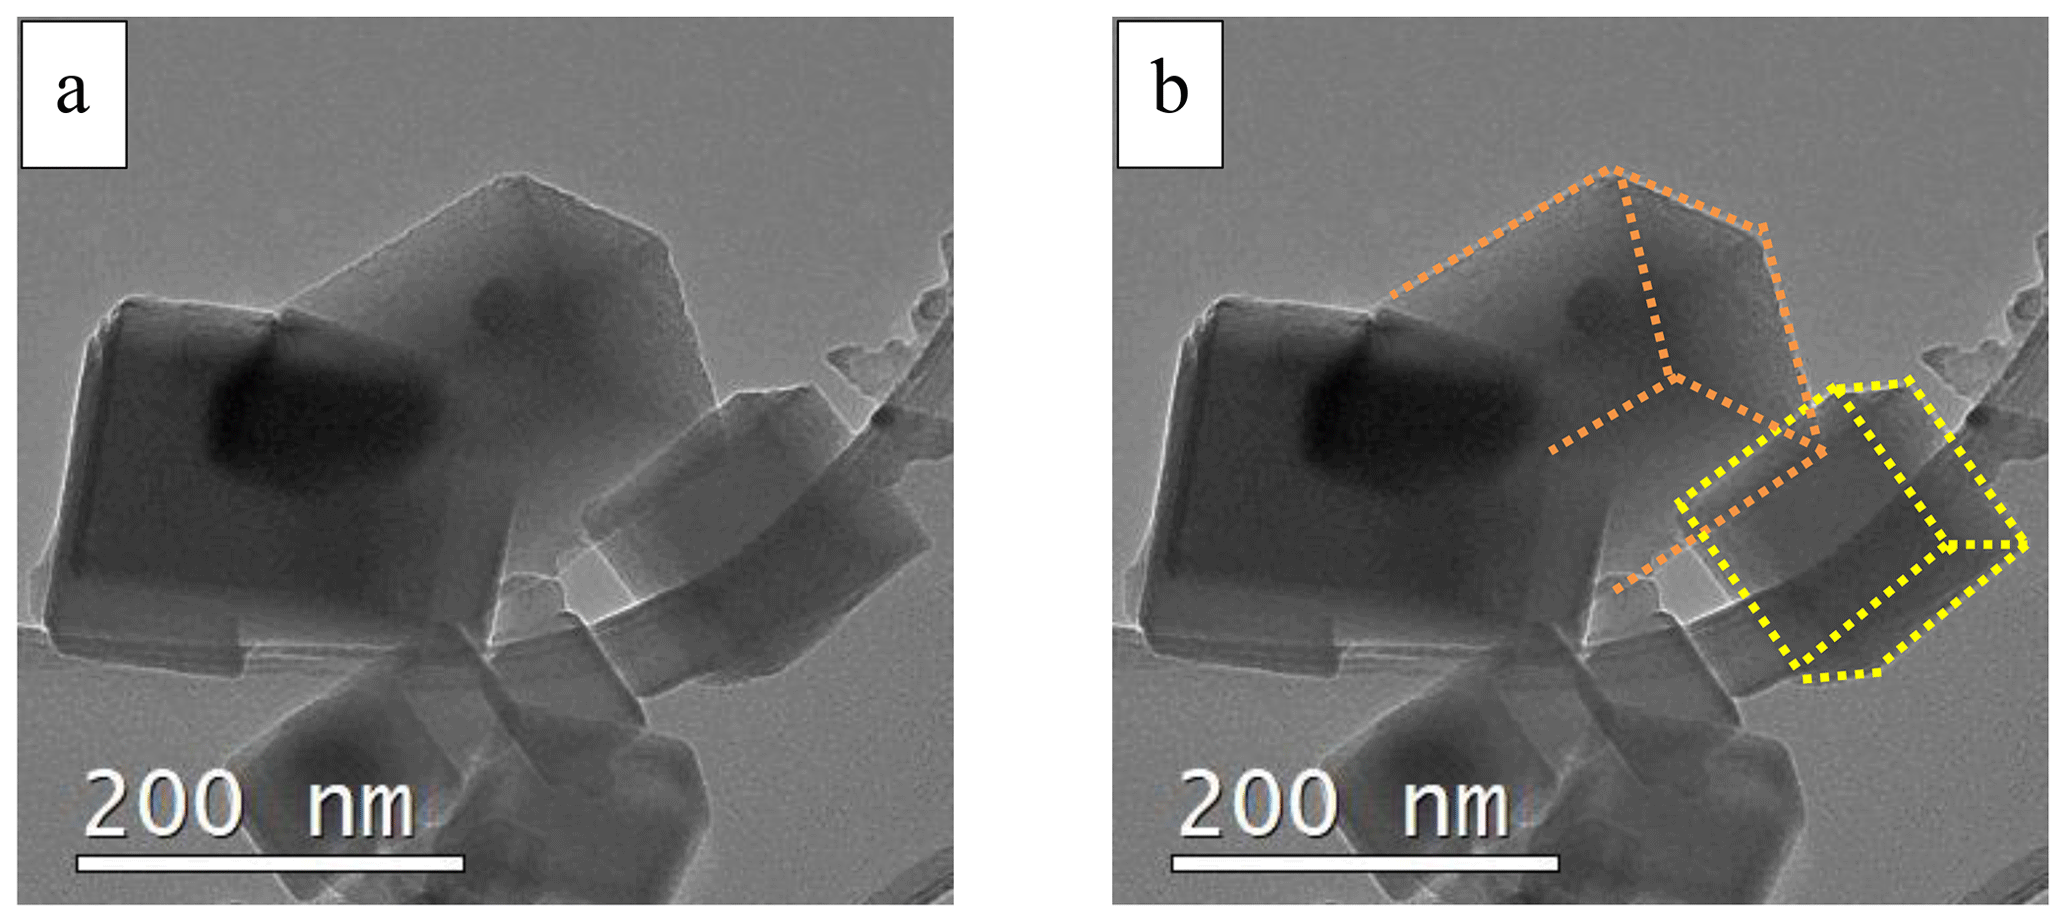
Figure 4(a) Reference TEM-BF image showing the presence of cubic particles. (b) The same TEM-BF image with dotted lines to highlight the edges of the observed cubic particles.
Several cubic particles had rounded-like edges, possibly exposing the (111) facet, and analogous facets for every other edge (Fig. 5a). Some of the cubic particles had visible thickness fringes or diffraction contrasts at the edges (Fig. 5b, c, and d). An accumulation of shapeless material was sometimes visible on the particle edge (Fig. 5c and details in Fig. 5d).
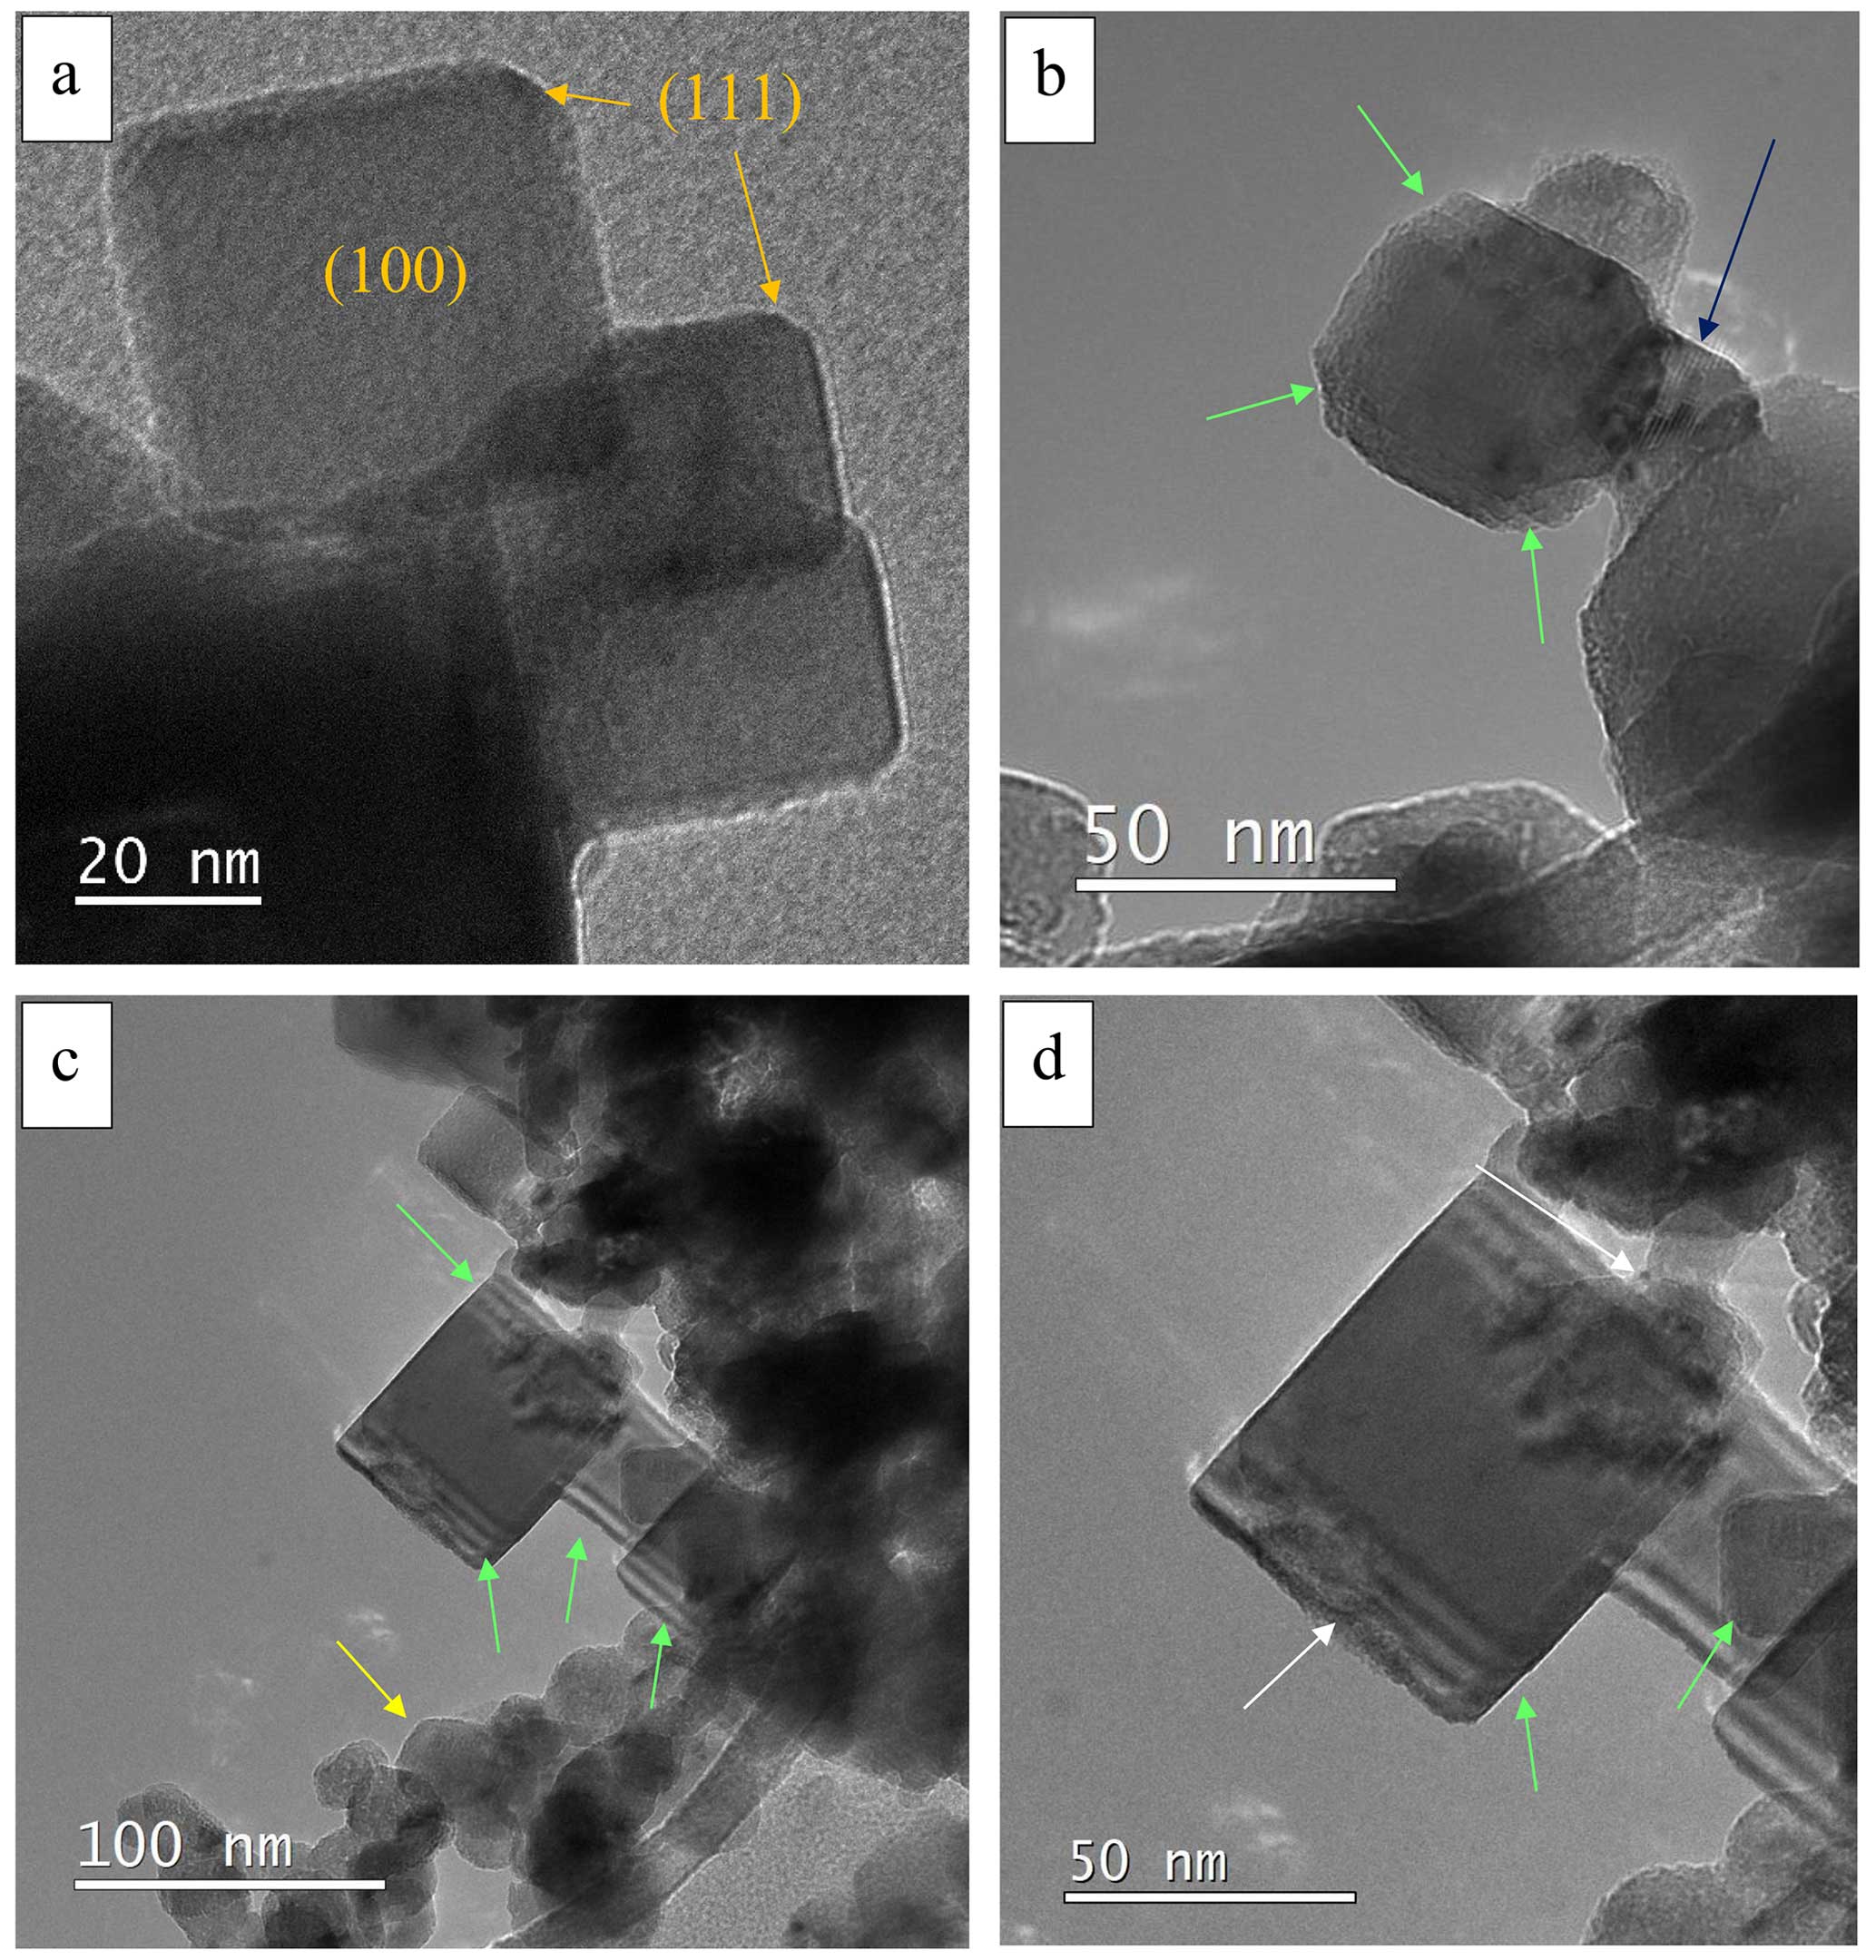
Figure 5(a) BF-TEM picture of cubic particles in which we can possibly locate (111) facets. (b) BF-TEM picture of a particle showing the presence of thickness fringes and diffraction contrast (light green arrows) and connective material with visible Moireé fringes (dark blue arrow). (c) Cubic particles showing a diffraction contrast (light green arrows) and a group of smaller round particles (yellow arrow). (d) Zoomed-in view of (c) showing the accumulation of shapeless material on the edge of the cubic structure (white arrows).
In addition to the listed shapes, particles projecting a rectangular, well-elongated 2-D shape (e.g., Sect. S3) were observed.
3.3 TEM-SAED and HR-ARM investigations
The SAED patterns recorded on aggregates are compatible with those of polycrystalline material (Fig. 6a and b). In some cases, the diffraction rings appear to be broadened (Fig. 6b) (see Sect. S4).
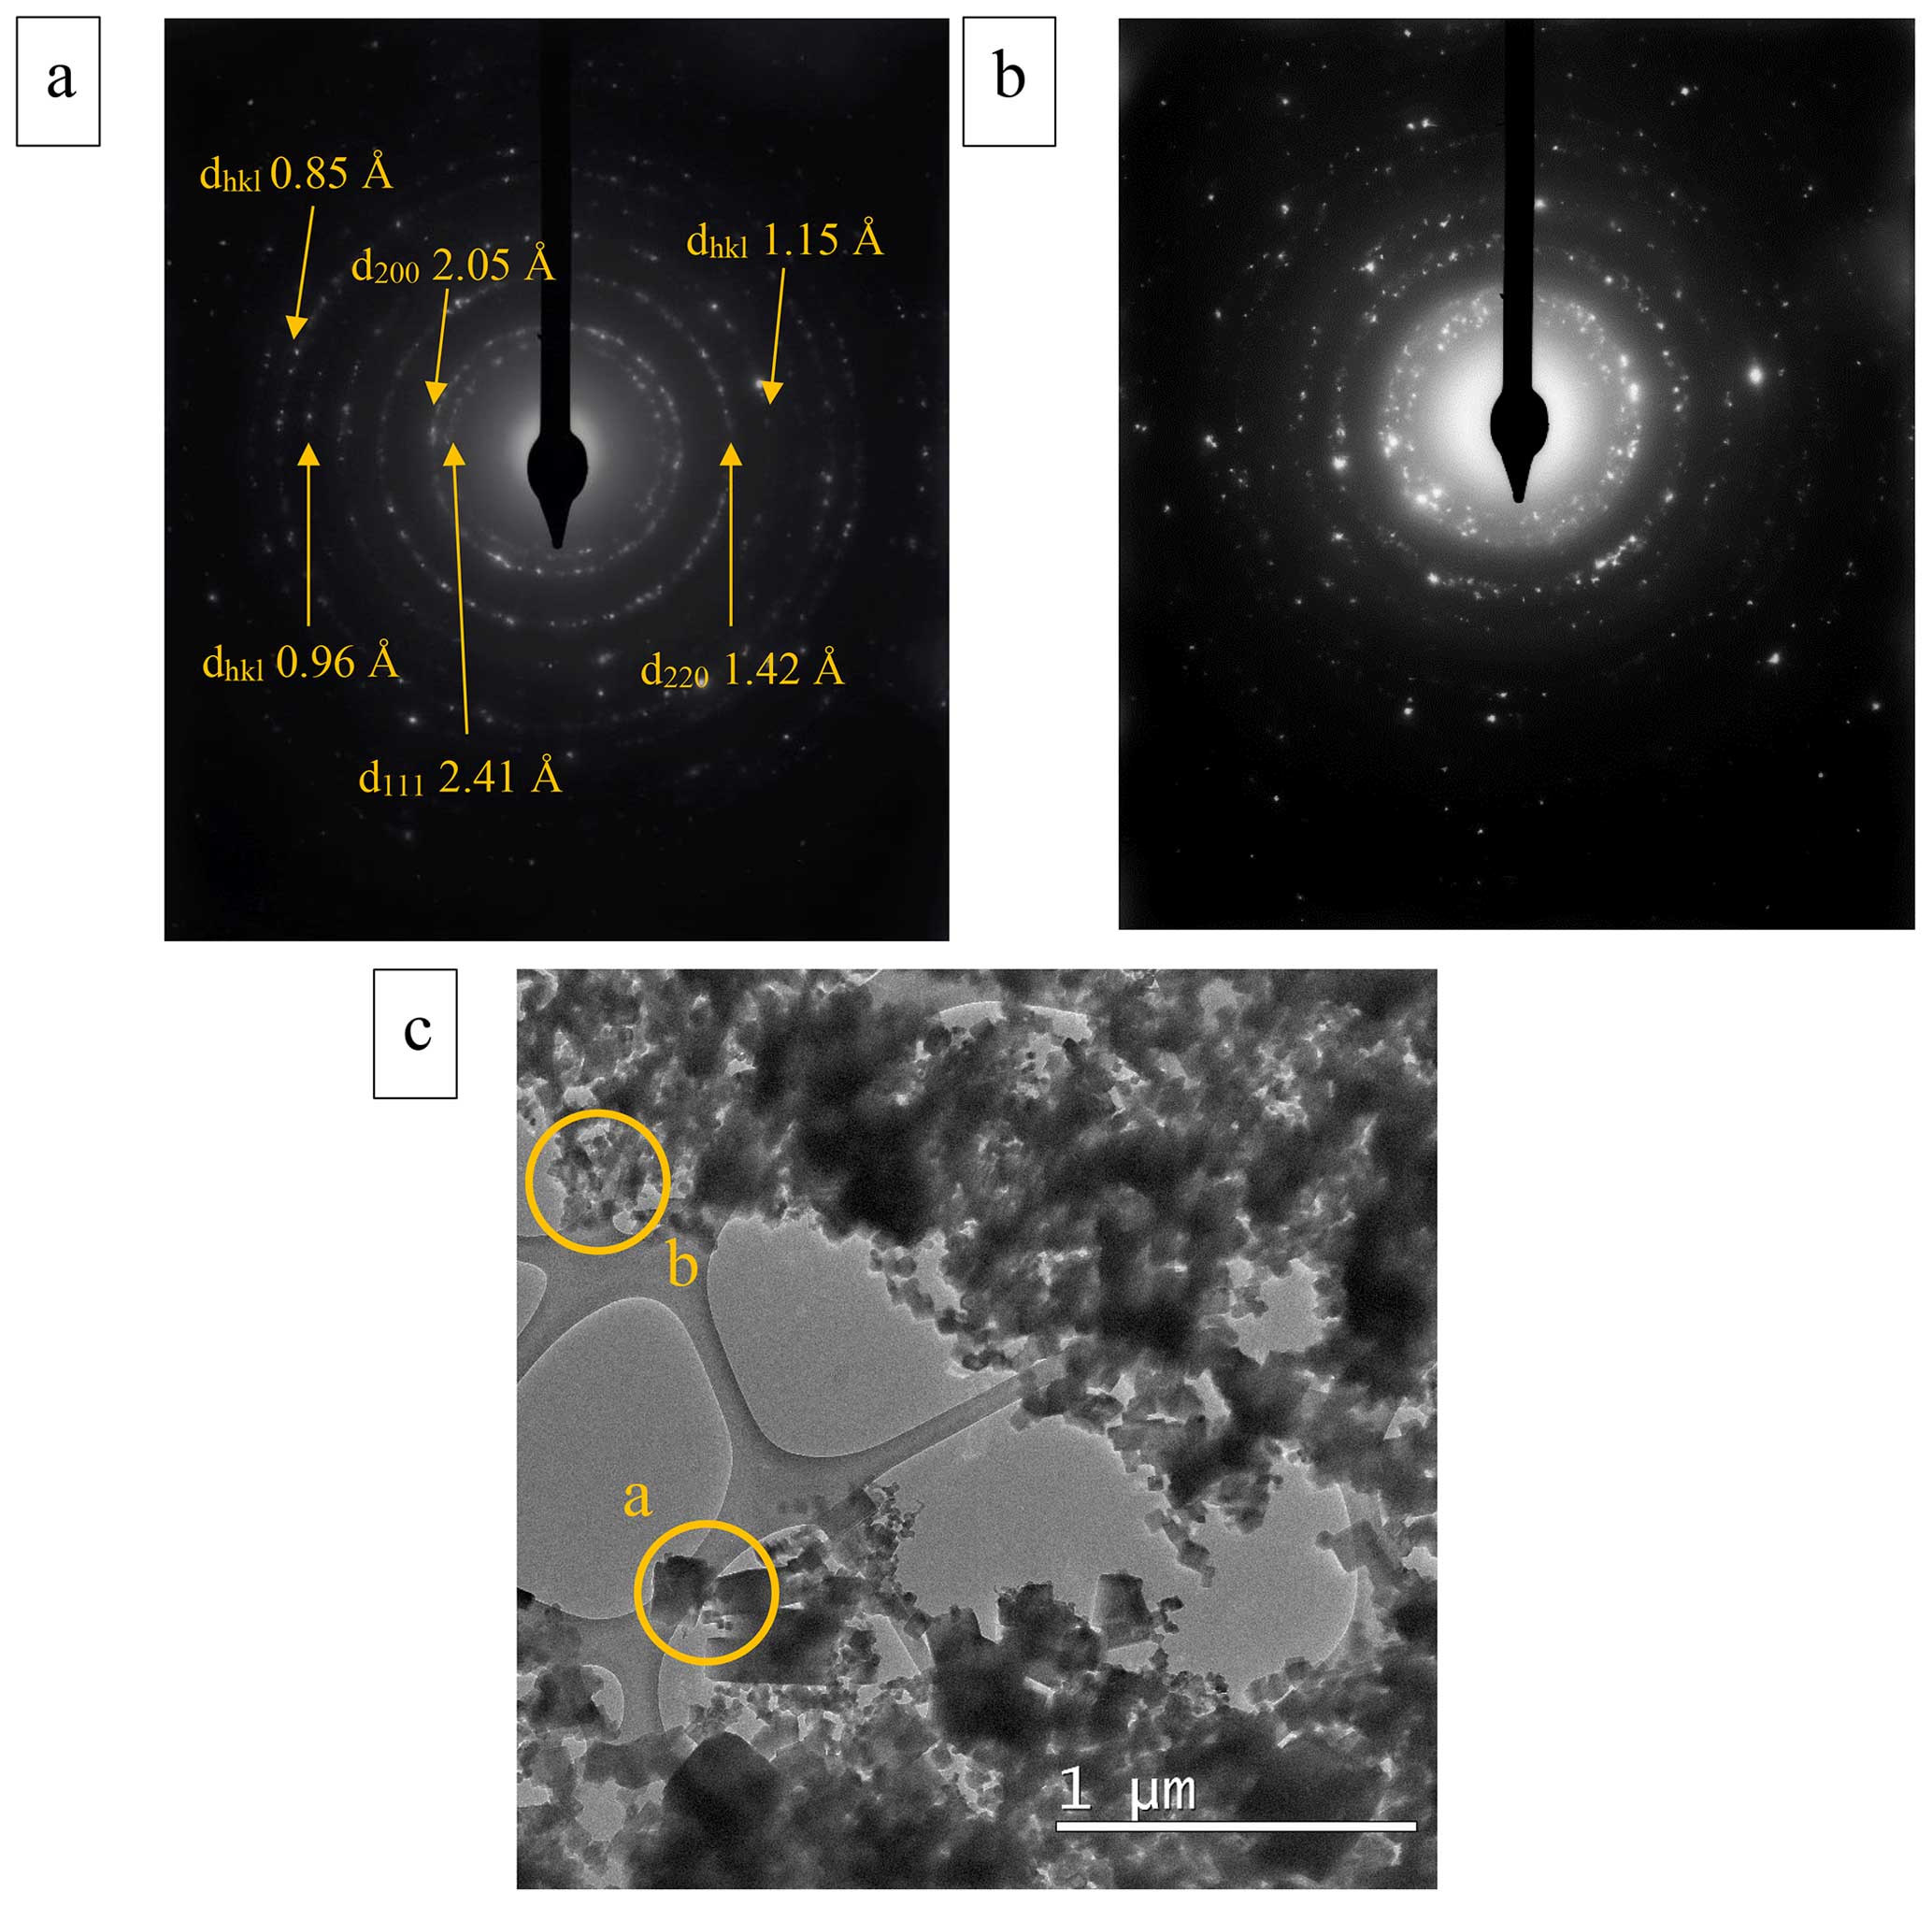
Figure 6(a) Polycrystalline SAED pattern of an aggregate of particles having well-defined rings and (b) SAED pattern of another aggregate showing wider rings and dispersed spots. (c) Regions from which the polycrystalline diffraction patterns were recorded (the yellow circles represent the region from which the diffraction patterns were obtained).
The cubic and truncated octahedron particles are crystalline (e.g., Fig. 7a). When particles are in contact, they usually share the same crystal lattice orientation (Fig. 7a). The ARM images show a crystal that is compatible with a cubic lattice (Fig. 7b) and with the model generated with Vesta software (Fig. 7b and c).
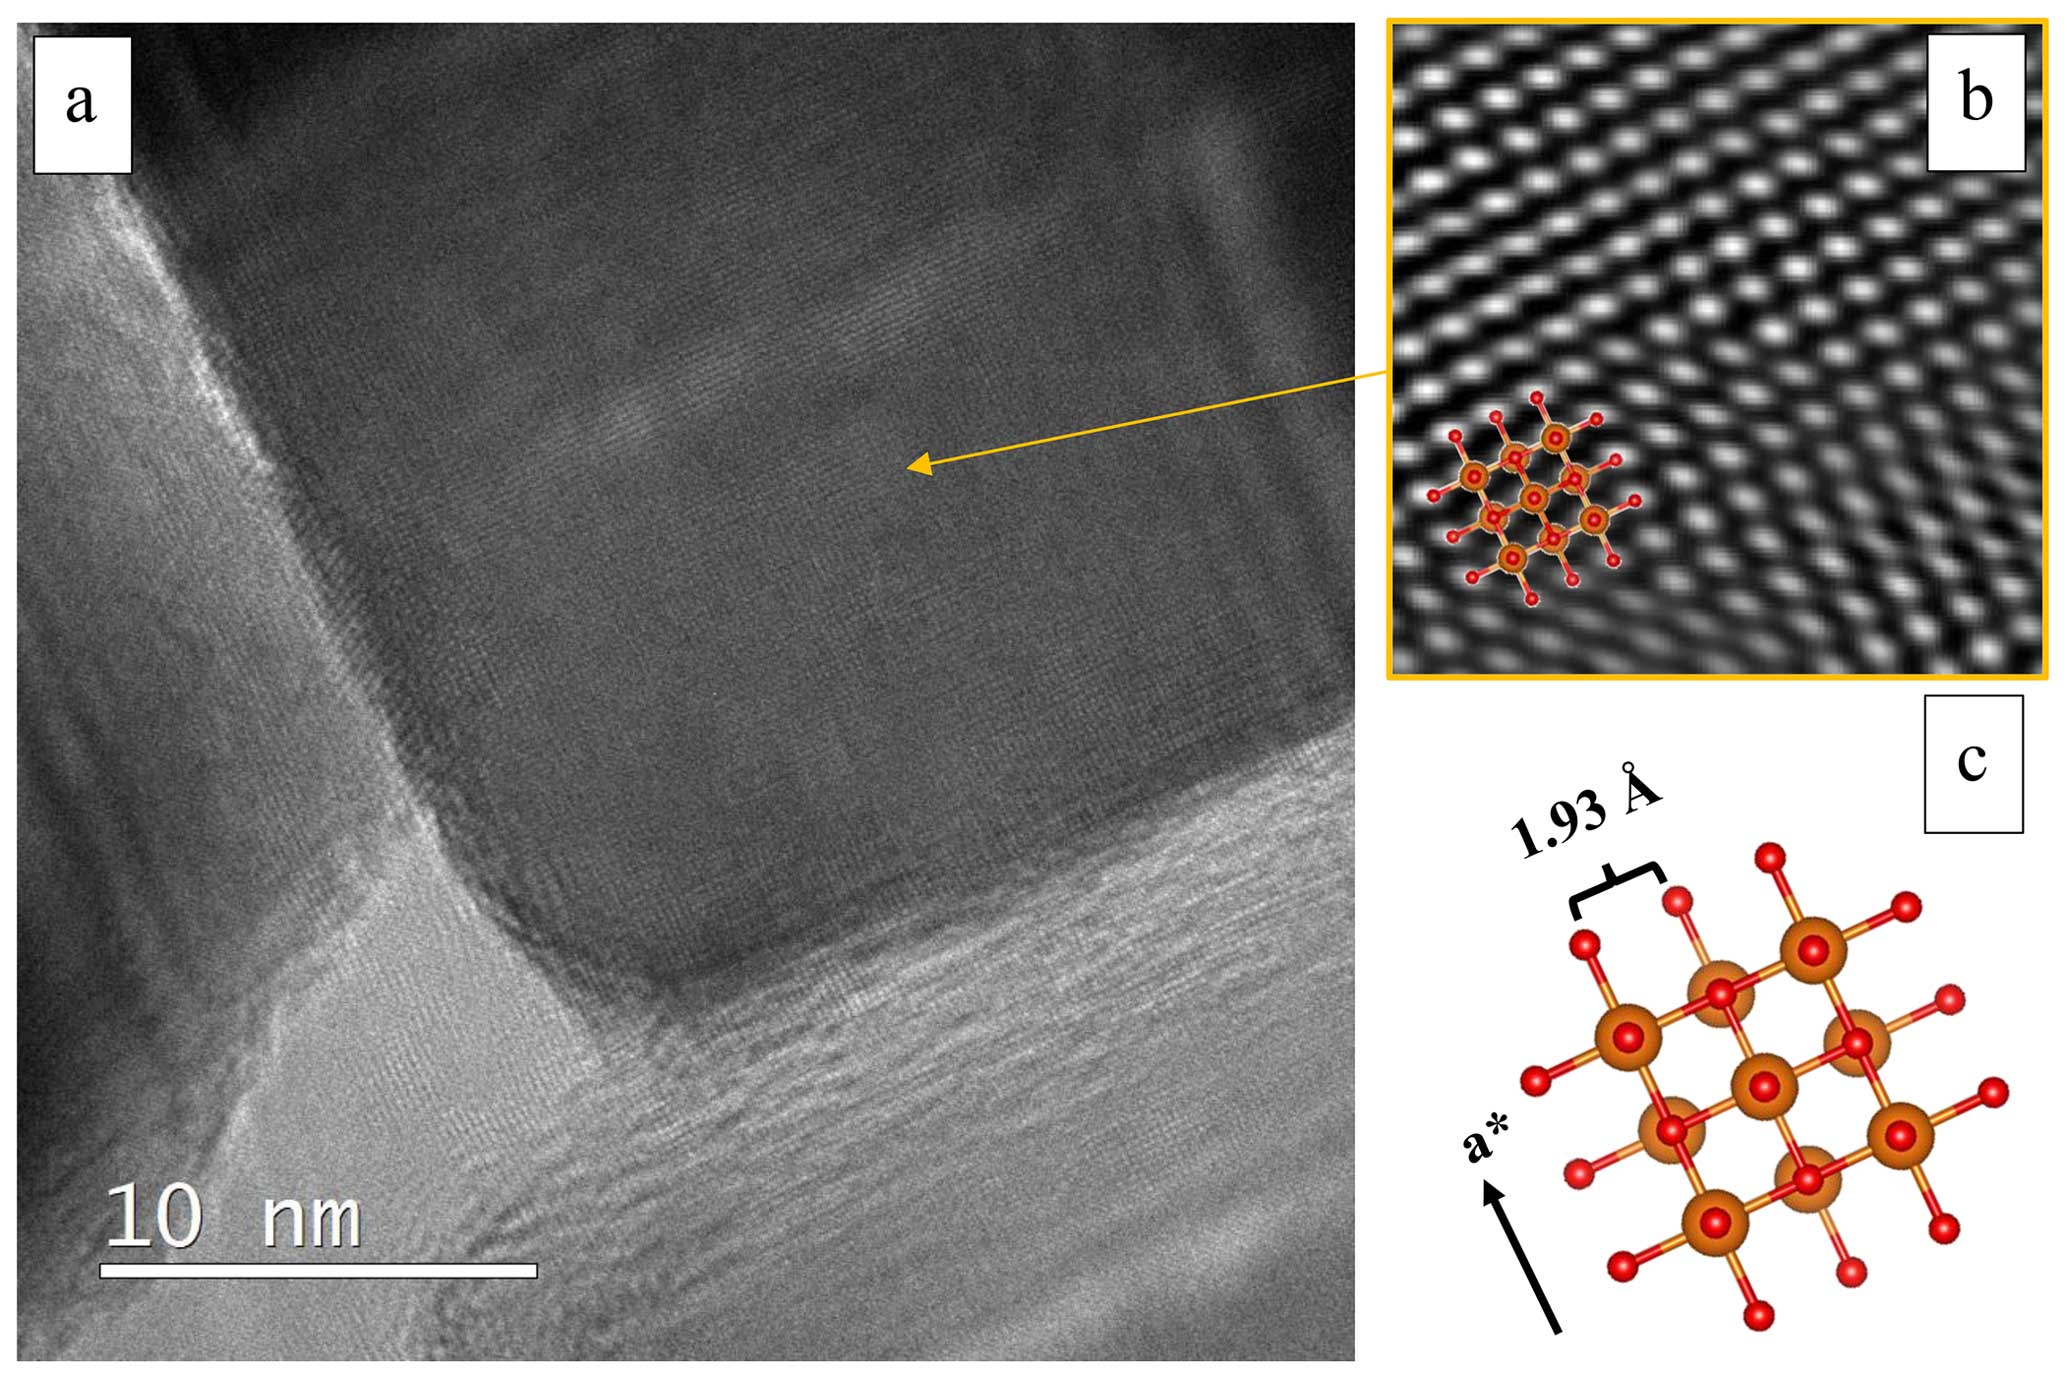
Figure 7(a) BF-TEM image showing a detailed view of a cubic crystal. (b) Extracted IFFT (the masking was performed by selecting the FFT spots and applying a smooth edge of 5 pixels) showing symmetry that is compatible with a cubic lattice. The cubic MgO structure (Jacobsen, 2008) was generated by Vesta (c) and superimposed on the IFFT (b). Orange spheres are Mg atoms, while red spheres are O atoms.
The chemistry of the sample was confirmed by STEM-EDXS, and it is compatible with the SEM-EDXS findings (Sect. S5). The amorphous material's chemistry was analogous to the crystalline material's chemistry.
3.4 Dual-range EELS and ELNES investigations
The dual-range EELS spectra were collected on about 10 different particles with one of the characteristic particle shapes observed in the sample, namely cubic, truncated octahedron, and spheres (Fig. 3). Since the irregular shape was a mix of the previously listed shapes and hardly classifiable (Fig. 3), it was not investigated. The ELNES of the low-loss edge and the Mg edge has small differences when comparing all the spectra collected on different shapes (Fig. 8). In particular, these differences are represented by the presence of two peaks at the edge (namely, f' and f”) of the spectra collected on a cubic crystal. On the other hand, the spectra collected on truncated octahedron and spheres only had one f edge, where it was not possible to clearly distinguish specific peaks.
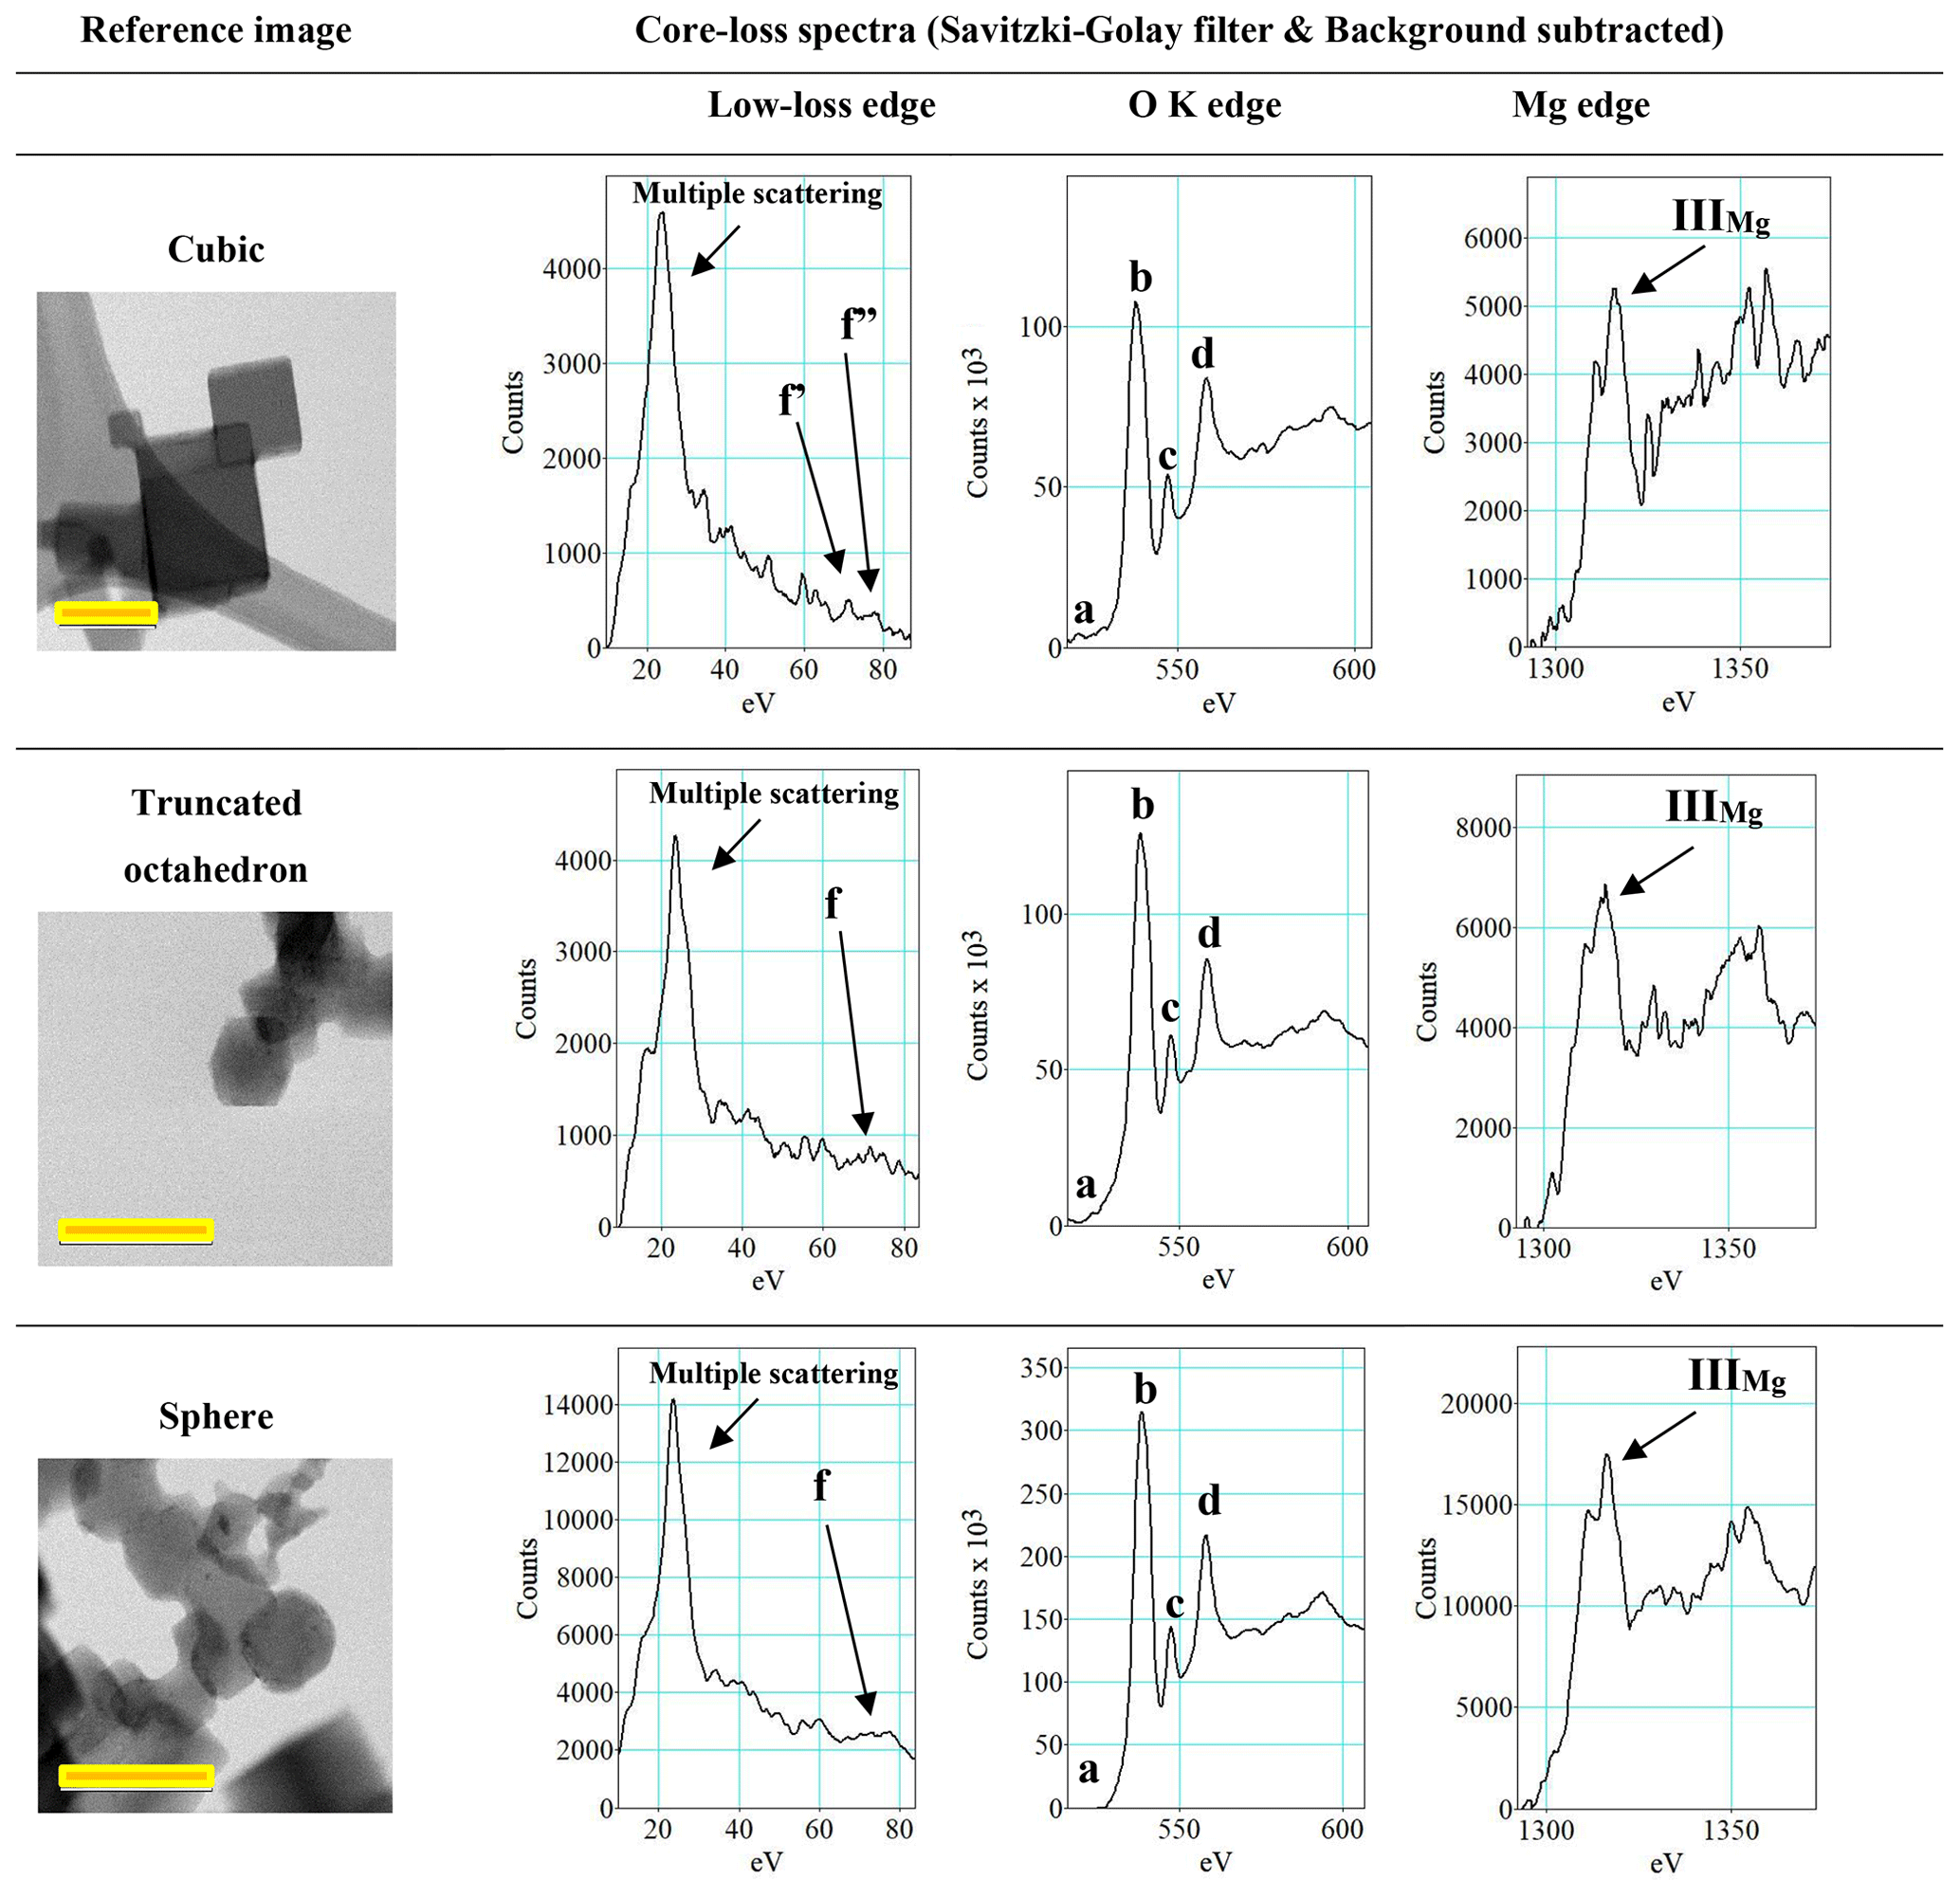
Figure 8Low-loss spectra and core-loss spectra for the O K edge and the Mg edge. A Savitzky–Golay filter and a background subtraction were applied to each spectrum. Imaging yellow scale bars are 100 nm.
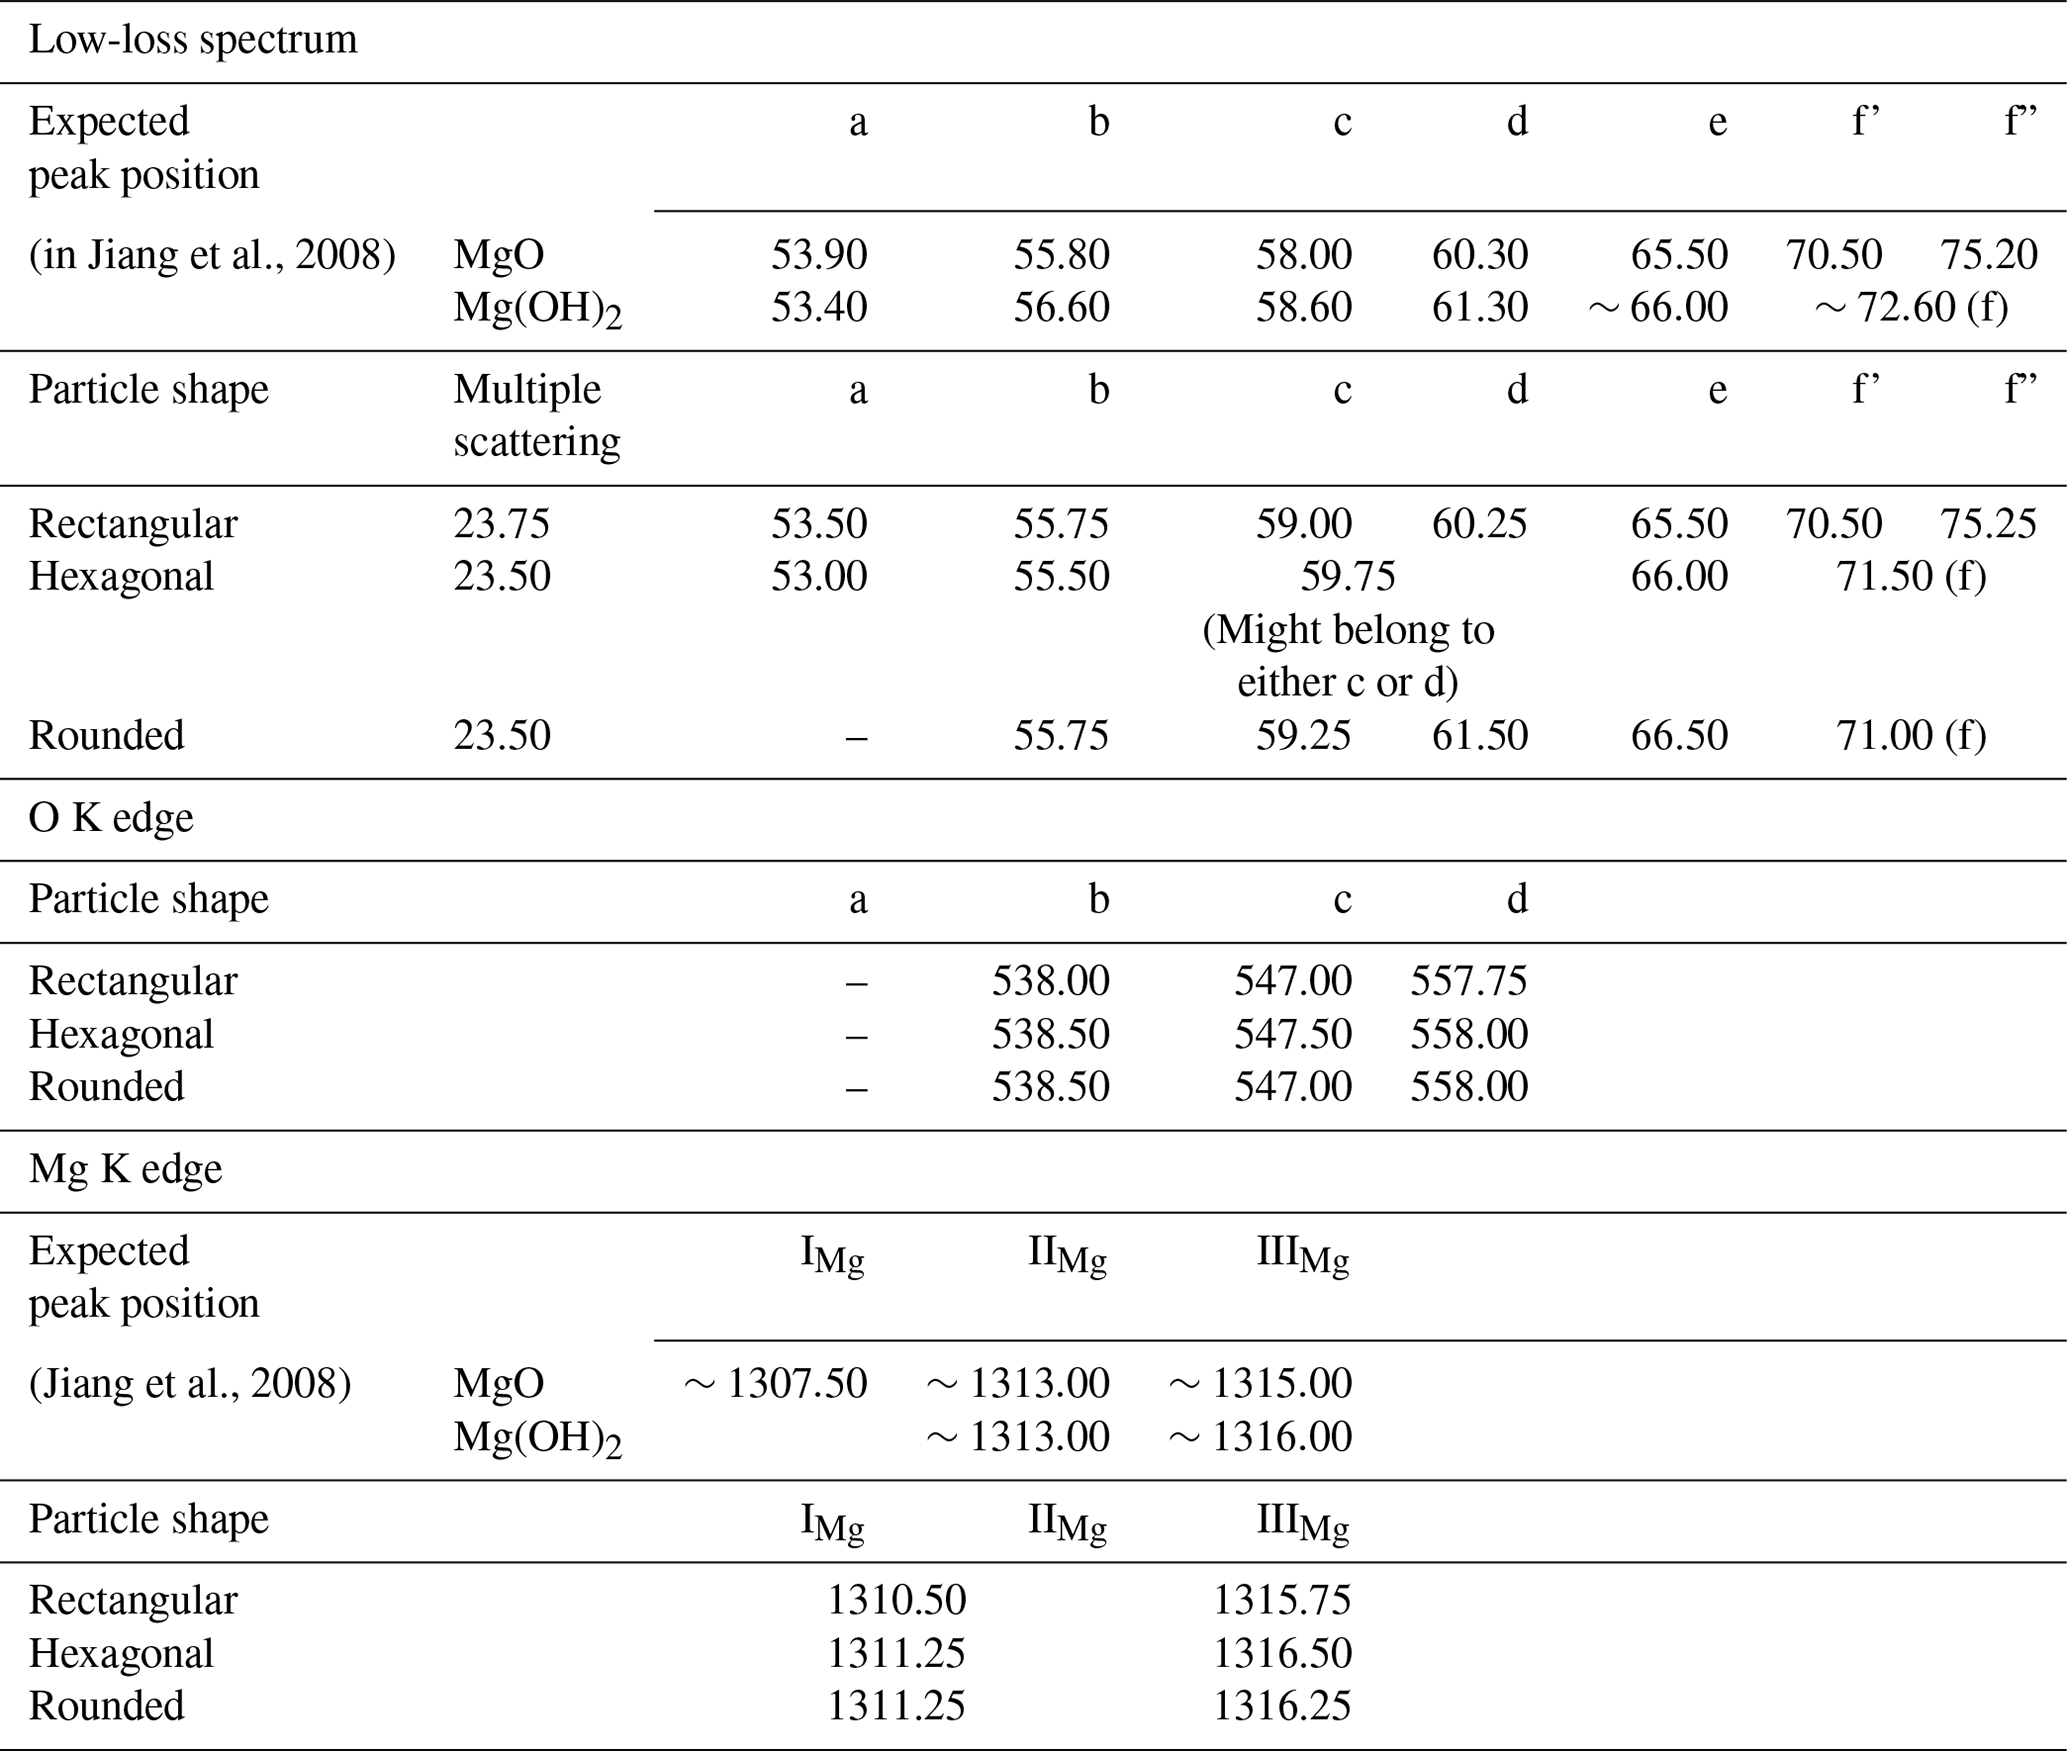
An energy shift in the spectra was observed when comparing all the peak positions. Since the shift is barely visible (Fig. 8), the positions of the more evident peaks that are present in the low-loss spectrum, as well as at the O K edge and the Mg K edge, were measured (Table 2).
Table 2The table summarizes the positions of the peaks that are detected in the low-loss spectrum and at the O K edge and Mg K edge. The peaks that were not named specifically in the literature are listed with roman numbers.
3.5 BET surface area
MgO had a specific surface area equal to 26.8916 m2 g−1 and (R2=0.9999732).
The sample of MgO appeared as a white powder (OM) with a homogenous morphology and was grouped into aggregates when observed in optical microscopy and SEM (Sects. S1 and S2). These particles were trapped as aggregates in cyclone 2, since the cut-off diameter of cyclone 2 equals approximately 1 µm, which allows for the entrapment of up to 98 % of the magnesia produced in the system by the Mg flame (Laraqui et al., 2020).
The preliminary SEM-EDXS mapping highlighted the chemical homogeneity and purity of the Mg-based aggregates at this level of investigation, and occasionally small amounts of Si and S were detected (Sect. S2).
The dimensional study on distinct MgO particles conducted at the TEM shows a Gaussian right-skewed distribution when considering the particle Dev (see Table 1, “Data availability” section, and Sect. S3; Vigliaturo et al., 2024). Both the average Dev and the median Dev fall within the PM1 category, and all of the individual particles belong to the PM1 category (Table 1 and Sect. S3). Analogously, the largest observed individual particle has a Dev of 187.61 nm (Table 1 and “Data availability” section; Vigliaturo et al., 2024), far below the PM1 threshold. Considering the particles from the perspective of respiratory tract accessibility, all the individual particles would reach the deepest regions of the lungs (i.e., alveoli) (Table 1, Sect. S3, and Appendix A; Vigliaturo et al., 2024). However, one should consider that most of the particles occur in aggregates. When observed at the STEM and taking as a reference the aggregates Dev, 1 of the 19 measured aggregates can be assigned to the PM10 category, 4 of the 19 measured aggregates can be assigned to the PM2.5 category, and 14 of the 19 aggregates belong to the PM1 category (Table 1, Sect. S3, and Appendix A; Vigliaturo et al., 2024). Thus, 18 of the 19 measured aggregates are also identified as respirable (Dev<4 µm), and all of the aggregates are inhalable (Dev<100 µm). Of course, one should consider that aggregates may form after the collection from the cyclone or during the sample preparation steps.
The cube octahedron and truncated octahedron particles have larger Dev with respect to spherical particles (see “Data availability” section; Vigliaturo et al., 2024). The smaller spherical particles can be related to fast crystal growth in the proximity of the flame base (Chae et al., 2017). On the other hand, moving to the end region of the flame, one should expect larger cube octahedron particles (Chae et al., 2017). In our sample, both nearly spherical and terraced spherical particles are visible (Figs. 3b, 5b and c). These particles are believed to divide into two types in the later stage of growth, but they should have a common initial stage of growth, which is identified in the smaller spherical particles (Chae et al., 2017). This initial stage of growth, producing nano-sized particles of MgO, was also observed by Altman et al. (2005, 2022). As mentioned previously, the oxidation of Mg occurs in the vapor phase producing MgO, and the vaporization temperature of MgO is higher than the flame temperature. MgO thus condenses into a solid form, such as the crystal we observed. The nano-sized particles of MgO can be categorized as primary particles (or, eventually, “seeds”) from which the MgO gas condenses, allowing for the growth of MgO crystals in cubic or truncated octahedron particles.
In an attempt to understand the physicochemical nature of these particles, a shape and morphological study was performed. The most commonly projected 2-D shapes are squares (e.g., Fig. 3a) with well-defined or rounded edges (N=189), followed by rounded particles (N=75) and hexagonal particles (N=39). The irregularly shaped particles (N=95) are usually a mix of the former shapes or shapeless, and they often show signs of morphological modification that might be reconducted to high temperatures or dissolution and redeposition processes. The particles projecting a square shape in 2-D are cubic particles (Figs. 3a, 4a and b). These particles are likely to have (111) facets at the edges (Figs. 3c, 5a and b), which are normally stabilized by hydroxylation processes (Geysermans et al., 2009). The presence of these (111)-like facets results in a cubic structure resembling a cube octahedron, with larger (100) clean facets and smaller hydroxylated (111) facets (Geysermans et al., 2009). The particles projecting a hexagonal shape in 2-D (Fig. 3b) are truncated octahedron, exposing both the (100) and the (111) facets to the electron beam (Fig. 3d). In this case, the (111) hydroxylated surface (if actually hydroxylated) would be larger with respect to the same facets observed in the cubic/cube octahedron particles. The extensive specific surface area of MgO suggests significant potential for designing trapping systems based on particle adsorption, owing to its abundant active sites.
The connective material (having the same chemistry as the crystalline particles), which clearly keeps parts of the particle aggregates together, was shapeless and occurred as both amorphous and crystalline material (Fig. 5b, c, and Supplement S3).
The SEM-EDXS and ARM-EDXS observations and mappings highlight substantial homogeneity in the sample chemistry. This observation is compatible with the presence of isostructural phases (periclase) having different cell parameters, as identified at the PXRD (Fig. 2). The presence of these two isostructural phases is a consequence of the formation of MgO nanoparticles at different temperatures and, thus, in different regions of the asymmetric combustor. A relationship between the MgO lattice parameters and formation temperature has already been highlighted in the literature by Cimino et al. (1966), in accordance with our results.
The SAED investigation on large aggregates (polycrystalline ring patterns) allowed us to measure d spacings that are compatible with the periclase crystal lattice determined by the PXRD study (Fig. 6a).
In particular, the [111] d spacing of 2.41 Å measured on the polycrystalline SAED is in good agreement with both isostructure [111] d-spacings of 2.43 and 2.37 Å measured by Merli et al. (2002) and by Jacobsen et al. (2008), respectively. On the other hand, the measurements on the polycrystalline SAED of the [200] and [220] d spacings (Fig. 6) are in better agreement with the diffractogram related to the results of Jacobsen et al. (2008) compared to those of Merli et al. (2002) (Fig. 2). Specifically, the [200] d spacing was 2.05 Å in the SAED, 2.11 Å in Merli et al. (2002), and 2.05 Å in Jacobsen et al. (2008), while the [220] d spacing was 1.42 Å in the SAED, 1.49 Å in Merli et al. (2002), and 1.44 Å in Jacobsen et al. (2008). These differences might be related to the heterogenous presence of the two isostructures within the sample or the lower accuracy of SAED measurements.
The other smaller d spacing that was measured (Fig. 6a and Sect. S4) has not been reported in the literature; we were thus not able to verify the correspondence of our results with the expected values. The electron diffraction ring broadening (i.e., Fig. 6b) could be indicative of smaller crystallite size in some of the investigated aggregates.
The sample crystallinity was confirmed by HR-ARM observations (Fig. 7a), and the calculated IFFT (Fig. 7b) was compatible with a cubic crystal and a defect-free atomic arrangement. The superposition of the IFFT image and the model generated by Vesta software (Fig. 7b and c) allowed us to identify the crystal as one of the crystals generated at a higher temperature. This specific crystal might have been generated in an area in which the local pressure is higher with respect to the rest of the combustion chamber; in contrast, we do not expect to have overpressure higher than 30 mbar in the studied system. We can thus expect that the effect of the pressure is negligible when compared to that of the temperature. In Fig. 7a, continuity between the lattice fringes of the darker crystal and the two lighter crystals in contact with it was also observed. This could be further confirmation of the common growth pathway of these crystals or the ordered arrangement of separate facets of different crystallites in close contact.
The particles were also investigated using dual-range EELS to determine if differences between particles with different morphologies were also significant in terms of composition or from a physicochemical point of view. This comparison was done since cubic particles should have less extended (111) facets with respect to truncated octahedron particles (Fig. 3c and d), allowing for a limited hydroxylation of the particle surface. On the other hand, spherical and more irregular particles may offer a larger number of bonds available for surface hydroxylation. The low-loss and core-loss O K edge and Mg edge were investigated. The observation of the low-loss spectra showed an obvious presence of a large edge related to multiple-scattering events (Colliex et al., 1985) and located at ∼23.50 eV (Fig. 8 and Table 2). The background noise was high in this spectral region, but the position of the peaks was compatible with the position of the peaks from the literature (Jiang et al., 2008). Despite the good fit of the recorded peak position and the expected peak position (Jiang et al., 2008), some of the peaks were too weak to be unequivocally identified (Table 2). This was evident for peaks a, c, and d in the O K-edge spectral region. Possibly, the largest difference observable in the low-loss spectra for each morphology was located in the f, f', and f” regions. The cubic particles have two distinct peaks, namely f' and f”, while the truncated octahedron particles and the spherical particles only have a wide f peak. The presence of both the f' and the f” peaks is related to MgO, while a single f peak is related to Mg(OH)2. Of course, this aspect should be carefully taken into consideration since a high noise in this spectral region was detected. The observation of the ELNES and positioning of the Mg K edge were compared with an XANES spectrum that was calculated for MgO and Mg(OH)2, considering different embedded cluster shells (Jiang et al., 2008). The positioning of the IIIMg peak was similar for all the observed morphologies (Fig. 8) and in a position that was comparable with the one calculated in the XANES spectrum (Table 2). The position of the IMg and IIMg peaks observed for all the different morphologies falls in the middle of the positioning expected for these two peaks, and they might not be completely distinguishable, resulting in a single peak in a middle position between the two peaks (IMg and IIMg). Despite this aspect, the IIIMg peak is more defined in the spectra collected on cubic structures, and it looks proportionally higher with respect to the “merged” IMg and IIMg peaks (Fig. 8). These aspects could be related to MgO rather than Mg(OH)2, but as previously discussed with regard to the low-loss spectra, the high noise could play a role in drawing erroneous conclusions. Future studies using a dispersion lower than 0.25 eV per channel are needed to clarify this aspect.
When comparing the core-loss O K-edge spectra, it is not possible to detect major differences in the ELNES and peak positioning (which is nearly unchanged between different morphologies). On the other hand, the absence of an O K-pre-edge peak is highlighted (Fig. 8 and Table 2). In the literature, the O K-pre-edge peak was initially thought to be related to the valence state of a material, but it is instead an indicator of beam damage (Jiang and Spence, 2006). Nevertheless, the appearance and disappearance of this peak during the analytical performance can be an indicator of induced beam damage as well. For this reason, and as anticipated in the “Material and methods” section, all the spectra were collected by summing up three separate frames so that the operator would be able to observe an eventual rise and decrease in the O K pre-edge. Our observation during the spectrum collection suggests that the observed structures were not exposed to consistent beam damages.
Considering the sample chemistry; the crystallographic information obtained through the combination of PXRD, TEM-SAED, FFT, and IFFT; software modeling; and HR-ARM imaging, the possible formation mechanism of the observed particles could be proposed as follows.
The smaller MgO spherical particles, which experience rapid initial growth, are supposed to grow closer to the flame origin point (Chae et al., 2017). The flame area can be defined as a volume in the combustion chamber where MgO gas is produced and then condensed into a solid phase. From the work of Andrieu (2022), the flame length is approximately 7 cm. This length was defined considering the gradient of the gas temperature along the chamber axis. In comparison, the total length and diameter of the combustion chamber are 70 and 10 cm, respectively. Once formed, the primary particles are then transported by convection/diffusion in the turbulent flow prevailing in the combustion chamber. The larger cubic and truncated octahedron particles should grow from the MgO primary particles farther away from the flame origin point at a slower pace (Chae et al., 2017). In our case, two different MgO isostructures with different cell parameters (Fig. 2) were observed. The presence of these two isostructures may confirm the proposed growth mechanism and thus the growth starting from nearly spherical primary particles of cubic and truncated octahedron particles at different lengths and temperatures along the flame region. As previously mentioned, the temperature of the combustion chamber exhibits large gradients when comparing the center of the flame (1280 °C for the gas phase and 2027 °C for the solid phase) to the chamber walls, which are water-cooled. Such large variations in the gas temperature certainly have a strong effect on the formation and growth of MgO particles.
In the MgO combustion product, three representative morphologies and two isostructural phases were identified. The observed particle physicochemical state, the surface hydroxylation, and the presence of facets that can be further hydroxylated may suggest a hydrothermal pathway to promote further crystal growth of the collected material. The promotion of crystal growth might improve the collection efficiency of the final products in the cyclones.
Future studies should be dedicated to validating the applicability of this system implementation and verifying whether the induced change in the final product's physicochemical state might affect its capability to store energy. Analogously, further studies are necessary to better understand the ELNES of these materials, using more advanced GIF filters and computational approaches.
The dataset collects additional morphometric data (https://doi.org/10.17632/5sm5cdfgvj.1, Vigliaturo et al., 2024).
The supplement related to this article is available online at: https://doi.org/10.5194/ejm-36-831-2024-supplement.
RV, GPS: conceptualization, methodology, validation, formal analysis, investigation, resources, data curation, writing (original draft), review and editing, visualization, supervision, project administration, funding acquisition; EB: methodology, validation, formal analysis, investigation, resources, data curation, writing (original draft), review and editing, visualization; QW: conceptualization, methodology, validation, formal analysis, investigation, resources, data curation, writing (original draft), review and editing, visualization, supervision, project administration, funding acquisition; GT and JFB: methodology, validation, formal analysis, resources, data curation, writing (original draft), review and editing, visualization, supervision, funding acquisition. All authors have read and agreed to the published version of the paper.
The contact author has declared that none of the authors has any competing interests.
Publisher’s note: Copernicus Publications remains neutral with regard to jurisdictional claims made in the text, published maps, institutional affiliations, or any other geographical representation in this paper. While Copernicus Publications makes every effort to include appropriate place names, the final responsibility lies with the authors.
This research was supported by the Grant for Internationalization (GFI_22_01) – Mammalian Brain Mineralogy and a local research grant (VIGR_RILO_23_ 01) awarded to Ruggero Vigliaturo. We are thankful to Goran Dražić for granting us to access the KI facilities (Slovenia) to perform the advanced microscopy investigations.
This research has been supported by the Università degli Studi di Torino (grant no. GFI_22_01) and the Università degli Studi di Torino (grant no. VIGR_RILO_23_01).
This paper was edited by Tiziana Boffa Ballaran and reviewed by two anonymous referees.
Altman, I., Fomenko, E., and Agranovski, I. E.: Fundamental insight into critical phenomena in condensation growth of nanoparticles in a flame, Sci. Rep.-UK, 12, 15699, https://doi.org/10.1038/s41598-022-20210-x, 2022.
Altman, I. S., Agranovski, I. E., and Choi, M.: Mechanism of nanoparticle agglomeration during the combustion synthesis, Appl. Phys. Lett., 87, 053104, https://doi.org/10.1063/1.2005387, 2005.
Andrieu, A.: Combustion de métaux dans un brûleur turbulent: étude de la stabilisation de la flamme et réduction des polluants, PhD thesis, Université de Haute-Alsace, France, https://theses.hal.science/tel-04148057 (last access: 16 September 2024), 2022.
Andrieu, A., Allgaier, O., Leyssens, G., Schönnenbeck, C., and Brilhac, J.-F.: NOx emissions in a swirled-stabilized magnesium flame, Fuel, 321, 124011, https://doi.org/10.1016/j.fuel.2022.124011, 2022.
Andrieu, A., Allgaier, O., Leyssens, G., Schönnenbeck, C., Brilhac, J-F., Brillard, A., and Tschamber, V.: NOx reduction based on N2 dilution in a swirled-stabilized magnesium flame, Fuel, 341, 127702, https://doi.org/10.1016/j.fuel.2023.127702, 2023.
Beck, T. R.: A New Energy-Efficient and Environmentally Friendly Process to Produce Aluminum, JOM, 65, 267–271, https://doi.org/10.1007/s11837-012-0517-8, 2013.
Bergthorson, J. M.: Recyclable metal fuels for clean and compact zero-carbon power, Prog. Energ. Combust., 68, 169–96, https://doi.org/10.1016/j.pecs.2018.05.001, 2018.
Bergthorson, J. M., Goroshin, S., Soo, M. J., Julien, P., Palecka, J., and Frost, D. L.: Direct combustion of recyclable metal fuels for zero-carbon heat and power, Appl. Energ., 160, 368–82, https://doi.org/10.1016/j.apenergy.2015.09.037, 2015.
Berro, Y. and Balat-Pichelin, M.: Metal fuels production for future long-distance transportation through the carbothermal reduction of MgO and Al2O3: A review of the solar processes, Energ. Convers. Manage., 251, 114951, https://doi.org/10.1016/j.enconman.2021.114951, 2022.
CEN: Comitéeuropéen de normalization, Workplace atmosphere: size fraction definitions for measurement of airborne particles in the workplace, CEN, Brussels (Standard EN 481), https://publications.jrc.ec.europa.eu/repository/bitstream/JRC23287/EUR 20268 EN.pdf (last access: 16 July 2024), 1992.
Cimino, A., Porta, P., and Valigi, M.: Dependence of the lattice parameter of magnesium oxide on crystallite size, J. Am. Ceram. Soc., 49, 152–155, https://doi.org/10.1111/j.1151-2916.1966.tb15394.x, 1966.
Chae, S., Lee, H., Pikhitsa, P. V., Kim, C., Shin, S., Kim, D. H., and Choi, M.: Synthesis of terraced and spherical MgO nanoparticles using flame metal combustion, Powder Technol., 305, 132–140, https://doi.org/10.1016/j.powtec.2016.09.057, 2017.
Colliex, C., Manoubi, T., Gasgnier, M., and Brown, L. M.: Near Edge Fine Structures on Electron Energy Loss Spectroscopy Core Loss Edges, Scan. Electron Micros., 2, 3, 1985.
European Commission: Critical Raw materials, https://single-market-economy.ec.europa.eu/sectors/raw-materials/areas-specific-interest/critical-raw-materials_en (last access: 16 July 2024), 2011.
Future Market Insights: Magnesium Oxide Market, 2021 Analysis and Review: Magnesium Oxide Market by Application – Industrial, Refractories, and Agricultural for 2021–2031, https://www.futuremarketinsights.com/reports/magnesium-oxide-market (last access: 1 August 2024), 2021.
Geysermans, P., Finocchi, F., Goniakowski, R., Hacquart, R., and Jupille, J.: Combination of (100), (110) and (111) facets in MgO crystals shapes from dry to wet environment, Phys. Chem. Chem. Phys., 11, 2228–2233, https://doi.org/10.1039/B812376D, 2009.
Glassman, I. and Yetter, R. A.: Combustion. Elsevier Inc., https://doi.org/10.1016/B978-0-12-088573-2.X0001-2, 2008.
Halter, F., Jeanjean, S., Chauveau, C., Berro, Y., Balat-Pichelin, M., Brilhac, J. F., Andrieu, A., Schonnenbeck, C., Leyssens, G., and Dumand, C.: Recyclable metal fuels as future zero-carbon energy carrier, Appl. Energ. Combust. Sci., 13, 100100, https://doi.org/10.1016/j.jaecs.2022.100100, 2023.
ICRP: Human respiratory tract model for radiological protection, International Commission on Radiological Protection Publication 66, Annals of the ICRP 24(1-3), Elsevier Science Ltd., Oxford, UK, https://www.icrp.org/publication.asp?id=_icrp (last access: 1 July 2024), 1994.
ISO Air Quality: Particle Size Fraction Definitions for Health-related Sampling, ISO Standard 7708, International Organization for Standardization (ISO), Geneva, https://www.iso.org/standard/14534.html (last access: 1 July 2024), 1995.
Jacobsen, S. D., Holl, C. M., Adams, K. A., Fischer, R. A., Martin, E. S., Bina, C. R., Lin, J., Prakapenka, V. B., Kubo, A., and Dera, P.: Compression of single-crystal magnesium oxide to 118 GPa and a ruby pressure gauge for helium pressure media, Am. Mineral., 93, 1823–1828, https://doi.org/10.2138/am.2008.2988, 2008.
Jiang, N. and Spence, J. C. H.: Interpretation of Oxygen K pre-edge peak in complex oxides, Ultramicroscopy, 106, 215–219, https://doi.org/10.1016/j.ultramic.2005.07.004, 2006.
Jiang, N., Su, D., and Spence, J. C. H.: Comparison of MgL23 edges in MgO and Mg (OH)2–Importance of medium-range structure, Ultramicroscopy, 109, 122–128, https://doi.org/10.1016/j.ultramic.2008.09.005, 2008.
Karimi, H. and Brouwers, H. J. H.: Accelerated thermal history of light-burnt magnesium oxide by surface properties, Results in Materials, 17, 100368 https://doi.org/10.1016/j.rinma.2023.100368, 2023.
Kouropis-Agalou, K., Liscio, A., Treossi, E., Ortolani, L., Pugno, N. M., and Palermo, V.: Fragmentation and exfoliation of 2-dimensional materials: a statistical approach, Nanoscale, 6, 5926–5933, 2014.
Laraqui, D., Leyssens, G., Schonnenbeck, C., Allgaier, O., Lomba, R., and Dumand, C.: Heat recovery and metal oxide particles trapping in a power generation system using a swirl-stabilized metal-air burner, Appl. Energ., 264, 114691, https://doi.org/10.1016/j.apenergy.2020.114691, 2020.
Lee, T.-H., Okabe, T. H., Lee, J.-Y., Kim, Y. M., and Kang, J.: Development of a novel electrolytic process for producing high-purity magnesium metal from magnesium oxide using a liquid tin cathode, J. Magnes. Alloy, 9, 1644–55, https://doi.org/10.1016/j.jma.2021.01.004, 2021.
Lomba, R., Bernard, S., Gillard, P., Mounaïm-Rousselle, C., Halter, F., and Chauveau, C.: Comparison of Combustion Characteristics of Magnesium and Aluminum Powders, Combust. Sci. Technol., 188, 1857–1877, https://doi.org/10.1080/00102202.2016.1211871, 2016.
Merli, M., Pavese, A., and Ranzini, M.: Study of the electron density in MgO, (Mg0.963Fe0.037)O and Cu2O by the maximum entropy method and multipole refinements: comparison between methods, Phys. Chem. Miner., 29, 455–465, https://doi.org/10.1007/s00269-002-0253-7, 2002.
Momma, K. and Izumi, F.: VESTA 3 for three-dimensional visualization of crystal, volumetric and morphology data, J. Appl. Crystallogr., 44, 1272–1276, 2011.
O'Shea, M., Vigliaturo, R., Choi, J. K., McKeon, T. P., Krekeler, M. P. S., and Gieré, R.: Alteration of yellow traffic paint in simulated environmental and biological fluids, Sci. Total Environ., 750, 141202, https://doi.org/10.1016/j.scitotenv.2020.141202, 2021.
Puig, J. and Balat-Pichelin, M.: Production of metallic nanopowders (Mg, Al) by solar carbothermal reduction of their oxides at low pressure, J. Magnes. Alloy, 4, 140–150, https://doi.org/10.1016/j.jma.2016.05.003, 2016.
Schindelin, J., Arganda-Carreras, I., Frise, E., Kaynig, V., Longair, M., Pietzsch, T., and Cardona, A.: Fiji: an open-source platform for biological-image analysis, Nat. Methods, 9, 676–682, https://doi.org/10.1038/nmeth.2019, 2012.
Sturm, R.: A Theoretical Approach to the Deposition of Cancer-Inducing Asbestos Fibers in the Human Respiratory Tract, Open Lung Cancer Journal, 2, 1–11, https://doi.org/10.2174/1876819900902010001, 2009.
U.S. Geological Survey: Mineral Commodity Summaries, https://doi.org/10.3133/mcs2021, 2021.
Vigliaturo, R., Pollastri, S., Gieré, R., Gualtieri, A., and Dražić, G.: Experimental quantification of the Fe-valence state on amosite asbestos boundaries using acSTEM Dual-Electron Energy-Loss Spectroscopy, Am. Mineral., 104, 1820–1828, https://doi.org/10.2138/am-2019-7218, 2019.
Vigliaturo, R., Servetto, G. P., Bittarello, E., Wehrung, Q., Brilhac, J., and Gwenaelle, T.: Dataset: Mineralogical characterization of Mg-based nanoparticles recovered from a swirled stabilized magnesium flame by TEM-SAED and ARM Dual-EELS, V1, Mendeley Data [data set], https://doi.org/10.17632/5sm5cdfgvj.1, 2024.