the Creative Commons Attribution 4.0 License.
the Creative Commons Attribution 4.0 License.
 | 12 Feb 2024
Confocal μ-XANES as a tool to analyze Fe oxidation state in heterogeneous samples: the case of melt inclusions in olivine from the Hekla volcano
Roman Botcharnikov
Max Wilke
Jan Garrevoet
Maxim Portnyagin
Kevin Klimm
Stephan Buhre
Stepan Krasheninnikov
Renat Almeev
Severine Moune
Gerald Falkenberg
Here we present a confocal Fe K-edge μ-XANES method (where XANES stands for X-ray absorption near-edge spectroscopy) for the analysis of Fe oxidation state in heterogeneous and one-side-polished samples. The new technique allows for an analysis of small volumes with high spatial 3D resolution of <100 µm3. The probed volume is restricted to that just beneath the surface of the exposed object. This protocol avoids contamination of the signal by the host material and minimizes self-absorption effects. This technique has been tested on a set of experimental glasses with a wide range of Fe3+ ΣFe ratios. The method was applied to the analysis of natural melt inclusions trapped in forsteritic to fayalitic olivine crystals of the Hekla volcano, Iceland. Our measurements reveal changes in Fe3+ ΣFe from 0.17 in basaltic up to 0.45 in dacitic melts, whereas the magnetite–ilmenite equilibrium shows redox conditions with Fe3+ ΣFe ≤0.20 (close to FMQ, fayalite–magnetite–quartz redox equilibrium) along the entire range of Hekla melt compositions. This discrepancy indicates that the oxidized nature of glasses in the melt inclusions could be related to the post-entrapment process of diffusive hydrogen loss from inclusions and associated oxidation of Fe in the melt. The Fe3+ ΣFe ratio in silicic melts is particularly susceptible to this process due to their low FeO content, and it should be critically evaluated before petrological interpretation.
Please read the corrigendum first before continuing.
-
Notice on corrigendum
The requested paper has a corresponding corrigendum published. Please read the corrigendum first before downloading the article.
-
Article
(7817 KB)
- Corrigendum
-
Supplement
(120 KB)
-
The requested paper has a corresponding corrigendum published. Please read the corrigendum first before downloading the article.
- Article
(7817 KB) - Full-text XML
- Corrigendum
-
Supplement
(120 KB) - BibTeX
- EndNote


Determination of redox conditions prevailing in magmatic systems at the time of magma genesis and evolution is essential for understanding many magmatic and volcanic processes on Earth and other terrestrial planets (e.g., Osborn, 1959; Carmichael, 1991; Bezos and Humler, 2005; Cline et al., 2018). However, the determination of the redox environment is a challenging task because it requires a well-defined redox proxy, reliable analytical approaches and calibrated instruments to convert the proxy record into the redox conditions of the system. Typically, the oxidation state of multivalent elements preserved in magmatic rocks, minerals and glasses is used as a quantitative record of the redox environment at magmatic conditions (e.g., Christie et al., 1986; Carmichael, 1991; Kelley and Cottrell, 2009; Rudra and Hirschmann, 2022). The most straightforward and developed approach is the analysis of the ferric–ferrous ratio of magmatic phases. Iron is present at high concentrations in typical magmas of mafic and intermediate compositions, and its oxidation state reflects chemical and redox evolution of magmas (e.g., Christie et al., 1986; Carmichael, 1991; Cottrell and Kelley, 2011; Kelley and Cottrell, 2012; Brounce et al., 2014; Berry et al., 2018). The relatively high concentration, typically >1 wt %, makes analytical determination of the ferric–ferrous ratio in natural rocks and glasses relatively easy in comparison to minor or trace redox-sensitive elements (e.g., Cu, V, Cr).
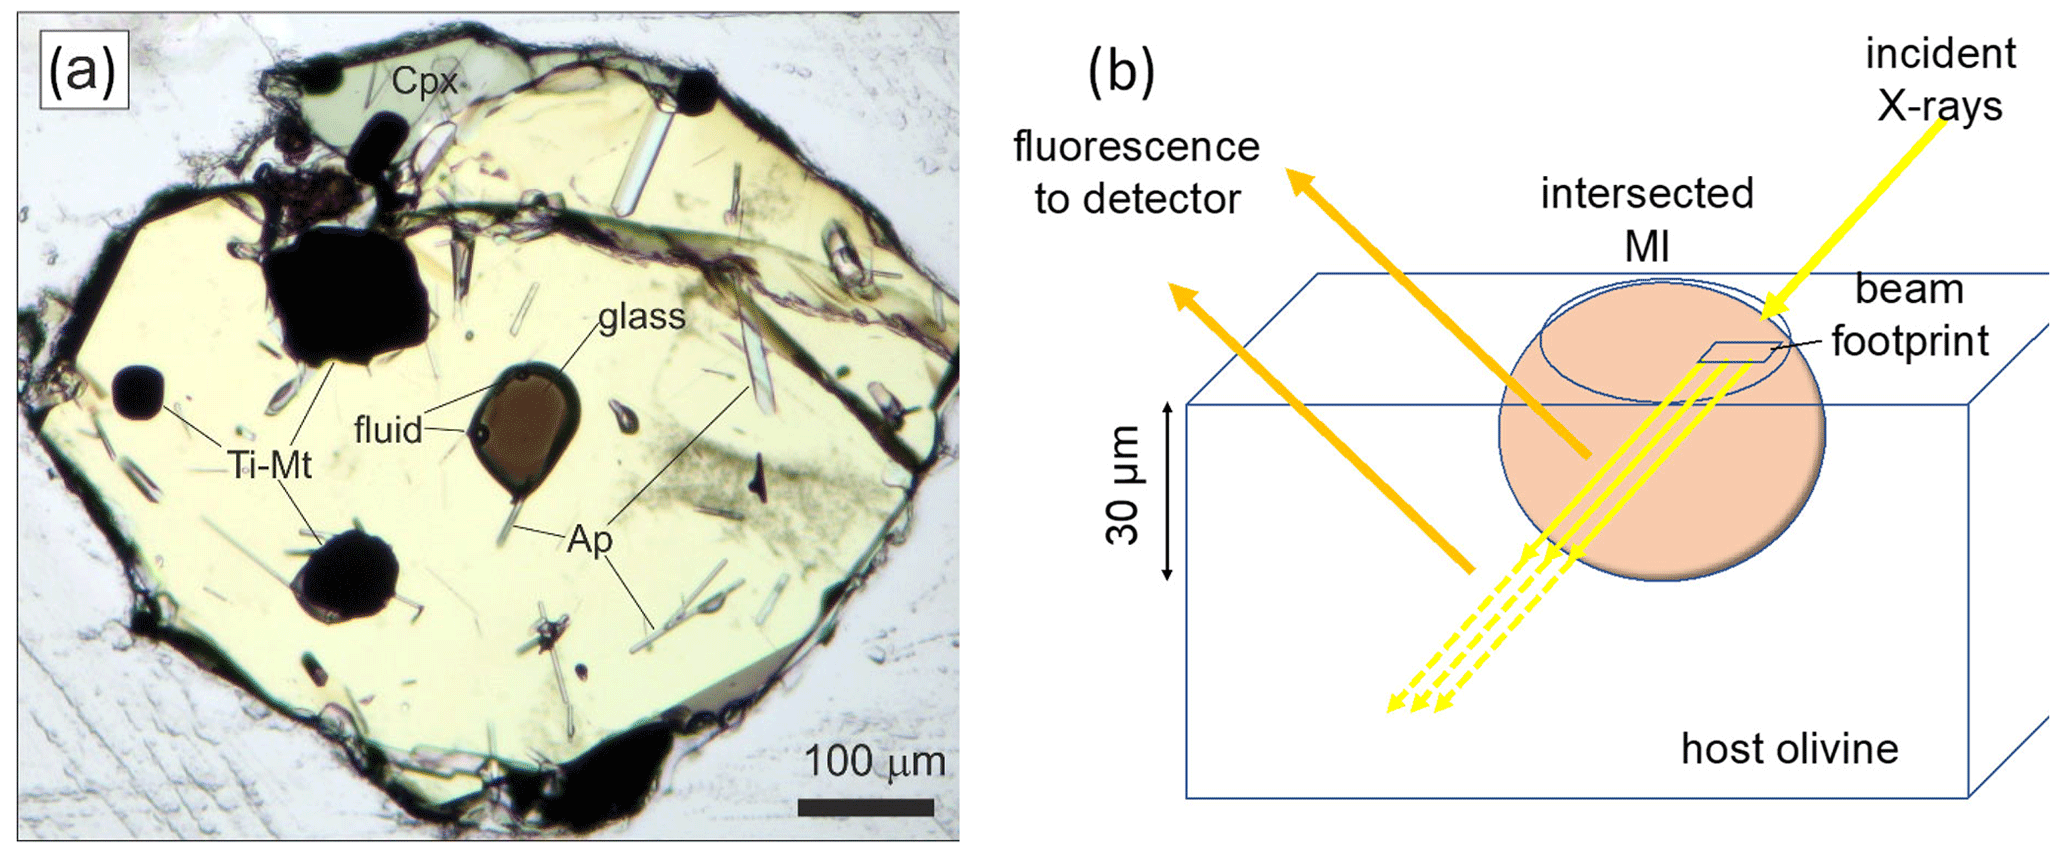
Figure 1(a) Inclusion of dacitic melt with fluid bubbles in olivine Fo12 from the Hekla volcano (sample 2H3-6-5). The other inclusions in olivine are titano-magnetite (Ti-Mt) and apatite (Ap). (b) Schematic illustration of the conventional XANES analysis of melt inclusion in olivine. Yellow arrows show the incident X-ray beam going through the sample, whereas orange arrows represent the fluorescence signal emitted at 90∘ to the incident beam. Note that the fluorescence signal also comes from the host below the melt inclusion, which affects the analytical results.
Whereas the Fe3+ Fe2+ ratio in some mineral phases can be predefined by mineral stoichiometry and less by redox conditions (e.g., in olivine), the ferric ferrous ratio of magmatic melts is strongly controlled by the prevailing oxygen fugacity (fO2) in the system. If the relationship between the melt composition, magmatic conditions, fO2 and Fe3+ Fe2+ ratio is calibrated, it can be used to evaluate the redox conditions of magma genesis (e.g., Kress and Carmichael, 1991; Botcharnikov et al., 2005; Berry et al., 2018; Borisov et al., 2018). However, magmas undergo significant physical and chemical modifications during their ascent to the surface such as crystallization and degassing that may obscure the primary compositional and redox signatures inherited at depth during magma generation and intermediate storage. Thus, investigation of rocks and even magmatic glasses quenched at near-surface conditions may result in misleading or erroneous estimates for the initial magmatic redox environment (e.g., Gaetani et al., 2012; Waters et al., 2016; Helz et al., 2017; Tou et al., 2021). A possible solution for this challenge is an investigation of melt inclusions (MIs) trapped in magmatic minerals. Their entrapment occurs during mineral growth in the magma under magmatic temperature (T), pressure (P) and redox conditions (fO2). Hence, it is believed that MIs are able to preserve key information about initial stages of magma generation, provided that post-entrapment modifications inside MIs are minimal or negligible. However, despite high expectations about the importance of redox record in melt inclusions, the validity of such an assumption remains elusive, as the existing data on the redox state of MIs are relatively scarce (see review Cottrell et al., 2021, and references therein). The reason is that typically melt inclusions are small in size (<100 µm) and contain other phases (Fig. 1a) limiting the number of reliable analytical methods that can be used to analyze the Fe oxidation state of the trapped magmas in the MI directly. Furthermore, the presence of solid and fluid phases inside MIs may be an indication of late-stage post-entrapment changes.
To overcome the problem of spatial resolution for tiny MIs, a few analytical techniques can be used. Recently, Zhang et al. (2018) and Hughes et al. (2018) have proposed analytical methods for the analysis of the Fe3+ Fe2+ ratio in silicate glasses using the electron probe microanalysis (EPMA). Although it can be applied for relatively small glass pools, it requires accurate calibration and accumulated statistics from long or multiple measurements, the results may be easily affected by beam damage, and, thus, the determined Fe3+ ∑Fe ratio has a relatively high uncertainty.
Rose-Koga et al. (2021) provided a recent overview on the methods that can be used to analyze the composition and properties of MIs, including analysis of the Fe redox state. The EMPA approaches of Zhang et al. (2018) and Hughes et al. (2018) have not been mentioned in this review paper, and the available methods, according to Rose-Koga et al. (2021), are mostly limited to the XANES technique (where XANES stands for X-ray absorption near-edge spectroscopy using synchrotron radiation source).
The Fe K-edge XANES method allows for micrometer-sized spatial resolution (Fe K-edge μ-XANES), and it has become widely used for the analysis of the ferric–ferrous ratio in numerous materials including magmatic glasses (e.g., Berry et al., 2003; Wilke et al., 2001, 2004, 2005). However, despite excellent 2D spatial resolution (up to ∼1 µm), application of Fe K-edge μ-XANES for the investigation of MIs remains challenged by the significant depth of sampling at the excitation energy of Fe (ca. 7 keV). In samples prepared in the usual way, i.e., one-side polishing, the beam excites significant depths of the sample. The X-ray attenuation length for Fe K-alpha (Henke et al., 1993) in basaltic composition with a density of 2.7 g cm−3 and in rhyolitic composition with a density of 2.3 g cm−3 is about 50 and 70 µm, respectively. These calculated X-ray attenuation lengths imply that about one-third of the Fe fluorescence signal at 6.4 keV (coming out at 90∘ from the direction of the incident beam) will be still detectable from a depth of 50–70 µm (see Fig. 1b). This imposes limitations on the application of μ-XANES for reliable analysis of small MIs to objects with thickness >150 µm. Melt inclusions in minerals are exposed by polishing, and hence typically only about half of the original inclusion is preserved in the polished sample. This limits the available analysis depth of the MI to a few tenths of micrometers or less (Fig. 1b). Although double-polished samples were used to solve this analytical problem (e.g., Kelly and Cottrell, 2009) and double-polishing is recommended as a main approach to prepare MIs for XANES analysis (Rose-Koga et al., 2021), the preparation of thin samples is challenging, some host minerals are not transparent (e.g., spinel), one mineral grain may contain several MIs with different size (Fig. 1a) and the thickness of the double-polished section should be a few tenths of micrometers. All these factors often make double-polishing of MIs not possible or a non-efficient approach.
To overcome these limitations, we developed a confocal μ-XANES setup allowing for an analysis of small volumes with high spatial 3D resolution of <100 µm3. The confocal arrangement restricts the sampled volume to that just beneath the surface of the exposed object, thus avoiding any contamination of the signal by the host phase and even minimizing self-absorption effects at high Fe concentrations. The setup has been tested on a set of experimental glasses having a wide range of Fe3+ ΣFe ratios (as previously determined by the Mössbauer and conventional XANES methods, Botcharnikov et al., 2005). We demonstrate that the new method can be successfully applied to study Fe oxidation states in natural melt inclusions with a size of >30 µm, trapped in forsteritic to fayalitic olivine crystals.
The principle of confocal X-ray fluorescence (XRF), and along with it confocal XANES, was introduced almost 20 years ago in several studies in order to image heterogeneous samples in all three dimensions (e.g., Kanngiesser et al., 2003, 2005, 2008; Vekemans et al., 2004; Vincze et al., 2004). These studies highlighted the possibility of obtaining tomography-like X-ray fluorescence data to visualize, e.g., trace-element distribution in a semi-quantitative way. Schmitz et al. (2009) used the 3D capability of this setup for restricting the sampled volume of the micro-XRF analysis to the one close to the surface in order to determine crystallization ages from the signals of Pb, U and Th in monazite and to perform chemical age dating of relatively young ages, i.e., at low radiogenic Pb concentrations. Kanngiesser et al. (2012) and Lühl et al. (2014) extended such 3D techniques to provide depth profiles using XANES on a layered system of various medieval ceramics, glasses and Fe oxides found on Athenian vases (sixth and fifth century BC). Here, we combine in a similar manner a submicron-sized X-ray beam from an undulator source with a focusing polycapillary optics in front of the XRF detector to achieve a confocal setup (Fig. 2). This arrangement allows for performing Fe K-edge XANES on a restricted volume in order to measure small melt inclusions exposed within Fe-bearing and Fe-rich crystalline phases.
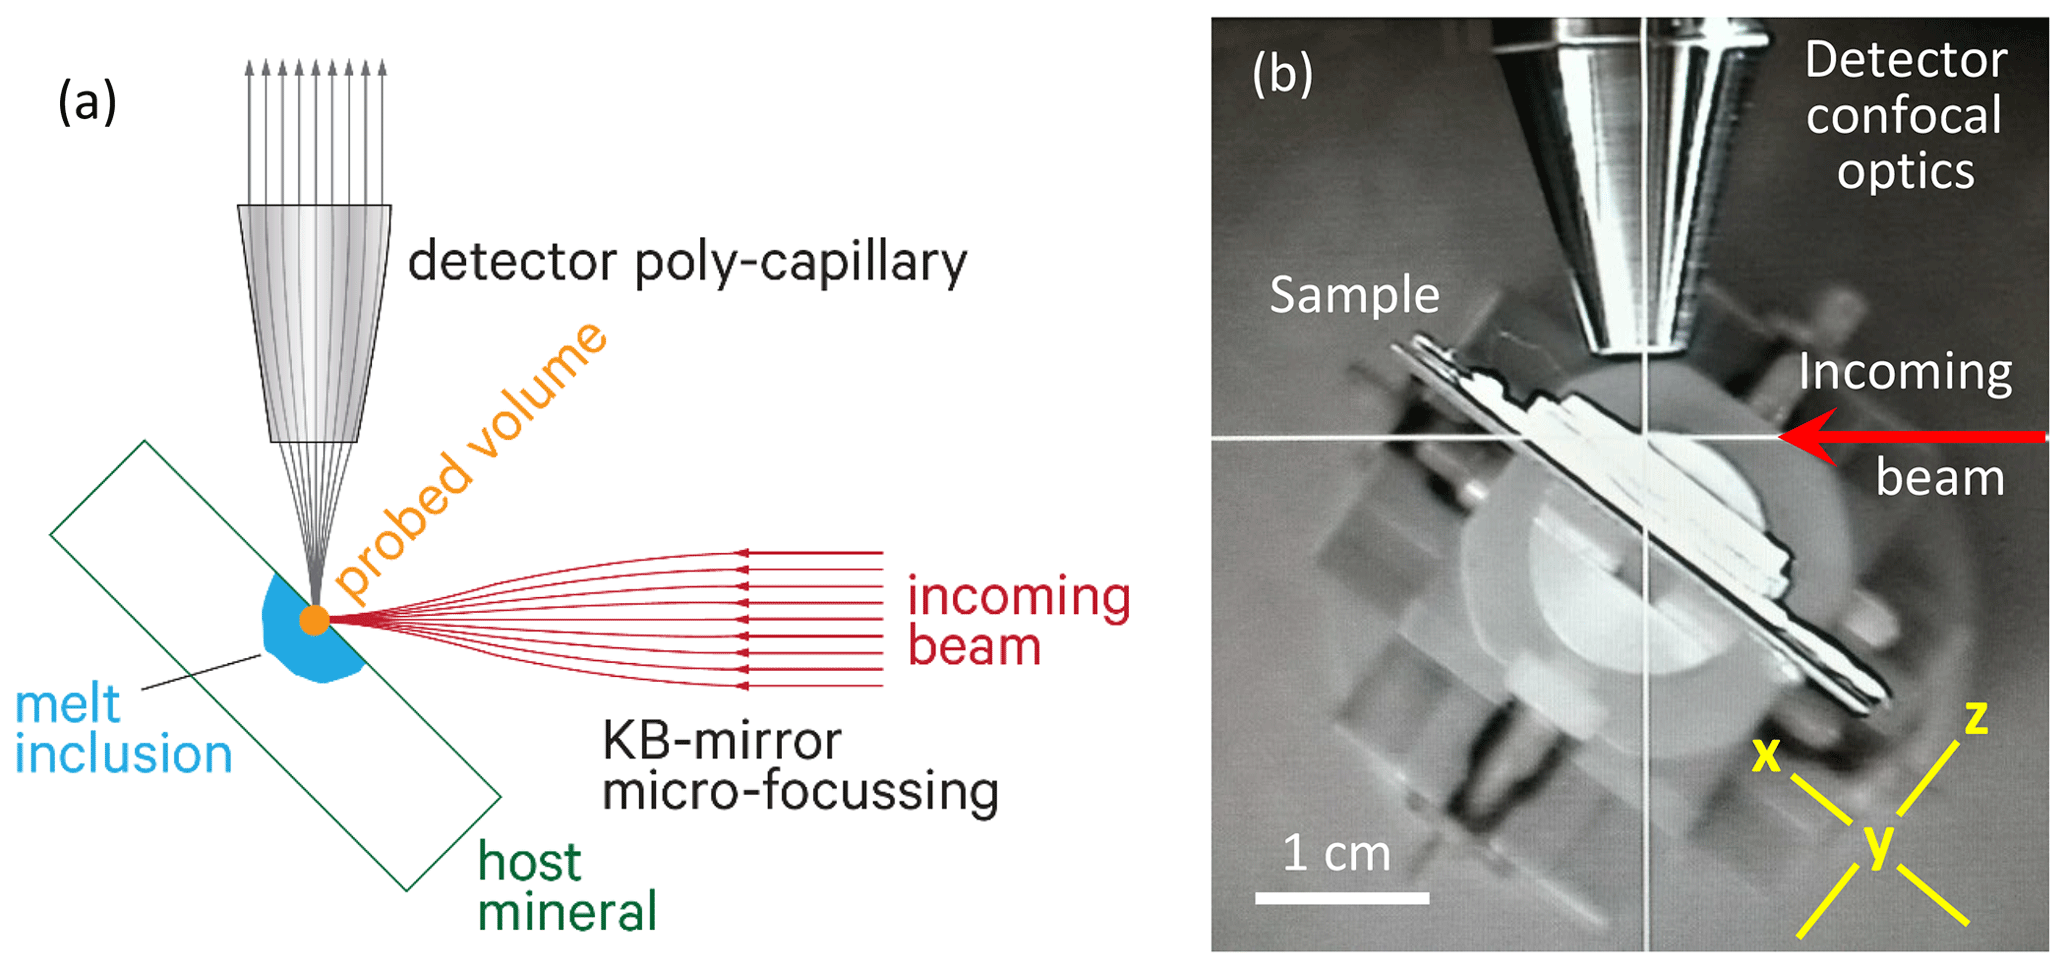
Figure 2(a) Sketch of the confocal setup for μ-XRF or μ-XANES measurements. The orange circle illustrates the overlap of the two foci of incoming beam and detector polycapillary half lens. The two foci define the probed volume at the surface of a melt inclusion (shown in blue). (b) Photograph of the sample setup seen from the top. The red arrow shows the direction of the incoming beam. Yellow lines show the x and z coordinate directions, whereas the y direction is perpendicular to the image plane.
2.1 Experimental
The experimental setup for the confocal Fe K-edge μ-XANES was established at the microprobe end station of the P06 beamline of the PETRA III synchrotron radiation source at DESY, Hamburg, Germany. The microprobe end station provides a beam size down to 0.35×0.35 µm2 at a photon flux of 1010 photons per second in the spot. For the measurements in this study, the spot size was about 0.8×1.2 µm2. The radiation from a 2 m U32 undulator was monochromatized by a Si(111) double-crystal monochromator providing an energy resolution of ca. eV. Higher harmonics were rejected using a pair of mirrors with a bare silica stripe after the monochromator. The final focus was achieved by a KB-mirror system. The intensity of the incoming beam was monitored in front of and behind the KB mirror for normalization of the fluorescence signal. A polycapillary half lens designed by X-Ray Optical Systems (XOS®) with a focal spot at a distance of 2.5 mm was mounted on a Si-drift detector, which was set at a 90∘ angle to the incoming beam to detect the fluorescence signal from the sample.
The sample was placed in the sample holder so that the sample surface was oriented at 45∘ to the incoming beam and hence at 45∘ to the detector capillary (Fig. 2). The positioning of the sample could be visualized by a microscope and controlled by high-precision x–y–z driving motors of the sample stage. Using a 7.5 µm thin Fe-metal foil as a reference sample, the two foci of the beam and the detector capillary were adjusted to each other as shown in Fig. 2a, so that they define a restricted excitation volume. The depth of the confocal volume was measured by scanning this Fe foil through the excitation volume, and a value for FWHM (full width at half maximum) of 30 µm was determined, which represents the true value convoluted with the thickness of the Fe foil. In this study, the excitation volume defined by the beam and detector optics is used to restrict the measured volume to that close to the surface in order to minimize contributions from deeper parts of the sample. To achieve this, a depth scan in the z direction (Fig. 2b) was performed after adjustment on a given melt inclusion in the focal spot in order to set the optimum depth position.
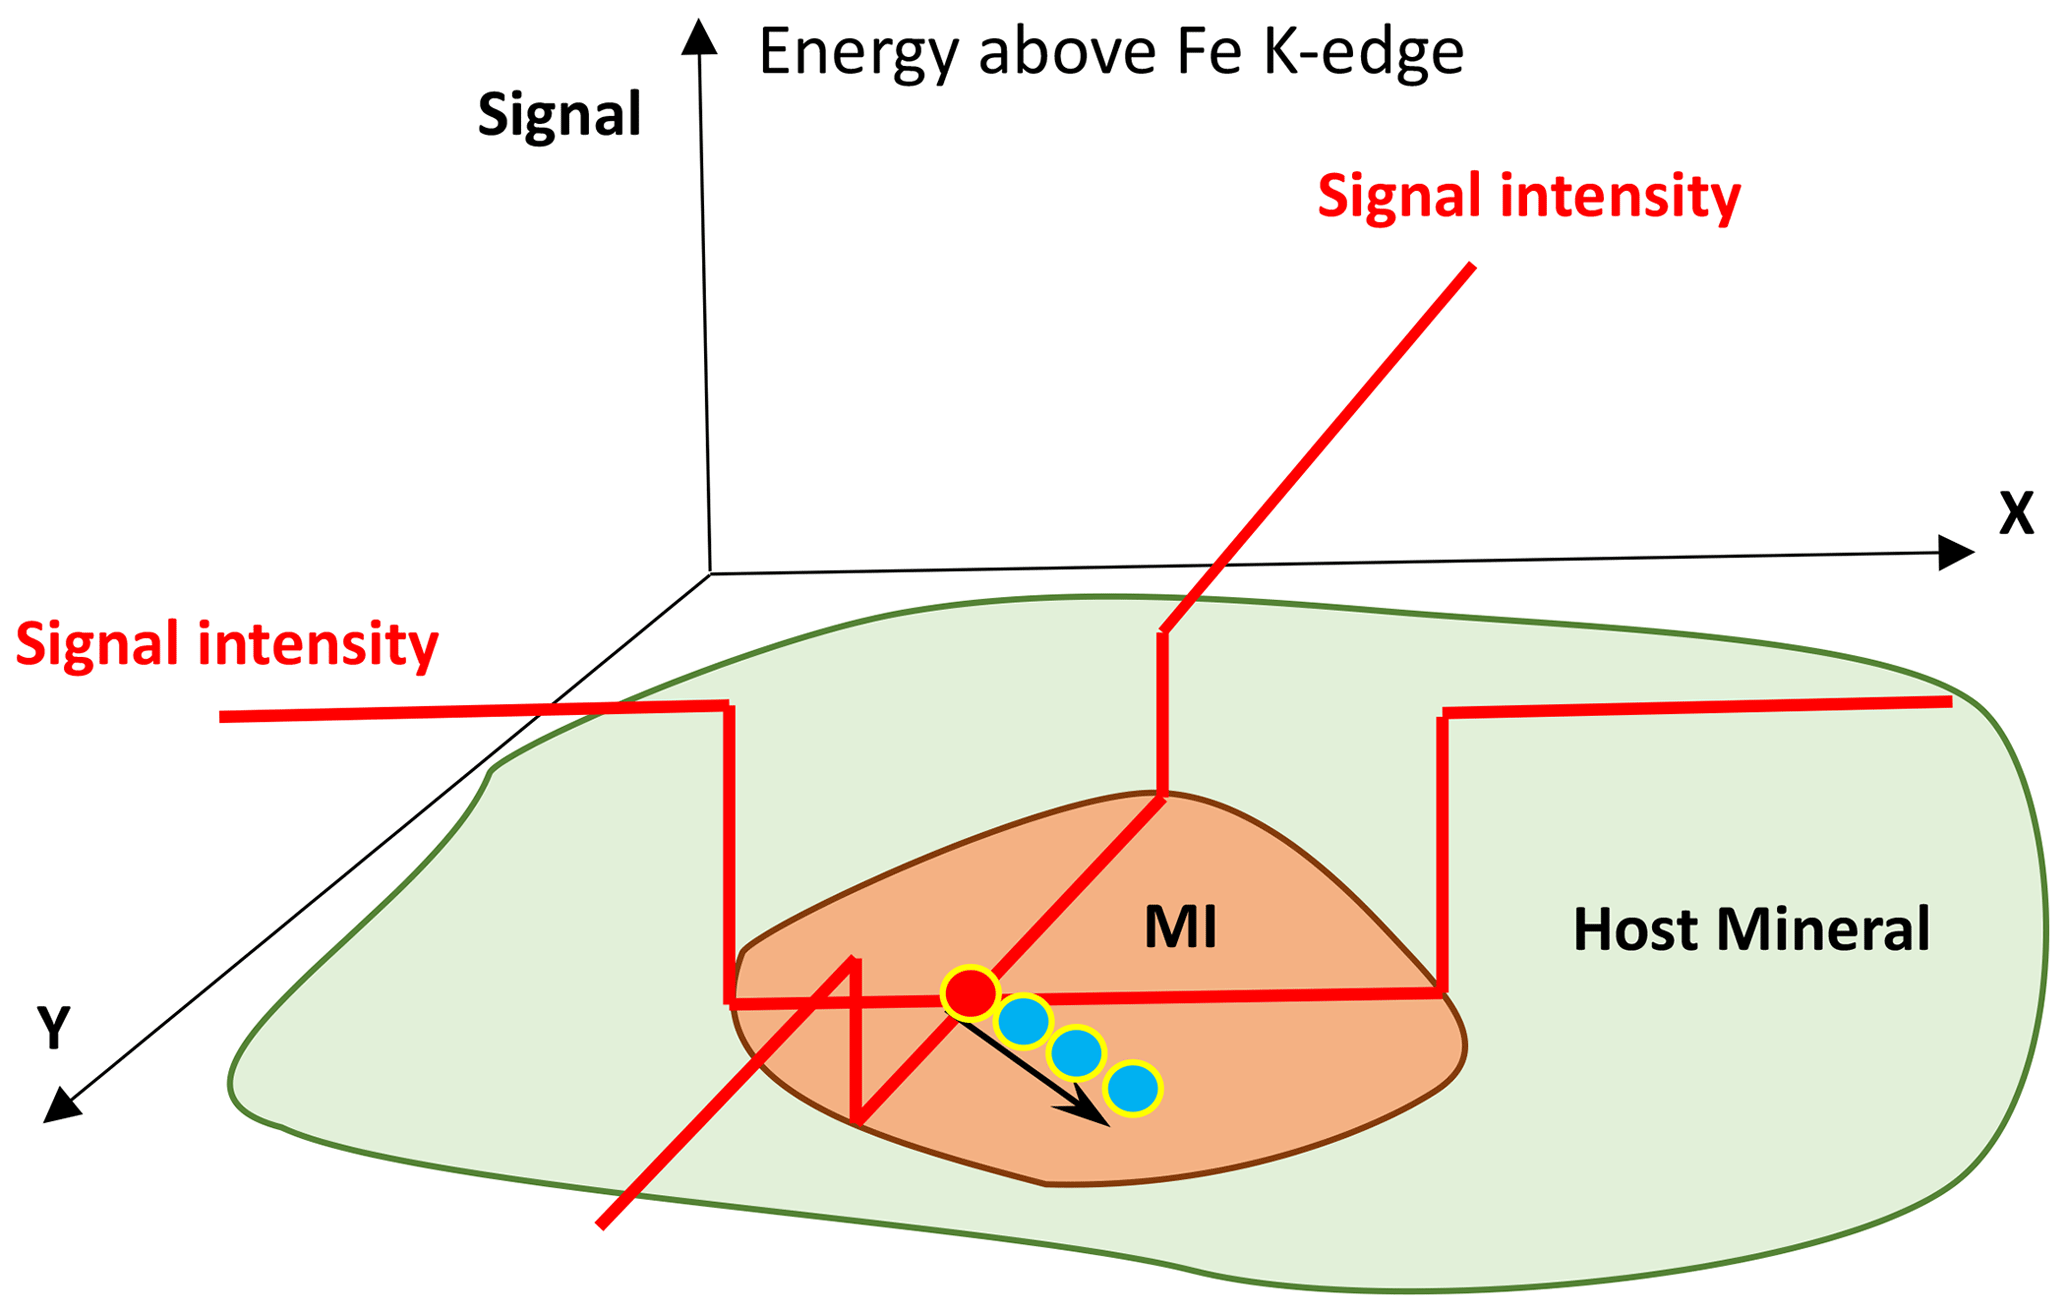
Figure 3Schematic illustration for the search of the optimum position on a melt inclusion by using x–y–z scans of the Fe XRF intensity. After focusing optically on the surface of the MI (orange field), the inclusion was scanned with the X-ray beam in the x and y directions to allocate the inclusion, which corresponds to a region of low intensity within the mineral host (green field) due to lower Fe content in MI (see red lines illustrating signal intensity). Finally, the optimum depth of the confocal volume with respect to the surface was found by a z scan at 90∘ to the sample surface (see Fig. 2b) at the x–y position defined for the measurement (red point on MI). The three blue points and black arrow schematically illustrate 1 µm movement of the beam after each scan during analysis to avoid beam damage.
The adjustment of the x–y position was achieved by scanning the sample in the x (horizontal) and y (vertical) directions (Fig. 2b). Since the signal intensity depends on the amount of Fe in the sample, the signal contrast resembles contribution from the host mineral with high Fe content (e.g., olivine) and from the MI with lower Fe content. The adjustment of the measurement spot is schematically illustrated in Fig. 3. After localization of the optimal x–y position on the surface of the MI, it was scanned along the z axis (at 90∘ to the MI surface, but 45∘ to the incoming beam; see Fig. 2b) to identify the optimal depth of the confocal volume with respect to the surface. The maximum signal of the z scan corresponds to the region just beneath the sample surface, and to further minimize any contamination from the host mineral, the sample was moved along the z axis so that the excitation volume was slightly “above” the sample surface.
Two beam time sessions were used to develop and apply this setup. During the first one, XANES spectra were recorded in step-scan mode; i.e., the monochromator and undulator were moved to a given energy point, and then the signal was integrated over 1 or 2 s for the pre-edge region (between 7105 and 7125 eV). This resulted in a considerable amount of overhead time for moving and settling of the monochromator and undulator, so that 9 min was needed in total for a single scan, where the total integration time of the sample signal was only 210 s. To improve this technique, in the second session, continuous scanning of the monochromator and undulator was used, which was already proven to provide high-quality X-ray absorption spectroscopy (XAS) spectra (Chernikov et al., 2016) and was set up to work with the electronics of the XRF detector.
In order to optimize the acquisition time and sampling rate in terms of eV steps, the spectra were taken in two scans: one covering only the pre-edge region and edge jump (7105–7125 eV), resulting in a high sampling rate and small steps (0.11 eV) across the pre-edge region, and a second scan over the entire range from 7080 to 7250 eV with 0.4 eV step. Each of these scans took about 1 min. The fluorescence signal was normalized to the intensity of the incoming beam, the two scans were merged, and then the spectra were normalized to the edge jump and analyzed. The pre-edge intensity and centroid position were determined using the fitting procedure developed by Wilke et al. (2004) using 7111.08 eV as the reference energy position of metallic Fe.
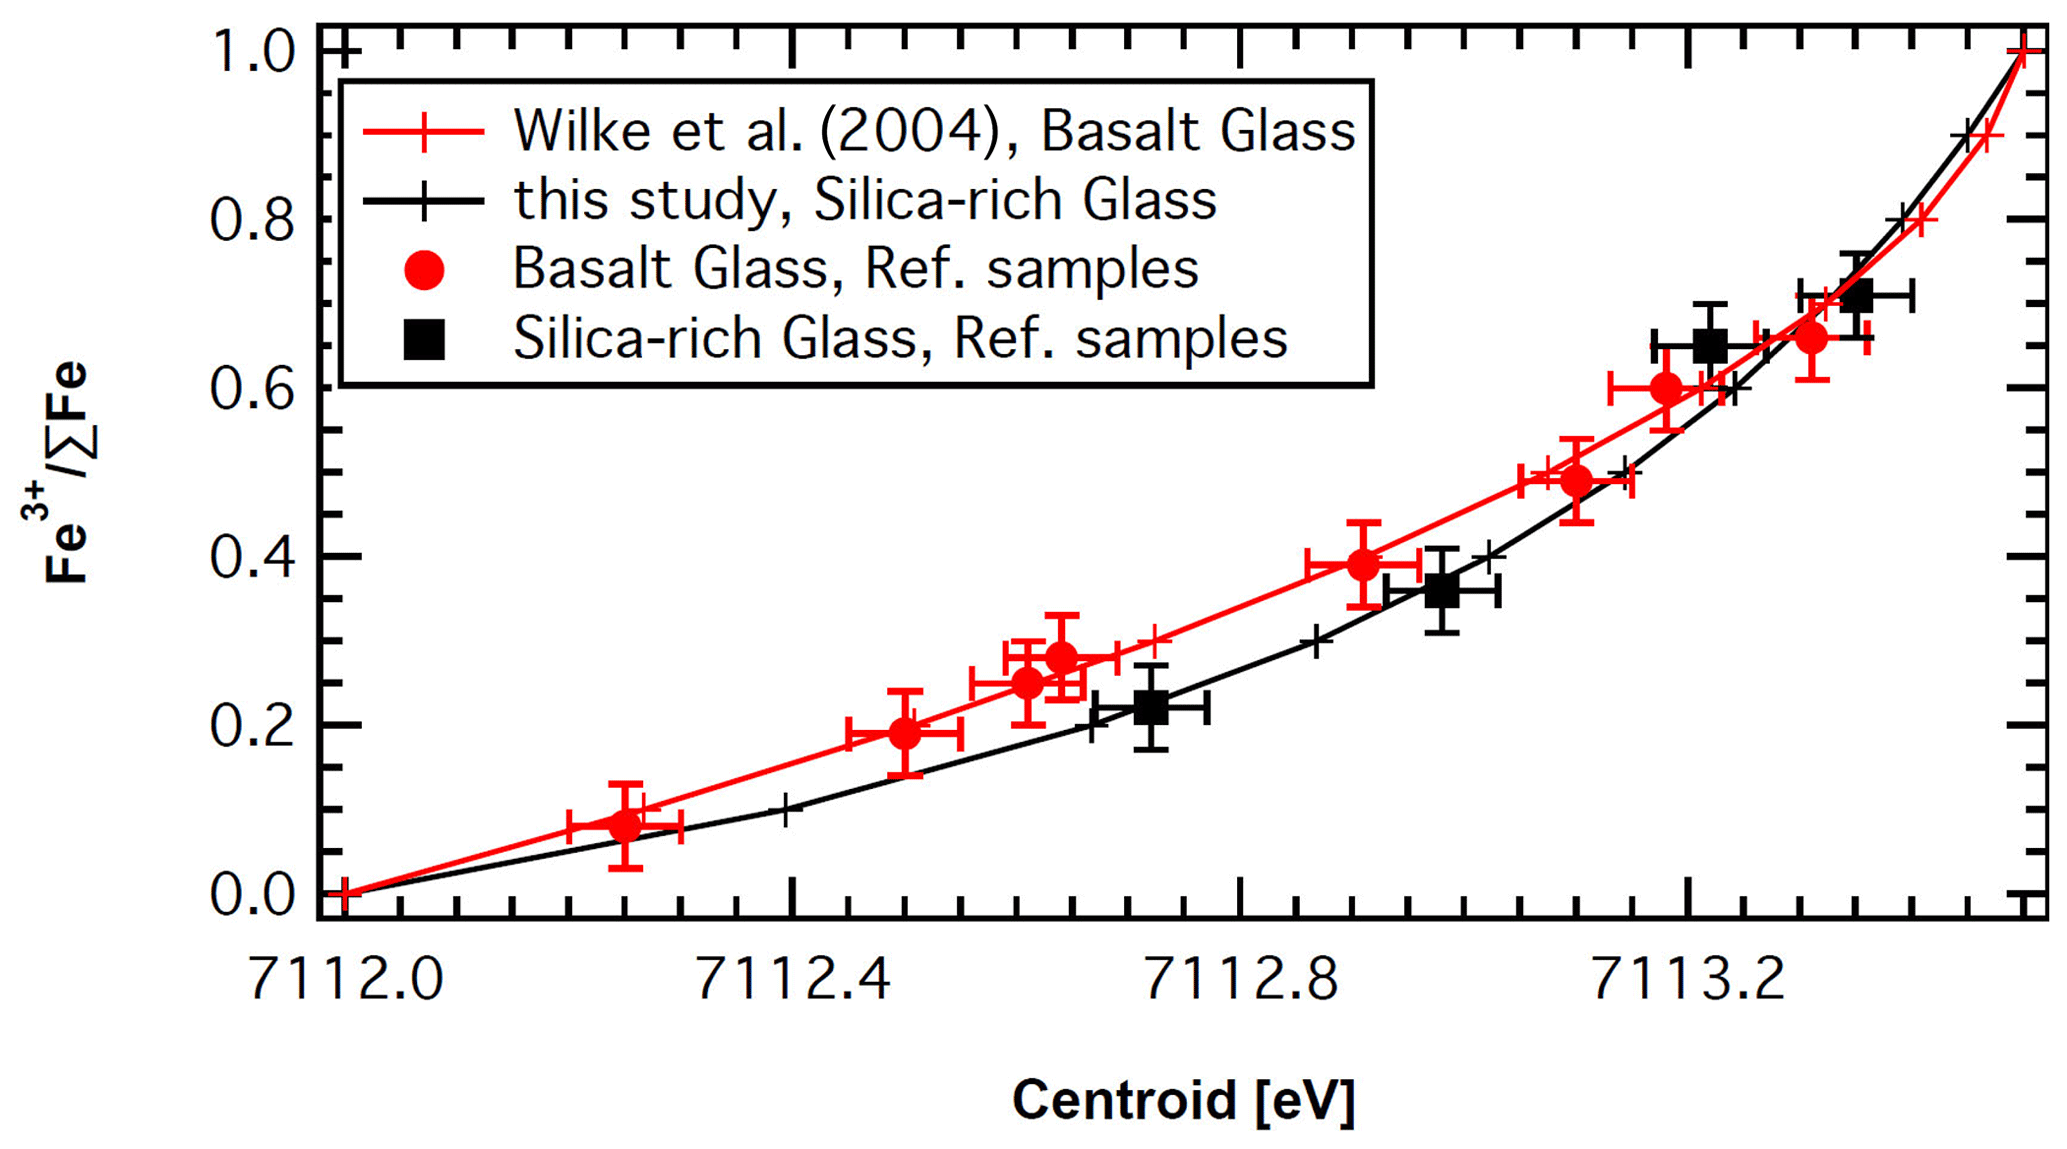
Figure 4Relationship between Fe3+ ΣFe and centroid [eV] for reference samples. Red circles represent basaltic glasses after Botcharnikov et al. (2005), with the centroid measured by confocal XANES and the Fe3+ ΣFe values determined using the Mössbauer method. The red circles are compared with the polynomial (red line) proposed by Wilke et al. (2004). The black line is constructed based on the variogram of Wilke et al. (2004) for silica-rich samples, and it is compared to the values (black squares) determined for silica-rich haplotonalitic (Wilke et al., 2002, 2006), haplogranitic (Wilke et al., 2007) and rhyolitic samples (see text for equation and further details).
2.2 Calibration and samples
The Fe oxidation state in the glasses was determined using the variogram for the pre-edge centroid and intensity proposed by Wilke et al. (2001, 2004). The polynomial of Fe3+ ΣFe vs. centroid (red line in Fig. 4) proposed by Wilke et al. (2004) describes well the data for reference basaltic glasses (red squares in Fig. 4), where the centroid was determined by confocal XANES and Fe3+ ΣFe was analyzed by the Mössbauer method (Botcharnikov et al., 2005). However, some of the measured melt inclusions in our study have rhyolitic composition, and, thus, application of the calibration made on basaltic glass may potentially lead to an overestimation of the ferric content. This is due to a potentially higher amount of tetrahedral Fe3+ in this type of highly polymerized glass. Tetrahedral Fe in general leads to stronger pre-edge intensities due to stronger p character of the unoccupied electronic d states that hybridize with p orbitals of the oxygen (e.g., Wilke et al., 2007; Cottrell et al., 2009; Fiege et al., 2017). Data on haplogranitic and haplotonalitic glasses have shown that Fe2+ in these glasses produces similar pre-edge intensities to those of basaltic and alkali-silicate glasses (Wilke et al., 2006, 2007). To account for the difference for Fe3+ between basaltic and silica-rich compositions, we used the centroid variation of Fe between the reduced silica-rich glass and the tetrahedral Fe3+ in the variogram for the pre-edge centroid and intensity (Wilke et al., 2001, 2004). This calibration is represented by the black line in Fig. 4.
In order to test this calibration, we used literature data on Fe-bearing haplotonalitic compositions (Wilke et al., 2002, 2006); own unpublished data for a haplogranitic sample, used as a starting material in Wilke et al. (2007); and new data determined on a rhyolitic composition (see Supplement Table for details). For the three latter samples, the Fe3+ ∑Fe ratio in the glass was determined by the wet-chemical and spectroscopic technique of Schüssler et al. (2008). The constructed trend (black line in Fig. 4) fits well to the data points of the silica-rich samples (black squares in Fig. 4). Thus, the Fe3+ ∑Fe of silica-rich glasses can be determined from the pre-edge centroid [eV] as follows (black line in Fig. 4):
Figure 4 shows that the trends for basaltic and silica-rich glasses differ considerably for reduced samples but merge for samples with Fe3+ ∑Fe >0.6. Both calibrations were used for the processing of analytical data obtained in this study.
The confocal capability of the method was tested using slices of oxidized basaltic glass (SC1-oxi) with thickness of 30, 50, 80, 100, 200 and 300 µm mounted on a piece of San Carlos olivine. The calibrated and optimized setup was applied to analyze melt inclusions in forsteritic to fayalitic olivines from the Hekla volcano, Iceland.
2.3 Beam damage
Intense X-ray beams, as provided by an undulator source, may easily alter the oxidation state of elements in a given sample. These effects scale with the photon dose, and they are well known in organic and biological tissue and usually become more severe at low energy. Strong oxidation state alteration in silicate glasses was reported for S (Wilke et al., 2008), but also the Fe oxidation state in glasses may be altered at high photon flux and particularly in water-bearing samples (Cottrell et al., 2018). Defocusing and attenuation of the beam were proposed as necessary requirements to minimize the beam damage at high photon flux (Cottrell et al., 2018). However, since the high spatial resolution was a prerequisite in our methodology, any defocusing of the beam was not applicable. Hence, to avoid beam damage, the incoming beam had been attenuated by Al filters before focusing. The level of attenuation was optimized by test measurements on the ferrobasaltic glass in sample B11 after Botcharnikov et al. (2005), which contains about 5 wt % H2O and has an Fe3+ ΣFe ratio of about 0.25. We performed repeated XANES scans on the same spot. Beam damage was immediately visible by a shift of the main edge position and changes in the pre-edge region. Further, we monitored the signal at 7117 eV (main edge) over time. A constant signal was indicative of damage-free beam conditions, and it was achieved only at 98 % attenuation on the B11 sample, which corresponds to 108 photons per second in the focus of 0.8×1.2 µm2 of the incident beam. Furthermore, since several (depending on Fe content of the MI) scans were summed up to achieve good counting statistics, after each scan the sample was moved by 1 µm to avoid long exposure on a single spot (see Fig. 3). These measures resulted in negligible beam damage on all investigated reference materials and samples (see below).
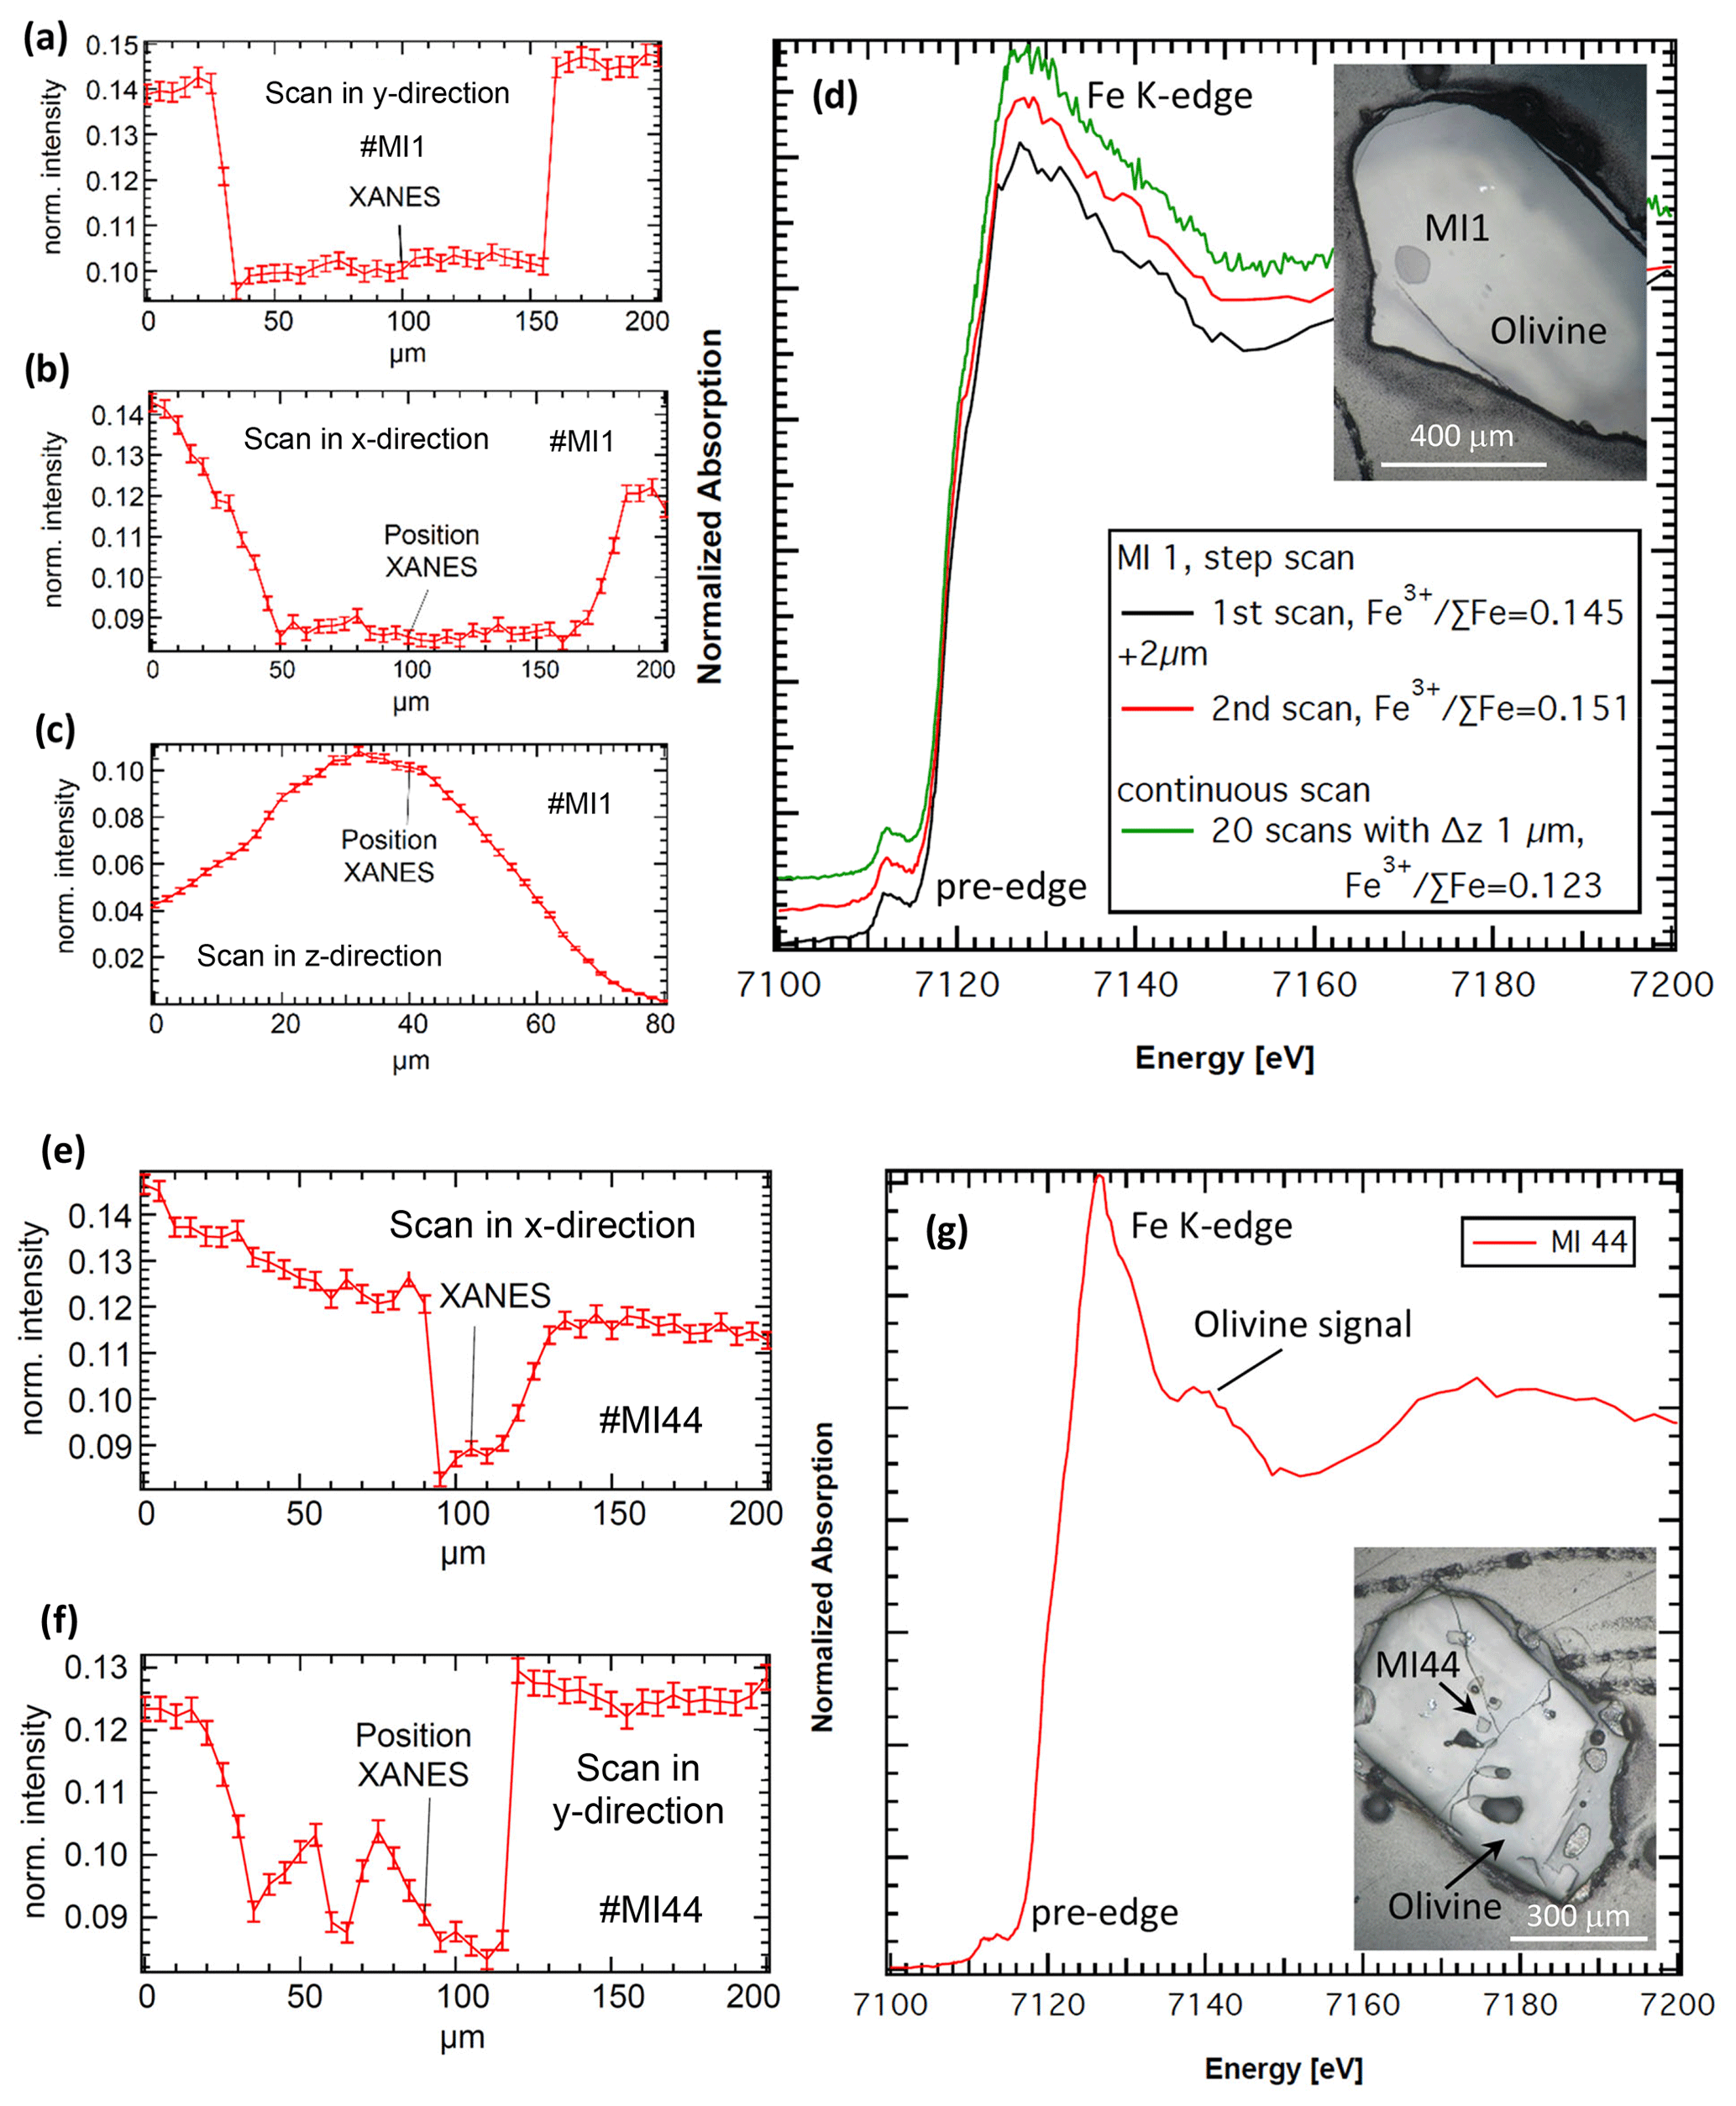
Figure 5Example of scans in the (a) y, (b) x and (c) z directions (see also Fig. 2b) across a basaltic melt inclusion no. MI1 in olivine (inlet photo) showing the Fe fluorescence intensity. The low-intensity regions in the x and y scan directions correspond to the melt inclusion due to lower Fe content. The z scan in panel (c) was started from the sample depth across the surface, and the maximum of the z scan corresponds to the region just beneath the sample surface. To restrict the excited volume to the volume close to the surface, a position to the right of this maximum was chosen (indicated as “Position XANES”). (d) XANES spectra taken on melt inclusion no. MI1 and corresponding Fe3+ ∑Fe: two spectra taken in step-scan mode on two spots separated by 2 µm (black and red lines); and one spectrum taken in continuous scanning mode, which represents the average of 20 individual scans (green line). (e)–(f) Similar to panels (a)–(b) but showing a case exemplifying the limits of the setup on a small and thin melt inclusion (no. MI44, inlet photo). (g) Corresponding XANES spectrum for no. MI44 that clearly shows contamination of the signal from MI by the signal from host olivine (sharp peak at the edge position and shoulder at the 7140 eV characteristic for crystalline materials).
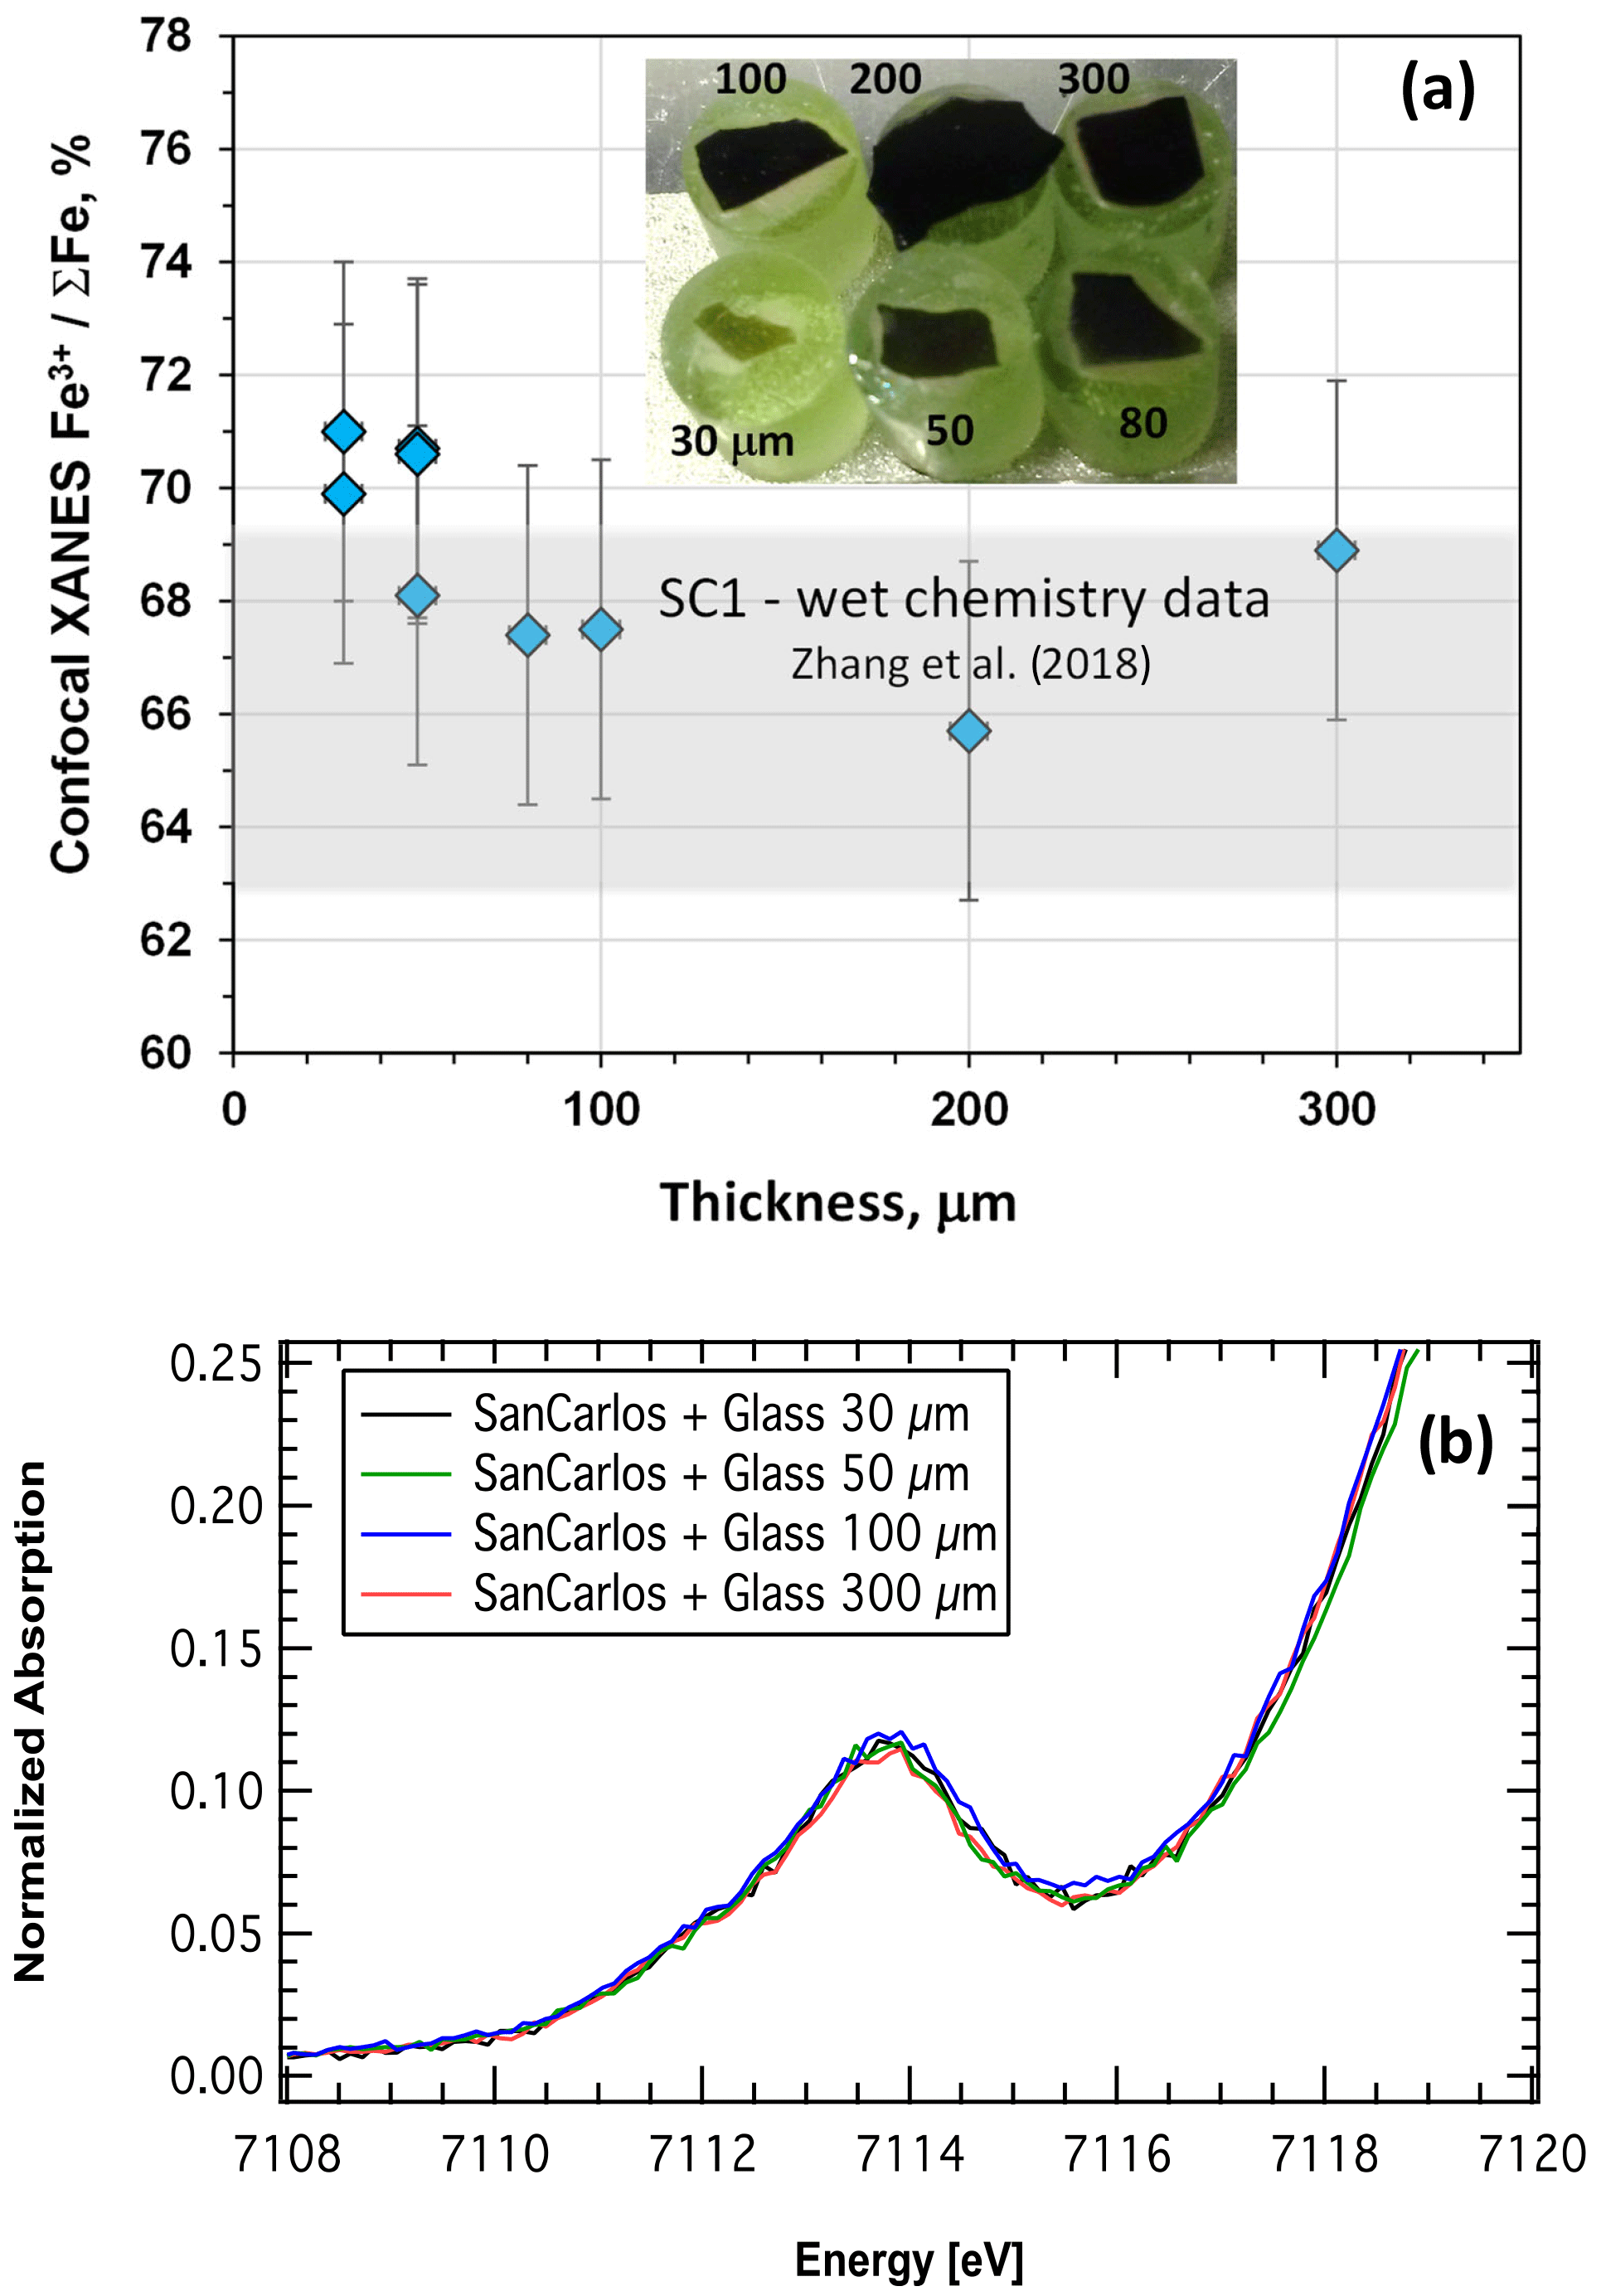
Figure 6(a) The Fe3+ ∑Fe of oxidized basaltic glass chips fixed on San Carlos olivine cylinders as a function of thickness (see photo in inlet – green represents olivine cylinders and dark brown represents the glass chips; numbers close to the olivine cylinders show the thickness of the glass chips in µm). The grey area on the diagram represents the Fe3+ ∑Fe of the oxidized glass determined by wet chemistry (A39 sample after Zhang et al., 2018). The sample with thickness of 30 µm was measured twice at different spots, whereas the sample of 50 µm was measured three times at different spots. Note that all results agree within analytical uncertainty and the determined Fe3+ ∑Fe values correspond to the value obtained by wet chemistry (Zhang et al., 2018). (b) Zoom of the pre-edge region for spectra prior to background subtraction of the glasses fixed on San Carlos olivine.
3.1 Spatial resolution and data quality
Figure 5 shows examples of XRF-intensity scans in all x–y–z directions for the location of the measurement spot (Fig. 5a–c and e–f) as well as the resulting XANES spectra for two melt inclusions in an olivine matrix (Fig. 5d and g). In the first example, no. MI1 (sample from mid-ocean ridge basalt, MORB), a comparison between XANES data taken in step-scan mode (black and red lines in Fig. 5d) and continuous mode (green line in Fig. 5d) is shown. In both cases, counting statistics in the pre-edge region are sufficient for the analysis. However, data taken in continuous mode provide better sampling statistics over the entire scan range (compare green line with red and black lines in Fig. 5d). Further, the step-scan data demonstrate slightly higher Fe3+ contents (Fe3+ ∑Fe = 0.145 after the first scan and Fe3+ ∑Fe = 0.151 after the second scan) when compared with data from the continuous scan mode (Fe3+ ∑Fe = 0.123). This effect might result from a longer dwell time on the given spot and potential beam damage. Continuous-scan data are the result of 20 individual scans on the position always shifted by 1 µm (see Fig. 3). The second example illustrates the limits of spatial resolution on no. MI44 (sample from arc basalt) that is relatively wide in the y direction but thin in the z direction as indicated by the small maximum in the center of the y scan, presumably resembling contribution from the underlying olivine host. Further, no. MI44 is only 30 µm wide in the x direction. The resulting XANES shows clear contamination by the signal from the host olivine as evident from the sharp signal peak at the K-edge position and from the prominent signal shoulder at the ca. 7140 eV characteristic for crystalline materials. The spatial resolution in the x direction is particularly limited by the fact that the sample surface is set up at 45∘ towards the incoming beam. Thus, inclusions that are too thin may still easily show contaminating signal by the host mineral. Possible complex geometry or chemical heterogeneity of the inclusion may also potentially affect the quality of the analysis and should be taken into account.
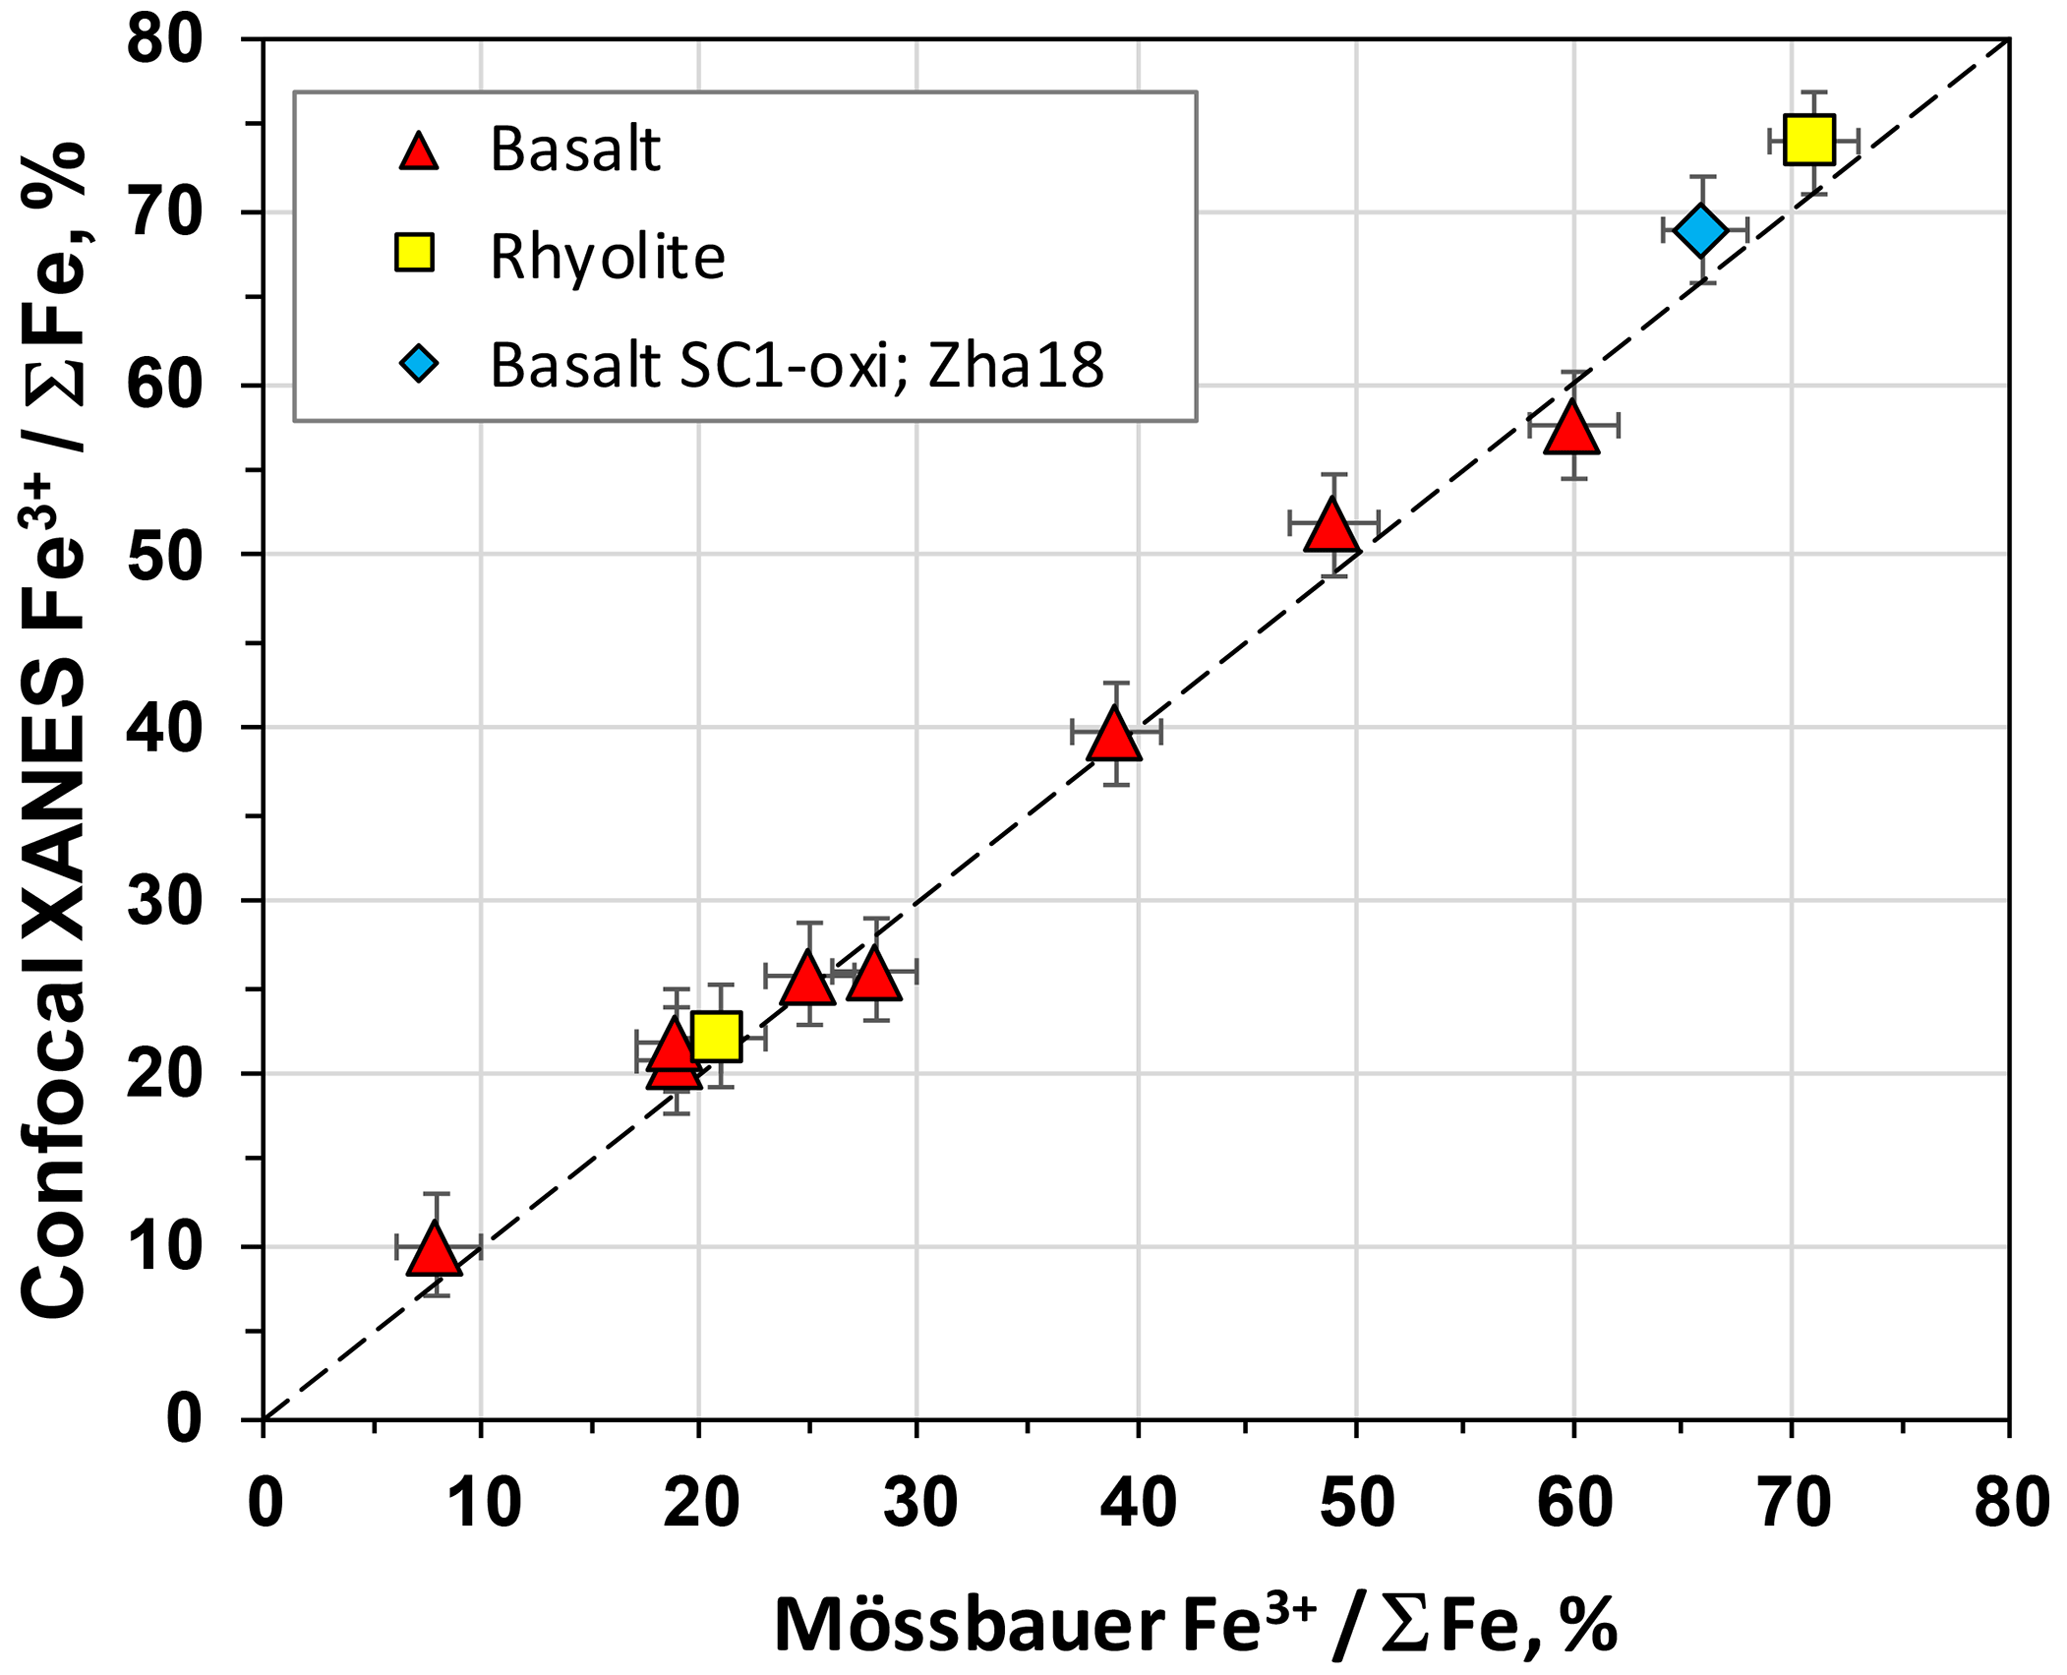
Figure 7Comparison between Fe3+ ΣFe measurements conducted by confocal XANES and Mössbauer or wet-chemistry (Schuessler et al., 2008) methods (see Supplement Table). Red triangles represent basaltic samples after Botcharnikov et al. (2005). The blue square is the basaltic glass sample SC1-oxi (identical to the sample A39 in Zhang et al., 2018, Zha18). Yellow squares are rhyolite samples IBR_02.
In order to test the limits of the confocal approach, a set of glass chips was prepared and fixed on the polished cylinders of San Carlos olivine. The glass chips were made of double-polished oxidized ferrobasaltic glass (the same composition as in Botcharnikov et al., 2005) with a thickness of 30, 50, 80, 100, 200 and 300 µm. The glass chips were hot-pressed onto the olivine crystal surface using a thin layer of wax. The thickness of the wax layer was estimated to be ca. 1–2 µm. Because the glass is very oxidized (66 % Fe3+, SC1-oxi sample from this study and A39 sample after Zhang et al., 2018) and amorphous, whereas the olivine is crystalline and contains only Fe2+, potential contamination of the Fe-XANES glass signal by the olivine signal should be easily visible. The results of this test are illustrated in Fig. 6a. The Fe3+ ΣFe ratio is identical for all glass chips independent of thickness, within error. This is particularly emphasized by the zoom on the pre-edge region prior to background subtraction (Fig. 6b). The small variability found in the final results is thus only related to the background subtraction procedure. The determined values also agree with wet-chemistry data for this glass (grey field in Fig. 6a). Any contamination by olivine should shift the Fe3+ ΣFe to lower values, which is not observed. Further, none of spectra shows extra features at the main edge region that may stem from olivine. This simple test implies that the confocal method is applicable for the melt inclusions with a thickness down to at least 30–40 µm.
3.2 Analysis of reference materials
The optimized confocal technique was tested on reference glasses with known Fe3+ ΣFe ratio (Supplement Table). A set of ferrobasaltic glass samples from the study of Botcharnikov et al. (2005) was analyzed. The Fe3+ ΣFe of these samples was determined previously by Mössbauer and XANES in the study of Botcharnikov et al. (2005) and used later to investigate the sensitivity of glasses to beam damage (Cottrell et al., 2018). The proportion of Fe3+ in these glasses varies from <10 % to 60 %. Additional reference material (SC1-oxi) is the oxidized (Fe3+ ΣFe = 66%) ferrobasaltic glass synthesized at 1600 ∘C and ambient pressure in air (identical to the sample A39 in Zhang et al., 2018). Two synthetic rhyolite glasses (unpublished data) were analyzed using wet chemistry (method of Schuessler et al., 2008). Figure 7 shows that reference values of plotted samples are consistent with Fe oxidation state values derived using the pre-edge region (see polynomials in Fig. 4). Thus, it demonstrates that the Fe3+ ΣFe is reproduced within analytical uncertainty by the new confocal technique in all reference glasses, indicating that the analytical setup is robust and that beam damage is avoided.
3.3 Melt inclusions in olivines from the Hekla volcano
The new method was applied for the analysis of melt inclusions in olivine from the Hekla volcano, Iceland. The magmas erupted from Hekla show not only a high variability in melt composition from basaltic to rhyolitic but also a rare case of olivine crystals with forsterite number (Fo = Mg (Mg + Fe) in moles) varying from ca. Fo84 in basalts to Fo3 in rhyolites (e.g., Moune et al., 2007; Portnyagin et al., 2012; Lucic et al., 2016; Geist et al., 2021). The most recent studies concluded that erupted rocks of Hekla represent a series of magmas originated predominantly by extensive (up to 90 %) fractional crystallization with little crustal interaction in a tabular vertically oriented macro-dike extending from the lower to the upper crust (Geist et al., 2021). The parental mafic magmas contained about 0.6 wt % H2O and were generated at relatively reducing conditions close to FMQ (FMQ is fayalite–magnetite–quartz redox equilibrium) (Moune et al., 2007; Portnyagin et al., 2012). Evolving magmas show increasing H2O and K2O concentrations up to ∼6.2 wt % and ∼3 wt %, respectively, with an almost constant mass ratio H2O K2O of 2–2.3 in melt inclusions, which trapped the least degassed melts or lost minimal amounts of hydrogen by diffusion through the olivine host (Portnyagin et al., 2012; Lucic et al., 2016; Geist et al., 2021). Variations in redox conditions of the Hekla magmas fall within ±0.5 log units of the FMQ buffer as estimated from the compositions of coexisting magnetites and ilmenites enclosed in olivine and pyroxene phenocrysts (Portnyagin et al., 2012; Schattel et al., 2014; Geist et al., 2021). Such a narrow range of redox conditions and absence of any correlation with H2O content in magmas were interpreted as a decoupling between water activity and oxygen fugacity in the Hekla magmatic system and as an inheritance of redox signature from the mantle source (Portnyagin et al., 2012; Schattel et al., 2014). In other words, it was suggested that magma differentiation occurred at conditions open to oxygen, and, thus, it may reflect redox conditions in the off-rift Icelandic crust (Schattel et al., 2014).
However, although the data for H2O content and magma composition were obtained for melt inclusions, the estimates on the redox conditions were derived indirectly by analyzing mineral inclusions of Mt and Ilm in phenocrysts. Although it was claimed that ilmenite–magnetite pairs can preserve redox signature from depths of rhyolitic magma chambers and that this signature is not affected by water degassing (Waters and Lange, 2016), kinetic experiments showed that redox equilibria of Fe–Ti oxides can be significantly modified by changes in the external T–fO2 conditions within hours (Venezky and Rutherford, 1999; Hou et al., 2021). Only the assumption of complete chemical isolation of mineral inclusions within the host olivine during magmatic evolution would allow an assessment of the redox signature from depth. Furthermore, recently Humphreys et al. (2022) suggested that basaltic melt inclusions can record late-stage redox evolution of degassing magmas and that this process is decoupled from diffusive re-equilibration of the H2O content in the inclusions. These examples clearly demonstrate a controversy of redox record interpretations in natural magmatic systems and a need for better understanding of redox proxies.
Table 1Compositions of melt inclusions from the Hekla volcano.
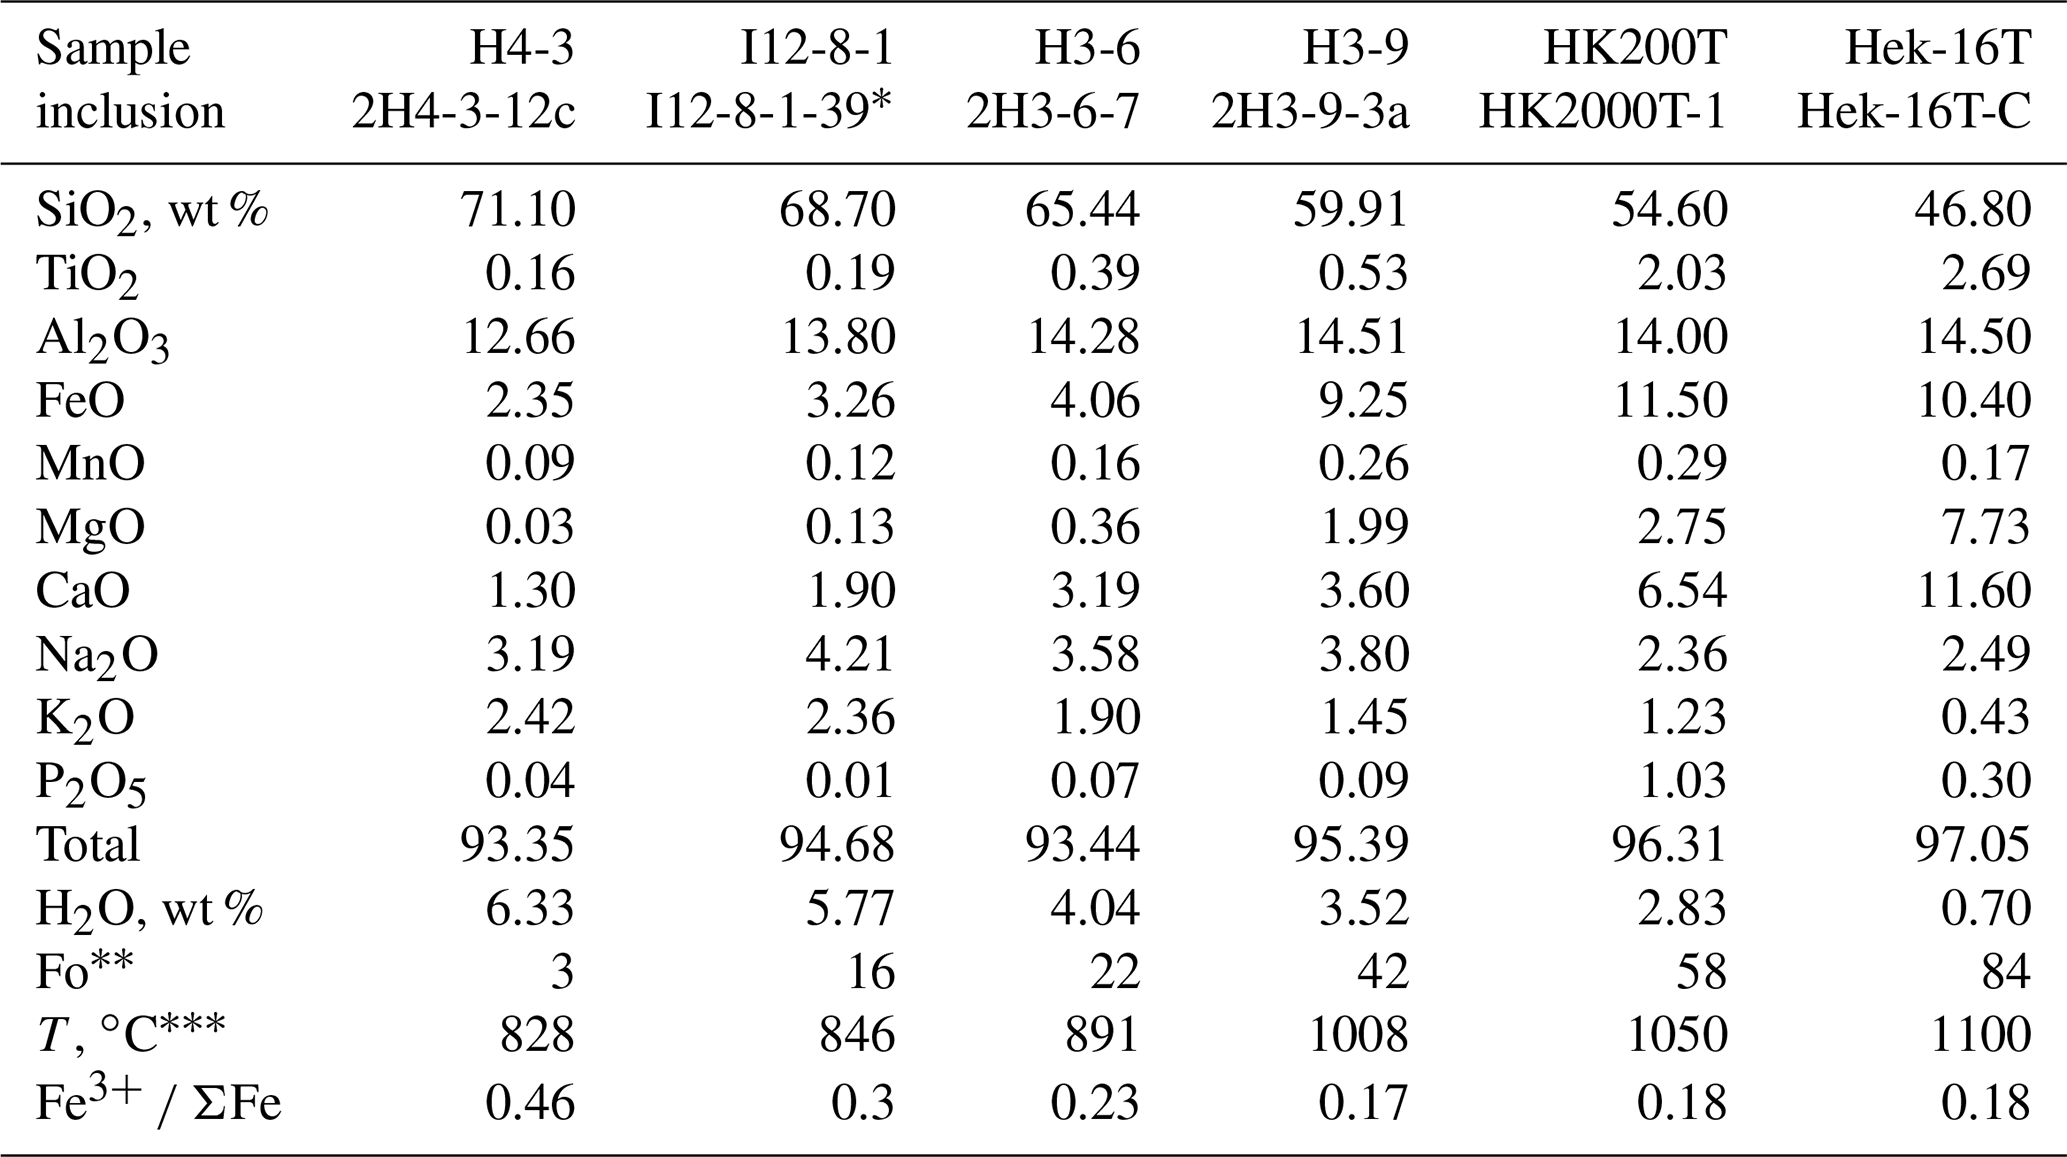
∗ Melt inclusion I12-8-1-39 is first reported in this study; the others are after Moune et al. (2007) and Portnyagin et al. (2012). Fo number of host olivine (Mg (Mg + Fe) in moles). Temperature of the melt calculated using the olivine–melt thermometer of Putirka (2008).
The unique wide range of Hekla melt and olivine compositions allows for an important test of our confocal μ-XANES method as well as for possible volcanological implications. We have selected several olivine grains, covering the whole compositional range, from the studies of Moune et al. (2007) and Portnyagin et al. (2012). One additional MI of intermediate composition (I12-8-1-39) from the H2 Hekla eruption (1855 BC) was selected and analyzed in this study. A brief summary for the selected melt inclusions is presented in Table 1, and the compositions of melt inclusions are shown in Fig. 8.
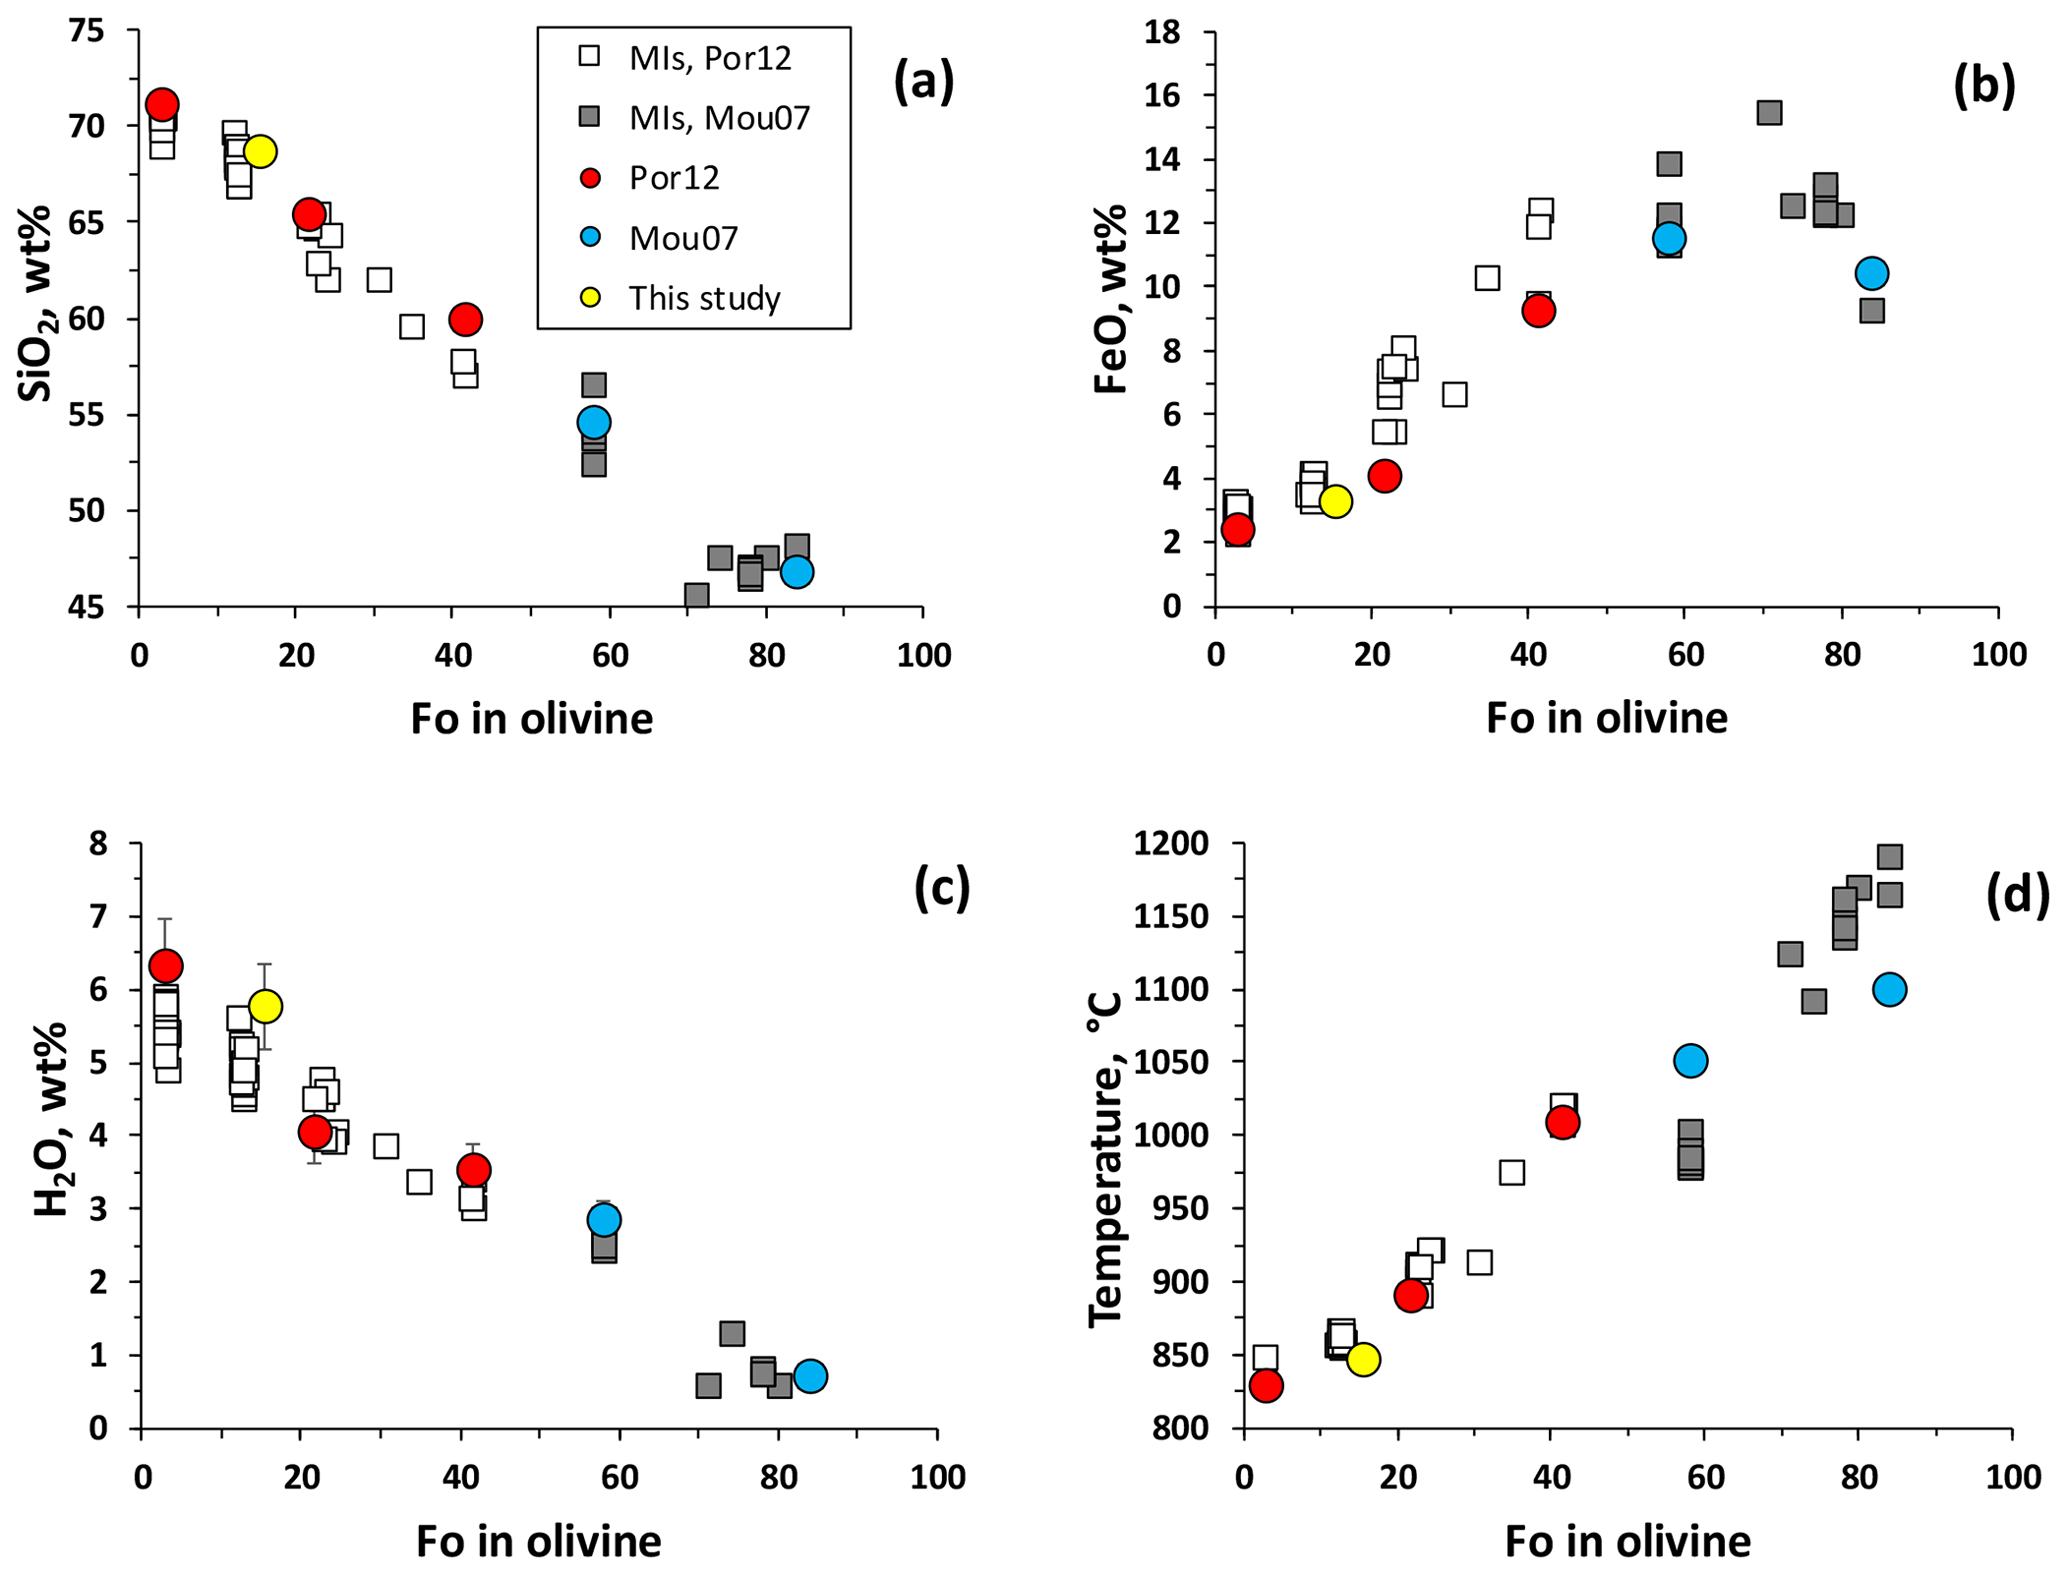
Figure 8Concentrations of SiO2 (a), FeO (b) and H2O (c) in melt inclusions (MIs) versus composition of the corresponding olivine host. Blue, red and yellow circles represent MIs selected for this study, whereas white and grey squares are the entire datasets for MIs after Portnyagin et al. (2012) and Moune et al. (2007), respectively. Panel (d) shows estimated temperatures of the magma based on the olivine–melt thermometer of Putirka (2008).
The compositions of MIs, analyzed by EMPA, demonstrate strong correlation with the composition of host olivine (Fo number) as shown in Fig. 8a (SiO2) and in Fig. 8b (FeO). The correlation is also clearly visible for the concentration of dissolved H2O (determined by SIMS) in MIs (Fig. 8c). The melt water content shows a linear relationship with the concentrations of SiO2 and K2O, demonstrating a crystal fractionation trend of the magma from basalt to rhyolite with accumulation of incompatible elements and volatiles, as discussed by Portnyagin et al. (2012). Figure 8d shows the relationship between olivine composition and temperature of the magma calculated using the thermometer of olivine–melt equilibria in the presence of H2O after Putirka (2008).
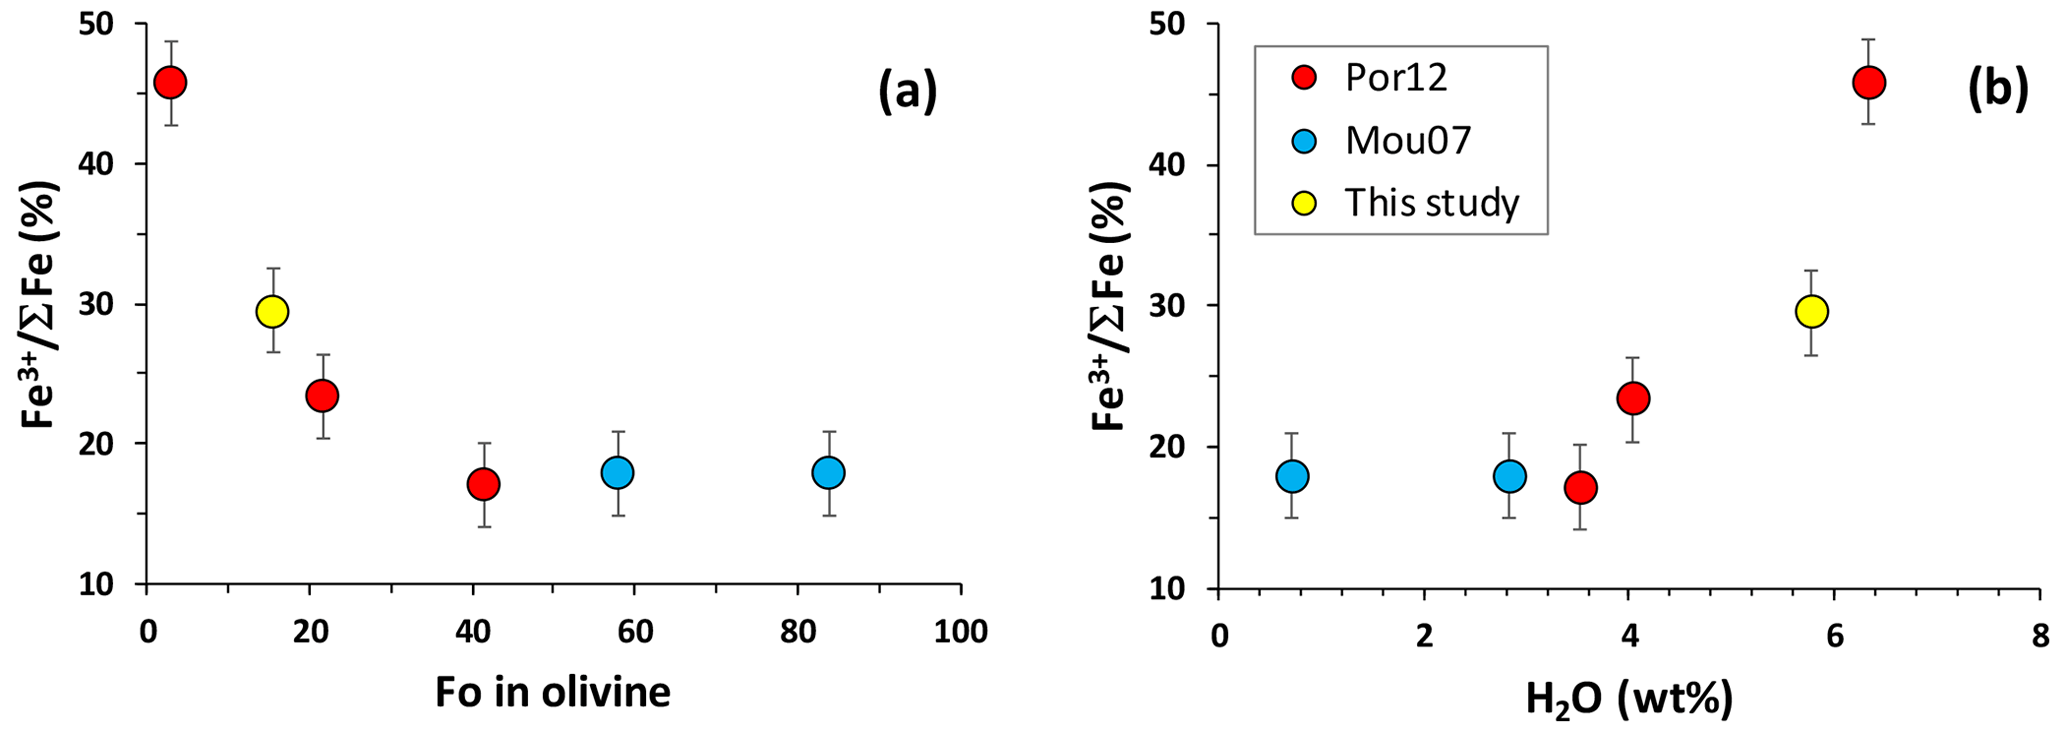
Figure 9Relationships between the Fe3+ ΣFe ratio in melt inclusions and (a) Fo number of the olivine host and (b) H2O content of melt inclusions. The data for Fe3+ ΣFe for all samples are from this study.
The analyzed Fe3+ ΣFe ratios (%) in the MIs are shown in Fig. 9 as a function of Fo number of the olivine host (Fig. 9a) and the water content of the inclusions (Fig. 9b). The results show a dramatic increase in the Fe3+ proportion from 17 % to 46 % with decreasing Fo and increasing H2O concentration. It must be noted that this increase is not linear and visible mostly for glass compositions from dacites to rhyolites, whereas andesites to basalts show almost constant Fe oxidation state.
Both decreasing Fo and increasing H2O reflect progressive differentiation of the magma. Therefore, the trends observed in Fig. 9 may indicate that differentiation was able to affect redox evolution of dacitic to rhyolitic melts and that felsic MIs recorded the external magmatic conditions. Alternatively, it may be just a result of internal processes within melt inclusions such as post-entrapment crystallization of MIs, water loss and related redox re-equilibration.
In order to unravel possible effects of external and internal processes that could be responsible for oxidation state changes in the MIs, we have estimated the extent of recorded redox modifications. We have calculated the expected variations of Fe oxidation state in the MIs as a function of melt composition, temperature and oxygen fugacity. The calculations were conducted for the compositions and temperatures of MIs reported in Table 1 using the model of Kress and Carmichael (1991) and the recent model of Borisov et al. (2018). Pressure was kept constant at 100 MPa in the calculations, despite the fact that some inclusions have high H2O content, because P is not known for every sample, and small variations in P will not significantly affect the calculated redox state of Fe. The results from both models are shown in Fig. 10 relative to the FMQ buffer (the values for the FMQ buffer at given T–P were calculated after Schwab and Küstner, 1981).
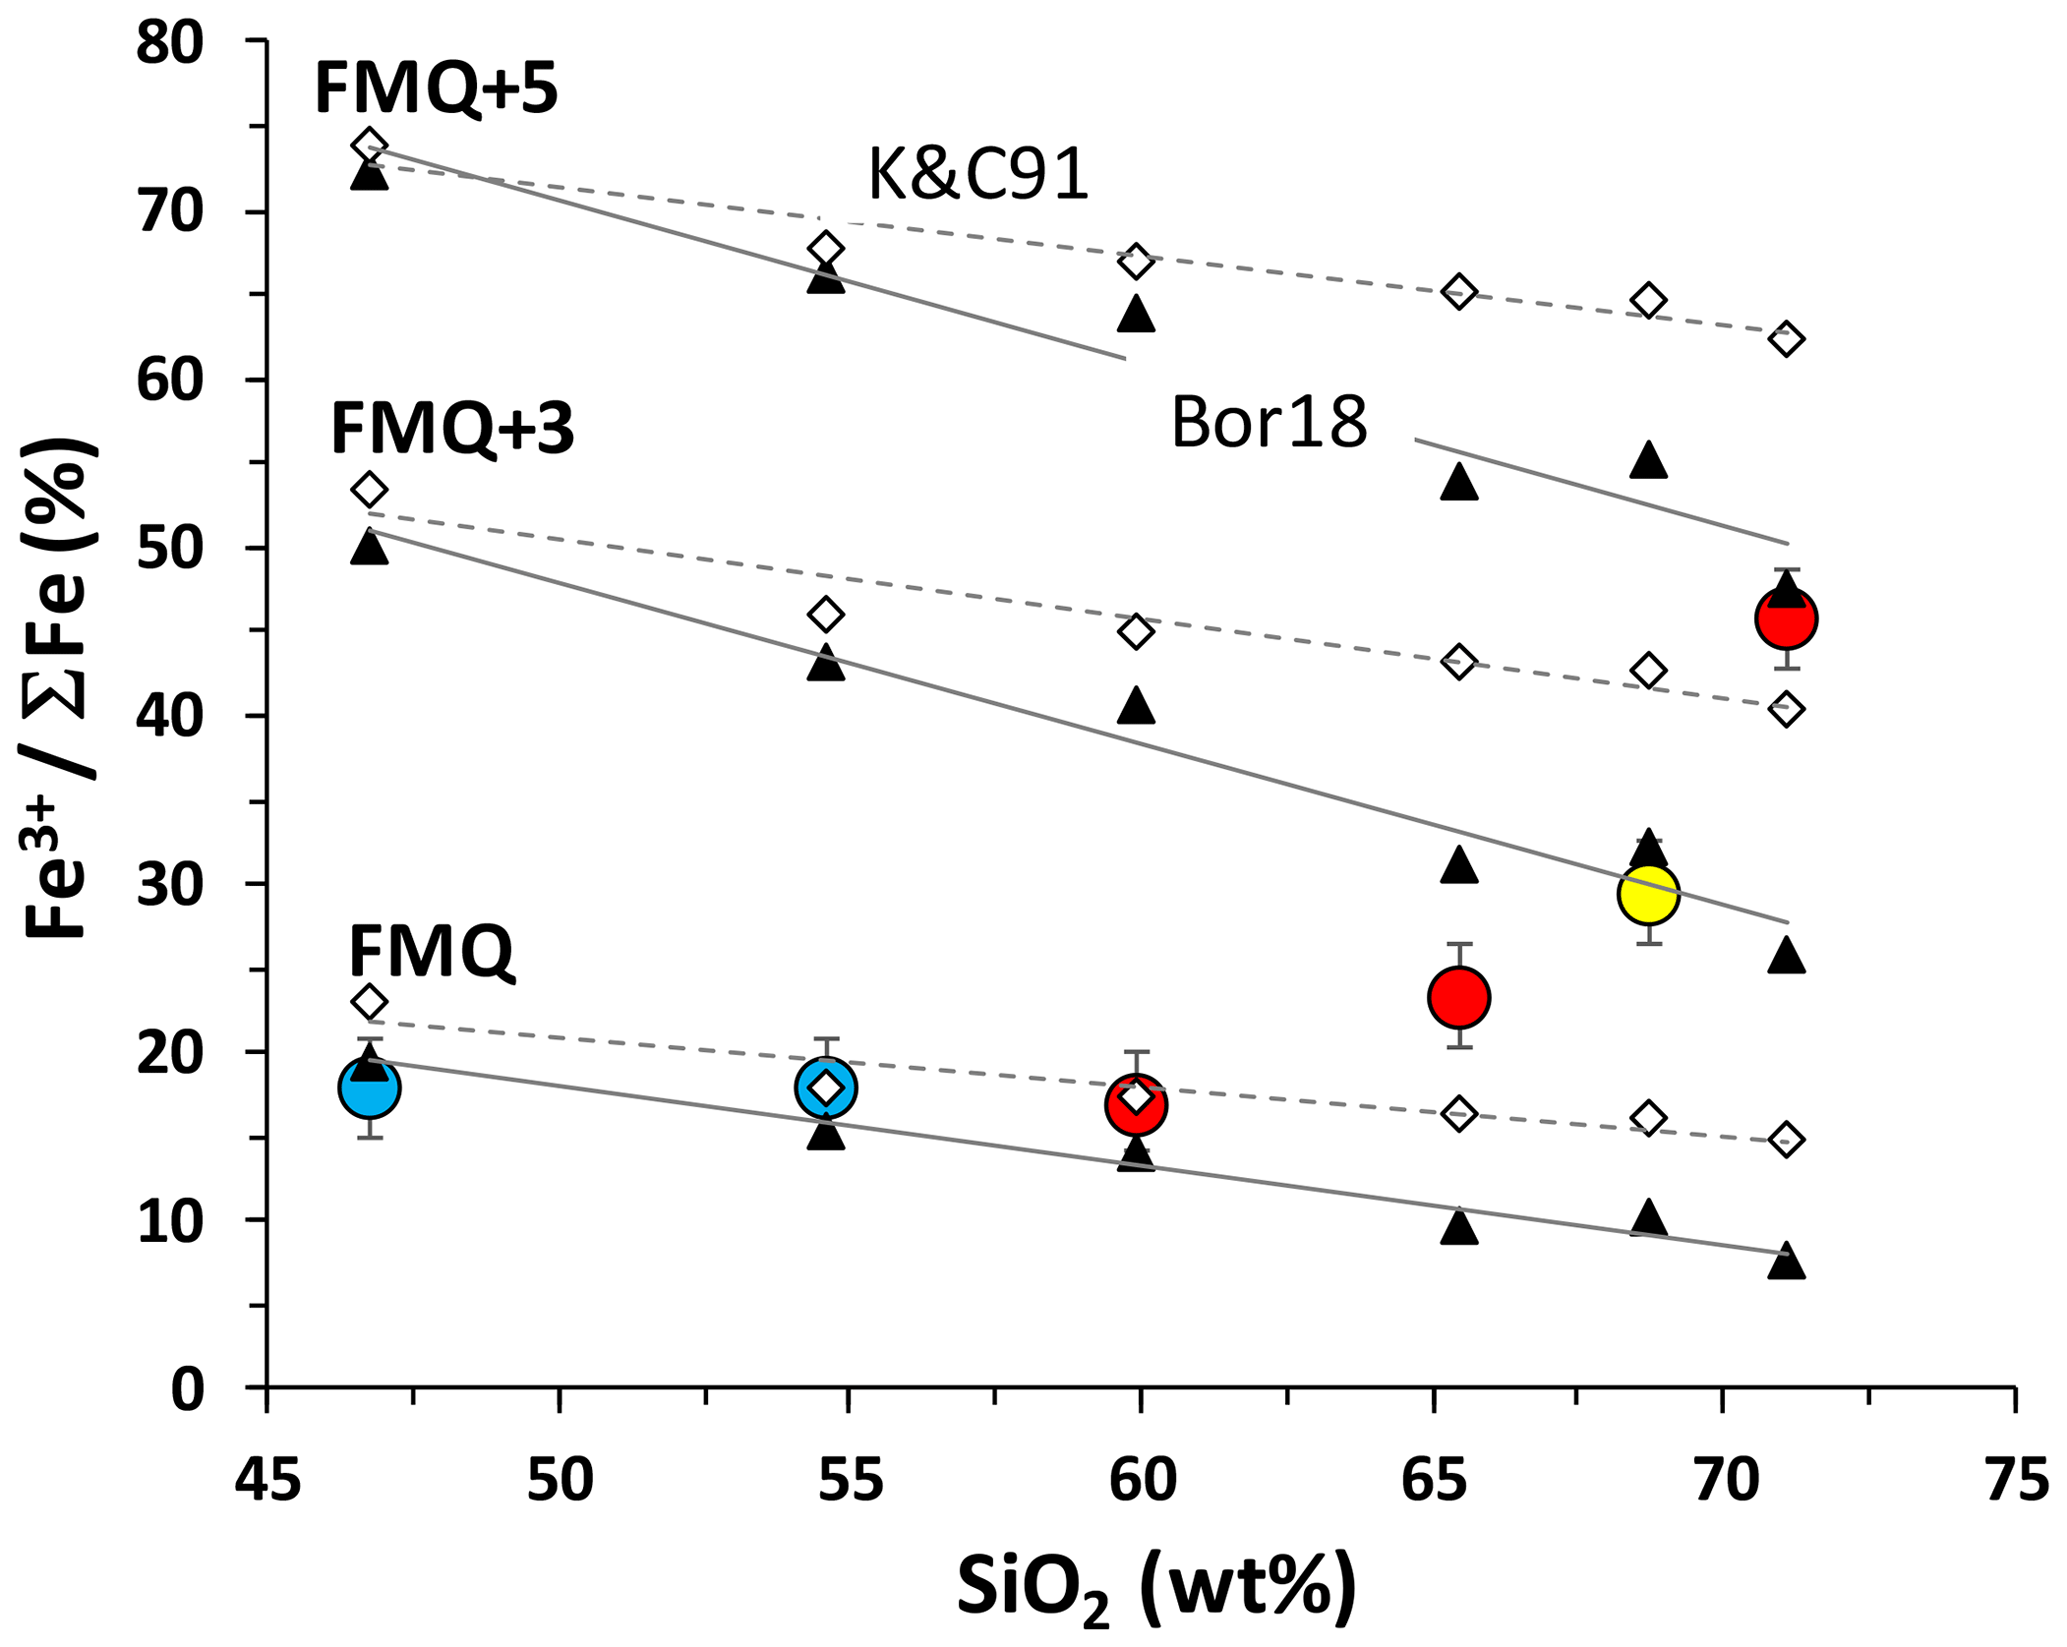
Figure 10Fe oxidation state as a function of SiO2 content of the melt. Symbols of MIs are the same as in previous figures. Open diamonds and black triangles are calculated as Fe3+ ∑Fe for the melt inclusions assuming three different redox conditions (logfO2 = FMQ, FMQ + 3 and FMQ + 5) following the models of Kress and Carmichael 1991 (labeled as K&C91) and Borisov et al., 2018 (Bor18), respectively. Solid and dashed lines are linear trends for the calculated datasets, respectively.
The Fe oxidation state of basaltic to andesitic MIs corresponds to that at FMQ and is in good agreement with wet-chemical data on Fe2O3 FeO in Hekla basalts (Portnyagin et al., 2012). In contrast, the oxidation state of Fe in the dacitic and rhyolitic MIs rises from conditions corresponding to FMQ to very oxidizing conditions from FMQ + 4 to FMQ + 5, depending on the chosen model (Fig. 10). These estimates for felsic MIs based on Fe3+ ΣFe in melt inclusions are in strong contrast with the results of magnetite–ilmenite redox barometry (Portnyagin et al., 2012; Schattel et al., 2014; Geist et al., 2021). The coexisting magnetite–ilmenite crystals reported by Portnyagin et al. (2012) and Schattel et al. (2014) were mostly mineral pairs trapped in the same olivine and pyroxene crystals but isolated from each other. Being preserved by the host mineral from direct contact and re-equilibration (e.g., Hou et al., 2021), these magnetite–ilmenite pairs should reflect original redox equilibria existing at magmatic conditions. Therefore, the extremely high Fe3+ ΣFe obtained for silicic Hekla melt inclusions can hardly reflect the oxidation state of the melts at the moment of olivine crystallization. The oxidizing conditions are also in contrast with the occurrence of pyrrhotite inclusions in fayalitic olivine (Portnyagin et al., 2012).
If the oxidizing redox conditions recorded by the silicic inclusions do not correspond to the conditions of their entrapment in olivine, the high Fe3+ ΣFe could be related to later processes that occurred in melt inclusions after their isolation from host magma. One potential process could be post-entrapment crystallization of olivine on the walls of MIs. Since olivine contains mainly Fe2+, its crystallization may increase the Fe3+ ΣFe ratio of the residual melt in melt inclusion, at least in a closed system. This process will be dramatically enhanced in felsic magmas of the Hekla volcano because olivine grains become progressively enriched in the fayalite component up to Fo3. The validity of this hypothesis can be tested on the FeO vs. SiO2 compositional diagram shown in Fig. 11. Compositions of three melt inclusions from this study (stars) are compared with the compositions of all melt inclusions (after Portnyagin et al., 2012) and matrix glasses from H3 and H4 eruptions (open circles and black or grey squares, respectively in Fig. 11). As illustrated by our modeling, any crystallization of olivine from MIs should affect the FeO–SiO2 relationship as demonstrated by red, green and blue lines in Fig. 11 representing calculated modifications of the melt composition, if up to 10 wt % of olivine with the host composition is crystallized from the MI. Since all the MIs lie directly on the trend defined by matrix glasses and also are close to olivine–melt Fe–Mg equilibria (Portnyagin et al., 2012), the olivine crystallization hypothesis can be excluded.
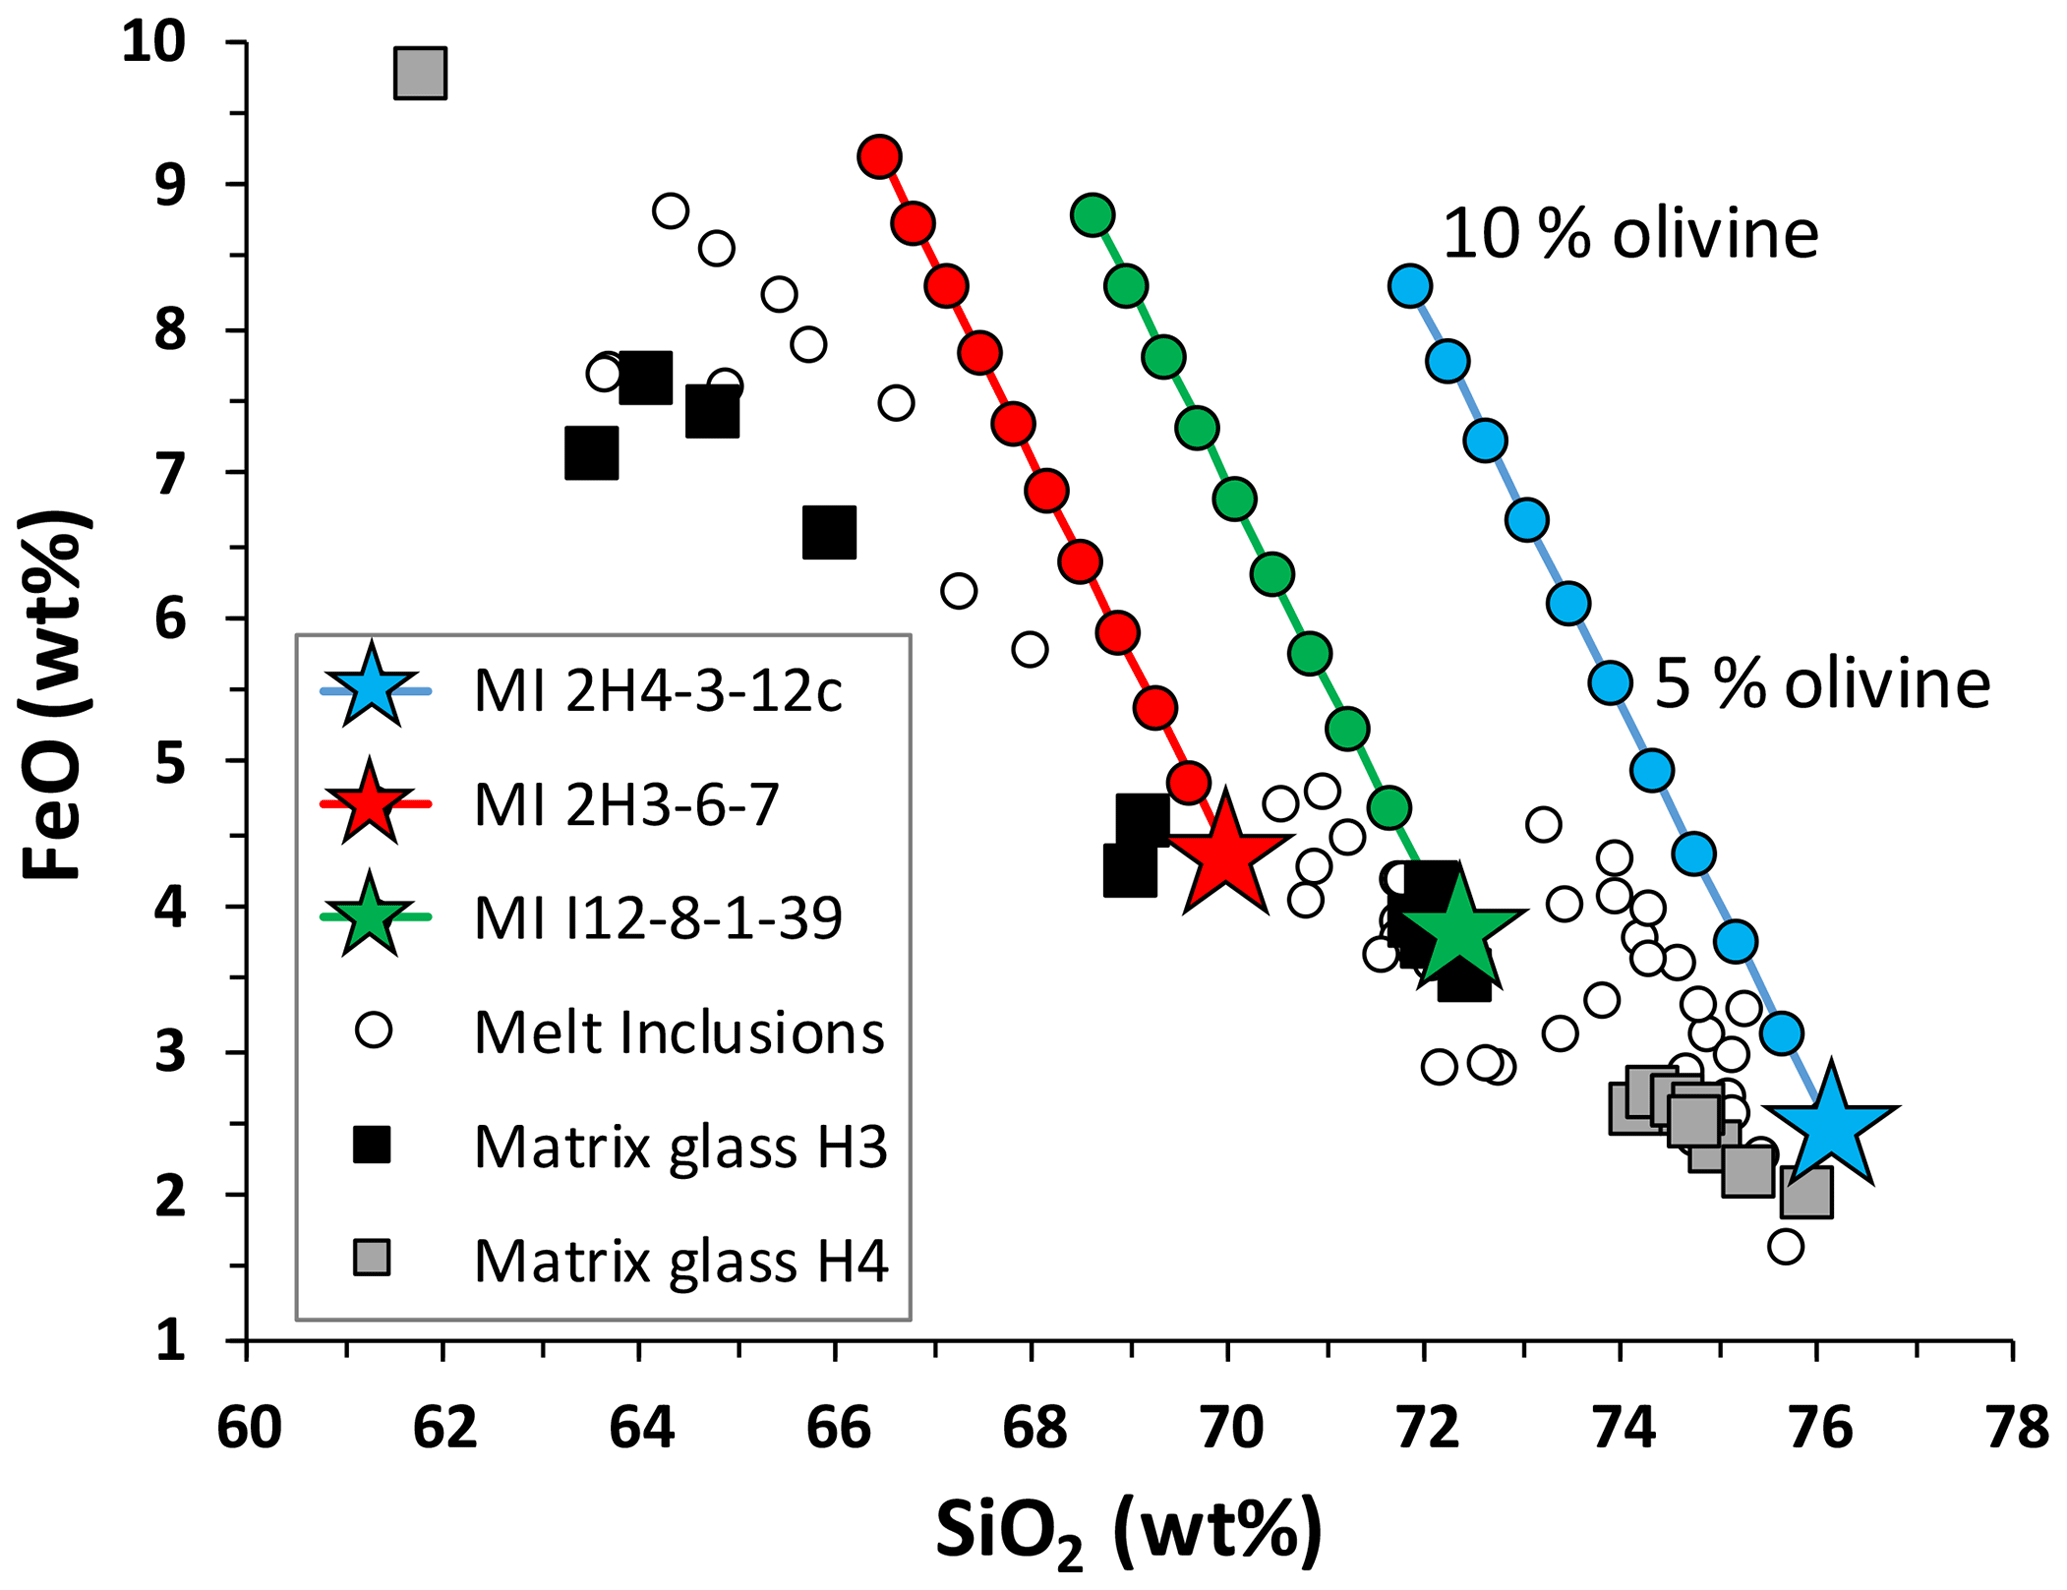
Figure 11FeO versus SiO2 in the melts of MIs. Blue, red and green stars represent compositions of MIs from this study (see labels in the legend). Blue, red and green lines are calculated changes of the FeO–SiO2 relationship in the MI, if up to 10 wt % of the olivine host is crystallized with 1 wt % step. Open circles are melt inclusions of the H3 and H4 eruptions after Portnyagin et al. (2012), whereas black and grey squares are matrix glasses.
Another post-entrapment process that can potentially affect the composition and oxidation state of MIs is auto-oxidation due to dissociation of water according to the reaction H2O(m) = H2(g) + O2(g), where subscript m refers to melt and g refers to gas (e.g., Sobolev and Danyushevsky, 1994; Danyushevsky et al., 2002). If the system is open for hydrogen but closed for oxygen, the hydrogen loss via diffusion through the host olivine (e.g., Portnyagin et al., 2008; Gaetani et al., 2012) should lead to an increase in oxygen fugacity within the inclusion. This in turn can oxidize FeO in the melt to Fe2O3, changing the apparent redox signature of Fe. A simple mass balance of such a redox reaction is expressed by the reaction H2O(m) + 2FeO(m) = 2H+ + Fe2O3(m)). The relationship between the amount of dissociated H2O and the amount of FeO oxidized is expressed as H2O (wt %) × FeO (wt %) (Danyushevsky et al., 2002). It shows that (1) at a similar oxidation state, Fe-rich basaltic melts can lose more H2O by this mechanism than Fe-poor silicic melts, and (2) the relative effect of a certain amount of H2O loss on Fe oxidation state will increase with decreasing amount of total Fe in the melt. Hence, felsic melts may experience the largest effect of such post-entrapment re-equilibration. Simple calculations of the mass balance demonstrate that H2O loss of about 0.1 wt % from the melt inclusion is sufficient to shift the Fe3+ ΣFe from 0.15 to 0.2 in basaltic MIs (containing 12 wt % FeOtot) and from 0.15 to 0.45 in felsic MIs (containing 2.5 wt % FeOtot) (Fig. 12). Such a pronounced redox effect in felsic melts with only small H2O loss (<0.1 wt %) is hardly detectable in MIs containing about 5 wt %–6 wt % H2O. Apparently, the oxidation state of silicic melt inclusions is strongly decoupled from the oxidation state of the host magma. Therefore, it requires very short residence times of olivines with oxidized melt inclusions in the magma (e.g., Gaetani et al., 2012; Bucholz et al., 2013). This can be the case for melt inclusions, which experience H2O loss and oxidation shortly before and during eruption, when the host magma degasses and H2O fugacity inside inclusions exceeds that of the host magma, thus causing melt inclusions in olivine crystals to dehydrate.
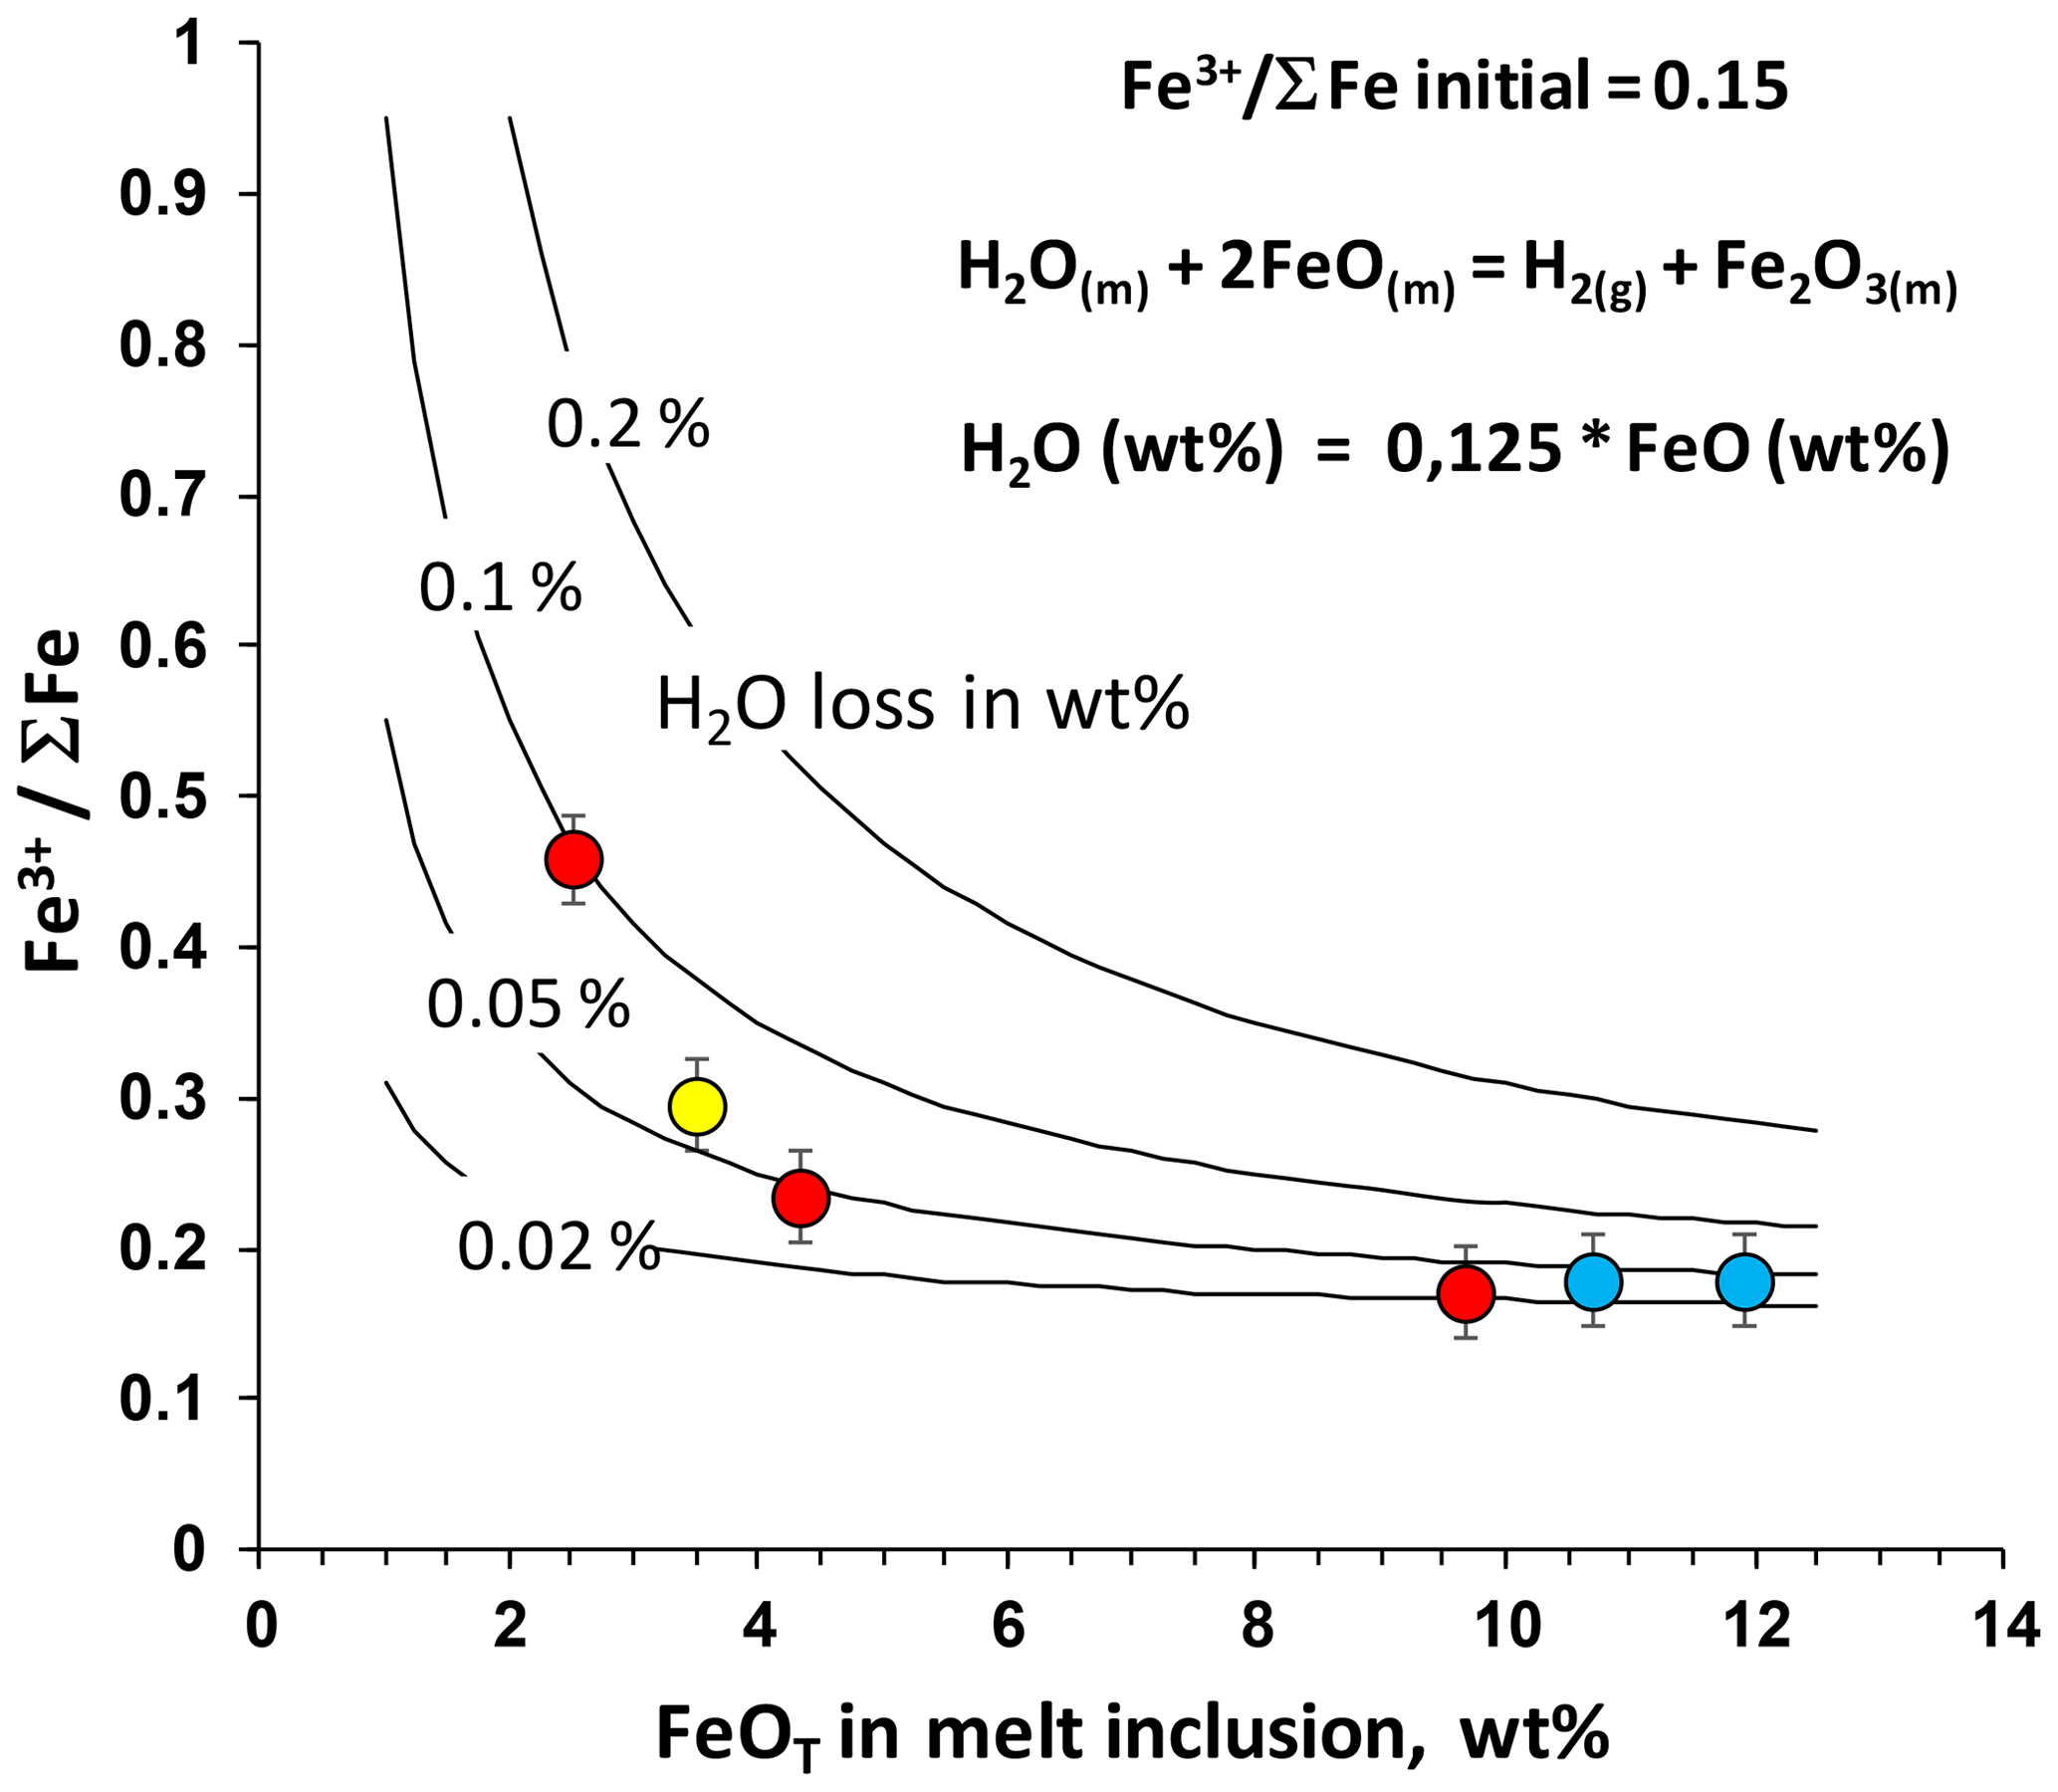
Figure 12Calculated effect of water loss from MIs on the Fe3+ ∑Fe ratio. The calculation is based on the redox reaction between H2O and Fe as illustrated in the equations (Danyushevsky et al., 2002). Solid lines represent the loss of 0.02 wt %, 0.05 wt %, 0.1 wt % and 0.2 wt % H2O from the MIs. Circles represent analyzed melt inclusions. Note that the oxidizing effect of H2O loss increases with decreasing content of Fe in the MIs.
Based on the obtained data, we conclude that the most probable explanation for the highly oxidized nature of melt inclusions in olivine from Hekla silicic rocks is post-entrapment oxidation of melts due to minor H2O loss from inclusions at low pressure. An increasingly large oxidation of silicic melts with low Fe may be explained by their larger sensitivity to auto-oxidation processes in comparison to Fe-rich basaltic and andesitic melts, which can preserve the intrinsic redox conditions more readily.
In summary, the new confocal μ-XANES methods provides a reliable and robust technique for the analysis of tiny (>30 µm) one-side-polished melt inclusions in any type of mineral host (rich and poor in Fe) and also for other types of Fe-bearing heterogeneous materials. The application example of the Hekla volcano demonstrates that the Fe redox proxy provides an important contribution to the reconstruction of magmatic processes. In particular, the obtained results imply that the oxidation state of Fe in the melt inclusions can be affected by post-entrapment modifications like water loss due to hydrogen diffusion through the olivine host. This effect is most pronounced in felsic melt inclusions with low concentration of Fe.
The dataset is provided in Table 1 and in the Supplement table.
The supplement related to this article is available online at: https://doi.org/10.5194/ejm-36-195-2024-supplement.
MW and RB developed the idea of the method. GF and JG designed the equipment and technical approach. MP, SM, RA and RB prepared the samples and provided the analytical and geological data. RB, MW, KK, MP, SB and SK conducted the XANES measurements with guidance and assistance from GF and JG. MW processed the raw spectroscopic data. All co-authors participated in the discussion of the results. RB, MW and MP prepared the manuscript with contributions from all co-authors.
The contact author has declared that none of the authors has any competing interests.
Publisher’s note: Copernicus Publications remains neutral with regard to jurisdictional claims made in the text, published maps, institutional affiliations, or any other geographical representation in this paper. While Copernicus Publications makes every effort to include appropriate place names, the final responsibility lies with the authors.
This article is part of the special issue “Probing the Earth: spectroscopic methods applied to mineralogy”. It is not associated with a conference.
We acknowledge DESY (Hamburg, Germany), a member of the Helmholtz Association (HGF), for the provision of experimental facilities. Parts of this research were carried out at PETRA III at the P06 beamline. We thank Harald Behrens for the wet-chemical analysis of silica-rich reference glasses, Julian Feige for the sample preparation and Corinna Kallich for the help with graphics. We thank Nadine Schattel for providing an olivine sample from H2 tephra for analysis. We acknowledge Costanza Bonadiman and an anonymous reviewer for thoughtful comments and useful suggestions.
This research has been supported by the Deutsches Elektronen-Synchrotron (grant nos. I-20160716 and I-20170875), the Deutsche Forschungsgemeinschaft (grant no. Bo2941/4) and Johannes Gutenberg-Universität Mainz (JGU TeMaS Research Platform).
This open-access publication was funded by Johannes Gutenberg University Mainz.
This paper was edited by Francesco Di Benedetto and reviewed by Costanza Bonadiman and one anonymous referee.
Berry, A. J., O'Neill, H. S. C., Jayasutiya, K. D., Campbell, S. J., and Foran, G. J.: XANES calibrations for the oxidation state of iron in a silicate glass, Am. Mineral., 88, 967–977, 2003.
Berry, A. J., Stewart, G. A., O'Neill, H. S. C., Mallmann, G., and Mosselmans, J. F. W.: A re-assessment of the oxidation state of iron in MORB glasses, Earth Planet. Sc. Lett., 483, 114–123, 2018.
Bezos, A. and Humler, E.: The Fe3+ ΣFe ratios of MORB glasses and their implications for mantle melting, Geochim. Cosmochim. Ac. 69, 711–725, 2005.
Borisov, A., Behrens, H. and Holtz, F.: ferric ferrous ratio in silicate melts: a new model for 1 atm data with special emphasis on the effects of melt composition, Contrib. Mineral. Petrol., 173, 98, https://doi.org/10.1007/s00410-018-1524-8, 2018.
Botcharnikov, R. E., Koepke, J., Holtz, F., McCammon, C., and Wilke, M.: The effect of water activity on the oxidation and structural state of Fe in a ferrobasaltic melt, Geochim. Cosmochim. Ac., 69, 5071–5085, 2005.
Brounce, M. N., Kelley, K. A., and Cottrell, E.: Variations in Fe3+ ∑Fe of Mariana Arc Basalts and Mantle Wedge fO2. J. Petrol., 55, 2513–2536, 2014.
Bucholz, C. E., Gaetani, G. A., Behn, M. D., and Shimizu, N.: Post-entrapment modification of volatiles and oxygen fugacity in olivine-hosted melt inclusions, Earth Planet. Sc. Lett., 374, 145–155, https://doi.org/10.1016/j.epsl.2013.05.033, 2013.
Carmichael, I. S. E.: The redox states of basic and silicic magmas: a reflection of their source regions?, Contrib. Mineral. Petrol., 106, 129–141, 1991.
Chernikov, R., Welter, E., Caliebe, W., Wellenreuther, G., and Falkenberg, G.: Fast EXAFS in synchronous scanning mode at PETRA P06, J. Phys. Conf. Ser., 712, 012020, https://doi.org/10.1088/1742-6596/712/1/012020, 2016.
Christie, D. M., Carmichael, I. S. E., and Langmuir, C. H.: Oxidation states of mid-ocean ridge basalt glasses, Earth Planet. Sc. Lett., 79, 397–411, 1986.
Cline II, C. J., Faul, U. H., David, E. C., Berry, A. J., and Jackson, I.: Redox-influenced seismic properties of upper-mantle olivine, Nature, 555, 355, https://doi.org/10.1038/nature25764, 2018.
Cottrell, E., Kelley, K. A., Lanzirotti, A., and Fischer, R. A.: High-precision determination of iron oxidation state in silicate glasses using XANES, Chem. Geol., 268, 167–179, 2009.
Cottrell, E. and Kelley, K. A.: The oxidation state of Fe in MORB glasses and the oxygen fugacity of the upper mantle, Earth Planet. Sc. Lett., 305, 270–282, 2011.
Cottrell, E., Lanzirotti, A., Mysen, B., Birner, S., Kelley, K. A., Botcharnikov, R. E., Newville, M., and Davis, F. A.: A Mössbauer-based XANES calibration for hydrous basalt glasses reveals radiation-induced oxidation of Fe, Am. Mineral., 103, 489–501, 2018.
Cottrell, E., Birner, S. K., Brounce, M., Davis, F. A., Waters, L. E., and Kelley, K. A.: Oxygen fugacity across tectonic settings, in: Magma Redox Geochemistry, edited by: Moretti, R. and Neuville, D. R., 33–61, https://doi.org/10.1002/9781119473206.ch3, 2021.
Danyushevsky, L. V., McNeill, A. W., and Sobolev, A. V.: Experimental and petrological studies of melt inclusions in phenocrysts from mantle-derived magmas: an overview of techniques, advantages and complications, Chem. Geol., 183, 5–24, https://doi.org/10.1016/S0009-2541(01)00369-2, 2002.
Fiege, A., Ruprecht, P., Simon, A. C., Bell, A. S., Göttlicher, J., Newville, M., Lanzirotti, T., and Moore, G.: Calibration of Fe XANES for high-precision determination of Fe oxidation state in glasses: Comparison of new and existing results obtained at different synchrotron radiation sources, Am. Mineral., 102, 369–380, 2017.
Gaetani, G. A., O'Leary, J. A., Shimizu, N., Bucholz, C. E., and Newville, M.: Rapid reequilibration of H2O and oxygen fugacity in olivine-hosted melt inclusions, Geology, 40, 915–918, https://doi.org/10.1130/G32992.1, 2012.
Geist, D., Harpp, K., Oswald, P., Wallace, P., Bindeman, I., and Christensen, B.: Hekla Revisited: Fractionation of a magma body at historical timescales, J. Petrol., 62, 1–31, https://doi.org/10.1093/petrology/egab001, 2021.
Helz, R., Cottrell, E., Brounce, M. N., and Kelley, K. A.: Olivine-melt relationships and syneruptive redox variations in the 1959 eruption of Kılauea Volcano as revealed by XANES, J. Volcanol. Geotherm. Res., 333, 1–14, 2017.
Henke, B. L., Gullikson, E. M., and Davis, J. C.: X-Ray Interactions: Photoabsorption, Scattering, Transmission, and Reflection at E = 50–30,000 eV, Z = 1-92, Atomic Data and Nuclear Data Tables, 54, 181–342, 1993.
Hou, T., Botcharnikov, R., Moulas, E., Just, T., Koepke, J., Berndt, J., Yang, Z., Zhang, Z., Wang, M., and Holtz, F.: Kinetics of Fe-Ti oxide re-equilibration in magmatic systems: Implications for thermo-oxybarometry, J. Petrol., 61, 1–24, https://doi.org/10.1093/petrology/egaa116, 2021.
Hughes, E., Buse, B., Kearns, S. L., Blundy, J. D., Kilgour, G., Mader, H. M., Brooker, R. A., Balzer, R., Botcharnikov, R. E., Di Genova, D., Almeev, R. R., and Riker, J. M.: High spatial resolution analysis of the iron oxidation state in silicate glasses using the electron probe, Am. Mineral., 103, 1473–1486, 2018.
Humphreys, J., Brounce, M., and Walowski, K.: Diffusive equilibration of H2O and oxygen fugacity in natural olivine-hosted melt inclusions, Earth Planet. Sc. Lett.,, 584, 117409, https://doi.org/10.1016/j.epsl.2022.117409, 2022.
Kanngießer, B., Malzer, W., and Reiche, I.: A new 3D micro X-ray fluorescence analysis set-up – First archaeometric applications, Nuclear Instruments and Methods in Physics Research Section B: Beam Interactions with Materials and Atoms, 211, 259–264, https://doi.org/10.1016/S0168-583X(03)01321-1; 2003.
Kanngießer, B., Malzer, W., Rodriguez, A., and Reiche, I.: 3D micro-XRF investigations of paint layers with tabletop set-up, Spectrochimica Acta Part A: Molecular and Biomolecular Spectroscopy, 60, 41–47, https://doi.org/10.1016/j.sab.2004.10.012, 2004.
Kanngießer, B., Mantouvalou, I., Malzer, W., Wolff, T., and Hahn, O.: Non-destructive, depth resolved investigation of corrosion layers of historical glass objects by 3D Micro X-ray fluorescence analysis, J. Anal. Atom. Spectrom., 23, 814–819, 2008.
Kanngießer, B., Malzer, W., Mantouvalou, I., Sokaras, D., and Karydas A. G.: A deep view in cultural heritage – confocal micro X-ray spectroscopy for depth resolved elemental analysis, Appl. Phys. A, 106, 325–338, https://doi.org/10.1007/s00339-011-6698-0, 2012.
Kelley, K. A. and Cottrell, E.: Water and the Oxidation State of Subduction Zone Magmas, Science, 325, 605–607, 2009.
Kelley, K. A. and Cottrell, E.: The influence of magmatic differentiation on the ox-idation state of Fe in a basaltic arc magma, Earth Planet. Sc. Lett., 329, 109–121, https://doi.org/10.1016/j.epsl.2012.02.010, 2012.
Kress, V. C. and Carmichael, I. S. E.: The compressibility of silicate liquids containing Fe2O3 and the effect of composition, temperature, oxygen fugacity and pressure on their redox states, Contrib. Mineral. Petrol., 108, 82–92, 1991.
Lucic, G., Berg, A.-S., and Stix, J.: Water-rich and volatile-undersaturated magmas at Hekla volcano, Iceland, Geochem. Geophys. Geosyst., 17, 3111–3130, https://doi.org/10.1002/2016GC006336, 2016.
Lühl, L., Hesse, B., Mantouvalou, I., Wilke, M., Mahlkow, S., Aloupi-Siotis, E., and Kanngiesser, B.: Confocal XANES and the Attic Black Glaze: The Three-Stage Firing Process through Modern Reproduction, Anal. Chem., 86, 6924–6930, 2014.
Moune, S., O. Sigmarsson, T. Thordarson, and P.-J. Gauthier: Recent volatile evolution in the magmatic system of Hekla volcano, Iceland, Earth Planet. Sc. Lett., 255, 373–389, https://doi.org/10.1016/j.epsl.2006.12.024, 2007.
Osborn, E. F.: Role of oxygen partial pressure in the crystallization and differentiation of basaltic magma, Am. J. Sci., 257, 609–647, 1959.
Portnyagin, M., Almeev, R., Matveev, S., and Holtz, F.: Experimental evidence for rapid water exchange between melt inclusions in olivine and host magma, Earth Planet. Sc. Lett., 272, 541–552, https://doi.org/10.1016/j.epsl.2008.05.020, 2008.
Portnyagin, M., Hoernle, K., Storm, S., Mironov, N., van den Bogaard, C., and Botcharnikov, R.: H2O-rich melt inclusions in fayalitic olivine from Hekla volcano: Implications for phase relationships in silicic systems and driving forces of explosive volcanism on Iceland, Earth Planet. Sc. Lett., 357, 337–346, https://doi.org/10.1016/j.epsl.2012.09.047, 2012.
Putirka, K.: Thermometers and barometers for volcanic systems, in Minerals, Inclusions and Volcanic Processes, in: Reviews in Mineralogy and Geochemistry, vol. 69, edited by: Putirka, K. D. and Tepley III, G. J., Washington, D. C., Mineral. Soc. Am., 61–120, https://doi.org/10.2138/rmg.2008.69.3, 2008.
Rose-Koga E. F., Bouvier, A. S., Gaetani, G. A., et al.: Silicate melt inclusions in the new millennium: A review of recommended practices for preparation, analysis, and data presentation, Chem. Geol., 570, 120145, https://doi.org/10.1016/j.chemgeo.2021.120145, 2021.
Rudra, A. and Hirschmann, M. M.: Fe3+ partitioning between clinopyroxene and silicate melt at 1–2.5 GPa: Implications for Fe3+ content of MORB and OIB source mantle, Geochim. Cosmochim. Ac., 328, 258–279, 2022.
Schattel, N., Portnyagin, M., Golowin, R., Hoernle, K., and Bindeman, I.: Contrasting conditions of rift and off-rift silicic magma origin on Iceland, Geophys. Res. Lett., 41, 5813–5820, https://doi.org/10.1002/2014GL060780, 2014.
Schmitz, S., Möller, A., Wilke, M., Malzer, W., Kanngiesser, B., Bousquet, R., Berger, A., and Schefer, S.: Chemical U-Th-Pb dating of monazite by 3D-Micro X-ray fluorescence analysis with synchrotron radiation, Europ. J. Mineral., 21, 927–945, 2009.
Schuessler, J., Botcharnikov, R., Behrens, H., Misiti, V., and Freda, C.: Amorphous Materials: Properties, structure, and durability: Oxidation state of iron in hydrous phono-tephritic melts, Am. Mineral., 93, 1493–1504, https://doi.org/10.2138/am.2008.2795, 2008.
Schwab, R. G. and Küstner, D.: The equilibrium fugacities of important oxygen buffers in technology and petrology, Neues Jahrbuch für Mineralogie, 140, 112–142, 1981.
Sobolev, A. V. and Danyushevsky, L. V.: Petrology and Geochemistry of Boninites from the North Termination of the Tonga Trench: Constraints on the Generation Conditions of Primary High-Ca Boninite Magmas, J. Petrol., 35, 1183–1211, 1994.
Vekemans, B., Vincze, L., Brenker, F., and Adams, F.: Processing of three-dimensional microscopic X-ray fluorescence data, J. Anal. Atom. Spectrom., 19, 1302–1308, 2004.
Venezky, D. Y. and Rutherford, M. J.: Petrology and Fe–Ti oxide reequilibration of the 1991 Mount Unzen mixed magma, J. Volcan. Geotherm. Res., 89, 213–230, 1999.
Vincze, L., Vekemans, B., Brenker, F. E., Falkenberg, G., Rickers, K., Somogyi, A., Kersten, M., and Adams, F.: Three-Dimensional Trace Element Analysis by Confocal X-ray Microfluorescence Imaging, Anal. Chem., 76, 6786–6791, 2004.
Waters, L. E. and Lange, R. A.: No effect of H2O degassing on the oxidation state of magmatic liquids, Earth Planet. Sc. Lett., 447, 48–59, 2016.
Wilke, M., Farges, F., Petit, P.-E., Brown Jr., G. E., and Martin, F.: Oxidation state and coordination of Fe in minerals: An Fe K-XANES spectroscopic study, Am. Mineral. 86, 714–730, 2001.
Wilke, M., Behrens, H., Burkhard, D. J. M., and Rossano, S.: The oxidation state of iron in silicic melt at 500 MPa water pressure, Chem. Geol., 189, 55–67, 2002.
Wilke, M., Partzsch, G. M., Bernhardt, R., and Lattard, D.: Determination of the iron oxidation state in basaltic glasses using XANES at the K-edge, Chem. Geol., 213, 71–87, 2004.
Wilke, M., Partzsch, G. M., Bernhardt, R., and Lattard, D.: Erratum for Wilke et al. (2004) due to incorrect and missing figures, Chem. Geol., 220, 143–161, 2005.
Wilke, M., Schmidt, C., Farges, F., Malavergne, V., Gautron, L., Simionovici, A., Hahn, M., and Petit, P. E.: Structural environment of Fe in water-bearing silicate glass and melt e evidence from X-ray absorption spectroscopy, Chem. Geol., 229, 144–161, 2006.
Wilke, M., Farges, F., Partzsch, G. M., Schmidt, C., and Behrens, H.: Speciation of iron in silicate glasses and melts by in-situ XANES spectroscopy, Am. Mineral. 92, 44–56, 2007.
Wilke, M., Jugo, P., Klimm, K., Susini, J., Botcharnikov, R., Kohn, S. C., and Janousch, M.: The origin of S4+ detected in silicate glasses by XANES, Am. Mineral., 93, 235–240, https://doi.org/10.2138/am.2008.2765, 2008.
Zhang, C., Almeev, R. R., Hughes, E., Borisov, A. A., Wolff, E. P., Höfer, H. E., Botcharnikov, R. E., and Koepke, J.: Electron microprobe technique for the determination of iron oxidation state in silicate glasses, Am. Mineral., 103, 1445–1454, 2018.
The requested paper has a corresponding corrigendum published. Please read the corrigendum first before downloading the article.
- Article
(7817 KB) - Full-text XML
- Corrigendum
-
Supplement
(120 KB) - BibTeX
- EndNote