the Creative Commons Attribution 4.0 License.
the Creative Commons Attribution 4.0 License.
 | 09 Nov 2023
Constraining the volatile evolution of mafic melts at Mt. Somma–Vesuvius, Italy, based on the composition of reheated melt inclusions and their olivine hosts
Rosario Esposito
Daniele Redi
Leonid V. Danyushevsky
Andrey Gurenko
Benedetto De Vivo
Craig E. Manning
Robert J. Bodnar
Matthew Steele-MacInnis
Maria-Luce Frezzotti
Mount Somma–Vesuvius is a stratovolcano that represents a geological hazard to the population of the city of Naples and surrounding towns in southern Italy. Historically, volcanic eruptions at Mt. Somma–Vesuvius (SV) include high-magnitude Plinian eruptions, such as the infamous 79 CE eruption that occurred after 295 years of quiescence and killed thousands of people in Pompeii and surrounding towns and villages. The last eruption at SV was in 1944 and showed a Volcanic Explosivity Index (VEI) of 3 (0.01 km3 of volcanic material erupted). Following the 1944 eruption, SV has been dormant for the past nearly 79 years, with only minor fumarolic and seismic activity. During its long history, centuries of dormancy at SV have ended with Plinian eruptions (VEI 6) that signal the beginning of a new cycle of eruptive activity. Thus, the current dormancy stage demands a need to better understand the mechanism involved in high-magnitude eruptions in order to better predict future eruption magnitude and style. Despite centuries of research on the SV volcanic system, many questions remain, including the evolution of magmatic volatiles from deep primitive magmas to shallower more evolved magmas. Developing a better understanding of the physical and chemical processes associated with volatile evolution at SV can provide insights into magma dynamics and the mechanisms that trigger highly explosive eruptions at SV.
In this study, we present new data for the pre-eruptive volatile contents of magmas associated with four Plinian and two inter-Plinian eruptions at SV based on analyses of reheated melt inclusions (MIs) hosted in olivine. We correct the volatile contents of bubble-bearing MIs by taking into account the volatile contents of bubbles in the MIs. We recognize two groups of MIs: one group hosted in high-Fo olivine (Fo85–90) and relatively rich in volatiles and the other group hosted in low-Fo olivine (Fo70–69) and relatively depleted in volatiles. The correlation between volatile contents and compositions of host olivines suggests that magma fractionation took place under volatile-saturated conditions and that more differentiated magmas reside at shallower levels relative to less evolved/quasi-primitive magmas. Using the CO2 contents of corrected MIs hosted in Fo90 olivine from SV, we estimate that 347 to 686 t d−1 of magmatic CO2 exsolved from SV magmas during the last 3 centuries (38–75 Mt in total) of volcanic activity. Although this study is limited to only few SV magmas, we suggest that further study applying similar methods could shed light on the apparent lack of correlation between the volatile contents of MIs and the style and age of eruptions. Further, such studies could provide additional constraints on the origin of CO2 and the interaction between the carbonate platform and ascending magmas below SV.
- Article
(8079 KB) - Full-text XML
-
Supplement
(4909 KB) - BibTeX
- EndNote


Melt inclusions (MIs) are tiny droplets of melt trapped in igneous crystals during growth (Fig. 1) and in recent years have become a widely used tool to determine directly the pre-eruptive compositions of melts in volcanic systems (Esposito, 2021; Rose-Koga et al., 2021; Frezzotti, 2001; Lowenstern, 1995; Métrich and Wallace, 2008; Roedder, 1979; Sobolev and Danyushevsky, 1994; Esposito et al., 2023). Once the MI is sealed within the crystal, the melt may retain the original composition, especially if the host crystal is ejected shortly after the MI was formed and is not stored in magma at elevated pressure and temperature (P, T) conditions for extended periods of time during which re-equilibration of the fast-diffusing elements may occur (e.g., H; Wallace et al., 2021, and references therein). One of the main concerns is H diffusion into and/or out of the MI that can occur if a geochemical gradient exists between the MI and the melt around the growing host crystal (e.g., Portnyagin et al., 2008; Barth and Plank, 2021; Bucholz et al., 2013; Qin et al., 1992; Ferriss et al., 2018). It has been shown that significant amounts of H2O can diffuse out of MIs after/during eruption, especially for lavas (in particular when they build up a thick sequence of flows) and bomb samples that cool relatively slowly (Lloyd et al., 2013) and for relatively small MIs close to the rim of the host crystal (Barth et al., 2019). Various methods have been proposed to estimate magma decompression rates based on modeling H diffusion out of the MI into the host during magma ascent (Barth and Plank, 2021), and diffusion of H into and out of the MI can modify the concentration of CO2 in the melt phase in the MI (Mironov et al., 2015). If a significant amount of H diffuses out of the MI, a void space (vapor bubble) may form and C (in the form of CO2) can diffuse through the melt and into the vapor phase of the MI. Because C does not diffuse through the host easily (Bucholz et al., 2013), the CO2 content of the MI remains constant, but it is re-distributed between the melt and the vapor bubble within the MI.
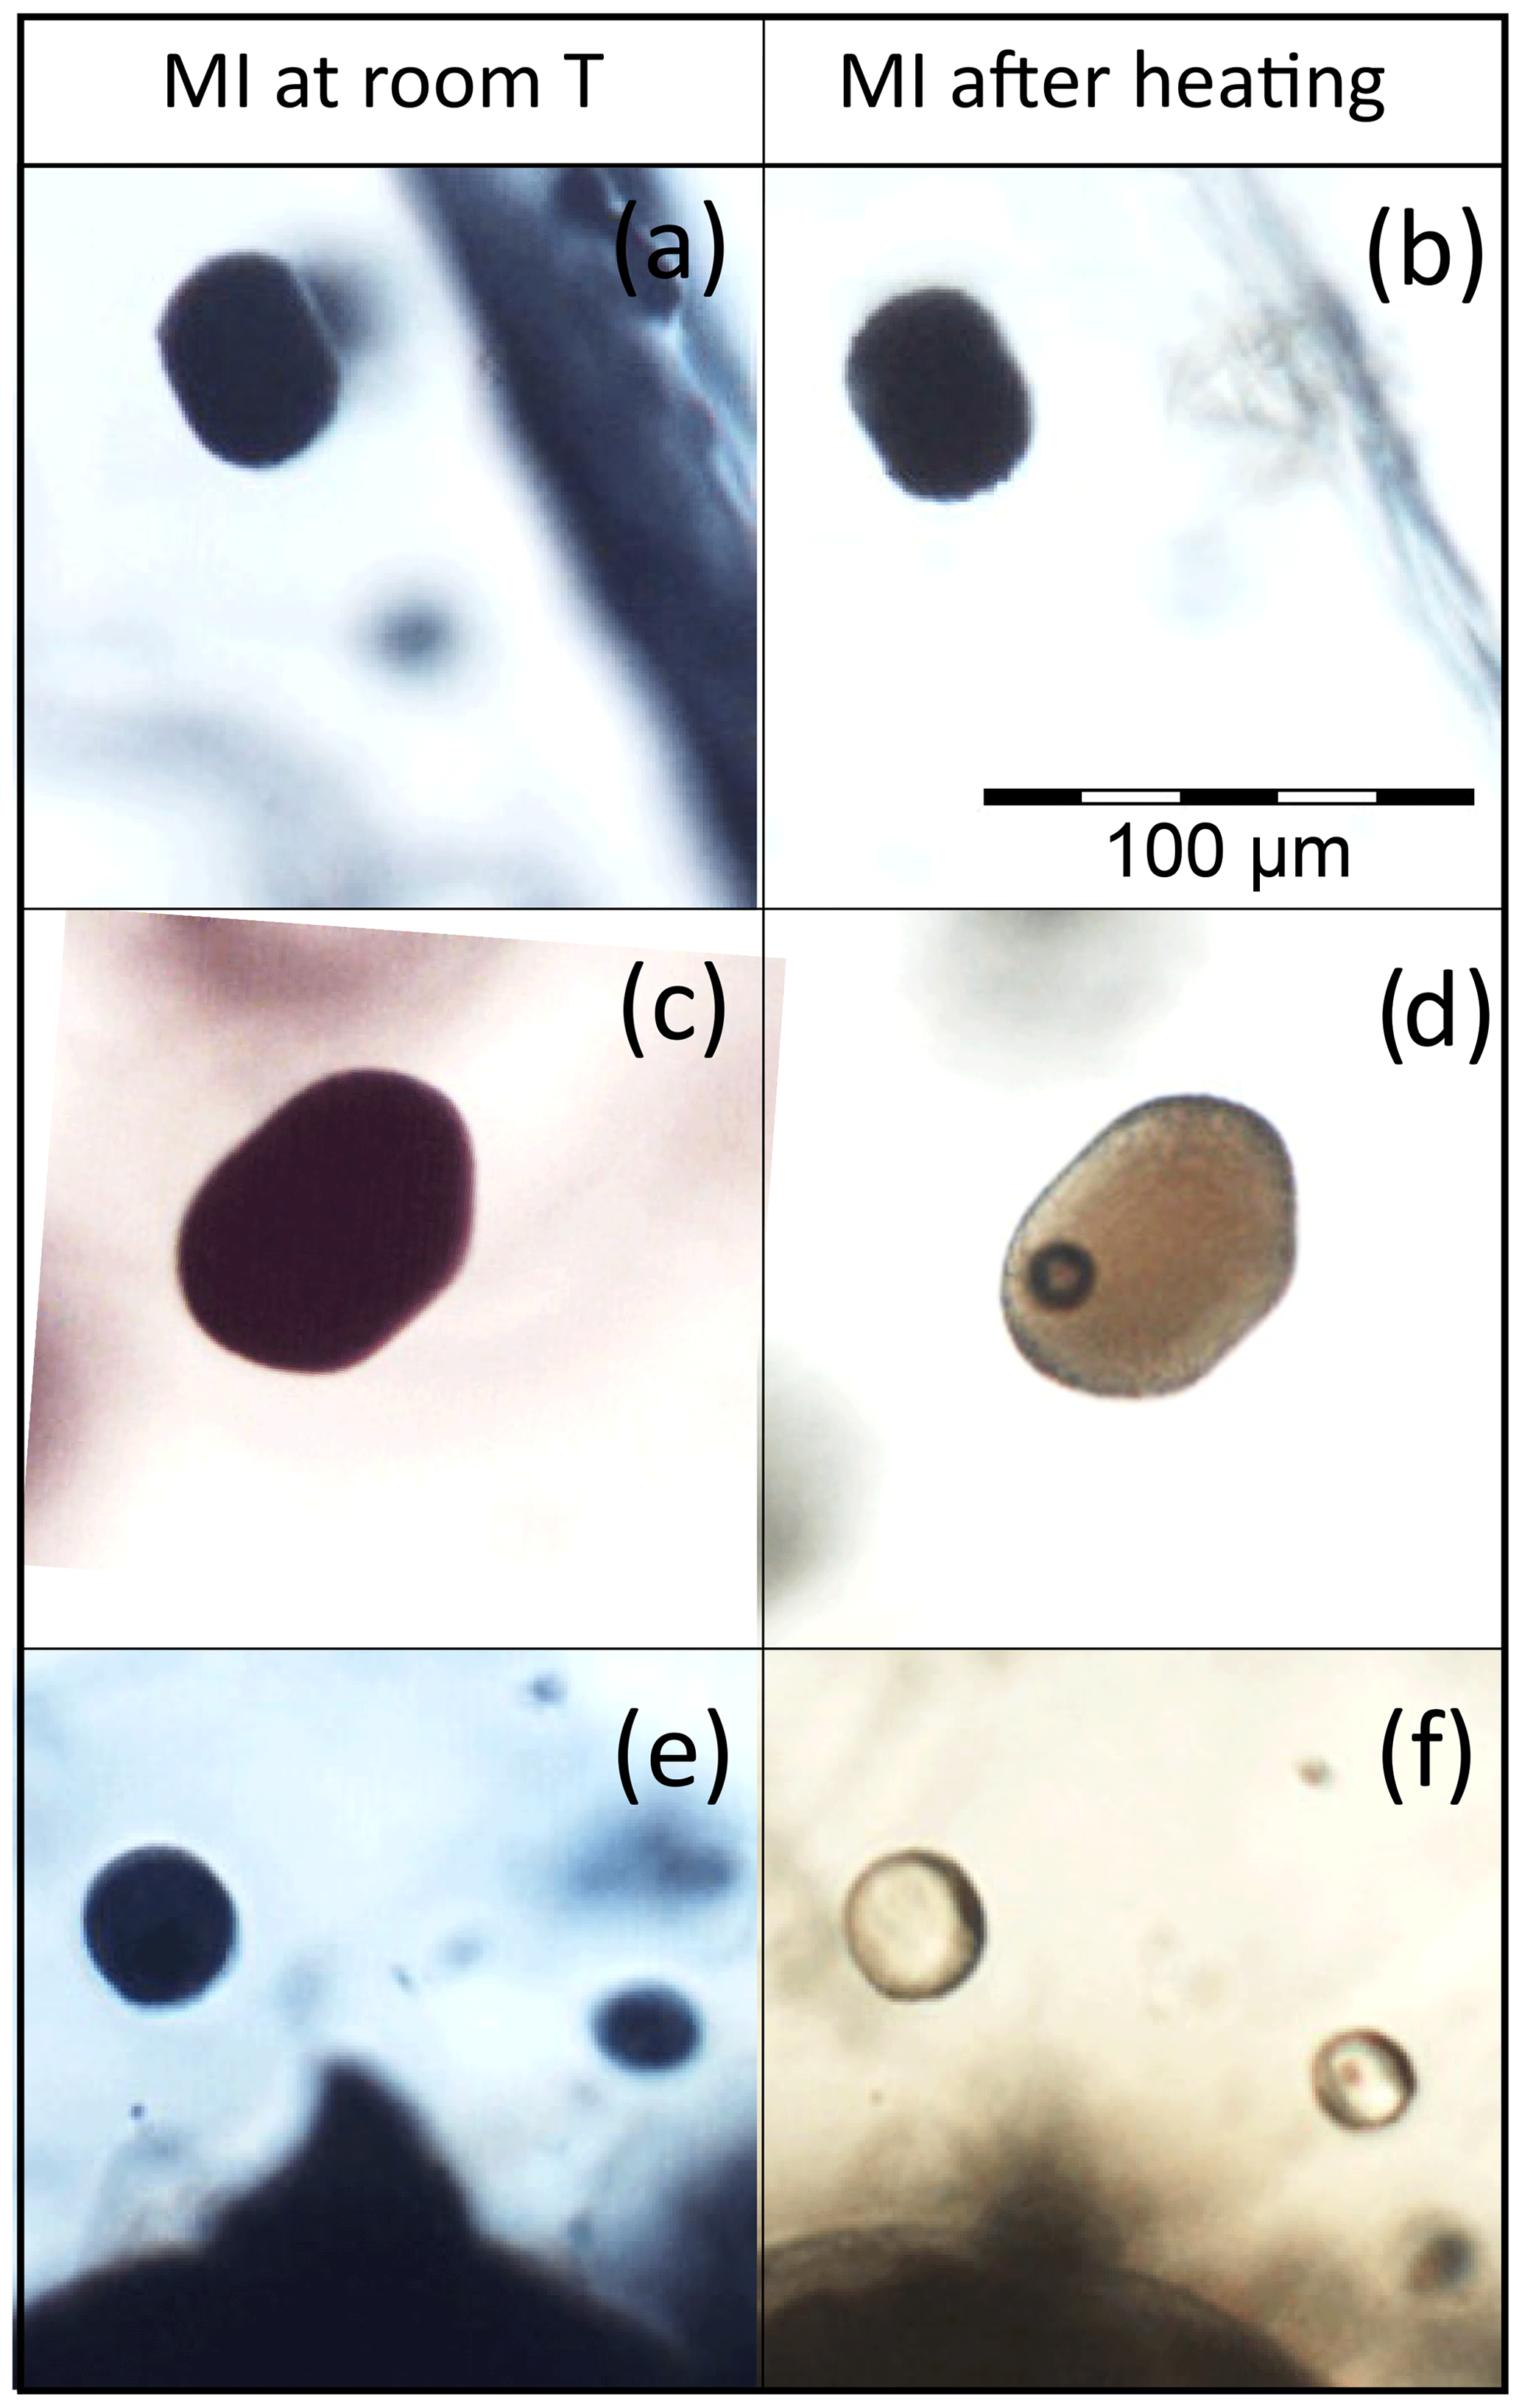
Figure 1Photomicrographs of MIs as found (a, c, e) and after heating (b, d, f). (a, b) MIs from the Pompeiian eruption (79 CE, megacycle III) that cannot be quenched to a glass after homogenization. (c, d) MIs from a pre-Codola inter-Plinian eruption (>33 ka, megacycle I) that contain glass plus a bubble after quenching from high temperature. (e, f) MIs from the Pompeiian eruption (79 CE, megacycle III) that contain only glass after homogenization and quenching from high temperature. Scale bar in photomicrograph (b) applies to all other photomicrographs.
In addition to H loss, MIs in volcanic samples often show various degrees of crystallization of material on the walls after trapping that is referred to as post-entrapment crystallization (PEC) (e.g., Danyushevsky et al., 2002; Portnyagin et al., 2019; Esposito, 2020; Rasmussen et al., 2020). As for H loss, PEC causes the formation of a shrinkage bubble as the newly formed mineral growing on the wall of the MI has a higher density (smaller molar volume) than the silicate melt from which it is crystallizing (e.g., Steele-Macinnis et al., 2011). Also, the partition coefficient of H2O between olivine and the silicate melt can increase with the increase in CO2 concentration of the melt driven by H diffusion loss (Sokol et al., 2013), causing further H loss from the MI. However, such behavior has been only reported for experiments at high P (6.3 GPa) and T (1400 ∘C).
The volatile contents of silicate melts in subvolcanic magmas exert fundamental controls on magma dynamics, heat and mass transport, explosivity of volcanic eruptions, global volatile cycles, and ore formation (e.g., Edmonds and Wallace, 2017). Thus, developing a better understanding of the pre-eruptive volatile content of magmas associated with the Mt. Somma–Vesuvius (SV) volcano in southern Italy can provide valuable insights into mechanisms that trigger highly explosive eruptions. Despite abundant research on the SV system during the last century (e.g., Doronzo et al., 2022 and Table 1), important questions about the volatile evolution of magmas erupted at SV still remain, including the pre-eruptive abundances of magmatic volatiles in primitive magmas at SV, the relationship between the pre-eruptive volatile contents and the age and style of past eruptions, and the relative contributions of carbonate assimilation by upwelling magmas versus deep (mantle) sourced CO2 to the total CO2 flux at the surface.
Table 1Summary of studies of Somma–Vesuvius eruptions that report pre-eruptive volatile contents of magmas based on CO2 and/or H2O analyses of melt inclusions and/or fluid inclusions.
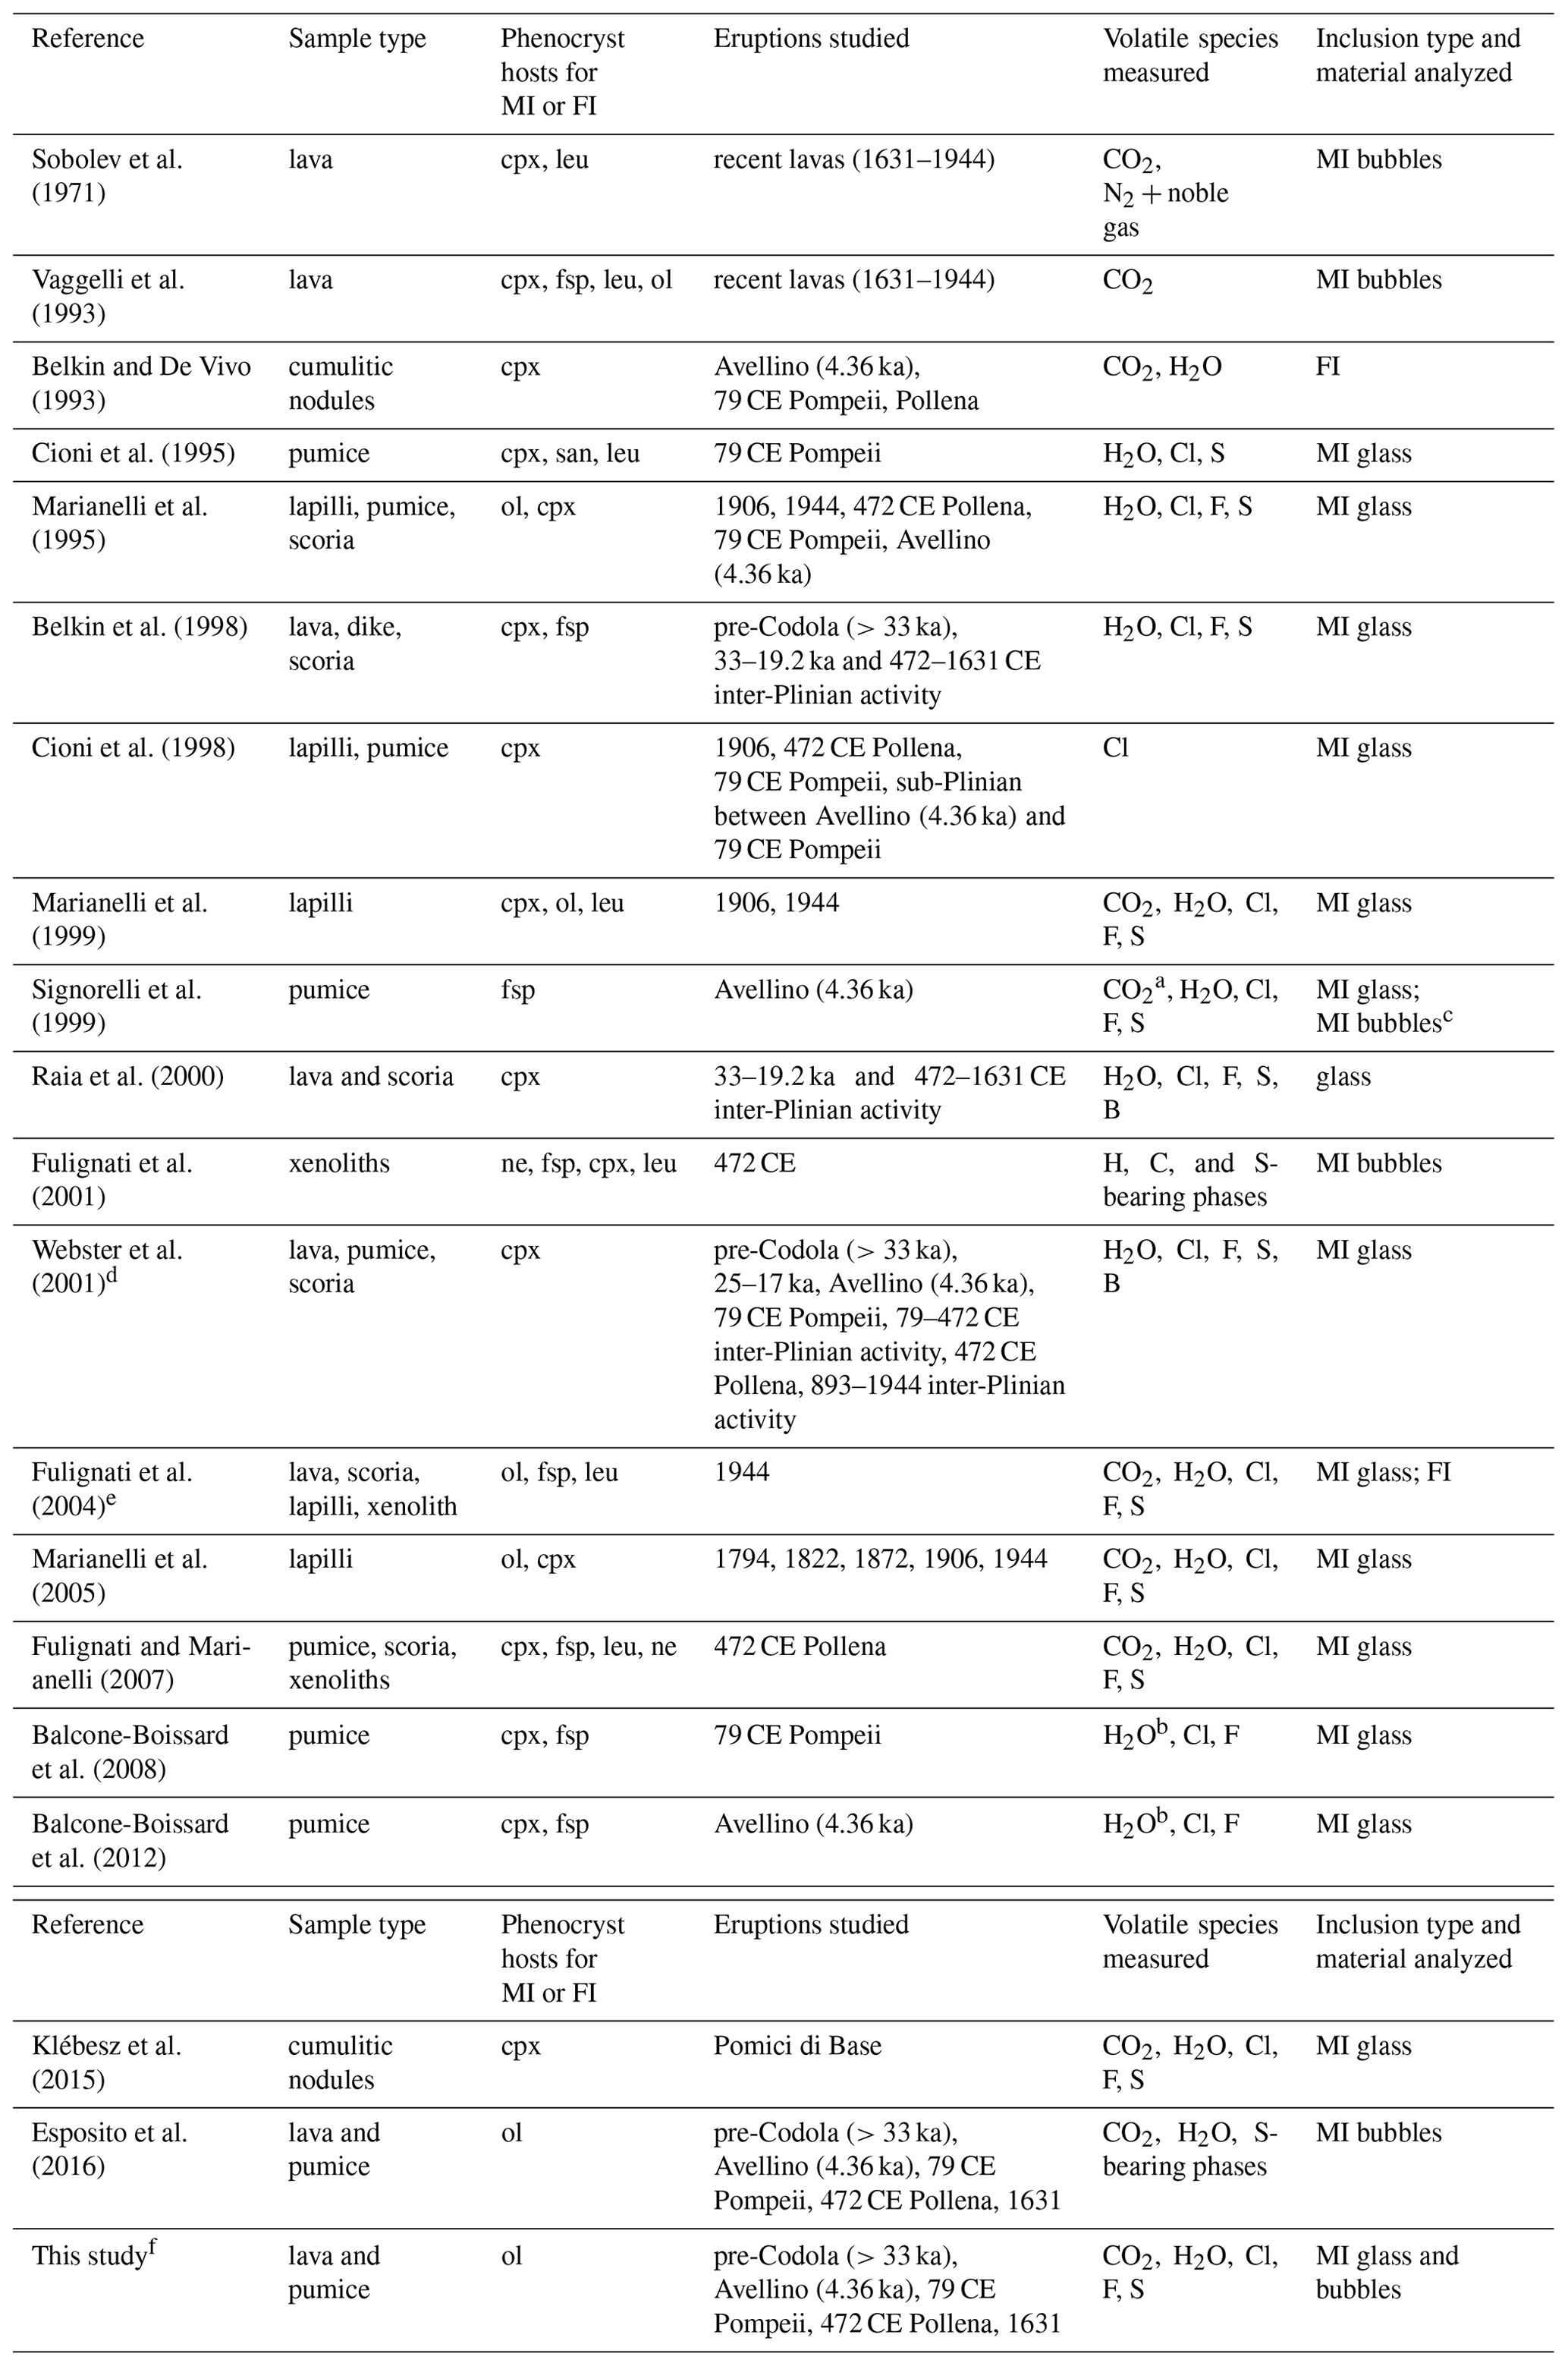
cpx: clinopyroxene; leu: leucite; fsp: feldspar; ol: olivine; ne: nepheline. a CO2 below the instrumental detection limit. b H2O calculated from EMPA total difference. c No Raman active gases detected in bubbles. d Partly based on Raia et al. (2000). e Based on other studies (Marianelli et al., 1999; Fulignati et al., 2000a, b, c; Del Moro et al., 2001). f Includes data from analysis of MI bubbles reported by Esposito et al. (2016).
At SV, the lack of correlation between MgO content of the bulk rocks and average Mg# () of olivine and clinopyroxene in the rock suggest disequilibrium between the bulk rock composition and the contained olivine and clinopyroxene phenocrysts (Fig. S1 in the Supplement). This lack of correlation indicates that bulk rock compositions represent a mixture of various proportions of clinopyroxene and/or olivine cumulus material and evolved phonolitic and trachytic magmas. For example, major-element compositions of bulk rocks from the post-472 CE eruptions with MgO > 4 wt % could reflect incorporation of variable amounts of clinopyroxene into a relatively evolved melt as reported by Danyushevsky and Lima (2001). Also, bulk rock compositions of pre-19.2 ka eruptions showing high K2O concentrations exhibit geochemical trends that reflect addition of large proportions of olivine in addition to clinopyroxene. An important implication of rock–mineral disequilibrium is that information about the primitive melts associated with SV volcanism is not directly available from bulk rock analyses alone. Volatile contents of the original silicate melt generated by partial melting in the upper mantle, before addition of volatiles from decarbonation of the carbonate platform occurred below the SV system, may be preserved in MIs hosted in phenocrysts that formed at crustal depths beneath the carbonate platform.
Many researchers investigated glassy, naturally quenched MIs to study the magmatic history of some of the most recent eruptions of SV (1944, 1906, and 1822 inter-Plinian eruptions; Table 1) (e.g., Marianelli et al., 1995, 1999, 2005). The studied MIs are hosted in olivine and clinopyroxene phenocrysts with high Mg# (from 83 to 90), which are interpreted to have crystallized during early stages of differentiation (Marianelli et al., 1995, 1999, 2005). Specifically, Marianelli et al. (2005) reported H2O and CO2 contents of MIs ranging from 2.3 wt % to 4.9 wt % and 1500–3500 ppm, respectively. These researchers reported that bubbles were present in the studied MIs, but they did not consider the volatile contents of the bubbles when determining the volatile contents of the trapped melt, resulting in underestimates of H2O and especially CO2 contents of the melts.
Unfortunately, a large portion of all MIs in samples from SV are partially to completely crystallized as found (see Fig. 1a, c, and e for completely crystallized MIs; see also Esposito et al., 2016). Also, crystallization after trapping has been observed during experimental quenching of SV MIs in the laboratory following heating to melt and homogenize the inclusion contents (Fig. 1b). If the goal of the MI study is to determine the pre-eruptive volatile contents of the melt, it is not possible to obtain the volatile composition of the originally trapped melt if the MI has crystallized. Crystallized MIs can be heated in the laboratory and homogenized (melted) and then quenched quickly to produce MIs containing only glass (Fig. 1f) for subsequent analysis (Bartoli et al., 2013; e.g., Esposito et al., 2012). Care must be taken to minimize the duration of the heating experiments to limit H diffusion loss from the MIs at high T (Barth and Plank, 2021). In fact, the duration of the experiment should be planned based on the size of MIs and the size and nature of the host crystal (Danyushevsky et al., 2002; Esposito et al., 2018, 2016) as also discussed in more detail below. Similar to some naturally quenched MIs, MIs quenched from high temperature in the lab sometimes contain a vapor bubble in addition to glass (Fig. 1d; see also Wallace et al., 2015). To reconstruct the original volatile concentrations of the melt, the volatile contents of the vapor bubble must be included in the bulk composition determination (e.g., Esposito et al., 2011; Moore et al., 2015; Esposito et al., 2016; Hartley et al., 2014; Borghini et al., 2023).
Many studies have used MIs to constrain the pre-eruptive volatile contents of magmas erupted during the volcanic history of SV (Table 1) (see also Cannatelli, 2020, and references therein). Other studies have used densities of fluid inclusions hosted in crystals from xenoliths to constrain depths associated with the carbonate platform below SV (Belkin et al., 1998; Fulignati et al., 2004). In the present study, a MI is defined as an inclusion that originally trapped a silicate melt ± a vapor bubble at magmatic conditions. Similarly, a fluid inclusion (FI) is defined as an inclusion that originally trapped a volatile non-silicate fluid, such as H2O and/or CO2. We note, however, that Steele-Macinnis et al. (2017) report that, if the melt is volatile saturated at the time of inclusion formation, some inclusions may trap only the silicate melt phase, others may trap only the coexisting fluid phase, and still others may trap various proportions of both melt and H2O ± CO2 fluid to produce a continuum in inclusion properties between MIs and FIs. Some of these studies listed in Table 1 focused on cumulate nodules and crustal xenoliths (e.g., Fulignati et al., 2001; Belkin and De Vivo, 1993; Klébesz et al., 2015) but did not include juvenile phenocrysts. Other workers studied MIs hosted in phenocrysts of juvenile material. Some of these studies reported concentrations of some, but not all, volatile components of interest in the MI, and many did not report data for both H2O and CO2 in the MI (e.g., Cioni et al., 1995, 1998; Vaggelli et al., 1993; Sobolev et al., 1971; Raia et al., 2000; Belkin et al., 1998; Webster et al., 2001; Balcone-Boissard et al., 2008, 2012). For example, Webster et al. (2001) analyzed MIs hosted in clinopyroxene phenocrysts for H2O, Cl, and S (but not CO2). Because some studies do not report a complete volatile budget for the trapped melts, it is difficult to compare results from different studies, which show wide ranges in reported volatile concentrations and estimated depths (pressures) of trapping. The study by Webster et al. (2001) suggests that the magnitude and style of eruptions at SV correlate with the pre-eruptive volatile concentrations of magmas. In particular, for Plinian and sub-Plinian eruptions between 3.55 and 4.3 ka (Santacroce et al., 2008, and references therein), MIs are associated with higher H2O and S contents and higher S/Cl relative to magmas associated with inter-Plinian volcanic events during the same time frame. Moreover, Webster et al. (2001) reported that average H2O contents for individual SV eruptions (individual sample) range from 3 to <0.5 wt % with a maximum of ∼ 6 wt % H2O obtained from a single MI from the 79 CE eruption. It was also shown that after heating and quenching, the glass in most of the MIs studied by Webster et al. (2001) contained a vapor bubble. The average S contents of the 79 CE eruption were found to range from <500 to 2400 ppm, and the average Cl contents range from 2000 to 8000 ppm with several individual MIs showing >1 wt % Cl; CO2 contents of the MIs were not reported in this study. Although the MIs studied by Webster et al. (2001) were reported to contain vapor bubbles, the volatile contents of the bubbles were not considered when estimating the volatile budget of the trapped melt. As previously mentioned, failure to account for volatiles contained in the bubble can lead to significant underestimation of CO2 and S concentration in the trapped melt. For SV, up to 1757 ppm of CO2 and up to 1192 ppm S were the maximum estimated to be hosted in the bubble by Esposito et al. (2016; MI LFL2-D44-1-1). These values correspond from 44 % to 80 % of the total CO2 (3094 ± 896 ppm) and 61 % of the total S (1946 ppm) as described below for MI LFL2-D44-1-1.
A review of the literature highlights the lack of information regarding the CO2 contents of mafic magmas erupted at SV. In order to more accurately constrain the depths of MI formation, assuming that the melts were volatile saturated, information is required for the concentrations of the volatile components (e.g., CO2, H2O, S, Cl, F) in the MI, with CO2 perhaps being the most important volatile in more mafic melts. More accurate determination of depths of trapping from MIs hosted in crystals could also shed light on the origin of CO2 that is being fluxed to the surface. In the present study, we provide new insights into the volatile budgets of some inter-Plinian and Plinian eruptions at SV based on measured volatile contents of MIs hosted in olivine crystals.
The work presented here builds and expands on the heating experiments and Raman data from 20 vapor bubbles in bubble-bearing MIs reported by Esposito et al. (2016). Nine of the same MIs for which Raman data were reported earlier by Esposito et al. (2016) were analyzed in the present study to determine the major elements and volatile contents of the glass (not the bubble). In addition, we present new major-element and volatile data of the glass phase in another bubble-bearing MI, as well as new major elements and volatile unpublished data for 10 additional bubble-free MIs (Table 2 and flowchart in Fig. 2). Based on the new data presented here, MIs hosted in high-Fo olivine (Fo85–90) show relatively high volatile contents compared to MIs hosted in low-Fo (Fo74–69) olivine. Based on the restored CO2 content of MIs hosted in olivine Fo90, we estimated the amount of CO2 that has exsolved from ascending magmas during the last 300 years of activity at SV.

Figure 2Flowchart for the sample preparation and analysis of MIs presented in this study and those of Esposito et al. (2016).
Table 2Comparison between the analytical techniques and the number of MIs analyzed reported by Esposito et al. (2016) and in this study.

The Mt. Somma–Vesuvius (SV) volcanic complex is located in the Campanian Plain in the eastern part of the city of Naples (southern Italy; Fig. S2). The history of this volcanic system dates back to ∼ 400 ka based on lava flow samples from a bore hole at Trecase (Brocchini et al., 2001), but most current knowledge concerning the volcanic history of SV is from < 40 ka to 1944 CE, when the most recent eruption occurred. The SV volcanic field is part of the Campanian Magmatic Province, which in turn is part of the Plio-Quaternary volcanism of the Italian Peninsula (Peccerillo, 2020, and references therein). Volcanic activity at SV has been divided into three megacycles (Fig. S3): megacycle I (pre-19.2 kyr BP, Santacroce et al., 2008), megacycle II (19.27 kyr BP to 79 CE), and megacycle III (79 CE to 1944 CE) as proposed by Ayuso et al. (1998). The most recent megacycle began with the 79 CE eruption (also known as the Pompeii eruption) following 295 years of repose (Stothers and Rampino, 1983). Following the 79 CE eruption, two other high-magnitude explosive eruptions (Plinian and sub-Plinian) occurred in 472 CE (Pollena eruption) and in 1631 CE. These high-magnitude events were followed by episodic low-magnitude vulcanian and effusive activity (Fig. S3). At SV, the 79 CE and Avellino (4.36 ka, Santacroce et al., 2008) Plinian eruptions produced airfall deposits in which the lower half of the deposit is characterized by white pumice clasts, while in the upper half pumice clasts abruptly change to a gray color (e.g., Lirer et al., 1973; Sigurdsson et al., 1982). The color change has been correlated with a change in chemical composition of pumices of these deposits (Civetta et al., 1991) that reflects eruption from a compositionally layered magma chamber, an interpretation that is also supported by the Sr and Nd isotopic compositions (Civetta et al., 1991).
At SV, a correlation is observed between the megacycle of eruption and the extent of Si undersaturation and K enrichment of erupted magmas (Ayuso et al., 1998; Joron et al., 1987; Peccerillo, 2020; Piochi et al., 2006; Santacroce et al., 2008; Pappalardo and Mastrolorenzo, 2010). In fact, the three megacycles represent three distinct suites of rocks. The oldest suite of rocks (megacycle I) follows a trajectory from trachybasalts to shoshonite, latite, and trachyte on a total alkali–silica (TAS) diagram (Fig. 4a from this study and Fig. 5.3 in Peccerillo, 2020). The megacycle I rock suite is represented by moderately silica undersaturated magmas similar to those defined by the rocks in the nearby Campi Flegrei (Phlegraean Fields) volcanic field (Fig. S2). The second rock suite (megacycle II) lacks mafic rocks and shows a prevalence of Si-undersaturated composition evolving from tephriphonolites to phonolites. The megacycle III rock suite represents the most Si-undersaturated rocks of SV. This rock suite defines in general a trend starting from the upper part of the trachybasalt field crossing to the phonotephrite and tephriphonolite fields (Fig. 4a from this study and Fig. 5.3 in Peccerillo, 2020). This chronological correlation with Si undersaturation has been interpreted to represent the progressive interaction between magmas and carbonates that comprise the upper part of the local crust with time (Peccerillo, 2020). The 79 years of dormancy since the last eruption of SV in 1944 can be interpreted as the beginning of a long repose time before the next (fourth) megacycle begins. Alternatively, the 79 years of dormancy might represent the beginning of an anomalously long repose time within megacycle III (De Vivo et al., 2010), based on the observation that during the 1631–1944 inter-Plinian cycle the repose time between eruptions has ranged from 7 to 30 years.
The structure of the crust beneath SV has been investigated by geophysical studies (Nunziata et al., 2020, and references therein) that have attempted to define the base (bottom) of the carbonate platform beneath SV. The carbonate platform is interpreted to extend no deeper than 10 km based on one- and two-dimensional velocity models (Nunziata et al., 2006). Conversely, the base of the carbonates could be at ∼ 12 km below the surface where the magnetic basement representing metamorphic rocks is present (Merlini and Mostardini, 1986). The thickness of the carbonate platform in the Campanian Plain is thought to be 3 km based on geological field work and mapping in the southern Apennines (Vitale and Ciarcia, 2018). Some have also suggested that the thickness of the carbonate platform below Vesuvius could be up to 6 km if its thickness has been doubled as a result of thrusting (Nunziata et al., 2020). In addition to geophysical studies, many studies of magma dynamics and depth of magma storage at SV were based on melt and fluid inclusions hosted in crystals from xenoliths and in crystals interpreted to have grown from the erupted magma (Belkin et al., 1998; Fulignati et al., 2004). Scaillet et al. (2008) presented experimental phase equilibria data suggesting that magma reservoirs feeding eruptions at SV migrated from 7–8 km before the 79 CE Pompeii event to 3–4 km before the 472 CE Pollena event. This upward migration of magma reservoirs could be larger (9–11 km) if the Pomici di Base (22 ka; Santacroce et al., 2008) and 1944 volcanic events are considered.
These studies all point to magma storage at various depths consistent with those of the carbonate platform, especially if the platform is doubled in thickness as discussed above.
3.1 Sample preparation
In this study, 23 olivine phenocrysts containing one MI or multiple MIs were selected from samples representative of SV eruptions based on Ayuso et al. (1998) and Redi et al. (2017). Locations of the studied samples are reported in Fig. S2. The 23 olivine crystals were in addition to 20 olivine crystals studied earlier by Esposito et al. (2016) (Table 2). Three olivine crystals are from the 1631 CE Plinian eruption and four are from the 472 CE (Pollena) Plinian eruption. Fifteen olivine phenocrysts are from the 79 CE (Pompeii) Plinian eruption. Of the olivines from the 79 CE Pompeii Plinian eruption, seven are from the gray pumice deposit and eight are from the white pumice deposit. Nine olivine crystals are from of the Avellino Plinian eruption (4.36 ka). Four of the olivines are from the white pumice deposit, while the rest of the crystals are from the gray pumice deposits of the same eruption. The rest of the olivines (12) are from two lava flows that occurred at >33 ka, preceding the Codola eruption which formed the Somma Caldera at 33 ka (Giaccio et al., 2008). Six olivine crystals were selected for each of these lava flows. Additional information related to the samples used for this study can be found in Ayuso et al. (1998) and Redi et al. (2017). Data from the present study are divided into microthermometric data, major-element concentrations, and volatile concentrations. A summary of the data collected in this study and data from Esposito et al. (2016) is listed and compared in Table 2 and Fig. 2. The crystals studied were separated from the bulk rock by gentle crushing. Olivine crystals were separated and mounted in several epoxy mounts (2.54 cm in diameter). The mounts were examined with a petrographic microscope, and crystals containing suitable MIs were selected for further study. Suitable MIs were those sufficiently large (>25 µm) to be analyzed by the technique we employed in this study (see text below). MIs selected for heating experiments were examined to search for evidence of decrepitation and/or connection with the outside of the olivines (Esposito, 2021). The selected MI-bearing olivine crystals were extracted from the epoxy mounts using a hot probe and mounted with super glue on a standard glass section. Several 300 µm thick pieces of glass were mounted around the olivine crystals to control the thickness during grinding and polishing. The ∼ 300 µm thickness was important to enhance the quality of the optics during experiments at high temperatures (Esposito et al., 2012). After polishing, heating experiments were conducted to re-homogenize the MI using a Vernadsky stage (Sobolev et al., 1980) at the Centre for Ore Deposit and Earth Sciences (CODES), University of Tasmania (Australia). After the heating experiments, the crystals were remounted in single aluminum cylinders (5 mm in diameter), with the crystal surface that was closest to the MI facing upward. During polishing, an amount of material was removed such that the approximate middle (in term of thickness) of each MI was exposed at the surface. After exposing the MI, the crystals were removed from the epoxy mount for Raman analyses as reported by Esposito et al. (2016). After the Raman data were collected, the crystals were remounted in 2.54 cm epoxy mounts for major- and minor-element concentrations using wavelength dispersive X-ray spectroscopy (WDS) electron probe techniques at the University of California Los Angeles (UCLA; USA). Finally, after this third extraction, the crystals were pressed into an indium mount for analysis of volatiles in the MI glass using secondary ion mass spectrometry (SIMS) at Centre de Recherches Pétrographiques et Géochimiques (CRPG; France). Note that when crystals are pressed into indium, they may break and the MI can be compromised. Also, some crystals were lost through sample extractions and remounting. To summarize, during the sample selection and preparation process many crystals were initially selected, but some crystals were lost during the process of repeated mounting and extraction, and some MIs were accidentally destroyed or damaged during polishing. Some other MIs were too small for one or more of the selected analytical techniques. In spite of these various occurrences, we were able to obtain SIMS data for 18 MIs. Vapor bubbles in 9 out of 10 bubble-bearing MIs studied here were analyzed for volatile contents using Raman spectroscopy at Virginia Tech (US) and the results were reported by Esposito et al. (2016). Those latter results are incorporated together with the new results reported here in order to provide full characterization of the studied bubble-bearing MI.
3.2 Heating experiments
In this study, 43 heating experiments were conducted to homogenize crystal-bearing MIs, followed by quenching to a homogeneous glass (± a vapor bubble) using a Vernadsky heating stage (Sobolev et al., 1980). The experiments were done on single crystals to observe and record temperatures of phase changes in each individual MI (Table S1 in the Supplement). Out of the 43 experiments, 18 heating experiments were reported previously by Esposito et al. (2016), while the other 25 experiments were newly conducted for the present study. Reheated olivines contained one MI or multiple MIs. One olivine (P1-D49-2-3) from the Pompeii eruption was heated twice to homogenize the MI to a single phase after failing on the first attempt. We included a gold flake during each experiment and positioned it close to the MI being analyzed to monitor and correct for known thermal gradients within the Vernadsky stage (e.g., Schiano et al., 2006). Based on melting ∼ 50 µm gold flakes mounted on the top surface of the olivine phenocryst and ∼ 100 µm from the analyzed MI, the average of the measured gold melting temperature was 1063 ∘C with a range of temperature between 1050 and 1073 ∘C (the known melting temperature of pure gold is 1064 ∘C). In fact, factors such as the thickness of the crystal, its position inside the furnace, and the position of the MI itself inside the crystal may influence the measured T. The average duration of the experiments was 17 min, and the length of time an individual phenocryst and its contained MI was held at T>800 ∘C was less than 9 min (see also Esposito et al., 2016). The olivine phenocrysts were held at maximum T (1143–1238 ∘C) for ∼ 3 min to attain thermal equilibrium. Before heating, some of the MIs were partially glassy, and in some cases it was possible to recognize one or more bubbles and daughter crystals. Other selected MIs showed a high degree of crystallization and were completely opaque on the optical microscope (Fig. 1a, c, e). In these cases, it was not possible to recognize a bubble or daughter crystals before heating. During the heating ramps we noted that the glass begins to crystallize (devitrify) in the glass portion of the partially crystallized MI. The crystallization T ranges from 560 to 996 ∘C. Also, during the heating ramp we noted that melting starts at the MI wall at 686 to 1107 ∘C (Table S1).
3.3 Electron microprobe (EMP) analysis of major-element concentrations of MI and olivine
Major- and minor-element abundances in MIs were determined using a JEOL JXA-8200 Superprobe equipped with five WDS detectors at UCLA. The accelerating voltage was 15 kV, with a beam current of 10 nA and a 10 µm spot. The 1σ standard errors were <2 % (relative) for SiO2, Al2O3, FeO, MgO, and CaO; <9 % for Ti2O3, NaO, K2O, and Cl; and <20 % for MnO based on counting statistics. Background counting times were 10 s, while counting times at peaks were 20 s, with the exception of Na and K that were counted for 10 s and were analyzed first to minimize loss by diffusion. Major- and minor-element concentrations were determined for 24 MIs, and most MIs were analyzed twice (at two different spots within the MI) to test the homogeneity of the glass. More MIs were heated in the Vernadsky stage than were analyzed using EMPA for the following reasons. Firstly, some MIs could not be homogenized. Secondly, some MIs showed decrepitation halos after heating, suggesting loss of some components from the MI (Fig. S4). Thirdly, some crystals were lost or damaged during one of the steps from heating experiments to sample preparation and analysis. Finally, some MIs were damaged or completely consumed during sample preparation to expose the MI at the surface of the sample. All of the analyzed MIs are hosted in olivine (Tables S1 and S2).
The composition of olivine host crystals was analyzed with the same instrument as for the MI. The oxides analyzed were SiO2, Al2O3, MgO, FeOtot, CaO, NiO, and Cr2O3. An accelerating voltage of 15 kV and a beam current of 40 nA were used in focused spot mode (spot size around 1 µm). The standards used for this set of analyses were the same as were used for the glass analyses, with the addition of a synthetic Ni-olivine. The 1σ error is <1 % relative for SiO2, MgO, and FeOtot, and it is <5 % for CaO. For NiO concentrations >0.10 wt %, the 1σ error is <20 % but increases to 30 % for NiO concentrations <0.10 wt %. The 1σ error for Al2O3 and Cr2O3 can be as much as 40 %.
The compositions of the 24 olivine-hosted MIs were corrected for PEC and Fe loss (Petrolog3; Danyushevsky and Plechov, 2011); see Table S2. We assumed 8.00 wt % FeO for the glass composition for the Fe-loss correction. Olivine-melt equilibrium was calculated as described by Ford et al. (1983), and a Ni–NiO buffer was assumed to calculate the oxygen fugacity based on the model of Borisov and Shapkin (1990). Corrections of MI composition based on this method indicate that 0.2 % to 10 % excess olivine was added to the melt, suggesting MIs were overheated during the heating experiments. Accordingly, aliquots of olivine were removed (not added back) from the liquid to reach equilibrium based on the conditions assumed (Table S2). In two cases, from 3 % to 4 % of olivine had to be added back to the measured MI composition to reach equilibrium with the MI hosts.
3.4 Analysis of volatiles by SIMS
Volatile (CO2, H2O, F, S, Cl) and Al concentrations of the glass in reheated melt inclusions were determined using secondary ion mass spectrometry (SIMS) at Centre de Recherches Pétrographiques et Géochimiques (Nancy, France). Thirteen (13) international reference glasses were used to construct calibration curves for each of the following isotopic ratios: , , , , , and (Table S3). Based on repeated analysis of the standards, the 1σ error for is <12 % when the CO2 concentration in the glass is >120 ppm and <31 % when the CO2 concentration of the glass is <120 ppm; the 1σ error for is <7 % for H2O concentrations from 0.01 wt % and 3.07 wt %; the 1σ error for , , and is ≤7.4 %; the 1σ error for is ≤10 % (Table S3). The analytical accuracy was calculated based on the average deviation of the individual reference glasses from the calibration curves. This deviation was 18 % for CO2, 5 % for H2O, 4 % for F and S, and 11 % for Cl. Additional information related to glass reference identities and sources is available in Table S3. Calibration curves for SIMS analysis are reported in Fig. S5 in the Supplement.
3.5 Restoration of CO2 recorded by MIs
For the bubble-bearing/high-Fo MIs, the total CO2 concentration of the trapped melt was obtained by correcting the CO2 contents of the glass determined by SIMS to account for the CO2 contained in the bubble (Table 3). The Fo-rich MIs analyzed by EMPA and SIMS in the present study are the same as those for which Esposito et al. (2016) previously reported micro-Raman and microthermometric data for the bubble (not the glass). In this study, major and minor elements and volatile contents of the glass (not the bubble) were obtained to gain comprehensive volatile analyses of both the glass and the bubble for these bubble-bearing MIs. The volatile contents of the glass obtained in this study were thus combined with volatile contents reported by Esposito et al. (2016) to obtain the total volatile budget of the trapped melt. One of the 10 high-Fo MIs for which we measured major and minor elements and volatile contents of the glass (P1-D50-1-8-M6: in red in the Table 3) was not analyzed using Raman analysis because the bubble was opened during polishing to expose the MI at the surface. However, the olivine hosting this MI contained other MIs, one of which (P1-D50-1-8-M1) was analyzed both in this study and by Esposito et al. (2016). For P1-D50-1-8-M6, which was destroyed during polishing, the correction for the CO2 content of the bubble was based on the other MIs hosted in the same olivine crystal (P1-D50-1-8-M1) because the major-element and volatile compositions of the glass of the two MIs are the same within analytical error. In addition, the bubble MI volume ratio of the two MIs is similar (1.9 and 2.5). The volume proportion of the MI occupied by the bubble could be determined for both MIs because photomicrographs after the heating experiments were taken for all the MIs selected (Table 3). Also, the bubble of MI LM8-D57-4-4 was analyzed by Esposito et al. (2016) and the Raman Fermi diad peaks for CO2 were detected. However, the Fermi diad peaks were defined by <6 data points above the background, and the estimated peak positions were imprecise. If the peak positions have large uncertainty, the calculated CO2 density of the bubble will also be highly imprecise (see the Supplement by Esposito et al., 2016, for method details). It was not possible to repeat the analysis in an attempt to obtain a better resolution because the bubble was opened during further polishing to bring the MI closer to the surface. However, the glass of this MI was analyzed for volatiles using SIMS because the glass was not compromised. In this study, the CO2 content of the bubble in MI LM8-D57-4-4 was assumed to be the average content measured in other bubbles. For 9 out of the 10 bubble-bearing and Fo-rich MIs, Esposito et al. (2016) reported whether mineral phases on the wall of the bubble were present using micro-Raman. The mineral phases reported included calcite, native sulfur, and gypsum (see the dark objects in the bubble in Table 3). Esposito et al. (2016) used a mass balance method to calculate the amount of CO2 or S contained in these minerals present in the bubble, similar to Moore et al. (2015), who determined the amount of mineral on the bubble wall optically. The amount in volume of the mineral detected in the bubble was based on two assumptions. The first one is that the thickness of the dark objects is ∼ 2 µm. The second one is that the amount of crystals (in terms of volume) observed on the top wall of the bubble is the same as the bottom part. For bubbles showing both carbonate and S-bearing phases, different proportion of the two phases were assumed, and this explains the error reported in Table 3 (LFL2-D4-4-1-1, P1-D4-9-2-7, P1-D5-0-1-8-M1, P1-D5-0-1-8-M6, R6-D5-4-4-2, SCL14-D92-3-1). The lower bound is calculated assuming a carbonate S-bearing phase ratio of 0.1. The upper bound is calculated assuming carbonate S-bearing phase ratio of 0.9. For the other bubbles showing only carbonate Raman signal, a single value of CO2 from carbonate was calculated. The four bubbles reported in Table 1 by Esposito et al. (2016) were also reported in our Table 3 (SCL14-D92-3-1, LFL2-D4-4-1-1, P1-D4-9-2-7, R6-D5-4-4-2). For the other bubbles, we considered their photomicrographs, and we applied the same method to calculate the amount of CO2 stored as carbonates within the bubble. As discussed above, for P1-D5-0-1-8-M6, the contribution to the CO2 budget from carbonates was assumed to be the same as for P1-D5-0-1-8-M1. For LM8-D57-4-4, no correction for carbonate was applied because a Raman signal for carbonates was not detected in this bubble. A final correction of the CO2 content of MIs involved correction for PEC. The CO2 contents of bubbles were based on the sum of the CO2 contained in the gas (fluid phase) and CO2 hosted by carbonates within the bubble, combined with the CO2 contained in the glass (Table 3). A correction coefficient was applied based on the PEC using Petrolog3 software (Danyushevsky and Plechov, 2011). Furthermore, we compared our CO2 bubble restoration values with that predicted using the method by Rasmussen et al. (2020) and by Riker (2005) using Mimic software (Rasmussen et al., 2020); see Table S4.
Table 3Correction for the CO2 contents of bubbles of bubble-bearing MIs. Red indicates CO2 contents not directly quantified (see the text for more details).

Based on results reported by Esposito et al. (2016) for one bubble (LFL2-D44-3-2), the molar fractions of H2O and CO2 in the bubble were estimated from the relative Raman peak areas measured at 150 ∘C, normalized according to the relative scattering efficiencies (Burke, 2001). For inclusion LFL2-D44-3-2 (Avellino eruption; 4.36 ka), two analyses at two focal depths within the bubble yielded H2O concentrations of 20 ± 12 mol % and 30 ± 21 mol % H2O. The CO2 Fermi diad peaks were obtained both at room T and at 150 ∘C. Comparison of the splitting of the CO2 Fermi diad of the two micro-Raman analyses suggests that the peaks taken at different temperatures do not show a significant shift (Fig. S6). The most important source of error for the density estimation is represented by the asymmetry of the Fermi diad peaks for relatively low density, hampering the curve fitting of these peaks (Remigi et al., 2021). In this work, we estimated an error of the CO2 density of the bubble based on the calculation of the bubble MI volume percent as described by Tucker et al. (2019); see Table 3.
3.6 Restoration of H2O recorded by MIs
H2O can be lost from the MI during residence in the plumbing system before eruption or after eruption during cooling at the Earth surface (natural processes) and during the heating experiments in the laboratory (human-induced process). We tested for H loss during experiments by applying H diffusion models of Qin et al. (1992). For the calculation, we employed the Hmelt-olivine partition coefficient k=0.001 (Barth and Plank, 2021). The H diffusion coefficients (D) in olivine were based on the Arrhenius relationship (equation reported in Table 1 by Barth and Plank, 2021). To solve this equation, we assumed different H diffusion coefficients (D0) according to the composition of the host for each MI studied here. For the high-Fo MIs, we used the diffusion coefficient reported by Ferriss et al. (2018), and for low-Fo MIs we used that reported by Barth et al. (2019). For the T to solve the Arrhenius relationship, we used the maximum T of the heating experiment of each MI analyzed in the present study. This is a conservative assumption because the maximum T of the heating experiment was held only for 3 min. For the extent of re-equilibration calculated using Eq. (12) of Qin et al. (1992), we used the size of MIs obtained from petrographic observations and assumed that the host olivine crystals were 2 mm in diameter as this is a reasonable average for the olivines studied here. Using the spherical model of Qin et al. (1992) in combination with the D along the [100] direction overestimates H diffusive loss, providing an upper bound. In our calculation, we assumed that the MIs are located in the centers of the olivine hosts, and this introduces some uncertainty because the amount of H loss by diffusion depends on the distance from the MI to the rim of the olivine host. In order to estimate the error based on the location of the MI within the host, we considered that the host olivine radius was 250 µm instead of 1000 µm as a limiting condition. Based on this assumption, for high-Fo MIs, the average relative error on the restored H2O content after experiments is 27 % (or 1.06 wt % of the total MIs). For the low-Fo MIs, the average relative error is 0.60 wt % of the H2O mass, even though the error in the degree of re-equilibration is >100 % for half of the MIs studied.
After these observations, based on the location of the MI within the host, we observe that the distance from the MI to the rim of the host has a larger effect for MIs hosted in low-Fo olivine, especially for MIs associated with a diffusion coefficient on the order of 10−10 cm2 s−1 and with a relatively small radius (<30 µm). Particular attention should be taken when heating MIs show these size and host composition conditions. On one hand, there is a positive error associated with the location of the MI relative to the rim of its host. On the other hand, there is negative error associated with the assumption that the D calculated using the quenching T is constant at high T during the experiments. These two errors likely compensate. We have developed a program to calculate the degree of the re-equilibration of the MI as a function of the diffusion coefficient (D), the radius of the MI and its host, and the densities of melt and host, based on Eq. (12) by Qin et al. (1992) available upon request to the corresponding author.
We also tested for possible H loss before eruption during residence in the magma chamber by predicting the crystallization path using Petrolog3 (Danyushevsky and Plechov, 2011). We used as a starting composition the high-Fo MI of this study and selected the trend that best fit our MI data in K2O versus Fo content (mol %) space. We assumed a polybaric crystallization path and an H2O-saturated magma. Finally, we tested the correlation between H2O and K2O by comparing our MI data to the trend predicted by Petrolog. Based on this comparison, we did not correct the H2O contents of MIs for H loss during residence in the plumbing system (see Sect. 5.1 for further details).
The MIs studied here were also corrected for H diffusive loss post-eruption in nature (see flowchart of Fig. 3 and Table 4). To correct the H2O contents of MIs we compared MI data of lava samples (which are assumed to have cooled more slowly and, as a result, lost more H2O after eruption) with those of lapilli samples of airfall deposits from the Pompeii 79 CE eruption which presumably cooled more quickly. For the Pompeii 79 CE eruption sample, the white and gray pumices have an average size of 2 cm (Sigurdsson et al., 1982). As reported by Lloyd et al. (2013), a MI at the center of a 2 cm lapillus cools from 1034 to 400 ∘C in ∼ 1 min. To correct for post-eruption H loss, we assumed that all MIs hosted in olivines with similar compositions showed the same initial H2O content, regardless of the sample type (pumices versus lava samples). This assumption is supported by the correlation between the Fo content of the host and the volatile contents of MIs (see flowchart of Fig. 3 and Table 4).
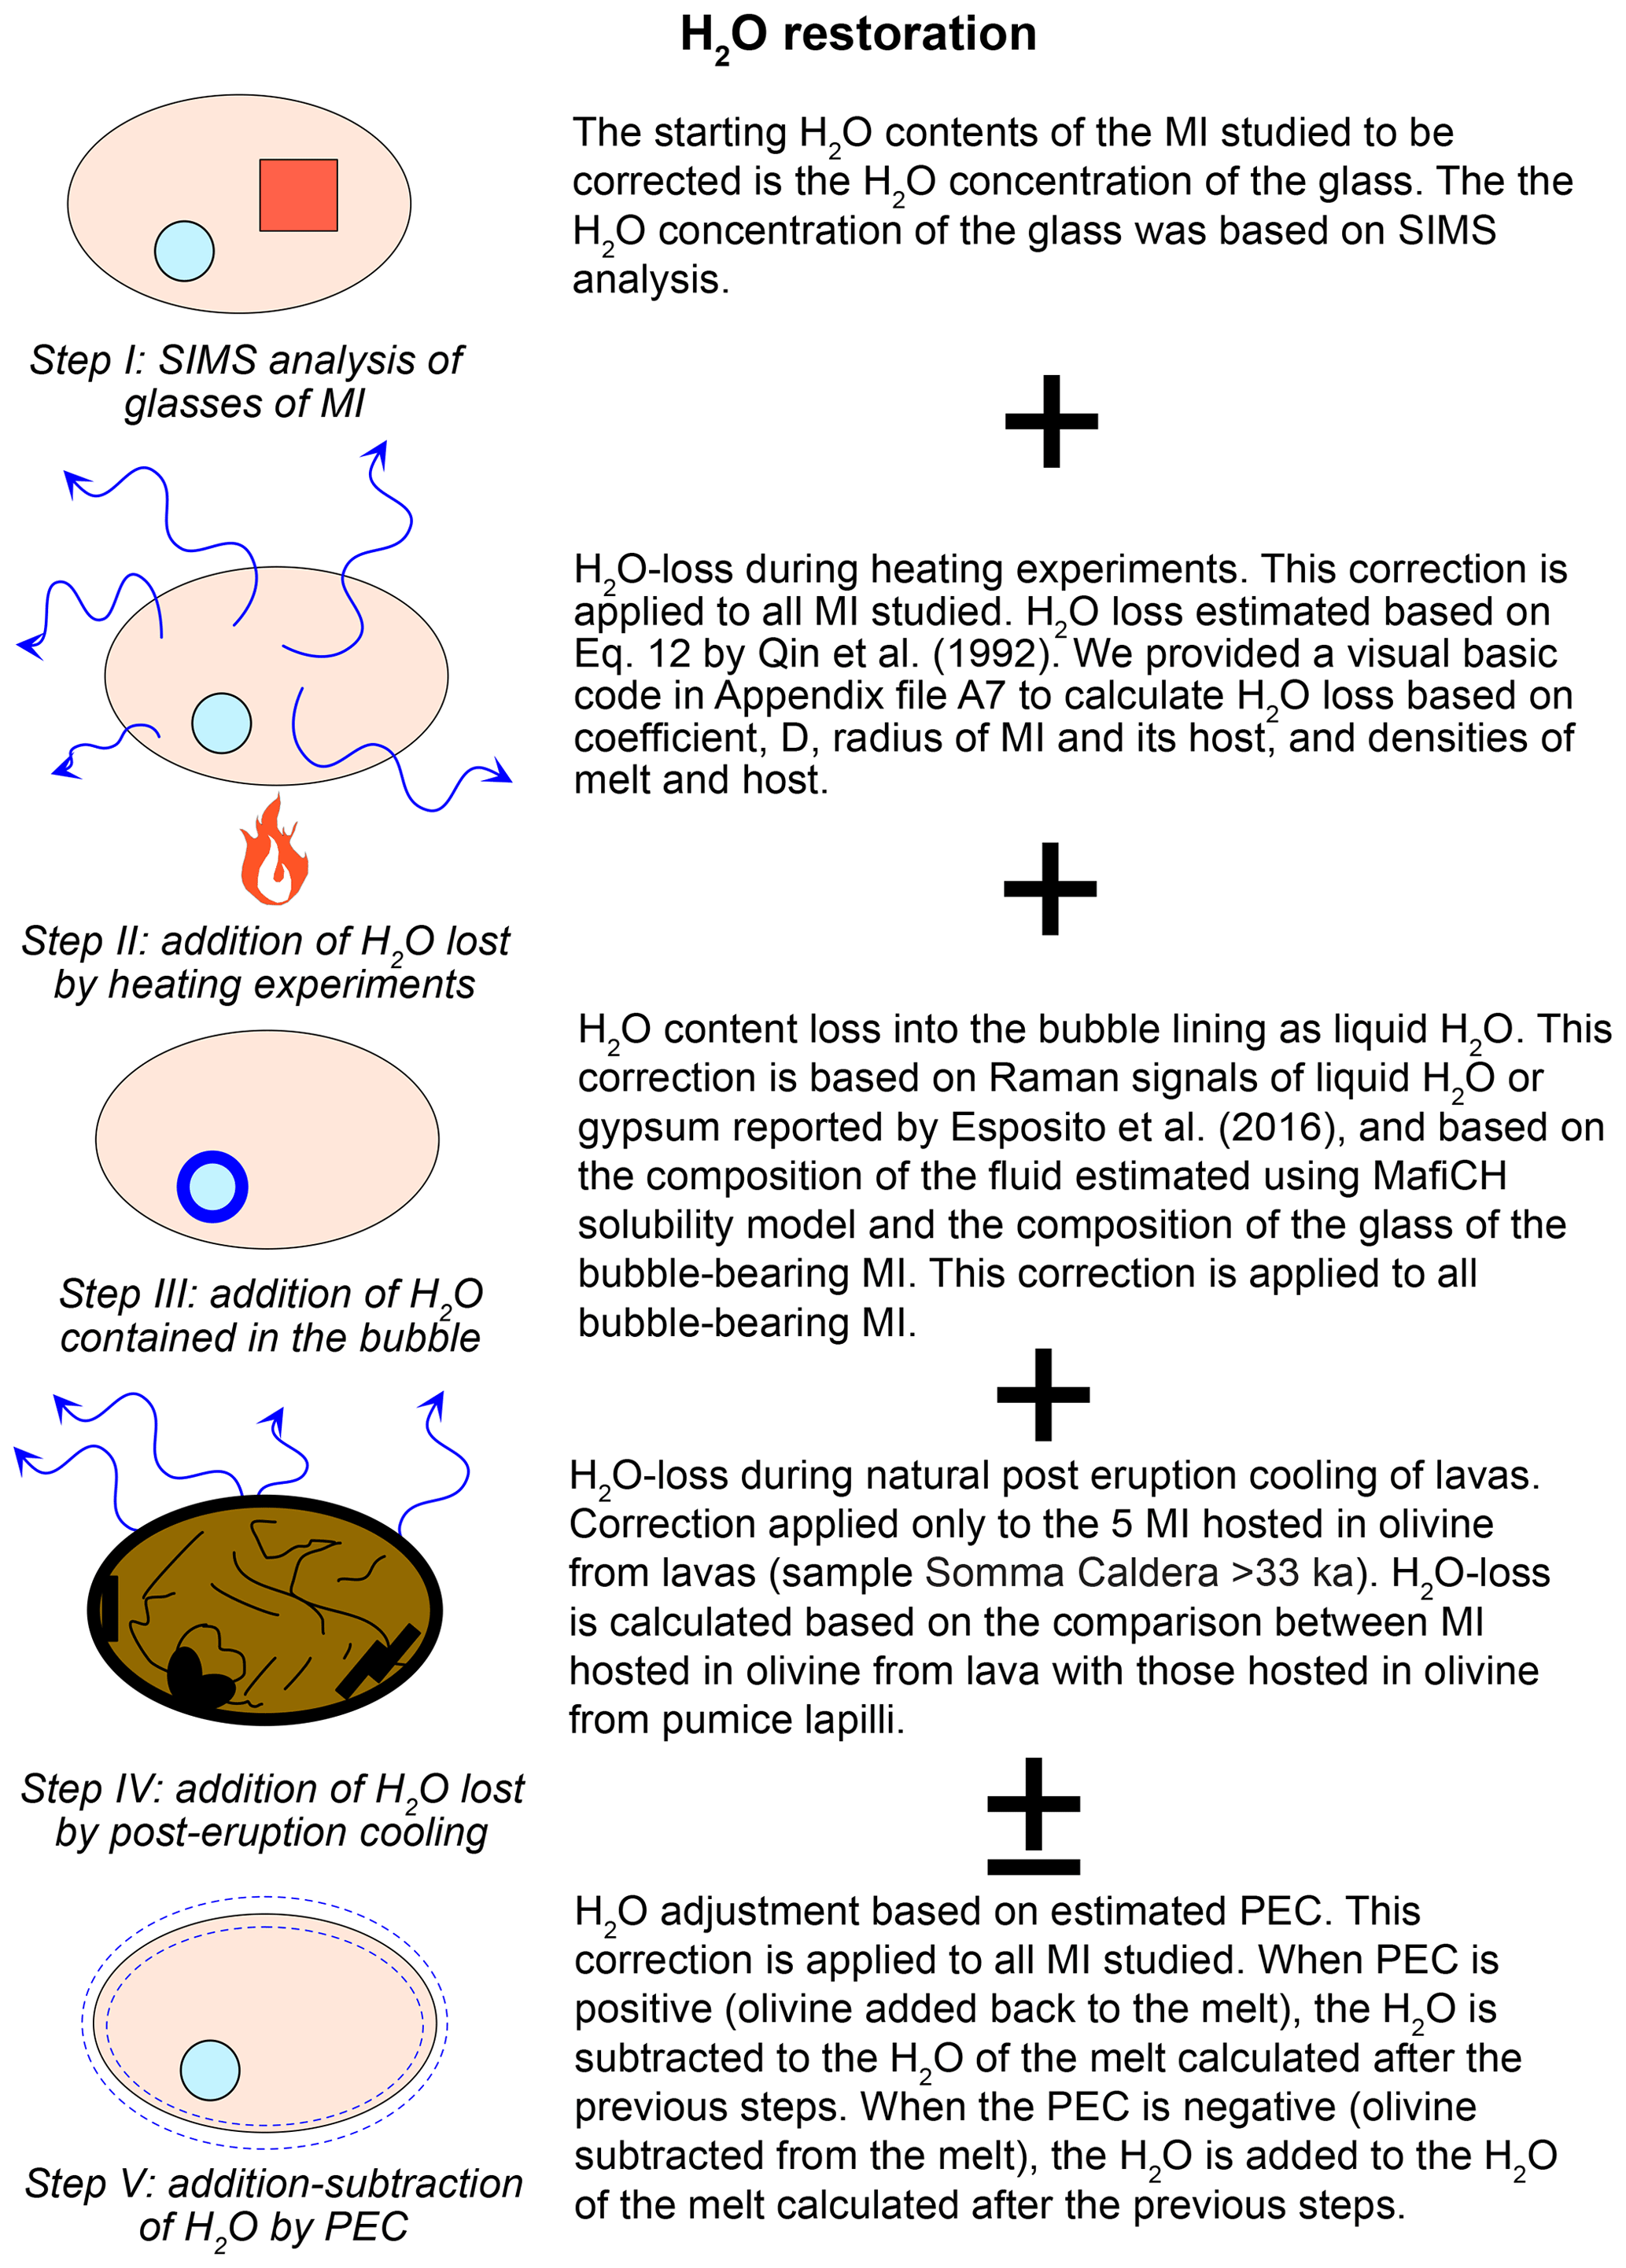
Table 4Restoration of the H2O contents of MIs. H2O corrections take into account (1) H2O loss by diffusion during heating experiments, (2) H2O loss by diffusion during post-eruption cooling, (3) H2O content of the bubble in bubble-bearing MIs, and (4) PEC (see the text for more details). The table also shows the restored CO2 contents along with F, S, and Cl contents of the glass of the MI.
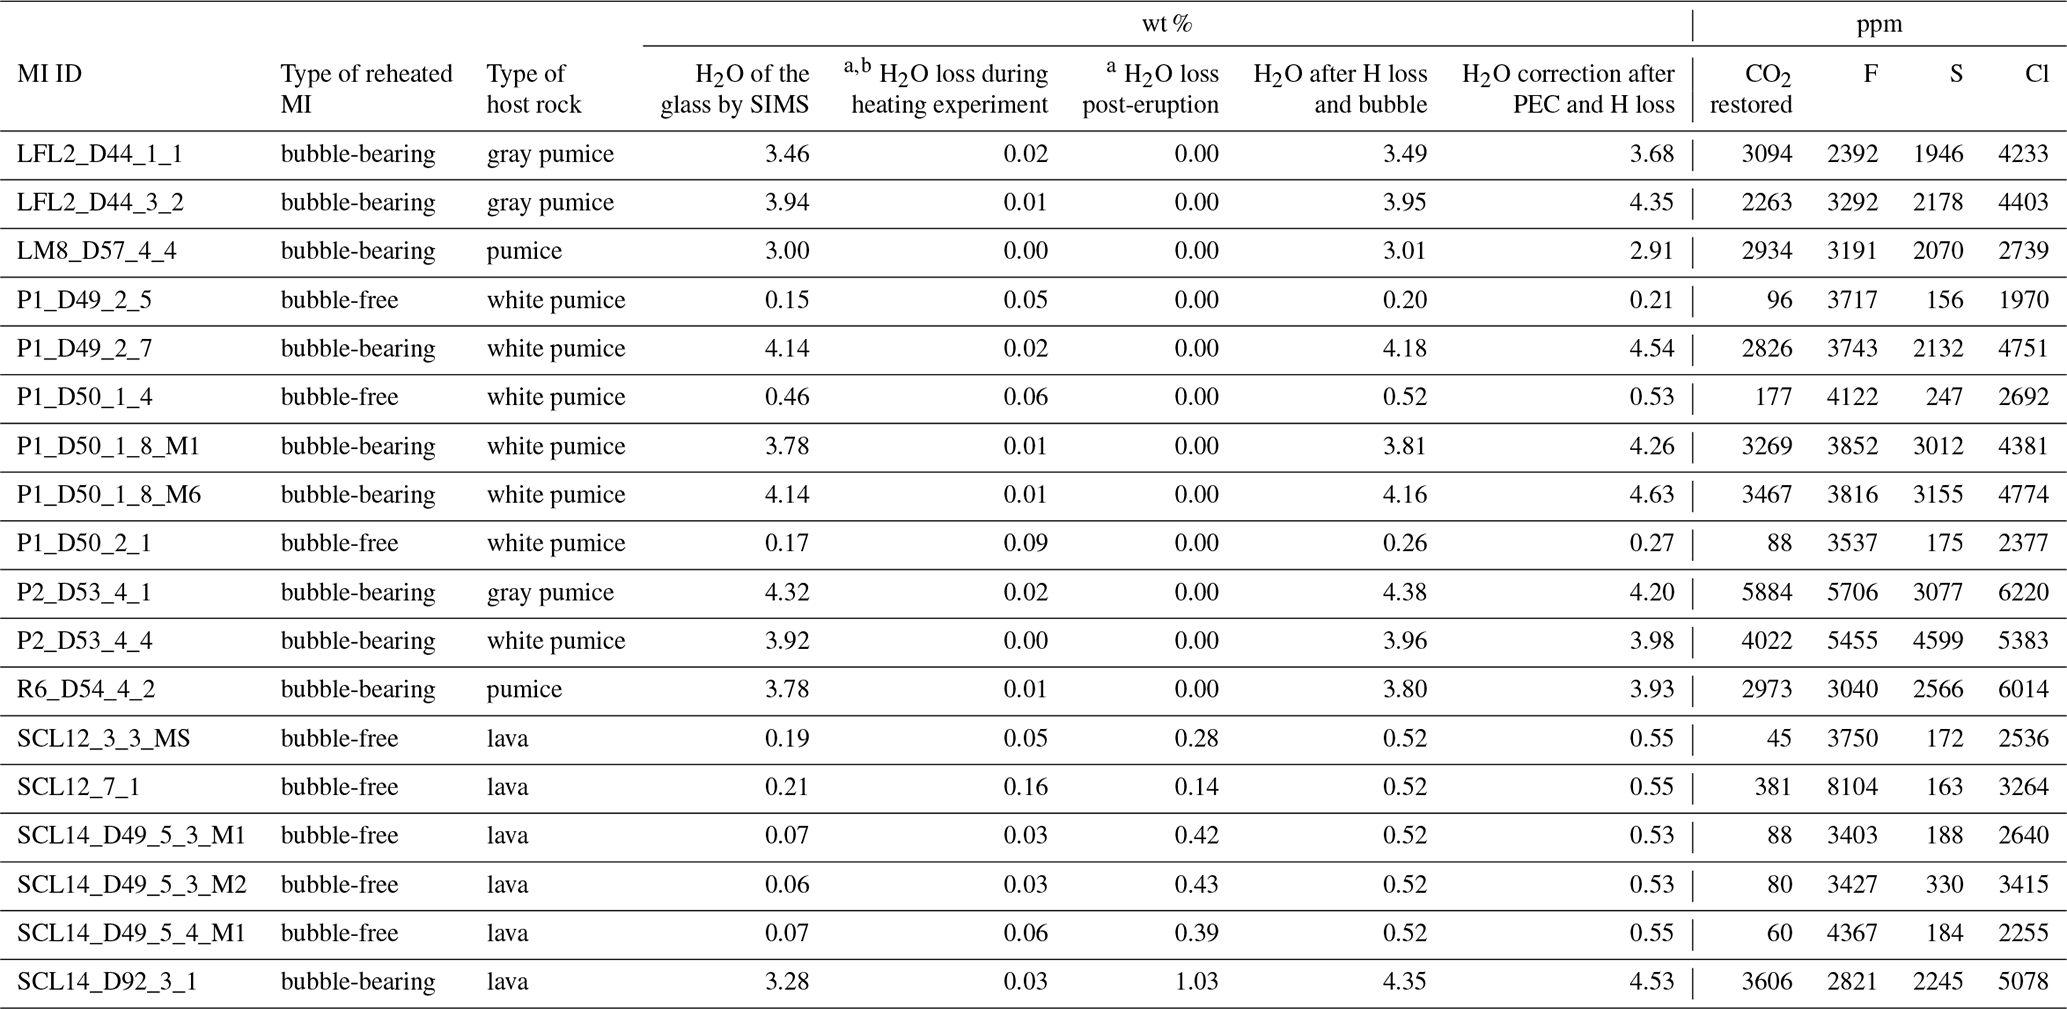
a wt % relative to the total MI mass. b From “H diffusive experiments” worksheet column L of Table S5.
In addition to modifications of the H2O contents of MIs from H diffusive loss, the H2O contents of the bubbles in bubble-bearing MIs were calculated to correct the original H2O content of the MIs (Table 4). This calculation was based on the fluid composition returned by the solubility model MafiCH (Allison et al., 2022) using as input the volatile and major-element compositions of the glass in MIs. Knowing the composition and density of CO2, the amount of H2O in the bubble was calculated from the molar fraction predicted by MafiCH (Allison et al., 2022). The need to correct for H2O is based on the presence of H2O liquid and vapor in six bubbles in MIs as reported by Esposito et al. (2016). As for CO2, the H2O content was corrected to account for PEC. In summary, we corrected the H2O contents of the MI by (1) adding to the H2O content of the glasses of bubble-bearing MIs the H2O content of the bubble, (2) adding the H2O loss during heating experiments for each individual MI, (3) adding the H2O content lost during natural cooling post-eruption (only for MIs hosted in olivine from lavas), and (4) taking into account the PEC of individual MIs (see flowchart of Fig. 3 and Table 4). We did not correct the H2O content for possible loss during magma residence.
4.1 Heating experiments
Petrographic descriptions of the MI before and after heating, as well as other information related to individual MIs and their host crystals, are listed in Table S1. References to individual MIs and/or host crystals below use the identifiers listed in column N of Table S1. During heating, crystals in most MIs melted to produce MIs that contain melt plus vapor at high T (Table S1, column T). With further heating, the size of the bubble in MIs in three olivine crystals decreased with increasing T until complete dissolution into the melt occurred (experiment M161, M162, and M142 in column N of Table S1). The MIs contained in these three olivines were quenched to produce bubble-free MIs. In addition to these three olivine crystals, one olivine showed that smaller MIs were quenched to only glass, but the larger one selected for the study leaked to the surface (experiment M147 in column N of Table S1). In contrast, in 18 other heating experiments (18 olivine crystals), the bubble size of MIs did not decrease significantly with increasing T after a specific high T was reached (M141, M163, M136, M167, M165, M129, M158, M138, M137, M139, M140, M135, M130, M130a, M132, M000, M152, M156). Esposito et al. (2016) quenched 20 MIs from 18 experiments when the bubble was not completely dissolved, and, after quenching, the MIs contain glass plus a vapor bubble. In eight additional heating experiments (eight olivine crystals, experiments M143, M128, M150, M151, M154, M155a, M146, and M145), the MIs still contained a solid (mineral) phase ± bubble after heating to high T. In two experiments (M143 and M155a) the mineral phases in the MI are opaque, and for the other six experiments, the mineral phases are colorless. In these cases, the minerals did not dissolve into the melt with further heating, suggesting that these MIs represent heterogeneous trapping of melt plus mineral plus or minus bubble. In nine of the experiments, the MI crystallized microlites (M166, M159, M160, M133, M157, and M134) or exsolved multiple bubbles (M144 and M158 from this study and M145 by Esposito et al., 2016) during quenching. In most of these cases, the MIs were completely dark when viewed on the optical microscope after quenching and were not considered further for this study (Fig. 1b). During four experiments (M143, M148, M155, and M164), the MIs leaked or decrepitated during reheating. Finally, during the loading or unloading of the crystals to the furnace, three olivine crystals were lost (olivines associated with experiment M131, M149, and M153). After heating and quenching experiments, we noticed that three MIs showed a decrepitation halo (MI associated with experiment M147 and M143 from this study and M139 by Esposito et al. (2016); see also Fig. S4), indicating loss of volatiles from the MI, and we did not consider these MIs for further examination. Notice that during an individual heating experiment more than one MI could have been described, and different MI behaviors could have been reported for individual olivine.
4.2 Major-element compositions of MIs
Corrected major-element compositions of MIs cluster into two groups in the TAS diagram (Le Bas et al., 1986) as shown in Fig. 4a. One group represents MIs hosted in high-Fo olivine (Fo = 85 mol %–90 mol %) showing compositions near the fields for trachybasalt, shoshonite, tephrite, and phonotephrite (Fig. 4a). In particular, MIs from the Avellino and Pollena eruptions show lower total alkali contents relative to MIs from the pre-Codola, Pompeii, and the 1631 CE eruptions. The other group represents MIs hosted in high-Fo olivine (Fo = 69 mol %–76 mol %) from the 79 CE Pompeii eruption and pre-Codola eruptions (>33 ka). All MIs of this group plot within the tephriphonolite field (Fig. 4a).

Figure 4Major-element composition of olivine-hosted MIs from this study compared to olivine-hosted MIs of recent SV activity from the literature and to bulk rock compositions reported by Ayuso et al. (1998). (a) TAS diagram (Le Bas et al., 1986). Note that MI data for the pre-Codola lava flows (Somma Caldera) >33 ka do not match with the bulk rock compositions associated with megacycle I. (b) MgO versus SiO2 discriminated by the age (megacycles) of eruptions. Note that MIs do not show the low-SiO2 trends as defined by the bulk rock data for megacycle III. (c) MgO versus SiO2 discriminated by the style of eruptions. (d) MgO versus K2O discriminated by the age of eruptions; volatile-rich MIs hosted in Fo-rich olivines from the Avellino eruption (4.36 ka, megacycle II) show lower K2O contents compared to volatile-rich MIs associated with the other eruptions. (e) MgO versus K2O discriminated by the style of eruptions. The field delineated by the dashed dark-green line represents volatile-poor MIs hosted in low-Fo olivines, and the field delineated by the dashed blue line represents volatile-rich MIs hosted in high-Fo olivines. The orange fields in panels (a), (b), and (d) and the light-green fields in panels (c) and (e) represent unheated MIs hosted in olivine from the most recent activity at SV (megacycle III) reported by Marianelli et al. (1995, 1999, 2005) and corrected for PEC and Fe loss using the same methods as for the MIs of this study.
It is important to note that compositions of MIs from the high-Fo olivine group are not distinguished from those of the bulk rocks based on the time (age) of the eruption (Fig. 4a, b, d). This behavior is in contrast with the three trends (megacycles) defined on the TAS when bulk rock compositions are considered instead of the MI compositions (Ayuso et al., 1998). The major-element compositions of MIs from this study are comparable to compositions of MIs hosted in olivine from the most recent 1944 eruption at SV, i.e., the last eruption in megacycle III (Marianelli et al., 1995, 1999, 2005). It is also important to note that the bulk rock compositions for the 79 CE Pompeii eruption up to the most recent eruptions (megacycle III) all show a lower SiO2 concentration at a given MgO concentration on the SiO2 vs. MgO diagram, compared to MI compositions (Fig. 4b–c). Note that this behavior is not observed in the older eruptions (megacycle I and II). In addition, bulk rock compositions of the younger SV products show a higher K2O concentration for a given MgO compared to the MI compositions (see Fig. 4d–e). The low SiO2 and high K2O versus MgO trends have been commonly interpreted to be the result of assimilation of Mesozoic carbonates into the younger magmas, an interpretation that is supported by skarn xenoliths that are frequently found in SV volcanic deposits (e.g., Gilg et al., 2001). Alternatively, these same trends can be explained as a mixture of accumulated olivine and clinopyroxene crystals and evolved magmas (Fig. S1). When all compositions of MIs hosted in olivine from this study and from the literature are compared to compositions of bulk rocks, MI compositions plot along one single trend in the K2O and SiO2 versus MgO diagrams, independent of the age (Fig. 4a, b, c) or style of the eruption (Fig. 4d–e).
4.3 Volatile contents of magmas
The H2O and CO2 contents of MIs obtained from analysis of the glass and the vapor bubble were corrected for post-trapping changes resulting from re-equilibration using the methods mentioned above. For H2O, H diffusive loss is the main process that could modify the H2O concentration in the MI after trapping. Here, we present the results of the corrections for H diffusive re-equilibration during heating experiments in the laboratory. Our results show that diffusive loss of H2O during heating experiments for all MIs studied ranges from 0.01 wt % to 0.16 wt % relative to the total mass of the respective MI (Table S5, H2O “correction and MafiCH press” worksheet column C). The extent of re-equilibration of MI H2O content correlates with the host composition, whereby high-Fo MIs show re-equilibration <1 %, while the low-Fo MIs show re-equilibration from 11 % to 62 % (Table S5, “H diffusive experiments” worksheet column K).
Considering the correction for the H diffusive loss post-eruption in nature, the highest H2O content of low-Fo MIs hosted in olivine Fo73 from lapilli samples is 0.52 wt % (P1-D50-1-4; see Table 4). Thus, as an upper boundary, the largest amount of H2O loss from MIs hosted in olivine from lava is 0.42 wt % (SCL14-D49-5-3-M1; after correction for the 0.10 wt % loss during the heating experiment). This maximum H2O correction corresponds to 81 % H2O re-equilibration of which, in turn, corresponds to a cooling time of 16 min based on the Eq. (12) of Qin et al. (1992). A cooling time of 16 min is significantly greater than the 10 min cooling time estimated for the 6 cm bomb as calculated by Lloyd et al. (2013). The thickness of the lava flow from which sample SCL14 was collected is ∼ 2 m, and, thus, the results could be consistent with the nature of the sample depending on the position of the olivine hosting the MI within the lava flow. The estimated cooling time represents the shortest possible amount of time because the diffusion coefficient is assumed constant at high T (1198 ∘C quenching T of SCL14-D49-5-3-M1), while it is known that the diffusion coefficient decreases as T decreases (Zhang and Cherniak, 2010). For the high-Fo MIs, MI SCL14-D92-3-1 is the only one hosted in olivine from lavas. This MI shows 3.35 wt % H2O after the heating experiment correction (Table 4). The largest difference in H2O contents between lava samples and pumice samples is ∼ 1.03 wt % and is observed between MI SCL14-D92-3-1 (from the lava flow) and MI P2-D53-4-1 hosted in an olivine crystal from pumice. This amount of H2O loss corresponds to 26 min of cooling time and 24 % re-equilibration based on Eq. (12) of Qin et al. (1992). For this MI (SCL14-D92-3-1), the calculated cooling time is consistent with cooling rates of lavas, which varies as a function of the distance of the olivine crystal from the surface of the flow.
Finally, the Fo-rich MIs were corrected to account for the H2O contents of the bubble. Adding the H2O contents of the bubble to the amount in the glass increases the concentration of H2O in the MI by 0.04 wt % to 0.007 wt %. The magnitude of the H2O correction is on the order of the error of SIMS analyses used to determine the H2O concentration in the glass (Table S3; see also Esposito et al., 2014). Corrections for CO2 in bubbles and from PEC range from 340 ± 214 to 1479 ± 896 ppm. In comparison, CO2 corrections predicted by the model proposed by Rasmussen et al. (2020) using Mimic software range from 1719 to 4720 ppm.
Results of corrected volatile contents of MIs show that all of the bubble-free MIs are volatile-poor relative to the bubble-bearing MIs. In turn, the bubble-bearing and volatile-rich MIs are contained in olivine showing Fo 85 mol %–90 mol %, while bubble-free, volatile-poor MIs are hosted in olivine showing Fo 69 mol %–76 mol % (Fig. 5). In particular, the corrected CO2 content of MIs hosted in high-Fo olivine (Fo = 85 mol %–90 mol %) ranges from 5884 ± 255 to 2263 ± 57 ppm, while the CO2 content of MIs hosted in low-Fo olivine (Fo = 69 mol %–76 mol %) ranges from 45 to 381 ppm (Fig. 5b, d, f). The same correlation can be found for H2O, F, S, and Cl (Fig. S7). For example, the corrected H2O content of the high-Fo MI group ranges from 2.91 wt % and 4.64 wt %, while that of MIs in the low-Fo group ranges from 0.21 wt % to 0.55 wt % (Fig. 5a, c, e). Also, the Cl contents of the MI hosted in Fo90 are from 2739 to 6220 ppm, which is anomalously high for primitive magmas (e.g., Ruscitto et al., 2012).

Figure 5Correlation between Fo content (mol %) of the host and corrected volatile contents of MIs hosted in olivine from this study. For H2O and CO2 (a and b respectively), MIs from this study are compared to MIs hosted in olivine reported by Marianelli et al. (1995, 1999, 2005) delimited by the colored fields as in Fig. 4. (a) Fo content versus H2O content discriminated by single eruptions. (b) Fo content versus CO2 content discriminated by single eruptions. (c, d) Fo content versus H2O content and Fo content versus CO2 content, respectively, discriminated by the age of eruptions. (e, f) Fo content versus H2O and Fo content versus CO2, respectively, discriminated by the style of eruptions. MIs that represent primitive or near-primitive melts below SV and hosted in olivine with Fo90 are highlighted. The error bars for CO2 contents are shown in panels (b), (d), and (f) representing the uncertainties based on the volume of the bubble of bubble-bearing MIs and the fraction of carbonates for the crystalline aggregates observed in bubbles of bubble-bearing MIs.
As can be observed in Fig. 5 the CO2 and H2O contents of MIs hosted in high-Fo olivine of the eruption studied here partially overlap with but extend to higher H2O and CO2 values than those of MIs hosted in high-Fo olivine from more recent eruptions (Marianelli et al., 2005, 1995, 1999). However, it should be emphasized that we are comparing compositions of MIs that were reheated (our study) with those that were not reheated (MIs from the literature). Also, Marianelli et al. (2005) reported that the MIs studied are glassy with only one bubble, but the volatile content of bubbles was not discussed, and any volatiles contained in the bubbles was not added to the total MI volatile budget. For these reasons, the CO2 contents of the unheated MI reported by Marianelli et al. (2005) likely underestimate the actual CO2 contents of the MI, in light of more recent findings relative to the importance of bubbles in MIs (e.g., Esposito et al., 2011; Wallace et al., 2015).
4.4 Estimates of pressure of trapping of MIs
The alkali and the SiO2 concentrations of MIs studied here show a wide range (Fig. 4a). Based on the major-element composition and the corrected H2O and CO2 contents of MIs studied, we have applied the solubility model MafiCH developed by Allison et al. (2022). Although other solubility models from the literature could be used for estimating pressures (e.g., Duan, 2014; Ghiorso and Gualda, 2015; Iacono-Marziano et al., 2012; Newman and Lowenstern, 2002; Papale et al., 2006; Shishkina et al., 2014), the MafiCH model is valid for silicate melts containing 44 wt % to 53 wt % SiO2 and from 2 wt % to 9 wt % Na2O+K2O, which is the most recent model fitting with the composition of the high-Fo MI of this study. For the low-Fo MI, compositions are at or above the upper limit of K2O + Na2O and SiO2 concentrations considered for the MafiCH model. However, the Fo-poor MIs show relatively low volatile contents, and the difference in the pressures calculated using different solubility models is less significant for silicate melts showing low volatile contents (Fig. 6 in Wieser et al., 2022). In the Supplement (Fig. S8), we included a comparison of the 400 MPa isobar calculated by MafiCH with that calculated by MagmaSat (Ghiorso and Gualda, 2015). The 400 MPa isobars were estimated based on the composition of MI LFL2-D44-1-1 from our study, as well as 1200 ∘C and NNO buffer for the oxidation state as input for the MagmaSat solubility model. The two models predict similar isobars especially within the range of compositions of the high-Fo MI studied. MIs hosted in high-Fo olivines show calculated pressures from 225 ± 6 and 456 ± 46 MPa if corrections of CO2 for vapor and carbonate are considered (Fig. 6a). On the other hand, all of the MIs hosted in low-Fo olivine show pressures ranging from 38 to 7 MPa (Fig. 6). Thus, there is an apparent gap of 187 MPa (∼ 7 km) for the trapping pressures of MIs between those hosted in high-Fo olivine versus those hosted in low-Fo olivine. MIs with more evolved compositions were trapped at much lower pressure compared to the more primitive MI, as expected in transcrustal magmatic systems (Cashman et al., 2017). The very low volatile contents of MIs hosted in olivine from lavas could represent crystallization during magma stalling in a conduit or an extremely shallow reservoir magma. A shallow magma reservoir (<1000 m) below SV has been proposed for recent volcanic activity by Santacroce et al. (1993). Also, the size of the low-Fo olivine is comparable to the size of the high-Fo olivine averaging around 2 mm. Growing large phenocrysts is difficult to reconcile with olivine crystallizing during magma stalling in a conduit, as in this case magma is expected to cool relatively rapidly.
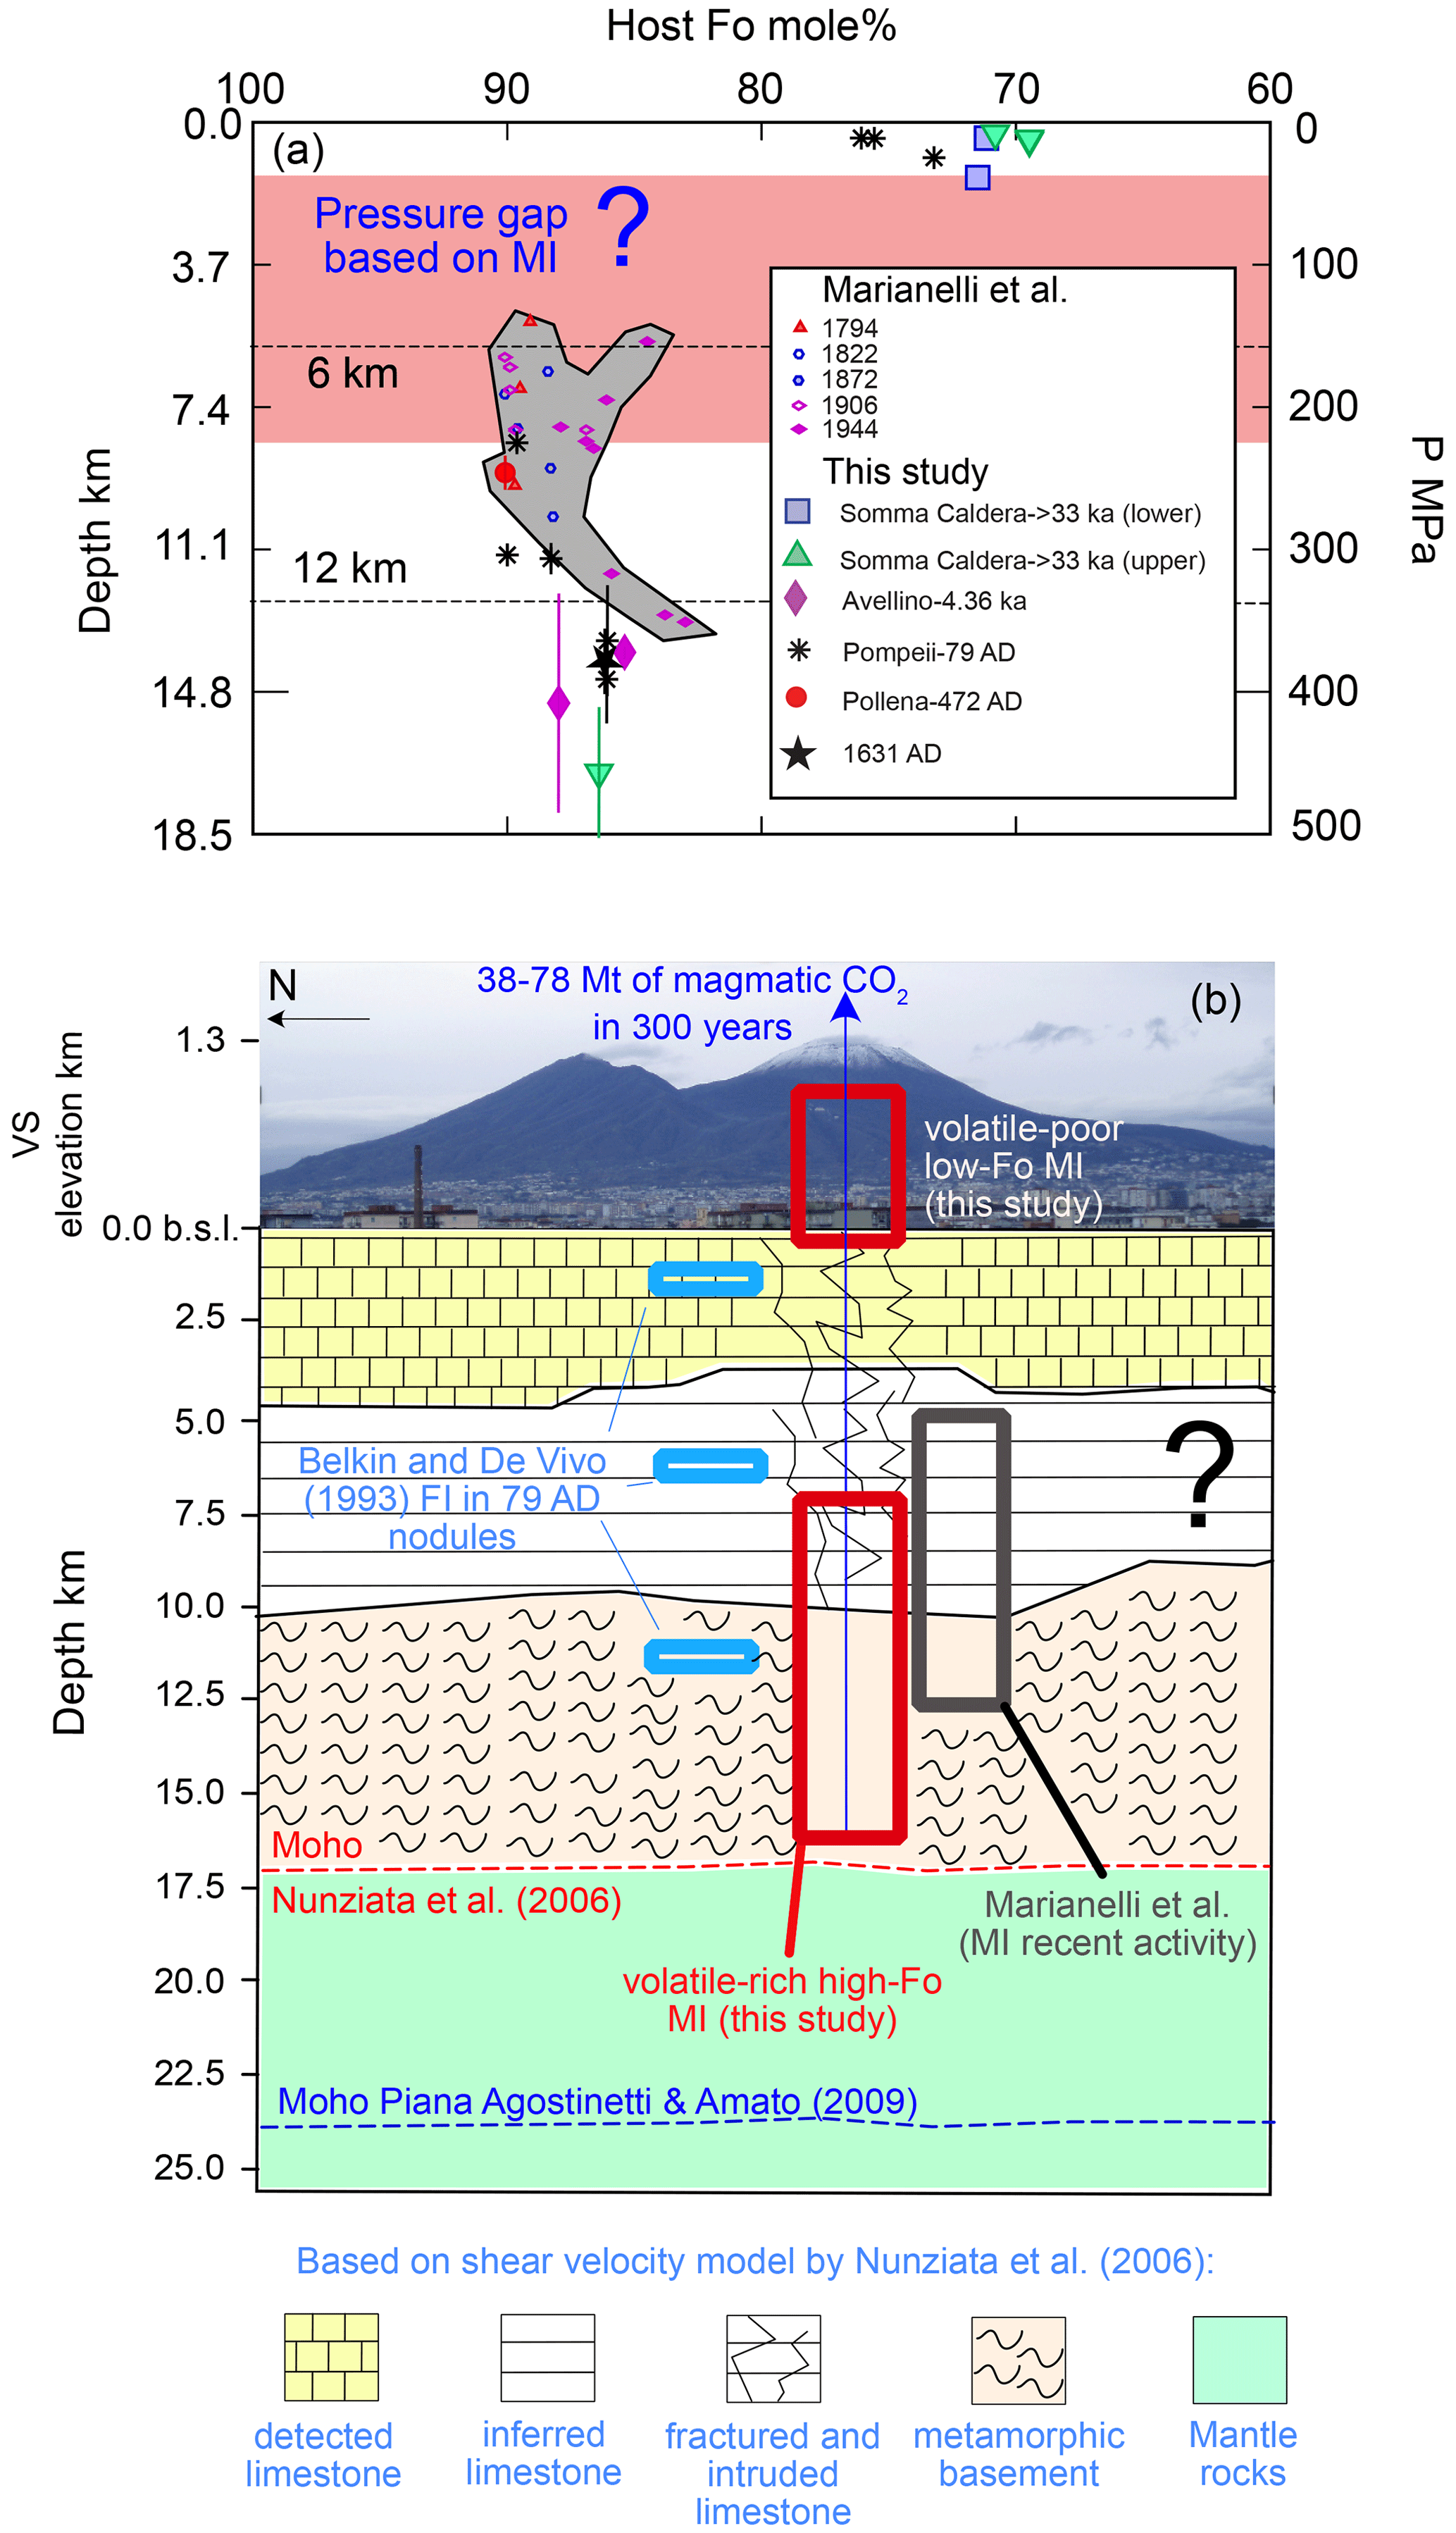
Figure 6Host Fo content (mol %) versus pressure P and implied depths of corrected MIs hosted in olivine from this study and from recent activity of SV (Marianelli et al., 1995, 1999, 2005) discriminated by individual eruptions studied. (a) Pressure estimates based on MIs corrected for CO2 and H2O (see text and Tables 3 and 4 for additional information). In panel (a) the dashed lines correspond to depths of 6 and 12 km, representing the possible bottom of the carbonate platform. The pink area represents the pressure gap based on the MI studied. (b) Geological schematic cross section of SV proposed by Nunziata et al. (2006) based on Rayleigh wave dispersion measurements. For this panel the upper part above sea level is a photo of SV taken from the west side (San Giovanni a Teduccio neighborhood in Naples). The upper part the section below sea level shows a different vertical scale. Two inferred depths for the Moho are shown, including that suggested by Nunziata et al. (2006) and that reported by Piana Agostinetti and Amato (2009). The question mark relates to the uncertainty associated with the depth of the base of the carbonate platform (estimates range from 6 to 12 km). Depths estimated for the corrected MIs of our study (red rectangles) and those estimated from MIs hosted in olivine of recent activity (gray rectangle; Marianelli et al., 1995, 1999, 2005) are shown. For comparison, we report the depths estimated based on fluid inclusions of nodules of the 79 CE (Belkin and De Vivo, 1993). The blue arrow represents the CO2 flux estimate based on the ascent of deep degassing magmas during the last 300 years of activity at SV.
To calculate depths we assumed a gradient of 27 MPa km−1 based on Fuis et al. (1991) and a crustal thickness of 25 km (Nunziata et al., 2020; Piana Agostinetti and Amato, 2009). The implied depths corresponding to the pressures estimated for MIs hosted in high-Fo olivine are 8.3 ± 0.2 to 16.9 ± 1.7 km, while those for the low-Fo MI range from 1.4 to 0.3 km.
In the following section, we first discuss the corrections applied to estimate the original volatile contents of the MI. Then, we consider the link between the volatile contents of the melt and the forsterite content of the host. Finally, we estimate the CO2 budget driven by degassing of relatively deep and primitive magmas based on CO2 concentrations recorded by MIs.
5.1 Corrections to estimate the H loss of MIs before eruption
To correct for H2O loss driven by H re-equilibration before the MI was ejected onto the Earth's surface, we employed the Petrolog3 crystallization model and used the composition of MI SCL14-D92-3-1 as the starting melt composition. The composition of this MI showed the best fit relating the host Fo mol % versus K2O concentration of MIs (Fig. 7a). The initial composition is in equilibrium with an olivine having a composition of Fo85 based on Petrolog3. After 40 % of fractional crystallization, the liquid is in equilibrium with an olivine of Fo69 (Table S6). In this calculation, we assumed a polybaric fractional crystallization path that is consistent with a gap in pressure determined in this study – crystallization is not permitted in this region. In particular, the first 20 % of crystallization (from olivine Fo85 to Fo77) occurs progressively as the pressure decreases from 100 to 30 MPa, followed by an additional 20 % of crystallization from 3 to 1 MPa. This fractional crystallization trend is consistent with the K2O concentration of the liquid when compositions of high-Fo MIs are compared to those of low-Fo MIs (Fig. 7a). If the predicted liquid compositions and MI data are plotted in a H2O versus K2O diagram, the restored H2O contents of MIs are consistent with the predicted trend for which crystallization of an H2O-saturated magma is occurring while magma is ascending through the crust (Fig. 7b). This suggests that the H2O content of the melt originally trapped in the low-Fo group of MIs was relatively low and that H loss after trapping and before eruption did not significantly affect the H2O concentration of the MI.
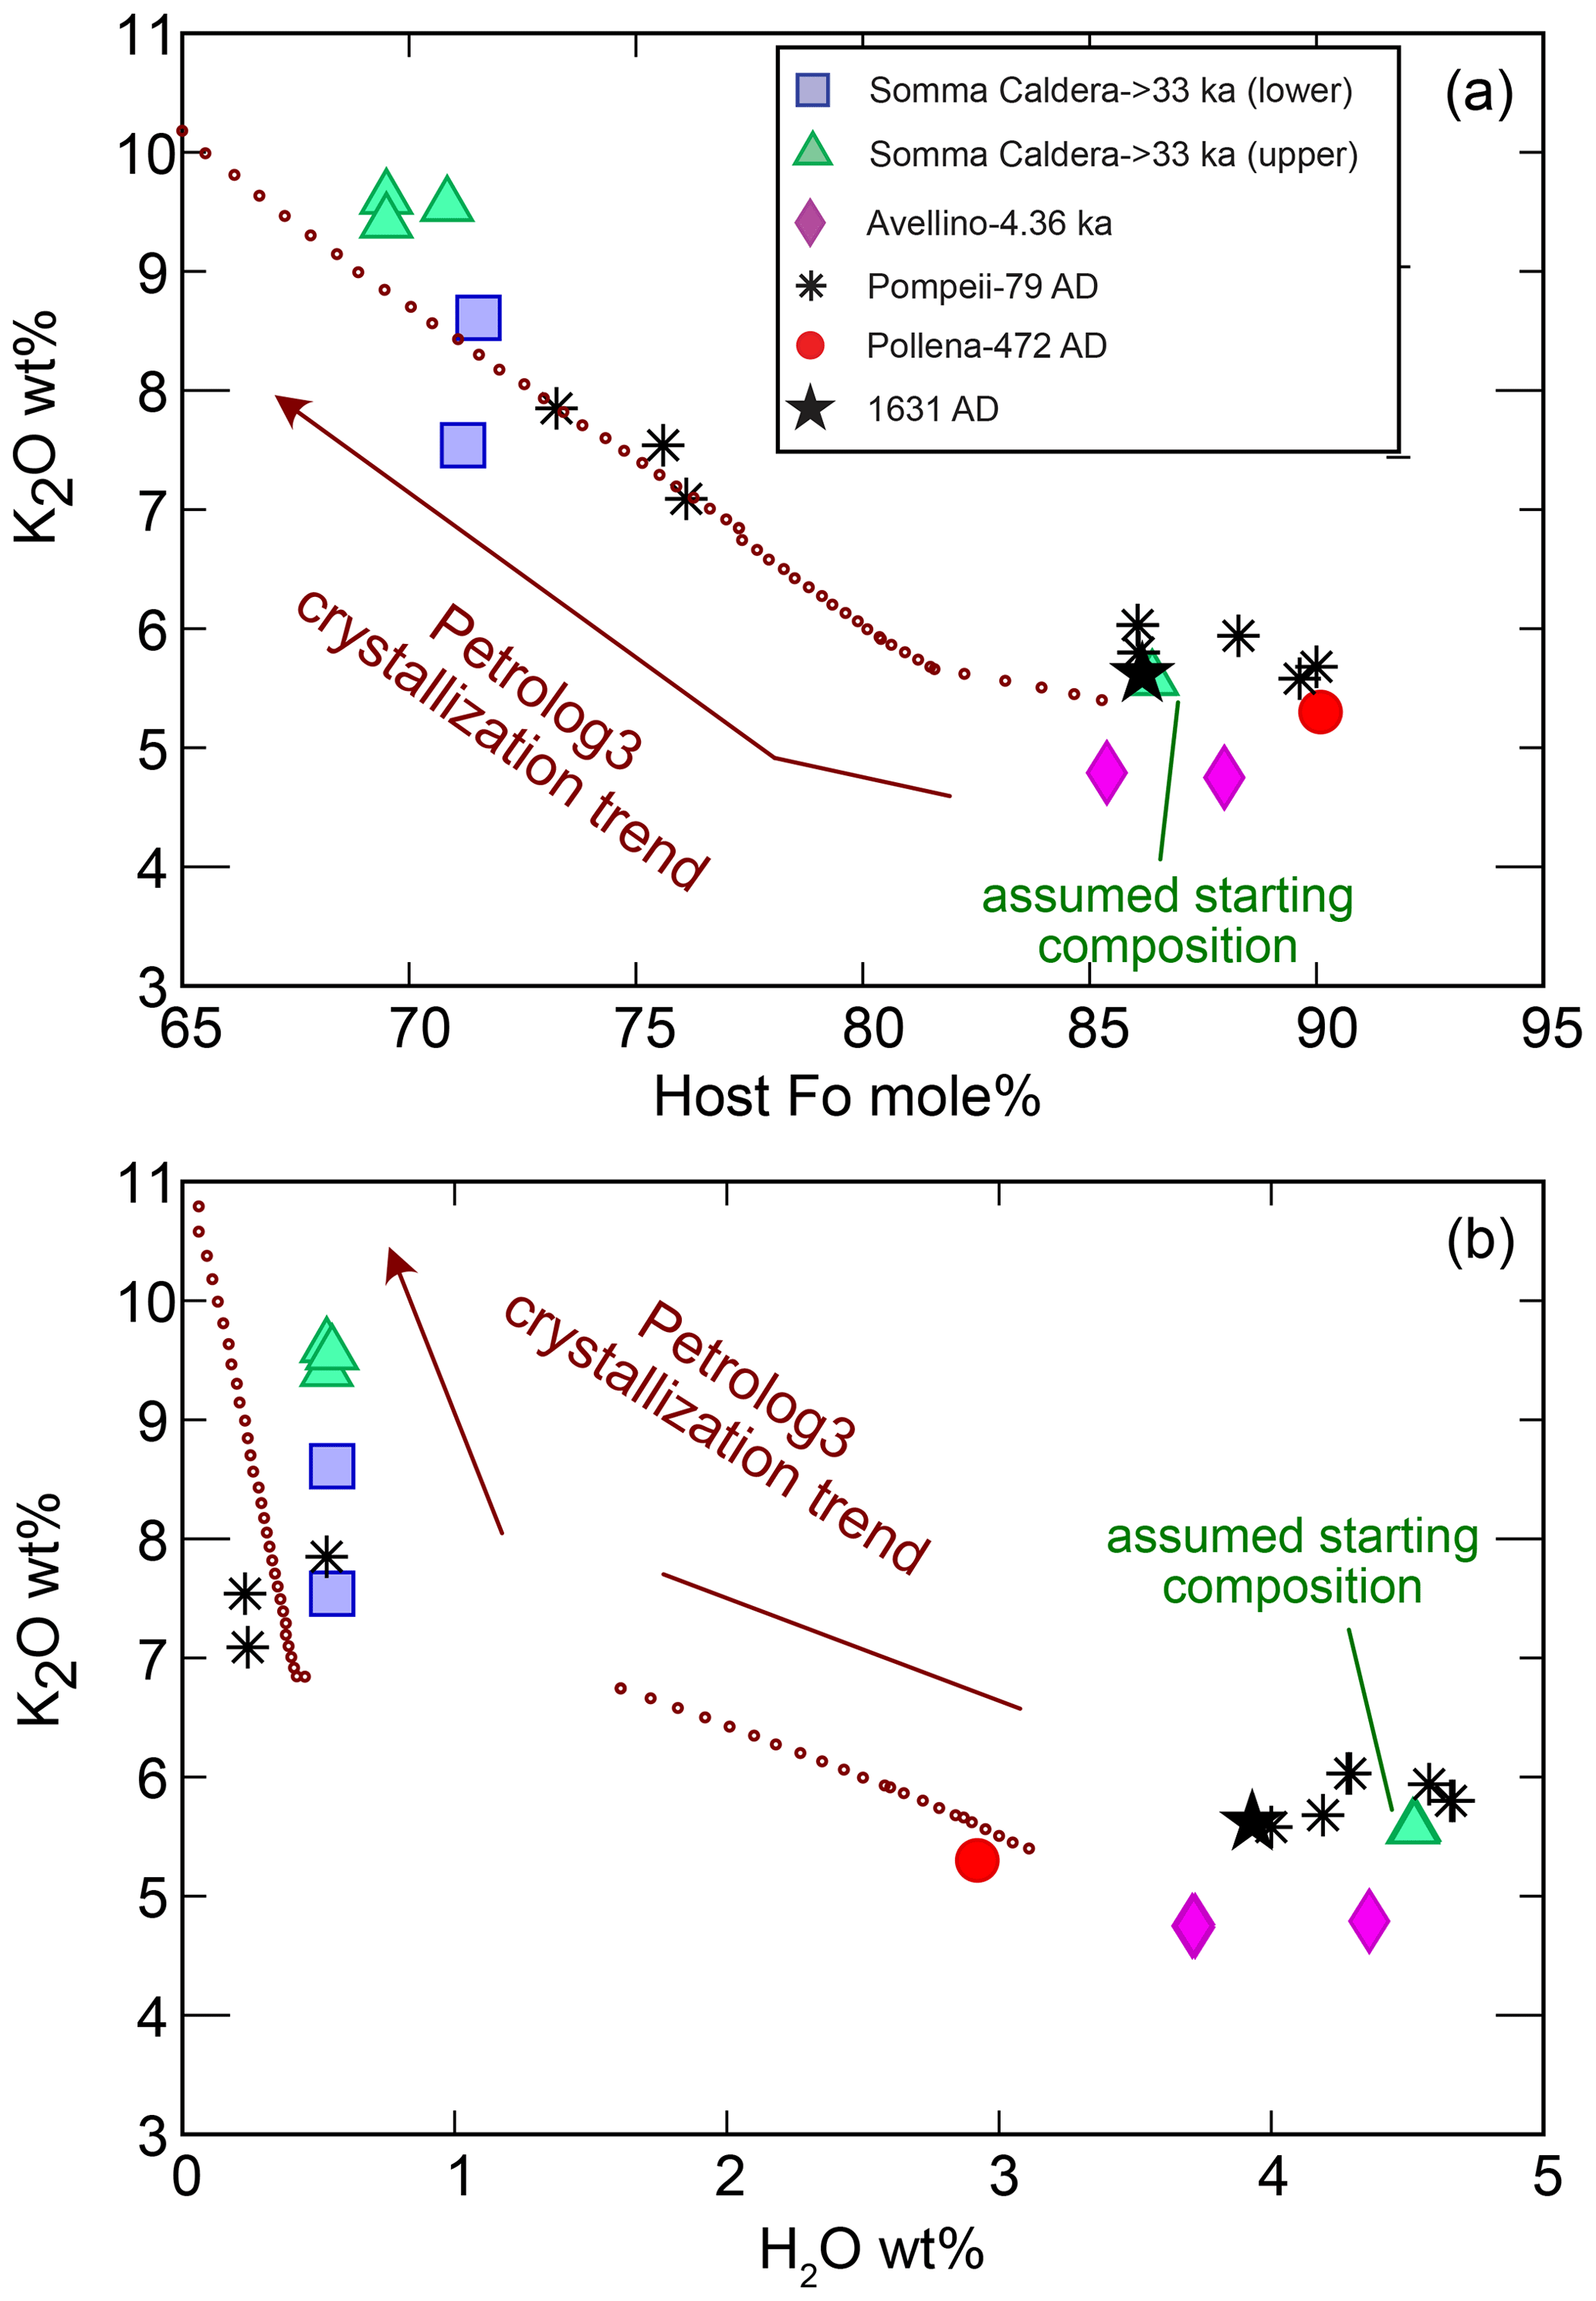
Figure 7Comparison of trends in the K2O vs. Fo content (a) and K2O vs. H2O content (b) predicted by Petrolog3 (small dark red circles) with corrected composition of MIs. The Petrolog3 calculation conditions are summarized in Table S6 and the main text.
To further support the interpretation that no significant H loss occurred while MIs resided in the plumbing system at high T, we tested the correlation between the H2O contents and the size of the MI, as proposed in other studies (e.g., Barth et al., 2019). We considered the two groups of MIs separately because of the difference in H2O and major-element compositions between the MI of these two groups. There is no correlation between the size of the MI and their respective H2O contents (Fig. S9). Other researchers have reported a correlation between H loss and SiO2 contents of MIs (Portnyagin et al., 2019). In fact, Portnyagin et al. (2019) reported a positive correlation between the H2O content and the SiO2 content of MIs hosted in olivine from the Klyuchevskoy volcano (Russia). For our MI data, the opposite correlation can be observed. The SiO2 content increases as the H2O concentration decreases (Fig. 8). Because of this, we did not correct the MI contents for H diffusive loss before the MI was ejected from the volcano.
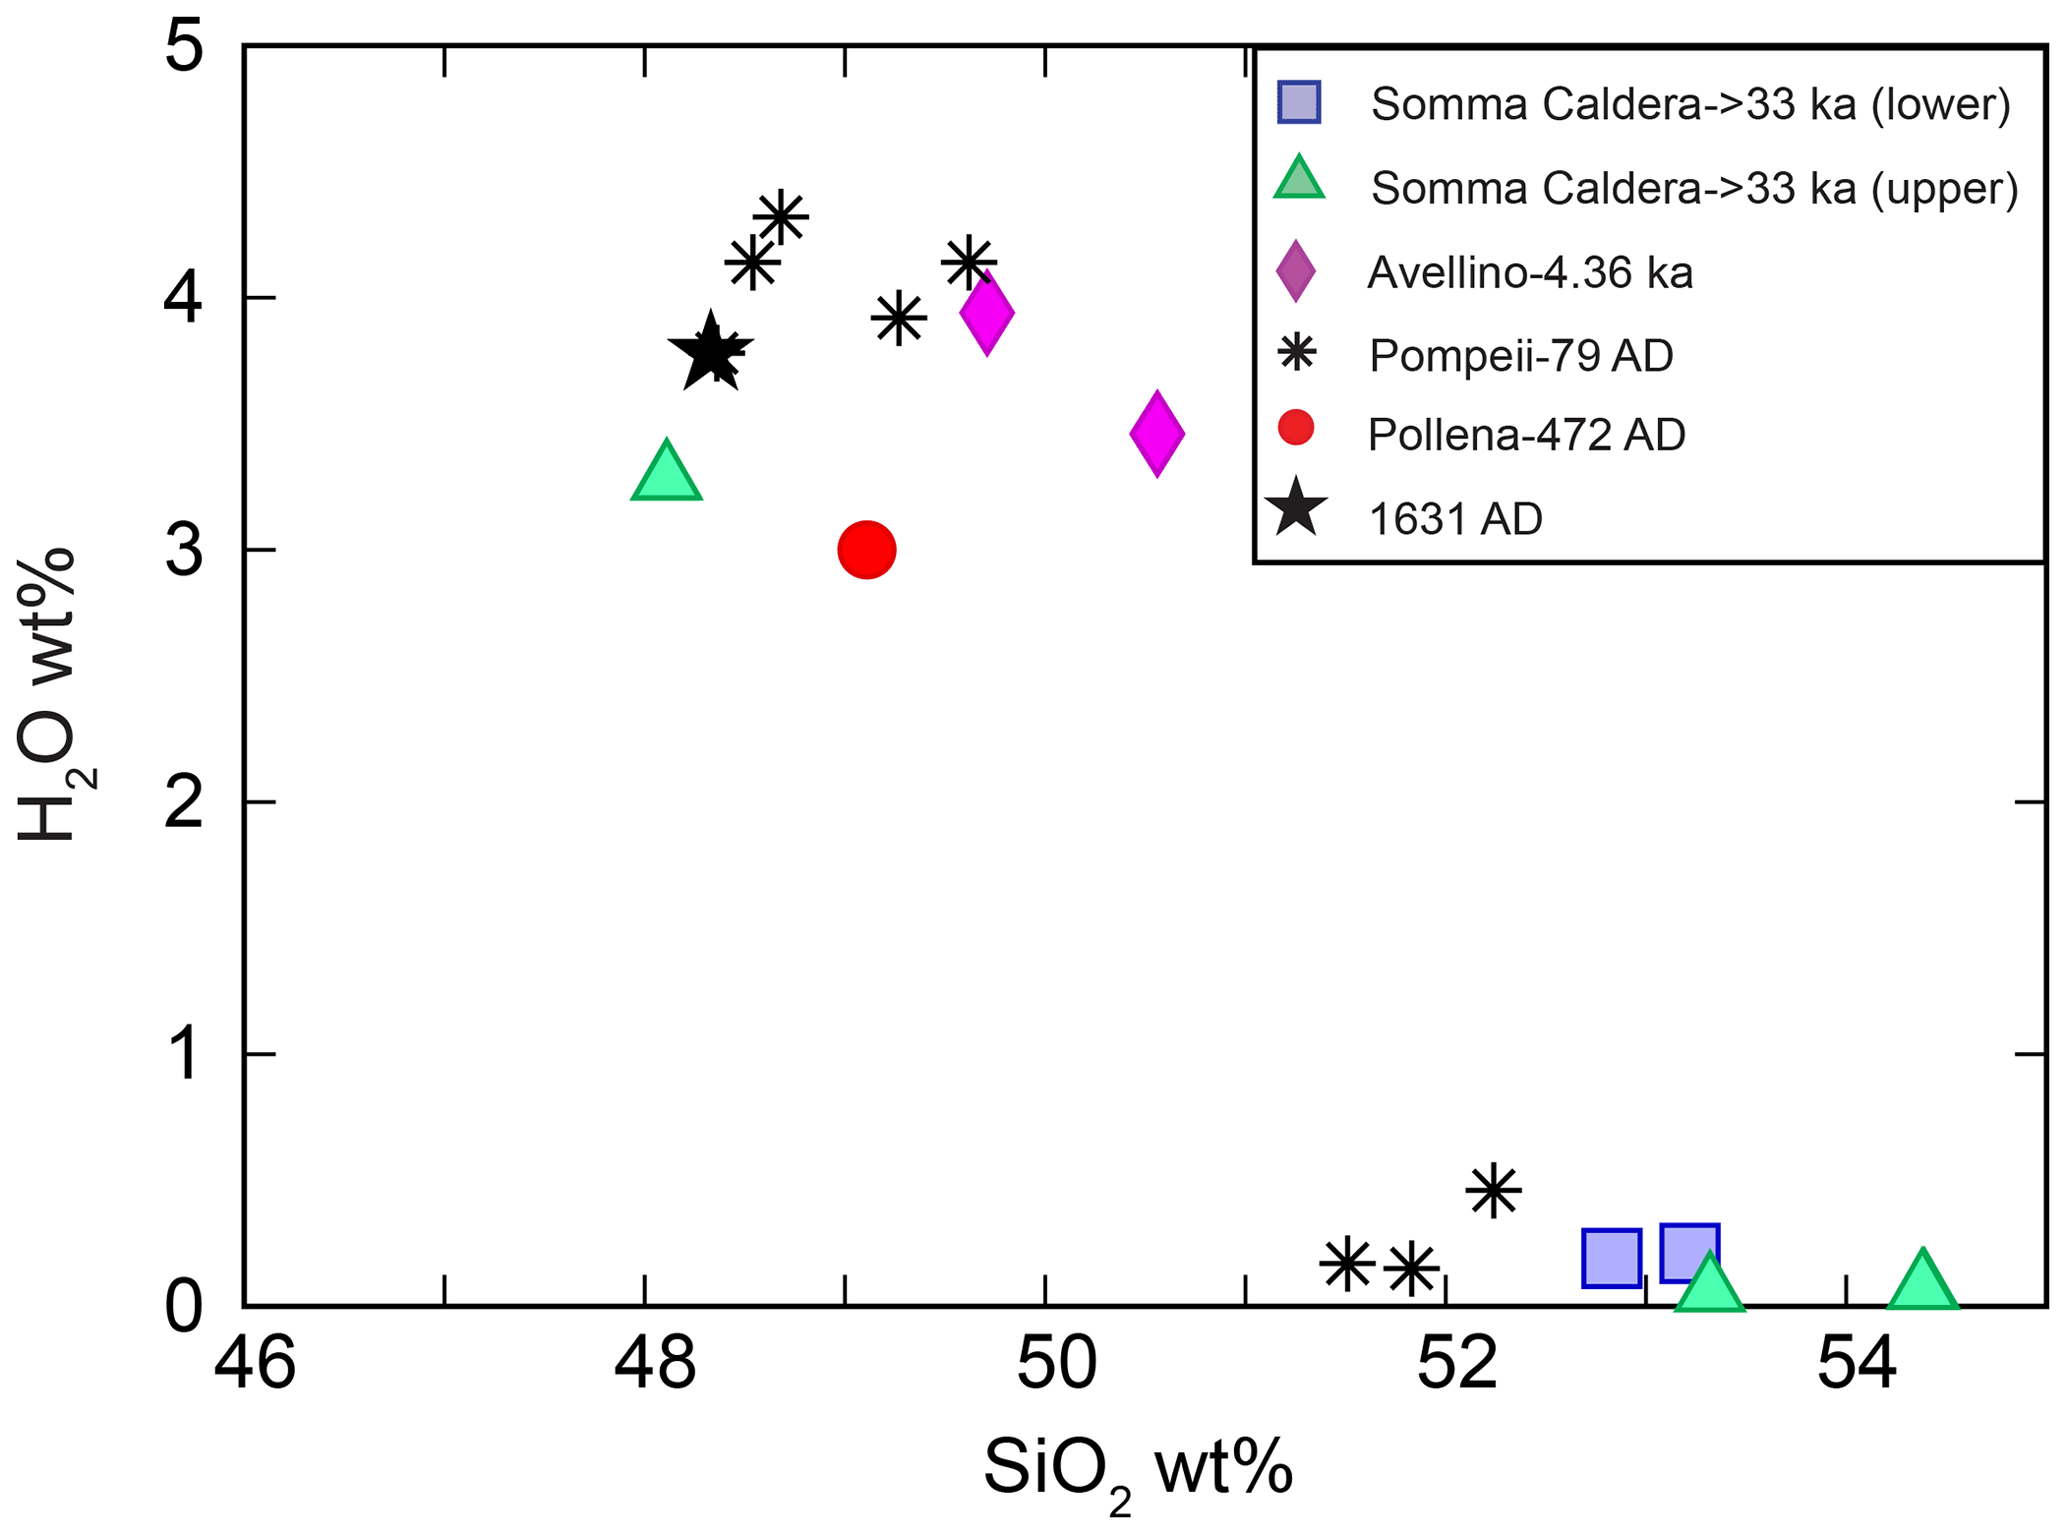
Figure 8SiO2 concentration of MIs versus H2O concentration for MIs of this study. The H2O content of MIs decreases as the SiO2 content increases, suggesting that H2O degasses from the melt during crystallization of magmas at SV.
5.2 Link between composition of olivine hosts and the volatile contents recorded by MIs
Many researchers have discussed the role that volatiles play in determining the style of volcanic eruptions (Edmonds and Wallace, 2017, and references therein). When volatile contents of undegassed melt (based on MI analysis) were compared to the style of the eruption at SV, a correlation between the explosivity or magnitude of eruptions is observed based on volatile contents of reheated MIs hosted in clinopyroxene from several eruptions (Webster et al., 2001). Plinian and sub-Plinian eruptions younger than 3.55 ka show higher H2O, S, and ratios relative to older relatively passive inter-Plinian eruptions. However, MIs in that study were reheated and held at high temperature for 2 h (Webster et al., 2001), also because at the time of their study the knowledge of H2O loss by diffusion through the host was not as well constrained as it is now based on recent studies. In fact, many researchers reported that when MIs are reheated and held at high T for longer periods of time, diffusive loss of H (H2O) can be significant after 2 h (e.g., Sobolev and Danyushevsky, 1994; Barth and Plank, 2021; Bucholz et al., 2013; Severs et al., 2007). Based on our estimated H loss, MIs studied here would have re-equilibrated from 40 % to 99 % if the heating experiments lasted for 2 h (7200 s). MIs with different sizes and/or different distances from the surface of the studied crystals should show different degrees of H loss, assuming that they all trapped a melt with the same H2O contents (Esposito, 2021, and references therein; Barth et al., 2019; Barth and Plank, 2021; Qin et al., 1992). In addition, Webster et al. (2001) also reported that reheated MIs in their study contained bubbles after quenching, and any volatiles that may have been contained in the bubbles were not included in estimating the volatile budgets of the quenched MI. In this case, knowledge of the importance and quantification of volatiles in bubbles of MIs was not as advanced as it has been in the last decade (e.g., Esposito, 2021, and references therein). More importantly, the compositions of the clinopyroxene hosts were not reported by Webster et al. (2001), and, thus, host phase compositions were not compared with the volatile contents. As shown here, the volatile contents correlate with the host composition (Fig. 5). Also, the average composition of the Plinian pyroxenes in the samples analyzed by Webster et al. (2001) had much higher Mg# compared to other inter-Plinian samples studied (Redi et al., 2017). Additionally, the original S and Cl contents of the melt trapped in MIs studied by Webster et al. (2001) could be underestimated. In fact, Esposito et al. (2016) reported that a significant amount of S could be stored in the bubble of olivine-hosted MIs in the form of S-bearing phases such as gypsum and native sulfur. Esposito et al. (2016) estimated that up to several hundreds of parts per million (ppm) of S could be stored in the bubble, and this would not be accounted for if only the volatiles in the glass are measured. Other studies have also reported S-bearing phases in bubbles of MIs (Schiavi et al., 2020, and references therein). It is also likely that a portion of Cl in the melt partitions into the bubble along with H2O (Esposito et al., 2016). Owing to the long duration of the heating experiments and the possible underestimation of S and Cl that results when amounts that may have been sequestered in the MI bubbles are not considered, the correlation between volatile concentrations and the eruptive style for SV found by Webster et al. (2001) may be questionable.
In contrast to Webster et al. (2001), Lima et al. (2003) showed that the H2O and S contents of MIs from nodules and from volcanic rocks negatively correlate with their host Mg#. Based on this correlation, Lima et al. (2003) proposed a model involving multiple magma chambers at various depths below SV, each of which differentiates magmas at different P–T conditions, as proposed for other volcanic systems (Cashman et al., 2017). In this model, the difference in eruption style simply reflects the pressure needed to open the conduit. Since the pressure needed after a long repose is much higher as the conduit is cold and fully sealed, a Plinian eruption will be triggered. When the conduit is open while magma supply continues, an inter-Plinian eruption is triggered instead. Such a model does not imply differences in the compositions of the parental melts.
One of the most important observations we can make regarding the volatile contents of MIs hosted in olivine from this study is that there is a correlation between volatile contents and the host crystal composition (Fig. 5e–f). While we can estimate the amounts of CO2 and H2O in the MI bubble, it is more difficult to correct for the for S and Cl contents of MI bubbles and quantify the original melt contents and correlations among volatiles. Regardless of these uncertainties and limitations, volatile contents of MIs define two groups when plotted versus host crystal composition (Fig. 3, Table 4, and Fig. S7). One group of MIs shows low volatile contents (from 45 to 381 ppm CO2; 127 ppm CO2 on average) and low host forsterite contents, while the other group shows high volatile contents (2263–5884 ppm CO2; 3437 ppm CO2 on average) and high host forsterite contents (Fig. 5).
5.3 CO2 budget of deep ascending melts and the CO2 flux during the last 300 years
Here, we consider the source of the CO2 budget recorded by the MI hosted in high-Fo olivine. One possibility is that the CO2 contained in these melts was generated by interaction between the SV magmas and the carbonate platform that underlies SV. On the other hand, the CO2 could have been sourced from the upper mantle where the magmas were generated (e.g., Kovács et al., 2021).
Currently, magmatic CO2 flux at the surface at SV is estimated to be 301 t d−1 (tonnes per day) based on CO2 gas diffusing through soil and CO2 gas present in groundwater (Caliro et al., 2005; Frondini et al., 2004). A possible contribution to the CO2 budget by decarbonation triggered by interaction of the silicate magma with the carbonate platform beneath the SV has been previously proposed and studied by many researchers. For instance, Chiodini et al. (2001) reported that most of the CO2 has a crustal origin based on isotopic analysis of C of fumarolic fluids (δ13C = 0.06 ‰–0.34 ‰ relative to Vienna Pee Dee Belemnite, VPDB). Dallai et al. (2011) presented δ18O values (relative to Standard Mean Ocean Water, SMOW) for mafic phenocrysts from four SV eruptions that vary from 5.5 ‰ to 7.1 ‰ for olivines and from 6.04 ‰ to 7.47 ‰ for clinopyroxene. They found that the origin of oxygen was consistent with near-primary melts experiencing a CO2 flux derived from decarbonation reactions via magma–carbonate interaction. Jolis et al. (2013) showed experimentally that the interaction between magma and carbonate at SV is a significant process operating on both long and short timescales. This conclusion was based on piston cylinder mixing experiments using an SV shoshonite composition and dolostone–limestone as starting materials at 0.5 GPa, 1200 ∘C, and a duration from 0 to 300 s. More recently, Knuever et al. (2023) suggested that the viscosity of magma is a fundamental factor controlling the short-term assimilation of carbonates by magmas. In addition, many studies have focused on skarn xenoliths found in many of the deposits from SV (e.g., Del Moro et al., 2001; Fulignati et al., 2004). For instance, Fulignati et al. (2004) studied fluid inclusions in skarn xenoliths from the 1944 deposits to estimate the pressure of formation of the newly formed skarn minerals. These pressures are consistent with the inferred depth of the carbonate platform (∼ 100 MPa or ∼ 3.7 km assuming 27 MPa km−1, Fig. 6b). Also, pressure estimates from CO2-rich fluid inclusions from cumulate nodules in SV deposits are consistent with the carbonate platform depths (∼ 4, ∼ 8, and ∼ 12 km; Belkin et al., 1998).
Table 5Magmatic CO2 flux mass balance calculations.
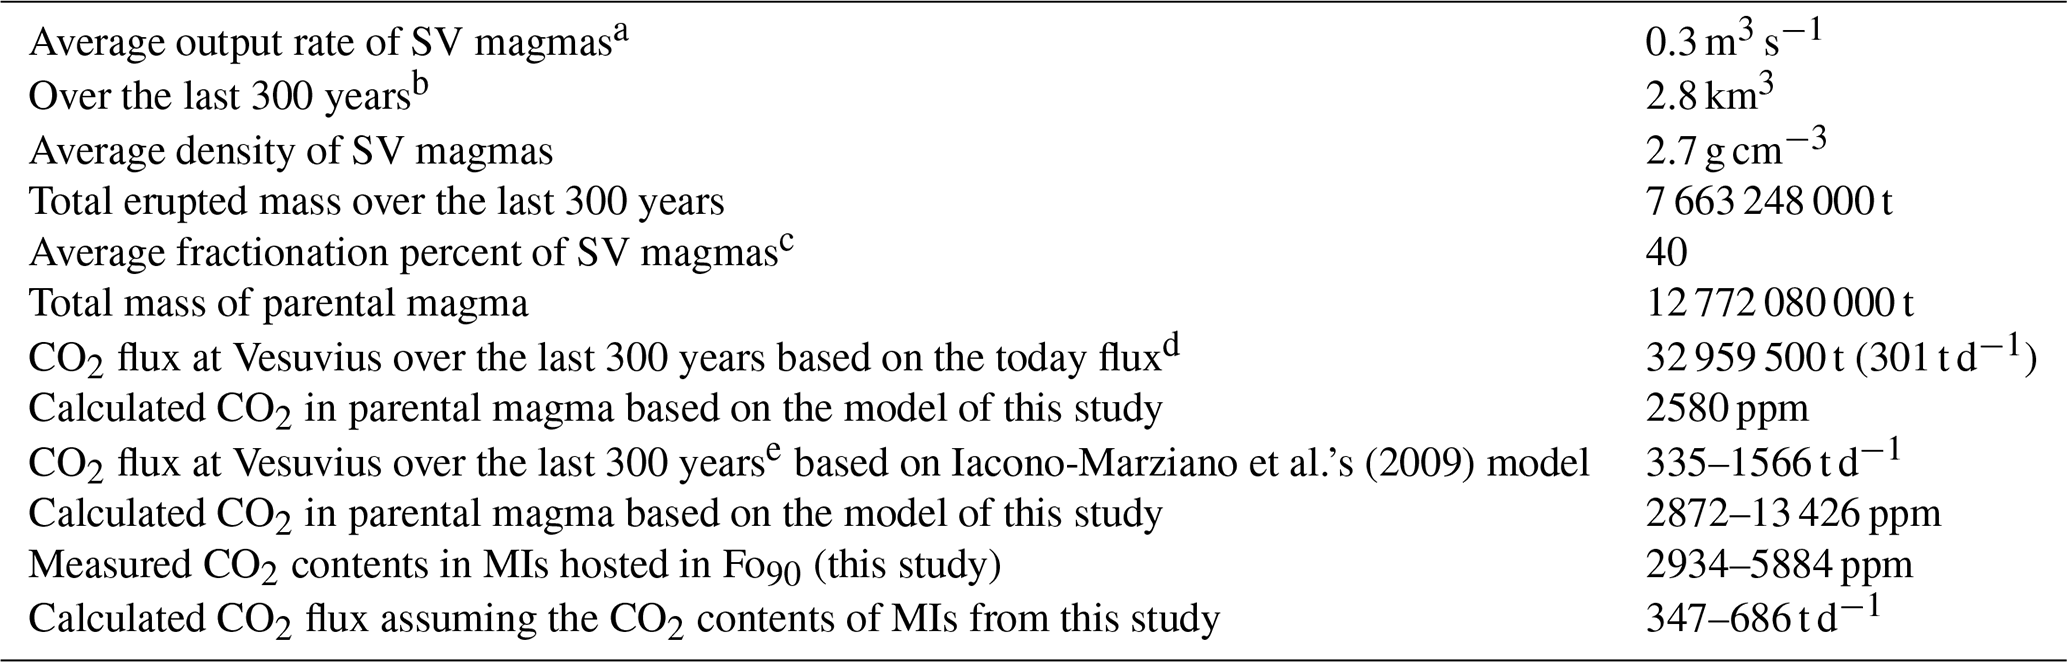
a Output magma rate based on Wadge (1980) and on Civetta and Santacroce (1992). b Volume of magma erupted after the 1631 CE Plinian eruption (see also Scandone et al., 1993). c Average fractionation based on the model using Petrolog3 (Danyushevsky and Plechov, 2011) to predict a silicate liquid in equilibrium with an olivine Fo69 starting from a silicate liquid (MI SCL14-D92-3-1) in equilibrium with a Fo85. d The CO2 today flux is based on Frondini et al. (2004) and Caliro et al. (2005). e This flux is based on the carbonate assimilation model by Iacono-Marziano et al. (2009).
Conversely, Fulignati et al. (2004) examined a combination of mineral chemistry, melt and fluid inclusions, and stable and radiogenic isotope data reported by previous studies from SV (Del Moro et al., 2001; Marianelli et al., 1999; Fulignati et al., 2000a, b, c) and proposed a model for the reconstruction of the magmatic feeder system associated with the 1944 eruption in which SV magmas did not experience significant exchange with the carbonate wall rock. Also, models based on the geodynamics of Plio-Quaternary Tyrrhenian magmatism and CO2 surface flux along the Italian Peninsula suggest that the amount of deep mantle CO2 fluxing produced by the interaction between subduction-related fluids and mantle melting is sufficient to explain the surface fluxes (Frezzotti et al., 2009). The mantle-derived CO2 flux has been quantified as 70 Mt yr−1 on average for all of the Tyrrhenian coast (Frezzotti et al., 2009). More locally at SV, Avanzinelli et al. (2018) modeled the mantle CO2 flux based on U isotopic compositions of recent lavas and estimated an average CO2 fluxing during the last ∼ 300 years of 0.15 to 0.8 Mt yr−1. In this study, we used the MafiCH solubility model (Allison et al., 2022) based on melt compositions consistent with the compositions of the MI studied to estimate CO2 flux. The pressures estimated from the volatile-rich MIs correspond to depths of 8.3 ± 0.2 to 16.9 ± 1.7 km (Fig. 6b). Depths >12 km are inconsistent with maximum depths of the carbonate platform beneath Vesuvius (Berrino et al., 1998; Patacca and Scandone, 2007). The depths estimated using MI compositions in this study would be slightly greater (8.6 ± 0.2 to 17.6 ± 1.8 km) if the pressure gradient is assumed to be 26 MPa km−1 (e.g., Marianelli et al., 2005). In addition, some MIs from Fo-rich olivine were reheated in the lab and could not be quenched to a glass (Table S1 in the Supplement). This thermometric behavior may signify that these unquenchable MIs could be much richer in H2O and CO2 than those we were able to quench in the lab (Esposito, 2021; Gavrilenko et al., 2019; Steele-Macinnis, 2019; Student and Bodnar, 1999). For instance, mafic-hydrous melts were fully quenched from high T if the H2O content was up to 6 wt % (Gavrilenko et al., 2019). If the H2O content of these melts were from 6 wt % to 9 wt % the melt could not be fully quenched, based on results from previous studies. Thus, the high volatile abundances, Fo-rich host, and deep nature of these MIs (>8 km) indicate that it is unlikely that the CO2 contained in melts from which the MIs were trapped originated from interaction with the carbonate platform, especially if the bottom of the carbonate platform is assumed to be at 6 km below the Earth's surface. If the bottom of the carbonate platform is assumed to be at 12 km, 6 out of 10 MIs show depth (pressure) of formation greater than 12 km (from 13.5 ± 1.4 to 16.9 ± 1.7 km, Table S5). If the depths are calculated assuming 26 MPa km−1, the calculated depths of 6 out of 10 MIs are still greater than 14 ± 1.4 km. Also, the high-Fo MIs studied here show higher volatile contents relative to MIs hosted in Fo-rich olivine from recent eruptions which were not reheated in the lab (Marianelli et al., 2005). In agreement with this observation, a similar systematic relationship has been found in reheated versus natural MIs hosted in olivine from Mauna Loa (Hawaii) reported by Wallace et al. (2015). This highlights the importance of reheating the MI and correcting the MI volatile concentrations to account for the volatiles contained in the bubbles. Differences between MIs reported from volatile content in our study and those reported from recent eruptions (Marianelli et al., 2005) cannot be assessed because the contribution of volatiles in the bubbles of MIs from recent eruptions were not determined. Further studies of the most recent MIs at SV are needed to determine whether or not the bubbles in these MIs contain significant amounts of volatiles.
Based on evidence that at least half of the MIs studied here were trapped at significant depth (>12 km; Fig. 4), we estimate the amount of CO2 exsolved from primitive melts during volcanic activity during the last 300 years (Table 5). After the last Plinian eruption occurred in 1631 CE, the average magma output rate at SV was 0.3 m3 s−1 (Civetta and Santacroce, 1992; Wadge, 1980, and references therein). Thus, the total output in the last ∼ 300 years was 2.8 km3 (see also Appendix Table by Scandone et al., 1993). Assuming an average density of 2.7 g cm−3, 7.66×10⁹ t of magma was deposited on the Earth's surface around the SV vent. In our calculation, we assumed that the magma that was erupted had undergone 40 % crystallization of the original melt. As mentioned above, the algorithm predicts the formation of a Fo69 olivine after 40 % crystallization has occurred (see Petrolog3 prediction in Table S6). Thus, the total mass of parental melt was 12.77×10⁹ t. Also, here we assume that this mass of melt ascended to shallow crustal depths exsolving most of its CO2 into a magmatic vapor phase. CO2 flux at the SV volcanic area is 301 t d−1 based on Frondini et al. (2004) and Caliro et al. (2005). Thus, over the last 300 years, 32.96×10⁶ t of CO2 has been produced at SV (Table 5), assuming a constant output rate. The calculated CO2 content of the magma required to produce 301 t d−1 flux is ∼ 2580 ppm (32.96×10⁶ t of CO2 per 12.77×10⁹ t of parental melt). Based on the assimilation model by Iacono-Marziano et al. (2009), the outflux of CO2 during the last 300 years of activity is 335–1566 t d−1, still assuming a constant output rate (Fig. 6b). This amount of CO2 is consistent with the CO2 contents recorded by MIs hosted in Fo90 olivine (most primitive melts) which range from 347–686 t d−1 (from 2934 to 5884 ppm CO2). The upper bound of our calculated fluxes is yet a lower boundary if we assume that CO2-saturated magma could be stored at greater depths relative to that estimated by the composition of MIs of this study. The assumption that the primitive deep melts remain volatile saturated after they form has been suggested for magmas in subduction zones around the globe (Wallace, 2005). If we assume a Moho depth of ∼ 25 km (∼ 700 MPa) below SV (Piana Agostinetti and Amato, 2009), the solubility of CO2 in high-alkali melts is relatively high although difficult to quantify because the upper pressure limit of the MafiCH solubility model employed does not extend higher than 600 MPa (Allison et al., 2022). In addition, the amount of CO2 in the gas phase that could have been present in the mantle should be taken into account when estimating the total CO2 budget outfluxed at the surface (as also reported by Iacono-Marziano et al., 2009).
Somma–Vesuvius (SV) is an active volcanic system located in a heavily populated area of southern Italy. In order to better understand the nature of future volcanic events at SV, a fundamental understanding of its past activity is required. An important observation is that past eruptions at SV have ranged from those that were very large and explosive to others which were smaller and more passive in nature.
Our results confirm that the volatile contents of the melts recorded as MIs correlate with their olivine host compositions (Fig. 5). In particular, high volatile contents are associated with high-Fo olivines and vice versa. This systematic correlation suggests that deep and quasi-primitive melts differentiate and outgas during ascent to shallower depths below SV. Secondly, we quantified the amount of CO2 fluxing from deep quasi-primitive melts to the surface and compared the flux from our study (347–686 t d−1; Fig. 6b) with the CO2 flux modeled for carbonate–magma interaction below SV by Iacono-Marziano et al. (2009; 335–1566 t d−1). The two calculated ranges of fluxes partially overlap, suggesting that CO2 degassing driven by carbonate–magma interaction produce a similar CO2 flux to that produced by the ascent of deep volatile-saturated magma. The two types of CO2 degassing could both occur at SV. On one hand, the presence of skarn in SV deposits and the oxygen isotopic composition of mafic phenocrysts (Dallai et al., 2011) suggest that magma has interacted with carbonates. On the other hand, the findings of this work suggest that deep and primitive melt trapped as MIs in olivine can degas CO2 that originated from a mantle source or from the lower crust. We also suggest further MI studies applying our method to correct for the volatile contents of bubbles and H diffusive loss, targeting MIs hosted in olivine with compositions (Fo84–77) intermediate to those reported here (Fo90–86 and Fo76–69). Results from MIs hosted in intermediate-composition olivines could corroborate or contradict the apparent gap in pressure (187 MPa, ∼ 7 km) observed between the two groups of MIs studied here. Further, analysis of a larger number of MIs from the various eruptions considered here could help to confirm or refute the apparent lack of correlations between pre-eruptive volatile contents and the style and age of eruptions.
The code for this study (Visual Basic file) is available upon request.
Data from this work can be found in the Supplement; data from the other works are cited in the text.
The supplement related to this article is available online at: https://doi.org/10.5194/ejm-35-921-2023-supplement.
All authors were actively involved in the interpretations and discussion of data and significantly contributed to the present state of the paper. RE and LVD conceived the study. RE prepared samples, performed heating experiments, and conducted the electron probe analysis. DR collected samples, selected olivine crystals for petrographic study, and helped with the editing. AG performed the SIMS analysis and participated in the editing of the paper. RJB was actively involved in developing the study and methods used, interpreting the results, and writing and editing the text. MLF helped with CO2 fluxing and carbonate assimilation models. MSM developed the VBA code to calculate H diffusive loss of MIs. MSM, BDV, MLF, and CEM helped in developing the study, interpreting results, and editing the final version of the paper.
Author Daniele Redi is employed by Mazzeschi s.r.l., Colle Val d'Elsa (Italy). The remaining authors declare that the research was conducted in the absence of any commercial or financial relationships that could be construed as a potential conflict of interest.
Publisher’s note: Copernicus Publications remains neutral with regard to jurisdictional claims made in the text, published maps, institutional affiliations, or any other geographical representation in this paper. While Copernicus Publications makes every effort to include appropriate place names, the final responsibility lies with the authors.
This article is part of the special issue “Probing the Earth: Melt and solid inclusions as probes to understand nature”. It is not associated with a conference.
This study was highly improved based on suggestions of anonymous reviewers on an earlier version of this paper. In addition, reviews of the current paper by anonymous reviewers and by Francesca Forni further improved the work presented here. We thank James Webster for the inspiration he provided from the scientific to the human values.
This research has been partially supported by an NSF grant (EAR 0911093) to Andrey Gurenko and work and research funds for Rosario Esposito and Maria-Luce Frezzotti provided by PRIN2017 (project no. 2017LMNLAW).
This paper was edited by Silvio Ferrero and reviewed by two anonymous referees.
Allison, C. M., Roggensack, K., and Clarke, A. B.: MafiCH: a general model for H2O–CO2 solubility in mafic magmas, Contrib. Mineral. Petr., 177, 1–22, 2022.
Avanzinelli, R., Casalini, M., Elliott, T., and Conticelli, S.: Carbon fluxes from subducted carbonates revealed by uranium excess at Mount Vesuvius, Italy, Geology, 46, 259–262, 2018.
Ayuso, R. A., De Vivo, B., Rolandi, G., Seal II, R. R., and Paone, A.: Geochemical and isotopic (Nd–Pb–Sr–O) variations bearing on the genesis of volcanic rocks from Vesuvius, Italy, J. Volcanol. Geoth. Res., 82, 53–78, https://doi.org/10.1016/S0377-0273(97)00057-7, 1998.
Balcone-Boissard, H., Villemant, B., Boudon, G., and Michel, A.: Non-volatile vs volatile behaviours of halogens during the AD 79 plinian eruption of Mt. Vesuvius, Italy, Earth Planet. Sc. Lett., 269, 66–79, 2008.
Balcone-Boissard, H., Boudon, G., Ucciani, G., Villemant, B., Cioni, R., Civetta, L., and Orsi, G.: Magma degassing and eruption dynamics of the Avellino pumice Plinian eruption of Somma–Vesuvius (Italy). Comparison with the Pompeii eruption, Earth Planet. Sc. Lett., 331, 257–268, 2012.
Barth, A. and Plank, T.: The ins and outs of water in olivine-hosted melt inclusions: hygrometer vs. speedometer, Frontiers Earth Sci., 9, 614004, https://doi.org/10.3389/feart.2021.614004, 2021.
Barth, A., Newcombe, M., Plank, T., Gonnermann, H., Hajimirza, S., Soto, G. J., Saballos, A., and Hauri, E.: Magma decompression rate correlates with explosivity at basaltic volcanoes – Constraints from water diffusion in olivine, J. Volcanol. Geoth. Res., 387, 106664, https://doi.org/10.1016/j.jvolgeores.2019.106664, 2019.
Bartoli, O., Cesare, B., Poli, S., Bodnar, R. J., Acosta-Vigil, A., Frezzotti, M. L., and Meli, S.: Recovering the composition of melt and the fluid regime at the onset of crustal anatexis and S-type granite formation, Geology, 41, 115–118, 2013.
Belkin, H. E. and De Vivo, B.: Fluid inclusion studies of ejected nodules from plinian eruptions of Mt. Somma-Vesuvius, J. Volcanol. Geoth. Res., 58, 89–100, 1993.
Belkin, H. E., De Vivo, B., Török, K., and Webster, J. D.: Pre-eruptive volatile content, melt-inclusion chemistry, and microthermometry of interplinian Vesuvius lavas (pre-A.D. 1631), J. Volcanol. Geoth. Res., 82, 79–95, https://doi.org/10.1016/S0377-0273(97)00058-9, 1998.
Berrino, G., Corrado, G., and Riccardi, U.: Sea gravity data in the Gulf of Naples: a contribution to delineating the structural pattern of the Vesuvian area, J. Volcanol. Geoth. Res., 82, 139–150, 1998.
Borghini, A., Nicoli, G., Ferrero, S., O'brien, P. J., Laurent, O., Remusat, L., Borghini, G., and Milani, S.: The role of continental subduction in mantle metasomatism and carbon recycling revealed by melt inclusions in UHP eclogites, Sci. Adv., 9, eabp9482, https://doi.org/10.1126/sciadv.abp9482, 2023.
Borisov, A. and Shapkin, A.: A new empirical equation rating in magmas to their composition, oxygen fugacity, and temperature, Geochem. Int., 27, 111–116, 1990.
Brocchini, D., Principe, C., Castradori, D., Laurenzi, M., and Gorla, L.: Quaternary evolution of the southern sector of the Campanian Plain and early Somma-Vesuvius activity: insights from the Trecase 1 well, Miner. Petrol., 73, 67–91, 2001.
Bucholz, C. E., Gaetani, G. A., Behn, M. D., and Shimizu, N.: Post-entrapment modification of volatiles and oxygen fugacity in olivine-hosted melt inclusions, Earth Planet. Sc. Lett., 374, 145–155, https://doi.org/10.1016/j.epsl.2013.05.033, 2013.
Burke, E. A.: Raman microspectrometry of fluid inclusions, Lithos, 55, 139–158, 2001.
Caliro, S., Chiodini, G., Avino, R., Cardellini, C., and Frondini, F.: Volcanic degassing at Somma–Vesuvio (Italy) inferred by chemical and isotopic signatures of groundwater, Appl. Geochem., 20, 1060–1076, 2005.
Cannatelli, C.: Tracing magma evolution at Vesuvius volcano using melt inclusions: a review, Vesuvius, Campi Flegrei, and Campanian Volcanism, edited by: De Vivo, B., Belkin, H. E., and Rolandi, G., Elsevier, 121–139, https://doi.org/10.1016/B978-0-12-816454-9.00006-7, 2020.
Cashman, K. V., Sparks, R. S. J., and Blundy, J. D.: Vertically extensive and unstable magmatic systems: a unified view of igneous processes, Science, 355, eaag3055, https://doi.org/10.1126/science.aag3055, 2017.
Chiodini, G., Marini, L., and Russo, M.: Geochemical evidence for the existence of high-temperature hydrothermal brines at Vesuvio volcano, Italy, Geochim. Cosmochim. Ac., 65, 2129–2147, 2001.
Cioni, R., Civetta, L., Marianelli, P., Metrich, N., Santacroce, R., and Sbrana, A.: Compositional layering and syn-eruptive mixing of a periodically refilled shallow magma chamber: the AD 79 Plinian eruption of Vesuvius, J. Petrol., 36, 739–776, 1995.
Cioni, R., Marianelli, P., and Santacroce, R.: Thermal and compositional evolution of the shallow magma chambers of Vesuvius: evidence from pyroxene phenocrysts and melt inclusions, J. Geophys. Res.-Sol. Ea., 103, 18277–18294, 1998.
Civetta, L. and Santacroce, R.: Steady state magma supply in the last 3400 years of Vesuvius activity, Acta Vulcanologica, 2, 147–159, 1992.
Civetta, L., Galati, R., and Santacroce, R.: Magma mixing and convective compositional layering within the Vesuvius magma chamber, B. Volcanol., 53, 287–300, 1991.
Dallai, L., Cioni, R., Boschi, C., and D'Oriano, C.: Carbonate-derived CO2 purging magma at depth: influence on the eruptive activity of Somma-Vesuvius, Italy, Earth Planet. Sc. Lett., 310, 84–95, 2011.
Danyushevsky, L. and Lima, A.: Relationships between Campi Flegrei and Mt. Somma volcanism: evidence from melt inclusions in clinopyroxene phenocrysts from volcanic breccia xenoliths, Miner. Petrol., 73, 107–119, 2001.
Danyushevsky, L. V. and Plechov, P.: Petrolog3: Integrated software for modeling crystallization processes, Geochem. Geophy., 12, 7, https://doi.org/10.1029/2011GC003516, 2011.
Danyushevsky, L. V., McNeill, A. W., and Sobolev, A. V.: Experimental and petrological studies of melt inclusions in phenocrysts from mantle-derived magmas: an overview of techniques, advantages and complications, Chem. Geol., 183, 5–24, https://doi.org/10.1016/S0009-2541(01)00369-2, 2002.
Del Moro, A., Fulignati, P., Marianelli, P., and Sbrana, A.: Magma contamination by direct wall rock interaction: constraints from xenoliths from the walls of a carbonate-hosted magma chamber (Vesuvius 1944 eruption), J. Volcanol. Geoth. Res., 112, 15–24, 2001.
De Vivo, B., Petrosino, P., Lima, A., Rolandi, G., and Belkin, H.: Research progress in volcanology in the Neapolitan area, southern Italy: a review and some alternative views, Miner. Petrol., 99, 1–28, 2010.
Doronzo, D. M., Di Vito, M. A., Arienzo, I., Bini, M., Calusi, B., Cerminara, M., Corradini, S., De Vita, S., Giaccio, B., and Gurioli, L.: The 79 CE eruption of Vesuvius: A lesson from the past and the need of a multidisciplinary approach for developments in volcanology, Earth-Sci. Rev., 231, 104072, https://doi.org/10.1016/j.earscirev.2022.104072, 2022.
Duan, X.: A general model for predicting the solubility behavior of H2O–CO2 fluids in silicate melts over a wide range of pressure, temperature and compositions, Geochim. Cosmochim. Ac., 125, 582–609, 2014.
Edmonds, M. and Wallace, P. J.: Volatiles and exsolved vapor in volcanic systems, Elements, 13, 29–34, 2017.
Esposito, R.: Magmatism of the Phlegrean Volcanic Fields as revealed by melt inclusions, in: Vesuvius, Campi Flegrei, and Campanian Volcanism, edited by: De Vivo, B., Belkin, H. E., and Rolandi, G., Elsevier, 141–174, https://doi.org/10.1016/B978-0-12-816454-9.00007-9, 2020.
Esposito, R.: A protocol and review of methods to select, analyze and interpret melt inclusions to determine pre-eruptive volatile contents of magmas, in: Fluid and Melt Inclusions: Applications to Geologic Processes, edited by: Lecumberri-Sanchez, P., Steele-MacInnis, M., and Kontak, D., Topics in Mineral Sciences, Mineralogical Association of Canada, London, Ontario, 163–194, ISBN 9780921294634, 2021.
Esposito, R., Bodnar, R. J., Danyushevsky, L., De Vivo, B., Fedele, L., Hunter, J., Lima, A., and Shimizu, N.: Volatile Evolution of Magma Associated with the Solchiaro Eruption in the Phlegrean Volcanic District (Italy), J. Petrol., 52, 2431–2460, 2011.
Esposito, R., Klebesz, R., Bartoli, O., Klyukin, Y. I., Moncada, D., Doherty, A. L., and Bodnar, R. J.: Application of the Linkam TS1400XY heating stage to melt inclusion studies, Cent. Eur. J. Geosci., 4, 208–218, https://doi.org/10.2478/S13533-011-0054-Y, 2012.
Esposito, R., Hunter, J., Schiffbauer, J., Shimizu, N., and Bodnar, R. J.: An assessment of the reliability of melt inclusions as recorders of the pre-eruptive volatile content of magmas, Am. Mineral., 99, 976–998, 2014.
Esposito, R., Lamadrid, H. M., Redi, D., Steele-MacInnis, M., Bodnar, R. J., Manning, C. E., De Vivo, B., Cannatelli, C., and Lima, A.: Detection of liquid H2O in vapor bubbles in reheated melt inclusions: Implications for magmatic fluid composition and volatile budgets of magmas?, Am. Mineral., 101, 1691–1695, 2016.
Esposito, R., Badescu, K., Steele-MacInnis, M., Cannatelli, C., De Vivo, B., Lima, A., Bodnar, R. J., and Manning, C. E.: Magmatic evolution of the Campi Flegrei and Procida volcanic fields, Italy, based on interpretation of data from well-constrained melt inclusions, Earth-Sci. Rev., 185, 325–356, 2018.
Esposito, R., Badescu, K., Boyce, J. W., and Frezzotti, M.-L.: Chemical characterization of a magma recharging and mixing before an eruption: Insights from chronologically constrained melt inclusions, Lithos, 456, 107301, https://doi.org/10.1016/j.lithos.2023.107301, 2023.
Ferriss, E., Plank, T., Newcombe, M., Walker, D., and Hauri, E.: Rates of dehydration of olivines from San Carlos and Kilauea Iki, Geochim. Cosmochim. Ac., 242, 165–190, 2018.
Ford, C., Russell, D., Groven, J., and Fisk, M.: Distribution coefficients of Mg2+, Fe2+, Ca2+ and Mn2+ between olivine and melt, J. Petrol., 24, 256–265, 1983.
Frezzotti, M.-L.: Silicate-melt inclusions in magmatic rocks: applications to petrology, Lithos, 55, 273–299, https://doi.org/10.1016/S0024-4937(00)00048-7, 2001.
Frezzotti, M. L., Peccerillo, A., and Panza, G.: Carbonate metasomatism and CO2 lithosphere–asthenosphere degassing beneath the Western Mediterranean: an integrated model arising from petrological and geophysical data, Chem. Geol., 262, 108–120, 2009.
Frondini, F., Chiodini, G., Caliro, S., Cardellini, C., Granieri, D., and Ventura, G.: Diffuse CO2 degassing at Vesuvio, Italy, B. Volcanol., 66, 642–651, 2004.
Fuis, G. S., Ambos, E. L., Mooney, W. D., Christensen, N. I., and Geist, E.: Crustal structure of accreted terranes in southern Alaska, Chugach Mountains and Copper River Basin, from seismic refraction results, J. Geophys. Res.-Sol. Ea., 96, 4187–4227, 1991.
Fulignati, P. and Marianelli, P.: Tracing volatile exsolution within the 472 AD “Pollena” magma chamber of Vesuvius (Italy) from melt inclusion investigation, J. Volcanol. Geoth. Res., 161, 289–302, 2007.
Fulignati, P., Marianelli, P., and Sbrana, A.: Glass-bearing felsic nodules from the crystallizing sidewalls of the 1944 Vesuvius magma chamber, Mineral. Mag., 64, 481–496, 2000a.
Fulignati, P., Marianelli, P., and Sbrana, A.: The feeding system of 1944 eruption of Vesuvius: melt inclusion data from dunitic nodules, Neues Jb. Miner. Monat, 9, 419–432, 2000b.
Fulignati, P., Marianelli, P., Santacroce, R., and Sbrana, A.: The skarn shell of the 1944 Vesuvius magma chamber. Genesis and PTX conditions from melt and fluid inclusion data, Eur. J. Mineral., 12, 1025–1039, 2000c.
Fulignati, P., Kamenetsky, V. S., Marianelli, P., Sbrana, A., and Mernagh, T. P.: Melt inclusion record of immiscibility between silicate, hydrosaline, and carbonate melts: Applications to skarn genesis at Mount Vesuvius, Geology, 29, 1043–1046, 2001.
Fulignati, P., Marianelli, P., Métrich, N., Santacroce, R., and Sbrana, A.: Towards a reconstruction of the magmatic feeding system of the 1944 eruption of Mt Vesuvius, J. Volcanol. Geoth. Res., 133, 13–22, 2004.
Gavrilenko, M., Krawczynski, M., Ruprecht, P., Li, W., and Catalano, J. G.: The quench control of water estimates in convergent margin magmas, Am. Mineral., 104, 936–948, 2019.
Ghiorso, M. S. and Gualda, G. A.: An H2O–CO2 mixed fluid saturation model compatible with rhyolite-MELTS, Contrib. Mineral. Petr., 169, 1–30, 2015.
Giaccio, B., Isaia, R., Fedele, F. G., Di Canzio, E., Hoffecker, J., Ronchitelli, A., Sinitsyn, A. A., Anikovich, M., Lisitsyn, S. N., and Popov, V. V.: The Campanian Ignimbrite and Codola tephra layers: two temporal/stratigraphic markers for the Early Upper Palaeolithic in southern Italy and eastern Europe, J. Volcanol. Geoth. Res., 177, 208–226, 2008.
Gilg, H., Lima, A., Somma, R., Belkin, H., De Vivo, B., and Ayuso, R.: Isotope geochemistry and fluid inclusion study of skarns from Vesuvius, Mineral. Petr., 73, 145–176, 2001.
Hartley, M. E., Maclennan, J., Edmonds, M., and Thordarson, T.: Reconstructing the deep CO2 degassing behaviour of large basaltic fissure eruptions, Earth Planet. Sc. Lett., 393, 120–131, https://doi.org/10.1016/j.epsl.2014.02.031, 2014.
Iacono-Marziano, G., Gaillard, F., Scaillet, B., Pichavant, M., and Chiodini, G.: Role of non-mantle CO2 in the dynamics of volcano degassing: The Mount Vesuvius example, Geology, 37, 319–322, 2009.
Iacono-Marziano, G., Morizet, Y., Le Trong, E., and Gaillard, F.: New experimental data and semi-empirical parameterization of H2O–CO2 solubility in mafic melts, Geochim. Cosmochim. Ac., 97, 1–23, 2012.
Jolis, E. M., Freda, C., Troll, V. R., Deegan, F. M., Blythe, L. S., McLeod, C. L., and Davidson, J. P.: Experimental simulation of magma–carbonate interaction beneath Mt. Vesuvius, Italy, Contrib. Mineral. Petr., 166, 1335–1353, 2013.
Joron, J., Metrich, N., Rosi, M., Santacroce, R., and Sbrana, A.: Chemistry and petrography, in: Somma-Vesuvius, edited by: Santacroce, R., Quaderni de la ricerca scientifica, CNR, Roma, 8, 105–171, 1987.
Klébesz, R., Esposito, R., De Vivo, B., and Bodnar, R. J.: Constraints on the origin of sub-effusive nodules from the Sarno (Pomici di Base) eruption of Mt. Somma-Vesuvius (Italy) based on compositions of silicate-melt inclusions and clinopyroxene, Am. Mineral., 100, 760–773, https://doi.org/10.2138/am-2015-4958, 2015.
Knuever, M., Sulpizio, R., Mele, D., and Costa, A.: Magma–rock interactions: a review of their influence on magma rising processes with emphasis on short-timescale assimilation of carbonate rocks, Geol. Soc. Lond. Spec. Publ., 520, 101–120, 2023.
Kovács, I. J., Liptai, N., Koptev, A., Cloetingh, S. A., Lange, T. P., Mațenco, L., Szakács, A., Radulian, M., Berkesi, M., and Patkó, L.: The “pargasosphere” hypothesis: Looking at global plate tectonics from a new perspective, Global Planet. Change, 204, 103547, https://doi.org/10.1016/j.gloplacha.2021.103547, 2021.
Le Bas, M. J., Le Maitre, R. W., Streckeisen, A., and Zanettin, B. A.: Chemical classification of volcanic rocks based on the total alkali-silica diagram, J. Petrol., 27, 745–750, 1986.
Lima, A., Danyushevsky, L. V., De Vivo, B., and Fedele, L.: A model for the evolution of the Mt. Somma-Vesuvius magmatic system based on fluid and melt inclusion investigations, in: Developments in Volcanology, edited by: De Benedetto, V. and Robert, J. B., Elsevier, 227–249, https://doi.org/10.1016/S1871-644X(03)80032-3, 2003.
Lirer, L., Pescatore, T., Booth, B., and Walker, G. P.: Two plinian pumice-fall deposits from Somma-Vesuvius, Italy, Geol. Soc. Am. Bull., 84, 759–772, 1973.
Lloyd, A., Plank, T., Ruprecht, P., Hauri, E., and Rose, W.: Volatile loss from melt inclusions in pyroclasts of differing sizes, Contrib Mineral Petrol, 165, 129-153, 10.1007/s00410-012-0800-2, 2013.
Lowenstern, J. B.: Applications of silicate-melt inclusions to the study of magmatic volatiles, Short Course Handbook, 23, 71–99, 1995.
Marianelli, P., Metrich, N., Santacroce, R., and Sbrana, A.: Mafic magma batches at Vesuvius: a glass inclusion approach to the modalities of feeding stratovolcanoes, Contrib. Mineral. Petr., 120, 159–169, 1995.
Marianelli, P., Métrich, N., and Sbrana, A.: Shallow and deep reservoirs involved in magma supply of the 1944 eruption of Vesuvius, B. Volcanol., 61, 48–63, 1999.
Marianelli, P., Sbrana, A., Métrich, N., and Cecchetti, A.: The deep feeding system of Vesuvius involved in recent violent strombolian eruptions, Geophys. Res. Lett., 32, L02306, https://doi.org/10.1029/2004gl021667, 2005.
Merlini, S. and Mostardini, F.: Appennino centro-meridionale: sezioni geologiche e proposta di modello strutturale, Geologia dell'Italia centrale, Congresso nazionale, 73, 147–149, 1986.
Métrich, N. and Wallace, P. J.: Volatile abundances in basaltic magmas and their degassing paths tracked by melt inclusions, Rev. Mineral. Geochem., 69, 363–402, 2008.
Mironov, N., Portnyagin, M., Botcharnikov, R., Gurenko, A., Hoernle, K., and Holtz, F.: Quantification of the CO2 budget and H2O–CO2 systematics in subduction-zone magmas through the experimental hydration of melt inclusions in olivine at high H2O pressure, Earth Planet. Sc. Lett., 425, 1–11, 2015.
Moore, L., Gazel, E., Tuohy, R., Lloyd, A., Esposito R., Steele-MacInnis, M. J., Hauri, E. H., Wallace, P., Plank, T., and Bodnar, R. J.: Bubbles matter: An assessment of the contribution of vapor bubbles to melt inclusion volatile budgets, Am. Mineral., 100, 806–823, 2015.
Newman, S. and Lowenstern, J. B.: VolatileCalc; a silicate melt-H2O-CO2 solution model written in Visual Basic for Excel, Comput. Geosci., 28, 597–604, 2002.
Nunziata, C., Natale, M., Luongo, G., and Panza, G. F.: Magma reservoir at Mt. Vesuvius: Size of the hot, partially molten, crust material detected deeper than 8 km, Earth Planet. Sc. Lett., 242, 51–57, 2006.
Nunziata, C., Costanzo, M. R., and Panza, G. F.: Lithosphere structural model of the Campania Plain, in: Vesuvius, Campi Flegrei, and Campanian Volcanism, edited by: De Vivo, B., Belkin, H. E., and Rolandi, G., Elsevier, 57–78, https://doi.org/10.1016/B978-0-12-816454-9.00004-3, 2020.
Papale, P., Moretti, R., and Barbato, D.: The compositional dependence of the saturation surface of H2O + CO2 fluids in silicate melts, Chem. Geol., 229, 78–95, 2006.
Pappalardo, L. and Mastrolorenzo, G.: Short residence times for alkaline Vesuvius magmas in a multi-depth supply system: Evidence from geochemical and textural studies, Earth Planet. Sc. Lett., 296, 133–143, 2010.
Patacca, E. and Scandone, P.: Geology of the southern Apennines, B. Soc. Geol. Ital., 7, 75–119, 2007.
Peccerillo, A.: Campania volcanoes: petrology, geochemistry, and geodynamic significance, in: Vesuvius, Campi Flegrei, and Campanian Volcanism, edited by: De Vivo, B., Belkin, H. E., and Rolandi, G., Elsevier, 79–120, https://doi.org/10.1016/B978-0-12-816454-9.00005-5, 2020.
Piana Agostinetti, N. and Amato, A.: Moho depth and Vp Vs ratio in peninsular Italy from teleseismic receiver functions, J. Geophys. Res.-Sol. Ea., 114, B06303, https://doi.org/10.1029/2008JB005899, 2009.
Piochi, M., Ayuso, R. A., De Vivo, B., and Somma, R.: Crustal contamination and crystal entrapment during polybaric magma evolution at Mt. Somma–Vesuvius volcano, Italy: Geochemical and Sr isotope evidence, Lithos, 86, 303–329, 2006.
Portnyagin, M., Almeev, R., Matveev, S., and Holtz, F.: Experimental evidence for rapid water exchange between melt inclusions in olivine and host magma, Earth Planet. Sc. Lett., 272, 541–552, 2008.
Portnyagin, M., Mironov, N., Botcharnikov, R., Gurenko, A., Almeev, R. R., Luft, C., and Holtz, F.: Dehydration of melt inclusions in olivine and implications for the origin of silica-undersaturated island-arc melts, Earth Planet. Sc. Lett., 517, 95–105, 2019.
Qin, Z., Lu, F., and Anderson, A. T.: Diffusive reequilibration of melt and fluid inclusions, Am. Mineral., 77, 565–576, 1992.
Raia, F., Webster, J. D., and De Vivo, B.: Pre-eruptive volatile contents of Vesuvius magmas: constraints on eruptive history and behavior. I-The medieval and modern interplinian activities, Eur. J. Mineral., 12, 179–193, https://doi.org/10.1127/0935-1221/2000/0012-0179, 2000.
Rasmussen, D. J., Plank, T. A., Wallace, P. J., Newcombe, M. E., and Lowenstern, J. B.: Vapor-bubble growth in olivine-hosted melt inclusions, Am. Mineral., 105, 1898–1919, 2020.
Redi, D., Cannatelli, C., Esposito, R., Lima, A., Petrosino, P., and De Vivo, B.: Somma-Vesuvius' activity: a mineral chemistry database, Miner. Petrol., 111, 43–67, 2017.
Remigi, S., Mancini, T., Ferrando, S., and Frezzotti, M. L.: Interlaboratory Application of Raman CO2 Densimeter Equations: Experimental Procedure and Statistical Analysis Using Bootstrapped Confidence Intervals, Appl. Spectrosc., 75, 867–881, 2021.
Riker, J.: The 1859 Eruption of Mauna Loa Volcano, Hawai'i: Controls on the Development of Long Lava Channels, PhD thesis, University of Oregon, https://earthsciences.uoregon.edu/dissertations-and-theses#R (last access: 5 November 2023), 2005.
Roedder, E.: Origin and significance of magmatic inclusions, B. Mineral., 102, 487–510, 1979.
Rose-Koga, E., Bouvier, A.-S., Gaetani, G., Wallace, P., Allison, C., Andrys, J., de la Torre, C. A., Barth, A., Bodnar, R., and Gartner, A. B.: Silicate melt inclusions in the new millennium: A review of recommended practices for preparation, analysis, and data presentation, Chem. Geol., 570, 120145, https://doi.org/10.1016/j.chemgeo.2021.120145, 2021.
Ruscitto, D. M., Wallace, P. J., Cooper, L. B., and Plank, T.: Global variations in H2O/Ce: 2. Relationships to arc magma geochemistry and volatile fluxes, Geochem. Geophy. Geosy., 13, Q03025, https://doi.org/10.1029/2011GC003887, 2012.
Santacroce, R., Bertagnini, A., Civetta, L., Landi, P., and Sbrana, A.: Eruptive Dynamics and Petrogenetic Processes in a very Shallow Magma Reservoir: the 1906 Eruption of Vesuvius, J. Petrol., 34, 383–425, https://doi.org/10.1093/petrology/34.2.383, 1993.
Santacroce, R., Cioni, R., Marianelli, P., Sbrana, A., Sulpizio, R., Zanchetta, G., Donahue, D. J., and Joron, J. L.: Age and whole rock–glass compositions of proximal pyroclastics from the major explosive eruptions of Somma-Vesuvius: A review as a tool for distal tephrostratigraphy, J. Volcanol. Geoth. Res., 177, 1–18, 2008.
Scaillet, B., Pichavant, M., and Cioni, R.: Upward migration of Vesuvius magma chamber over the past 20,000 years, Nature, 455, 216–219, 2008.
Scandone, R., Giacomelli, L., and Gasparini, P.: Mount Vesuvius: 2000 years of volcanological observations, J. Volcanol. Geoth. Res., 58, 5–25, 1993.
Schiano, P., Provost, A., Clocchiatti, R., and Faure, F.: Transcrystalline melt migration and Earth's mantle, Science, 314, 970–974, 2006.
Schiavi, F., Bolfan-Casanova, N., Buso, R., Laumonier, M., Laporte, D., Medjoubi, K., Venugopal, S., Gómez-Ulla, A., Cluzel, N., and Hardiagon, M.: Quantifying magmatic volatiles by Raman microtomography of glass inclusion-hosted bubbles, Geochemical Perspectives Letters, 16, 17–24, 2020.
Severs, M., Azbej, T., Thomas, J., Mandeville, C., and Bodnar, R.: Experimental determination of H2O loss from melt inclusions during laboratory heating: evidence from Raman spectroscopy, Chem. Geol., 237, 358–371, 2007.
Shishkina, T. A., Botcharnikov, R. E., Holtz, F., Almeev, R. R., Jazwa, A. M., and Jakubiak, A. A.: Compositional and pressure effects on the solubility of H2O and CO2 in mafic melts, Chem. Geol., 388, 112–129, 2014.
Signorelli, S., Vaggelli, G., and Romano, C.: Pre-eruptive volatile (H2O, F, Cl and S) contents of phonolitic magmas feeding the 3550-year old Avellino eruption from Vesuvius, southern Italy, J. Volcanol. Geoth. Res., 93, 237–256, 1999.
Sigurdsson, H., Cashdollar, S., and Sparks, S. R.: The eruption of Vesuvius in AD 79: reconstruction from historical and volcanological evidence, Am. J. Archaeol., 86, 39–51, 1982.
Sobolev, A. V. and Danyushevsky, L. V.: Petrology and geochemistry of boninites from the north termination of the Tonga Trench: constraints on the generation conditions of primary high-Ca boninite magmas, J. Petrol., 35, 1183–1211, 1994.
Sobolev, A. V., Dmitriev, L. V., Barsukov, V. L., Nevsorov, V. N., and Slutsky, A. B.: The formation conditions of the high magnesium olivines from the monomineralic fraction of Luna 24 regolith, P. Lunar Planet. Sci. C., 11, 105–116, 1980.
Sobolev, V., Bazarova, T. Y., and Bakumenko, I.: Crystallization temperature and gas phase composition of alkaline effusives as indicated by primary melt inclusions in the phenocrysts, Bulletin Volcanologique, 35, 479–496, 1971.
Sokol, A. G., Kupriyanov, I. N., and Palyanov, Y. N.: Partitioning of H2O between olivine and carbonate–silicate melts at 6.3 GPa and 1400 ∘C: Implications for kimberlite formation, Earth Planet. Sc. Lett., 383, 58–67, 2013.
Steele-MacInnis, M.: Seeking the most hydrous, primitive arc melts: The glass is half full, Am. Mineral., 104, 1217–1218, 2019.
Steele-MacInnis, M., Esposito, R., Moore, L. R., and Hartley, M. E.: Heterogeneously entrapped, vapor-rich melt inclusions record pre-eruptive magmatic volatile contents, Contrib. Mineral. Petr., 172, 18, https://doi.org/10.1007/s00410-017-1343-3, 2017.
Steele-MacInnis, M. J., Esposito, R., and Bodnar, R. J.: Thermodynamic model for the effect of post-entrapment crystallization on the H2O-CO2 systematics of volatile saturated silicate melt inclusions, J. Petrol., 52, 2461–2482, 2011.
Stothers, R. B. and Rampino, M. R.: Volcanic eruptions in the Mediterranean before AD 630 from written and archaeological sources, J. Geophys. Res.-Sol. Ea., 88, 6357–6371, 1983.
Student, J. J. and Bodnar, R. J.: Synthetic Fluid Inclusions XIV: Coexisting Silicate Melt and Aqueous Fluid Inclusions in the Haplogranite–H2O–NaCl–KCl System, J. Petrol., 40, 1509–1525, https://doi.org/10.1093/petroj/40.10.1509, 1999.
Tucker, J. M., Hauri, E. H., Pietruszka, A. J., Garcia, M. O., Marske, J. P., and Trusdell, F. A.: A high carbon content of the Hawaiian mantle from olivine-hosted melt inclusions, Geochim. Cosmochim. Ac., 254, 156–172, 2019.
Vaggelli, G., De Vivo, B., and Trigila, R.: Silicate-melt inclusions in recent Vesuvius lavas (1631–1944): II. Analytical chemistry, J. Volcanol. Geoth. Res., 58, 367–376, 1993.
Vitale, S. and Ciarcia, S.: Tectono-stratigraphic setting of the Campania region (southern Italy), J. Maps, 14, 9–21, 2018.
Wadge, G.: Output rate of magma from active central volcanoes, Nature, 288, 253–255, 1980.
Wallace, P. J.: Volatiles in subduction zone magmas: concentrations and fluxes based on melt inclusion and volcanic gas data, J. Volcanol. Geoth. Res., 140, 217–240, 2005.
Wallace, P. J., Kamenetsky, V. S., and Cervantes, P.: Melt inclusion CO2 contents, pressures of olivine crystallization, and the problem of shrinkage bubbles, Am. Mineral., 100, 787–794, 2015.
Wallace, P. J., Plank, T., Bodnar, R. J., Gaetani, G. A., and Shea, T.: Olivine-hosted melt inclusions: A microscopic perspective on a complex magmatic world, Annu. Rev. Earth Pl. Sc., 49, 465–494, 2021.
Webster, J., Raia, F., De Vivo, B., and Rolandi, G.: The behavior of chlorine and sulfur during differentiation of the Mt. Somma-Vesuvius magmatic system, Miner. Petrol., 73, 177–200, 2001.
Wieser, P. E., Iacovino, K., Matthews, S., Moore, G., and Allison, C.: VESIcal: 2. A Critical Approach to Volatile Solubility Modeling Using an Open-Source Python3 Engine, Earth Space Sci., 9, e2021EA001932, https://doi.org/10.1029/2021EA001932, 2022.
Zhang, Y. and Cherniak, D. J.: Diffusion in minerals and melts: introduction, Reviews in Mineralogy and Geochemistry, 72, 1–4, 2010.