the Creative Commons Attribution 4.0 License.
the Creative Commons Attribution 4.0 License.
 | 27 Feb 2023
CO2 diffusion in dry and hydrous leucititic melt
Lennart Koch
Burkhard C. Schmidt
Using the diffusion couple technique, diffusion of CO2 in a leucititic melt from the Colli Albani Volcanic District in Italy was investigated at temperatures between 1200 and 1350 ∘C in an internally heated pressure vessel at 300 MPa. To examine the effect of dissolved H2O in the melt, experiments were performed for a nominally dry melt (0.18 ± 0.03 wt % H2O) and for a hydrous melt containing 3.36 ± 0.28 wt % H2O. Diffusion experiments were run for 40 to 120 min and terminated by rapid quench. CO2 concentration profiles were subsequently measured via attenuated total reflection Fourier transform infrared spectroscopy (ATR-FTIR) and fitted with error functions to obtain individual diffusion coefficients.
For the anhydrous and hydrous sample series, seven diffusion coefficients were determined each. Diffusivity was found to increase exponentially with temperature for both melts following an Arrhenius behaviour. The Arrhenius equation for the nominally dry leucititic melt is described by
where is the diffusion coefficient in m2 s−1 and T is the temperature in K. In the experimental temperature range, H2O has an accelerating effect on CO2 diffusion. At 1200 ∘C, diffusivity increases from 1.94 × 10⁻¹² m2 s−1 in the dry melt to 1.54 × 10⁻¹¹ m2 s−1 in the hydrous melt. The Arrhenius equation for the leucititic melt containing 3.36±0.28 wt % H2O is given by
The activation energies for CO2 were determined to be 275 ± 47 kJ mol−1 for the anhydrous melt and 209 ± 58 kJ mol−1 for the hydrous melt.
The high CO2 activation energy in the leucititic melt indicates that the diffusion might be partly attributed to the carbonate species. At high magmatic temperatures above 1200 ∘C, CO2 diffusivity in the leucititic melt is only slightly lower than CO2 diffusion in rhyolitic and basaltic melts, suggesting that CO2 diffusion in natural melts is relatively independent from the bulk melt composition at such temperatures. CO2 diffuses slower than other volatile components such as halogens and H2O in depolymerized silicate melts. Thus, a fractionation of volatiles can occur during magma ascent and degassing. The experimental data on CO2 diffusion can be used for modelling the degassing mechanisms of ultrapotassic mafic melts.
- Article
(3813 KB) - Full-text XML
-
Supplement
(381 KB) - BibTeX
- EndNote


Volatiles play a crucial role in the eruption dynamics of volcanoes. At great depth and under high pressure, volatiles are soluble in silicate melts. During magma ascent and the associated pressure decrease, silicate melts can become oversaturated in their volatiles. Consequently, bubbles can nucleate and volatiles start to degas. Further decompression and outgassing cause bubble growth and expansion of the fluids within vesicles. As a result, a fragmentation of the magma can occur during the eruption (e.g. Zhang et al., 2007). However, bubble growth rates are limited by transport properties (i.e. diffusion) of the associated volatile components within the melt (Sparks et al., 1994). Diffusion data on volatiles at magmatic temperatures and high pressures are therefore important for understanding and modelling the degassing and eruption mechanisms of silicate melts. Compared to H2O, the diffusion of CO2, the second most abundant volatile in the Earth's crust (e.g. Anderson, 1975; Symonds et al., 1994; Johnson et al., 1994), has however only been studied for a few natural melt compositions. For example, CO2 diffusion coefficients for foiditic melts are missing. Moreover, the effect of dissolved H2O on the CO2 diffusivity has not been investigated in great detail.
Carbon dioxide can be present in the form of molecular CO2 and carbonate (CO within silicate glasses (e.g. Fine and Stolper, 1985). The carbon speciation in a silicate glass depends on the bulk composition of the glass: with increasing depolymerization, the fraction of carbonate increases and the portion of molecular CO2 decreases (e.g. Fine and Stolper, 1985). However, the carbon speciation in a quenched glass does not necessarily represent the speciation in the corresponding melt at high temperatures. Experimental studies (Morizet et al., 2001; Nowak et al., 2003; Spickenbom et al., 2010; Konschak and Keppler, 2014) and simulations (Guillot and Sator, 2011) indicate that the molecular species of CO2 species is favoured as the temperature increases. This means that depolymerized melts (e.g. basaltic melts) most likely feature a certain proportion of molecular CO2 even though their quenched glasses only show carbonate groups. Accordingly, the total diffusive flux of CO2 is based on the individual diffusive fluxes of the two species involved. The diffusion coefficient for total CO2 can therefore be divided into the individual diffusion coefficients of the carbon species and in consideration of their relative fractions and (Nowak et al., 2004) according to the equation
CO2 diffusion data were experimentally obtained for (simplified) natural melts (Watson et al., 1982; Fogel and Rutherford, 1990; Watson, 1991; Zhang and Stolper, 1991; Blank, 1993; Nowak et al., 2004; Baker et al., 2005) and for melts in the Na2O–Al2O3–SiO2 system (Watson et al., 1982; Sierralta et al., 2002; Spickenbom et al., 2010). Moreover, CO2 diffusion was investigated by molecular dynamics simulations by Guillot and Sator (2011). The most recent review on CO2 diffusion is given by Ni and Keppler (2013). The experimental studies generally revealed that CO2 diffusion does not heavily depend on the bulk composition of the melt at high magmatic temperatures. For instance, Nowak et al. (2004) showed that CO2 diffusion in rhyolitic to hawaiitic melts at 1350 ∘C and 500 MPa is equal within error. In contrast to this, Sierralta et al. (2002) and Spickenbom et al. (2010) discovered that the addition of Na2O to an albitic melt accelerates CO2 diffusion, indicating a dependency on melt composition. These examples show that the diffusion mechanism of CO2 in silicate melts is complex: based on the melt composition and the temperature, specific proportions of molecular CO2 and CO are coexisting in a melt and both species show different individual diffusion coefficients with molecular CO2 diffusing faster than the carbonate species (Nowak et al., 2004; Spickenbom et al., 2010).
The aim of this study was the determination of diffusion coefficients for CO2 in a synthetic leucititic melt that is based on an eruption product of the Pozzolane Rosse eruption of the Colli Albani Volcanic District in Italy (Freda et al., 2011: sample “SULm”). The melt composition is characterized by a low SiO2 concentration (≈ 44 wt %) and a high alkali content (K2O + Na2O > 12 wt %). The explosivity of the Pozzolane Rosse eruption was supposedly caused by CO2 outgassing due to decompression and leucite crystallization (Freda et al., 2011) and was further enhanced by the relative high viscosity of the bulk melt composition (Kleest et al., 2020). Hence, information on CO2 diffusivity is useful for understanding the degassing behaviour during the eruption. Furthermore, this melt composition has the advantage that absorption coefficients for transmission FTIR (Fourier transform infrared) spectroscopy were already calibrated (Schanofski et al., 2019) and that a second method for CO2 quantification via attenuated total reflection Fourier transform infrared (ATR-FTIR) spectroscopy has been established (Schanofski et al., 2023).
Diffusion couple experiments were performed in an internally heated pressure vessel (IHPV) at a constant pressure of 300 MPa. Experiments were conducted at temperatures between 1200 and 1350 ∘C and with different water concentrations dissolved in the melt (anhydrous vs. hydrous).
2.1 Synthesis of starting glass
A leucititic glass was produced by melting oxides (SiO2, TiO2, Al2O3, Fe2O3, MnO2, MgO) and carbonates (CaCO3, Na2CO3, K2CO3) based on the chemical composition of the leucitite sample “SULm” from Freda et al. (2011). For decarbonation, the batch was heated at 1000 ∘C for 1 h in a Carbolite box furnace. The decarbonated mixture was then melted at 1600 ∘C for 1.5 h in a Pt crucible in a 1 atm Nabertherm box furnace. The melt was rapidly quenched by placing the hot crucible in water. The glass was then ground for 20 min using a motorized Retsch mortar (RM100). The glass powder was melted again at 1600 ∘C for 2 h to improve its homogeneity and was again rapidly quenched. Subsequently, the chemical composition of the starting glass was checked with a Bruker M4 Tornado micro X-ray fluorescence (μ-XRF) spectrometer (X-ray beam spot size: 20 µm). The chemical composition is given in Table 1.
Table 1Chemical composition of leucititic glasses given in wt %.

Note: 2σ of repeated measurements given in parentheses (last decimals). a Freda et al. (2011): EPMA, five-point analyses. b This study: μ-XRF (type calibrated based on 50 in-house standard glasses), six-point analyses (300 s per point), X-ray tube: 50 kV and 200 µA. c All iron calculated as Fe2O3.
2.2 Synthesis of volatile bearing glasses
Volatile bearing glasses were synthesized in a vertically operating internally heated pressure vessel (IHPV) with a rapid quench device. It uses Ar gas as pressure medium and has an intrinsic oxygen fugacity of NNO + 3 ± 1. In the internal furnace, heat is generated by two platinum windings which are controlled independently by a Eurotherm controller. In the hot zone of the furnace, temperatures are measured with three S-type thermocouples over a vertical distance of 3 cm. The temperature gradient over this distance is typically between 10 and 15 ∘C. Pressure is measured with a pressure transducer (accuracy: ± 5 MPa).
Au75Pd25 capsules (30 mm length, 4 mm outer diameter, 0.2 mm wall thickness) and Pt capsules (30 mm length, 3 mm outer diameter, 0.2 mm wall thickness) were cleaned with acetone and annealed with a propane flame. After one side of the capsules was shut by arc welding using a Lampert PUK U3 welding apparatus, a mixture of powdered leucititic starting glass and silver oxalate (Ag2C2O4) was loaded into the capsules. Silver oxalate serves as the CO2 source during the experiments since it dissociates into CO2 and elemental silver at high temperatures. For capsules of the hydrous sample series, 3 wt % deionized water was added to the mixture. The targeted CO2 and H2O concentrations for all synthesis capsules are listed in Table 2. The capsules were finally sealed by welding the second opening. Subsequently, the capsules were put in a hydrothermal autoclave at a pressure of about 120 MPa at room temperature for 1 h to check for leakage. In the IHPV, the capsules were put into a Pt cup suspended from a thin quench wire out of Pt90Rh10 (0.2 mm diameter). Synthesis experiments were run at 300 MPa at temperatures between 1250 and 1300 ∘C for time spans between 91 and 117 h. At these experimental conditions, the melts were fluid undersaturated according to the solubility data for the same leucititic melt of Schanofski et al. (2019). Synthesis experiments were stopped with a rapid quench: by applying an electric current to the quench electrodes, the quench wire fuses and the sample containing cup drops into the cold part of the pressure vessel. In a similar experimental setting, Benne and Behrens (2003) determined the cooling rate of the rapid quench to be about 150 ∘C s−1.
Table 2Experimental conditions and results of synthesis experiments.
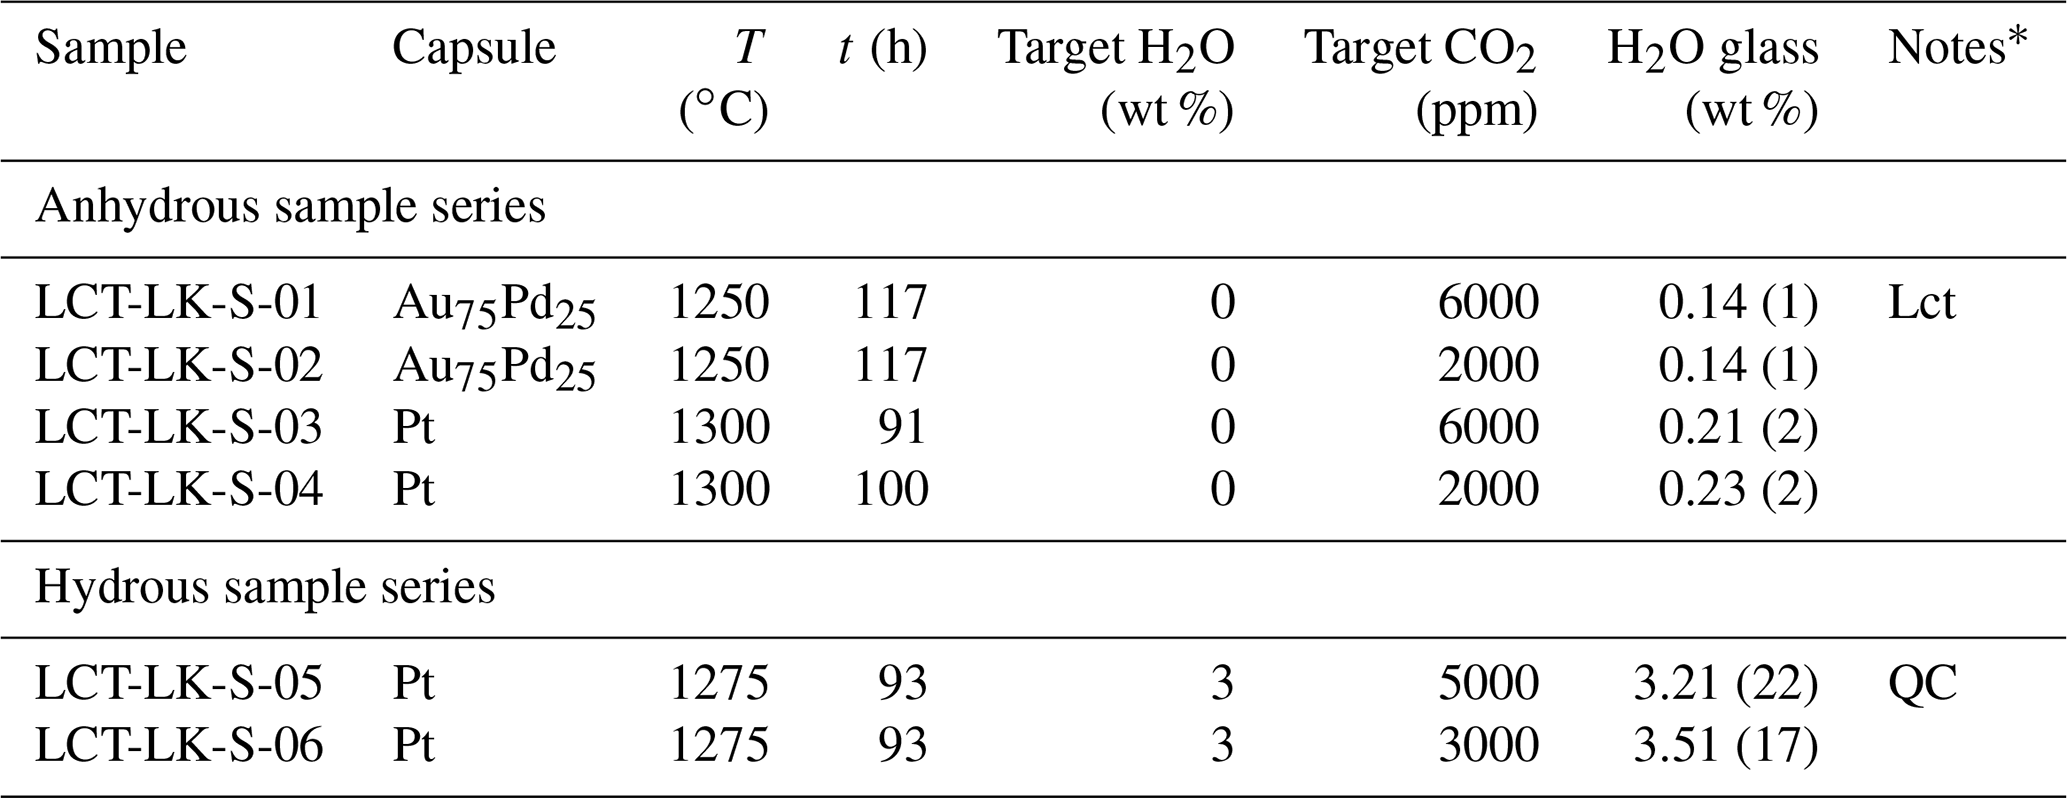
* Lct: Leucite; QC: quench crystallization.
All melts were successfully quenched to glasses and showed no bubbles. The rapid quench caused stress cracks within all glasses making them extremely brittle. Microscopic examination revealed that the CO2-rich, dry glass synthesized in a Au75Pd25 capsule at 1250 ∘C (LCT-LK-S-01) showed few idiomorphic leucite crystals (<0.1 vol %). Consequently, following synthesis experiments were run at higher temperatures. The hydrous, CO2-rich sample LCT-LK-S-05 was affected by quench crystallization, whereas all other samples were free of quench crystals. The quench crystals were examined via Raman spectroscopy, but the phase could not be identified because of its small size and weak Raman signal.
2.3 Diffusion couple experiments
Whereas diffusion couples from other CO2 diffusion studies consisted of a CO2-rich and a CO2-free starting glass (e.g. Nowak et al., 2004), we used a CO2-rich and a CO2-poor starting glass for diffusion couples. This approach was chosen because minimum CO2 concentrations of 1700 ppm are required for a reliable evaluation of ATR-FTIR spectra (Schanofski et al., 2023) and thus for accurate measurements of CO2 contents at the low concentration side of the diffusion profiles.
Capsules from synthesis experiments were cut into cylindrical pieces with lengths of 1 to 3 mm using a Buehler ISOMET saw with a diamond saw blade. Their sawn surfaces were lapped stepwise with SiC grinding paper (600, 1200 and 2500 grit size), but the outer capsule material was not removed from the glass cylinders because it stabilized the fragile samples (Fig. 1a). Two cylinders (a CO2-rich and a CO2-poor one) were brought into contact at their lapped surfaces (Fig. 1b), and the noble metal jackets were welded together to stabilize the diffusion couple and to ensure a good contact between the glasses (Fig. 1c). Au75Pd25-jacketed diffusion couples were then placed into larger Au75Pd25 capsules (5.5 mm outer diameter, 0.2 mm wall thickness), whereas Pt-jacketed diffusion couples were put into larger Pt capsules (4.0 mm outer diameter, 0.2 mm wall thickness). These capsules were subsequently welded shut (Fig. 1d) and brought in hydrothermal autoclaves to 120 MPa at room temperature for 1 min. By applying the external pressure, the outer capsule was pressed against the inner cylindrical diffusion couple, and the encased air got compressed (Fig. 1e). Subsequently, this compressed air was released by cutting the outer capsule open with a wire cutter. Afterwards, the capsules were welded shut again. By this procedure, we reduced the presence of a mixed fluid phase involving N2 that could lead to bubble formation due to changed solubility behaviour of a CO2–N2 or CO2–H2O–N2 fluid phase within the capsule during the diffusion experiment.
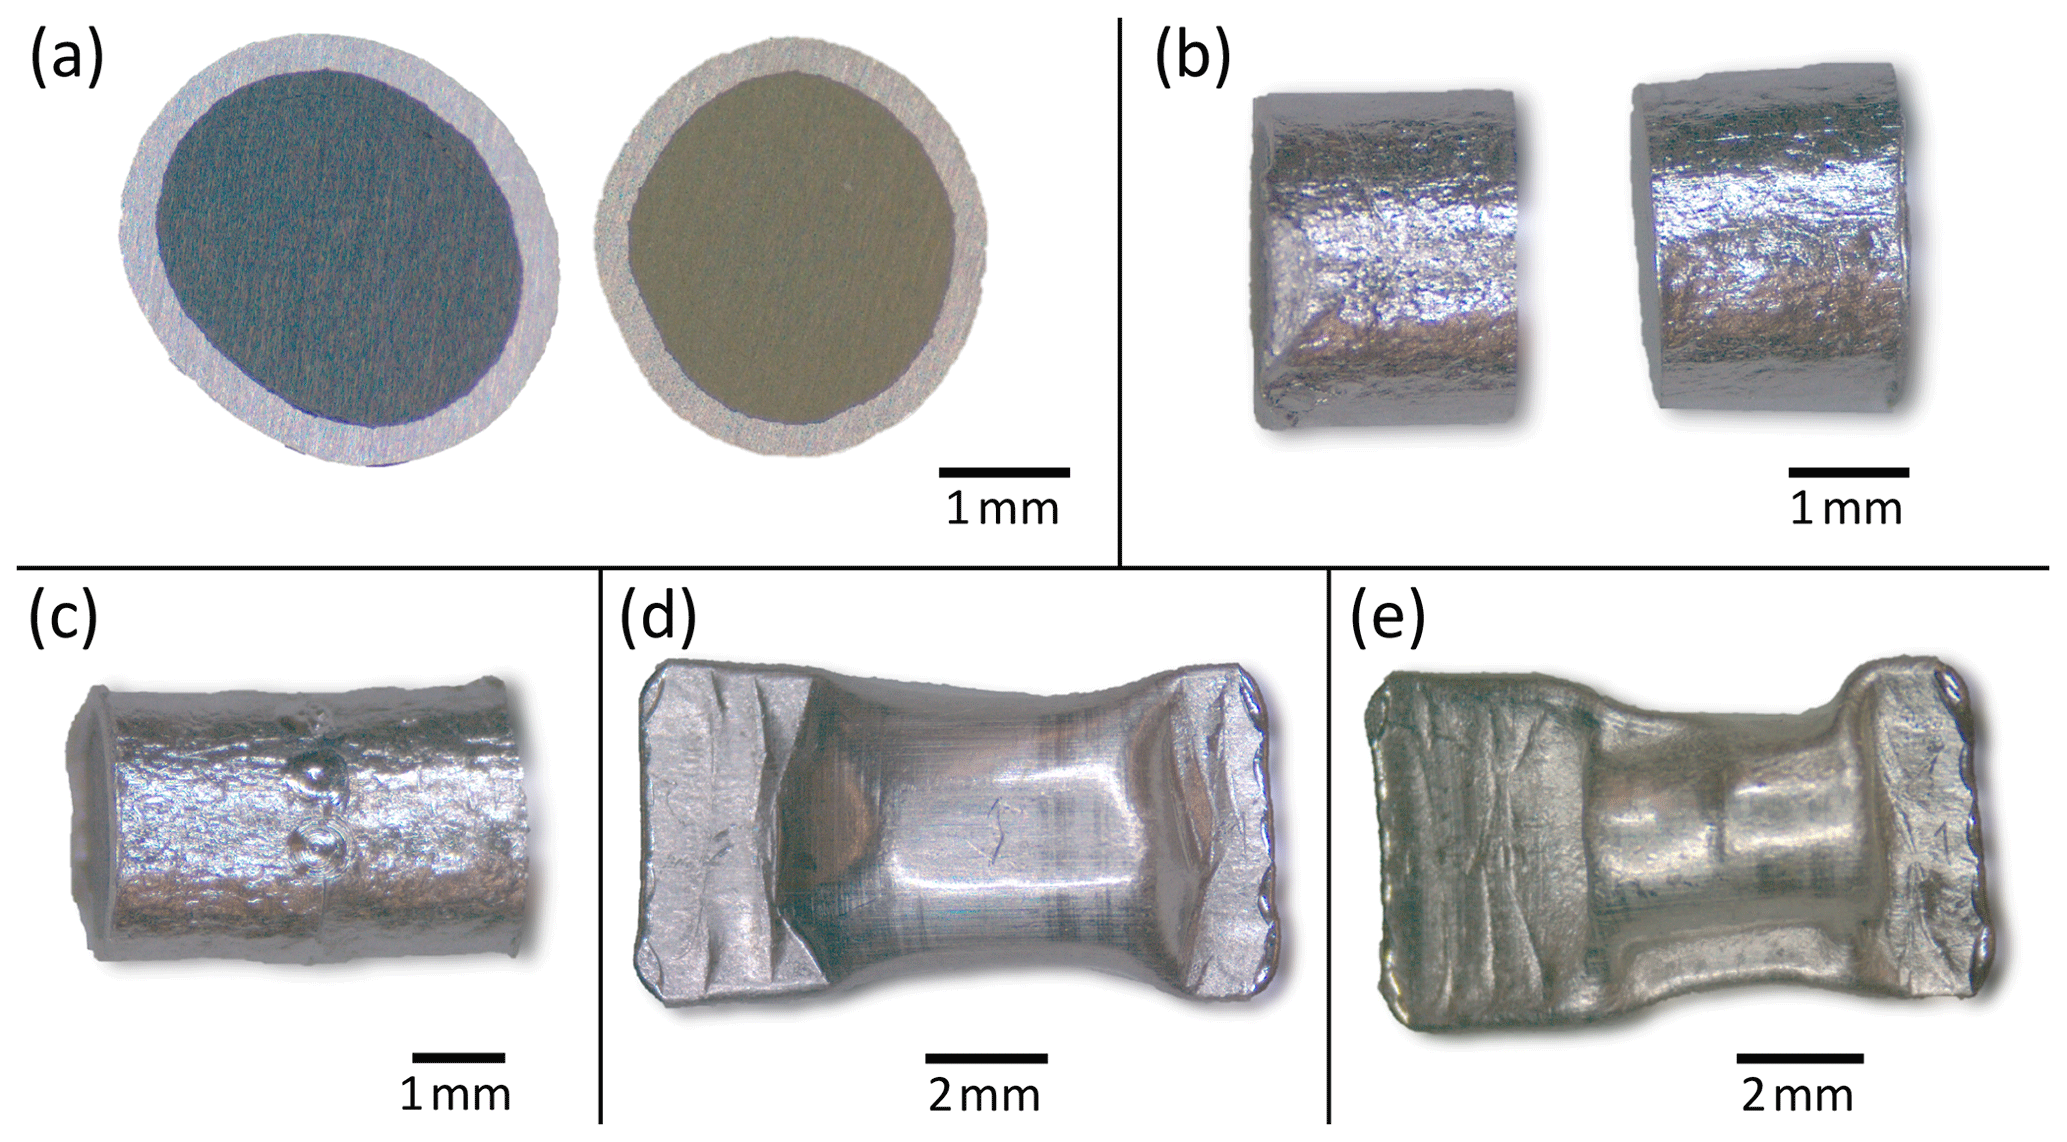
Figure 1Photomicrographs of (a) glass cylinders with their lapped surfaces facing upward (encased by Pt capsule; the glass on the right side is affected by quench crystallization), (b) Pt-jacketed glass cylinders with their lapped surfaces facing against each other, (c) a welded diffusion couple (see welding points in the central area), (d) diffusion couple placed in a larger Pt capsule and (e) Pt capsule with diffusion couple after pressurization in the hydrothermal autoclave at 120 MPa.
Diffusion experiments were also performed in the IHPV. For each diffusion experiment, one diffusion couple was attached to a hook-shaped sample holder which got connected to the quench wire. The suspended sample was located in the hot zone of the furnace at the height of a thermocouple. Before heating, pressure was increased to about 190 MPa to prevent volatile degassing during the heating process once the glass transition temperature ( is exceeded. Temperature was then automatically increased at a rate of 40 ∘C min−1 until the target temperature was reached (target temperatures were between 1200 and 1350 ∘C). During heating, the targeted pressure of 300 MPa was reached and exceeded at temperatures between 800 and 1100 ∘C (and therefore above ; Kleest et al., 2020) because of thermal expansion of the Ar gas. Excessive gas was released stepwise by opening an outlet valve. Temperature was kept constant once the targeted temperature was reached. From this point, diffusion experiments were run for different durations between 40 and 120 min (nominal run-time tnom). The experiments were stopped by a rapid quench. To quantify the diffusion during heating and cooling experimentally, three zero time experiments were performed. The experimental approach is similar to the procedure of normal diffusion experiments, but after reaching the targeted temperature, diffusion was immediately stopped by a rapid quench. Thus, zero time samples only experienced CO2 diffusion during the heating process and the rapid quench.
All diffusion couples were successfully quenched to glasses. In contrast to previous synthesis experiments, hydrous samples were not affected by quench crystallization due to faster cooling rates of the smaller sample masses. However, diffusion samples that were run at the lowest experimental temperatures (sub-liquidus) had crystals that formed during the experiments and not during the rapid quench (sizes above 1 µm and partly idiomorphic). Anhydrous glasses (experimental temperatures ≤ 1250 ∘C) featured leucite and magnetite. LCT-LK-D-d04 (1200 ∘C) was affected heavily (30 vol % to 40 vol % crystals in the CO2-rich part), whereas LCT-LK-D-d07 (1225 ∘C) and LCT-LK-D-d02 (1250 ∘C) showed fewer crystals (up to 5 vol %). In the case of the hydrous sample series, only LCT-LK-D-w02 (1200 ∘C) was affected by crystallization of magnetite (≈ 1 vol %). Again, all glasses showed stress cracks caused by the rapid quench (Fig. 2). The diffusion couples could therefore not be unwrapped from their capsule material because they would have broken into pieces.
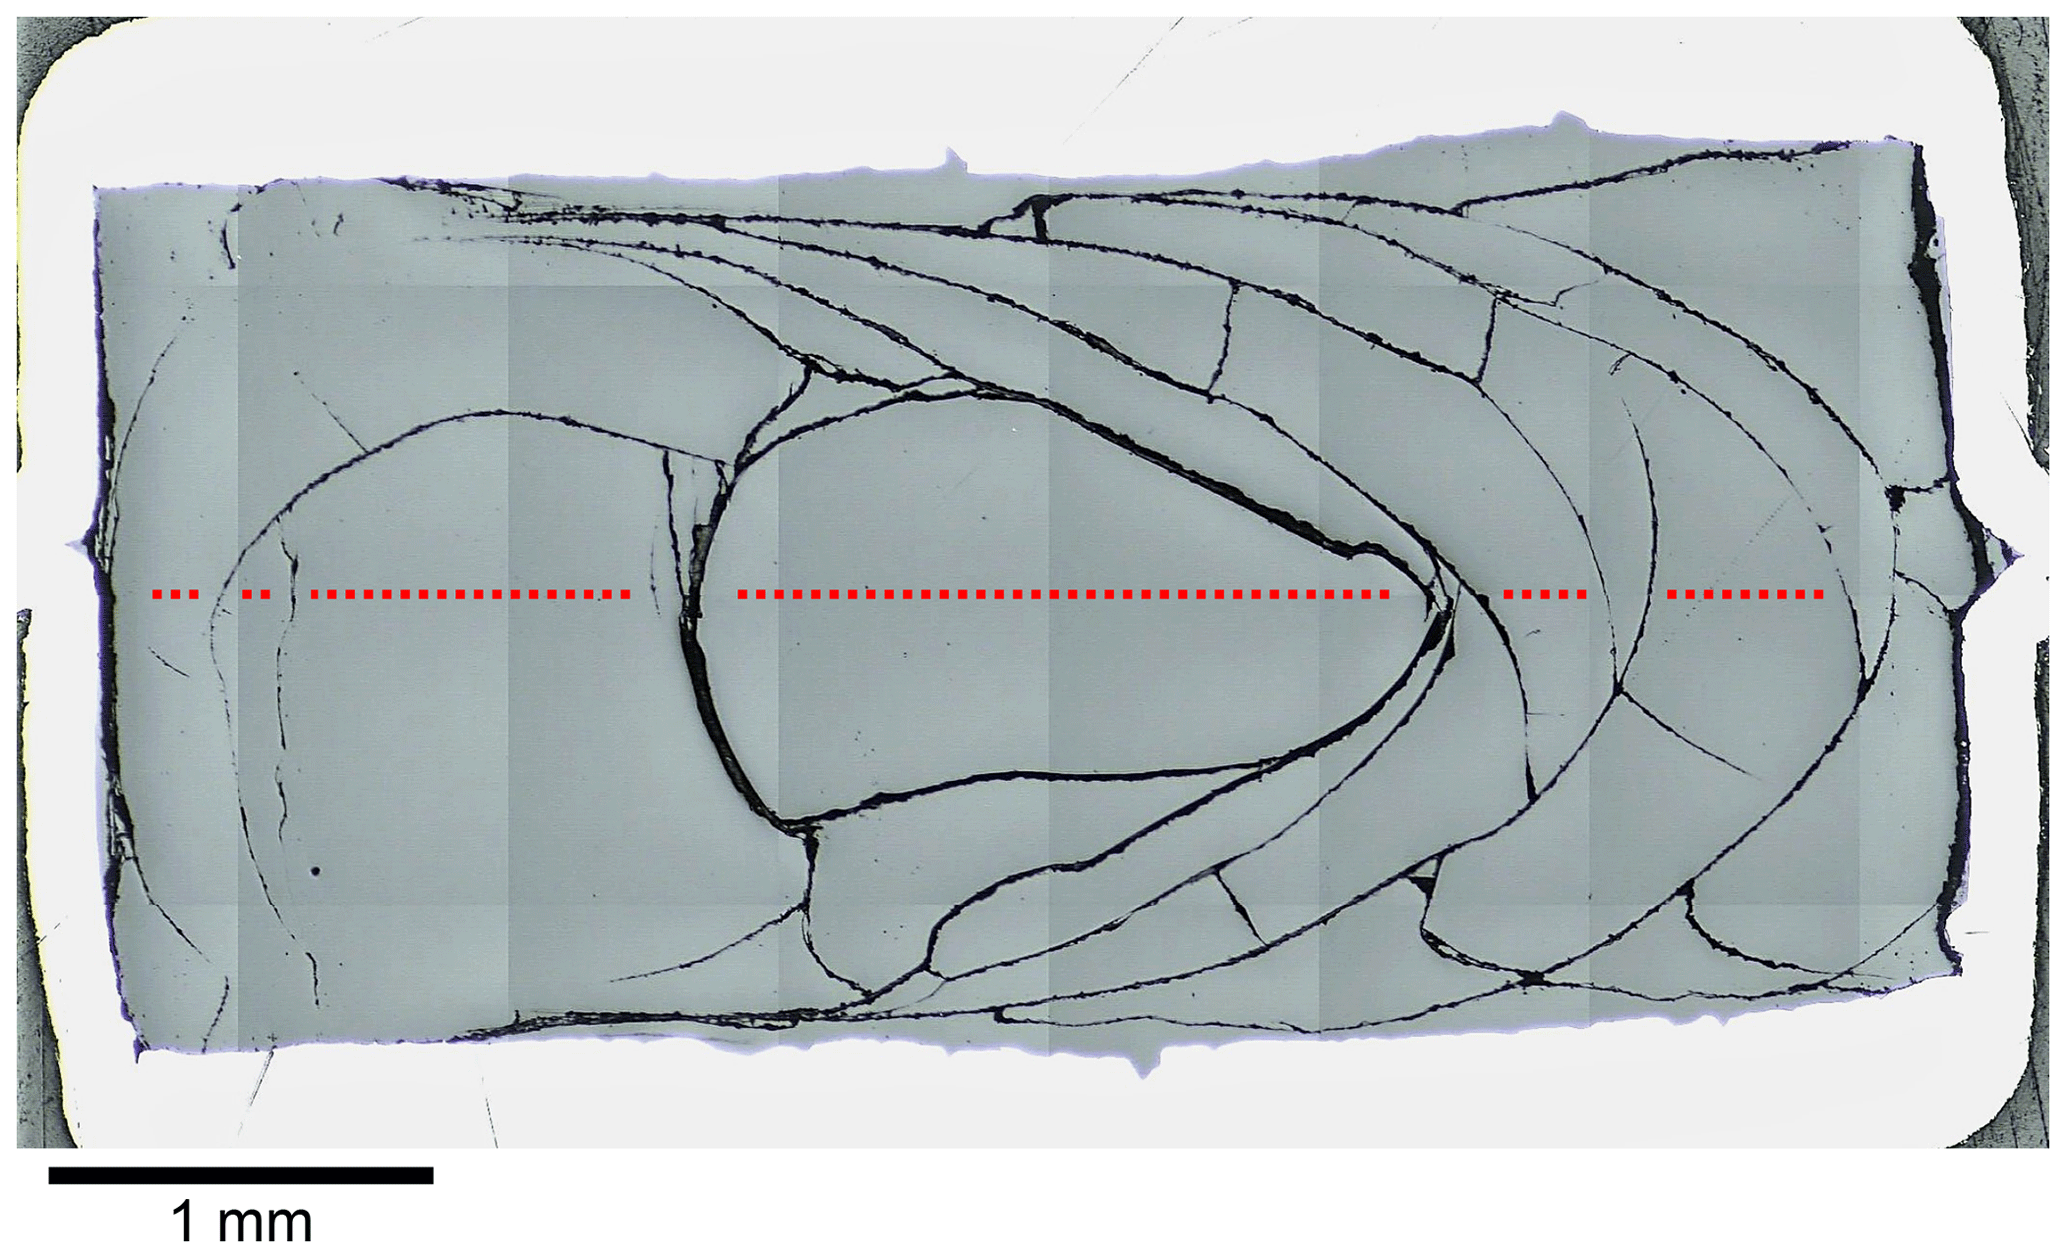
Figure 2Reflected light mosaic image of the diffusion sample LCT-LK-D-d05; the glass has many quench cracks demonstrating the fragility of the sample; the red dotted line schematically displays the diffusion profile that was measured for this sample (size and distance of measuring points are not true to scale); see Fig. 5a for the corresponding diffusion profile.
2.4 Quantification of H2O in the synthesized volatile bearing starting glasses
H2O concentrations of synthesized leucititic glasses were analysed with a Bruker Hyperion 3000 IR microscope attached to a Bruker Vertex 70 FTIR spectrometer. The spectrometer and microscope were constantly flushed with dried air to reduce spectral noise from atmospheric H2O and CO2. The microscope was equipped with a liquid N2 cooled MCT (mercury cadmium telluride) detector covering the mid- to near-infrared spectral range. For quantification, the principles of the Lambert–Beer law were used.
Single glass fragments or slabs cut from the capsules were ground and doubly polished with 1 µm diamond paste. IR spectra were measured in the mid-infrared (MIR) range using a KBr beam splitter and a Globar light source. One hundred scans per spectra were collected with a resolution of 4 cm−1 in the spectral range from 6000 to 600 cm−1. At least three spectra were measured for each sample to obtain an average H2O concentration. The fundamental stretching band of OH at 3570 cm−1 was used for quantification of nominally dry glasses. Here, a two-tangent baseline between 3800 and 2500 cm−1 was applied and the peak height was determined. A molar extinction coefficient of L mol−1 cm−1 was used (based on molar extinction coefficients for basaltic compositions; e.g. Yamashita et al., 1997). Spectra of H2O-rich glasses (hydrous sample series) were also measured with the MIR setup of the spectrometer. They featured the absorption of the combination band of molecular H2O at 5200 cm−1 as well as the absorption of the combination band of OH at 4500 cm−1. Total water concentrations were determined by evaluating both absorption bands. Spectra were corrected using a polynomial baseline that was fitted through the minima of the spectra (for details see Schanofski et al., 2019). The molar extinction coefficients of Schanofski et al. (2019) for the same leucititic composition were used for quantification: L mol−1 cm−1 (H2Omol) and ε4500=0.42 ± 0.02 L mol−1 cm−1 (OH). Sample thicknesses were measured with a Mitutoyo digital micrometre, which has an accuracy of ± 3 µm. Densities were determined using a Mettler Toledo balance equipped with a density determination kit where glass samples were weighted in air and in ethanol.
2.5 Quantification of CO2 in the diffusion samples
CO2 diffusion profiles were measured with the ATR objective of the IR microscope. The ATR method (attenuated total reflection) is based on the interaction between the IR beam and a sample in total reflection (Fahrenfort, 1961). One advantage of this method is that it allows one to analyse samples that reached total absorption in transmission FTIR spectroscopy for the absorption bands of interest. Moreover, no doubly polished sample wafers are required. This becomes relevant when samples contain many cracks and are too brittle to be cut and doubly polished like our leucititic glasses. ATR-FTIR spectroscopy has already been used for the quantification of volatiles in silicate glasses (e.g. H2O: Lowenstern and Pitcher, 2013; CO2: Schanofski et al., 2023) but also for the quantification of H2O and CO2 in apatite (Hammerli et al., 2021).
For an ATR measurement, a crystal with a high refractive index n is pressed onto the sample. The incoming IR beam passes through the ATR crystal and gets totally reflected at the crystal–sample boundary. Here, the IR light interacts with the sample forming an evanescent wave that penetrates the sample. The Bruker ATR objective has a Germanium crystal (n=4.01) with a circular interface (diameter: 100 µm) and a rectangular IR beam size of about 30 by 30 µm. For pressing the Ge crystal onto the sample surface, five different force levels are available.
At first, diffusion couples were cut in half, parallel to the cylinder axis using a WELL 3242 diamond wire saw (wire thickness 130 µm). For each diffusion couple, one half was embedded in epoxy resin, ground using SiC grinding paper (grit size 600, 1200 and 2500) and finally polished with 1 µm diamond paste. The embedded samples were fixed on the IR microscope sample stage using carbon adhesive tape. For determination of CO2 diffusion profiles, line profiles parallel to the direction of diffusion were measured using variable point spacing (30 to 70 µm). Areas with cracks within the glass were avoided since the Ge ATR crystal can be harmed by roughness (Fig. 2). Consequently, diffusion profiles often showed gaps because of the quench cracks in the leucititic glasses. Zero time samples were prepared and analysed similar to normal diffusion samples. The analyses were performed in the MIR range using a KBr beam splitter. For each spectrum, 32 scans with a resolution of 4 cm−1 were collected in the range from 4000 to 600 cm−1. All measurements were performed using force level 3, corresponding to about 5 N. The background was measured repeatedly after every fourth point analysis using the same analytical conditions.
All ATR spectra featured a carbonate doublet between 1600 and 1300 cm−1. Evaluation was done using the quantification method of Schanofski et al. (2023): the spectra were corrected by a two-tangent baseline and the peak height of the 1430 cm−1 CO absorption band was determined accordingly (Fig. 3). The 1430 cm−1 absorption band was always used for evaluation because the 1510 cm−1 absorption band can be influenced by the absorption of the bending vibration of molecular H2O at 1640 cm−1. Since the peak height also depends on the contact between ATR crystal and the sample surface, the absorption was normalized to the peak area of the absorption band of tetrahedral coordinated cations T–O (with T = Si4+, Al3+, Fe3+) at 970 cm−1, which represents the aluminosilicate network. Here, a two-tangent baseline with base points at 1200 and 790 cm−1 was applied (Fig. 4). More details on the normalization procedure can be found in Schanofski et al. (2023). The total CO2 concentration can then be calculated using the correlation coefficient of Schanofski et al. (2023) according to
where is the concentration of CO2 in wt %, A1430 is the absorption of the carbonate band at 1430 cm−1 and Int970 is the integral of the T–O band at 970 cm−1.
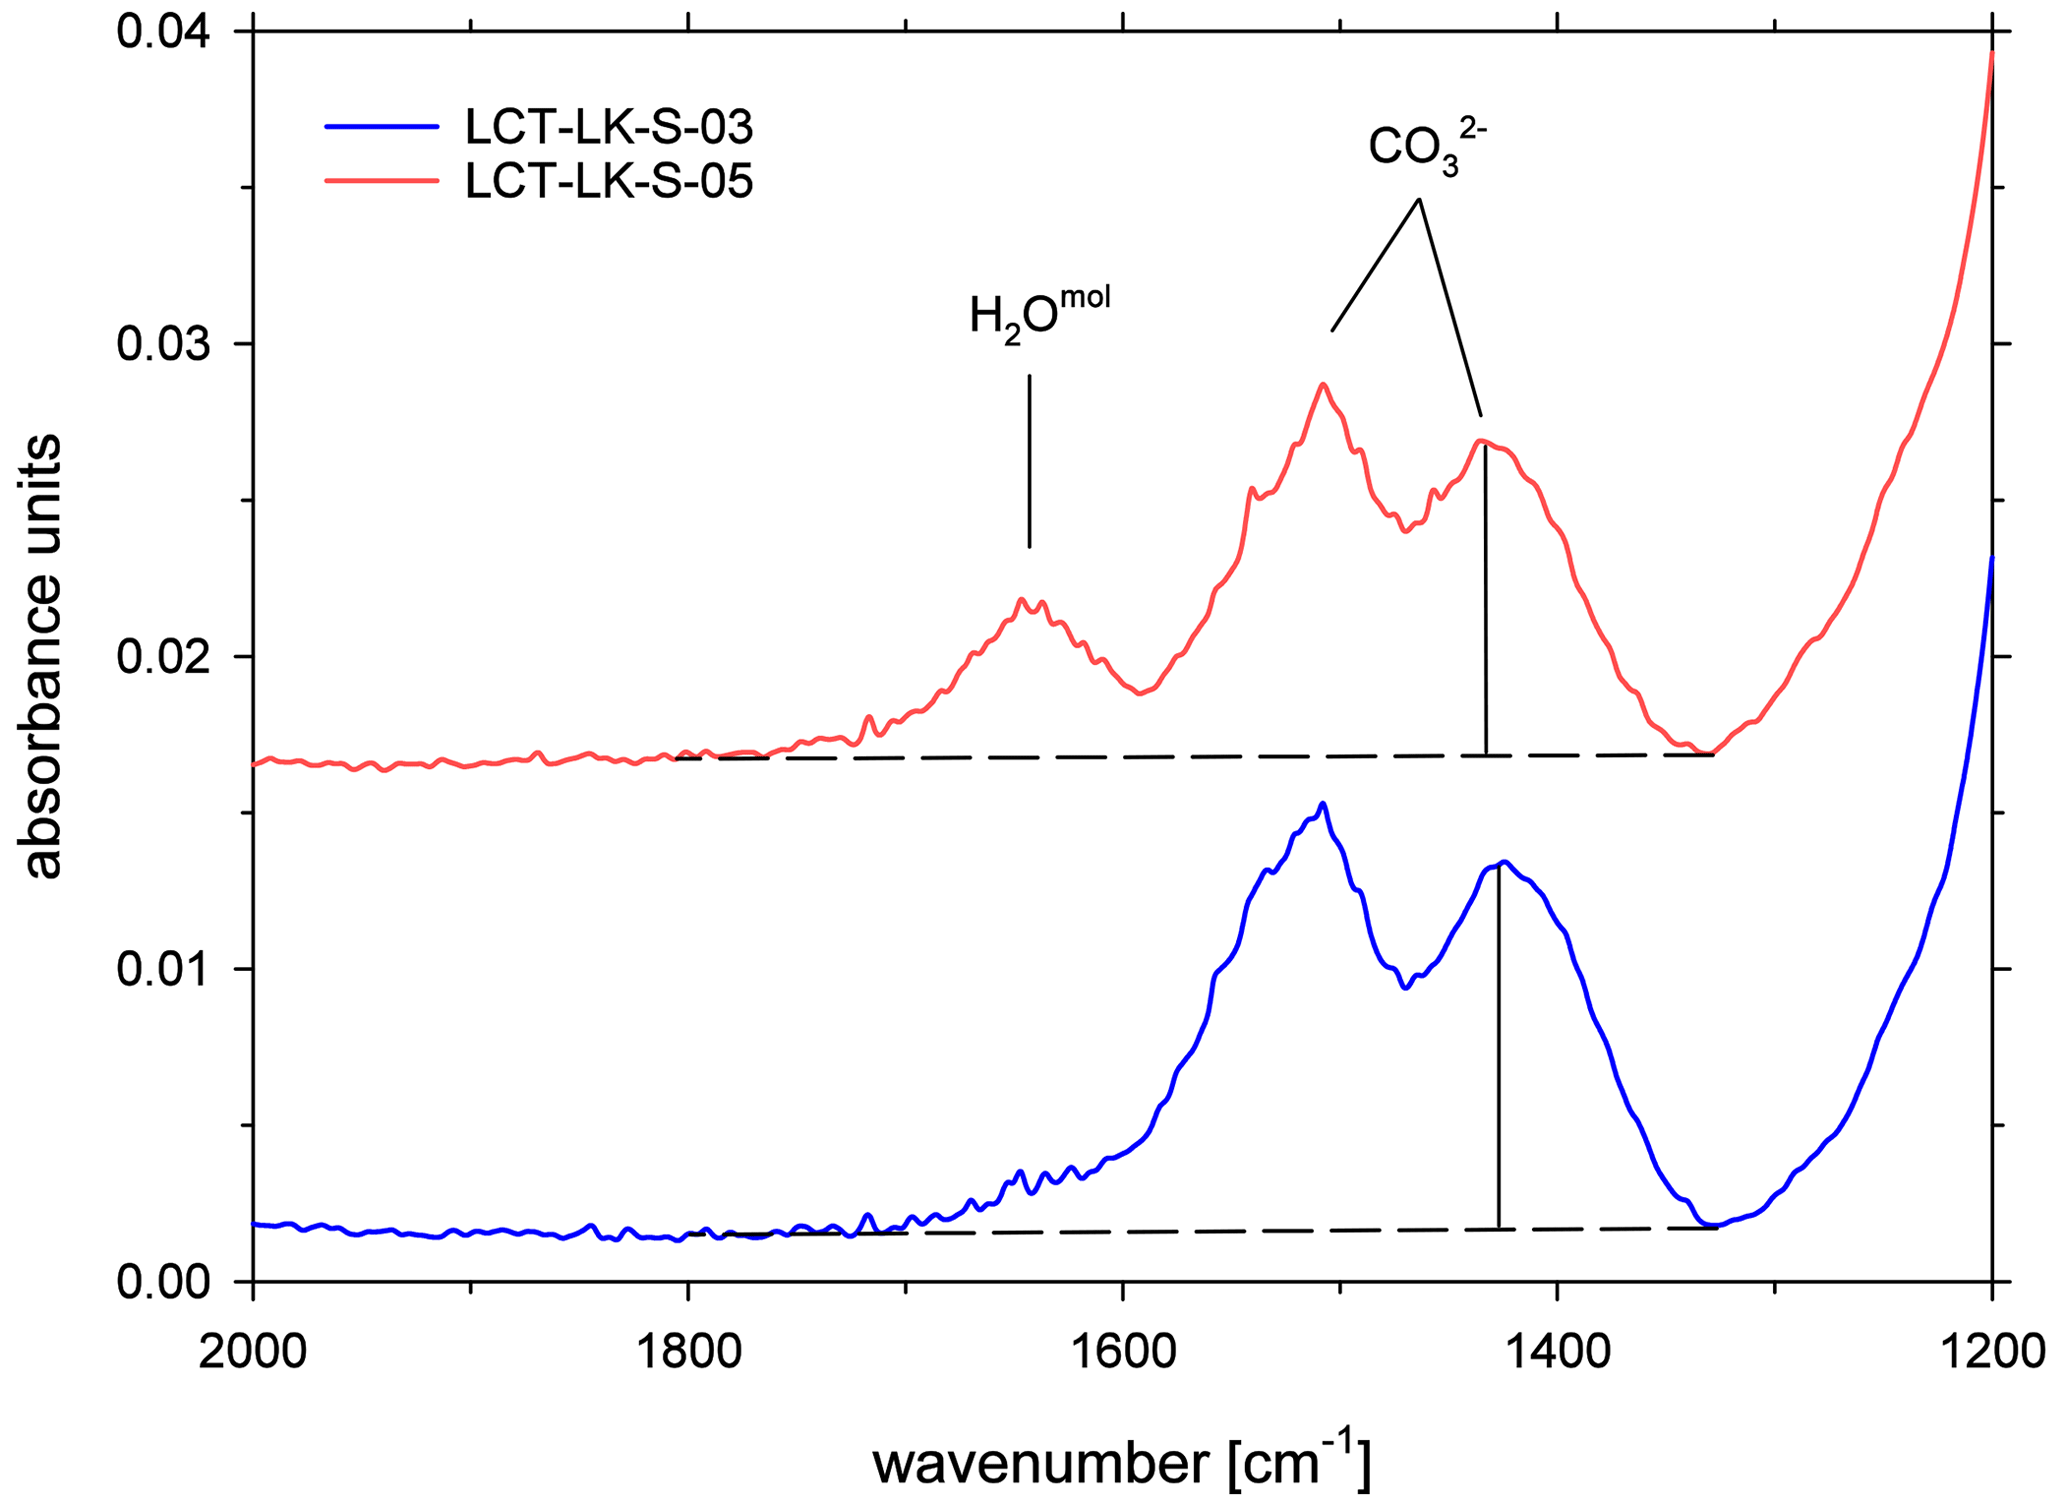
Figure 3ATR-FTIR spectra of CO2-rich glasses (LCT-LK-S-03: anhydrous; LCT-LK-S-05: hydrous); the dashed lines mark the TT baselines that were applied to evaluate the peak heights of the carbonate doublet; spectra are offset for clarity.
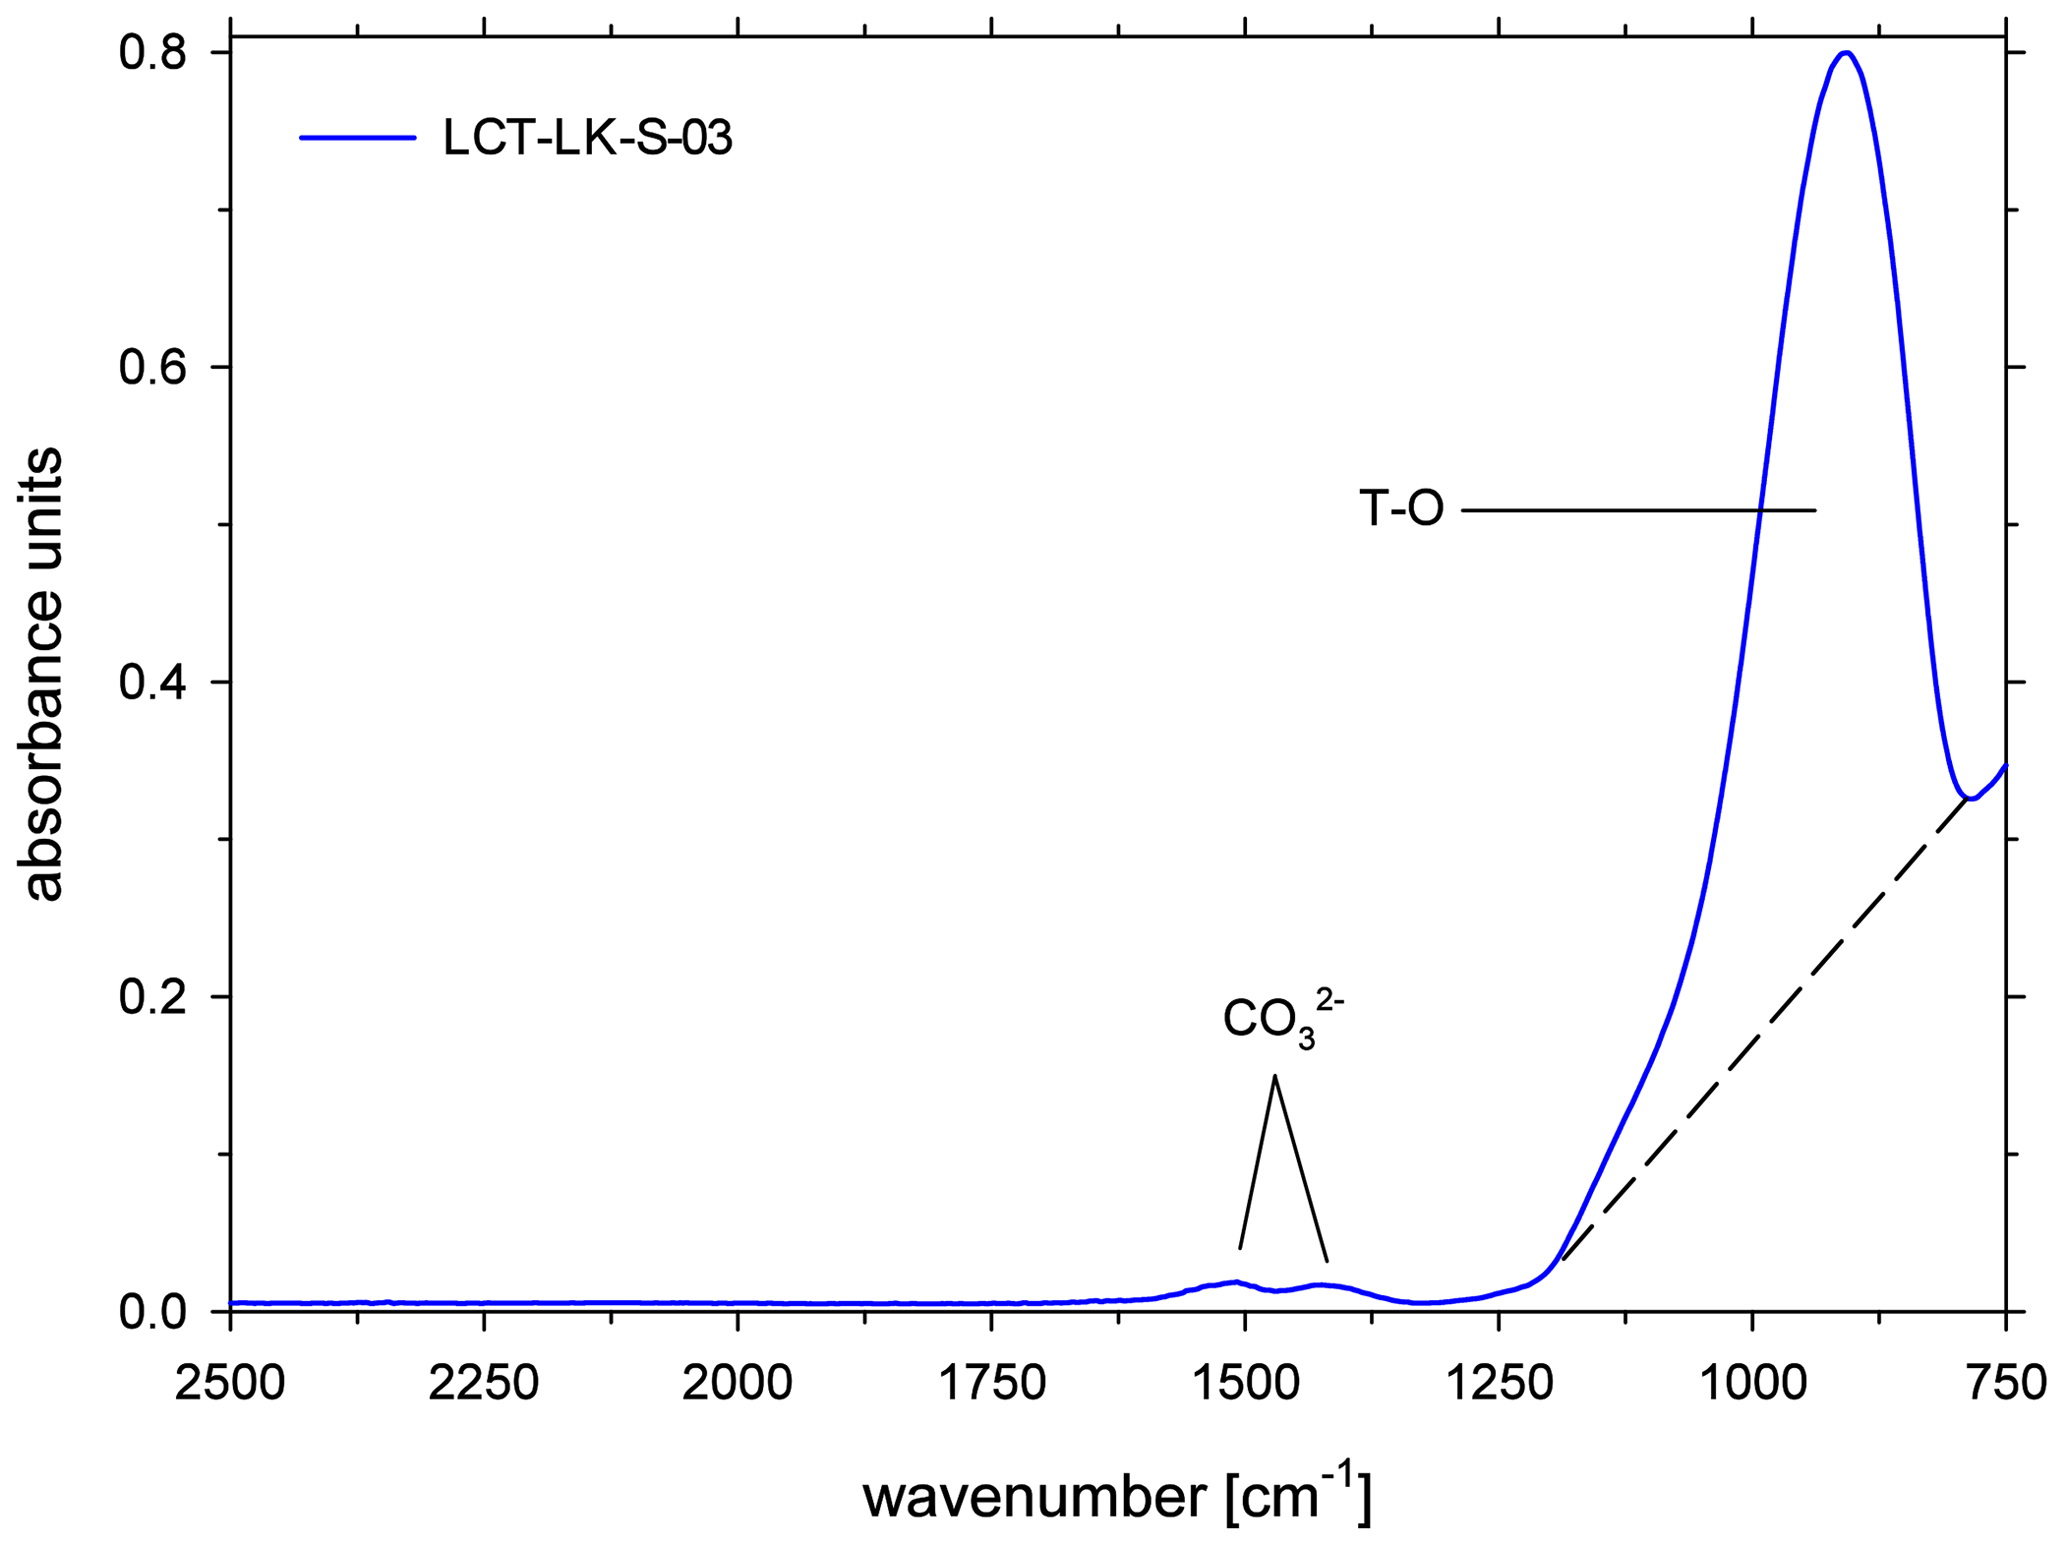
Figure 4ATR-FTIR spectra of CO2-rich, anhydrous glass; the dashed lines mark the TT baseline that was applied to integrate the peak area of the T–O band for normalization.
3.1 Evaluation of diffusion profiles
For every diffusion sample, CO2 concentration vs. distance plots were compiled based on the ATR measurements. Since CO2 diffusion is independent from its total concentration (Watson et al., 1982) and the concentration vs. distance plots showed a symmetrical shape, diffusion could be described by the equation for concentration independent diffusion in a semi-infinite medium (Crank, 1975)
where C(x, t) is the concentration of CO2 in wt % at an x-coordinate x in mm after a time t in s, Clow is the CO2 concentration in the CO2-poor medium in wt % at t0, Chigh is the CO2 concentration in the CO2 enriched medium in wt % at t0, x0 is the x coordinate of the contact plane of both media in mm and D is the diffusion coefficient in mm2 s−1. The software Table Curve 2D Version 5.01 (Systat Software Inc.) was used for fitting the diffusion profiles using Eq. (4):
The software determines the best fitting numeric values for the parameters a, b, c and d. Finally, the fit parameter d provides the diffusion coefficient D through Eq. (5):
The obtained fit parameter and calculated diffusion coefficients are given in Table 3. Figure 5a and b exemplarily show concentration vs. distance plots for an anhydrous and hydrous diffusion experiment. All diffusion profiles are compiled in the supplementary material (Figs. S1–S17).
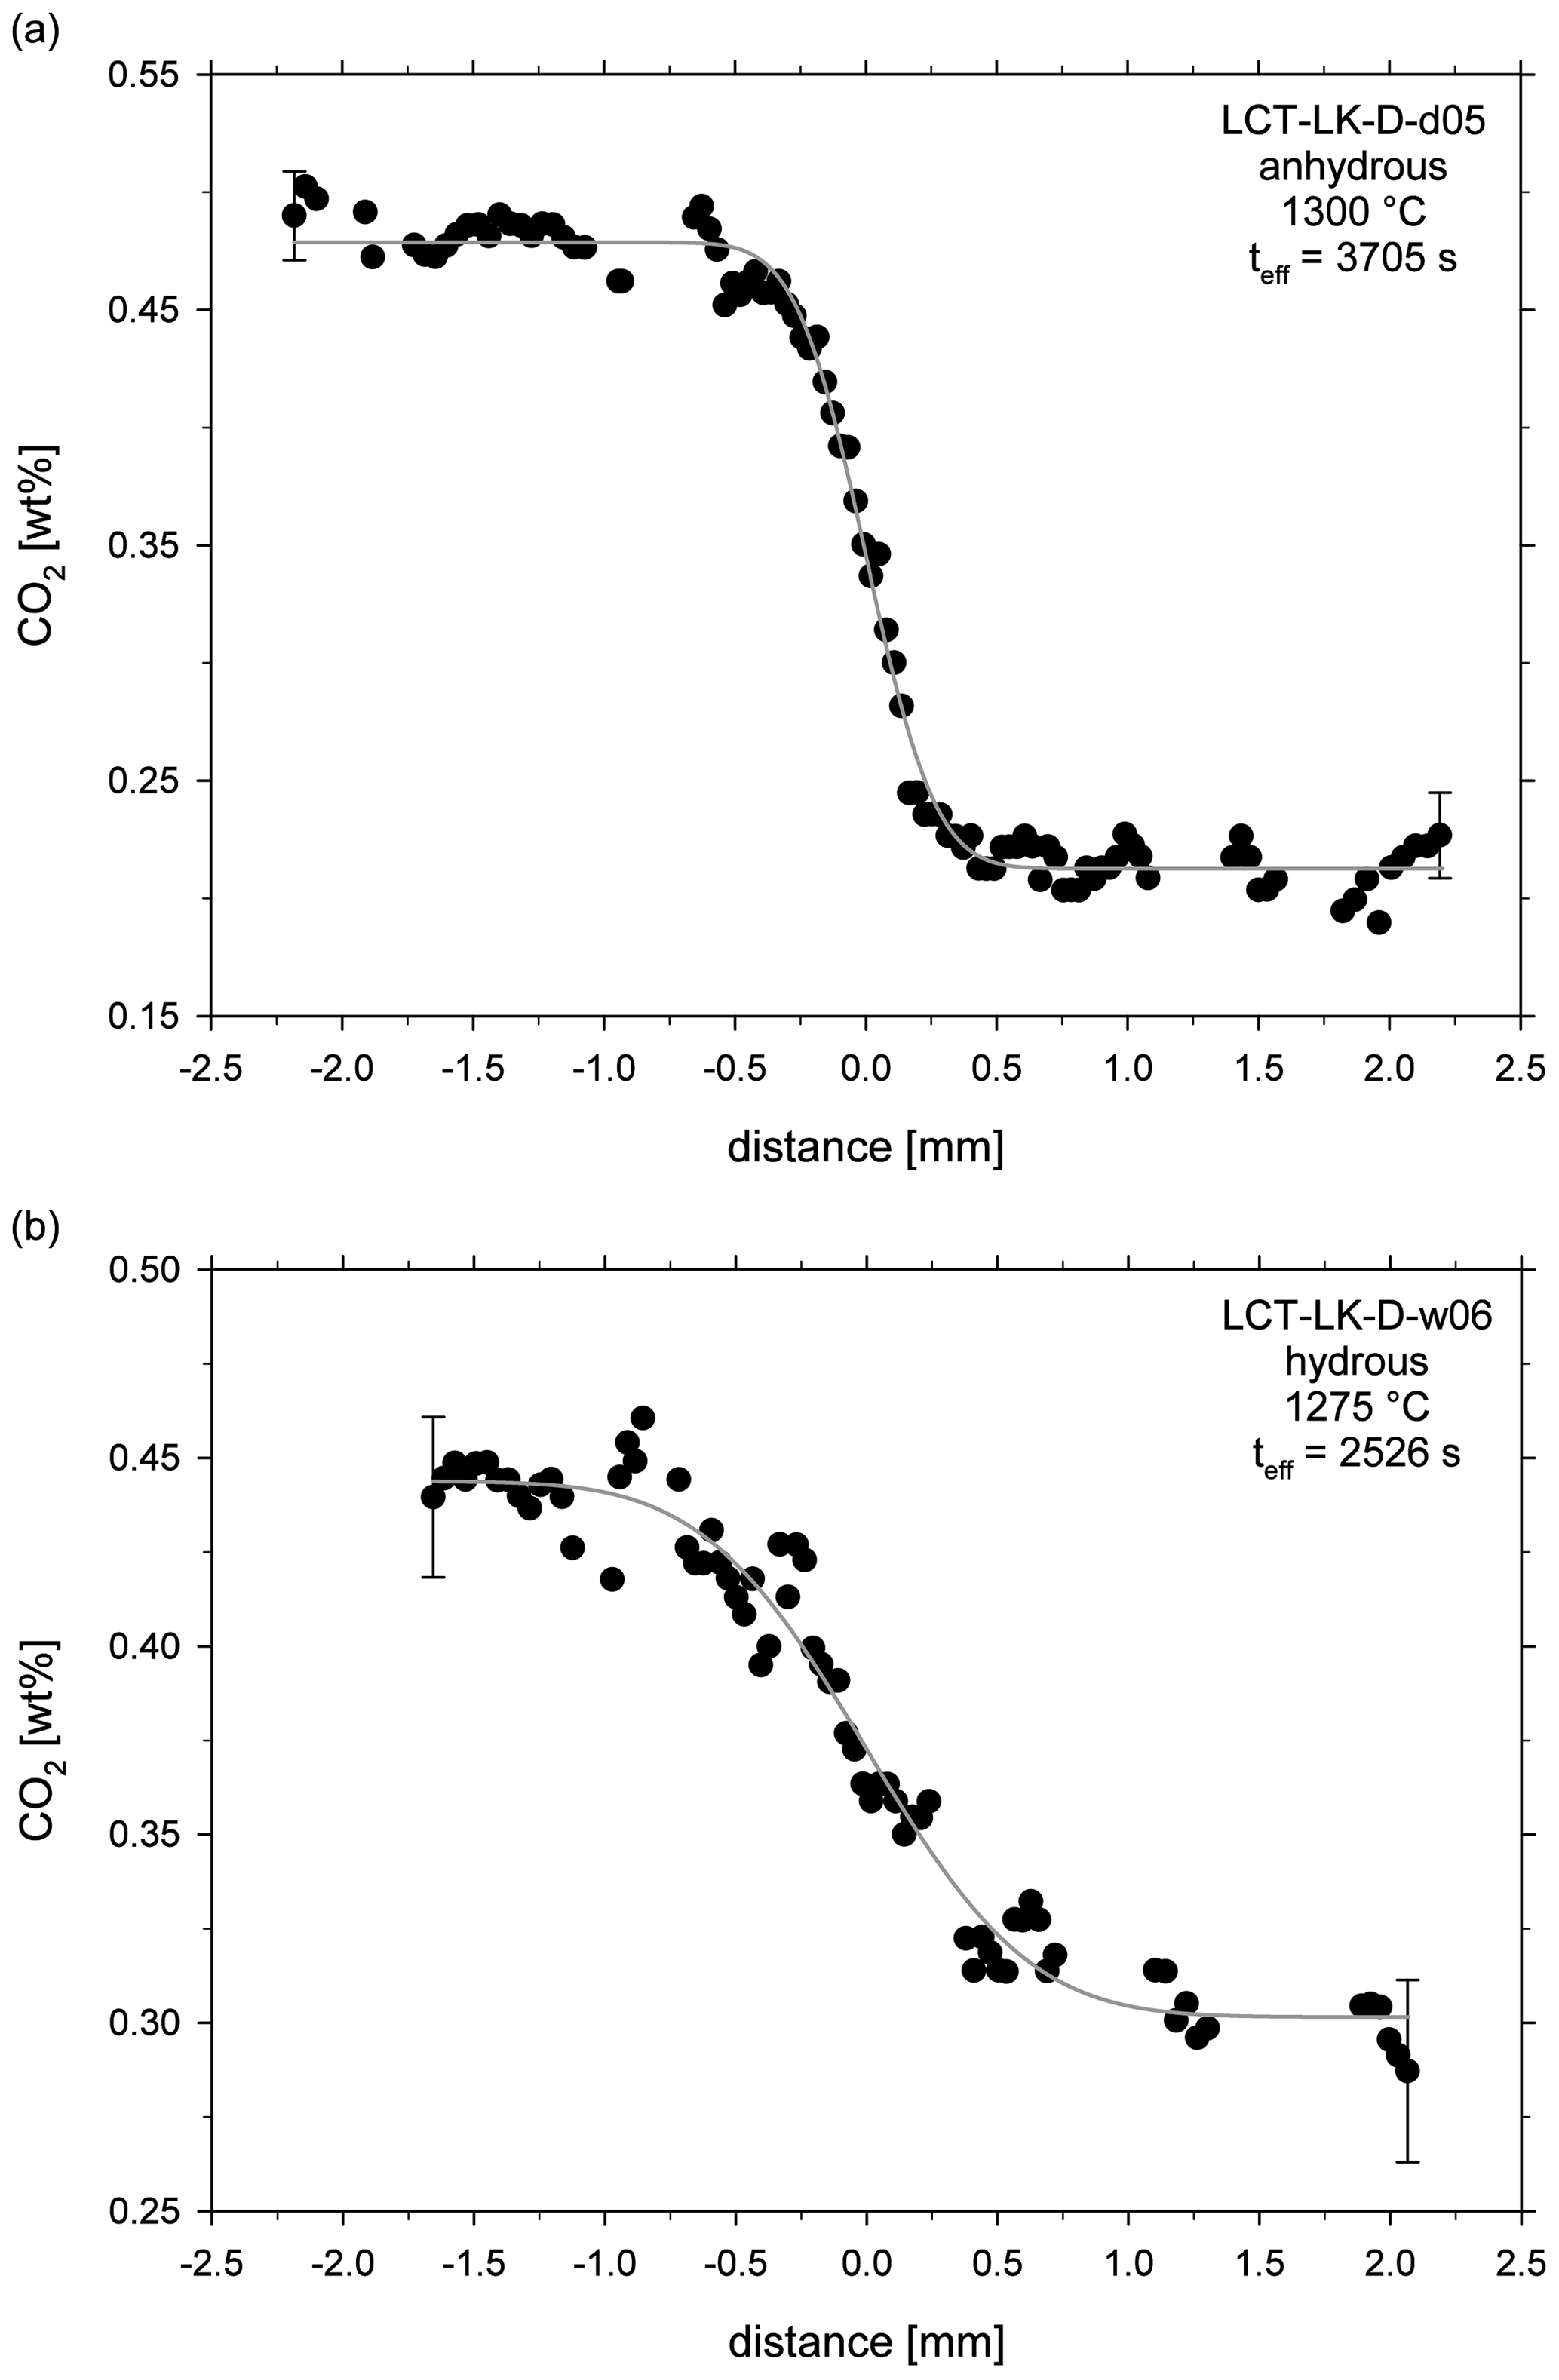
Figure 5CO2 diffusion profiles of (a) an anhydrous diffusion sample (LCT-LK-D-d05) and (b) a hydrous diffusion sample (LCT-LK-D-w06); distance = 0 mm marks the initial contact plane of the melts; the grey lines represent the fitted complementary error functions from which the diffusion coefficients were extracted; error bars are representative for 2σ errors of repeated measurements.
Table 3Experimental conditions and results of the CO2 diffusion experiments.
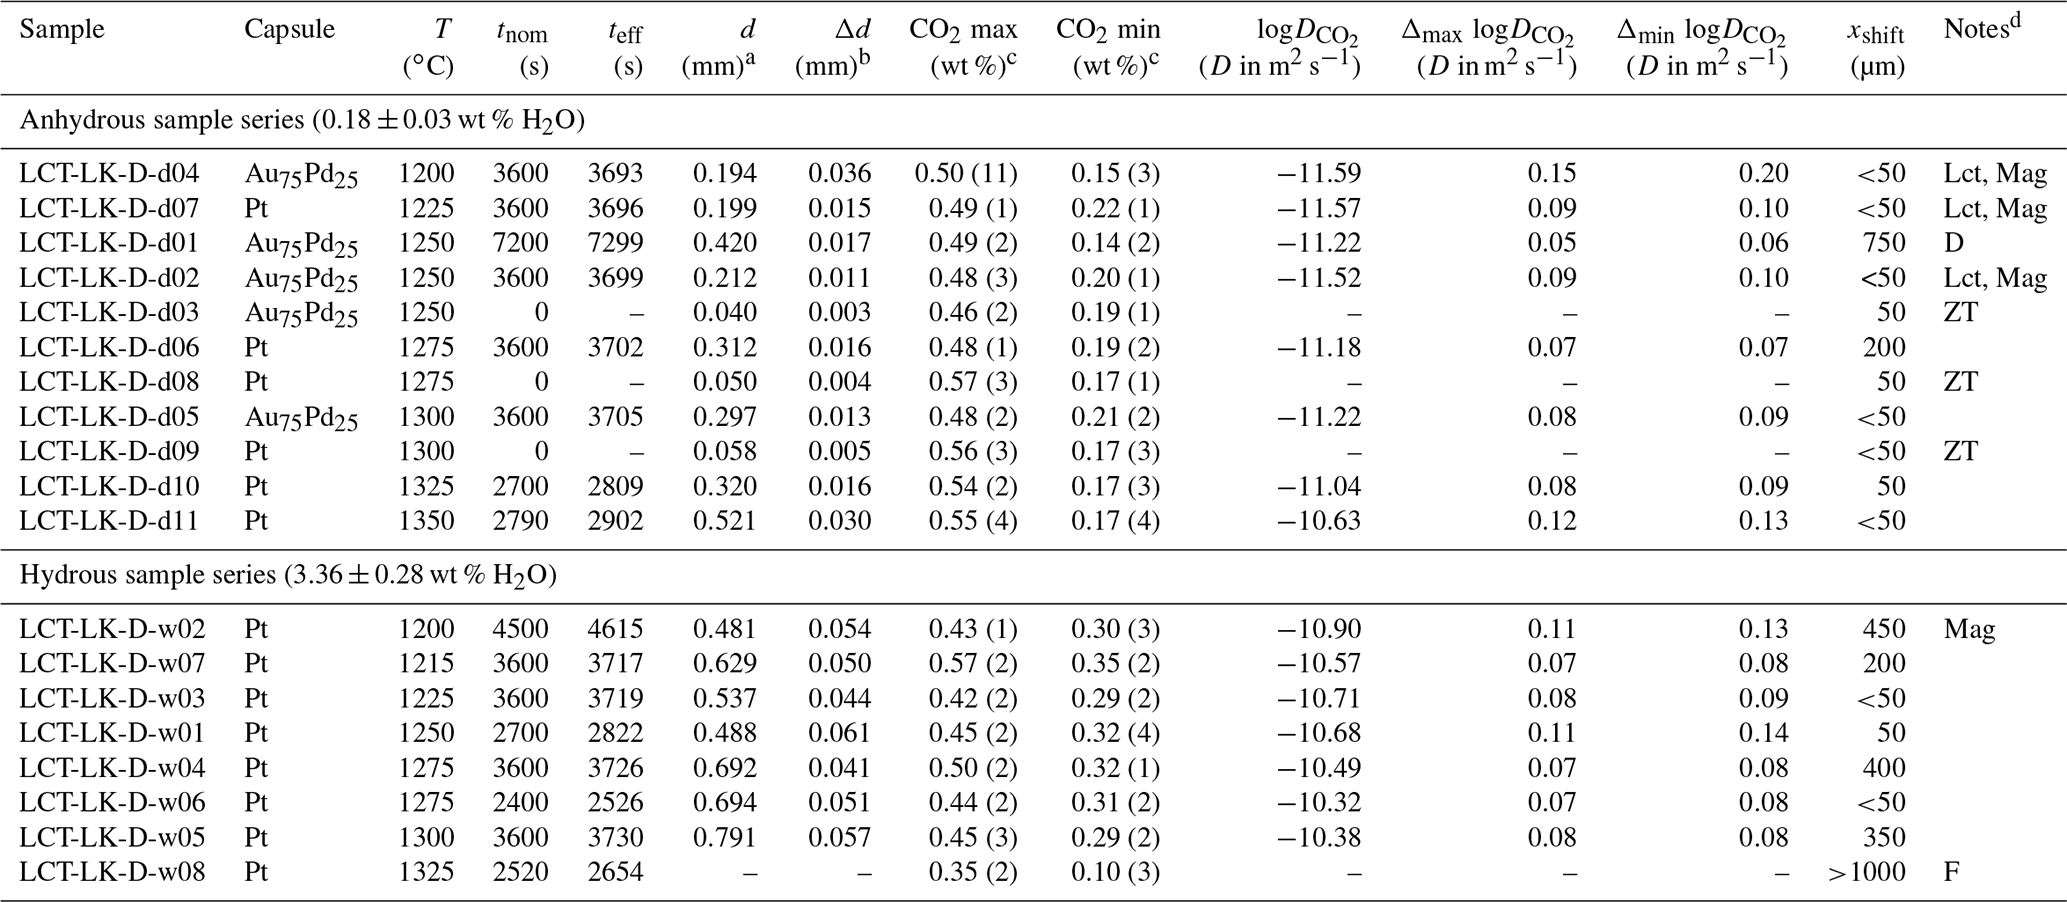
a Diffusion profile fit parameter from which D is calculated (see Eqs. 4 and 5). b Standard error of the fit parameter d which is used for error calculation (see Sect. 3.3). c CO2 max and CO2 min determined from average CO2 values in CO2-rich and CO2-poor parts of diffusion couples; 2σ of repeated measurements given in parentheses (last decimals). d D: discarded experiment; Lct: leucite; Mag: magnetite; ZT: zero time experiment; F: failed experiment (D is not determinable).
3.2 Correction of the heating time
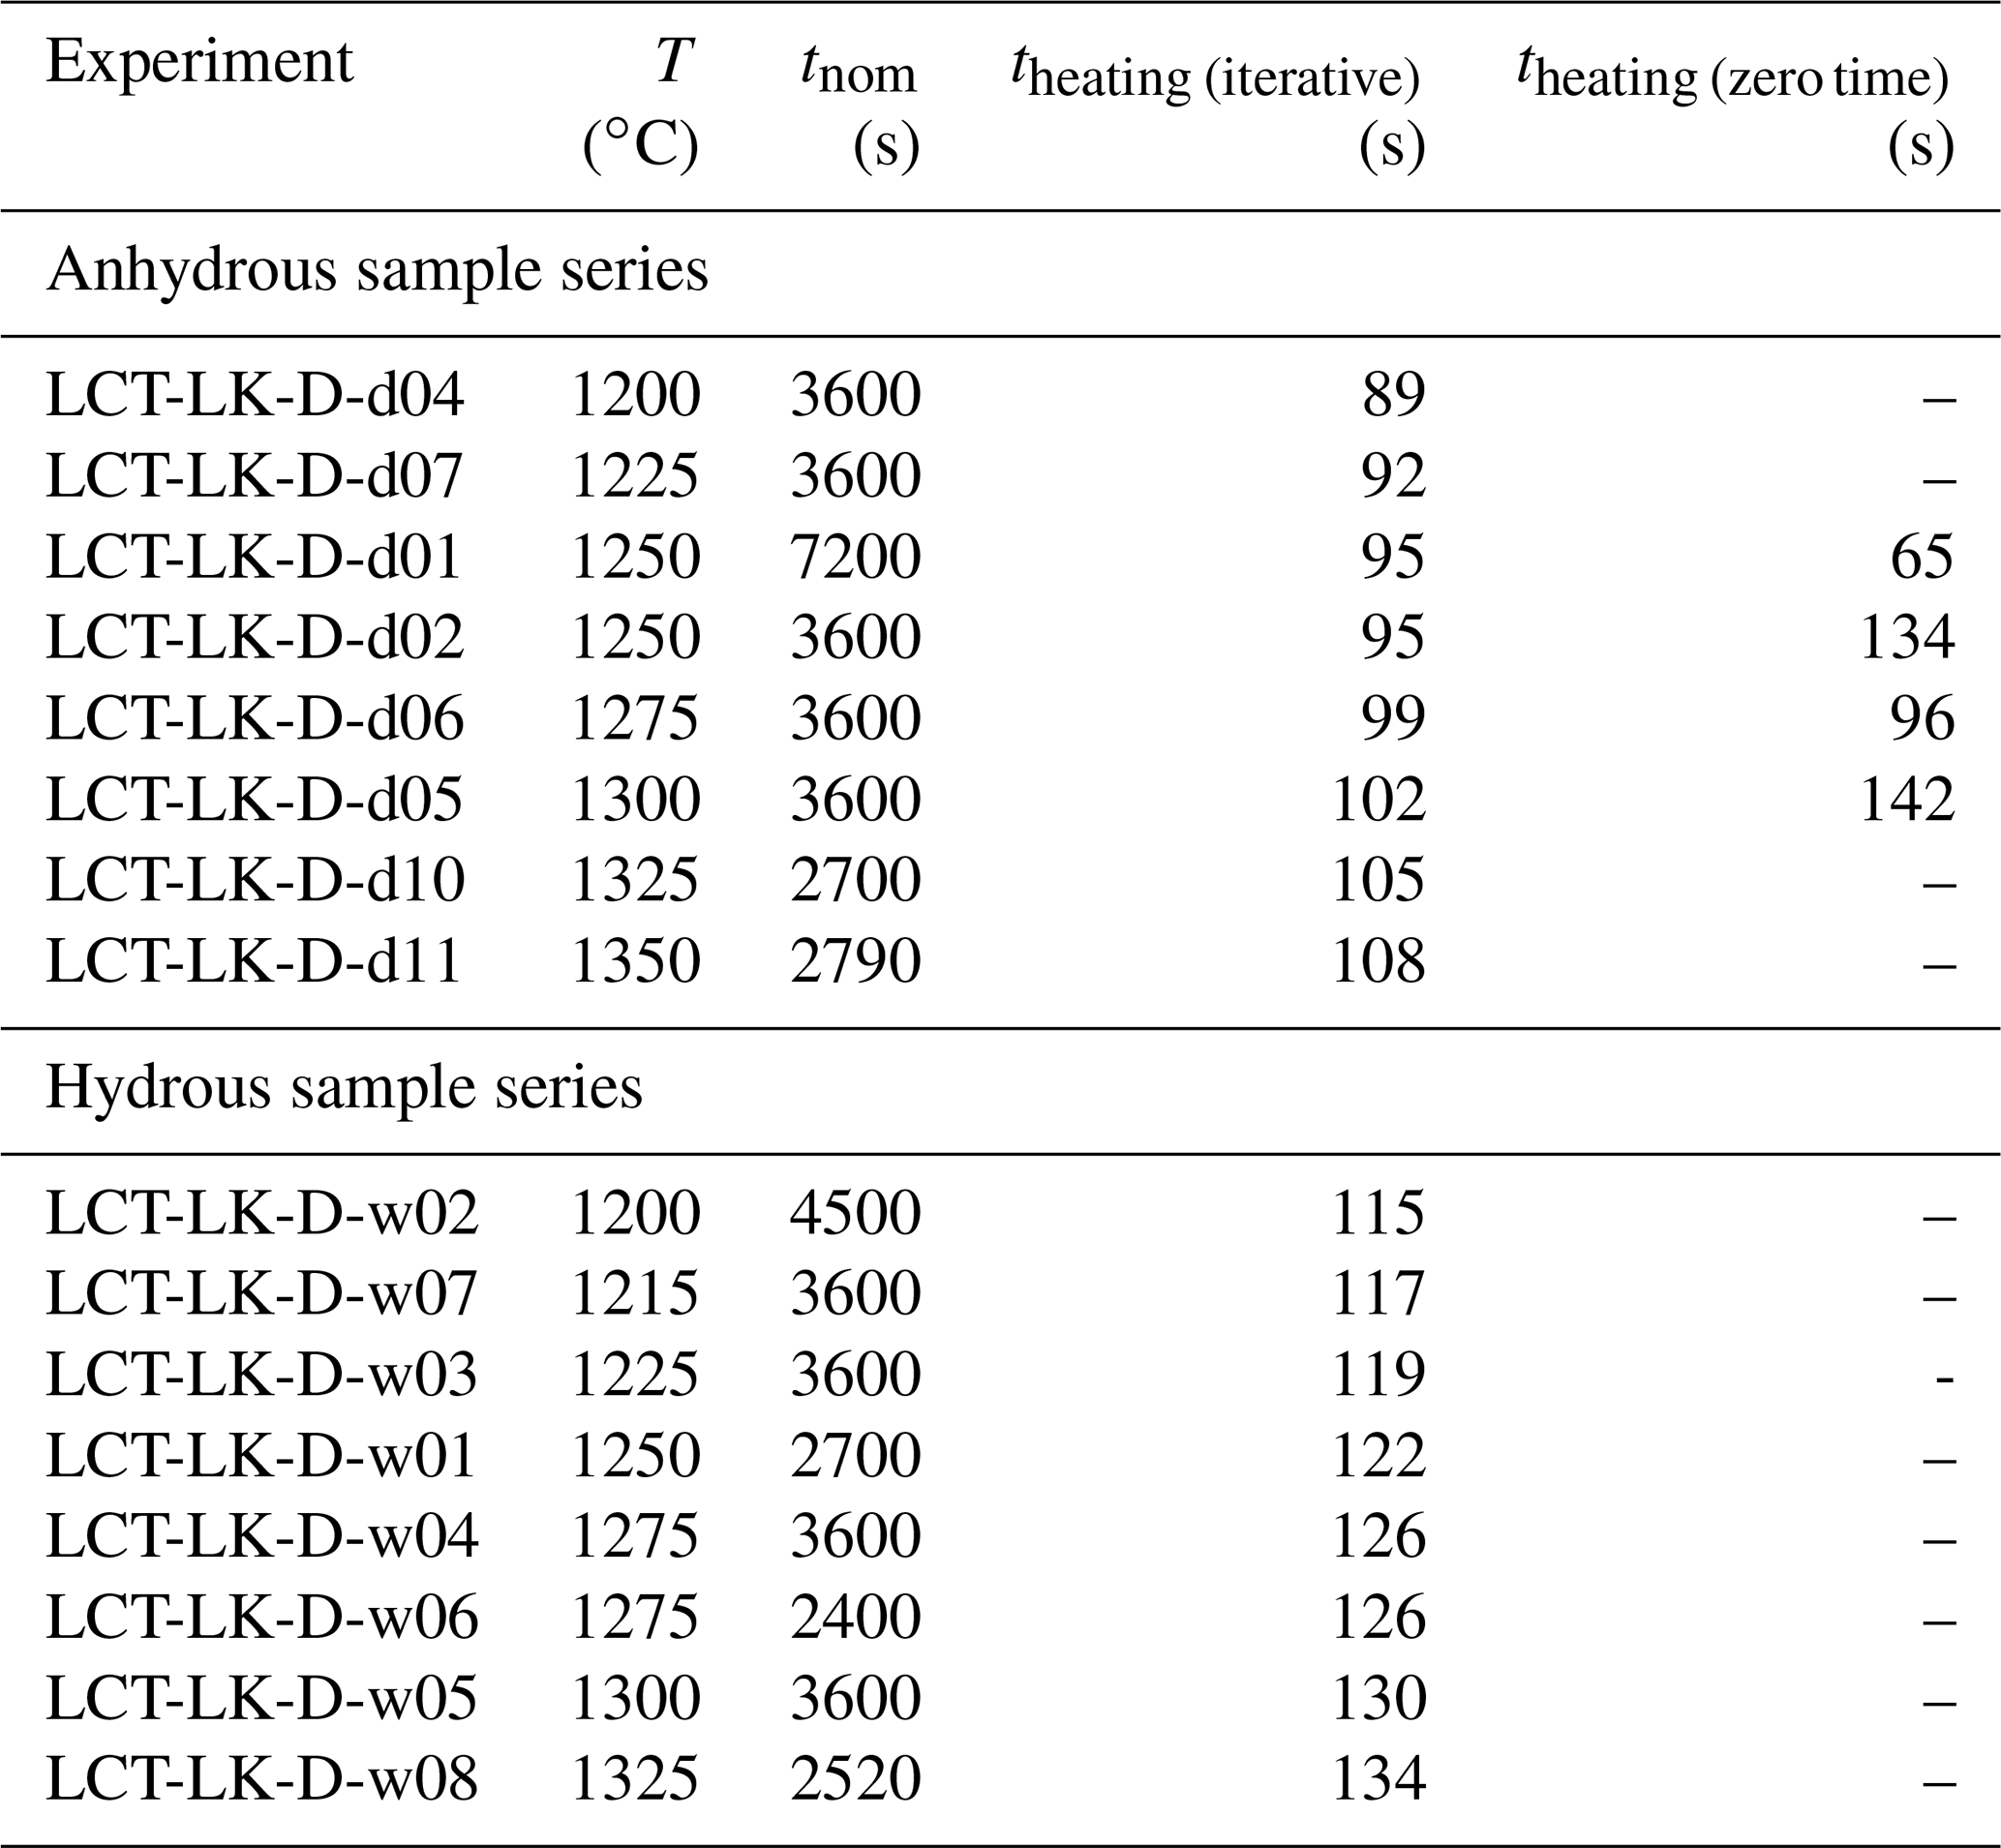
Diffusion already occurs during the heating process in the IHPV before the targeted temperature is reached and the nominal run-time tnom is recorded. The effective time of diffusion during the heating process theating was therefore calculated for every diffusion experiment with an iterative procedure described by Nowak and Behrens (1997). However, instead of using the experimentally determined diffusion coefficients in the final calculation step, the diffusion coefficients were extracted from the preliminary Arrhenius equations (based on diffusion coefficients that are not corrected for the heating time). By this, the results are not biased by the deviations of each diffusion coefficient from the Arrhenius equation and the calculated theating values increase with increasing experimental temperature. The calculation procedure was only performed once because further iterations only caused insignificant changes in theating and D respectively.
The validity of the iterative procedure was furthermore tested with the zero time experiments for the anhydrous sample series. The diffusion profiles of these zero time samples were also fitted with Eq. (4) to obtain the d parameter (see supplementary material for zero time profiles). The zero time approach is based on the relation between the length of a diffusion profile and the effective run-time of the experiment (Zhang and Behrens, 2000). This relation is expressed by
where ddiff is the d parameter obtained from the diffusion profile of a normal diffusion experiment with the nominal run-time tnom in s; d0 is the d parameter from the zero time experiment at the same temperature, pressure and heating rate; and theating is the diffusion time during heating and cooling in s. Therefore, theating can be calculated
As a result, theating was obtained for three experimental temperatures (1250, 1275 and 1300 ∘C). These experimentally determined values were in good agreement with the iteratively obtained values (same order of magnitude; maximum deviation of 40 s; see Table 4). The theating values from the iterative procedure were finally used to correct all diffusion coefficients by adding theating to the nominal run-time tnom of the initial experiment (resulting in teff) and recalculating the diffusion coefficient using Eq. (5).
Table 4Determined diffusion times of the IHPV heating process.
3.3 Calculation of errors
Errors of determined diffusion coefficients are based on the uncertainties of different experimental and analytical parameters. For estimating the absolute errors of the diffusivities, the mathematical approach of Böhm and Schmidt (2013) was used. In total, four relevant error sources were considered. For the effective run-time teff of all diffusion experiments, an uncertainty of ± 60 s was assumed. Another uncertainty is based on the mathematical fit of the diffusion profiles. The error is represented by the standard error Δd of the fit parameter d which is given by the fitting software individually for every profile. An uncertainty in temperature ΔT of ± 10 ∘C was assumed for every diffusion experiment. A fourth error source is given by the uncertainty of the length of a diffusion profile. If the measured profile is not strictly parallel to the direction of diffusion or if the initial cutting and polishing were already oblique to the direction of diffusion, it will result in an overestimation of the diffusion coefficient because the distance of the measured profile is elongated. This error source only affects the negative error of D since the length of the measured profiles is always longer than the length of an ideal profile. A maximum deviation of 10∘ between the measured profile and the actual diffusion direction was assumed.
New absolute diffusion coefficients were calculated using minimum and maximum values of teff and d for every diffusion profile using Eq. (5). The effect of uncertainty in temperature on the diffusion coefficient was estimated using the constructed Arrhenius equation. Here, maximum and minimum values for D were calculated for every diffusion experiment by extracting such diffusion coefficients for minimum and maximum temperatures. To evaluate the uncertainty in diffusion profile length, the distances of all diffusion profiles were recalculated and finally all profiles were refitted. As a result, a new d parameter was obtained from which new minimum diffusion coefficients were calculated with Eq. (5). By this, three maximum and four minimum diffusion coefficients were obtained for every diffusion experiment (individual errors given by the difference between these coefficients and the initial diffusion coefficients). Finally, positive and negative errors (ΔmaxD and ΔminD) were calculated by error propagation (given as logarithmic values in Table 3). As described above, all these calculations were done for every experiment and every diffusion coefficient respectively.
4.1 Synthesis experiments
The dry leucititic glasses were not completely water free. Due to the adsorption of atmospheric water on the starting materials (glass powder and silver oxalate), small amounts of water were added to the capsules. Moreover, water is formed by reduction of iron during the experiment because of the presence of hydrogen within the autoclave (e.g. Botcharnikov et al., 2006). The determined H2O concentrations in the synthesized glasses are given in Table 2. The nominally dry sample series showed an averaged water content of 0.18 ± 0.03 wt %. Water concentrations of water bearing samples were higher than the amount of water originally loaded into the capsules. Again, adsorption of water on the starting materials and reduction of iron by hydrogen increased the total H2O concentration. Moreover, a discrepancy in water content between both water enriched glasses was found: LCT-LK-S-06 (CO2-poor) showed about 3000 ppm more total H2O. This results in an averaged water concentration of 3.36 ± 0.28 wt % for diffusion couples of the hydrous sample series.
Maximum and minimum CO2 concentrations obtained from diffusion profiles should represent the CO2 concentrations of the CO2-rich and CO2-poor starting glasses from synthesis experiments. Since different starting concentrations in diffusion couples from the same starting glass were detected, CO2 was not homogenously distributed within the capsules of the synthesis experiments. Higher concentrations were detected in diffusion couples that consisted of glass blocks from the upper part of the synthesis capsules (the upper part corresponds to the capsule part that faced upward in the IHPV). This implies that the experimental time for synthesis experiments (3 to 4 d) was not sufficient to completely homogenize CO2 in the melt at fluid undersaturated conditions. Consequently, CO2 concentrations of the synthesized glasses are not given as average values but the individual starting CO2 concentrations for each diffusion experiment are listed in Table 3.
Sierralta et al. (2002) found a zoning of CO2 and H2O in glasses synthesized in Pt capsules. H2O was enriched at the capsule rims, whereas CO2 was enriched in the capsule centre. In contrast to this, no such zoning of CO2 and H2O was observed in our samples. Both volatiles showed a homogeneous distribution in the glasses within error. Pt-jacketed glass cylinders were therefore suitable for diffusion experiments.
Considering the experimental duration of 91 to 100 h for synthesis experiments in Pt capsules and the high initial iron concentration of the starting glass, loss of iron from the melt to the platinum of the surrounding capsule was expected. μ-XRF analyses confirmed that a fraction of iron was lost during synthesis experiments of dry melts in Pt capsules. Fe2O3 concentrations of 9.57 ± 0.09 wt % and 9.66 ± 0.05 wt % were determined for LCT-LK-S-03 and LCT-LK-S-04 (initial Fe2O3 concentration: 10.69 ± 0.06 wt %). Contrarily, no decrease in Fe2O3 was measured for hydrous glasses in Pt capsules using μ-XRF. Furthermore, no iron gradients between capsule centre and capsule wall were detected for dry and hydrous glasses, indicating that a steady state was reached during the experiments. Further iron loss during diffusion experiments is unlikely due to the short experimental duration and the apparent steady state between iron concentration of melt and capsule material.
4.2 Diffusion couple experiments
For the nominally dry and hydrous melt series, seven valid diffusion coefficients were obtained each. The diffusion coefficient from experiment LCT-LK-D-d01 (anhydrous; 1250 ∘C) was not used for further evaluation because of the large melt movement and the associated error source (see discussion of error sources in Sect. 5.1). Experiment LCT-LK-D-w08 (hydrous; 1325 ∘C) is considered as a fail because no diffusion coefficient could be determined from the concentration profile due to convection and the resulting melt movement as well as bubble formation.
Figure 6 shows the diffusion coefficients (logD) plotted as a function of inverse temperature (Arrhenius diagram). For both sample series, CO2 diffusivity increases with increasing temperature. The addition of 3.36 wt % H2O has an accelerating effect on CO2 diffusion in the leucititic melt. For instance, CO2 diffusivity is 0.75 log units faster in the hydrous melt (3.36 ± 0.28 wt % H2O) compared to the nominally dry melt (0.18 ± 0.03 wt % H2O) at 1300 ∘C.
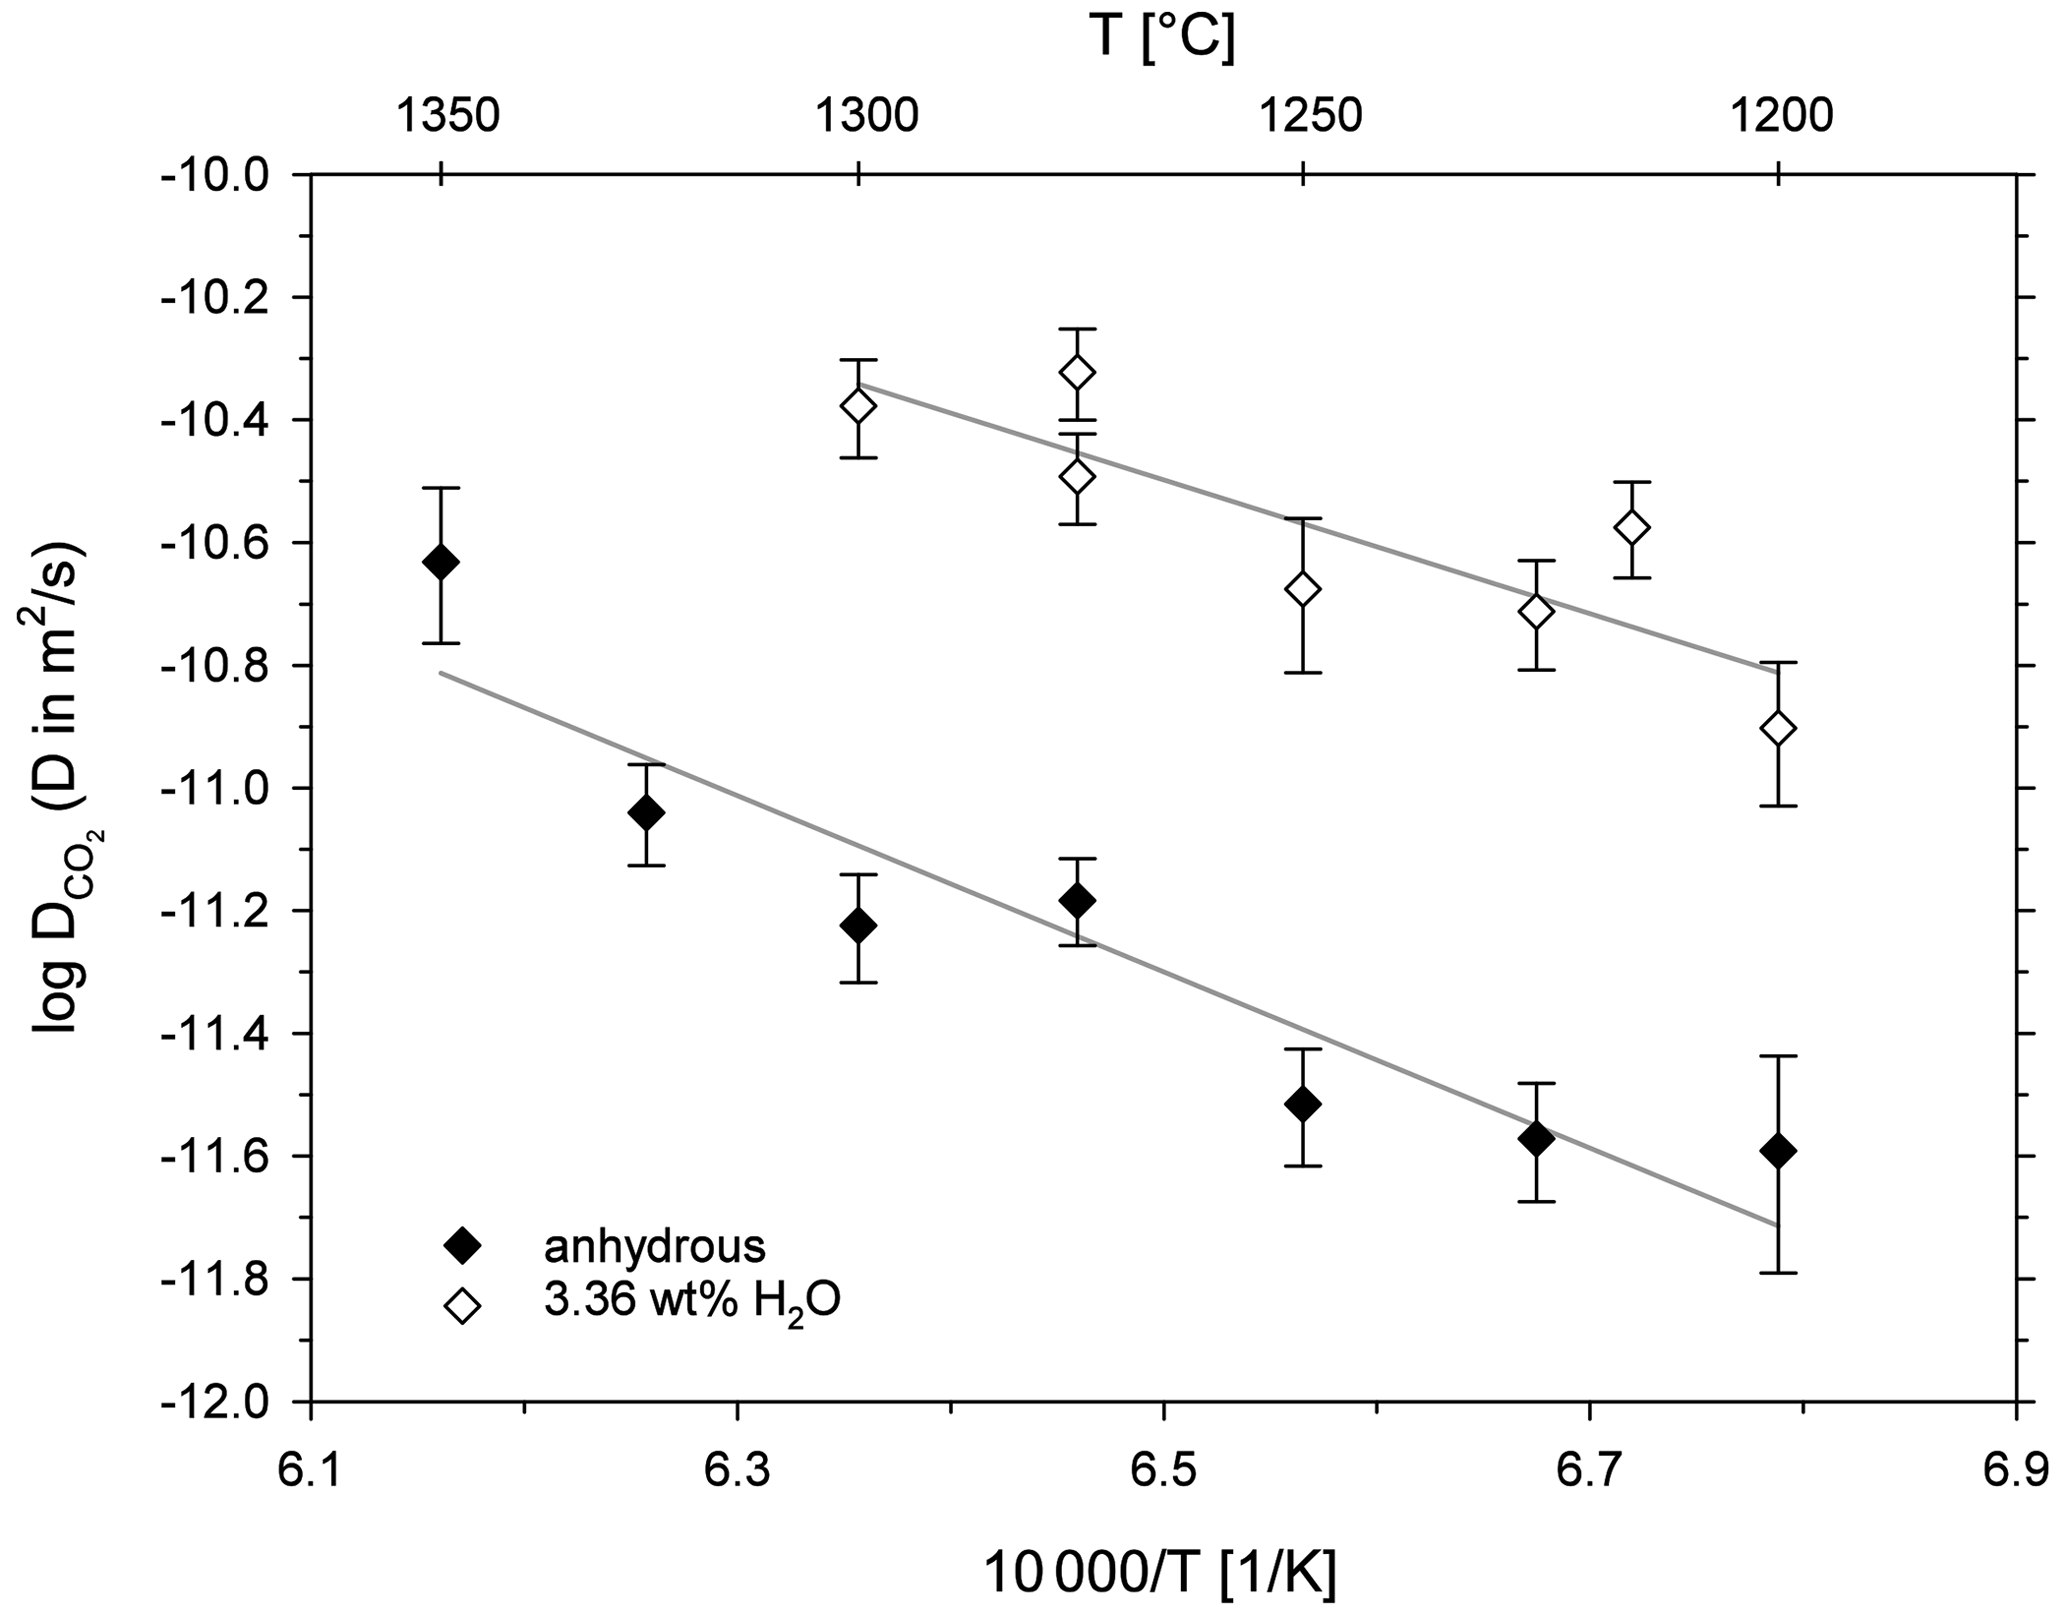
Figure 6Arrhenius diagram for CO2 diffusion in leucititic melt; the grey lines represent the linear Arrhenius equations.
The data points of each sample series were fitted with a linear equation (Arrhenius equation). The Arrhenius behaviour for diffusion is generally described by the exponential equation
where D is the diffusion coefficient in m2 s−1, D0 is the diffusion coefficient in m2 s−1 at infinite temperature, EA is the activation energy in J mol−1, R is the universal gas constant (8.3145 J K−1 mol−1) and T is the temperature in K. Equation (8) can be modified to a linear equation when diffusion coefficients are plotted in an Arrhenius diagram (logD vs. ):
The term corresponds to the slope of the linear equation, and logD0 is given by the intersection with the y axis. Consequently, the activation energies for CO2 and the D0 values can be calculated (Table 5). For the nominally dry melt, the activation energy for CO2 is 275 ± 47 kJ mol−1, whereas it is 209 ± 58 kJ mol−1 in the hydrous melt. Accordingly, water seems to decrease the activation energy of CO2; however, given the large uncertainties of EA, which were calculated using the standard errors of the slopes, a definite distinction is not possible.
Table 5Activation energies of CO2 and D0 values for the leucititic melt.

5.1 Experimental uncertainties and error sources
Deviations of experimentally determined diffusion coefficients from the Arrhenius equations partly exceed the calculated individual errors. A similar observation was made in other CO2 diffusion studies. Based on the scatter of their data, Spickenbom et al. (2010) suggested errors of about ± 0.15 log units for individual diffusion coefficients even though their calculations produced smaller errors. Applying such error bars to the diffusion coefficients presented here leads to a better intersection between Arrhenius equations and data points. It illustrates that further experimental error sources must exist.
For our experiments, melt convection presents an experimental uncertainty which is hard to quantify and difficult to consider during error calculation. Shifts of diffusion interfaces (discrepancy between initial glass interface and mean CO2 concentration) were observed for several diffusion samples. It indicates that convection or some sort of melt movement occurred during the experiment. By comparing the coordinates of mean CO2 concentrations (extracted from diffusion profiles) with the coordinates of the initial glass interface (identifiable from small offsets between the two capsule jackets), the displacement distance xshift was determined for all samples (Table 3). The highest displacements were observed for the diffusion samples LCT-LK-D-d01 (≈ 750 µm) and LCT-LK-D-w08 (>1 mm). Accordingly, both samples were discarded. Other samples that experienced more moderate shifts of 50 to 450 µm were used for further evaluation. A strong intermixing of melts is excluded since diffusion profiles always showed a symmetric shape. We therefore believe that the measured concentration profiles only represent the diffusional transport of CO2.
Crystallization of leucite and magnetite at sub-liquidus conditions in some of our experiments will also impact the diffusion mechanism of CO2. The chemical composition of the residual melt gets changed slightly, and crystals might act as some sort of barrier for diffusing molecules or ions. The temperature range for experiments is limited by the furnace of the IHPV towards higher temperatures. Therefore, experiments affected by crystallization were not discarded to cover a temperature range of at least 100 to 150 ∘C for a reliable fit of the Arrhenius equations.
Heterogeneities such as inhomogeneous distribution of H2O or CO2 in the synthesized glasses present another error source for the diffusion experiments. Imperfect preparation of diffusion couples could cause problems such as oblique contact between the glasses or the encasement of large amounts of ambient air and atmospheric H2O.
An analytical error source is given by convolution of CO2 concentrations in diffusion profiles due to the relatively large spot size of 30 µm of the ATR setup. Convolution will result in an overestimation of the diffusion coefficients because the diffusion profile is elongated (Ganguly et al., 1988). Like Schmidt et al. (2013), we used equation 20 from Ganguly et al. (1988) to estimate the effect of convolution on the diffusion coefficients:
where D is the true diffusion coefficient, Dc is the diffusion coefficient obtained from the fitted profile, ε is the standard deviation of the intensity distribution and xc is the half width of the diffusion profile. Based on the observations of Ni and Zhang (2008) we assumed that the spatial distribution of the ATR-IR signal is also Gaussian and that the true spatial resolution is 1.5 times the spot size diameter (45 µm), which corresponds to the full width at half maximum (FWHM). The standard deviation of the spatial distribution ε then corresponds to about 19.2 µm (ε= FWHM 2.35). According to Eq. (10) we overestimate the diffusion coefficient for the sample with the shortest diffusion profile (LCT-LK-D-d04) by about 2 % (0.01 log units). The uncertainties due to convolution are therefore negligible. Since the profiles of the zero time experiments are almost 1 order of magnitude shorter than the profiles of normal diffusion experiments, their length is overestimated more drastically. The calculated theating values from the zero time approach (Table 4) therefore represent maximum values. This also demonstrates the preferred application of the iterative calculation of theating.
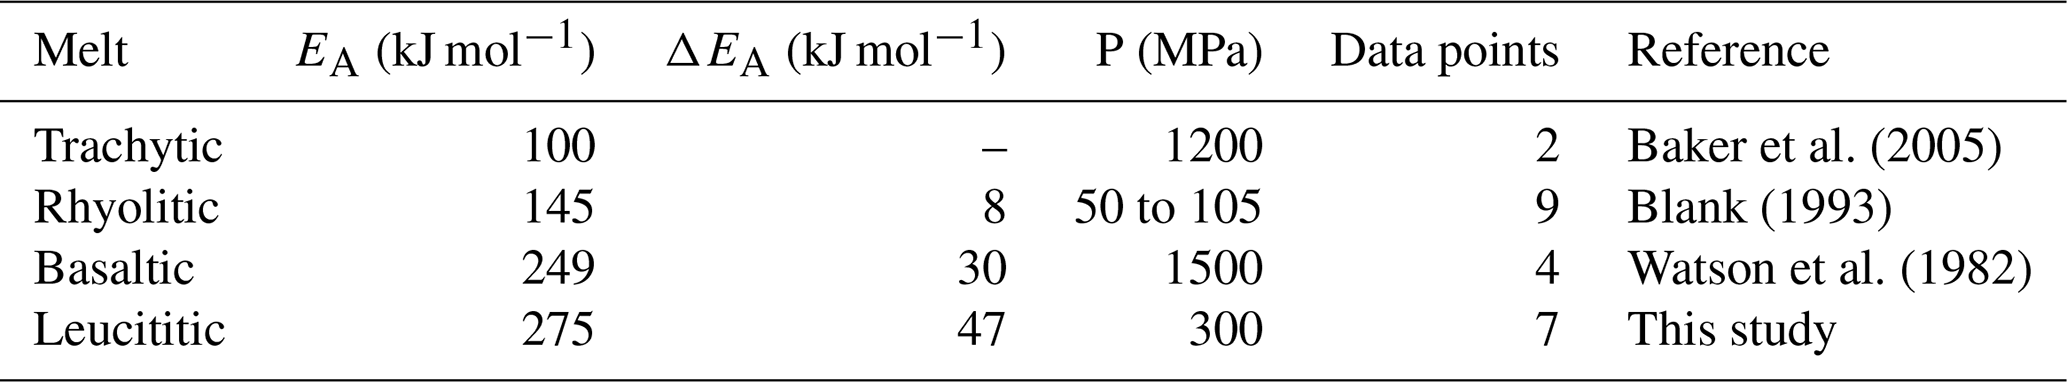
Table 6CO2 activation energies for different anhydrous silicate melts.
5.2 Effect of H2O on CO2 diffusion
Water was found to increase the diffusivity of CO2. For the experimental temperature range, CO2 diffuses almost 1 order of magnitude faster in a leucititic melt containing 3.36 ± 0.28 wt % H2O than in a nominally dry melt (0.18 ± 0.03 wt % H2O). Similar observations were made by Watson (1991) and Sierralta et al. (2002), who also examined the effect of water. At 1250 ∘C, the effect of water in the leucititic melt is very similar to the water effect in an albitic melt measured by Sierralta et al. (2002): about 4 wt % H2O causes an increase in diffusivity by 1 order of magnitude. In contrast, Baker et al. (2005) did not find an accelerating effect of water on CO2 diffusion in a trachytic melt in their preliminary calcite dissolution experiment at 1200 ∘C. Zhang and Ni (2010) noted that this result could however be imprecise due to the inadequate analytical method (CO2 quantification with electron microprobe using the “difference from 100 %′′ technique). Therefore, it is inferred that dissolved water generally accelerates the CO2 diffusion in silicate melts. Assuming that dissolved water forms OH groups within the melt structure, more non-bridging oxygen is formed and the melt gets depolymerized upon addition of water (increasing NBOT: 0.509 for the nominally dry leucititic melt and 0.825 for the hydrous leucititic; NBOT calculated after Mysen (1988) assuming that dissolved H2O only forms OH groups and that the molar fraction of Fe2O3 is equal to the molar fraction of FeO). As a result, molecules and ions can diffuse more easily through the melt structure.
Watson (1991) found that the presence of water lowers the activation energy for CO2 diffusion in the rhyolitic obsidian melt. This finding coincides with the trend observed for the leucititic melts even though our calculated activation energies intersect within the error range. Since the activation energy can be described as an energetic barrier that must be overcome to start a chemical reaction or diffusion, it gives information on how strongly CO2 is incorporated within the melt structure (not necessarily bonded). A lowered activation energy therefore indicates that CO2 is incorporated less strongly in the melt structure and that more diffusive pathways are available in the presence of water because of the melt depolymerization.
An accelerating effect of water was also observed for diffusion of other volatile components in silicate melts. For instance, halogens diffuse faster in hydrous phonolitic melts (Balcone-Boissard et al., 2009; Böhm and Schmidt, 2013) compared to their anhydrous analogues. Even for water itself, a higher water concentration in the initial melt accelerates the diffusivity of total H2O (e.g. Zhang and Stolper, 1991; Nowak and Behrens, 1997; Zhang and Behrens, 2000; Schmidt et al., 2013). These results support the validity of the experimental data on the effect of H2O on CO2 diffusion in the leucititic melt.
5.3 Comparison with CO2 diffusion in other natural silicate melts
A comparison of CO2 diffusivity in the leucititic melt with diffusivity in rhyolitic, basaltic and trachytic melts is shown in Fig. 7. An extrapolation of the Arrhenius equations implies that CO2 diffuses slightly slower in the leucititic melt compared to the basaltic melt in the temperature range of the experimental data (1200 to 1500 ∘C). Below 1325 ∘C, CO2 diffusion in the leucititic melt is also slower than in the rhyolitic melt. At 1300 ∘C for instance, diffusion in the rhyolitic melt (extrapolated) is about 1.2 times faster than in the leucititic melt. Above 1325 ∘C, diffusion in the leucititic melt exceeds diffusion in the rhyolitic melt. However, a clear distinction is not possible when the uncertainties of each Arrhenius equation (especially upon extrapolation) are taken into account.
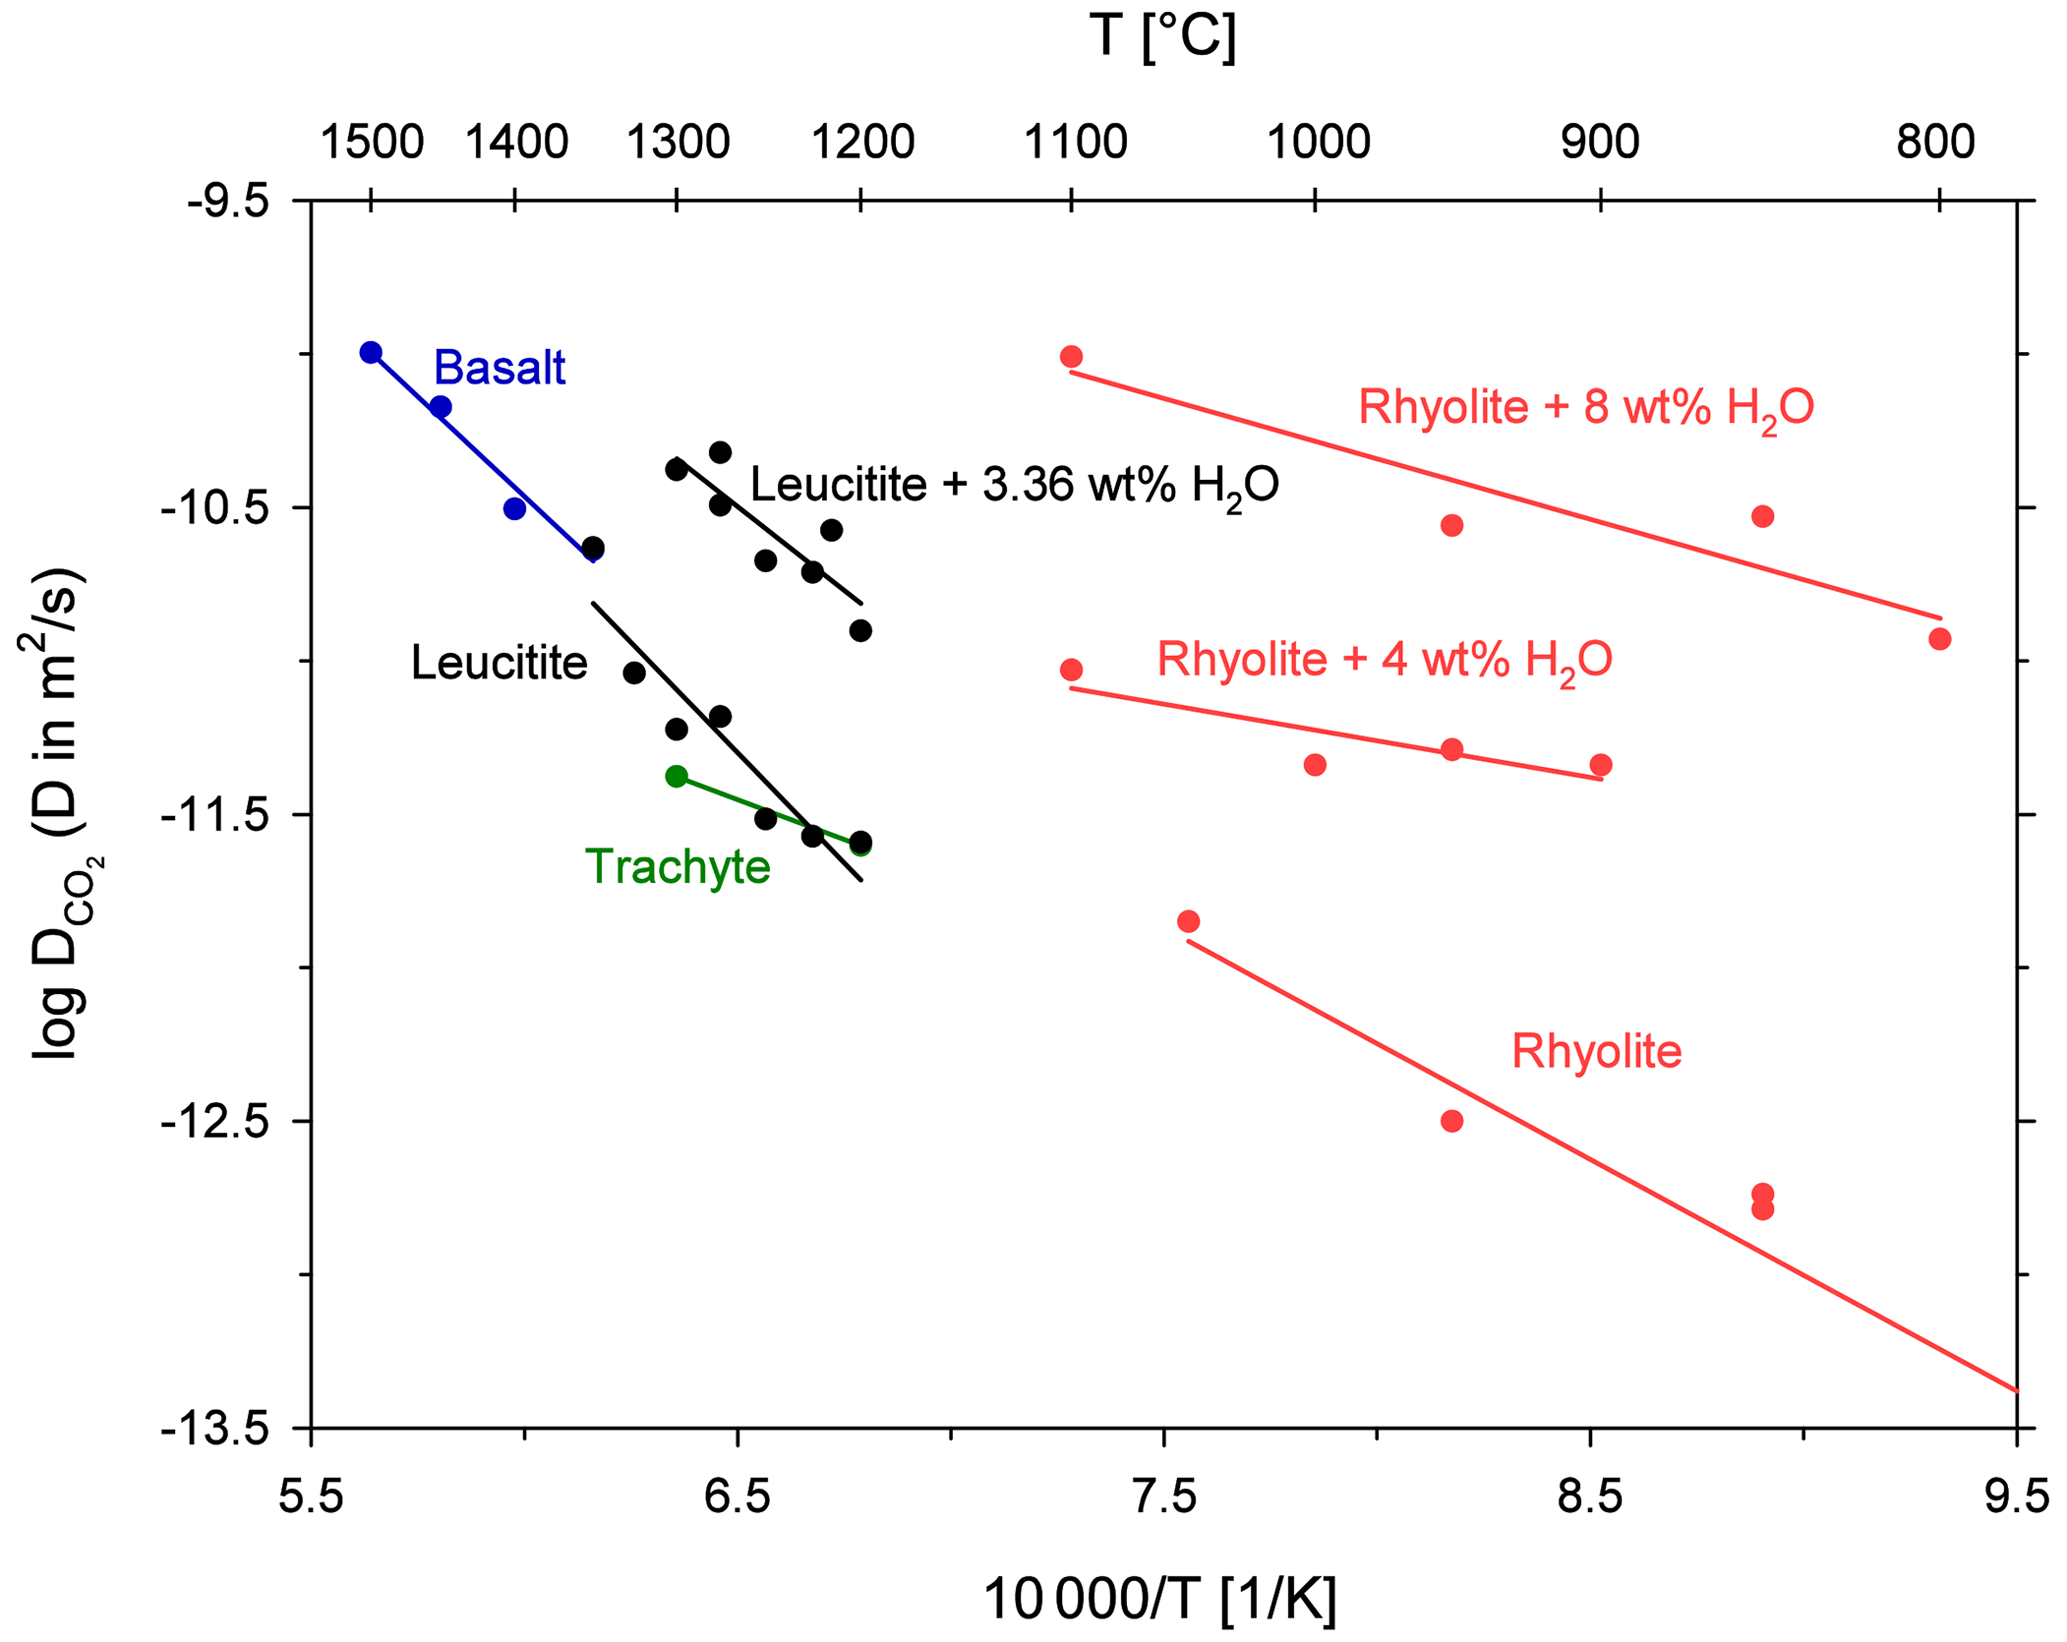
Figure 7Arrhenius diagram for CO2 diffusion in natural melts; rhyolite and H2O from Watson (1991); rhyolite from Blank (1993); basalt from Watson et al. (1982); trachyte from Baker et al. (2005).
Based on these observations, one can assume that CO2 diffusion is relatively insensitive to the bulk melt composition when looking at high temperatures. A comparison with diffusion in the trachytic melt from Baker et al. (2005) is difficult since the Arrhenius equation is only based on two data points and our data demonstrate that there can be a certain scatter. The Arrhenius equations for hydrous melts shown in Fig. 7 illustrate the strong effect of dissolved H2O on diffusion. Its effect clearly exceeds the influence of the bulk melt composition. Sierralta et al. (2002) showed that Na2O also strongly accelerates CO2 diffusion (albitic melt + Na2O). The trends for H2O and Na2O therefore contradict the general observation that CO2 diffusion does not depend on the melt composition. Consequently, depolymerization due to the addition of H2O and Na2O affects the CO2 diffusion behaviour differently than a general change from polymerized (rhyolitic) to depolymerized (basaltic) melts. Nowak et al. (2004) argued that the observed CO diffusion is an interplay between CO2 speciation and the individual diffusivities of the two species (see Eq. 1). For a fundamental change in melt composition (from rhyolite to basalt), the two effects compensate each other (Nowak et al., 2004). The observed increase in CO2 diffusivity due to the addition of H2O (or Na2O) could therefore potentially be explained by an increase of the individual diffusivities (CO and CO due to depolymerization of the melt structure (but a constant carbon speciation) or by a change of the carbon speciation in the melt (increasing CO CO).
The Arrhenius equations for leucititic and basaltic melts show steeper slopes than the Arrhenius equations for rhyolitic and trachytic melts, indicating a higher activation energy for CO2 diffusion in the depolymerized systems (Table 6). Carbonate ions are bound to the silicate network (e.g. Fine and Stolper, 1985; Kohn et al., 1991), whereas CO2 molecules are arranged in interstitial places, and thus they are only weakly associated to the silicate network (e.g. Guillot and Sator, 2011). Spickenbom et al. (2010) suggested that CO2 diffusion in depolymerized melts could be attributed to an interconversion mechanism of CO and CO2: structurally bound carbonate converts into a CO2 molecule which moves through melt “doorways” and reconverts into carbonate, which is incorporated into the melt structure. Consequently, more energy is required for total CO2 diffusion. An elevated activation energy could therefore indicate that CO2 is at least partly present in the form of carbonate in the depolymerized melts.
5.4 Comparison with diffusion of other volatiles and implications for magma degassing
Besides CO2, natural silicate melts contain several volatile components such as water and halogens (e.g. Anderson, 1975). The comparison of diffusion coefficients for different volatile components is important because the rate of diffusive bubble growth is directly proportional to the diffusion coefficient of the diffusing species (Sparks et al., 1994). Profound differences in diffusivities could cause a fractionation of the volatile components in the degassing fluid phase (Watson et al., 1982). Unfortunately, there is no published diffusion data available for leucititic melts. H2O diffusion is constrained for basaltic and differentiated melts (e.g. Zhang and Stolper, 1991; Zhang and Behrens, 2000). Sulfur and halogen diffusion are also experimentally investigated for such melt compositions (e.g. Freda et al., 2005; Alletti et al., 2007). We therefore compare the determined CO2 diffusion in the leucititic melt with volatile diffusion in basaltic melts at anhydrous conditions (Fig. 8). The comparability of the diffusion data is limited since different melt compositions and experimental techniques are compared. Moreover, Arrhenius equations were extrapolated to the temperature range of our study, which further increases the uncertainties in diffusion coefficients. Nevertheless, the comparison demonstrates some general trends for mafic melts.

Figure 8Arrhenius diagram for diffusion of different volatiles in depolymerized melts at anhydrous conditions; H2O diffusion in a basaltic melt from Zhang and Stolper (1991); F and Cl diffusion in a basaltic melt from Alletti et al. (2007); S diffusion in a basaltic melt from Freda et al. (2005); CO2 diffusion in a leucititic melt from this study; Arrhenius equations for H2O, F, Cl and S are extrapolated to the temperature range of our study for better comparison.
The diffusion of H2O (at low total water concentrations) is more than 1 order of magnitude faster than CO2 diffusion, and it therefore marks the largest difference. The halogens F and Cl diffuse roughly half an order of magnitude faster than CO2, whereas S diffusion is similar to CO2 diffusion. Assuming that the diffusivity of these volatiles in a basaltic melt is similar to diffusion in the leucititic melt, a diffusive fractionation (especially between CO2 and H2O or between S and H2O) could occur due to decompression and bubble growth during fast magma ascent. Alletti et al. (2007) developed a model for the behaviour of volatiles during bubble growth in a basaltic melt. The model shows that the fluid composition of bubbles should remain constant during steady-state degassing. During fast bubble growth however, the volatile ratios of the fluid change as a function of bubble growth rate due to different diffusivities and partitioning coefficients of the volatiles. Given the slow CO2 diffusivity (this study) and the strong partitioning of CO2 into the vapour phase (e.g. Lesne et al., 2011), CO2 will be relatively enriched in the gas phase during slow bubble growth, whereas its portion will decrease at higher bubble growth rates. For instance, a high CO2 F ratio in the emitted gas of an active volcano would indicate slow bubble growth, whereas a decreasing CO2 F ratio would indicate faster bubble growth and increased volcanic activity.
Pichavant et al. (2013) and Le Gall and Pichavant (2016a, b) observed an anomalous degassing behaviour for CO2 in their decompression experiments. CO2 concentrations in their run products exceeded the equilibrium solubilities of CO2 at final pressure indicating a disequilibrium degassing mechanism. Pichavant et al. (2013) identified the slow diffusion of CO2 (compared to H2O) as the driving force for this phenomenon. Our data further confirm the slow diffusivity of CO2 and imply that disequilibrium degassing could also occur in the leucititic melt. Large degrees of CO2 supersaturation could be maintained during magma ascent, promoting the explosive eruption behaviour of the Colli Albani melts. Disequilibrium degassing and diffusive fractionation should therefore be considered for monitoring and interpreting gas emission of active volcanoes (Pichavant et al., 2019).
The first data set for CO2 diffusion with reliable Arrhenius relations determined at constant conditions (pressure, oxygen fugacity, experimental and analytical approach) for an anhydrous and hydrous melt is presented here. The diffusivity in the leucititic melt increases exponentially with temperature and shows Arrhenius behaviour. Dissolved H2O in the melt accelerates diffusion of CO2 by about 1 order of magnitude at water concentrations of 4 wt %. The data confirm that the diffusion of CO2 in nominally dry melts is not heavily dependent on the melt composition. So far, there is no satisfactory explanation as to why CO2 diffusion is insensitive to the bulk melt composition but is strongly affected by dissolved H2O.
The study further demonstrated that the ATR-FTIR method is a suitable method for spatially resolved CO2 quantification in silicate glasses. It presents a good alternative to the traditional transmission FTIR spectroscopy when samples are too brittle for polishing too-small thicknesses or when absorption bands reach total absorption due to high concentrations.
The raw data are stored at the Department of Mineralogy at the University of Göttingen. All diffusion profiles are either part of the paper or shown in the Supplement.
The supplement related to this article is available online at: https://doi.org/10.5194/ejm-35-117-2023-supplement.
LK performed the experiments and analyses as part of his Master's thesis. BCS initiated and supervised the research project and helped with the experiments and analyses. LK wrote the paper draft. BCS reviewed and edited the paper.
The contact author has declared that neither of the authors has any competing interests.
Publisher’s note: Copernicus Publications remains neutral with regard to jurisdictional claims in published maps and institutional affiliations.
This article is part of the special issue “Probing the Earth: magma and fluids, a tribute to the career of Michel Pichavant”. It is a result of the Magma & Fluids workshop, Orléans, France, 4–6 July 2022.
The authors would like to thank Sara Fanara for co-supervising Lennart Koch's Master's thesis. Maximilian Schanofski is thanked for the help with IR analyses. The authors thank two anonymous reviewers for their constructive comments and Fabrice Gaillard for editorial handling of the special issue.
This research has been supported by the Deutsche Forschungsgemeinschaft (grant no. FA 1477/1-1 | SCHM 1622/9-1).
This open-access publication was funded by the University of Göttingen.
This paper was edited by Fabrice Gaillard and reviewed by two anonymous referees.
Alletti, M., Baker, D. R., and Freda, C.: Halogen diffusion in a basaltic melt, Geochim. Cosmochim. Ac., 71, 3570–3580, https://doi.org/10.1016/j.gca.2007.04.018, 2007.
Anderson, A. T.: Some basaltic and andesitic gases, Rev. Geophys., 13, 37–55, https://doi.org/10.1029/RG013i001p00037, 1975.
Baker, D. R., Freda, C., Brooker, R. A., and Scarlato, P.: Volatile diffusion in silicate melts and its effects on melt inclusions, Ann. Geophys., 48, 699–717, https://doi.org/10.4401/ag-3227, 2005.
Balcone-Boissard, H., Baker, D. R., Villemant, B., and Boudon, G.: F and Cl diffusion in phonolitic melts: Influence of the Na K ratio, Chem. Geol., 263, 89–98, https://doi.org/10.1016/j.chemgeo.2008.08.018, 2009.
Benne, D. and Behrens, H.: Water solubility in haplobasaltic melts, Eur. J. Mineral., 15, 803–814, https://doi.org/10.1127/0935-1221/2003/0015-0803, 2003.
Blank, J. G.: An experimental investigation of the behavior of carbon dioxide in rhyolitic melt, Dissertation (Ph.D.), California Institute of Technology, https://doi.org/10.7907/tq3x-2059, 1993.
Böhm, A. and Schmidt, B. C.: Fluorine and chlorine diffusion in phonolitic melt, Chem. Geol., 346, 162–171, https://doi.org/10.1016/j.chemgeo.2012.09.005, 2013.
Botcharnikov, R. E., Behrens, H., and Holtz, F.: Solubility and speciation of C–O–H fluids in andesitic melt at T=1100–1300 ∘C and P=200 and 500 MPa, Chem. Geol., 229, 125–143, https://doi.org/10.1016/j.chemgeo.2006.01.016, 2006.
Crank, J.: The mathematics of diffusion, Second edition, Clarendon Press, Oxford, 421 pp., ISBN: 0198533446, 1975.
Fahrenfort, J.: Attenuated total reflection: A new principle for the production of useful infra-red reflection spectra of organic compounds, Spectrochim. Ac., 17, 698–709, https://doi.org/10.1016/0371-1951(61)80136-7, 1961.
Fine, G. and Stolper, E.: The speciation of carbon dioxide in sodium aluminosilicate glasses, Contrib. Mineral. Petr., 91, 105–121, https://doi.org/10.1007/bf00377759, 1985.
Fogel, R. A. and Rutherford, M. J.: The solubility of carbon dioxide in rhyolitic melts; a quantitative FTIR study, Am. Mineral., 75, 1311–1326, 1990.
Freda, C., Baker, D. R., and Scarlato, P.: Sulfur diffusion in basaltic melts, Geochim. Cosmochim. Ac., 69, 5061–5069, https://doi.org/10.1016/j.gca.2005.02.002, 2005.
Freda, C., Gaeta, M., Giaccio, B., Marra, F., Palladino, D. M., Scarlato, P., and Sottili, G.: CO2-driven large mafic explosive eruptions: the Pozzolane Rosse case study from the Colli Albani Volcanic District (Italy), Bull. Volcanol., 73, 241–256, https://doi.org/10.1007/s00445-010-0406-3, 2011.
Ganguly, J., Bhattacharya, R. N., and Chakraborty, S.: Convolution effect in the determination of composition profiles and diffusion coefficients by microprobe step scans, Am. Mineral., 73, 901–909, 1988.
Guillot, B. and Sator, N.: Carbon dioxide in silicate melts: A molecular dynamics simulation study, Geochim. Cosmochim. Ac., 75, 1829–1857, https://doi.org/10.1016/j.gca.2011.01.004, 2011.
Hammerli, J., Hermann, J., Tollan, P., and Naab, F.: Measuring in situ CO2 and H2O in apatite via ATR-FTIR, Contrib. Mineral. Petrol., 176, 1–20, https://doi.org/10.1007/s00410-021-01858-6, 2021.
Johnson, M. C., Anderson Jr., A. T., and Rutherford, M. J.: Pre-eruptive volatile contents of magmas, in: Volatiles in Magmas, edited by: Carroll, M. R. and Holloway, J. R., Mineralogical Society of America, Washington, DC, 281–330, https://doi.org/10.1515/9781501509674-014, 1994.
Kleest, C., Webb, S. L., and Fanara, S.: Rheology of melts from the colli albani volcanic district (Italy): a case study, Contrib. Mineral. Petr., 175, 82, https://doi.org/10.1007/s00410-020-01720-1, 2020.
Kohn, S. C., Brooker, R. A., and Dupree, R.: 13C MAS NMR: A method for studying CO2 speciation in glasses, Geochim. Cosmochim. Ac., 55, 3879–3884, https://doi.org/10.1016/0016-7037(91)90082-G, 1991.
Konschak, A. and Keppler, H.: The speciation of carbon dioxide in silicate melts, Contrib. Mineral. Petr., 167, 998, https://doi.org/10.1007/s00410-014-0998-2, 2014.
Le Gall, N. and Pichavant, M.: Experimental simulation of bubble nucleation and magma ascent in basaltic systems: Implications for Stromboli volcano, Am. Mineral., 101, 1967–1985, https://doi.org/10.2138/am-2016-5639, 2016a.
Le Gall, N. and Pichavant, M.: Homogeneous bubble nucleation in H2O- and H2O-CO2 -bearing basaltic melts: Results of high temperature decompression experiments, J. Volcanol. Geoth. Res., 327, 604–621, https://doi.org/10.1016/j.jvolgeores.2016.10.004, 2016b.
Lesne, P., Kohn, S. C., Blundy, J., Witham, F., Botcharnikov, R. E., and Behrens, H.: Experimental Simulation of Closed-System Degassing in the System Basalt–H2O–CO2–S–Cl, J, Petrol., 52, 1737–1762, https://doi.org/10.1093/petrology/egr027, 2011.
Lowenstern, J. B. and Pitcher, B. W.: Analysis of H2O in silicate glass using attenuated total reflectance (ATR) micro-FTIR spectroscopy, Am. Mineral., 98, 1660–1668, https://doi.org/10.2138/am.2013.4466, 2013.
Morizet, Y., Kohn, S. C., and Brooker, R. A.: Annealing experiments on CO2-bearing jadeite glass: an insight into the true temperature dependence of CO2 speciation in silicate melts, Mineral. Mag., 65, 701–707, https://doi.org/10.1180/0026461016560001, 2001.
Mysen, B. O.: Structure and properties of silicate melts, Developments in geochemistry, 4, Elsevier, Amsterdam, 354 pp., ISBN: 0444416358, 1988.
Ni, H. and Keppler, H.: Carbon in Silicate Melts, in: Carbon in Earth, edited by: Hazen, R. M., Jones, A. P., and Baross, J. A., Mineralogical Society of America, 251–287, https://doi.org/10.2138/rmg.2013.75.9, 2013.
Ni, H. and Zhang, Y.: H2O diffusion models in rhyolitic melt with new high pressure data, Chem. Geol., 250, 68–78, https://doi.org/10.1016/j.chemgeo.2008.02.011, 2008.
Nowak, M. and Behrens, H.: An experimental investigation on diffusion of water in haplogranitic melts, Contrib. Mineral. Petr., 126, 365–376, https://doi.org/10.1007/s004100050256, 1997.
Nowak, M., Porbatzki, D., Spickenbom, K., and Diedrich, O.: Carbon dioxide speciation in silicate melts: a restart, Earth Planet. Sc. Lett., 207, 131–139, https://doi.org/10.1016/S0012-821X(02)01145-7, 2003.
Nowak, M., Schreen, D., and Spickenbom, K.: Argon and CO2 on the race track in silicate melts: A tool for the development of a CO2 speciation and diffusion model, Geochim. Cosmochim. Ac., 68, 5127–5138, https://doi.org/10.1016/j.gca.2004.06.002, 2004.
Pichavant, M., Di Carlo, I., Rotolo, S. G., Scaillet, B., Burgisser, A., Le Gall, N., and Martel, C.: Generation of CO2-rich melts during basalt magma ascent and degassing, Contrib. Mineral. Petr., 166, 545–561, https://doi.org/10.1007/s00410-013-0890-5, 2013.
Pichavant, M., Le Gall, N., and Scaillet, B.: Gases as Precursory Signals: Experimental Simulations, New Concepts and Models of Magma Degassing, in: Volcanic unrest: From science to society, edited by: Gottsmann, J., Neuberg, J., and Scheu, B., Springer, Cham, 139–154, https://doi.org/10.1007/11157_2018_35, 2019.
Schanofski, M., Fanara, S., and Schmidt, B. C.: CO2–H2O solubility in K-rich phonolitic and leucititic melts, Contrib. Mineral. Petr., 174, 52, https://doi.org/10.1007/s00410-019-1581-7, 2019.
Schanofski, M., Koch, L., and Schmidt, B. C.: CO2 quantification in silicate glasses using μ-ATR FTIR spectroscopy, Am. Mineral., https://doi.org/10.2138/am-2022-8477, in press, 2023.
Schmidt, B. C., Blum-Oeste, N., and Flagmeier, J.: Water diffusion in phonolite melts, Geochim. Cosmochim. Ac., 107, 220–230, https://doi.org/10.1016/j.gca.2012.12.044, 2013.
Sierralta, M., Nowak, M., and Keppler, H.: The influence of bulk composition on the diffusivity of carbon dioxide in Na aluminosilicate melts, Am. Mineral., 87, 1710–1716, https://doi.org/10.2138/am-2002-11-1221, 2002.
Sparks, R. S. J., Barclay, J., Jaupart, C., Mader, H. M., and Phillips, J. C.: Physical aspects of magma degassing, I. Experimental and theoretical constraints on vesiculation, in: Volatiles in Magmas, edited by: Carroll, M. R. and Holloway, J. R., Mineralogical Society of America, Washington, DC, 413–446, https://doi.org/10.1515/9781501509674-017, 1994.
Spickenbom, K., Sierralta, M., and Nowak, M.: Carbon dioxide and argon diffusion in silicate melts: Insights into the CO2 speciation in magmas, Geochim. Cosmochim. Ac., 74, 6541–6564, https://doi.org/10.1016/j.gca.2010.08.022, 2010.
Symonds, R. B., Rose, W. I., Bluth, G. J. S., and Gerlach, T. M.: Volcanic-gas studies: methods, results, and applications, in: Volatiles in Magmas, edited by: Carroll, M. R. and Holloway, J. R., Mineralogical Society of America, Washington, DC, 1–66, https://doi.org/10.1515/9781501509674-007, 1994.
Watson, E. B.: Diffusion of dissolved CO2 and Cl in hydrous silicic to intermediate magmas, Geochim. Cosmochim. Ac., 55, 1897–1902, https://doi.org/10.1016/0016-7037(91)90031-Y, 1991.
Watson, E. B., Sneeringer, M. A., and Ross, A.: Diffusion of dissolved carbonate in magmas: Experimental results and applications, Earth Planet. Sc. Lett., 61, 346–358, https://doi.org/10.1016/0012-821X(82)90065-6, 1982.
Yamashita, S., Kitamura, T., and Kusakabe, M.: Infrared spectroscopy of hydrous glasses of arc magma compositions, Geochem. J., 31, 169–174, https://doi.org/10.2343/geochemj.31.169, 1997.
Zhang, Y. and Behrens, H.: H2O diffusion in rhyolitic melts and glasses, Chem. Geol., 169, 243–262, https://doi.org/10.1016/S0009-2541(99)00231-4, 2000.
Zhang, Y. and Ni, H.: Diffusion of H, C, and O Components in Silicate Melts, in: Diffusion in Minerals and Melts, edited by: Zhang, Y. and Cherniak, D. J., Mineral. Soc. Am., 171–225, https://doi.org/10.2138/rmg.2010.72.5, 2010.
Zhang, Y. and Stolper, E. M.: Water diffusion in a basaltic melt, Nature, 351, 306–309, https://doi.org/10.1038/351306a0, 1991.
Zhang, Y., Xu, Z., Zhu, M., and Wang, H.: Silicate melt properties and volcanic eruptions, Rev. Geophys., 45, 4, https://doi.org/10.1029/2006RG000216, 2007.
- Abstract
- Introduction
- Experimental and analytical methods
- Mathematical methods for determining diffusion coefficients
- Results
- Discussion
- Conclusions
- Data availability
- Author contributions
- Competing interests
- Disclaimer
- Special issue statement
- Acknowledgements
- Financial support
- Review statement
- References
- Supplement