the Creative Commons Attribution 4.0 License.
the Creative Commons Attribution 4.0 License.
 | 16 Nov 2023
Li–Na interdiffusion and diffusion-driven lithium isotope fractionation in pegmatitic melts
Christian R. Singer
Harald Behrens
Ingo Horn
Martin Oeser
Ralf Dohmen
Stefan Weyer
In this study, we investigate the diffusion of Li and its stable isotopes (6Li and 7Li) in flux-rich (1.8 % Li2O, 2.6 % B2O3, 2.3 % P2O5 and 3 % F) pegmatitic melts in order to contribute to the understanding of Li enrichment in such systems. Two glasses were synthesized with a model pegmatitic composition, one of which is highly enriched in Li (> 1 wt %, PEG2-blue) and the other one essentially Li-free (PEG2-Li-free). Diffusion couple experiments were performed to determine the chemical diffusivity of Li in dry pegmatitic melts. Experiments were conducted using rapid-heat and rapid-quench cold-seal pressure vessels in a temperature range of 650–940 ∘C at 100 MPa with Ar as the pressure medium. We observed rapidly formed diffusion profiles, driven by an interdiffusive exchange of the monovalent alkalis Li and Na, while the other elements are immobile on the timescale of experiments (1–30 min). From these experiments, activation energies for Li–Na interdiffusion were determined as 99 ± 7 kJ mol−1 with a pre-exponential factor of log D0 = −5.05 ± 0.33 (D0 in m2 s−1). Li and Na partitioning between the stronger depolymerized PEG2-blue and the less depolymerized PEG2-Li-free leads to a concentration jump at the interface; i.e. Na is enriched in the more depolymerized PEG2-blue. Li–Na interdiffusion coefficients in the studied melt composition are in a similar range as Li and Na tracer diffusivities in other dry aluminosilicate melts, confirming little to no effect of aluminosilicate melt composition on Li diffusivity. Thus, added fluxes do not enhance the Li diffusivity in the same way as observed for H2O (Holycross et al., 2018; Spallanzani et al., 2022). Using melt viscosity as a proxy for the polymerization of the melt shows that water has a stronger potential to depolymerize a melt compared to other fluxing elements. Faster diffusion of 6Li compared to 7Li leads to a strong Li isotope fractionation along the diffusion profile, resulting in δ7Li as low as −80 ‰ relative to the diffusion-unaffected regions. This diffusive isotope fractionation can be quantified with an empirical isotope fractionation factor (β) of 0.20 ± 0.04, similar to previously observed β values for Li diffusion in melts. This suggests in accordance with previously published data that a β value of ca. 0.2 seems to be universally applicable to diffusive Li isotope fractionation in aluminosilicate melts.
- Article
(4222 KB) - Full-text XML
-
Supplement
(620 KB) - BibTeX
- EndNote


Li is a valuable resource in our modern-day society, being used to manufacture rechargeable batteries and as a component in the ceramics and glass industry. The soaring demand for Li-ion batteries in electronic devices and electric vehicles during the last decade requires the ongoing prospect of new reservoirs. According to the US Geological Survey (2021), the two main deposit types currently mined for Li are lacustrine brines (e.g. central Andes in Chile, Argentina and Bolivia) and pegmatites (e.g. Greenbushes pegmatite in Australia). Of particular interest with respect to this study are the rare element Li–Cs–Ta (LCT) pegmatites, a subgroup of pegmatites, which are highly enriched in Li, Cs, Ta, Be, B and F (Černý and Ercit, 2005; Černý, 1991). LCT pegmatites probably originate from partial anatexis of crustal rocks (Černý and Ercit, 2005; Deveaud et al., 2015). However, the transport mechanisms leading to enrichment of rare elements in pegmatites are still poorly understood.
Pegmatites are enriched in incompatible elements, but their bulk compositions are still in the vicinity of granites (e.g. Stilling et al., 2006). The strikingly different textures between pegmatites and granites are facilitated by large undercooling below the liquidus temperature of these melts (London et al., 1989; Morgan and London, 1999; Webber et al., 1999). Crystallization temperatures were found to be as low as ∼ 350–400 ∘C (Teng et al., 2006b; Sirbescu and Nabelek, 2003), considerably below the expected granitic melt solidus temperature. During the formation of pegmatites, fluxes (such as Li, B, P and F) are suspected to play a key role by decreasing liquidus temperature and melt viscosity, inhibiting nucleation and increasing the diffusion rates of network formers like SiO2 and Al2O3 (London, 1992). The importance of fluxes comes into effect during rapid crystal growth, where the formation of a boundary layer at the interface between crystal and melt is inferred, according to the concept of constitutional zone refining (London, 2005). Incompatible fluxes accumulate in this boundary layer and enhance the diffusivities of SiO2 and Al2O3, enabling the rapid growth of crystals. The existence of such a boundary layer was proven experimentally (London, 2005), and their composition was inferred from silicate-rich fluid inclusions (London, 1986) and quartz-hosted melt inclusions (Thomas and Webster, 2000) and can reach extreme levels of H2O, Li, B, P and F enrichments. The role of fluid exsolution during pegmatite genesis remains elusive even today, although there is experimental evidence that it is not strictly necessary to generate pegmatitic textures (London et al., 1989).
Aside from its economic value, Li concentrations and stable isotopes (6Li and 7Li) have been utilized in a variety of magmatic settings to untangle petrological processes. Li was successfully applied as a geospeedometer to estimate cooling rates of oceanic crust based on Li diffusion in clinopyroxene (Coogan et al., 2005). Timescales of pre-eruptive magma replenishment were ascertained by investigating Li zoning in olivines (Lynn et al., 2018). Diffusion-driven isotope fractionation of 6Li and 7Li has been observed in peridotite olivine and pyroxene and proposed as a geospeedometer for high-temperature magmatic processes (Jeffcoate et al., 2007). A combination of Li concentration gradients and diffusive Li isotope fractionation in plagioclase was employed by Neukampf et al. (2021) to estimate the time span between volatile degassing and quenching during the eruption of a magma. Steinmann et al. (2020) unravelled multi-stage magmatic diffusion processes in olivine that could not be resolved by major elements (Fe–Mg interdiffusion) alone.
Li diffusion was already studied in a variety of aluminosilicate melts, such as rhyolite (Jambon and Semet, 1978), alkali basalt (Lowry et al., 1981), or andesite and pitchstone (Cunningham et al., 1983). Exotic systems, like highly fluxed pegmatitic melts, have not been investigated experimentally yet, in that regard. It has been shown that Li diffusion in dry aluminosilicate melts does not vary significantly with composition (see review in Zhang et al., 2010). In hydrous aluminosilicates, however, diffusion rates increase with increasing water content by depolymerizing the melt structure (Spallanzani et al., 2022; Holycross et al., 2018). One aim of our study is to investigate whether high amounts of fluxing elements, such as Li2O, B2O3, P2O5 and F, influence the Li diffusivity in the same way as water. By imposing high Li concentration gradients, chemical diffusivity of Li is investigated, pointing to the roles of chemical potential gradients and coupling of Li to other elements during its transport. Li isotope diffusion profiles may provide further insights into the transport mechanisms. Thus, we will contribute to understanding Li transport in aluminosilicate melts and specifically Li diffusion in highly fractionated, flux-rich pegmatitic melts, essential to forming Li ore deposits.
Table 1Chemical analyses, water content and densities of PEG2-base, PEG2-blue and PEG2-Li-free starting compositions compared to the composition used by Bartels et al. (2011).
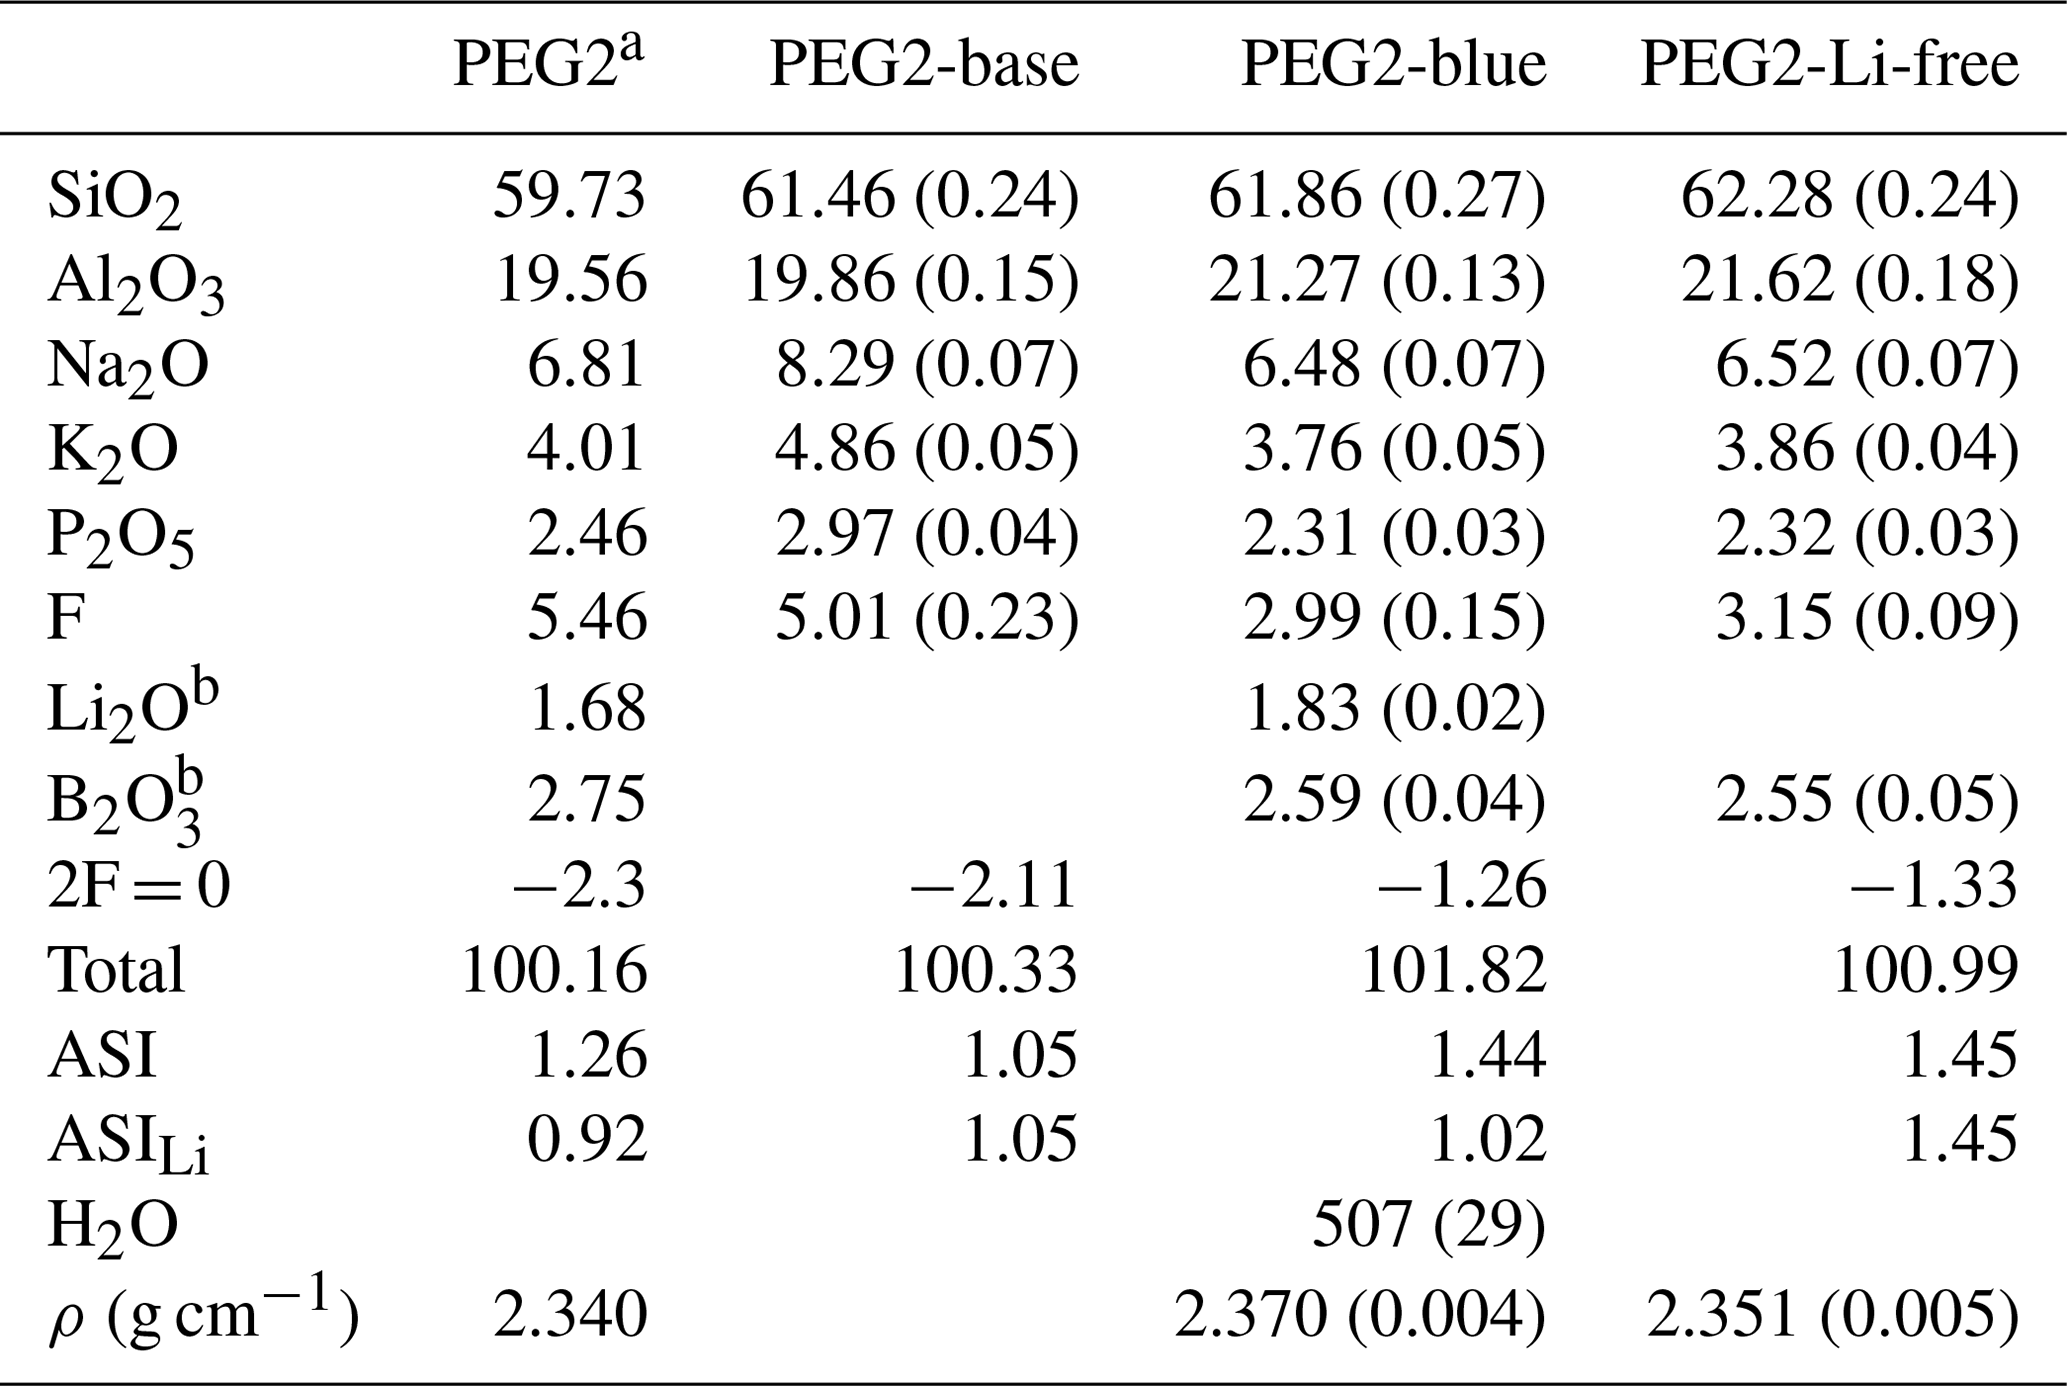
a Composition from Bartels et al. (2011); ρ refers to their PEG2 with 0.07 wt % H2O. If not mentioned otherwise, values refer to mean of ≥ 17 electron microprobe measurements given as weight percent (wt %). b Measured by fs-LA-ICP-MS. The 1σ standard deviation is given in parentheses. ASI signifies molar ratio of Al (Na + K), ASILi= Al (Li + Na + K).
2.1 Starting material
Diffusion experiments were performed with pegmatitic melts that differed essentially only in their Li content. By changing the Li concentration in these melts, the absolute concentrations of the other elements also change, while the relative concentrations are the same. The composition PEG2 (Table 1) was selected from Bartels et al. (2011), who studied the influence of fluxes, such as Li2O, B2O3, P2O5, F and H2O, on melt viscosity in pegmatitic systems. Rather than representing a bulk pegmatitic melt, this composition approximates that of a fluxed boundary layer. In the first step, a Li- and B-free base composition (PEG2-base) was prepared from a mixture of SiO2, Al2O3, Na2CO3, K2CO3, (NH4)H2PO4 and AlF3. The mixture was melted at 1400 ∘C for 2 h in a Pt crucible in a chamber furnace. The resulting glass was crushed in a steel mortar and re-melted at 1400 ∘C. After this procedure, the glass was crushed and ground again to produce a homogeneous glass powder (Table 1).
In the second step, PEG2-base was used to produce glasses for the diffusion experiments:
-
PEG2-blue by adding a spodumene glass (LiAlSi2O6) and boric acid (H3BO3) – ∼ 0.2 wt % cobalt oxide (Co3O4) was also added to colour this glass blue to be able to recognize possible advective mixing during diffusion experiments;
-
PEG2-Li-free by adding the corresponding amounts of H3BO3, silica (SiO2) and alumina (Al2O3) to PEG2-base.
These glasses were synthesized as described above by a two-step melting and crushing procedure. After the second melting, resulting glasses are optically homogeneous. They are microscopically crystal-free and contain ca. 3 vol %–4 vol % bubbles. The glasses were annealed at the glass transition temperature (Tg, ∼ 430 ∘C) for 20 min and cooled slowly (5 K s−1) to ca. 370 ∘C to release internal stresses resulting from fast cooling. Tg was calculated based on the viscosity data of Bartels et al. (2011) to be ca. 433 ∘C based on the melt viscosity of 1012 Pa s. Cylindrical pieces were drilled directly from the glass inside the Pt crucible with a diameter of 4 mm and a length of 5 mm. Glass cylinders were polished on one side to obtain a flat surface, which optimizes the contact at the interface during experiments.
Separate glass cylinders were used for chemical analysis of the starting material. The major element composition of starting glasses was analysed by electron probe micro-analyser (EPMA; see Sect. 2.3). Li and B concentrations were measured in situ by femtosecond laser ablation inductively coupled plasma mass spectrometry (fs-LA-ICP-MS). The other major elements were included in these measurements to crosscheck the data obtained by EPMA. Glass compositions of PEG2-base, PEG2-blue and PEG2-Li-free are given in Table 1. Although PEG2-Li-free was synthesized as a Li-free counterpart, it contains traces of Li (ca. 7 ppm). From these results the aluminium saturation index (ASI) can be calculated as the molar ratio of Al (Na + K) or, including Li as a highly abundant alkali, as Al (Na + K + Li) (ASILi; Bartels et al., 2011). According to this, PEG2-blue and PEG2-Li-free have an ASI of 1.44 and 1.45 and an ASILi of 1.05 and 1.45, respectively. Therefore, the glasses are generally (strongly) peraluminous, indicating that not all Al in the melt is charge-balanced by alkalis.
2.2 Experimental procedure
Diffusion experiments were performed according to the commonly used diffusion couple technique. One glass cylinder each of PEG2-blue and PEG2-Li-free was placed in 4 mm diameter Au capsules so that cylinders were joined on the polished sides (meaning the interface). Sealed capsules were compacted at ∼ 30 MPa in a cold-seal pressure vessel (CSPV) at room temperature prior to the experimental runs. This was done to ensure capsules were gas-tight and to fix the cylinder positions inside the capsule. Temperature and time were selected systematically so that diffusion profiles are long enough (> 250 µm) to be measurable and short enough to avoid that they reach the end of the glass cylinders. Two experiments were conducted at the same temperatures with different run durations (DCLi3 and DCLi5, 6.25 and 25 min at 775 ∘C) to check whether the transport processes are exclusively diffusion-controlled.
All experiments in this study were performed at the Institute of Mineralogy, Leibniz University Hannover. A rapid-heat and rapid-quench cold-seal pressure vessel (RH/RQ CSPV, design similar to that described by Matthews et al., 2003) was used to perform Li diffusion experiments. The RH/RQ CSPV consists of an autoclave and an extension tube, which are connected via a water-circulated coupling. Only the autoclave is placed inside the furnace, and therefore the extension tube remains at room temperature during experiments. A support rod inside the assemblage can be moved using an external magnet outside of the extension tube. The pressure in the autoclave was adjusted to 100 MPa using Ar as the pressure medium during experiments. The maximum temperature for application of the RH/RQ CSPV was 940 ∘C for short-term runs at 100 MPa. The oxygen fugacity of the autoclave was not controlled in our experiments since there are no redox-sensitive elements present in the samples. Prior to an experiment, a capsule was mounted with Pt wire onto the support rod. While the autoclave was pre-pressurized with Ar and heated to the desired experimental conditions, the support rod with the sample assemblage was located in the extension tube of the device. Approximately 2 h of preheating is necessary to equilibrate the temperature inside the autoclave. Then, the capsule was rapidly moved into the hot zone of the autoclave by moving upwards the external magnet that holds the support rod. Experimental times started as soon as the capsules reached the topmost position and terminated with the beginning of the retraction of the sample.
Temperatures were monitored during experiments using a K-type thermocouple placed in an external drill hole on the top side of the autoclave. The distribution of temperatures inside the autoclave was calibrated prior to diffusion experiments at 100 MPa by inserting three thermocouples into the autoclave, whose lengths varied by 5 cm each. With this setup, the temperature of the external thermocouple was calibrated against the temperatures of the three internal thermocouples. The temperature variation over a length of 10 cm is < 5 K. The pressure was monitored using a strain gauge manometer. Maximum uncertainties of temperature and pressure are ± 5 K and ± 5 MPa, respectively. The cooling rate of samples was determined additionally using the hydrous species geospeedometer of Zhang et al. (2000). A rhyolitic glass containing ca. 5 wt % H2O (erbium doped fibre, EDF, glass composition, e.g. Withers and Behrens, 1999) was annealed at 800 ∘C and 200 MPa for 3.5 h and subsequently quenched in the same way as the diffusion couples. The relative abundances of OH groups and H2O molecules determined by NIR spectroscopy (Zhang et al., 2000; Withers and Behrens, 1999) yielded a cooling rate of ca. 20 K s−1. This value corresponds to the glass transition temperature of EDF (341–362 ∘C; calculated after models by Hui and Zhang, 2007, and Giordano et al., 2008).
All diffusion couple run products were cut in half along the cylindrical axis, mounted in epoxy and polished to 1 µm. The processed glasses contain no bubbles anymore since they collapsed under experimental conditions. This was expected since all experiments were performed at conditions above Tg of the glass. The glasses are also crystal-free, indicating that experimental times were too short for nucleation and crystal growth.
Although no water was added, small amounts of water were incorporated into the melt structure during glass synthesis originating from atmospheric water. To quantify the amount of water in experimental glasses, PEG2-blue glasses with 0.5 wt % and 1 wt % H2O were produced, which were subsequently used to determine the molar absorption coefficient for the fundamental OH stretching vibration band in the mid-infrared. Finely ground PEG2-blue powder and defined amounts of water were loaded into Au80Pd20 capsules. These water-bearing glasses were synthesized in an internally heated pressure vessel. All capsules were processed simultaneously at 1200 ∘C and 200 MPa Ar pressure for > 12 h to homogeneously dissolve the water in the melts. The glasses were quenched by switching off the heating power. Temperatures were monitored using K-type thermocouples throughout the experiment. The pressure was measured using a strain gauge manometer. Maximum uncertainties of temperature and pressure are < 5 K and < 5 MPa. Water-bearing glass pieces were embedded in epoxy to produce 60 to 100 µm thick, doubly polished sections, which were subsequently analysed by Fourier transform infrared spectroscopy (FTIR).
2.3 Analytical methods
2.3.1 Compositional analysis
Starting glass compositions and diffusion-generated concentration profiles were determined with respect to SiO2, Al2O3, Na2O, K2O, P2O5 and F using a JEOL JXA-iHP200F EPMA at the Institute of Mineralogy, Leibniz University Hannover (LUH). Major elements were measured with an acceleration voltage of 15 kV, a beam current of 10 nA and a beam size of 12 µm. With this setting, no beam damage occurred within at least 20 s measuring on the same analysis spot on our experimental glasses. Diffusion profiles were obtained as line scans perpendicular to the interface with step sizes between 30–70 µm. To ensure the quality of the measurements the rhyolitic reference materials mm3 (in-house standard) and ke3 (Mosbah et al., 1991) were repeatedly analysed during sample investigation.
Li concentration profiles were determined using a femtosecond laser ablation (fs-LA) system coupled with a sector field ICP-MS (SF-ICP-MS; Thermo Scientific Element XR) at the LUH. The major oxides SiO2, Al2O3, Na2O, K2O, P2O5 and B2O3 were included in these measurements. The laser ablation system is built in-house, based on a Spectra-Physics Solstice femtosecond laser operating in the deep UV at 194 nm. The setup was described in more detail by Horn et al. (2006) and Zhang et al. (2017). A constant repetition rate of 10 Hz was used for analyses. The laser spot size during ablation was ∼ 20 µm. To achieve a high precision, line scans were measured perpendicular to the diffusion profile (i.e. parallel to the interface; Fig. 1) with lengths of ∼ 100 µm. Up to 24 measurements per sample were obtained at various positions along the diffusion profile. The exact positions of the line scans were determined subsequently using an optical microscope. Analyses were conducted with a total integration time of 120 s, consisting of ∼ 45 s background (laser off) and ∼ 75 s of sample analysis (laser on). The scan speed was set to 5 µm s−1, and each line scan was ablated up to four times. The acquired signal was then integrated and represents the elemental concentration at the respective distance to the interface. The ablated material was transported from the ablation cell by He gas. Ar was added directly behind the ablation cell. SiO2 values determined by the EPMA were used as an internal standard (29Si). The NIST SRM 610 reference glass (350 ppm B, 468 ppm Li; Jochum et al., 2011) was used for external standardization and quantification of Li and B concentrations. Data reduction was accomplished using the SILLS software package (Guillong et al., 2008).
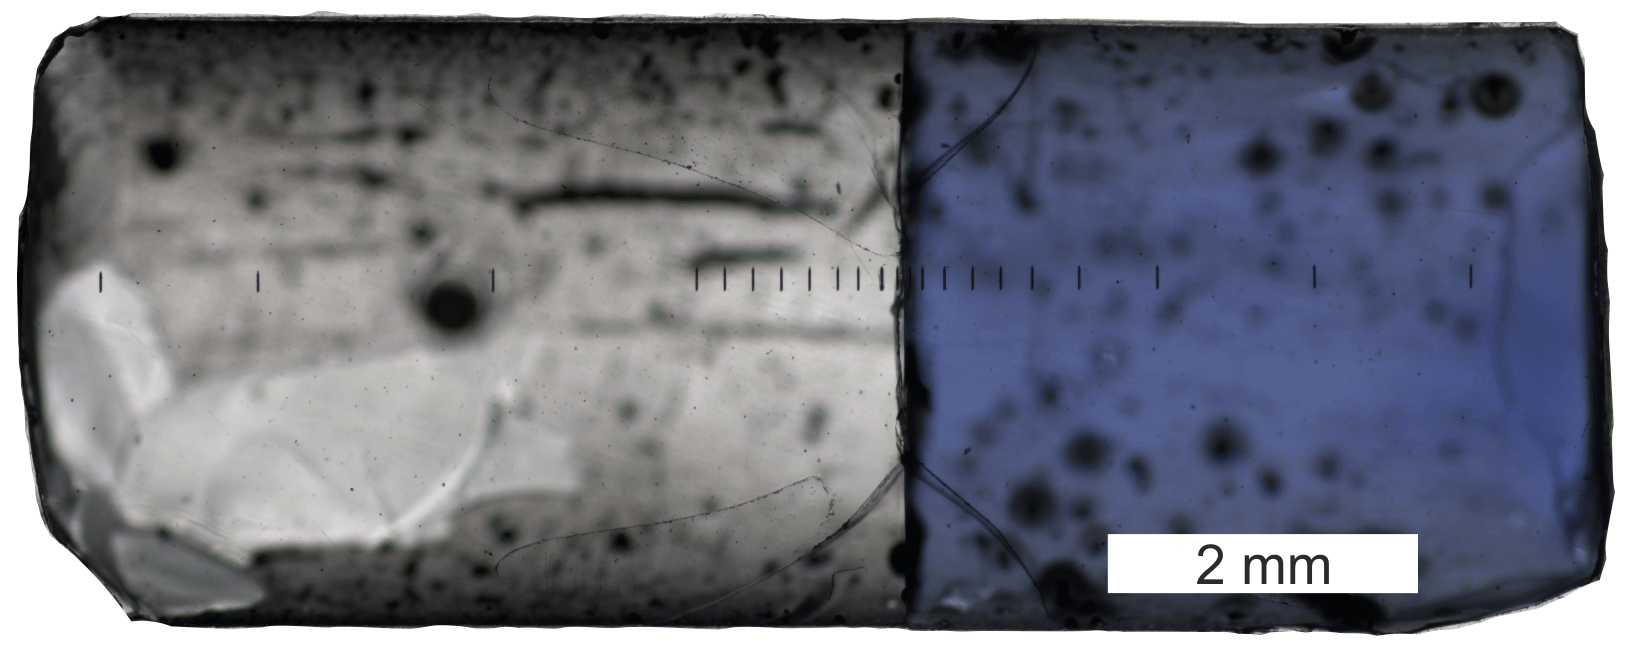
Figure 1Diffusion couple DCLi7 (940 ∘C, 5 min) after a successful experiment in transmitted light. PEG2 is on the right, and PEG2-Li-free is on the left side. The contact between the two glasses is a sharp boundary without any curvature. Black lines in the central region are laser ablation tracks. The total length of the diffusion couple is approximately 10 mm.
2.3.2 Isotope analysis
Li isotopic compositions were measured in situ utilizing the fs-LA system combined with a Neptune Plus multicollector ICP-MS (MC-ICP-MS; Thermo Scientific; Steinmann et al., 2019). Two different detector setups were employed to measure isotopic compositions. For high Li concentrations (> 80 ppm) two Faraday cups were used, equipped with 1011Ω and 1013Ω amplifiers for 7Li and 6Li, respectively. On the low-concentration side (< 80 ppm), the 1013Ω Faraday cup was used in conjunction with a secondary electron multiplier for 7Li and 6Li. Since higher-resistance amplifiers have a slower signal response, a τ correction was applied as described by Steinmann et al. (2019). All measurements were performed using a standard–sample bracketing protocol. Repetition rates were adapted during measurements in order to keep the detector's intensities as constant as possible, while the Li concentration decreased. The laser spot size during ablation was ∼ 20 µm. Individual Li isotope analyses were conducted as line scans of ca. 300 µm length parallel to the interface at a scanning speed of 5 µm s−1. Signals were collected for a total time of 180 s including 40 s of background prior to the ablation. δ7Li values are reported in ‰ relative to IRMM–016 according to
Since the diffusion profiles span a range of Li concentrations from > 8000 ppm down to ∼ 7 ppm, different bracketing and secondary reference glasses were selected. The following materials were used: ARM-1 and ARM-2 (511 ppm, 1230 ppm Li; Wu et al., 2019), GOR-132-G, T1-G (9.4 ppm Li, 20.0 ppm Li; Jochum et al., 2006; De Hoog, 2018), and NIST610 (468 ppm Li; Jochum et al., 2011). For high Li concentrations, ARM-2 was employed as bracketing reference glass, which was at the time the material with the highest Li concentration available in our lab, and ARM-1 and NIST610 were employed as secondary reference glasses. On the low-concentration side, GOR132-G and T1-G were used as bracketing and secondary reference glasses, respectively. Replicate analysis of these reference materials was taken as a measure for the accuracy and reproducibility of fs-LA-MC-ICP-MS measurements. Values of δ7Li are initially calculated relative to the corresponding bracketing reference glasses ARM-2 and GOR132-G. Subsequently, they are recalculated and reported relative to IRMM-016, which has the same Li isotope composition as L-SVEC (Qi et al., 1997). GOR132-G has a δ7Li value of 8.9 ‰ relative to IRMM-016 (Jochum et al., 2006). For ARM-2, however, there is a discrepancy for published δ7Li values by Wu et al. (2021) between those acquired by solution measurements (0.62 ± 0.58 ‰) and in situ LA-MC-ICP-MS (6.02 ± 0.54 ‰). In order to crosscheck this value, fs-LA-MC-ICP-MS analysis of the ARM-2 sample available in our lab was performed in two separate sessions. Measurements were conducted using ARM-1 and NIST610 as bracketing reference glasses and yielded averages of 2.78 ± 0.95 ‰ and 2.27 ± 0.59 ‰, respectively, relative to IRMM-016, which is right in between those values reported by Wu et al. (2021). The average value of 2.59 ± 0.94 ‰ (eight measurements) obtained in our lab was used for calculations. For the secondary reference materials, the following δ7Li values (relative to IRMM-016) were obtained: 31.9 ± 0.7 ‰ (NIST610), 0.95 ± 0.6 ‰ (ARM-1) and 4.5 ± 1.5 ‰ (T1-G), consistent with data reported in the literature (Jochum and Stoll, 2008; Wu et al., 2021; Jochum et al., 2011). All isotopic measurements were performed within 2 consecutive days. The long-term instrumental reproducibility was not further investigated in this study; however, the high precision of our setup has been previously shown and described in detail by Steinmann et al. (2019).
2.3.3 Glass density and water analysis
Glass density is needed for the evaluation of diffusion profiles, as well as for the quantification of water contents of glasses. To obtain bubble-free glasses for density measurements, bubble-bearing glasses were annealed for short times (< 5 min) at 800 ∘C and 100 MPa in Au capsules, leading to a collapse of bubbles. Densities of these glasses were determined experimentally by the buoyancy method, i.e. weighing single glass pieces of PEG2-blue and PEG2-Li-free in air and in ethanol. The masses of glass pieces were 120–214 mg, and the uncertainty of densities is < 1 %. PEG2-blue has a slightly higher density of 2.37 g cm−3 compared to its Li-free counterpart with 2.35 g cm−3 (Table 1). These values are in good agreement with densities reported by Bartels et al. (2011) for their PEG2. Densities of hydrous glasses were calculated assuming linear mixing of dry glass and pure water as described in Vetere et al. (2007). Using the molar volume of H2O of 12.0 cm3 mol−1 (Richet et al., 2000) and assuming a compaction of glass of 1 % per 500 MPa (Mysen and Richet, 2005), the density of hydrous PEG2-blue glasses can be expressed by the following equation:
with ρhydrous in grams per litre (g L−1), in weight percent (wt %) and P in gigapascals (GPa).
The water content of all synthesized water-bearing glasses was analysed by pyrolysis of samples and subsequent Karl Fischer titration as described in detail by Behrens et al. (1996). Two single glass pieces of ca. 10–20 mg were used per sample originating from the different ends of the capsule. Measured water contents were increased by 0.1 wt % H2O to account for an incomplete dehydration during pyrolysis of the samples (Leschik et al., 2004). The resulting values do not differ significantly from each other, and the mean values are 0.51 ± 0.07 wt % and 1.07 ± 0.06 wt % H2O for the two water-bearing PEG2-blue glasses.
FTIR was used to determine water contents in nominally dry and water-bearing PEG2-blue glasses. The thickness of each sample was measured with a digital micrometer (Mitutoyo). A Bruker IFS88 with an attached IRscope II was employed to collect spectra. The peak heights of the 3570 cm−1 band were used to quantify the total water concentration. The slit aperture was set to an area of ca. 100×100 µm2 in the focus plane. A globar light source and KBr beam splitter were used in all measurements. Each sample was measured three times at different positions. A total of 100 scans were accumulated for each spectrum with a spectral resolution of 4 cm−1. A linear baseline was subtracted from the gained spectra. The H2O contents were then calculated applying the Lambert–Beer law:
where denotes the content of H2O in weight percent (wt %) based on the peak height at 3570 cm−1, A3570 is the absorbance as peak height, d is the thickness in centimetres (cm), ρ is the density in grams per litre (g L−1), and ε3570 is the linear molar absorption coefficient in litres per mole per centimetre (L mol−1 cm−1). Exemplary absorbance spectra are shown in Fig. 2a for dry and hydrous glasses. All spectra were evaluated separately and indicate a homogeneous distribution of water within the samples. Using the water contents of hydrous glasses determined by Karl Fischer titration and the mean absorbance values, the linear molar absorption coefficient was determined by linear regression (Fig. 2b) as εOH= (81.2 ± 1.1) L mol−1 cm−1. The point of origin was included in the linear regression. The linear molar absorption coefficient is very similar to that reported by Leschik et al. (2004) for rhyolitic glasses. The water content determined in nominally dry PEG2-blue glasses is 507 ± 29 ppm (Table 1).
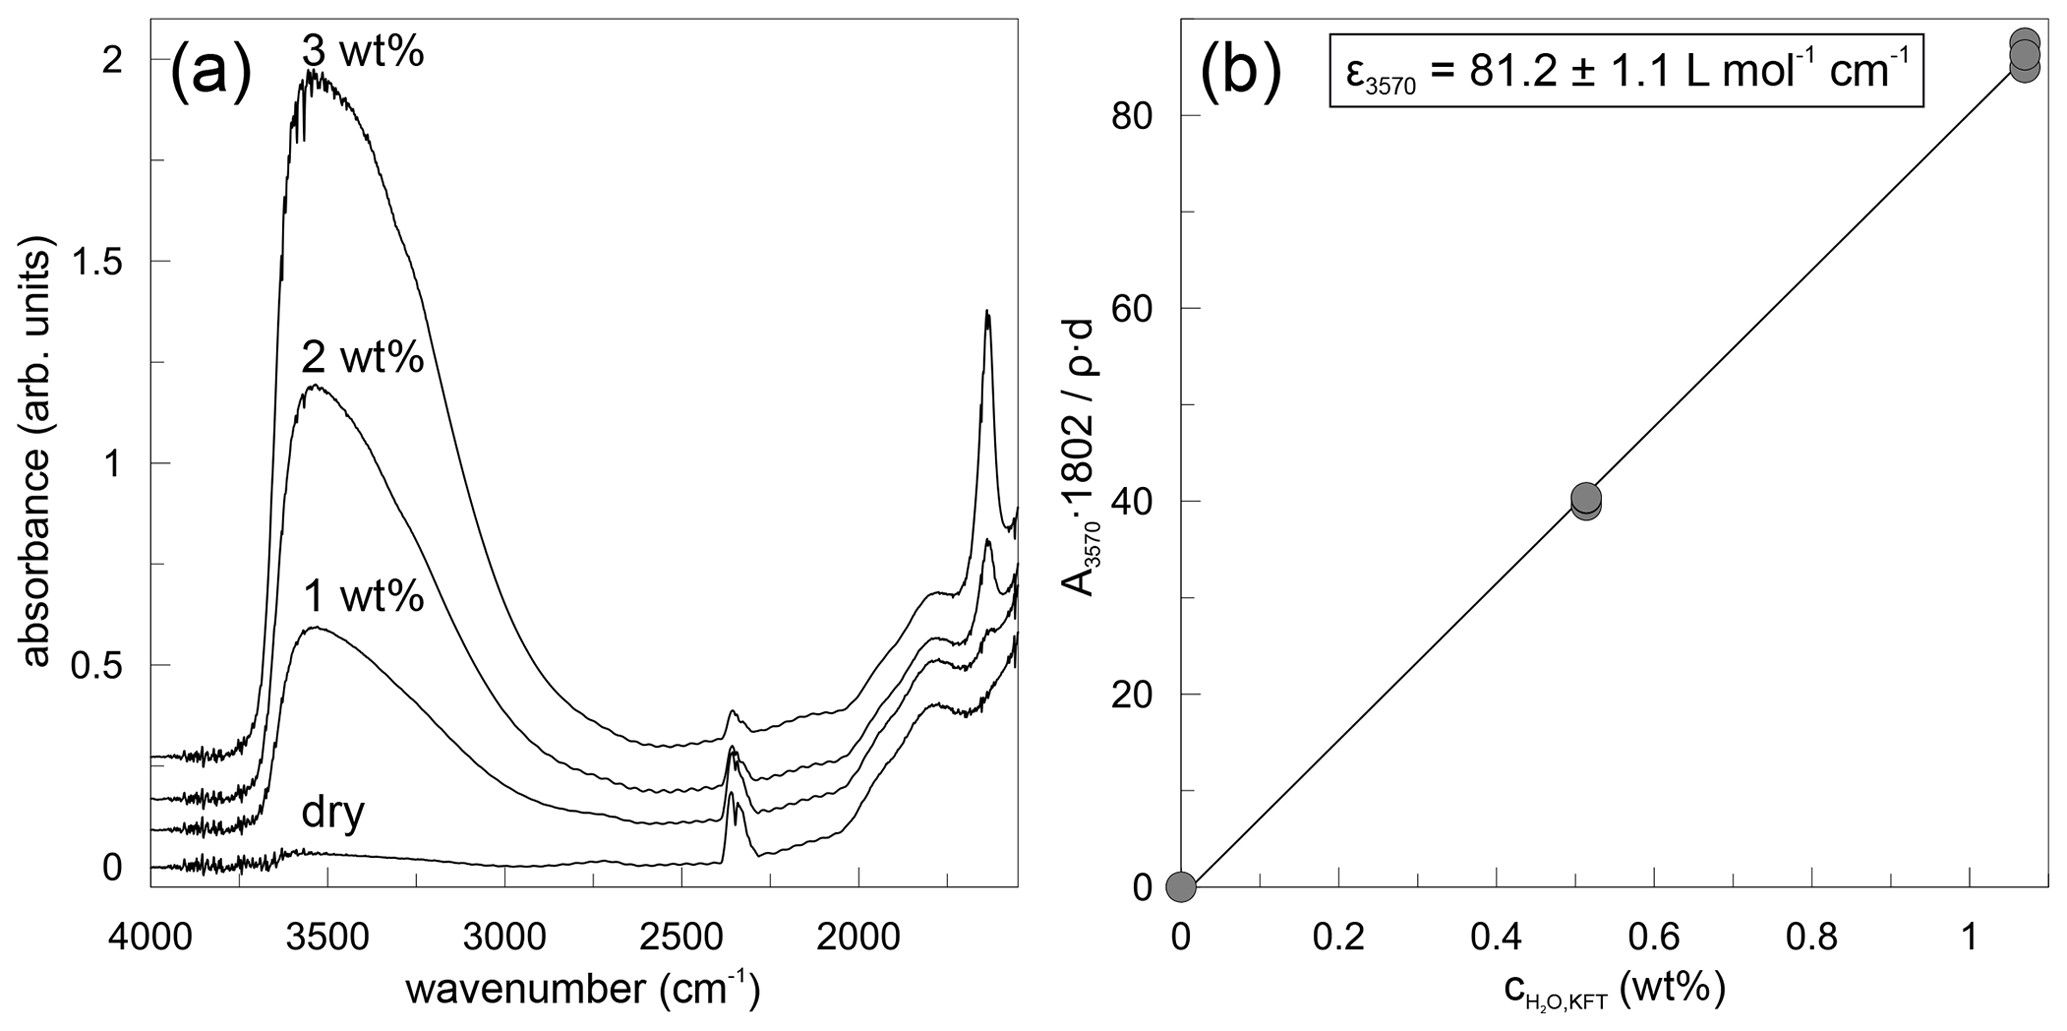
Figure 2Results of mid-infrared spectroscopy (MIR) measurements of dry and water bearing PEG2-blue glasses. (a) MIR spectra for dry and 1 wt %–3 wt % H2O glasses. (b) Calibration of water content measured by Karl Fischer titration plotted against the absorption by MIR spectroscopy.
A summary of experimental run conditions and diffusion data is given in Table 2. All run products are crystal- and bubble-free glasses, showing that all run temperatures were sufficiently above Tg. The two glass cylinders of PEG2-blue and PEG2-Li-free are fused at the contact after the experiments. The initial interface, as defined by the contact between the blue and transparent glasses, is clearly visible as a sharp, planar contact (Fig. 1). No smearing of the blue colour (as produced by Co2+) was observed in any run product. This indicates the absence of advective mixing during the diffusion experiments and confirms much slower diffusivity of the divalent Co2+ ion compared to the monovalent alkalis. On the experimental timescales, Co2+ is quasi-immobile. Using measured glass densities and the molar weights, element concentrations were recalculated to moles per litre (mol L−1).
Table 2Experimental conditions, Li–Na interdiffusion coefficients, partitioning coefficients KD and fitting parameters for isotope profiles obtained in this study.
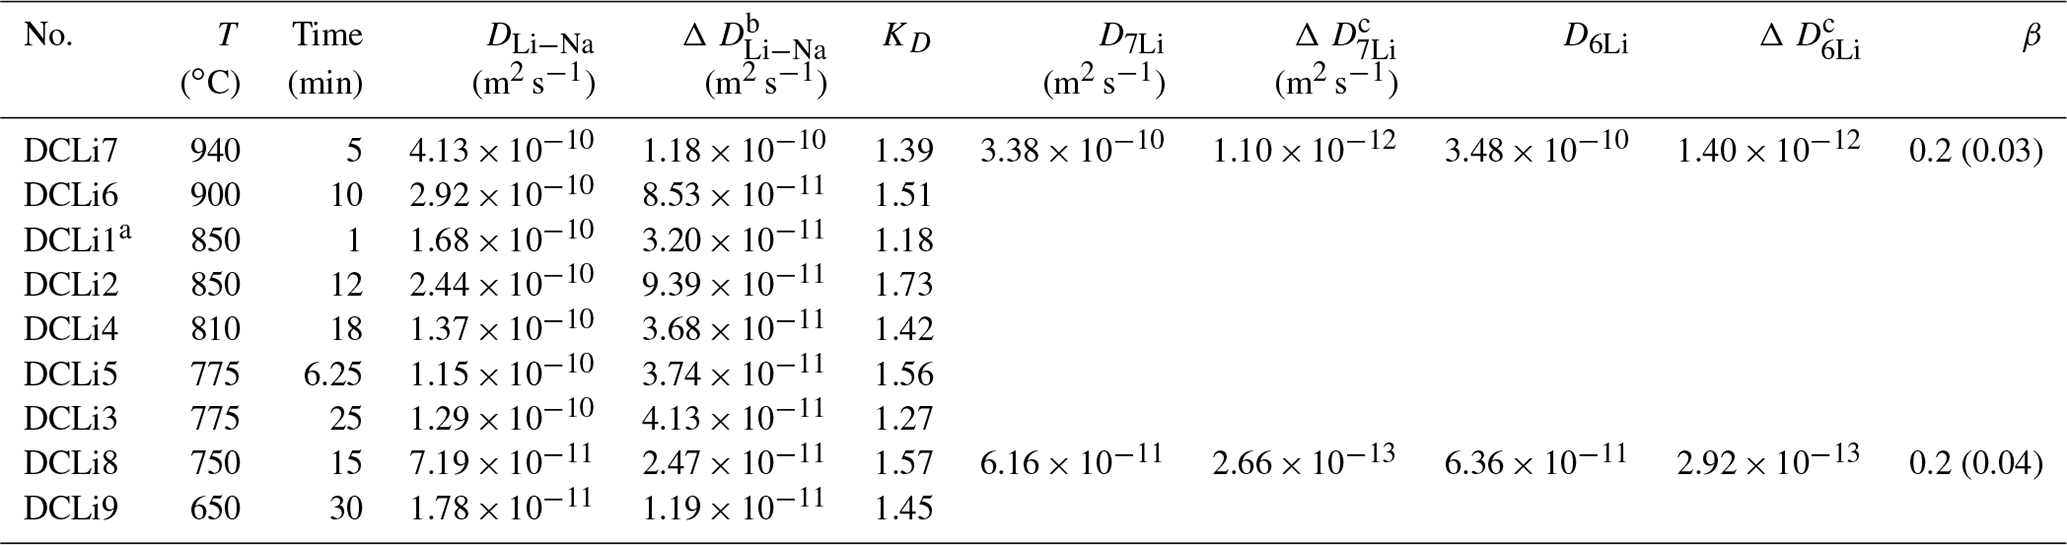
a Fit for DCLi1 is based only on Na data due to short diffusion profile. KD was not fitted but calculated on the basis of fitted DLi−Na. D7Li and D6Li are diffusion coefficients fitted to the isotopic profiles; see text for details. b Error in DLi is the total error calculated by error propagation taking experimental parameters into account. c Errors in D7Li and D6,Li are plain fitting errors since all other parameters are the same.
3.1 Concentration profiles
Li and Na are the only diffusing elements in our experiments. The other major elements remain constant over the entire length of the diffusion couples and are unaffected by diffusion (Fig. 3). The concentration profile data can be reviewed in the Supplement. Exemplary Li and Na diffusion profiles are shown in Fig. 4. Diffusion profiles display total lengths of up to 2000 µm, at which Li and Na profiles are characterized by the same lengths. Li concentration decreases continuously from the Li-rich side (PEG2-blue) towards the interface and, vice versa, increases from the Li-free side to the interface. In contrast, Na concentration increases on the Li-rich side towards the interface but decreases on the Li-free side, while Na concentrations are equal in the regions unaffected by diffusion. The Na profiles evidently mirror the Li profiles. Li and Na profiles are rotationally symmetrical with respect to the interface; i.e. the sum of Li and Na remains constant throughout each half of the diffusion couple. Both Li and Na concentration profiles are characterized by an apparent discontinuity at the interface (Fig. 4). This could be either a real jump in concentration or a very steep concentration gradient that was not resolvable with the applied analytical methods. As a first approximation, the position of the interface was defined optically to be located at the transition between the blue and transparent glasses. The exact position was refined during the fitting process (see Discussion).
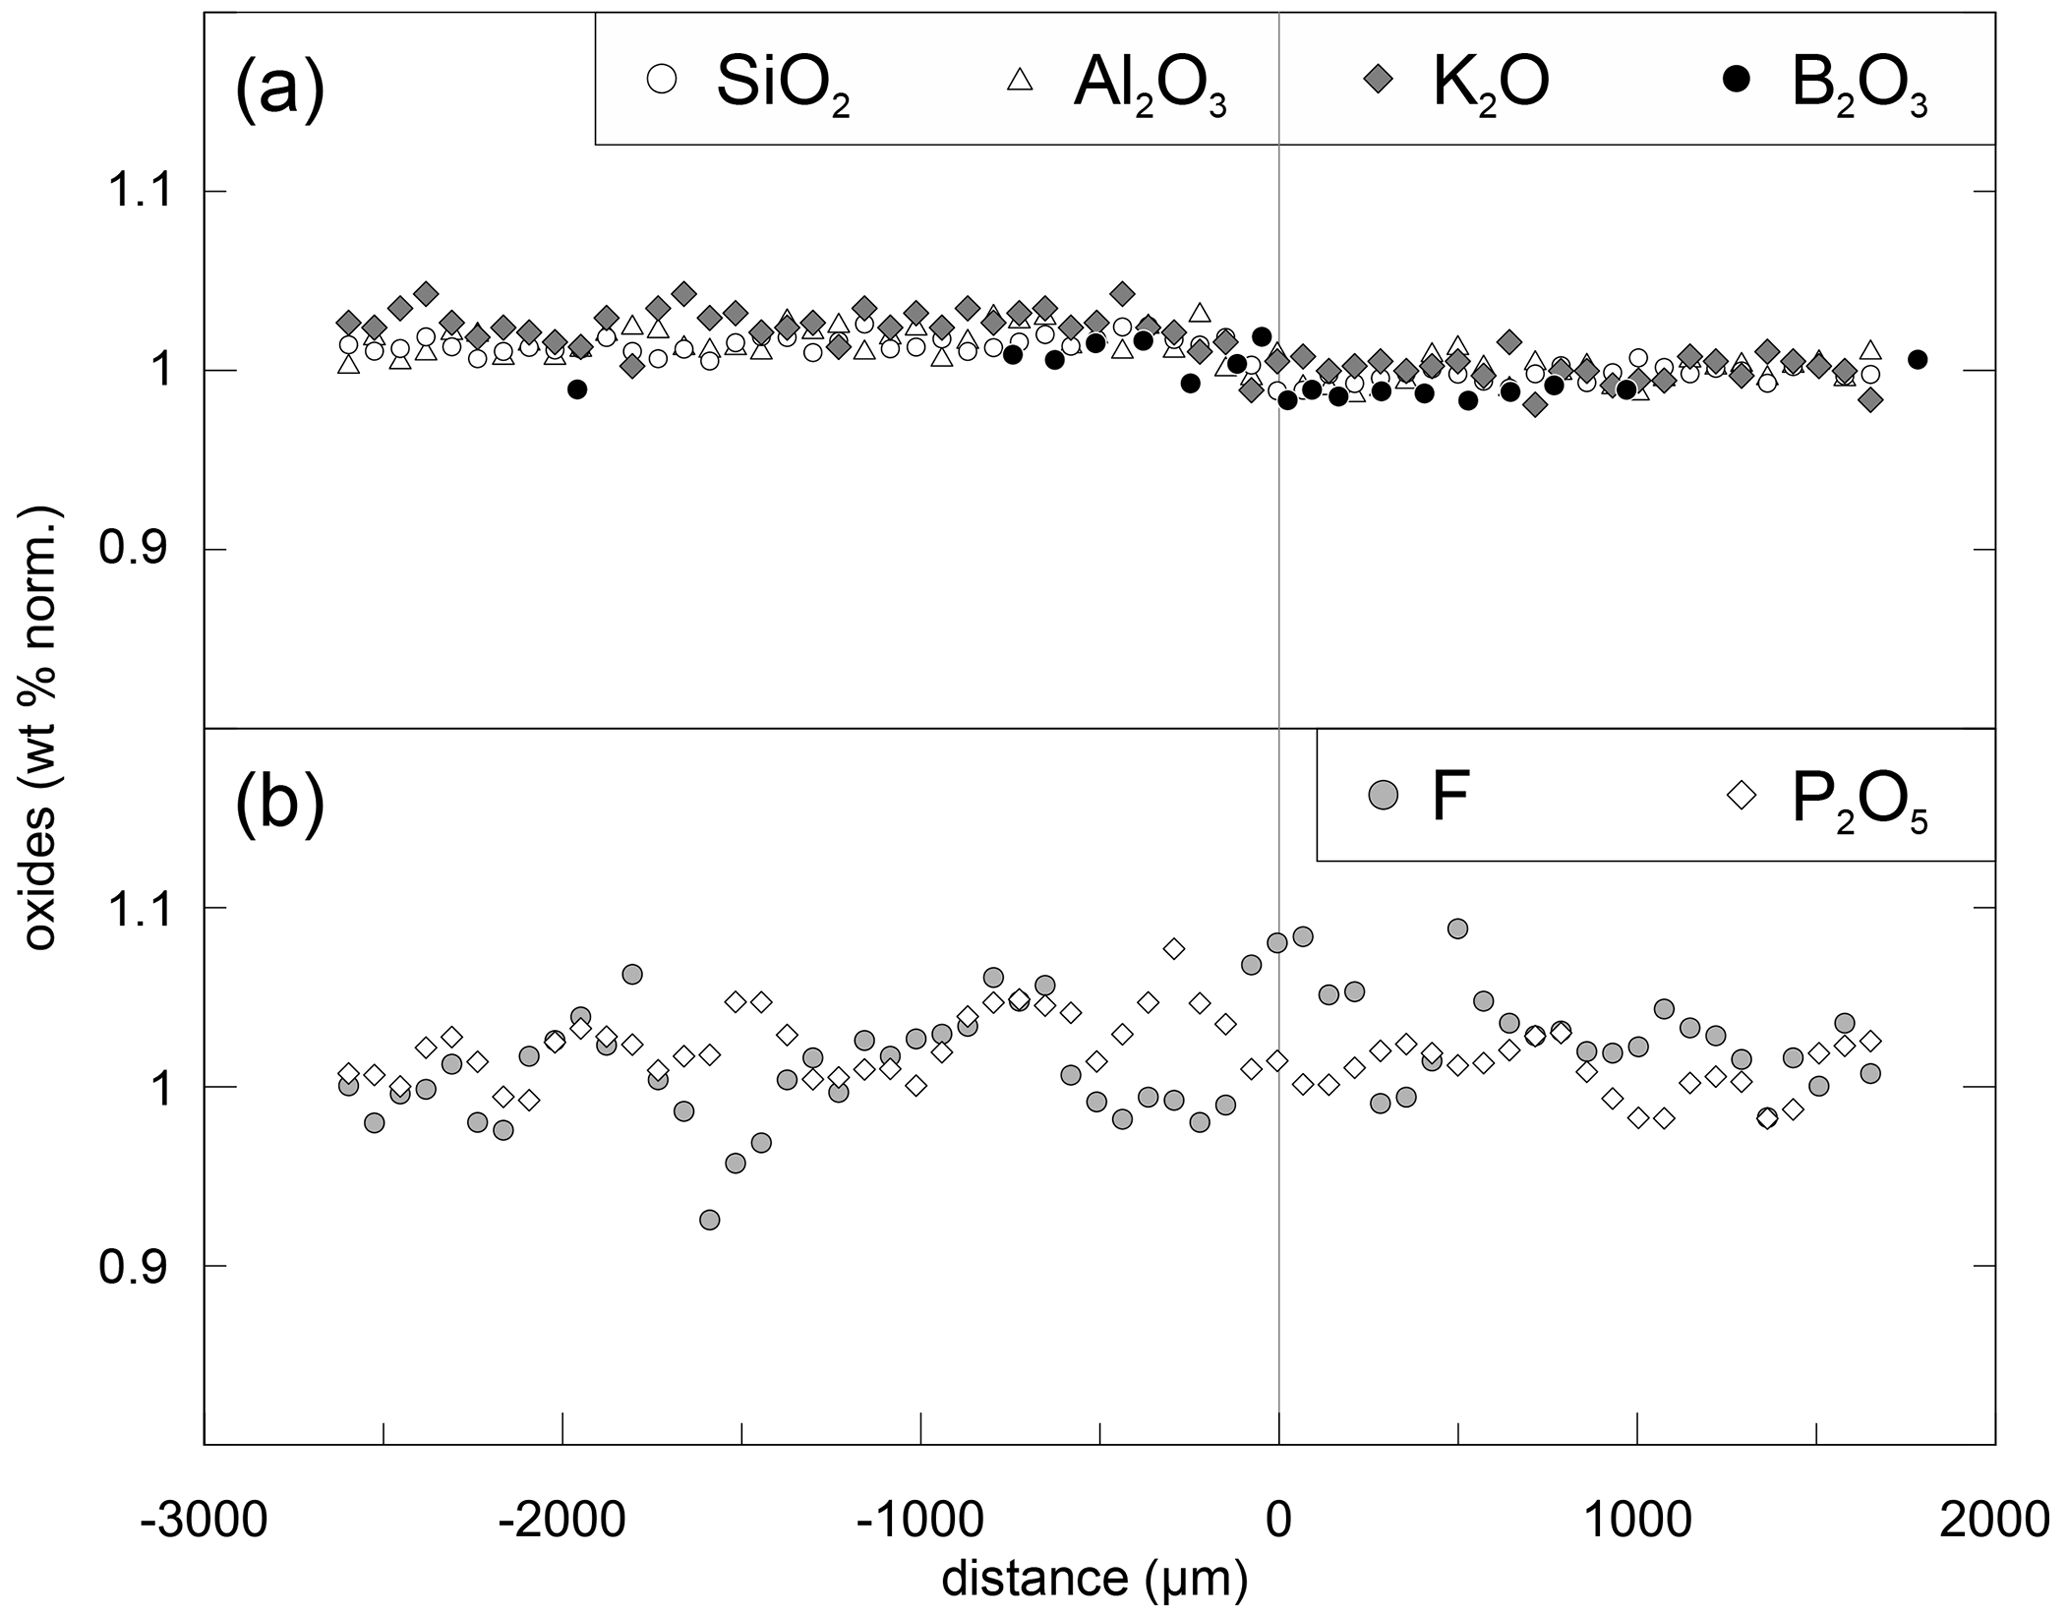
Figure 3Normalized concentrations for DCLi7 (5 min, 940 ∘C). Each component was normalized to its concentration on the right side (PEG2-blue). Upper plot (a) shows SiO2, Al2O3, K2O and B2O3, and lower plot (b) shows P2O5 and F. The slight offset between concentrations in the left and right halves is induced by the absence of Li2O in the left half (PEG2-Li-free). Since errors for P2O5 (3 %) and F (5 %) are relatively high, the data were smoothed with a moving average over three data points. All the data were acquired by EPMA except B2O3, which was measured by SF-ICP-MS.
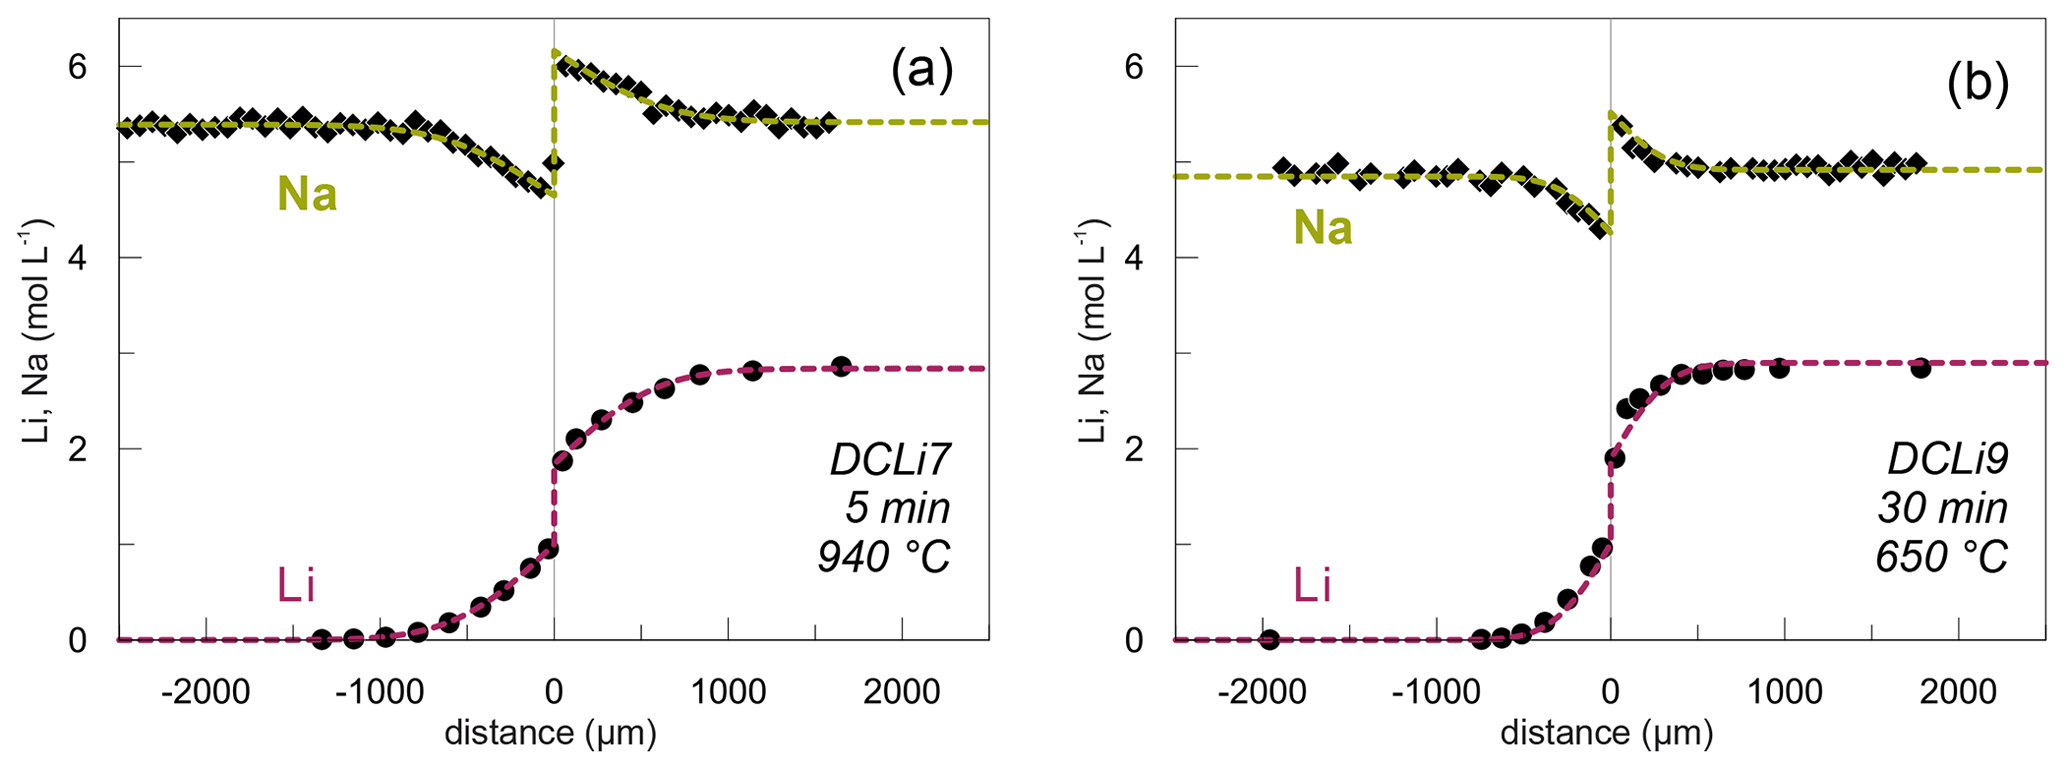
Figure 4Concentration profiles for Li (circles) and Na (diamonds; in mol L−1) showing the maximum (a) and minimum (b) temperatures investigated. Li data obtained by SF-ICP-MS and Na concentration profiles acquired by EPMA. Dashed lines show calculated theoretical fits to the data (see text for details). Experiment name and conditions are given in the bottom right corners.
Na concentration profiles were acquired additionally by EPMA. Profiles measured by EPMA and SF-ICP-MS on the same sample are compared in Fig. 5. Na concentrations determined by EPMA were systematically ca. 0.5 wt % lower compared to SF-ICP-MS. This is likely related to Na loss during interaction between the glass and the electron beam, although we checked the applicability of the measurement settings beforehand. In that case, the Na2O concentrations analysed by SF-ICP-MS give the correct total abundance of Na2O. However, shifting either dataset up- or downwards shows that the trends exhibited by Na2O abundance are the same (Fig. 5), independent of the method they were obtained by. In terms of determining diffusivities, this difference is irrelevant, since the diffusion coefficient is only influenced by the trend of the profiles and not by the absolute abundances. The precision of SF-ICP-MS data is comparable or slightly lower with respect to Na2O concentrations compared to EPMA, as is the case for Al2O3, K2O and P2O5. Shown errors are calculated on the basis of counting statistics in the case of SF-ICP-MS for each analysis spot and by the standard deviation of repeated measurements on PEG2-blue for EPMA. Since microprobe analyses were conducted as automatic overnight runs, the point density for EPMA is higher compared to SF-ICP-MS (ca. 60 vs. 24 points per profile). Nevertheless, all profiles were evaluated with respect to their diffusion coefficients and will be compared in a later section.
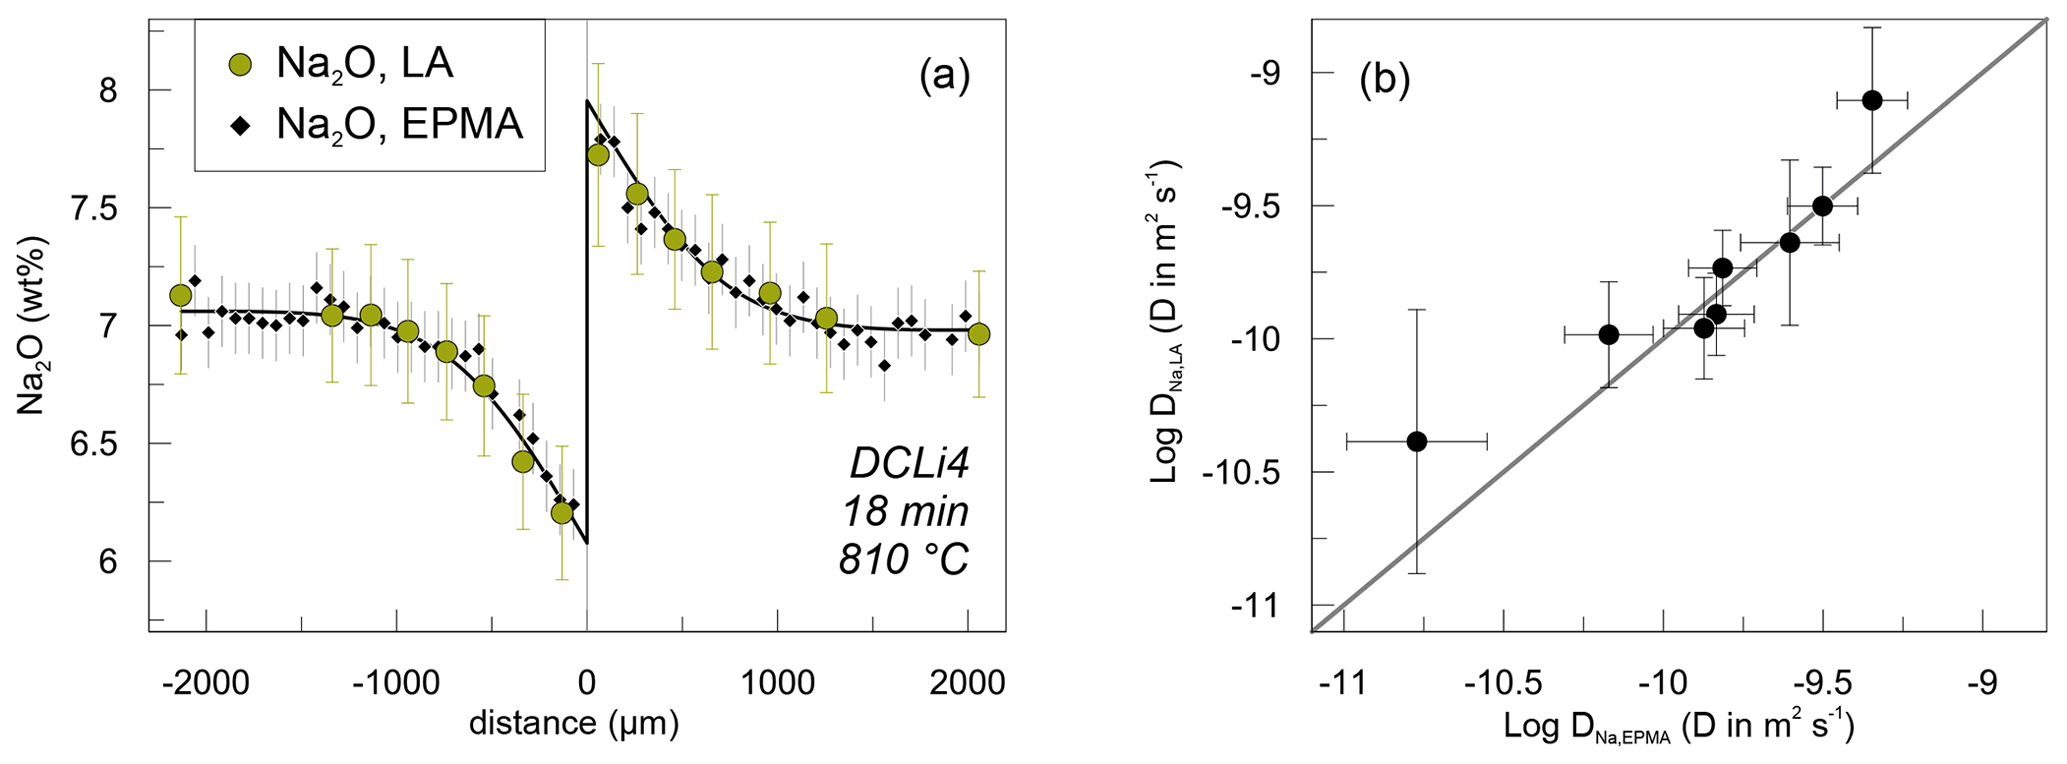
Figure 5Comparison between results for Na diffusion data obtained by SF-ICP-MS and EPMA. (a) Exemplary Na concentration profiles measured by SF-ICP-MS (green circles) and EPMA (black diamonds) on sample DCLi4. The solid line represents a calculated fit to the EPMA data. The error bars indicate 2σ standard deviation for EPMA and SF-ICP-MS Na analysis. (b) Diffusion coefficients determined on the basis of SF-ICP-MS and EPMA data including fit errors.
3.2 Isotopic profiles
Li stable isotope (6Li and 7Li) profiles were measured in the two experiments DCLi7 and DCLi8 (Fig. 6). In the diffusion-unaffected regions, δ7Li is 3 ‰ in PEG2-blue and 15 ‰ in PEG2-Li-free. This shows that PEG2-Li-free is enriched in 7Li compared to PEG2-blue, which was synthesized by addition of a spodumene glass (see Sect. 2.1). This isotopic difference will be considered during the fitting of the observed δ7Li profiles. There is a tiny increase in δ7Li on the PEG2-blue side towards the interface from 3 ‰ to ca. 5 ‰. On the Li-free side, δ7Li decreases dramatically to −85 ‰. The minimum in δ7Li coincides with the position where the concentration of Li almost reaches the plateau of 7 ppm. The strong decrease in δ7Li is caused by the different diffusivities of 6Li and 7Li, where the lighter 6Li diffuses faster than the heavier 7Li. Comparing the δ7Li profiles of DCLi7 and DCLi8 shows that the degree of diffusion-driven isotope fractionation is similar in both cases, even though the experiments were conducted at different temperatures and durations (940 ∘C and 5 min, 750 ∘C and 15 min, respectively).
4.1 Evaluation of diffusion profiles and experimental boundary conditions
All concentration–distance profiles were initially evaluated assuming one-dimensional diffusion in two adjoining semi-infinite media characterized by two individual diffusion coefficients. Because of the steep concentration gradients for Li and Na at the interface, we treat the two sides of the diffusion couple as different phases (in thermodynamic equilibrium only one liquid composition would be stable), for which an apparent partition coefficient for Li and Na can be assigned as follows:
where ki is the partitioning coefficient for i (i= Li, Na) and c1,i and c2,i are the concentrations (mol L−1) of i at the interface for x > 0 and x < 0, respectively. This approach can be justified by the two experiments at 775 ∘C with different run durations (DCLi3 and DCLi5, 6.25 and 25 min; Table 2), where constant apparent partitioning coefficients were observed. For this boundary condition we can apply the analytical solution as given by Crank (1975):
as well as a slightly modified version of Eqs. (5) and (6) to model the mirrored Na concentration profiles:
where c0,Li is the initial Li concentration for x > 0, and c1,Na and c2,Na are the Na concentrations for x > 0 and x < 0, respectively. t is the annealing time, erf and erfc are the error and complementary error functions, respectively, and i= Li, Na. The 7 ppm Li in PEG2-Li-free has a negligible effect on the modelled profiles, and therefore the initial Li concentration in PEG2-Li-free was set to 0.
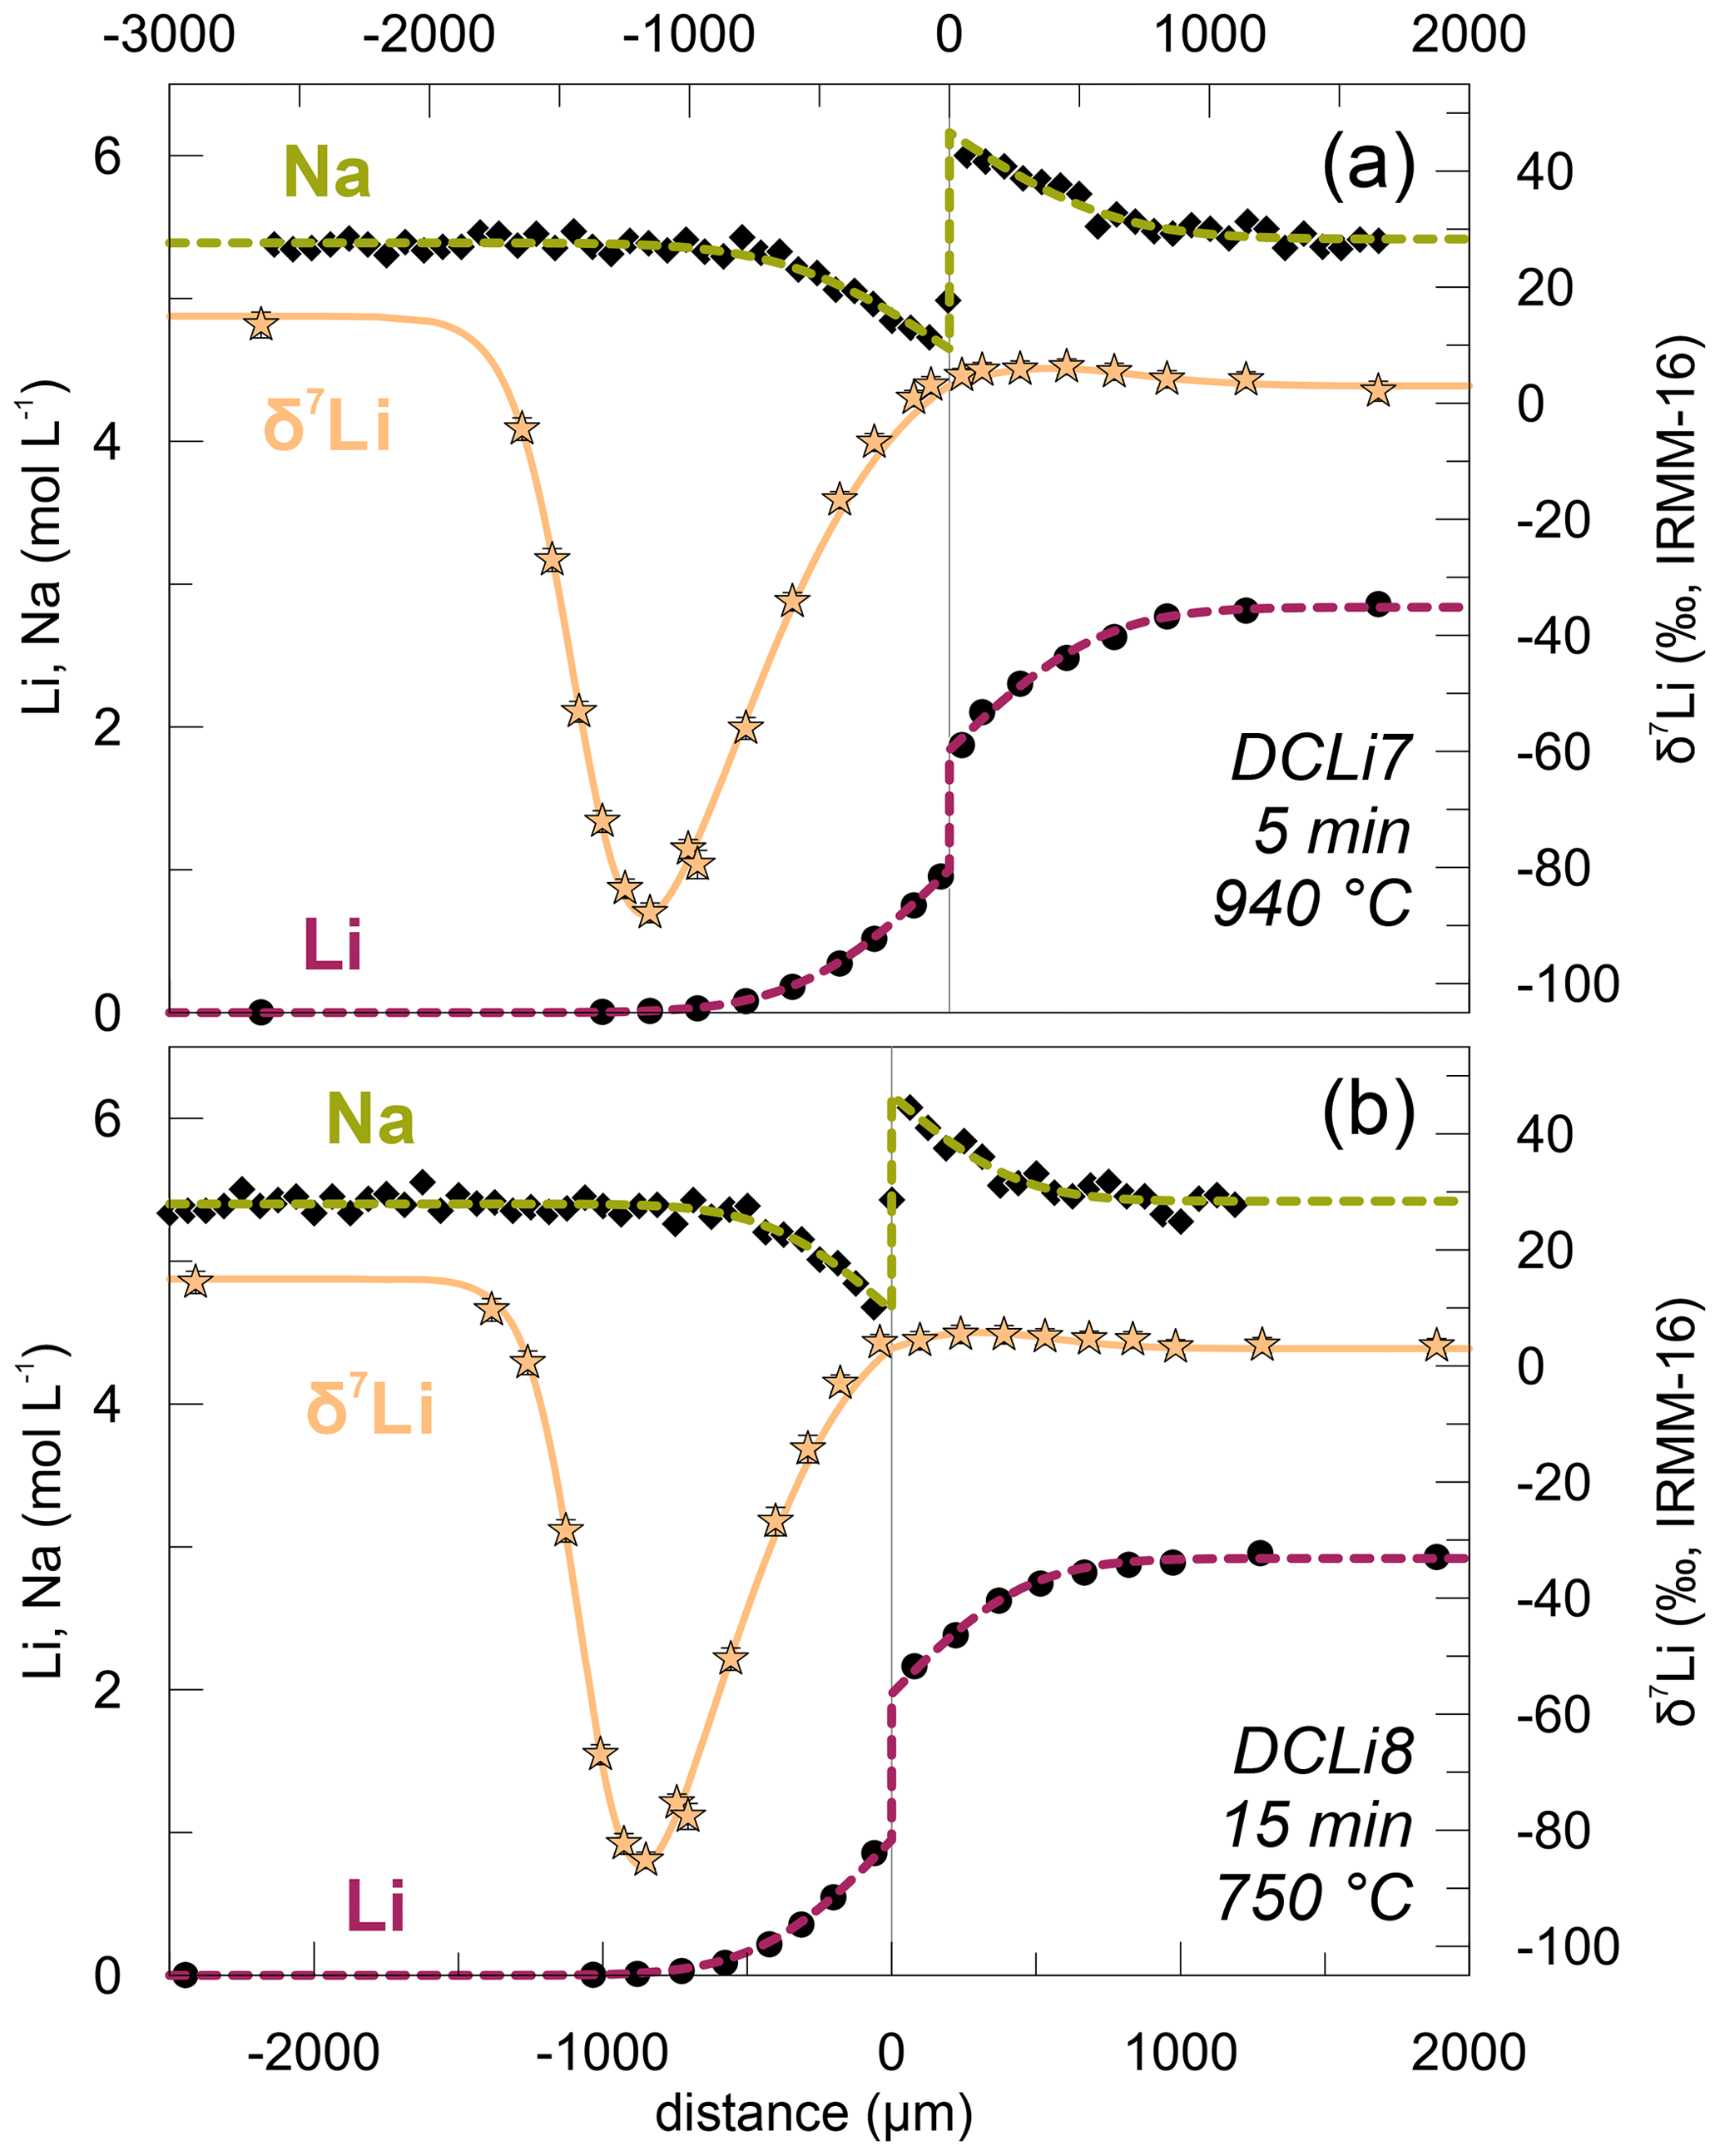
Figure 6Combined plot of δ7Li measurements along with Li and Na concentration profiles in (a) DCLi7 and (b) DCLi8. The Li isotopic composition decreases close to the interface in PEG2-Li-free due to kinetic fractionation of Li isotopes compared to PEG2-blue and the diffusion-unaffected part of PEG2-Li-free. The amplitude of this effect is similar in (a) and (b) and therefore independent of temperature. The dotted lines are calculated fit curves according to the corresponding equations given in the text. A β value of 0.20 was used for both fits.
Concentration profiles determined by SF-ICP-MS (Li and Na) and EPMA (Na) were fitted to Eqs. (5)–(8). To verify the interdiffusive exchange between Li and Na, apparent Li and Na diffusion coefficients were fitted individually as an intermediate step. In a first fitting attempt, the parameters D1,i, D2,i,ki, c0,Li, c1,Na and c2,Na were allowed to freely vary. The interface position was manually refined by shifting it optically to fit the modelled profiles to the measured data. However, only minor adjustments < 20 µm were necessary. The diffusion profiles are perfectly reproduced by the fit curves (Fig. 4). Resulting diffusion coefficients D1,i and D2,i are indistinguishable on either side of the diffusion couple and for Li and Na within their respective errors. Therefore, diffusion profiles were modelled again with simplified Eqs. (5)–(8), presuming the entire profile is controlled by only one diffusion coefficient, i.e. . Similar to the first approach, Li and Na diffusion coefficients are in good agreement within errors. This proves that the exchange of Li and Na can be regarded as interdiffusion described by a single interdiffusion coefficient DLi−Na. Furthermore, it demonstrates that the compositional difference between the starting glasses does not significantly affect the Li–Na interdiffusion. The interdiffusion coefficients DLi−Na are reported as averages between apparent Li and Na diffusivities for each experimental run (Table 2). The results of intermediate Li and Na fits can be reviewed in the Supplement.
Apparent Na diffusion coefficients obtained by SF-ICP-MS and EPMA are indistinguishable within errors (Fig. 5b). The fitting errors, however, are higher when using the SF-ICP-MS data (Fig. 5). This is related to the larger spacing of analysis spots inherent to SF-ICP-MS, while EPMA analysis spots are more densely distributed. The EPMA data are especially suited for determining the distribution coefficient k because the concentrations on either side of the interface are well confined. Based on these observations, EPMA data are favoured over SF-ICP-MS for Na concentration analysis and are used to constrain the Arrhenius parameters for Li–Na interdiffusion.
Due to the low activation energy, Li–Na interdiffusion likely occurs already during heating and proceeds during cooling of the samples. To quantify the contribution of heating and cooling to the evolution of the exchange profiles, we performed a very short experiment (DCLi1, 1 min) and compared it to its longer-running counterpart conducted at the same temperature (DCLi2, 12 min). Applying the diffusion coefficient (see Sect. 4 for details) of the longer run (DCLi2) to model the short-running experiment (DCLi1) yields an effective time at experimental conditions of 40 s (Fig. 7). Thus, the combined effects of heating and cooling equal a diffusion time of 20 s at nominal run conditions. Considering this correction for the 12 min experiment would result in a 3 % higher diffusion coefficient. To compensate for this systematic effect, all nominal experimental times were adjusted by a decrease of 20 s, and the resulting effective experimental times were used to model the profiles.
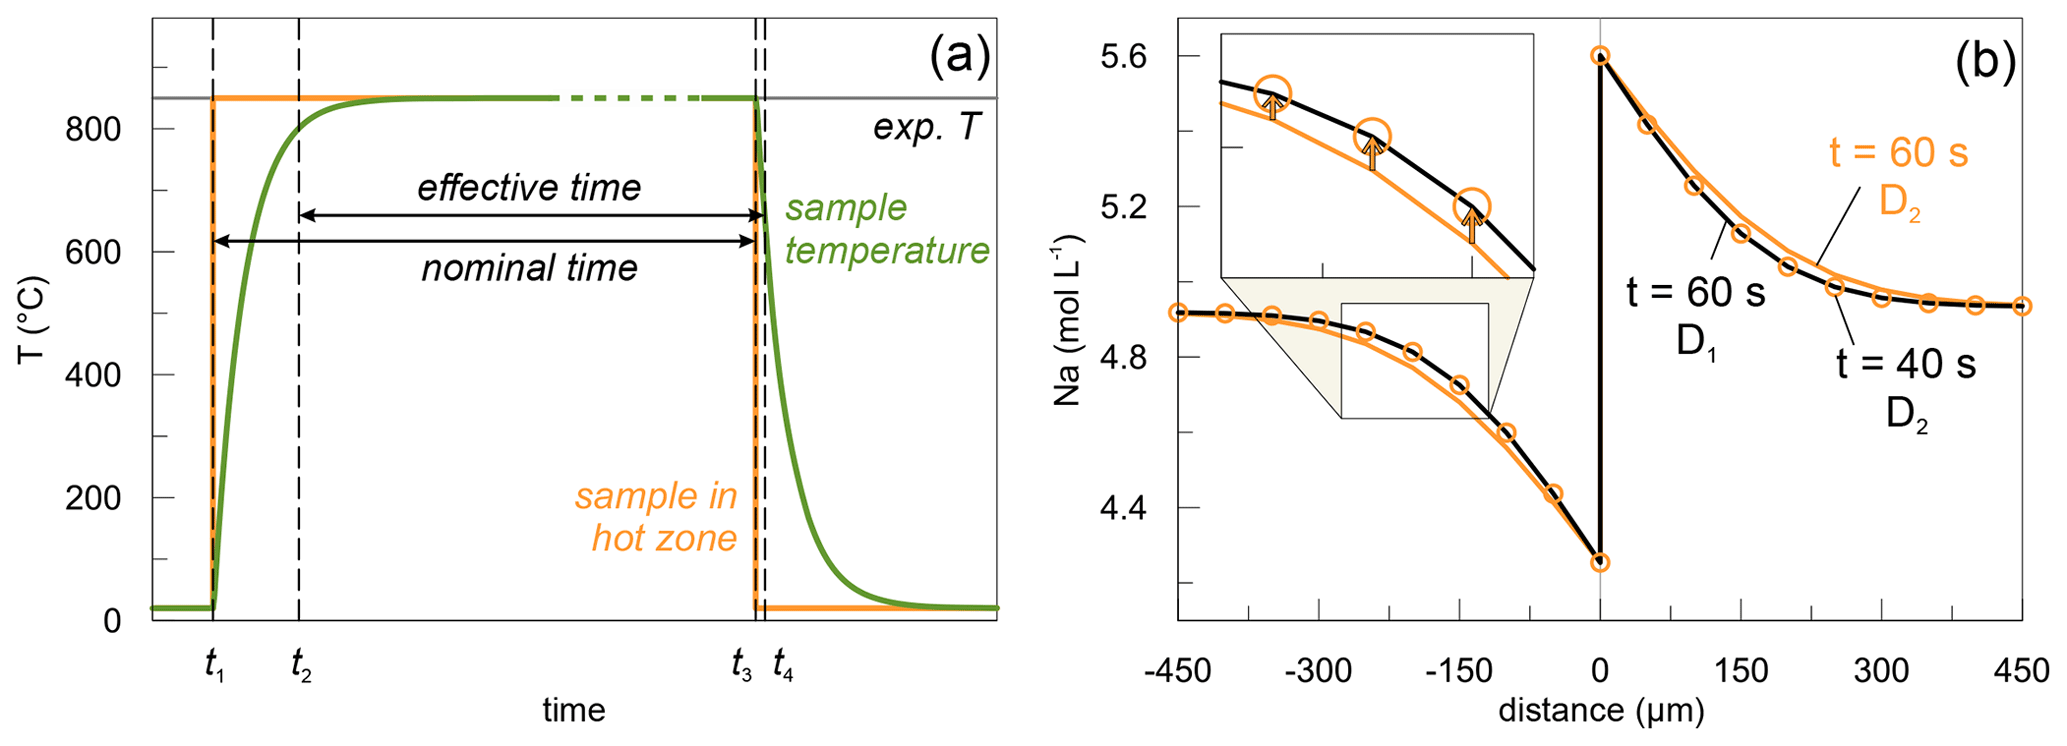
Figure 7Considerations about the effective experimental times. (a) Theoretical time–temperature pathway during a diffusion experiment conducted at 850 ∘C. At t1 the sample is moved into the hot zone, and at t3 it is retracted back into the cold zone (extension tube). t1 and t3 delimit the nominal experimental time. Since heating and cooling of the material do not occur instantaneously, t2 and t4 denote the times between which the sample temperature is sufficiently high for Li and Na to diffuse, and hence these define the effective experimental time. Image is purely qualitative and not to scale. (b) Fitting of DCLi1 data using estimated diffusion coefficient of DCLi2 (850 ∘C, 12 min). The black line represents the DCLi1 concentrations and is calculated using the diffusion coefficient D1 derived from (a). The yellow line is calculated based on DCLi2 diffusion coefficient D2 assuming an annealing time of 1 min. The yellow circles are fitted to the black line by using D2 and adjusting the experimental time to 40 s.
4.2 Li–Na exchange mechanism
The interdiffusion coefficient DLi−Na is controlled by the self-diffusivities of the individual species and the concentrations of the respective elements. The self-diffusivity of an element can be determined either by dedicated self-diffusion experiments (e.g. different isotopes of the same element) or by tracer diffusion experiments (traditionally thin-source deposition of radioactive tracer) of the respective elements. The following equation can be derived linking self-diffusivities to the chemical or interdiffusion coefficient:
where DLi−Na is the interdiffusion coefficient, refers to the self-diffusion coefficients of i (i= Li, Na), Xi is the mole fraction of i, and φ is the thermodynamic factor. This equation goes back to Manning (1968) and was used, for example, to describe Fe–Mg interdiffusion in olivine (Chakraborty, 1997), Na–K interdiffusion in alkali feldspar melts (Freda and Baker, 1998) and Na–K interdiffusion in alkali feldspar (Schäffer et al., 2014). Although Eq. (9) shows that the interdiffusion coefficient is concentration-dependent, a compositional dependence of DLi−Na was not observed in this study; i.e. the diffusion coefficients are the same in both halves of the diffusion couple, and profiles are symmetrical with respect to the interface. However, our experiments only cover a compositional range of XLi < 0.4, and a compositional dependence might exist at higher XLi.
Comparing our determined DLi−Na to Li and Na tracer diffusion coefficients in dry rhyolitic melts shows that they are the same within 0.3 log units. Li and Na tracer diffusivities themselves differ by less than 0.2 log units in the temperature region relevant to this study (Margaritz and Hofmann, 1978; Jambon and Semet, 1978; Jambon, 1982; Fig. 8). The similarity between tracer diffusivities of Li and Na further explains the compositional independence of DLi−Na. The K tracer diffusivity in dry rhyolite, on the other hand, is 1.5–2 orders of magnitude slower (Fig. 8; Jambon, 1982, and review by Zhang et al., 2010). Rhyolite was chosen as a reference system for the lack of tracer diffusion data for the pegmatitic melt used in this study. As both Na and K are highly abundant in our studied system, they present potential alkalis for interdiffusive exchange with Li. The similarity between Li and Na tracer diffusivities is indicative of why Na is favoured for interdiffusion with Li instead of K. Furthermore, no mixed-alkali effect is obvious in the studied system (e.g. Isard, 1969). This might be related to the relatively small ionic sizes of Li+ and Na+ (0.76 and 1.02; Shannon, 1976) so that the bigger Na+ is still small enough to avoid clogging diffusion pathways. It is worth pointing out the difference between these tracer diffusion experiments and our experiments here. In the cited studies, a few tens to hundreds of parts per million Li are deposited onto the studied melts before annealing. Technically, in these Li tracer diffusion experiments, Li diffusion is still controlled by interdiffusion. However, due to the trace amounts of Li in these experiments its diffusivity approaches self-diffusivity (see Eq. 9). In our setup Li concentrations are orders of magnitude higher, and hence the Li diffusivity is strongly coupled to interdiffusion with Na.
The interface jump is a very prominent feature of the diffusion profiles obtained in our study. It is likely caused by a chemical potential difference in Li and Na between the diffusion couple halves. In the experiments, Na migrates from PEG2-Li-free into PEG2-blue, indicating the higher chemical affinity of Na for PEG2-blue. The major chemical difference between PEG2-blue and PEG2-Li-free is the high Li abundance of ∼ 1.8 wt % in the former, while the latter contains only parts per million levels of Li. Being a monovalent alkali, Li acts as a network modifier in silicate melts and depolymerizes the melt structure, similar to Na and K. Hence, it is evident that the Li-rich PEG2-blue is more depolymerized than its Li-free counterpart PEG2-Li-free. The potential gradient is directed from PEG2-Li-free towards PEG2-blue, and both alkalis partition into the more depolymerized structure of PEG2-blue. For Na, however, the driving force is greater than for Li. This results in a flux of Na, albeit with the absence of an obvious concentration gradient, or in other words uphill diffusion of Na. Based on the spatial resolution of EPMA analysis (∼ 30 µm) it can be stated that the apparent jump is either a real jump or a very steep concentration gradient at the interface with an extent of less than ∼ 30 µm.
The concentration jump for Li and Na at the interface was modelled using an apparent distribution coefficient k (Fig. 9), which is defined as the concentration ratios of both Li and Na at the interface (Eq. 4). This coefficient k is distinct for Li and Na, yet for each species it is constant throughout all temperatures and is time-independent. The different k values for Li and Na arise from the fact that the absolute molar abundances of Li and Na are different, and therefore, their ratios must be different. The variance of k for Li is higher compared to Na because Li concentrations are not well constrained directly at the interface. In terms of absolute molar difference, the jump is equal for Li and Na since it is confined by charge balance. From a thermodynamic point of view, local equilibrium between the two glasses is established at the interface. This equilibrium can be described by the following reaction: Li1+ Na2= Na1+ Li2, where 1 and 2 refer to the respective halves of the diffusion couples. Therefore, the chemical potentials of Li2O and Na2O are equalized in both glasses according to the Clausius–Clapeyron equation. The adjustment of Li and Na ratios at the interface occurs almost instantaneously, as suggested by the jump developed even in the shortest experiment (DCLi1, 1 min), which can be characterized by a k value similar to those of the longer-running experiments. The complete Li–Na exchange reaction can be quantitatively described by a partitioning coefficient KD, assuming an ideal solution, where the activity coefficients equal 1:
where xLi and xNa are defined as the molar fractions of Li and Na in the respective diffusion couple halves. Applying this to the dataset obtained in this study results in a KD value of 1.45 ± 0.16 averaged over all temperatures.
The Clausius–Clapeyron equation implies the following relationship between the distribution coefficient KD and the temperature:
where ΔG0 is the standard Gibbs free energy, R is the universal gas constant, and T is the temperature. This clearly suggests an exponential dependence of the distribution coefficient on the temperature. While our data do not explicitly show such a dependence due to the uncertainty of the data and the limited temperature coverage, a weak temperature dependence cannot be ruled out.
Close inspection of the presented concentration profiles reveals that Li and Na concentrations at the interface do not exchange exactly in a 1 / 1 ratio. This can have several reasons, where the following are the most relevant. LA spots have a larger spacing and a larger spot size, which allows for a less precise determination of Li concentrations at the interface. The larger spot size during LA facilitates strong convolution effects close to the interface, which is less pronounced during EPMA measurements. Furthermore, NIST610 was used as a reference material to quantify Li concentrations, although it only contains 511 ppm Li, which may lead to inaccurate quantification of Li concentrations especially on the high-concentration side. Nevertheless, the direct exchange of Li and Na is evident from the observation that the other elements are constant throughout the diffusion couples.
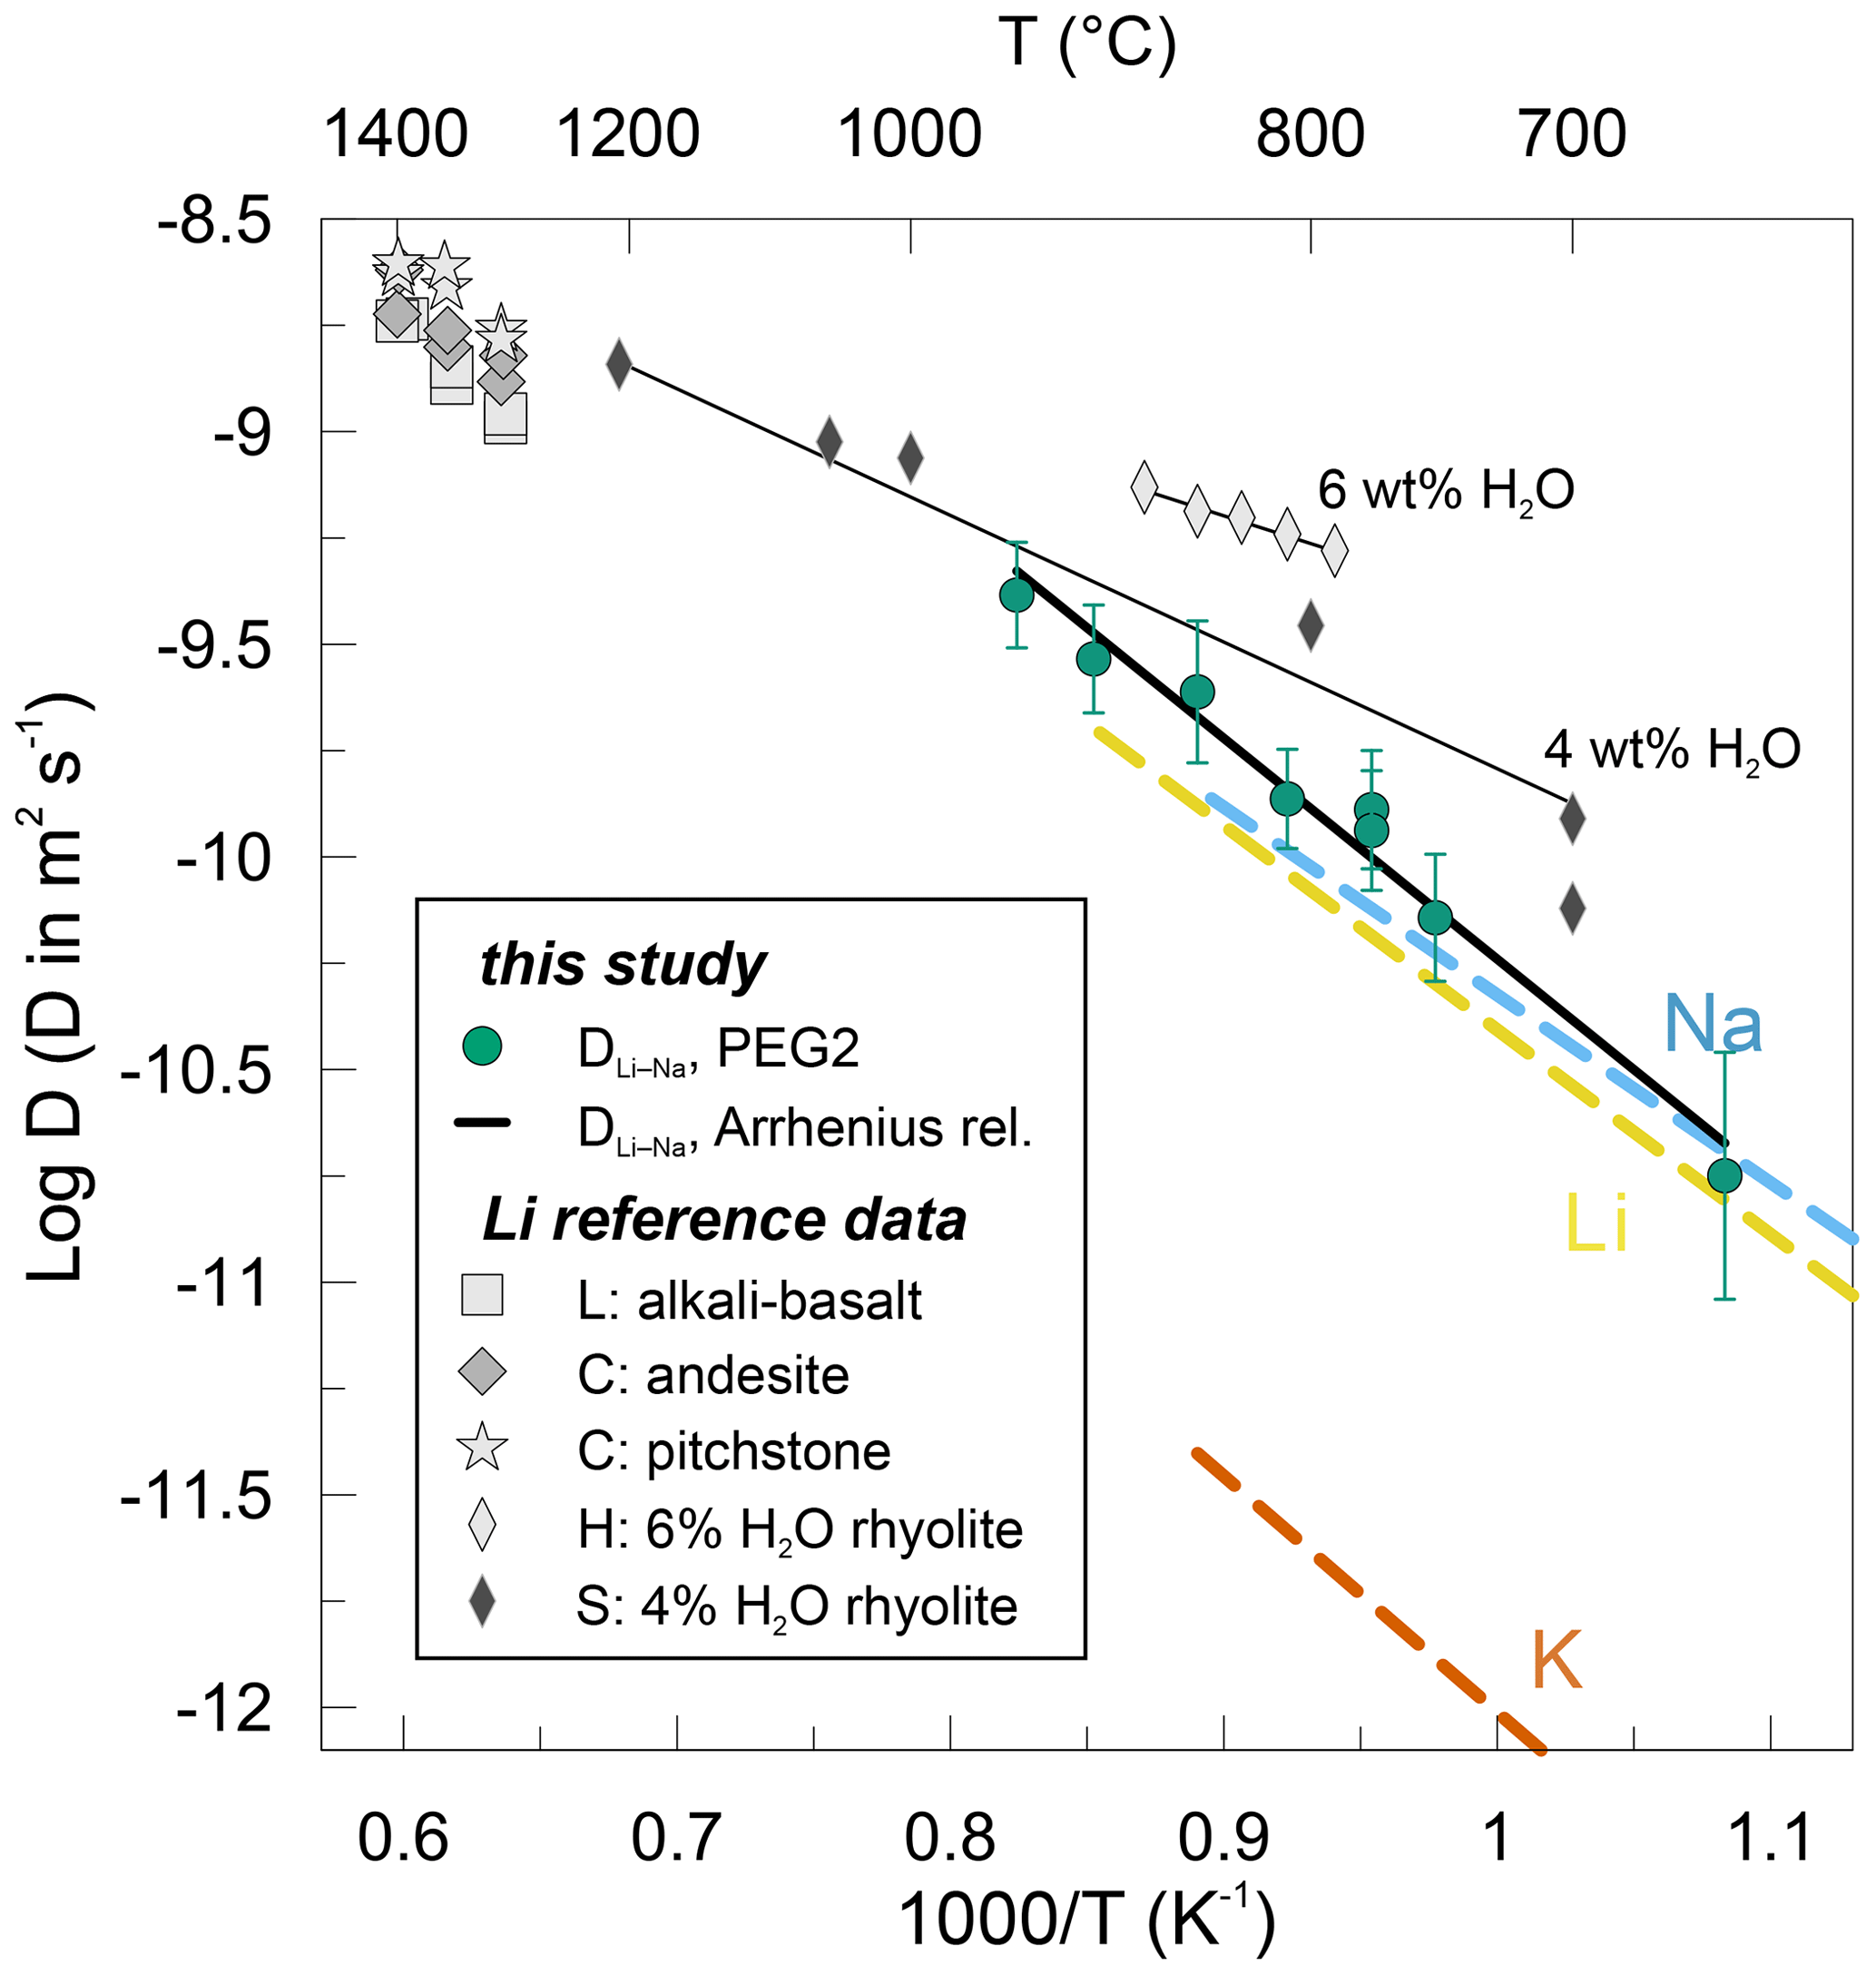
Figure 8Arrhenius plot showing Li–Na interdiffusion coefficients determined in this study (filled dots). The solid black line represents linear regression of Li–Na interdiffusion data obtained in this study. Li, Na and K tracer diffusion data are shown as dashed lines for dry rhyolitic melts (Margaritz and Hofmann, 1978; Jambon and Semet, 1978; Jambon, 1982). Li tracer diffusion coefficients are displayed for various dry melts, such as alkali basalt (L: Lowry et al., 1981), andesite and pitchstone (C: Cunningham et al., 1983), as well as for hydrous rhyolitic melts (H: Holycross et al., 2018; S: Spallanzani et al., 2022). Thin solid black lines represent the Arrhenius relationship for the respective hydrous rhyolitic melts.
4.3 Diffusion–temperature relationship and compositional effects
The interdiffusion data produced in this study display Arrhenian behaviour, i.e. show an exponential dependence on reciprocal temperature. The data can be described by the Arrhenius equation for diffusion:
where Di is the diffusivity of species i, D0 is the pre-exponential factor, Ea is the activation energy, R is the ideal gas constant, and T is the temperature (in K). Arrhenius parameters for Li–Na interdiffusion are as follows: Ea=99.4 ± 6.7 kJ mol−1 and log ± 0.33.
The data acquired in this study are compared to an extensive set of existing Li tracer diffusion data in various aluminosilicate melts in Fig. 8. Additionally, Na and K tracer diffusion data (Margaritz and Hofmann, 1978; Jambon and Semet, 1978; Jambon, 1982; review by Zhang et al., 2010) are given for dry rhyolitic melts. Jambon and Semet (1978) studied Li tracer diffusion in a rhyolitic melt. Their tracer diffusion coefficients differ by less than 0.2 log units compared to our DLi−Na interdiffusion coefficients. The activation energy reported by Jambon and Semet (1978) of ∼ 92 kJ mol−1 is very close to our value of 99 ± 7 kJ mol−1. Extrapolating our data to higher temperatures reveals that the data published by Lowry et al. (1981) and Cunningham et al. (1983) for alkali basalt, andesite and pitchstone fall roughly on the same trend defined by our data and the data by Jambon and Semet (1978). The activation energies are very similar in andesite (90 kJ mol−1) and pitchstone (84 kJ mol−1; Cunningham et al., 1983) but slightly elevated in alkali basalt (115 kJ mol−1; Lowry et al., 1981). This compilation demonstrates nicely that Li diffusion in dry aluminosilicate melts including our PEG2-blue is independent of the melt composition, being equal in melt compositions ranging from rhyolites to alkali basalts and andesites.
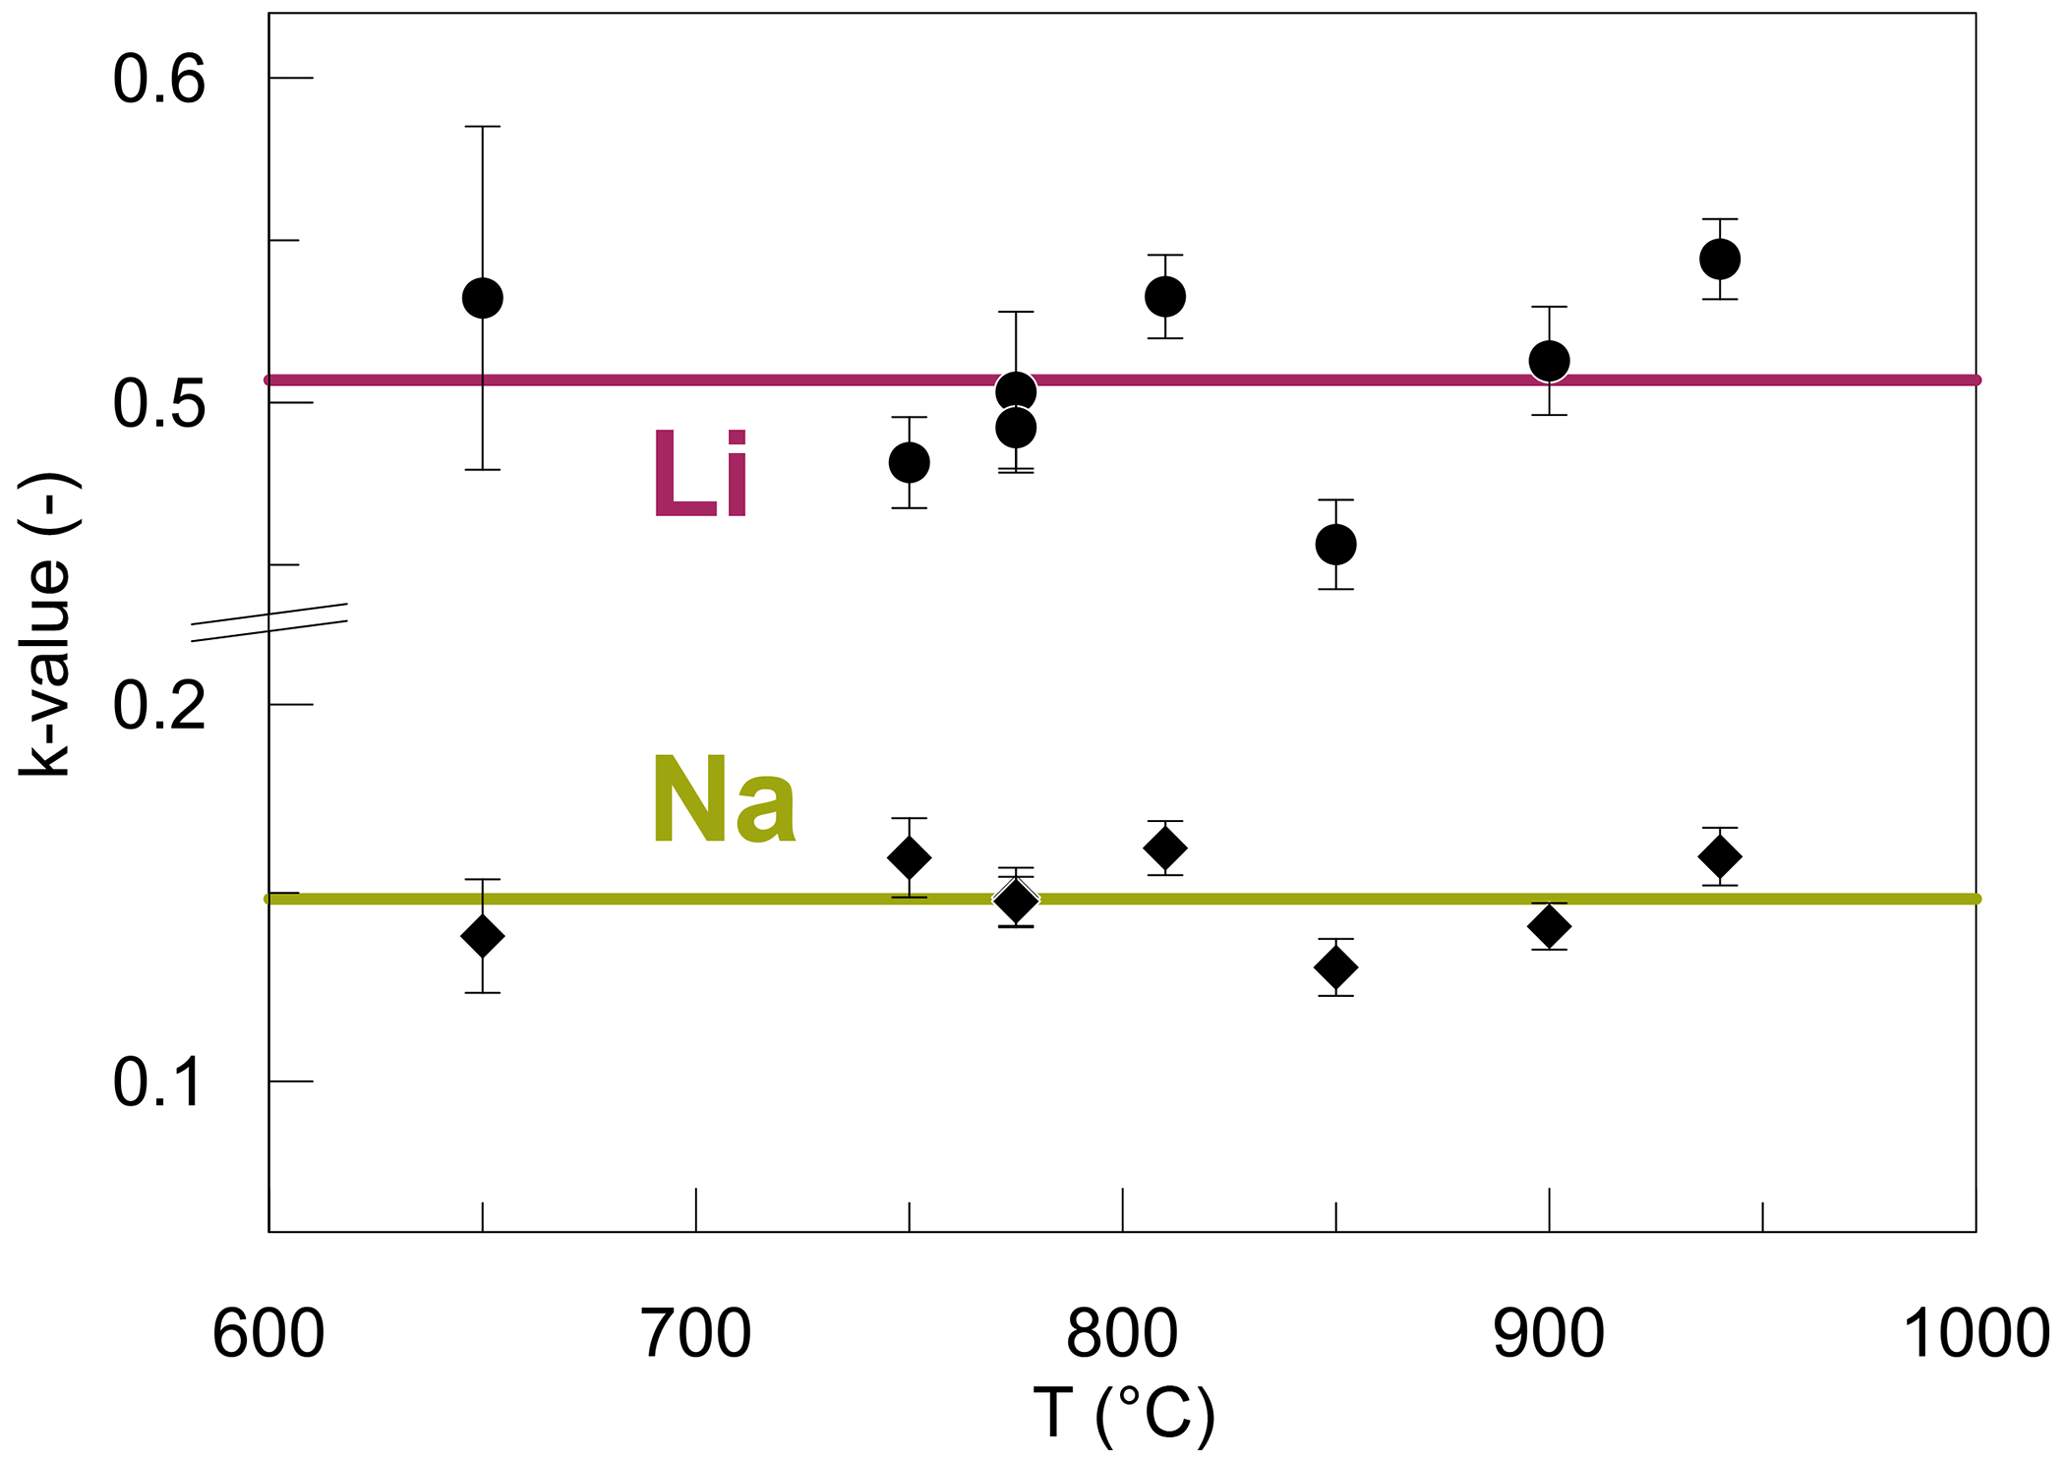
Figure 9k values acquired by fitting the diffusion profiles to Eqs. (5)–(8) for Li and Na. The horizontal lines represent the average k value for each species. The bigger variance of k values for Li is related to the smaller spatial resolution of SF-ICP-MS analysis since Li concentrations on either side of the interface are less well constrained compared to EPMA analysis. Error bars are the fitting errors.
In two recent studies, Holycross et al. (2018) and Spallanzani et al. (2022) have shown that the addition of water to rhyolitic melts increases the diffusivities of Li. They report Li diffusion coefficients that are ca. 0.5 log units higher compared to the average in a dry rhyolite (Fig. 8). In accordance, activation energies decrease significantly when introducing water to the system, i.e. to 57 kJ mol−1 by adding 4 wt % H2O (Spallanzani et al., 2022) and even further to 39 kJ mol−1 by adding 6 wt % H2O (Holycross et al., 2018). The authors explain this behaviour mainly by the breakdown of oxygen bonds through the introduction of hydroxyl groups (OH) to the silicate melt network followed by melt depolymerization. There are some methodological differences to be pointed out between these two studies and the presented study. Holycross et al. (2018) conducted their experiments at high pressures of 1 GPa in a piston-cylinder apparatus in the temperature range of 790–875 ∘C. Spallanzani et al. (2022) investigated Li diffusion at 300 MPa in an internally heated pressure vessel in the temperature range 700–1250 ∘C. The major differences between these two and our study are the Li concentrations in the diffusion couple halves. While our high-Li (low-Li) glasses contain 8000 ppm (7 ppm) Li, their high-Li (low-Li ) glasses contain only 500 ppm (180 ppm) Li (Holycross et al., 2018) and 200 ppm (58 ppm) Li (Spallanzani et al., 2022).
As shown above, adding fluxes to a dry granitic melt does not have the same effect on Li diffusivity as the addition of water. It is known that the addition of fluxing elements, such as Li, B, P and F, to granitic melts results in a disruption of the silicate melt structure and depolymerization of the melt (London, 2005; Henderson, 2005). This effectively decreases the melt viscosity (Thomas et al., 2000; Dingwell et al., 1992; Bartels et al., 2013, 2015) and liquidus and solidus temperature (Sirbescu and Nabelek, 2003; London et al., 1989, 1993). In principle, the impact of fluxes and water on a silicate melt is very similar. In order to assess quantitatively the depolymerizing effects of water or fluxes on a rhyolitic melt, detailed structural knowledge would be necessary. It was shown for F that it can occupy various structural units in a silicate melt, which differ strongly with the chemical composition of the melt (Baasner et al., 2014, and references therein). Both F and Li are known to have a much stronger potential in decreasing the viscosity (and therefore polymerization) compared to B and P (Bartels et al., 2013, 2015). For Li, Bartels et al. (2015) reported an effect as large as that of hydroxyl groups in decreasing the viscosity. Especially the high and combined abundance of many fluxes in PEG2-blue hampers the use of simplified parameters such as the NBO/T (non-bridging oxygen per tetrahedron) to estimate the polymerization.
Instead, a well-known parameter that can be used as a proxy for melt polymerization is the viscosity. Existing viscosity models are based on a range of rhyolitic compositions as a function of water content (e.g. Hui and Zhang, 2007). The viscosity of the PEG2-blue analogue PEG2 was studied as a function of water content by Bartels et al. (2011). For comparability all viscosities are given in the following as log η (η in Pa s) for a temperature of 800 ∘C. For the nominally dry (700–900 ppm H2O) PEG2, a log viscosity of 5.8 can be calculated (Bartels et al., 2011), which decreases to 2.7 upon addition of 4.2 wt % H2O. According to the model of Hui and Zhang (2007), a rhyolite with the same water content has a log viscosity of 11.4. The addition of 4.2 wt % H2O to the rhyolite reduces its log viscosity to 4.9, which is almost 1 order of magnitude lower than the nominally dry PEG2. Clearly, the viscosity of dry PEG2 is several orders of magnitude lower compared to the dry rhyolite. Assuming the viscosity is directly related to the degree of polymerization, it can be stated that PEG2 is much more depolymerized than the rhyolitic melt under nominally dry conditions. The drastic viscosity decrease upon addition of H2O shows clearly how efficiently water decreases the polymerization of a rhyolitic melt. While fluxes do also decrease the polymerization, their effect on the melt structure is a much more complex one (e.g. London, 2008).
Although the difference in viscosity between dry rhyolite and PEG2 is drastic, there is no resolvable difference in Li diffusivity between the dry equivalents of these melts (Fig. 8). This suggests that the degree of polymerization (in terms of viscosity) has no influence on the Li diffusivity. An additional mechanism likely related to the influence of water on the melt structure might lead to an enhanced Li diffusivity. Potentially, the incorporation of OH and H2O into the melt network facilitates the formation of percolation channels for Li. Percolation channels were proposed to form in alkali silicate glasses by the unmixing of structural units (e.g. Bauer et al., 2013) and provide pathways for fast alkali transport in the melt network. Another potential mechanism enhancing Li diffusion in hydrous glasses is Li–H interdiffusion. However, Behrens et al. (2002) demonstrated that proton mobility in BaSi2O5 glass is significantly lower than the mobility of Li in aluminosilicate glasses. The low contribution of protons to charge transport was also inferred by Fanara and Behrens (2011) in hydrous anorthite–diopside glass conductivity experiments. Therefore, increased Li diffusivity is unlikely to be caused by interdiffusion with H. Nevertheless, there were no alkalis present in the studied systems cited above, and proton diffusion could differ in such systems.
4.4 Modelling the kinetic isotope fractionation
The δ7Li profiles show a very strong isotope fractionation caused by faster diffusion of the lighter 6Li relative to the heavier 7Li. The diffusivities of the two isotopes can be related by the empirical formula of Richter et al. (1999):
where Di represents the diffusion coefficient of i; a and b are 6Li and 7Li, respectively; and M is the atomic mass of the isotopes. The exponent β is an empirical parameter that is specific for each element and diffusion medium. The β value was determined by recalculating the δ7Li values to absolute concentration profiles of 6Li and 7Li and fitting each profile separately according to Eqs. (5) and (6). β can then be calculated directly from the ratios of D6Li and D7Li and the respective isotope masses. For the recalculation to absolute isotope concentrations the 7Li 6Li ratio of IRMM-016 (12.114; Kasemann et al., 2005) was used. The fitted diffusion coefficients for D6Li and D7Li are in good agreement with values for DLi−Na within their respective errors (Table 2). The error in β can be derived from error propagation of the D6Li and D7Li fit errors. β values of 0.20 ± 0.03 and 0.20 ± 0.04 were obtained for DCLi7 and DCLi8, respectively.
Since the isotope effect is identical in both experiments, it is reasonable to assume that the diffusive isotope fractionation is independent of temperature and time in the studied temperature range. Our β values are in good agreement with data determined in previous works. Published β values for Li range from 0.228 in a wet rhyolite with ∼ 6 wt % H2O (Holycross et al., 2018), to 0.215 in basalt–rhyolite diffusion couples (Richter et al., 2003), and down to 0.15–0.20 as observed in wet rhyolite with ∼ 4 wt % H2O (Spallanzani et al., 2022). There is a slight variation in β in the different experimental studies, which might be related to different experimental and analytical setups or to the varying compositions of the experimental materials including water contents. Overall, the β values are similar, clustering around 0.2. There is evidence from Ca, where variable β values were found depending on melt composition, e.g. in diffusion couples of albite–diopside and albite–anorthite composition (0.165 and 0.210; Watkins et al., 2011) in comparison to basalt–rhyolite experiments (0.075; Richter et al., 2003). However, all of the Li isotope fractionation data were obtained in dry and wet rhyolitic melts, and further studies on different melt compositions are necessary to detect a potential compositional effect.
The β values acquired for diffusive Li isotope fractionation are considerably higher compared to those observed for other cations in silicate melts. In basalt–rhyolite diffusion couples, β values were determined as 0.075 for Ca (Richter et al., 2003), 0.05 for Mg (Richter et al., 2008) and 0.03 for Fe (Richter et al., 2009). The significantly higher β value for Li is likely related to its ability to move freely on interstitial sites through the melt network, promoted by the low charge and small ionic radius of Li. Diffusive Li isotope fractionation was also studied in olivine and pyroxene, which can contain trace amounts in nature. In both minerals, Li diffusion produces complex, step-like diffusion profiles, which can be described by a model assuming two transport mechanisms with Li partitioning between an octahedral and an interstitial site (Dohmen et al., 2010; Richter et al., 2014, 2017). In pyroxenes, a β value of 0.27 was reported (Richter et al., 2014), while in olivine β values as high as 0.4 ± 0.1 for diffusion along the c axis were found (Richter et al., 2017). This shows that the diffusivities of 6Li and 7Li differ much more in pyroxene and olivine than in silicate melts.
4.5 Implications for natural pegmatites
In nature, the bulk Li isotopic composition of pegmatites is likely inherited from their source rocks; i.e. crustal anatexis or fractional crystallization of a granite appears to have no significant effect on Li isotope fractionation (Teng et al., 2006a; Magna et al., 2010; Deveaud et al., 2015). After emplacement of a pegmatitic melt (e.g. Nabelek et al., 2010), different mechanisms may produce a fractionation of Li isotopes, e.g. interaction between minerals and the melt during fractional crystallization (Barnes et al., 2012) or exsolution of a fluid phase from the pegmatitic melt (Maloney et al., 2008; Teng et al., 2006a). Another potential mechanism for Li isotope fractionation is the diffusion of Li from a pegmatite into the country rock. As reported by Teng et al. (2006b), a ∼ 30 ‰ change in δ7Li in a pegmatite country rock can be caused by fluid-assisted grain boundary diffusion.
Our study shows experimentally that large Li isotope fractionation can be generated by diffusion of Li from a Li-rich into a Li-poor melt. This is basically the same process that operates during constitutional zone refining, where Li constantly diffuses away from the progressing crystallization front. Since 6Li diffuses faster than 7Li, the boundary layer at the crystallization front should be enriched in the heavier isotope. In order to preserve this isotopic signature, a sufficiently fast cooling is necessary so that re-equilibration of Li isotopes even after solidification is suppressed. This requirement should be satisfied in thin pegmatite dykes, where cooling occurs rapidly or during the solidification of late-stage pegmatitic fluids (miarolitic cavities). In order to verify this, spatially resolved δ7Li measurements within crystals are necessary. While δ7Li bulk-mineral analysis in pegmatites exist for tourmaline (Maloney et al., 2008) or spodumene, muscovite, plagioclase, and quartz (Teng et al., 2006a; Barnes et al., 2012), there exists only one dataset of in situ δ7Li profiles to our knowledge. Phelps and Lee (2022) analysed Li concentrations and isotope distributions in quartz crystals from a miarolitic cavity. They reported large Li isotope fractionations between different quartz crystals and within single crystals between core and rim. The rims are generally > 20 ‰ heavier compared to the cores, which they attribute partly to rapid crystal growth with an associated 7Li-enriched boundary layer and partly to Rayleigh fractionation. So, while there is evidence for diffusive Li isotope fractionation in quartz from miarolitic cavities, there is still a lack of such an observation outside of miarolitic cavities, e.g. from a thin, rapidly cooled pegmatite dyke.
The exposure of a Li-rich to a Li-poor pegmatitic melt leads to an interdiffusive exchange of Li and Na between these two melts. The interdiffusion rates are similar to Li and Na tracer diffusivities observed in various dry aluminosilicate melts including rhyolite. The addition of fluxes (e.g. Li, B, P and F), besides depolymerizing the melt, seems to have no influence on the diffusivity of Li in dry pegmatitic melts. Water, on the other hand, significantly decreases the activation energy of Li diffusion, as was shown by Holycross et al. (2018) and Spallanzani et al. (2022). While fluxes do have a strong decreasing effect on the viscosity of dry pegmatitic melts (Bartels et al., 2011), this demonstrates that water seems to have a structural effect on these melts beyond simply depolymerizing them. While Li–H interdiffusion is unlikely to increase the diffusion rates because of the low mobility of protons, the formation of potential percolation channels by OH in the melt structure might increase the diffusivity of Li. The stable Li isotopes have been shown to fractionate substantially during diffusion leading to δ7Li exceeding −80 ‰ in our experiments. The β value for Li diffusion in silicate melts seems to be generally around 0.2 with little dependence on the melt composition. Such high isotope fractionations might be preserved in minerals in sufficiently fast-cooled pegmatite dykes and might then be useful in confining growth rates of abundant minerals. A useful extension of this study would include experiments conducted on hydrous melts. Thus, it would allow us to discriminate between the effect of fluxes and H2O, and the potential formation of percolation channels could be investigated more deeply.
The raw data are stored at the Institute of Mineralogy at Leibniz University Hannover. All diffusion profiles are either shown in the paper or in the Supplement.
The supplement related to this article is available online at: https://doi.org/10.5194/ejm-35-1009-2023-supplement.
HB and SW initiated and supervised the project. CRS performed the experiments and analyses. IH and MO supported LA-ICP-MS measurements. RD helped fitting diffusion profiles. All authors discussed the data and profiles. CRS wrote the manuscript draft. HB, MO, RD and SW reviewed and edited the manuscript.
The contact author has declared that none of the authors has any competing interests.
Publisher’s note: Copernicus Publications remains neutral with regard to jurisdictional claims made in the text, published maps, institutional affiliations, or any other geographical representation in this paper. While Copernicus Publications makes every effort to include appropriate place names, the final responsibility lies with the authors.
This article is part of the special issue “Probing the Earth: magma and fluids, a tribute to the career of Michel Pichavant”. It is a result of the Magma & Fluids workshop, Orléans, France, 4–6 July 2022.
Julian Feige is thanked for careful preparation of sample mounts and polished sections. Thoughtful reviews by Shashank Prabha Mohan and one anonymous reviewer greatly improved this paper. Olivier Bachmann is thanked for editorial handling. The authors are grateful for the financial support from DFG via SPP 2238 “DOME”.
This research has been supported by the Deutsche Forschungsgemeinschaft (grant nos. BE 1720/46-1 and WE 2850/20-1).
The publication of this article was funded by the open-access fund of Leibniz Universität Hannover.
This paper was edited by Olivier Bachmann and reviewed by Shashank Prabha Mohan and one anonymous referee.
Baasner, A., Schmidt, B. C., Dupree, R., and Webb, S. L.: Fluorine speciation as a function of composition in peralkaline and peraluminous Na2O–CaO–Al2O3–SiO2 glasses: A multinuclear NMR study, Geochim. Cosmochim. Ac., 132, 151–169, https://doi.org/10.1016/j.gca.2014.01.041, 2014.
Barnes, E. M., Weis, D., and Groat, L. A.: Significant Li isotope fractionation in geochemically evolved rare element-bearing pegmatites from the Little Nahanni Pegmatite Group, NWT, Canada, Lithos, 132/133, 21–36, https://doi.org/10.1016/j.lithos.2011.11.014, 2012.
Bartels, A., Vetere, F., Holtz, F., Behrens, H., and Linnen, R. L.: Viscosity of flux-rich pegmatitic melts, Contrib. Mineral. Petrol., 162, 51–60, https://doi.org/10.1007/s00410-010-0582-3, 2011.
Bartels, A., Behrens, H., Holtz, F., Schmidt, B. C., Fechtelkord, M., Knipping, J., Crede, L., Baasner, A., and Pukallus, N.: The effect of fluorine, boron and phosphorus on the viscosity of pegmatite forming melts, Chem. Geol., 346, 184–198, https://doi.org/10.1016/j.chemgeo.2012.09.024, 2013.
Bartels, A., Behrens, H., Holtz, F., and Schmidt, B. C.: The effect of lithium on the viscosity of pegmatite forming liquids, Chem. Geol., 410, 1–11, https://doi.org/10.1016/j.chemgeo.2015.05.011, 2015.
Bauer, U., Welsch, A.-M., Behrens, H., Rahn, J., Schmidt, H., and Horn, I.: Li diffusion and the effect of local structure on Li mobility in Li2O-SiO2 glasses, J. Phys. Chem. B, 117, 15184–15195, https://doi.org/10.1021/jp408805e, 2013.
Behrens, H., Romano, C., Nowak, M., Holtz, F., and Dingwell, D. B.: Near-infrared spectroscopic determination of water species in glasses of the systems MAlSi3O8 (M = Li, Na, K): an interlaboratory study, Chem. Geol., 128, 41–63, 1996.
Behrens, H., Kappes, R., and Heitjans, P.: Proton conduction in glass – an impedance and infrared spectroscopic study on hydrous BaSi2O5 glass, J. Non-Cryst. Sol., 306, 271–281, 2002.
Černý, P.: Rare-element Granitic Pegmatites, Part I: Anatomy and Internal Evolution of Pegmatitic Deposits, Geosci. Can., 18, 49–67, 1991.
Černý, P. and Ercit, T. S.: The classification of granitic pegmatites revisited, Can. Mineral., 43, 2005–2026, https://doi.org/10.2113/gscanmin.43.6.2005, 2005.
Chakraborty, S.: Rates and mechanisms of Fe-Mg interdiffusion in olivine at 980–1300 ∘C, J. Geophys. Res., 102, 12317–12331, https://doi.org/10.1029/97JB00208, 1997.
Coogan, L. A., Kasemann, S. A., and Chakraborty, S.: Rates of hydrothermal cooling of new oceanic upper crust derived from lithium-geospeedometry, Earth Planet. Sc. Lett., 240, 415–424, https://doi.org/10.1016/j.epsl.2005.09.020, 2005.
Crank, J.: The Mathematics of Diffusion, 2nd Edn., Oxford science publications, Oxford University Press, Oxford, 414 pp., Clarendon Press, ISBN: 9780198534112, 1975.
Cunningham, G. J., Henderson, P., Lowry, R. K., Nolan, J., Reed, S., and Long, J.: Lithium diffusion in silicate melts, Earth Planet. Sc. Lett., 65, 203–205, https://doi.org/10.1016/0012-821X(83)90199-1, 1983.
De Hoog, J. C. M.: Matrix Effects During SIMS Measurement of the Lithium Mass Fractions of Silicate Glasses: Correction Procedures and Updated Preferred Values of Reference Materials, Geostand. Geoanal. Res., 42, 513–522, https://doi.org/10.1111/ggr.12237, 2018.
Deveaud, S., Millot, R., and Villaros, A.: The genesis of LCT-type granitic pegmatites, as illustrated by lithium isotopes in micas, Chem. Geol., 411, 97–111, https://doi.org/10.1016/j.chemgeo.2015.06.029, 2015.
Dingwell, D. B., Knoche, R., Webb, S. L., and Pichavant, M.: The effect of B2O3 on the viscosity of haplogranitic liquids, Am. Miner., 77, 457–461, 1992.
Dohmen, R., Kasemann, S. A., Coogan, L., and Chakraborty, S.: Diffusion of Li in olivine, Part I: Experimental observations and a multi species diffusion model, Geochim. Cosmochim. Ac., 74, 274–292, https://doi.org/10.1016/j.gca.2009.10.016, 2010.
Fanara, S. and Behrens, H.: Proton conduction in hydrous glasses of the join CaAl2Si2O8-CaMgSi2O6: An impedance and infrared spectroscopic study, J. Chem. Phys., 134, 194505, https://doi.org/10.1063/1.3589898, 2011.
Freda, C. and Baker, D. R.: Na-K interdiffusion in alkali feldspar melts, Geochim. Cosmochim. Ac., 62, 2997–3007, https://doi.org/10.1016/S0016-7037(98)00226-9, 1998.
Giordano, D., Russell, J. K., and Dingwell, D. B.: Viscosity of magmatic liquids: A model, Earth Planet. Sc. Lett., 271, 123–134, https://doi.org/10.1016/j.epsl.2008.03.038, 2008.
Guillong, M., Meier, D. L., Allan, M. M., Heinrich, C. A., and Yardley, B. W.: Appendix A6: SILLS: A MATLAB-based program for the reduction of laser ablation ICP-MS data of homogenous materials and inclusions, Mineral Assoc. Canada Short Course, 328–333, 2008.
Henderson, G. S.: The structure of silicate melts: A glass perspective, Can. Mineral., 43, 1921–1958, https://doi.org/10.2113/gscanmin.43.6.1921, 2005.
Holycross, M. E., Watson, E. B., Richter, F. M., and Villeneuve, J.: Diffusive fractionation of Li isotopes in wet, silicic melts, Geochem. Persp. Let., 6, 39–42, https://doi.org/10.7185/geochemlet.1807, 2018.
Horn, I., Blanckenburg, F. von, Schoenberg, R., Steinhoefel, G., and Markl, G.: In situ iron isotope ratio determination using UV-femtosecond laser ablation with application to hydrothermal ore formation processes, Geochim. Cosmochim. Ac., 70, 3677–3688, https://doi.org/10.1016/j.gca.2006.05.002, 2006.
Hui, H. and Zhang, Y.: Toward a general viscosity equation for natural anhydrous and hydrous silicate melts, Geochim. Cosmochim. Ac., 71, 403–416, https://doi.org/10.1016/j.gca.2006.09.003, 2007.
Isard, J. O.: The mixed alkali effect in glass, J. Non-Cryst. Sol., 1, 235–261, https://doi.org/10.1016/0022-3093(69)90003-9, 1969.
Jambon, A.: Tracer diffusion in granitic melts: Experimental results for NA, K, RB, CS, CA, SR, BA, CE, EU to 1300 ∘C and a model of calculation, J. Geophys. Res., 87, 10797–10810, https://doi.org/10.1029/JB087iB13p10797, 1982.
Jambon, A. and Semet, M. P.: Lithium diffusion in silicate glasses of albite, orthoclase, and obsidian composition: An ion-microprobe determination, Earth Planet. Sc. Lett., 37, 445–450, https://doi.org/10.1016/0012-821X(78)90060-2, 1978.
Jeffcoate, A. B., Elliott, T., Kasemann, S. A., Ionov, D., Cooper, K., and Brooker, R.: Li isotope fractionation in peridotites and mafic melts, Geochim. Cosmochim. Ac., 71, 202–218, 2007.
Jochum, K. P. and Stoll, B.: Reference materials for elemental and isotopic analyses by LA-(MC)-ICP-MS: Successes and outstanding needs, in: Laser ablation ICP-MS in the Earth sciences: Current practices and outstanding issues, edited by: Sylvestor, P., Mineralogical Association of Canada, Quebec, 147–168, ISBN: 9780921294498, 2008.
Jochum, K. P., Stoll, B., Herwig, K., Willbold, M., Hofmann, A. W., Amini, M., Aarburg, S., Abouchami, W., Hellebrand, E., Mocek, B., Raczek, I., Stracke, A., Alard, O., Bouman, C., Becker, S., Dücking, M., Brätz, H., Klemd, R., Bruin, D. de, Canil, D., Cornell, D., Hoog, C.-J. de, Dalpé, C., Danyushevsky, L., Eisenhauer, A., Gao, Y., Snow, J. E., Groschopf, N., Günther, D., Latkoczy, C., Guillong, M., Hauri, E. H., Höfer, H. E., Lahaye, Y., Horz, K., Jacob, D. E., Kasemann, S. A., Kent, A. J. R., Ludwig, T., Zack, T., Mason, P. R. D., Meixner, A., Rosner, M., Misawa, K., Nash, B. P., Pfänder, J., Premo, W. R., Sun, W. D., Tiepolo, M., Vannucci, R., Vennemann, T., Wayne, D., and Woodhead, J. D.: MPI-DING reference glasses for in situ microanalysis: New reference values for element concentrations and isotope ratios, Geochem. Geophy. Geosy., 7, 1–44, https://doi.org/10.1029/2005GC001060, 2006.
Jochum, K. P., Weis, U., Stoll, B., Kuzmin, D., Yang, Q., Raczek, I., Jacob, D. E., Stracke, A., Birbaum, K., Frick, D. A., Günther, D., and Enzweiler, J.: Determination of Reference Values for NIST SRM 610-617 Glasses Following ISO Guidelines, Geostand. Geoanal. Res., 35, 397–429, https://doi.org/10.1111/j.1751-908X.2011.00120.x, 2011.
Kasemann, S. A., Jeffcoate, A. B., and Elliott, T.: Lithium isotope composition of basalt glass reference material, Anal. Chem., 77, 5251–5257, https://doi.org/10.1021/ac048178h, 2005.
Leschik, M., Heide, G., Frischat, G. H., Behrens, H., Wiedenbeck, M., Wagner, N., Heide, K., Geißler, H., and Reinholz, U.: Determination of H2O and D2O contents in rhyolitic glasses, Phys. Chem. Glasses, 45, 238–251, 2004.
London, D.: Magmatic-hydrothermal transition in the Tanco rare-element pegmatite: Evidence from fluid inclusions and phase-equilibrium experiments, Am. Miner., 71, 376–395, 1986.
London, D.: The application of experimental petrology to the genesis and crystallization of granitic pegmatites, Can. Mineral., 30, 499–540, 1992.
London, D.: Granitic pegmatites: an assessment of current concepts and directions for the future, Lithos, 80, 281–303, https://doi.org/10.1016/j.lithos.2004.02.009, 2005.
London, D.: Pegmatites, The Canadian Mineralogist Special Publication, 10, Mineralogical Association of Canada, Ottawa, 347 pp., ISBN: 9780921294474, 2008.
London, D., Morgan VI, G. B., and Hervig, R. L.: Vapor-undersaturated experiments with Macusani glass + H2O at 200 MPa, and the internal differentiation of granitic pegmatites, Contrib. Mineral. Petrol., 102, 1–17, 1989.
London, D., Morgan, G. B., Babb, H. A., and Loomis, J. L.: Behavior and effects of phosphorus in the system Na2O-K2O-Al2O3-SiO2-P2O5-H2O at 200 MPa (H2O), Contrib. Mineral. Petrol., 113, 450–465, 1993.
Lowry, R. K., Reed, S., Nolan, J., Henderson, P., and Long, J.: Lithium tracer-diffusion in an alkali-basaltic melt – An ion-microprobe determination, Earth Planet. Sc. Lett., 53, 36–40, https://doi.org/10.1016/0012-821X(81)90023-6, 1981.
Lynn, K. J., Shea, T., Garcia, M. O., Costa, F., and Norman, M. D.: Lithium diffusion in olivine records magmatic priming of explosive basaltic eruptions, Earth Planet. Sc. Lett., 500, 127–135, https://doi.org/10.1016/j.epsl.2018.08.002, 2018.
Magna, T., Janoušek, V., Kohút, M., Oberli, F., and Wiechert, U.: Fingerprinting sources of orogenic plutonic rocks from Variscan belt with lithium isotopes and possible link to subduction-related origin of some A-type granites, Chem. Geol., 274, 94–107, https://doi.org/10.1016/j.chemgeo.2010.03.020, 2010.
Maloney, J. S., Nabelek, P. I., and Sirbescu, M.-L. C. H.: Lithium and its isotopes in tourmaline as indicators of the crystallization process in the San Diego County pegmatites, California, USA, Eur. J. Mineral., 20, 905–916, https://doi.org/10.1127/0935-1221/2008/0020-1823, 2008.
Manning, J. R.: Diffusion Kinetics for Atoms in Crystals, Van Nostrand, Princeton, NJ, 257 pp., Van Nostrand Reinhold Inc., U.S., ISBN: 9780442050948, 1968.
Margaritz, M. and Hofmann, A. W.: Diffusion of Sr, Ba and Na in obsidian, Geochim. Cosmochim. Ac., 42, 595–605, 1978.
Matthews, W., Linnen, R. L., and Guo, Q.: A filler-rod technique for controlling redox conditions in cold-seal pressure vessels, Am. Mineral., 88, 701–707, https://doi.org/10.2138/am-2003-0424, 2003.
Morgan, G. B. and London, D.: Crystallization of the Little Three layered pegmatite-aplite dike, Ramona District, California, Contrib. Mineral. Petrol., 136, 310–330, https://doi.org/10.1007/s004100050541, 1999.
Mosbah, M., Metrich, N., and Massiot, P.: PIGME fluorine determination using a nuclear microprobe with application to glass inclusions, Nucl. Inst. Methods Phys. Res. B, 58, 227–231, https://doi.org/10.1016/0168-583X(91)95592-2, 1991.
Mysen, B. O. and Richet, P.: Silicate Glasses and Melts: Properties and Structure, Developments in geochemistry, 10, Elsevier Science, Amsterdam, 544 pp., ISBN: 9780444520111, 2005.
Nabelek, P. I., Whittington, A. G., and Sirbescu, M.-L. C.: The role of H2O in rapid emplacement and crystallization of granite pegmatites: resolving the paradox of large crystals in highly undercooled melts, Contrib. Mineral. Petrol., 160, 313–325, https://doi.org/10.1007/s00410-009-0479-1, 2010.
Neukampf, J., Ellis, B. S., Laurent, O., Steinmann, L. K., Ubide, T., Oeser, M., Magna, T., Weyer, S., and Bachmann, O.: Time scales of syneruptive volatile loss in silicic magmas quantified by Li isotopes, Geology, 49, 125–129, https://doi.org/10.1130/G47764.1, 2021.
Phelps, P. R. and Lee, C.-T. A.: Extreme lithium isotope fractionation in quartz from the Stewart pegmatite, Geochim. Cosmochim. Ac., 336, 208–218, https://doi.org/10.1016/j.gca.2022.09.014, 2022.
Qi, H. P., Taylor, P., Berglund, M., and Bièvre, P. de: Calibrated measurements of the isotopic composition and atomic weight of the natural Li isotopic reference material IRMM-016, Int. J. Mass Spectrom. Ion Process., 171, 263–268, https://doi.org/10.1016/S0168-1176(97)00125-0, 1997.
Richet, P., Whittington, A., Holtz, F., Behrens, H., Ohlhorst, S., and Wilke, M.: Water and the density of silicate glasses, Contr. Mineral. and Petrol., 138, 337–347, https://doi.org/10.1007/s004100050567, 2000.
Richter, F., Watson, B., Chaussidon, M., Mendybaev, R., and Ruscitto, D.: Lithium isotope fractionation by diffusion in minerals, Part 1: Pyroxenes, Geochim. Cosmochim. Ac., 126, 352–370, https://doi.org/10.1016/j.gca.2013.11.008, 2014.
Richter, F., Chaussidon, M., Bruce Watson, E., Mendybaev, R., and Homolova, V.: Lithium isotope fractionation by diffusion in minerals, Part 2: Olivine, Geochim. Cosmochim. Ac., 219, 124–142, https://doi.org/10.1016/j.gca.2017.09.001, 2017.
Richter, F. M., Liang, Y., and Davis, A. M.: Isotope fractionation by diffusion in molten oxides, Geochim. Cosmochim. Ac., 63, 2853–2861, https://doi.org/10.1016/S0016-7037(99)00164-7, 1999.
Richter, F. M., Davis, A. M., DePaolo, D. J., and Watson, E.: Isotope fractionation by chemical diffusion between molten basalt and rhyolite, Geochim. Cosmochim. Ac., 67, 3905–3923, https://doi.org/10.1016/S0016-7037(03)00174-1, 2003.
Richter, F. M., Watson, E. B., Mendybaev, R. A., Teng, F.-Z., and Janney, P. E.: Magnesium isotope fractionation in silicate melts by chemical and thermal diffusion, Geochim. Cosmochim. Ac., 72, 206–220, https://doi.org/10.1016/j.gca.2007.10.016, 2008.
Richter, F. M., Watson, E. B., Mendybaev, R., Dauphas, N., Georg, B., Watkins, J., and Valley, J.: Isotopic fractionation of the major elements of molten basalt by chemical and thermal diffusion, Geochim. Cosmochim. Ac., 73, 4250–4263, https://doi.org/10.1016/j.gca.2009.04.011, 2009.
Schäffer, A.-K., Petrishcheva, E., Habler, G., Abart, R., Rhede, D., and Giester, G.: Sodium-potassium interdiffusion in potassium-rich alkali feldspar II: Composition- and temperature-dependence obtained from cation exchange experiments, Am. J. Sci., 314, 1300–1318, https://doi.org/10.2475/09.2014.03, 2014.
Shannon, R. D.: Revised effective ionic radii and systematic studies of interatomic distances in halides and chalcogenides, Acta Cryst. A, 32, 751–767, https://doi.org/10.1107/S0567739476001551, 1976.
Sirbescu, M.-L. C. and Nabelek, P. I.: Crustal melts below 400 ∘C, Geology, 31, 685–688, https://doi.org/10.1130/G19497.1, 2003.
Spallanzani, R., Koga, K. T., Cichy, S. B., Wiedenbeck, M., Schmidt, B. C., Oelze, M., and Wilke, M.: Lithium and boron diffusivity and isotopic fractionation in hydrated rhyolitic melts, Contrib. Mineral. Petrol., 177, 74, https://doi.org/10.1007/s00410-022-01937-2, 2022.
Steinmann, L. K., Oeser, M., Horn, I., Seitz, H.-M., and Weyer, S.: In situ high-precision lithium isotope analyses at low concentration levels with femtosecond-LA-MC-ICP-MS, J. Anal. At. Spectrom., 34, 1447–1458, https://doi.org/10.1039/C9JA00088G, 2019.
Steinmann, L. K., Oeser, M., Horn, I., and Weyer, S.: Multi-Stage Magma Evolution in Intra-Plate Volcanoes: Insights From Combined in situ Li and Mg–Fe Chemical and Isotopic Diffusion Profiles in Olivine, Front. Earth Sci., 8, 201, https://doi.org/10.3389/feart.2020.00201, 2020.
Stilling, A., Černý, P., and Vanstone, P. J.: The Tanco pegmatite at Bernic Lake, Manitoba, XVI. Zonal and bulk compositions and their petrogenetic significance, Can. Mineral., 44, 599–623, https://doi.org/10.2113/gscanmin.44.3.599, 2006.
Teng, F.-Z., McDonough, W. F., Rudnick, R. L., Walker, R. J., and Sirbescu, M.-L. C.: Lithium isotopic systematics of granites and pegmatites from the Black Hills, South Dakota, Am. Miner., 91, 1488–1498, https://doi.org/10.2138/am.2006.2083, 2006a.
Teng, F.-Z., McDonough, W. F., Rudnick, R. L., and Walker, R. J.: Diffusion-driven extreme lithium isotopic fractionation in country rocks of the Tin Mountain pegmatite, Earth Planet. Sc. Lett., 243, 701–710, https://doi.org/10.1016/j.epsl.2006.01.036, 2006b.
Thomas, R. and Webster, J. D.: Strong tin enrichment in a pegmatite-forming melt, Mineral. Deposita, 35, 570–582, https://doi.org/10.1007/s001260050262, 2000.
Thomas, R., Webster, J. D., and Heinrich, W.: Melt inclusions in pegmatite quartz: complete miscibility between silicate melts and hydrous fluids at low pressure, Contrib. Mineral. Petrol., 139, 394–401, https://doi.org/10.1007/s004100000120, 2000.
US Geological Survey: Mineral Commodity Summaries, US Geological Survey, Mineral Commodity Summaries, 200 pp., US Geological Survey, https://doi.org/10.3133/mcs2021, 2021.
Vetere, F., Behrens, H., Misiti, V., Ventura, G., Holtz, F., de Rosa, R., and Deubener, J.: The viscosity of shoshonitic melts (Vulcanello Peninsula, Aeolian Islands, Italy): Insight on the magma ascent in dikes, Chem. Geol., 245, 89–102, https://doi.org/10.1016/j.chemgeo.2007.08.002, 2007.
Watkins, J. M., DePaolo, D. J., Ryerson, F. J., and Peterson, B. T.: Influence of liquid structure on diffusive isotope separation in molten silicates and aqueous solutions, Geochim. Cosmochim. Ac., 75, 3103–3118, https://doi.org/10.1016/j.gca.2011.03.002, 2011.
Webber, K. L., Simmons, W. B., Falster, A. U., and Foord, E. E.: Cooling rates and crystallization dynamics of shallow level pegmatite-aplite dikes, San Diego County, California, Am. Miner., 84, 708–717, https://doi.org/10.2138/am-1999-5-602, 1999.
Withers, A. C. and Behrens, H.: Temperature-induced changes in the NIR spectra of hydrous albitic and rhyolitic glasses between 300 and 100 K, Phys. Chem. Mineral., 27, 119–132, https://doi.org/10.1007/s002690050248, 1999.
Wu, S., Wörner, G., Jochum, K. P., Stoll, B., Simon, K., and Kronz, A.: The Preparation and Preliminary Characterisation of Three Synthetic Andesite Reference Glass Materials (ARM-1, ARM-2, ARM-3) for In Situ Microanalysis, Geostand. Geoanal. Res., 43, 567–584, https://doi.org/10.1111/ggr.12301, 2019.
Wu, S., Yang, Y., Jochum, K. P., Romer, R. L., Glodny, J., Savov, I. P., Agostini, S., Hoog, J. C. de, Peters, S. T., Kronz, A., Zhang, C., Bao, Z., Wang, X., Li, Y., Tang, G., Feng, L., Yu, H., Li, Z., Le Zhang, Lin, J., Zeng, Y., Xu, C., Wang, Y., Cui, Z., Deng, L., Xiao, J., Liu, Y., Xue, D., Di Zhang, Jia, L., Wang, H., Xu, L., Huang, C., Xie, L., Pack, A., Wörner, G., He, M., Li, C., Yuan, H., Huang, F., Li, Q., Yang, J., Li, X., and Wu, F.: Isotopic Compositions (Li-B-Si-O-Mg-Sr-Nd-Hf-Pb) and FeFe Ratios of Three Synthetic Andesite Glass Reference Materials (ARM-1, ARM-2, ARM-3), Geostand. Geoanal. Res., 45, 719–745, https://doi.org/10.1111/ggr.12399, 2021.
Zhang, C., Koepke, J., Albrecht, M., Horn, I., and Holtz, F.: Apatite in the dike-gabbro transition zone of mid-ocean ridge: Evidence for brine assimilation by axial melt lens, Am. Miner., 102, 558–570, https://doi.org/10.2138/am-2017-5906, 2017.
Zhang, Y., Xu, Z., and Behrens, H.: Hydrous species geospeedometer in rhyolite: improved calibration and application, Geochim. Cosmochim. Ac., 64, 3347–3355, https://doi.org/10.1016/S0016-7037(00)00424-5, 2000.
Zhang, Y., Ni, H., and Chen, Y.: Diffusion Data in Silicate Melts, Rev. Mineral. Geochem., 72, 311–408, https://doi.org/10.2138/rmg.2010.72.8, 2010.