the Creative Commons Attribution 4.0 License.
the Creative Commons Attribution 4.0 License.
 | 21 Apr 2021
Crack-enhanced weathering in inscribed marble: a possible application in epigraphy
Stylianos Aspiotis
Jochen Schlüter
Kaja Harter-Uibopuu
Boriana Mihailova
Raman spectroscopy has been applied to check if there are detectible material differences beneath the inscribed and non-inscribed areas of marble-based written artefacts, which could be further used to visualize lost or hardly readable text via suitable mapping. As a case study, marble segments with ∼ 2000-year-old inscribed letters from Asia Minor (western Turkey) and marble gravestones with 66 ± 14-year-old inscriptions from the cemetery of Ohlsdorf (Hamburg, Germany) have been subjected to Raman spectroscopy, as well as to complementary X-ray diffraction, wavelength-dispersive electron probe microanalysis, and Fourier-transform infrared spectroscopy, to thoroughly study the effect of different environmental conditions, grain size, and inscription age on the nature and penetration depth of marble alteration. The results demonstrate that environmental conditions rule over the type of dominant weathering changes, which are carotenoid molecular inclusions produced by lichen and amorphous carbon for marbles from Hamburg and Asia Minor, respectively. The alteration is much stronger in medium- and coarse-grained than in fine-grained marble, but it is suppressed by letter colouring. In the absence of letter colouring, the weathering-related products in both ancient and modern engraved marbles are more abundant beneath than away from the engraved areas, and the penetration depth is larger due to the enhancement of fissures and micro-cracks around the inscribed areas. We show that the Raman intensity ratio between the strongest peak of the weathering-related product (ν(C=C) ∼ 1520 cm−1 for carotenoids or the G peak ∼ 1595 cm−1 for soot-like carbon) and the strongest peak of marble (CO3 stretching near 1087 cm−1) can serve as a quantitative marker to indirectly map the lateral distribution of cracks induced during the inscribing process and hence can potentially be used to trace lost text on vanished marble inscriptions. This approach can be applied to other rock types, but further studies are required to identify the corresponding autochthonous weathering-related products.
- Article
(26569 KB) - Full-text XML
-
Supplement
(3515 KB) - BibTeX
- EndNote


Mineralogical analyses of rock-based writing supports are crucial to understand the roots of human civilization since the written language, as a communicational expression, is the most widespread and secure practice of transmitting knowledge through time. In particular, inscribed rocks have been thought to be the most persistent medium in time, and they were introduced in the form of rectangular mould-based bricks in Mesopotamia at least from the 4th or 3rd millennium BCE (Artioli, 2010, and references therein). In ancient Greece and Rome, marble, limestone, and granodiorite became the common writing supports in the 1st millennium BCE. However, even if rocks appear imperishable, rock-based inscriptions are attacked by the elements of nature. With time the environment causes the weathering of rocks, resulting in deterioration and destruction of the rock surface layers and limited visibility of the inscribed text. Since many ancient inscriptions are not visible anymore or virtually unreadable, much effort has been put in finding methods which might unravel the epigraphic content of stone objects.
Commonly, a huge variation in weathering-induced changes in rock-based written artefacts of the same rock can be observed depending on the environmental conditions, which are determined by three main factors: (i) exposure to local climate in terms of humidity and temperature (e.g. Dragovich, 1991; Cooke et al., 1995; Frost and Weier, 2003), (ii) airborne particles of natural and anthropogenic origin, and (iii) biological microorganisms. In particular, the local position and altitude of the weathered object can be differently affected by sun, rain, and wind (e.g. Moropoulou et al., 1998). In an urban environment, the bottom layer of the atmosphere contains also airborne solid particles resulting mostly from industrial operations, demolition processes, exhaust gases, surface mining, and the combustion of fossil fuels and biomass. Naturally generated particulates can emerge predominantly from volcanic eruptions, dust storms (which are common in Mediterranean regions), and forest and peat fires (Gieré and Querol, 2010). These natural particles prevail over those of anthropogenic origin (98 wt % versus 2 wt % according to Gieré and Querol, 2010, and references therein) and hence can form a thick layer on rock-based artefacts. In addition, lichens as weathering agents and other microorganisms like fungi can alter substantially the structure, appearance, and chemical composition of the outermost layer of rocks and thereby the rock mineral-phase composition (Gadd, 2017). Rocks are the major construction constituents of many historical buildings, cultural heritage monuments, gravestones, and writing supports. It is anticipated that they will also be subjected to the impact of bioweathering processes triggered by lichens leading to the in situ alteration of the rock surface. These processes can lead to the formation of new minerals on their surface, like metal oxalates (Frost and Weier, 2003, and references therein), or to the incorporation of metabolic products of lichens like acids or proteins (Holder et al., 2000). Therefore, it is extremely important to study incorporated molecular species, as well as possible mineral nanoparticles, on the surface of rock-based written artefacts.
So far the chemical- and mineral-phase composition of weathered surfaces of monuments and engraved rocks has predominantly been analysed by X-ray fluorescence (XRF), ion chromatography, atomic absorption and emission spectroscopy, electron probe microanalysis (EPMA), Fourier-transform infrared (FTIR) spectroscopy, and Raman spectroscopy (e.g. Moropoulou et al., 1998; Powers et al., 2005; Twilley, 2006; Pinna et al., 2015). However, the majority of the aforementioned methods require sampling of the outer layer, which is strongly undesirable in the case of historical objects. Non-destructive analysis requires preparation-free methods operating in reflection mode such as XRF reflection, FTIR reflection, and Raman spectroscopy, but the application of the first two methods to samples with rough surfaces is complicated. An attempt has been made to recover the lost inscribed text using XRF mapping on trace elements, such as Fe, introduced into the writing support during its engraving (Powers et al., 2005), but the obtained results were not satisfactory enough.
Raman spectroscopy is a method that can non-invasively map the lateral distribution of a guest secondary phase or molecular inclusion in a host matrix via the guest-to-host peak intensity ratio and has the potential for being the appropriate method for the visualization of hardly readable or vanished inscriptions on severely weathered writing supports. The advantage of Raman spectroscopy is fourfold: (i) it is truly non-destructive; (ii) it enables the identification of both crystalline and amorphous phases; (iii) it can detect light element-containing (organic and H-bearing) compounds; and (iv) the utilization of a microscope allows for beam focusing down to 1–2 µm and thus the non-problematic analysis also of rough surfaces. Raman spectroscopy has been applied so far to the determination of the conservational state of wall paintings and buildings (e.g. Edwards and Farwell, 2008), as well as of products being used during restoration treatment of paintings (e.g. Sodo et al., 2019). The ascertainment of the origin of degradation products, such as calcium oxalate films, on the surface of several monuments and frescoes has been achieved also through Raman spectroscopy (e.g. Edwards et al., 1991; Rampazzi et al., 2004; Conti et al., 2012). In particular, the recent development of micro-spatially offset Raman spectroscopy (μ-SORS) allows for probing subsurface layers (Realini et al., 2016, 2017) even in opaque samples (Matousek et al., 2016). Since the first attempts of Smith (2003), a lot of progress has been made in developing portable Raman spectrometers for the identification of decaying products on construction materials and overall on cultural heritage objects. However, such an instrumentation still suffers from some instrumental limitations, such as a low spectral resolution of 4–5 cm−1 (e.g. Martínez-Arkarazo et al., 2008; Crippa et al., 2021) which hinders the distinction between different carbonate, sulfate, and nitrate mineral phases (e.g. Colomban, 2012).
Generally, a mechanical treatment with sharp tools, like those used for stone carving, should produce dislocations and microcracks in the material, and the density of such structural defects should be highest in the vicinity of the applied mechanical load. Thus it is reasonable to assume that in rock-based written artefacts there are more cracks and extended structural defects (induced during the engraving of letters) beneath inscribed areas in comparison to non-inscribed ones, independent of whether the inscription is still well preserved or has completely vanished (Fig. 1). Consequently, the incorporation of foreign material into these voids is possible, and the alteration of the original base material is expected to be intensified. This feature can be explained with the elevated molecular diffusion from the external surface to the bulk rock and the enlargement of the effective internal surface area due to cracks and structural defects. For instance, filamentous hyphae from lichens and fungi may penetrate further into an inscribed area through fissures and cracks, as well as in between mineral grains and onto cleavage plains if existing (Gadd, 2017). Therefore, the content of the weathering products as newly formed mineral phases or molecular inclusions should be higher beneath an inscription than in areas away from it. Moreover, if the signal from the weathered product can be detected by a certain non-destructive method, it can be used to improve the readability of rock-based written artefacts.
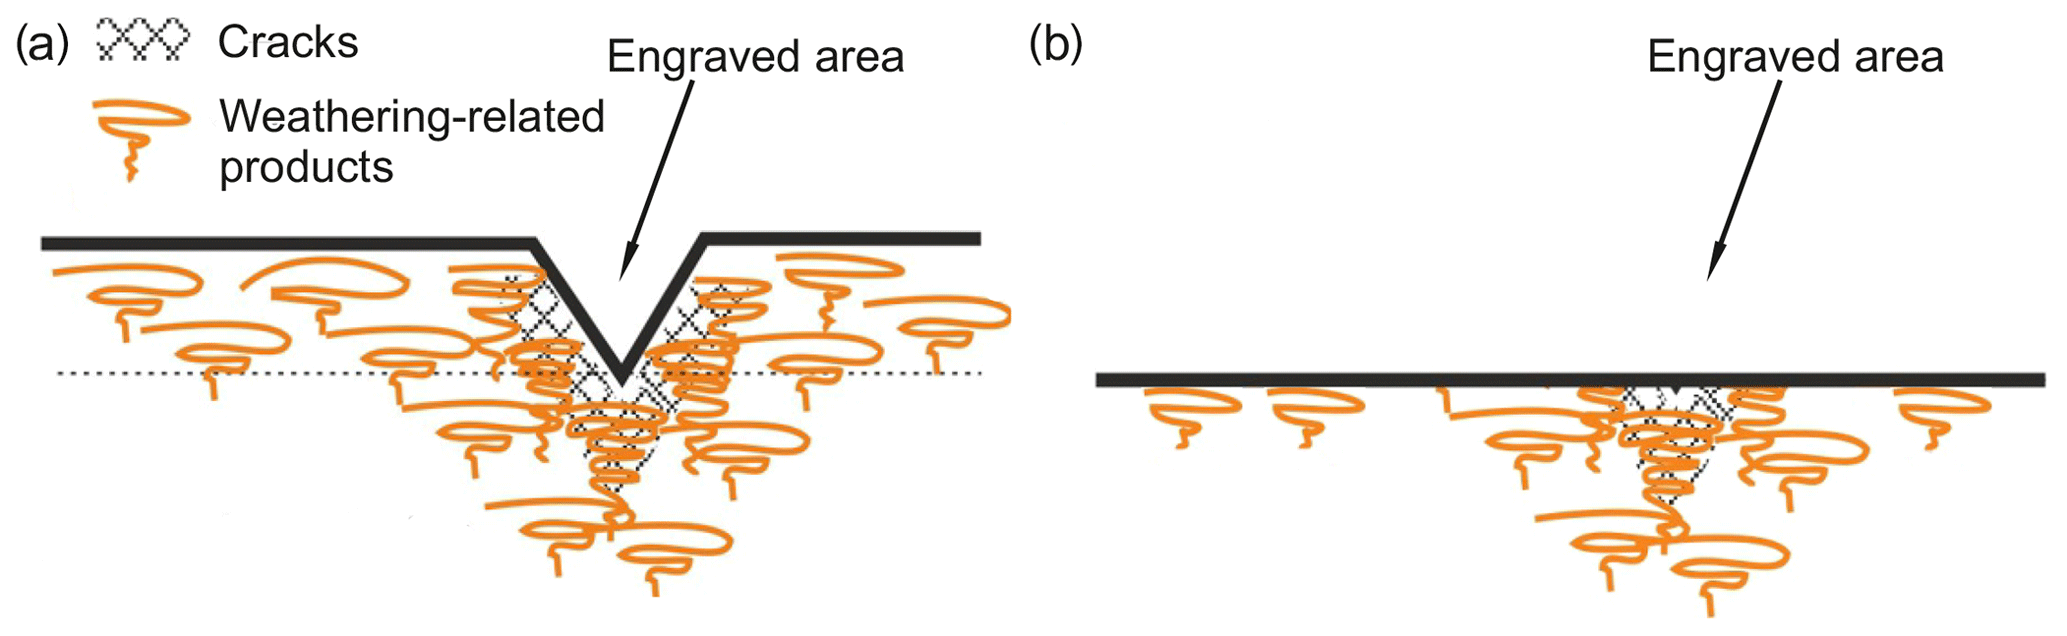
Figure 1Schematic representations of cross sections of an inscribed object in which the products directly or indirectly induced by weathering processes are more prominent beneath the engraved area than away from it. (a) The inscription is still legible; (b) the surface is deteriorated to the extent in which the inscription is hardly readable or no longer readable.
To test this concept, we have analysed two types of inscribed marble with contrasting environmental conditions and different inscription ages – gravestones from the cemetery of Ohlsdorf (Hamburg, Germany) and fragments of a marble slab from Asia Minor (western Turkey) – with Raman spectroscopy, as well as with complementary powder X-ray diffraction (XRD), wavelength-dispersive EPMA (WD-EPMA), and FTIR spectroscopy. The goals were (i) to identify the deterioration products in marble artefacts depending on the environmental conditions, (ii) to determine propagation depth of these weathering products, foreign particles, or inhabitants beneath inscribed and non-inscribed areas depending on the weather-exposure time, mineral grain size, and letter colouring, and (iii) to explore the sensitivity of Raman spectroscopy for detecting cracks introduced in marble while inscribing via the Raman signal of secondary nanophase or molecular species inhabiting the cracks, which could be further used to develop a non-destructive method for tracing letter remnants.
2.1 Samples
Figure 2a displays one of the marble gravestones, kindly provided by the administration of the Ohlsdorf cemetery in Hamburg, Germany. From the same gravestone, we have prepared cross-section cuts through the inscribed symbols (Fig. 2b) from which Raman spectra along line profiles beneath the inscription (dashed red line; bottom photograph in Fig. 2b) and away from the inscription (dashed blue line; bottom photograph in Fig. 2b) were collected. Additional cuts were prepared for WD-EPMA. The same sample preparation procedure was used for the ancient marble slab from Asia Minor, Turkey. The sample designation, provenance, inscription age, grain size, and letter colouring are given in Table 1. For the purposes of powder XRD and FTIR analyses, material was gently scraped under the microscope from the surface of altered and unaltered areas of samples AM_C1 (Asia Minor) and MaB1A (Hamburg).
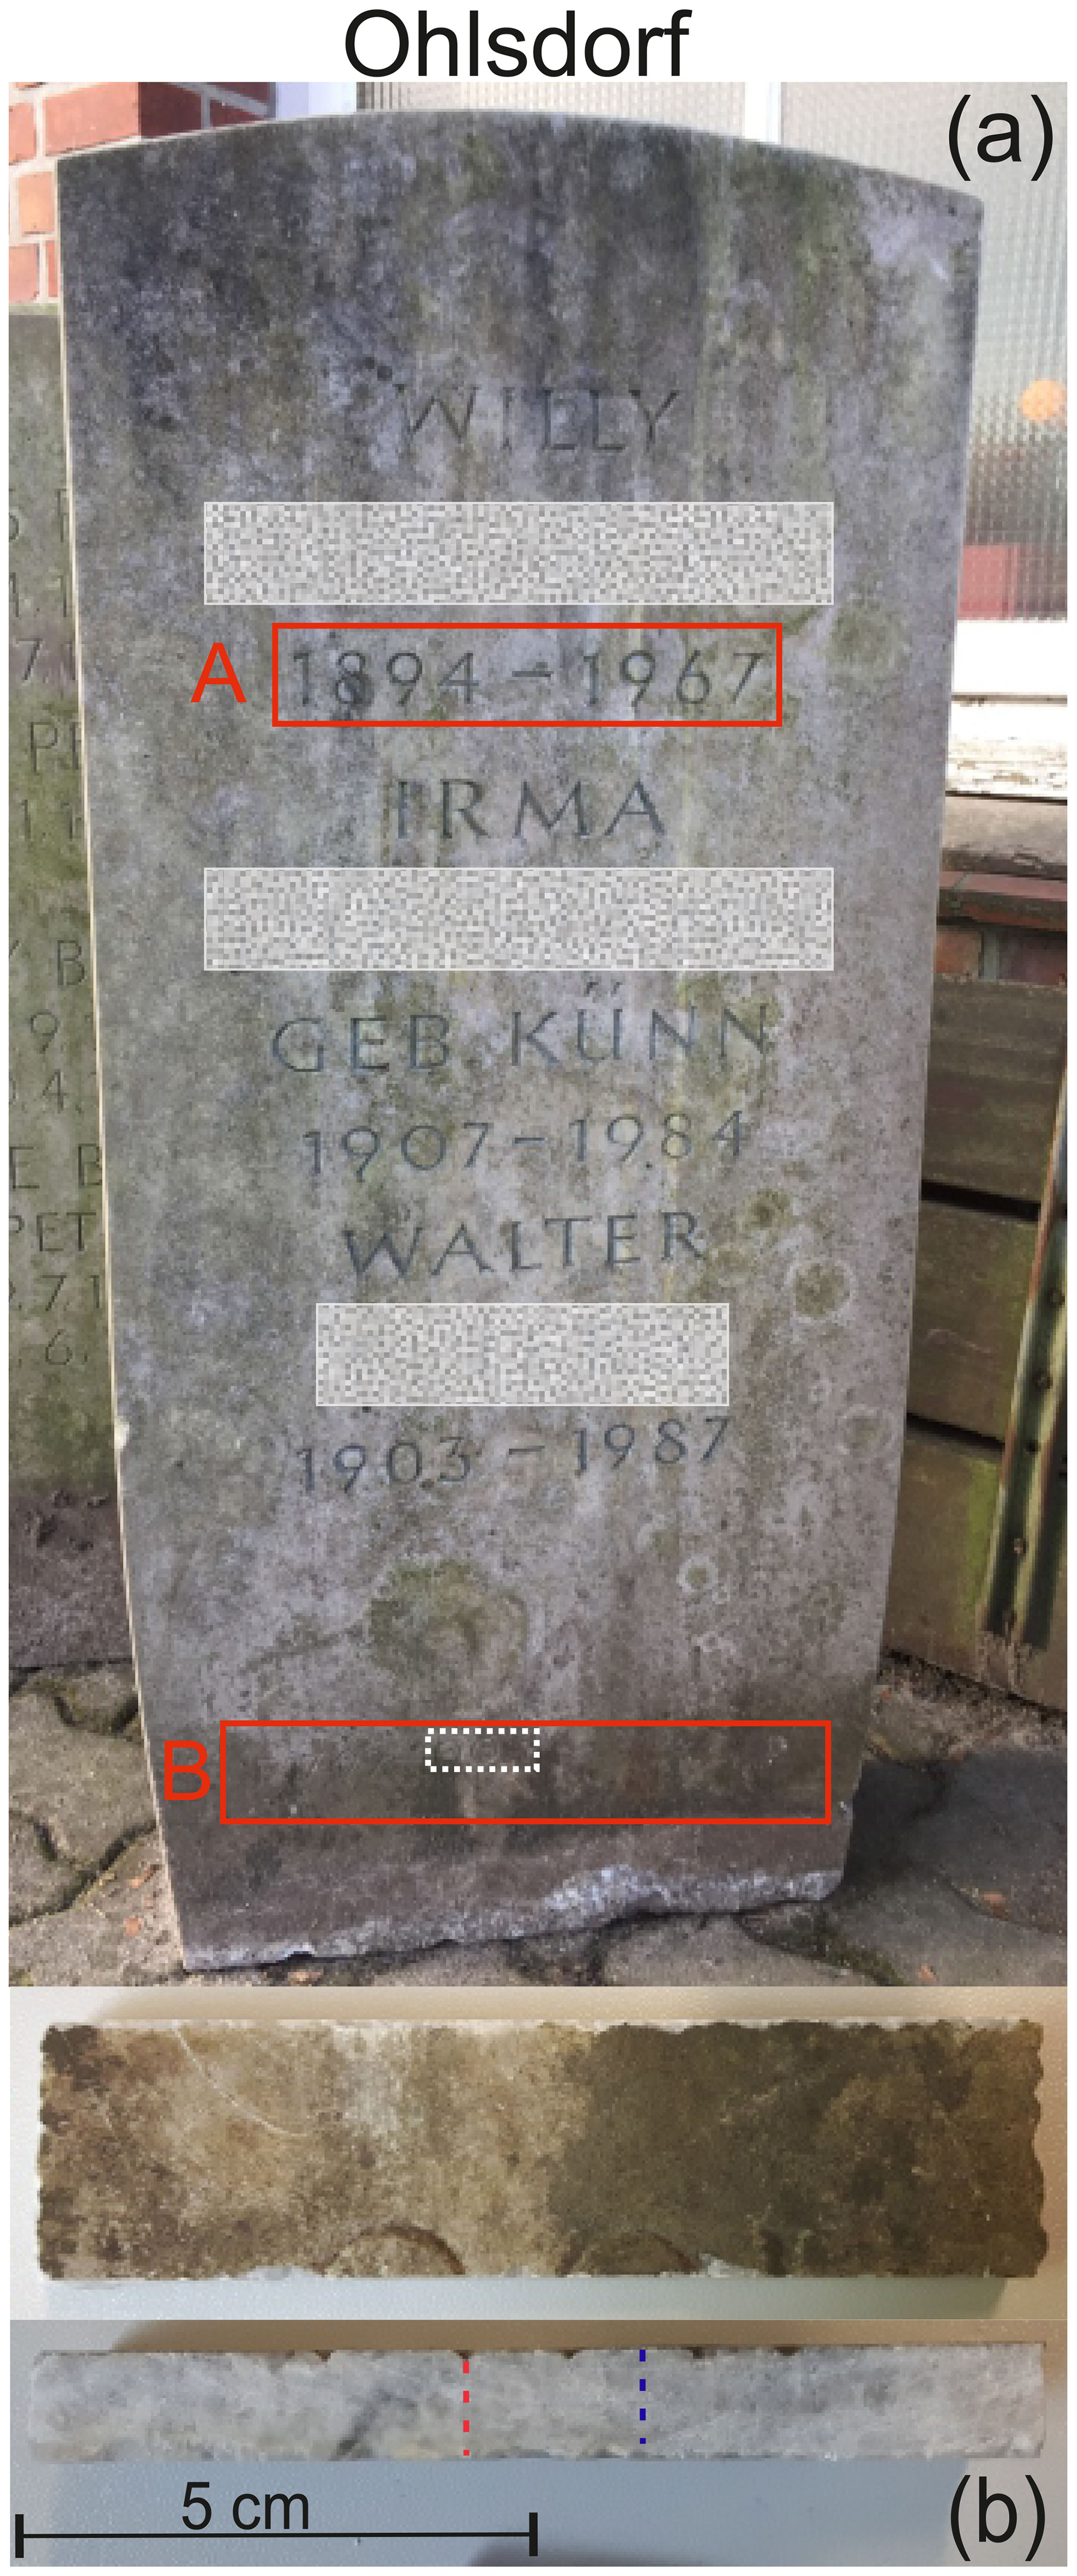
Figure 2(a) Photograph of engraved gravestone (MaD1) from Ohlsdorf (Hamburg Germany); the solid red rectangular lines mark the areas from which samples were cut, where A and B denote cuts from the upper and bottom part of the gravestone (e.g. MaD1A and MaD1B, respectively). (b) Top and side view of sample MaD1B_C4, corresponding to the dashed white rectangle in (a). The dashed red and blue lines in (b) trace the measured line profiles beneath and away from inscriptions, respectively.
Table 1Sample designation, provenance, inscription age, mineral grain size, and letter colouring. The mineral-phase composition was determined by XRD and WD-EPMA (mineral abbreviations: Cal: calcite; Qz: quartz; Dol: dolomite; Ap: apatite; Fsp: feldspar; Py: pyrite; Fl: fluorite).

a The mineral composition of the altered and unaltered areas regarding the major minerals is the same, while Py and Ap could be detected only in the unaltered bulk and mica only in the alteration zone. Fsp appears in both cases. b The mineralogy of the altered and unaltered areas is the same regarding the major minerals. Accessory minerals could be found solely in the unaltered bulk as inclusions.
2.2 Analytical methods
2.2.1 Powder X-ray diffraction (XRD)
The XRD patterns of powders taken from and far from the alteration zone of the Asia Minor marble were collected with a STOE STADI MP diffractometer operating in Bragg–Brentano geometry and equipped with a curved germanium (111) monochromator, providing CuKα1 radiation (λ=1.54056 Å). Powder diffraction data were recorded at room temperature in a 2θ range between 10–70∘, with a step size of 0.01∘ and signal resolution of 0.105∘. The assignment of the crystalline phases composing the sample was carried out through the Crystallographica Search-Match 3.1 programme.
2.2.2 Wavelength-dispersive electron probe microanalysis (WD-EPMA)
Chemical element mapping and WD-EPMA of cross sections were conducted with a Cameca SX100 SEM (scanning electron microscope) system with a wavelength-dispersive detector. The electron accelerating voltage used was 15 kV, while the beam current was 20 nA. The following standards were used: albite for Na, MgO for Mg, corundum for Al, apatite for P, BaSO4 for S and Ba, vanadinite for Cl, GaAs (gallium arsenide) for As, SrTiO3 for Sr, LiF for F, andradite for Si, Ca, and Fe, and orthoclase for K. The chemical composition of the unaltered area of each marble rock was determined by averaging the EPMA data over 150 points for the Asia Minor artefact and 100 points for the Ohlsdorf gravestones. The altered zone of the Asia Minor fragments was considerably thicker than that of marble from Ohlsdorf, and hence its chemical composition could be determined by averaging 45 points, whereas the composition of the altered zones of Ohlsdorf gravestones were analysed by averaging 16 and 25 points for fine- and course-grain marble, respectively. Additionally, randomly found inclusions in the altered zones of marbles from both localities were analysed in ∼ 3–11 points.
2.2.3 Fourier-transform infrared (FTIR) spectroscopy
FTIR spectra were collected in transmittance with a Bruker FTIR spectrometer Vertex 70 equipped with a RT-DLaTGS detector, using the KBr-pellet technique. Spectra in the range of 200–8000 cm−1 were obtained by averaging over 32 scans with an instrumental resolution of 2 cm−1 and subsequently compensated for the contribution of atmospheric CO2 and H2O via the OPUS 7.5 software programme. The IR absorption spectra were baseline corrected with a polynomial function, temperature reduced to account for the Bose–Einstein distribution of phonons, and fitted with pseudo-Voigt peak-shape functions PV = μL + (1-μ)G (L and G stand for Lorentz and Gauss peak-shape functions, respectively, while μ is a variable weight coefficient) to determine the peak positions ω, full widths at half maximum (FWHMs), and integrated intensities I. The data evaluation was carried out through the OriginPro 2019 software package.
2.2.4 Raman spectroscopy
Samples listed in Table 1 were analysed by Raman spectroscopy at room temperature using a Horiba Jobin Yvon T64000 triple-monochromator system coupled with a Symphony LN2-cooled charge-coupled device (CCD) detector and an Olympus BH41 confocal microscope with a 50× long working distance objective. The Raman scattering was excited with the green line (λ=514.532 nm) of a Coherent INNOVA 90C FreD Ar+ laser. The Raman spectrometer was calibrated against the peak at 520.5 cm−1 of a silicon standard wafer. The spectral resolution was ∼ 2 cm−1, while the instrumental peak position accuracy was ∼ 0.35 cm−1. The laser-spot diameter on the sample surface was ∼ 2 µm, while the laser power on the sample surface was 7.9 mW. Data were collected in the spectral range of 15–3800 cm−1, with acquisition times varying between 15 and 30 s and averaged over 3–5 loops to improve the signal-to-noise ratio. The measured spectra were evaluated in the same manner as the IR absorption spectra.
3.1 Powder XRD analysis
Figure 3 shows the powder XRD patterns collected from the alteration zone and unaltered bulk of the marble segments of Asia Minor to determine their mineral-phase constituents. As expected, calcite (CaCO3) is the most abundant mineral in both samples, accompanied by minor quantities of dolomite (CaMg(CO3)2). The XRD pattern of the altered area (black line in Fig. 3) additionally indicated a very small amount of quartz (SiO2). The XRD pattern of unaltered marble from Ohlsdorf resembles that of marble from Asia Minor. Powder XRD analysis could not be employed on the alteration zone of Ohlsdorf gravestones as its infinitesimal thickness did not enable us to collect enough sample material for measurements.
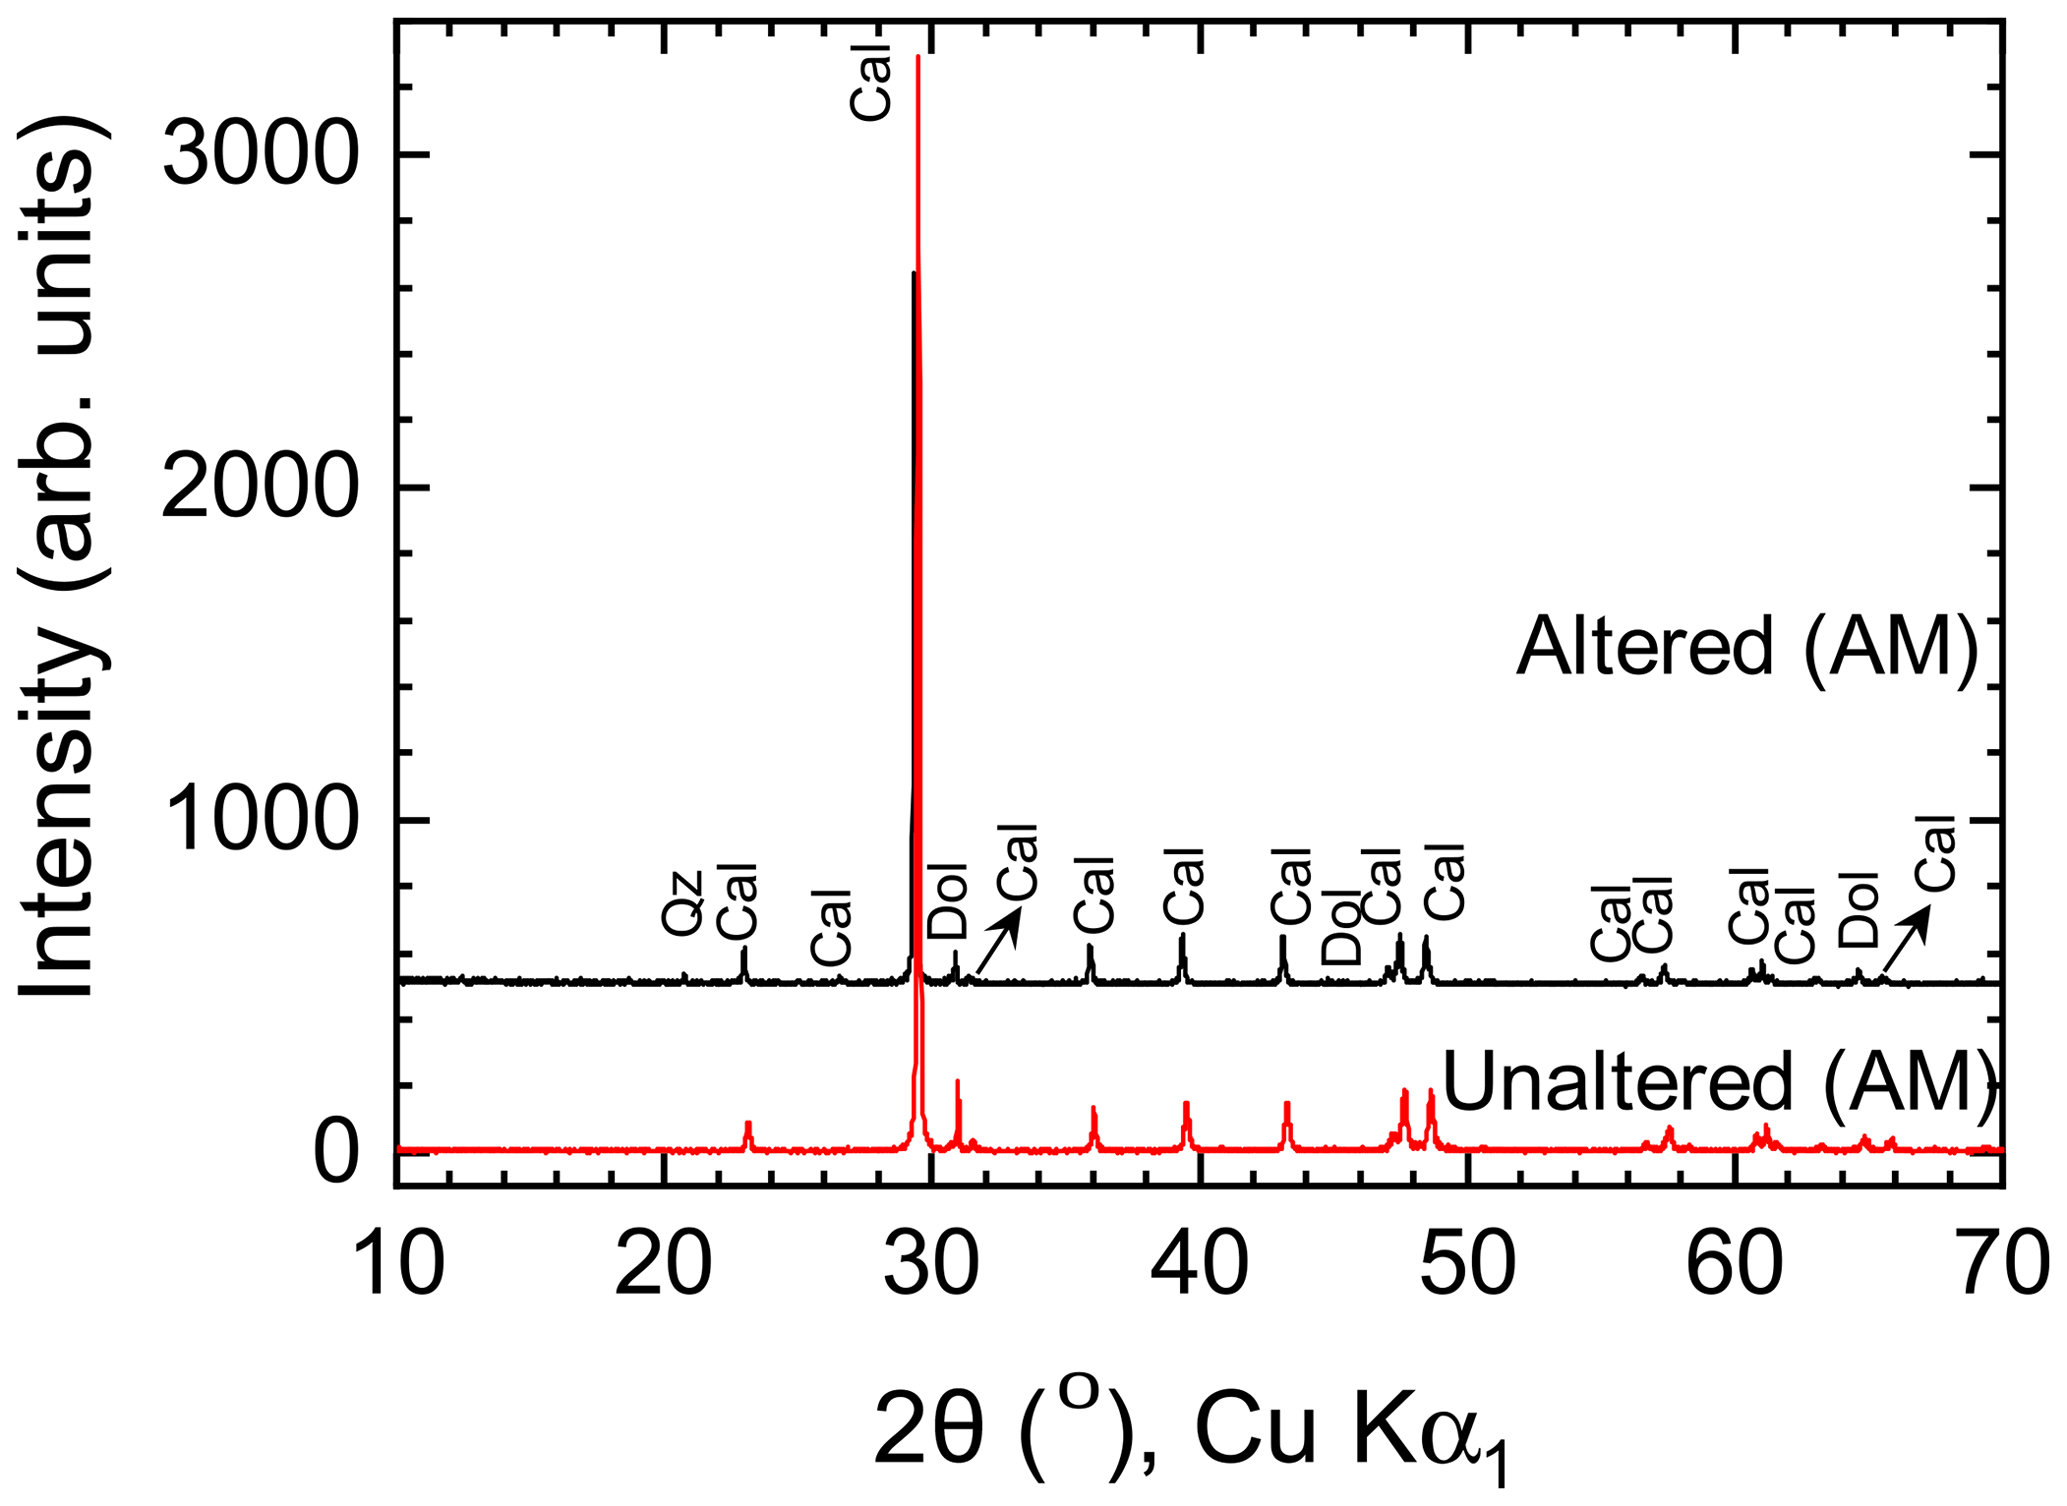
Figure 3Powder XRD patterns of the altered and unaltered zones of marble from Asia Minor (Turkey). Cal, Dol, and Qz mark the Bragg peaks arising from calcite, dolomite, and quartz, respectively.
3.2 Wavelength-dispersive element mapping and EPMA
Figures 4 and 5 display the backscattered electron (BSE) images and chemical element maps of studied cross sections of engraved and non-engraved marble from Ohlsdorf and Asia Minor, respectively. As can be seen, the ancient marble from Asia Minor exhibits a much thicker alteration rim than the samples from Ohlsdorf, which most probably results from the longer exposure time to weathering. For both types of marble, the altered layer is characterized by diminishing contents of Ca and enhanced C, indicating degradation of calcite. A similar correlated change in the Ca and C content can be spotted in the irregular cracks in the marble matrix beneath engraved areas, which might have been induced during the engraving, as well as in the natural cracks that follow the cleavage planes or twin boundaries of calcite (Figs. 4 and 5). Furthermore, micrometre-sized particles rich in Fe (see Figs. 4 and 5), as well as in Mg, Al, Si, and K (see the Supplement), can be spotted in the altered layers, which are most probably phyllosilicate grains from the natural mineral dust embedded in the surface layer during the weathering process or randomly distributed phyllosilicates as accessory phases of marble. The maps also suggest that the altered layer is slightly enriched in S, P, and N (Supplement), which can be related to the effect of the urban environment. The visual examination of the element maps however does not reveal any differences between the altered areas beneath and away from the inscription.
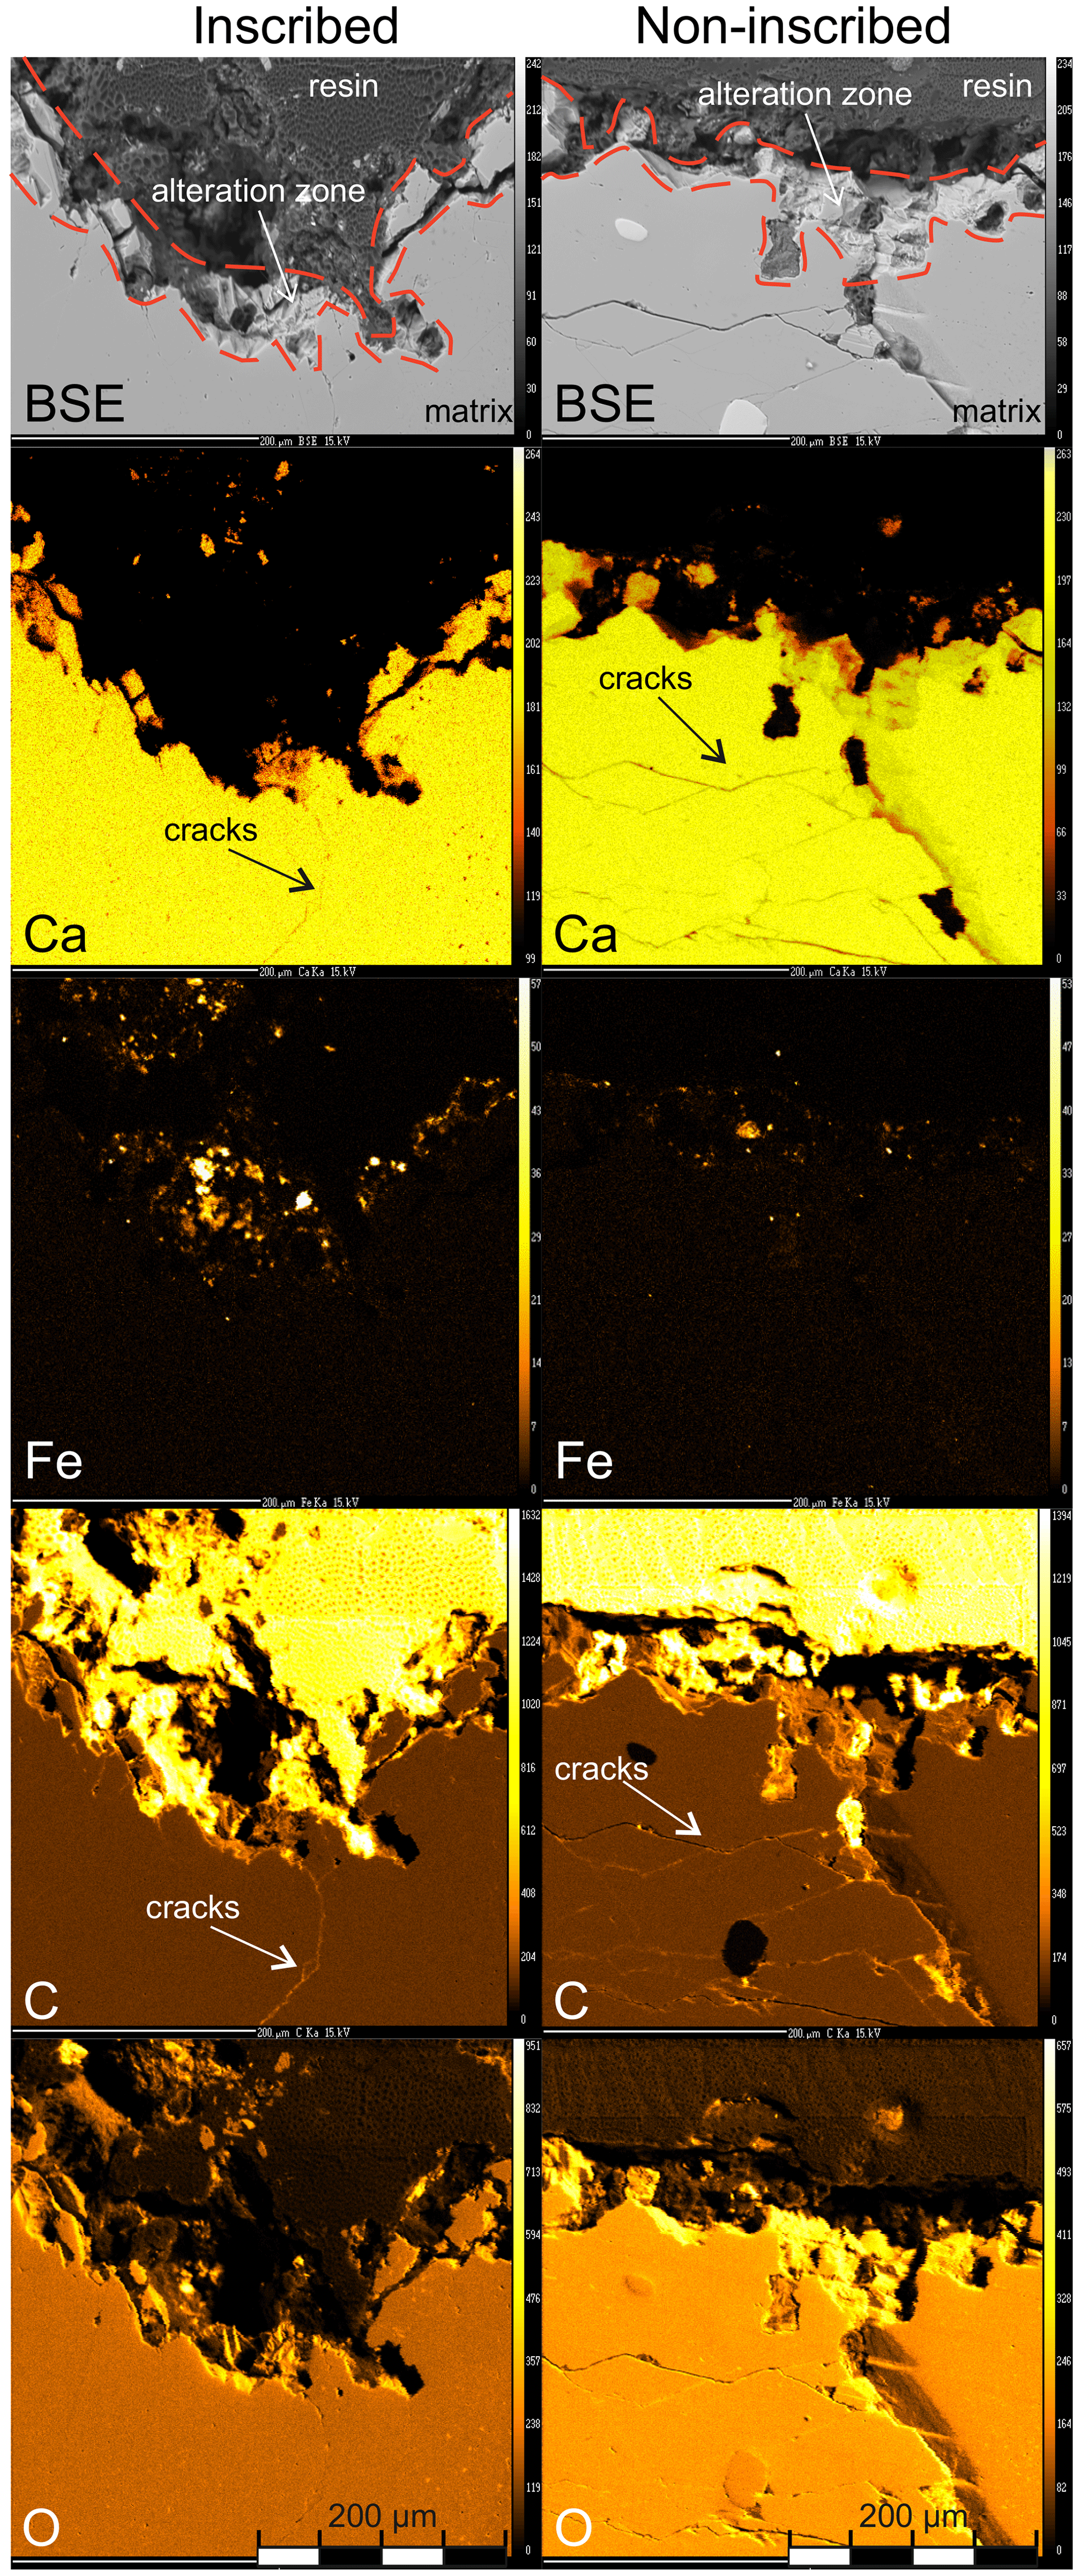
Figure 4Backscattered electron (BSE) image and maps of selected elements of a polished cross section of sample MaD1B (Hamburg) beneath and away from engraved letters. Dashed lines trace the altered surface layer.
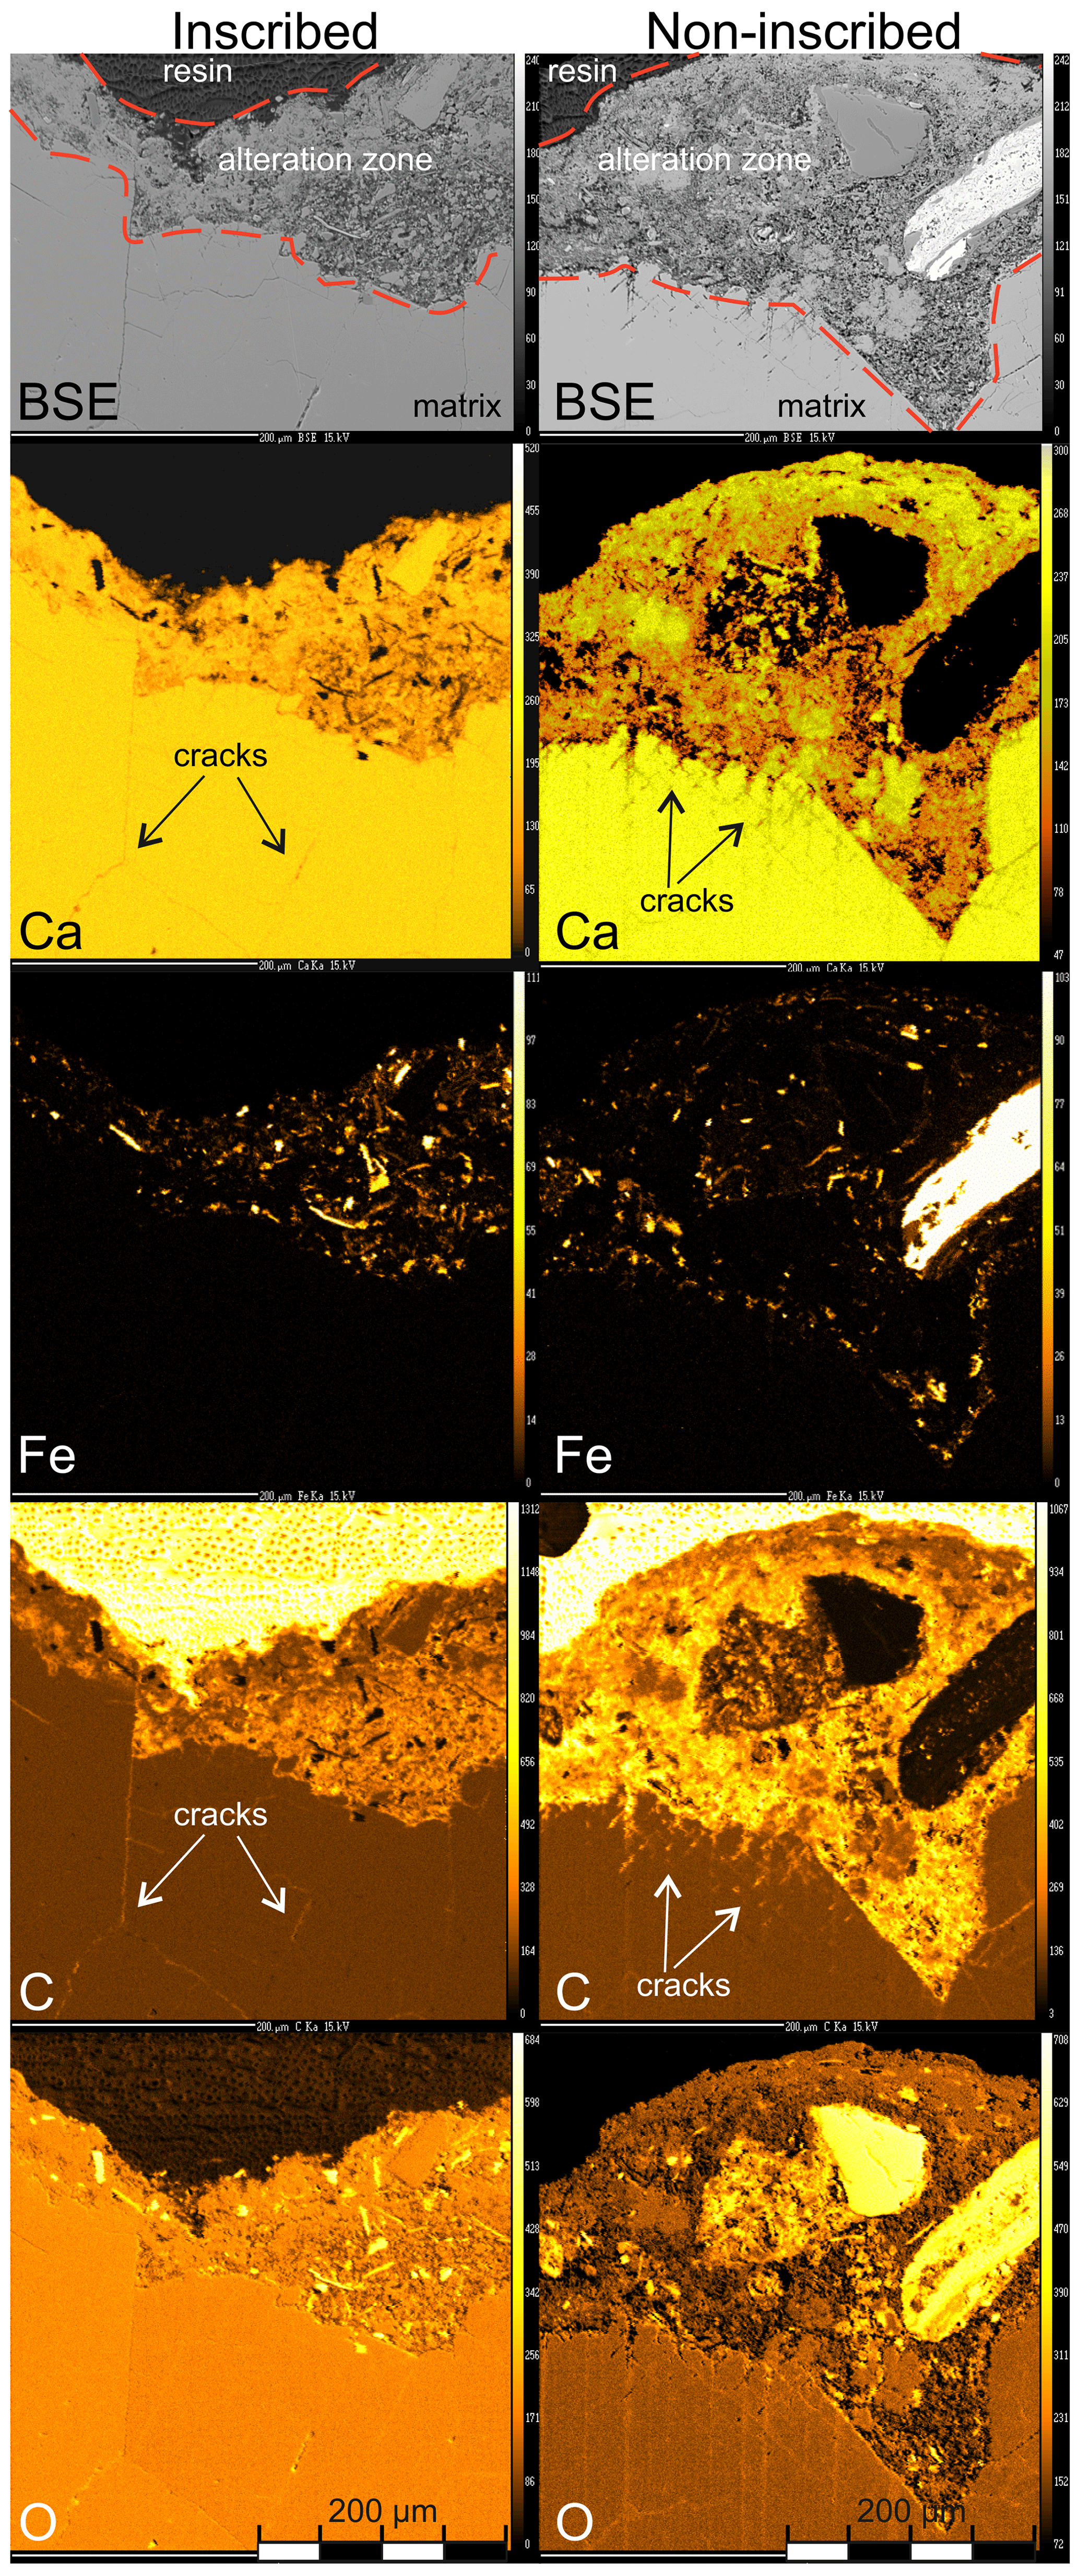
Figure 5Backscattered electron (BSE) image and maps of selected elements of a polished cross section of sample AM_C1 (Asia Minor) beneath and away from engraved letters. Dashed lines trace the altered surface layer; note that the difference in the thickness of the altered layers is not statistically relevant.
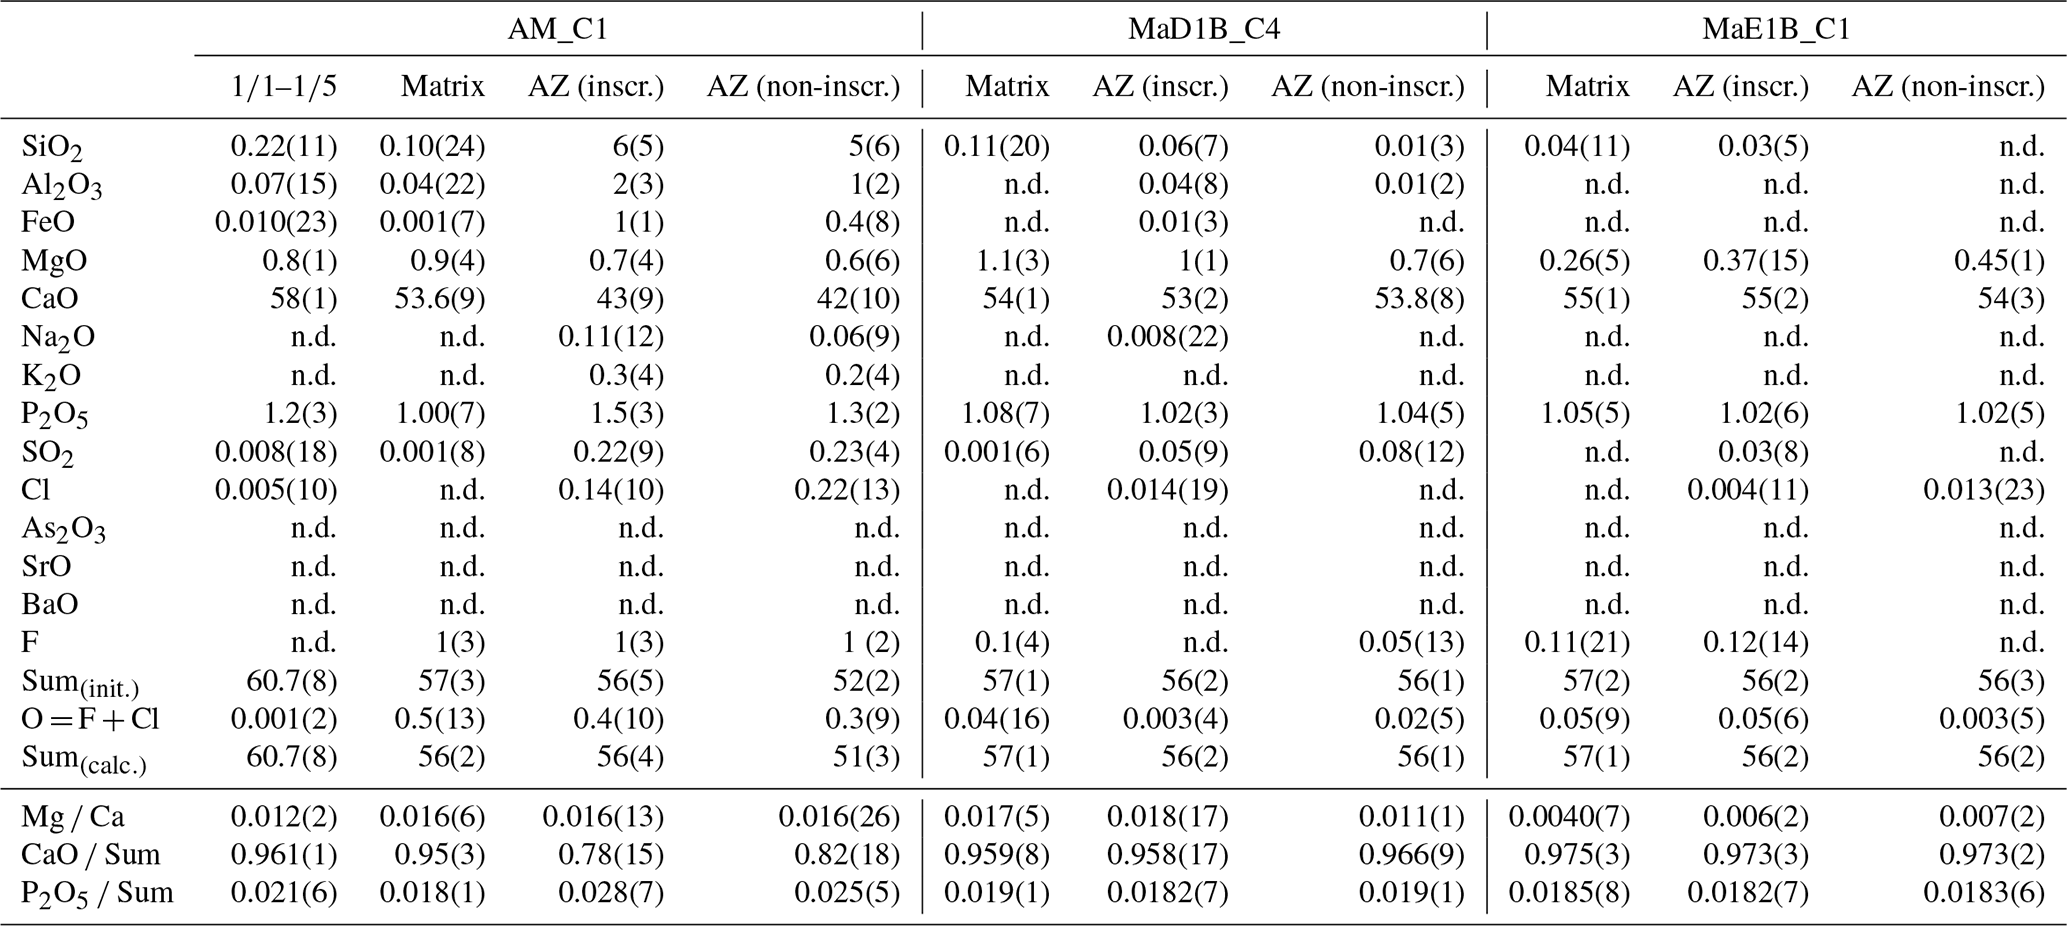
The quantitative chemical analysis (Table 2) verified the outcomes of the element maps. The most remarkable differences between altered and unaltered areas of the same specimen are observed in the Asia Minor marble, in which the CaO Sum(matrix) ratio has an average value of 0.95(3), while CaO Sum(AZ) (CaO sum of the alteration zone) ratio is ∼ 0.78(15). In some cases, e.g. for SiO2 (matrix) and Al2O3 (matrix) of the Asia Minor samples (Table 2), the standard deviation is greater than the average content which is due to the heterogeneous distribution of the corresponding element. A common feature among the samples from Hamburg, as well as from Asia Minor, is that the Mg Ca ratios tend to increase from the matrix towards the alteration zones of engraved regions and non-inscribed areas. The minor amount of dolomite in the marble segments of Asia Minor, which is less weatherable than calcite (Hartmann et al., 2013), can account for the elevated Mg Ca(AZ) with respect to Mg Ca(matrix). The EPMA data also indicate the relatively homogenous distribution of minor phosphate phase in both the matrix and altered layer of all studied marble specimens. Micas were found as accessory minerals in the matrix, as well as in the alteration zone, of the coarse-grained marbles of both localities. Fluorite (CaF2) was observed as random inclusions in the unaltered mass of the fine-grained marbles (Hamburg), whereas feldspars and pyrite (FeS2) were occasionally found in the Asia Minor marble.
Table 2Average chemical composition of the studied samples from Asia Minor (AM_C1) and from the cemetery of Ohlsdorf (Hamburg, Germany) in oxides weight per cent (wt %), determined by WD-EPMA. Abbreviations in the table: AZ: alteration zone; n.d.: not determined; C1, 4: cut 1, 4, respectively.
3.3 Infrared absorption analysis
Compositional differences between altered and unaltered regions of the same specimen can also be deduced from the FTIR absorption spectra (Fig. 6). As expected, calcite dominates the inscription-free and unaltered area of the marble segments of Asia Minor (red spectrum of Fig. 6) with no extra peaks from additional phases. The characteristic peaks of calcite can be generally subdivided into two main categories, namely those generated by lattice phonon modes (involving Ca vibrations, as well as external CO3 modes) and those by CO3 vibrational modes. The infrared bands centred around 222, 320, and 345 cm−1 pertain to the former vibrational group (e.g. Brusentsova et al., 2010), while the peaks near 712, 876, and 1430 cm−1 belong to the latter category and depict the in-plane bending (ν4), out-of-plane bending (ν2), and antisymmetric stretching mode (ν3) of the carbonate ion group, respectively (e.g. Prencipe et al., 2004; Gunasekaran et al., 2006). Minor deviations from these peak positions have been noticed in the spectra of the alteration zones beneath and away from engraved letters (green and black spectra; Fig. 6) and may be caused by trace metal contents or natural impurities in these samples (Gunasekaran et al., 2006). A partial substitution of Ca by Mg in the alteration zones of the samples from Asia Minor and Hamburg could further explain the shift of the most prominent IR peak of calcite at ∼ 1430 cm−1 to higher wavenumbers, which is in accordance with the IR absorption data on calcite, dolomite, and magnesite (e.g. Gunasekaran et al., 2006; Schauble et al., 2006). Overtones and combinations of the fundamental calcite phonon modes can be recognized as weak features in the spectra of Fig. 6 at wavenumbers around 1800, 2517, 2860–2880, 2920, and 2982 cm−1 (Gaffey, 1986; Gunasekaran et al., 2006). The presence of additional phases in the alteration zone of marble from Hamburg is revealed by the extra IR peaks centred at approximately 1072, 1132, 1267, 1724, 2931, and 3447 cm−1. The assignment of the peak near 1070 cm−1 is ambiguous; it may originate from SiO4 antisymmetric stretching in layered silicates like muscovite (e.g. Singha and Singh, 2016, and references therein) or even from organic compounds (e.g. Coates, 2000). The IR peak near 1132 cm−1 matches very well the strongest IR peak of gypsum (CaSO4 ⋅ 2H2O), (Bishop et al., 2014, and references therein), attributed to the ν3(SO4) antisymmetric stretching. The broad band near 1267 cm−1 could be a sign of whewellite (CaC2O4 ⋅ H2O), assigned to the stretching modes of the oxalate group (Petrov and Šoptrajanov 1975; Frost, 2004) but suppressed by the strongest IR peak of calcite ∼ 1430 cm−1 (e.g. Pinna et al., 2015). The peak at 1724 cm−1 is indicative of oxalic acid (e.g. Coates, 2000), which is the most important bioweathering agent produced by lichens and can lead to the secondary formation of calcium oxalates (like whewellite) after its reaction with carbonates (Gadd, 2017). Evidence of organic compounds in the altered area of the coarse-grained marbles of Hamburg (sample MaB1A) is supported also by the peak at ca. 2930 cm−1, which is attributed to the symmetric stretching vibration of the methylene group (Coates, 2000). The broad IR band near 3447 cm−1, arising from O-H bond stretching, is most probably due to H2O incorporated in microvoids and defect OH− groups on internal surfaces; water and hydroxyl groups in hydrous minerals like whewellite and gypsum resulting from weathering can also contribute to this band. It is worth noting that moisture remnants in the KBr pellets can also contribute to the broad IR band near 3447 cm−1; however, this band was systematically stronger in the spectra collected from the altered layers (Fig. 6), indicating the presence of extra hydrous species in the altered marble surface. The altered layer of the Asia Minor marble also exhibits a broad IR peak generated by O–H bond stretching, as well as extra peaks at 1047 and 1084 cm−1. The peak at 1047 cm−1 is close in wavenumber to the v3 (PO) antisymmetric stretching of apatite (e.g. Markovic et al., 2004; Balan et al., 2011; Eisa et al., 2015), whilst the peak at 1084 cm−1 matches very well the strongest IR absorption signal of quartz (Saikia et al., 2008).

Figure 6Infrared absorption spectra of altered areas of marbles from Ohlsdorf and Asia Minor (sample MaB1A and AM_C1, respectively), as well as of unaltered areas of the sample AM_C1, along with a reference calcite spectrum. Peak positions typical of calcite are marked in black, whilst the positions of extra peaks in the spectra from altered marble are given in red. The spectra were vertically offset for clarity.
3.4 Raman scattering analysis
Raman measurements were conducted on cross sections from each rock type along lines beneath and away from inscriptions where the line began from the surface and reached depths of either 1 or 2 mm. Figure 7 displays selected Raman spectra of representative marble cross sections. The Raman spectra collected from the matrix of coarse-grained (Fig. 7a, b, and d) and fine-grained marble (Fig. 7c) contain only peaks typical of calcite: the strongest peak at 1087 cm−1 (ν1(CO) symmetric stretching) being accompanied by the considerably weaker peaks near 156 and 282 cm−1 (external (CO) modes), as well as at 713 (ν4(CO) in-plane bending) and 1436 cm−1 (ν3(CO) antisymmetric stretching) (e.g. Behrens et al., 1995; De La Pierre et al., 2014). Some marble samples exhibited a weak peak at 1067 cm−1 which is due to the 18O satellite mode of the ν1 symmetric stretching vibration of the CO3 anion with an isotopic shift of 19.7 cm−1 (De La Pierre et al., 2014).
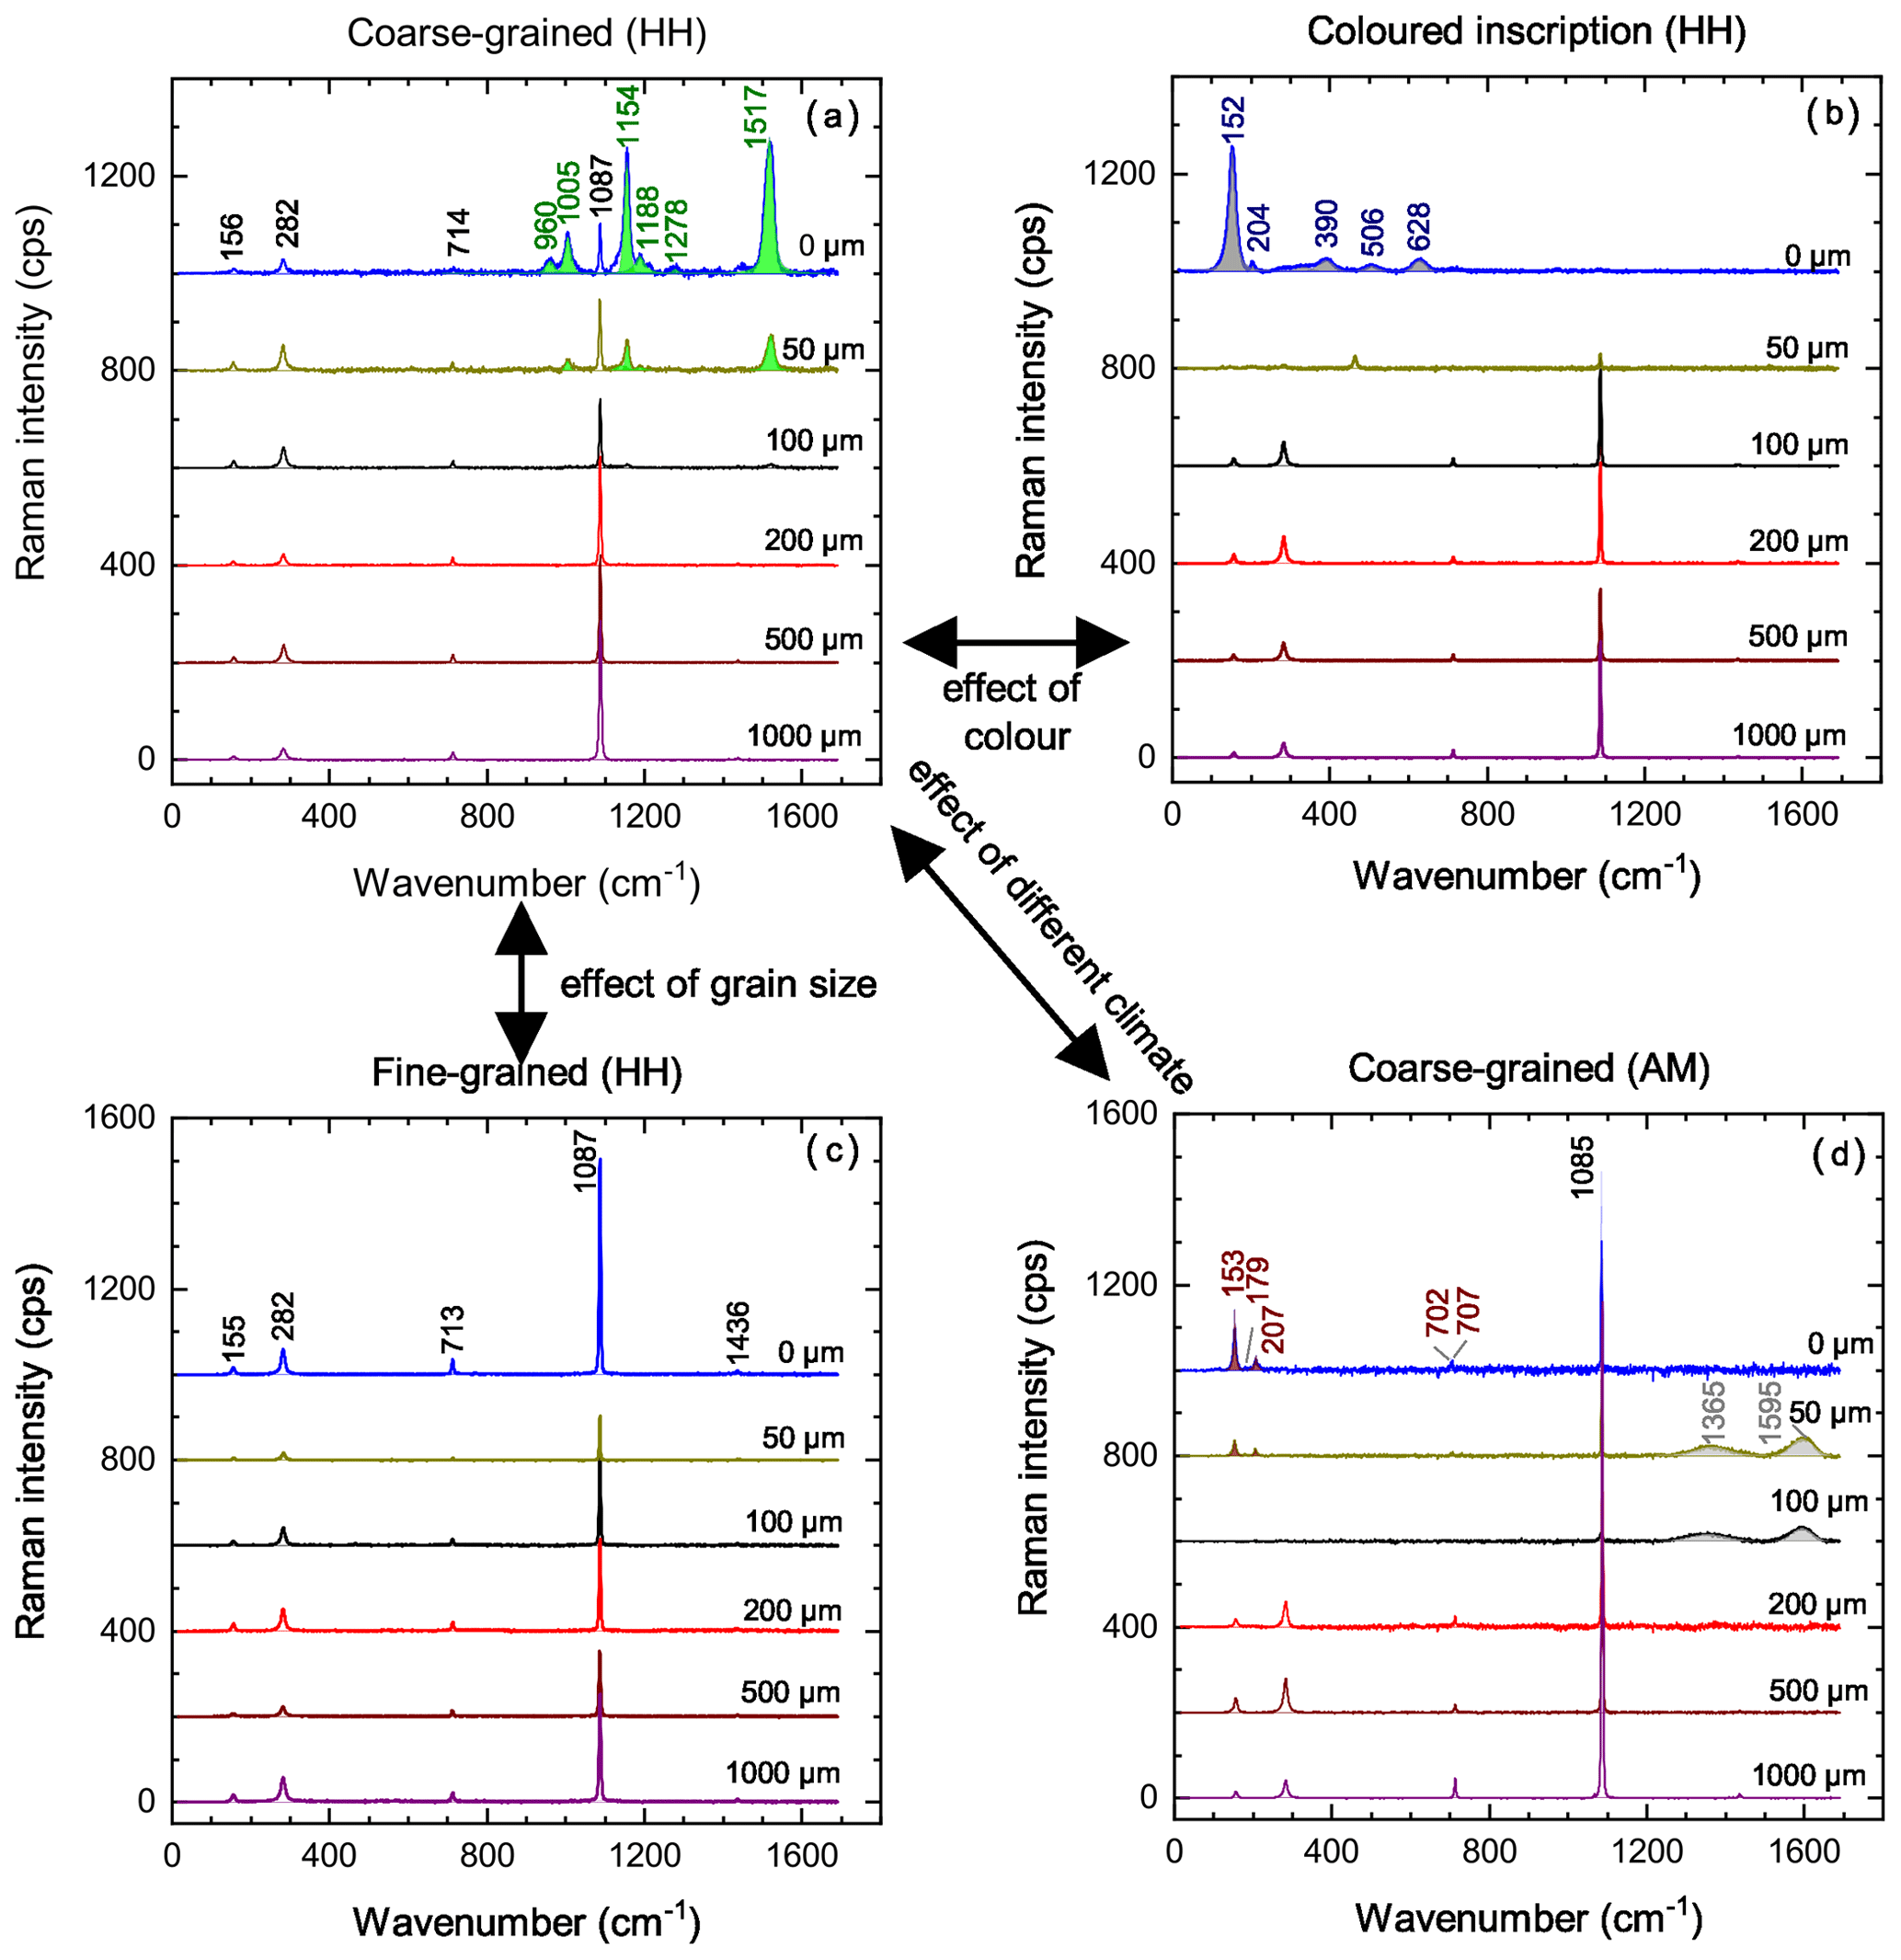
Figure 7Raman spectra collected along line profiles beneath engravings of selected samples, revealing differences emerging from the effect of colour (a vs. b; sample MaD1B_C4L2 vs. MaD1A_C1L4, respectively), grain size (a vs. c; sample MaD1B_C4L2 vs. MaE1B_C2L1, respectively), and diverse environmental conditions (a vs. d; sample MaD1B_C4L2 vs. Am_C1L1, respectively). The shaded extra peaks in (a) are generated by lichen, those in (b) by anatase, and those in (d) by sooth. Sample AM_C1 (d) exhibits a typical spectrum of aragonite at the surface (0 µm) and of calcite for all other points. Black letters in (a) and (c) are indicative of the calcite vibrational modes, while those with green letters characterize additional minerals and compounds (see text for details). Additional peaks at the 0 µm level of (b) are attributed to TiO2, while those with red and grey colour in (d) are attributed to aragonite and carbonaceous material, respectively. Abbreviations in the figure: C is cut, and L is line. The spectra within the same plot were vertically offset for clarity.
The line profiles collected away from the letters on marble from Ohlsdorf did not reveal any additional peaks. In strong contrast, various weathering-related products were detected at the first 100 µm from the surface beneath uncoloured engraved letters on a coarse-grained marble from Ohlsdorf via their characteristic Raman peaks (Fig. 7a), which confirms that the inscription introduces cracks and voids that can facilitate the formation and propagation of weathering-related products through the bulk and allow the host to be infiltrated by foreign substances. The strongest extra peaks are observed near 1154 and 1517 cm−1, indicating crack-enhanced organic molecular inclusions, as they result from the ν(C–C) and ν(C=C) stretching modes of carotenoids in lichen, respectively (Holder et al., 2000; Edwards et al., 2003). The Raman peak near 960 cm−1 should indicate the presence of the metal phosphate phase, e.g. hydroxylapatite or calcium orthosilicate, as its position matches very well the wavenumber of the corresponding Raman-active symmetric PO4 stretching mode (Edwards et al., 2004; Jegova et al., 2013; Litasov and Podgornykh, 2017; Stammeier et al., 2018); we assume this phase belongs to the apatite mineral group, which represents the most common accessory phosphate minerals in marble. The additional peaks around 1187 and 1278 cm−1 can be ascribed to the aromatic ring breathing typical of diverse organic compounds and the CH2=CH2 in-plane rocking mode of alkenes, respectively (e.g. Holder et al., 2000; Barnard and de Waal, 2006). Furthermore, in the first 100 µm of the same line profile we could also identify gypsum through its strongest peak at 1005 cm−1 generated by the ν1(SO4) symmetric stretching mode (Takahashi et al., 1983; Prasad et al., 2001; Buzgar et al., 2009).
The letter colouring apparently suppresses the weathering of marble as none of the above-mentioned organic compounds and minerals were detected beneath coloured letters on course-grained marble from Ohlsdorf (Fig. 7b). The superficial layer (0 µm) exhibits a very strong peak at ∼ 152 cm−1 and several weak peaks at ∼ 204, 335, 390, 506, and 628 cm−1 (see also Supplement Fig. S5). This is a typical Raman pattern of synthetic nanosized anatase with a large internal surface which is used in white pigments (Sahoo et al., 2009). This indicates that the major ingredient of the white pigment used to colour the letters in Ohlsdorf marble is nanosized anatase. The Raman peaks of such nanosized anatase are broader and appear at slightly different positions with respect to those of well crystalline anatase (143, 197, 321, 395, 515, and 638 cm−1; see Supplement Fig. S5) due to the competing phonon confinement effect and the impact of inherent structural defects (Zhang et al., 2000; Ceballos-Chuc et al., 2018). The most intense Raman-active Eg mode (∼ 143 cm−1 in well crystalline anatase) predominately experiences phonon confinement effects, and thus its position ω and FWHM are directly related to the mean crystallite size (Ceballos-Chuc et al., 2018). Spectral fitting of the experimental data gives ω=152.1 and FWHM = 22 cm−1 for the white pigment while giving ω=143.0 and FWHM = 8 cm−1 for reference well crystalline anatase, revealing nanosized anatase in the pigment with an average particle size of 6 nm.
The size of the mineral grains in marble is also critical for the propagation of the weathering-related products. The Raman line profiles of the fine-grained gravestone from Ohlsdorf (Fig. 7c) disclosed no additional mineral phases or organic compounds beneath the engraved areas. It is however worth noting that the inscription age of the studied gravestones from Ohlsdorf is ∼ 60 years, whereas for ancient written artefacts, exposed to weathering for a much longer time, the mineral grain size might be less important.
The Raman spectra collected along a line beneath the inscribed area of the ancient marble artefact from Asia Minor are shown in Fig. 7d. Two peculiar features are observed for this sample. (i) The dominant CaCO3 polymorph within the first 50 µm beneath the inscription is aragonite rather than calcite, as revealed by the presence of the strongest aragonite peak at 1085 cm−1, together with fingerprinting Raman peaks at 114, 153, 179, 194, 207, 246, 702, and 707 cm−1 (e.g. Frech et al., 1980; De La Pierre et al., 2014). Calcite was firstly detected at depths of approximately 120 µm, and (ii) two broad additional peaks are centred around 1365 and 1595 cm−1, which at depths of ∼ 60–120 µm were systematically stronger beneath the inscription than away from the inscription. These extra peaks correspond to the so-called D (diamond-like) and G (graphite-like) peaks in amorphous carbon arising from the ring breathing and C–C bond stretching of sp2-hybridized C, respectively (e.g. Ferrari and Robertson, 2004; Tomasini et al., 2012). Therefore, the main foreign material in ancient marble from Asia Minor seems to be soot-like carbon.
The abundance and penetration depth of the extra phases can be quantified by the integrated intensity of the strongest Raman peak of the corresponding guest compound normalized to that of the major peak of the host matrix. In the case of the Asia Minor marble, we used the intensity ratio between the G peak near 1595 cm−1, representing the carbonaceous material, and the strongest carbonate peak near 1086 cm−1. The resulting intensity ratio (ρ1= I1595 I1086) was plotted against the distance to the surface beneath inscribed and non-inscribed regions (Fig. 8a), and the data points were fitted with asymmetric lognormal statistical distribution . We have chosen a simplified single-peak statistical function to fit ρ1(d) because such a function represents best the apparent existence of a maximum around 60 µm for the non-inscribed areas and around 70–80 µm for the inscribed areas. It is obvious that the peak of ρ1(d) beneath inscriptions is much higher and wider than that of ρ1(d) away from them, and it is positioned at greater depth. This clearly shows that carbonaceous material is more abundant in inscribed areas than in untreated ones of the ancient marbles of Asia Minor as a result of the presence of cracks and voids formed during the engraving process.
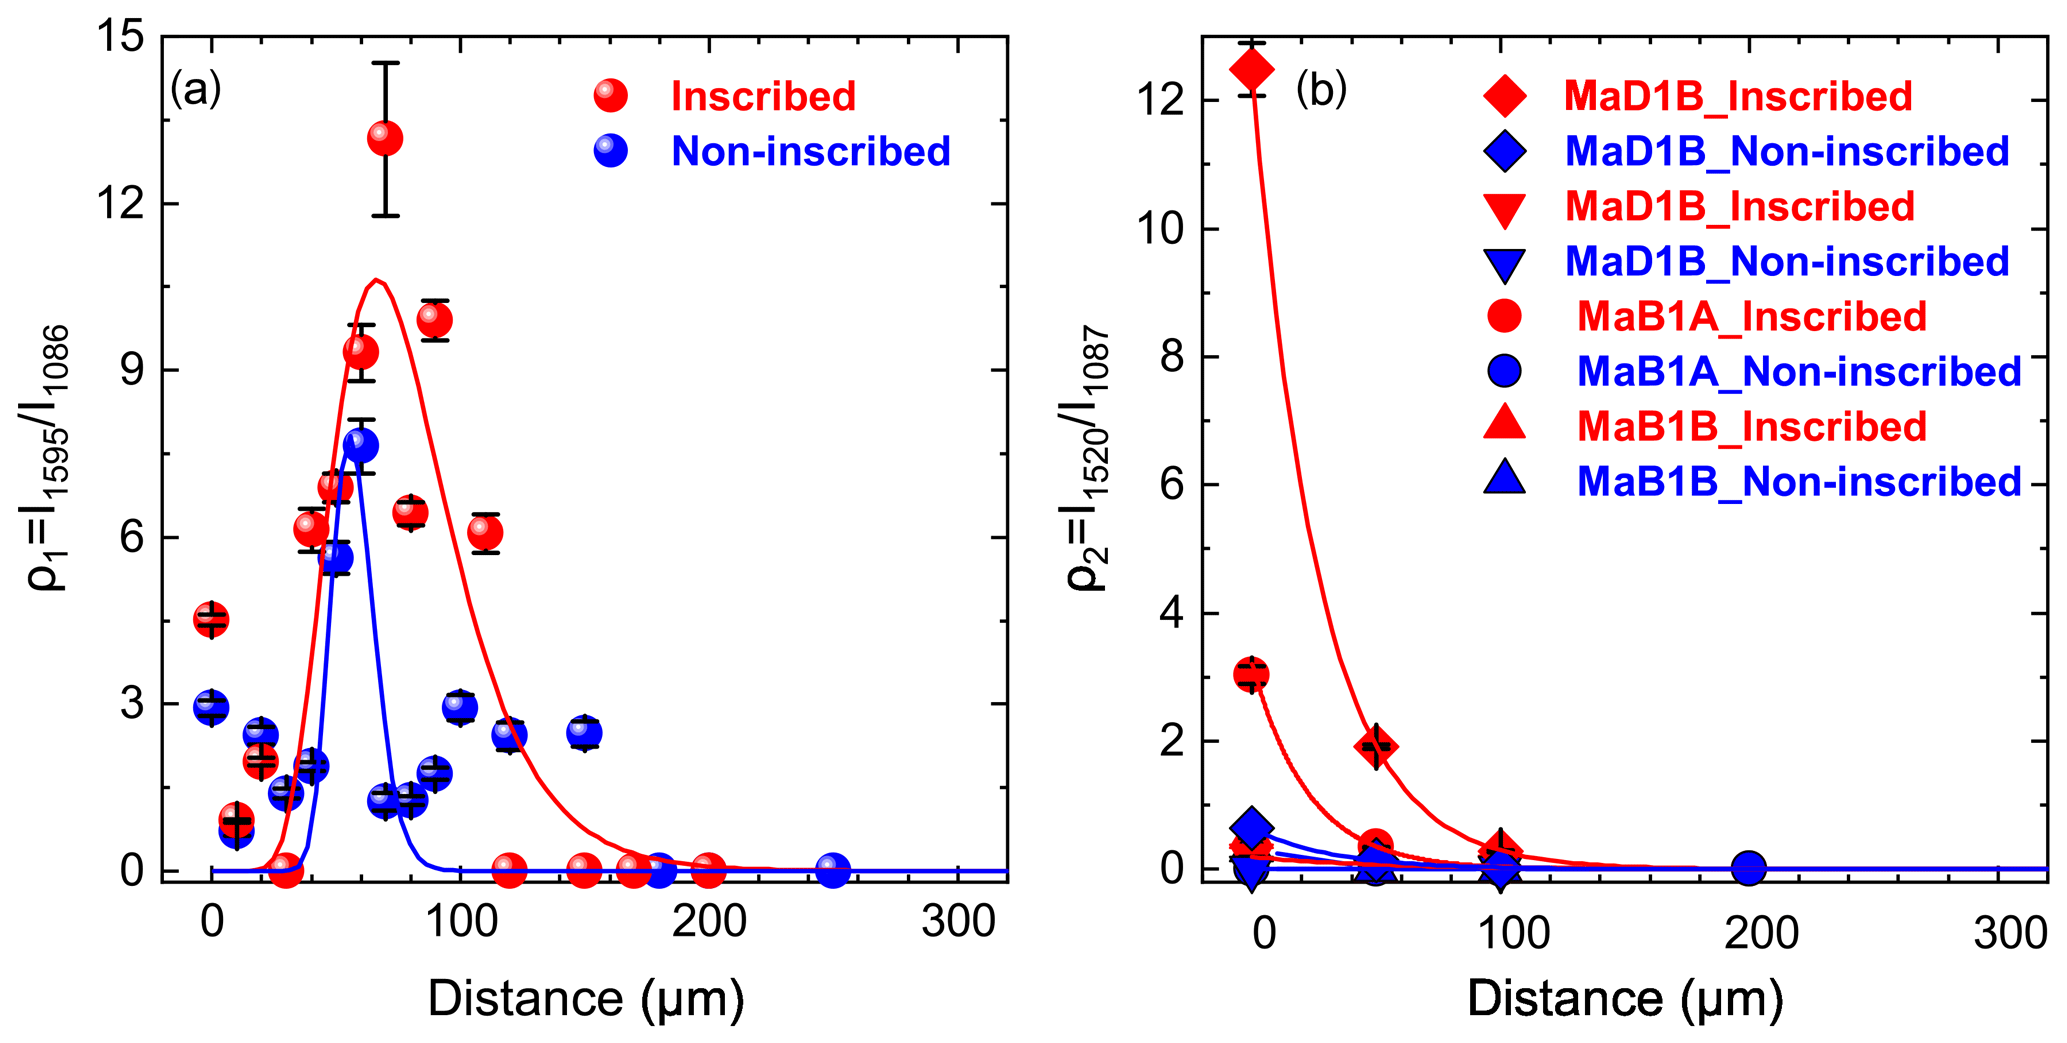
Figure 8Intensity ratios of (a) and (b) plotted against the distance to the surface measured along the lines inferred in the legend beneath inscribed and non-inscribed regions of samples from Asia Minor (a) and Hamburg (b). Lines in (a) are lognormal fits, whereas lines in (b) are exponential decay fits to the corresponding data points.
In the case of marble from Ohlsdorf, subjected mainly to biodegradation due to the specifics of the local climate, we used the intensity ratio ρ2=I1520 I1087, that is, the Raman signal from ν(C=C) of carotenoids versus that from ν1(CO3) of calcite (Fig. 8b). As can be seen, the ρ2(d) ratio rapidly decreases with depth, following an exponential decay . However, the metabolic products of lichens were much more abundant and persist at depths up to ∼ 100 µm beneath engraved letters (Fig. 8b; red lines) of the coarse-grained marbles from Ohlsdorf, as opposed to away from them (Fig. 8b; blue lines), carotenoids were less abundant and limited within the first 50 µm from the surface of the rock-based written artefact. In some cases (e.g. sample MaB1B) carotenoids could only be detected on the outermost surface (1–2 µm in depth) of untreated marble regions. Furthermore, ρ2 has much higher values in every specific measured point beneath inscriptions in comparison with non-inscribed areas when we consider the same cross section (e.g. line profile L1 versus line profile L102 of sample MaB1A in Fig. 8b). Thus, the abundance of metabolic products, i.e. carotenoids produced by lichen, is apparently enhanced beneath the inscribed areas of the coarse-grained gravestones.
As shown above, due to the strongest Raman cross section of organic C=C stretching, its Raman signal can be potentially used to trace the heterogeneous lateral distribution of cracks in the altered layer of biodegraded marble (Hamburg). Likewise, the strong Raman signal from sp2-hybridized C–C bond stretching provides a feasible way to scan the lateral distribution of cracks in weathered marble containing amorphous carbon (Asia Minor). The latter could have been formed as a result of the impact of airborne carbonaceous particles of anthropogenic origin, e.g. electric-power generation, traffic, oil- and wood-fired heating, industrial manufacturing processes, and fossil fuel combustion. Indeed, soot is a feature of ascribed urban environmental pollution (e.g. Wentzel et al., 2003; Engling and Gelencsér, 2010; Grobéty et al., 2010) and should be present in the altered layer of ancient written artefacts from the vicinity of large cities. Soot deposition on the surface of a late Bronze Age/Iron Age mortar found in Danebury (Hampshire, UK) has been detected via Raman spectroscopy (Edwards and Farwell, 2008). Moreover, the Raman signal from both the organic and inorganic C–C stretching vibrations may be resonantly enhanced by using UV laser excitation radiation (e.g. Ferrari and Robertson, 2004). The peak position of the ν(C=C) stretching mode, as well of sp2-hybridized C–C bond, may slightly vary due to substitutional or structural defects (e.g. Barnard and de Waal, 2006; De Oliveira et al., 2010), but it may also slightly change with the laser wavelength (e.g. Ferrari and Robertson, 2004). Hence, in a follow-up study we are going to investigate in detail the feasibility of Raman spectroscopy, varying the excitation laser wavelength between 633 and 325 nm, to map cracks on marble-written artefacts with a mechanically removed upper-layer material to the level where the inscription becomes hardly readable.
The detection of aragonite instead of calcite beneath the inscribed areas in the Asia Minor marble artefacts seems to be statistically irrelevant at least for the sole ancient inscribed marble studied here. Further experiments are necessary to check whether aragonite is indeed a feature related to inscribed areas of marble artefacts subjected to Mediterranean climate. Therefore, although aragonite is well distinguished from calcite by its Raman signature below 300 cm−1, currently we cannot recommend that it be used as a reliable criterion to indirectly trace topological defects and plastic deformations in marble. However, another candidate to scan cracks and voids introduced during the inscribing could be gypsum. The presence of gypsum in the outer altered film of the coarse-grained gravestones beneath and away from inscribed letters was monitored by FTIR and Raman spectroscopy. Element mapping (see Supplement) and EPMA (Table 2) also indicated a slight increase in S in the altered layer. Gypsum has been already reported to be the main weathering product of marble or limestone monuments and statues due to the acid damage of SO2-gas pollutant in urban and industrial environments (e.g. Moropoulou et al., 1998; Rampazzi et al., 2004; Crisci et al., 2009; Conti et al., 2012; Pinna et al., 2015); SO2 interacts with atmospheric water, forming sulfuric acid (H2SO4), whose wet deposition on the marble or limestone surface drives the formation of gypsum (e.g. Maguregui et al., 2012). In the coarse-grained gravestone samples from Ohlsdorf gypsum could be detected via Raman spectroscopy at a depth of 50–100 µm beneath inscriptions and to a lesser extent, or entirely not, at a depth of 0–50 µm beneath untreated areas of the same cuts. Therefore, the presence of gypsum at depths that exceed 50 µm is denotative of inscribed areas only, and similarly to carotenoids and soot-like carbon, it is facilitated by cracks induced during the carving of the letters. It is worth noting that gypsum as a weathered product has been found beneath the surface of the monuments at a depth ranging from 200–500 µm depending on the construction age (15th century BCE–13th century CE) and whether it was exposed to or sheltered from rainfall (Moropoulou et al., 1998; Conti et al., 2012). Therefore, since ν1(SO4) also has a relatively high Raman cross section, nanosized gypsum can be potentially used to scan letters in the absence of other weathering-related products exhibiting stronger Raman peaks.
The extra content of mica, apatite, and quartz mineral particles in the altered layers of marble from Ohlsdorf and Asia Minor, detected by the combined application of Raman, IR, EPMA, and XRD, is most probably related to natural airborne mineral dust (e.g. Engelbrecht and Derbyshire, 2010, e.g. Grobéty et al., 2010). None of the applied analytical methods revealed any differences in the distribution of these mineral phases beneath and away from the inscribed areas.
The Raman spectra of coloured inscriptions disclosed that pigment, i.e. synthetic anatase, prevents lichen formation on their surface. Nevertheless, traces of TiO2-pigments could be potentially used for tracking hardly readable engravings as pigment particles could also enter the cracks and voids of the inscribed medium like the other weathering-related products. The extremely strong Raman peak of anatase near 142–152 cm−1 allows for the detection of this compound with fractions less than 0.1 %. Thus the huge Raman scattering of synthetic anatase might be used as a marker of inscribed regions not only for modern artefacts but also for ancient rock-based written artefacts as traces of this white pigment have been monitored already on Roman wall paintings (Roman villa in UK) from ∼ 150 CE (Edwards et al., 2006).
The results from our Raman spectroscopic analysis clearly reveal detectable dissimilarities in the weathering-induced molecular and mineral embeddings beneath inscribed and non-inscribed areas of the same specimen. This was feasible through the Raman intensity of the sp2-hybridized C–C bond stretching and organic C=C stretching modes normalized to the Raman intensity of the host marble, illustrating a higher abundance and in-depth penetration of soot-like carbon (in the case of Asia Minor) and carotenoids produced by lichens (in the case of Hamburg) beneath inscribed letters. Therefore, such Raman signals, originating from suitable weathering-related products, can potentially be used to scan the lateral distribution of cracks introduced during the engraving procedure. Of critical importance could be also the presence of gypsum which could be used as a second marker of cracks and fissures induced during the inscribing process, especially when the studied artefacts are from urban environments.
Significant factors that influence the nature and propagation of weathering-related products of the same rock type are as follows.
-
Different inscription age. BSE images and chemical element maps highlighted an approximately 3 times thicker alteration layer of the ∼ 2000-year-old inscribed marble from Asia Minor than the ∼ 60-year-old engraved marbles from Hamburg.
-
Local climate and urban environment. Marble in a Mediterranean (Asia Minor) and in temperate oceanic climate (Hamburg) near or within an urban environment can be influenced by diverse decaying agents or characterized by different degradation products, i.e. bioweathering triggered by lichen and acid damage of SO2 gases in the case of Hamburg versus airborne mineral dust and soot-like carbonaceous particles in the case of Asia Minor.
-
Grain size. No additional mineral phases or organic compounds could be monitored beneath the engravings of the fine-grained gravestones of Ohlsdorf.
Letter colouring behaves as an inhibitor for the propagation of lichen bioweathering of marble as none of the above-mentioned weathering-related products were detected beneath coloured letters on coarse-grained marbles from Ohlsdorf. However, the strong Raman scattering of the white pigment that we observed, i.e. synthetic anatase, could be used as a marker of the exact location of inscriptions as pigments are expected to enter the small cavities and cracks characteristic of inscribed rock-based written artefacts.
Overall, the outcomes of this study provide a conceivable way for uncovering hardly readable or completely vanished inscribed text on rock-based written artefacts via the further systematic study of relevant samples through Raman 2D mapping, especially if combined with the novel μ-SORS method (e.g. Conti et al., 2015). Further work, based on Raman spectroscopy, is in progress to ascertain the effect of different acids and atmospheric CO2 under controlled temperature and humidity levels upon freshly inscribed marble and limestone pieces as a next step to understand the response of rock-based written artefacts in an urban environment and to assist in the conservation of our cultural heritage.
All data derived from this research are available upon request from the corresponding author.
The supplement related to this article is available online at: https://doi.org/10.5194/ejm-33-189-2021-supplement.
BM, JS, and KH initiated the project. SA performed the data collection and evaluation. SA wrote the paper with input from BM, JS, and KH. All authors discussed and interpreted the results.
The authors declare that they have no conflict of interest.
The research for this study was funded by the Deutsche Forschungsgemeinschaft (DFG, German Research Foundation) under Germany's Excellence Strategy – EXC 2176 “Understanding Written Artefacts: Material, Interaction and Transmission in Manuscript Cultures”, project no. 390893796. The research was conducted within the scope of the Centre for the Study of Manuscript Cultures (CSMC) at Universität Hamburg. We thank Stefanie Heidrich and Peter Stutz, Universität Hamburg, for help with WD-EPMA measurements and sample preparation, as well as Joachim Ludwig and Leonie Tipp for partial help with XRD and Raman measurements, respectively. We are very grateful to the administration and employees of the cemetery of Ohlsdorf for kindly providing marble gravestones.
This research has been supported by the Deutsche Forschungsgemeinschaft (grant no. EXC 2176 “Understanding Written Artefacts: Material, Interaction and Transmission in Manuscript Cultures”).
This paper was edited by Thilo Rehren and reviewed by two anonymous referees.
Artioli, G. (Eds.): Scientific methods and cultural heritage, Oxford University Press Inc., New York, 2010.
Balan, E., Delattre, S., Roche, D., Segalen, L., Morin, G., Guillaumet, M., Blanchard, M., Lazzeri, M., Brouder, C., and Salje, E. K. H.: Line-broadening effects in the powder infrared spectrum of apatite, Phys. Chem. Mineral., 38, 111–122, 2011.
Barnard, W. and de Waal, D.: Raman investigation of pigmentary molecules in the molluscan biogenic matrix, J. Raman Spectrosc., 37, 342–352, 2006.
Behrens, G., Kuhn, L. T., Ubic, R., and Heuer, A. H.: Raman spectra of vateritic calcium carbonate, Spectrosc. Lett., 28, 983–995, 1995.
Bishop, J. L., Lane, M. D., Dyar, M. D., King, S. J., Brown, A. J., and Swayze, G. A.: Spectral properties of Ca-sulfates: Gypsum, basanite and anhydrite, Am. Mineral., 99, 2105–2115, 2014.
Brusentsova, T. N., Peale, R. E., Maukonen, D., Harlow, G. E., Boesenberg, J. S., and Ebel, D.: Far infrared spectroscopy of carbonate minerals, Am. Mineral., 95, 1515–1522, 2010.
Buzgar, N., Buzatu, A., and Sanislav, I.V.: The Raman study of certain sulfates, An. Stiint. Univ. Al. I. Cuza Iasi Geol., 55, 5–23, 2009.
Ceballos-Chuc, M. C., Ramos-Castillo, C. M., Alvarado-Gil, J. J., Oskam, G., and Rodríguez-Gattorno, G.: Influence of brookite impurities on the Raman spectrum of TiO2 anatase nanocrystals, J. Phys. Chem. C, 122, 19921–19930, 2018.
Coates, J.: Interpretation of infrared spectra, a practical approach, in: Encyclopedia of Analytical Chemistry, edited by: Meyers, R. A., John Wiley & Sons Ltd., Chichester, 10815–10837, 2000.
Colomban, P.: The on-site/remote Raman analysis with mobile instruments: a review of drawbacks and success in cultural heritage studies and other associated fields, J. Raman Spectrosc., 43, 1529–1535, 2012.
Conti, C., Aliatis, I., Colombo, C., Greco, M., Possenti, E., Realini, M., Castignioli, C., and Zerbi, G.: μ-Raman mapping to study calcium oxalate historical films, J. Raman Spectrosc., 43, 1604–1611, 2012.
Conti, C., Colombo, C., Realini, M., and Matousek, P.: Subsurface analysis of painted sculptures and plasters using micrometer-scale spatially offset Raman spectroscopy (micro-SORS), J. Raman Spectrosc., 46, 476–482, 2015.
Cooke, R. U., Inkpen, R. J., and Wiggs, G. F. S.: Using gravestones to assess changing rates of weathering in the United Kingdom, Earth Surf. Process. Landf., 20, 531–546, 1995.
Crippa, M., Legnaioli, S., Kimbriel, C., and Ricciardi, P.: New evidence for the international use of calomel as a white pigment, J. Raman Spectrosc., 52, 15–22, 2021.
Crisci, G. M., La Russa, M. F., Malagodi, M., Mariani, F., Mazzoleni, P., Pezzino, A., and Ruffolo, S. A.: Study of alteration and degradation products of a Roman marble sarcophagus located in the medieval cloister of the old St Cosimato's Convent, now the new “Regina Margherita Hospital” (Rome), Conserv. Sci. Cult. Herit., 9, 143–156, 2009.
De La Pierre, M., Carteret, C., Maschio, L., André E., Orlando, R., and Dovesi, R.: The Raman spectrum of CaCO3 polymorphs calcite and aragonite: A combined experimental and computational study, J. Chem. Phys., 140, 164509, https://doi.org/10.1063/1.4871900, 2014.
De Oliveira, V. E., Castro, H. V., Edwards, H. G. M., and de Oliveira, L. F. C.: Carotenes and carotenoids in natural biological samples: a Raman spectroscopic analysis, J. Raman Spectrosc., 41, 642–650, 2010.
Dragovich, D.: Marble weathering in an industrial environment, Eastern Australia, Environ. Geol. Water Sci., 17, 127–132, 1991.
Edwards, H. G. M. and Farwell, D. W.: The conservational heritage of wall paintings and buildings: an FT-Raman spectroscopic study of prehistoric, Roman, medieval and Renaissance lime substrates and mortars, J. Raman Spectrosc., 39, 985–992, 2008.
Edwards, H. G. M., Farwell, D. W., and Seaward, M. R. D.: Raman spectra of oxalates in lichen encrustations on Renaissance frescoes, Spectrochim. Acta A, 47, 1531–1539, 1991.
Edwards, H. G. M., Seaward, M. R. D., Attwood, S. J., Little, S. J., de Oliveira, L. F. C., and Tretiach, M.: FT-Raman spectroscopy of lichens on dolomitic rocks: an assessment of metal oxalate formation, Analyst, 128, 1218–1221, 2003.
Edwards, H. G. M., Colomban, P., and Bowden, B.: Raman spectroscopic analysis of an English soft-paste porcelain plaque-mounted table, J. Raman Spectrosc., 35, 656–661, 2004.
Edwards, H. G. M., Hassan, N. F. N., and Middleton, P. S.: Anatase – a pigment in ancient artwork or a modern usurper?, Anal. Bioanal. Chem., 384, 1356–1365, 2006.
Eisa, M. Y., Al Dabbas, M., and Abdulla, F. H.: Quantitative identification of phosphate using X-ray diffraction and Fourier transform infrared (FTIR) spectroscopy, Int. J. Curr. Microbiol. App. Sci., 4, 270–283, 2015.
Engelbrecht, J. P. and Derbyshire, E.: Airborne mineral dust, Elements, 6, 241–246, 2010.
Engling, G. and Gelencsér, A.: Atmospheric brown clouds: from local air pollution to climate change, Elements, 6, 223–228, 2010.
Ferrari, A. C. and Robertson, J.: Raman spectroscopy of amorphous, nanostructured, diamond-like carbon, and nanodiamond, Phil. Trans. R. Soc. Lond. A, 362, 2477–2512, 2004.
Frech, R., Wang, E. C., and Bates, J. B.: The i.r. and Raman spectra of CaCO3 (aragonite), Spectrochim. Acta A, 36, 915–919, 1980.
Frost, R. L.: Raman spectroscopy of natural oxalates, Anal. Chim. Acta, 517, 207–214, 2004.
Frost, R. L. and Weier, M. L.: Raman spectroscopy of natural oxalates at 298 and 77 K, J. Raman Spectrosc., 34, 776–785, 2003.
Gadd, G. M.: Fungi, rocks, and minerals, Elements, 13, 171–176, 2017.
Gaffey, S. J.: Spectral reflectance of carbonate minerals in the visible and near infrared (0.35–2.55 microns): calcite, aragonite, and dolomite, Am. Mineral., 71, 151–162, 1986.
Gieré, R. and Querol, X.: Solid particulate matter in the Atmosphere, Elements, 6, 215–222, 2010.
Grobéty, B., Gieré, R., Dietze, V., and Stille, P.: Airborne particles in the urban environment, Elements, 6, 229–234, 2010.
Gunasekaran, S., Anbalagan, G., and Pandi, S.: Raman and infrared spectra of carbonates of calcite structure, J. Raman Spectrosc., 37, 892–899, 2006.
Hartmann, J., West, A. J., Renforth, P., Köhler, P., De La Rocha, C. L., Wolf-Gladrow, D. A., Dürr, H. H., and Scheffran, J.: Enhanced chemical weathering as a geoengineering strategy to reduce atmospheric carbon dioxide, supply nutrients, and mitigate ocean acidification, Rev. Geophys., 51, 113–149, 2013.
Holder, J. M., Wynn-Williams, D. D., Rull Perez, F., and Edwards, H. G. M.: Raman spectroscopy of pigments and oxalates in situ within epilithic lichens: Acaroscopa from the Antarctic and Mediterranean, New Phytol., 145, 271–280, 2000.
Jegova, G., Titorenkova, R., Rashkova, M., and Mihailova, B.: Raman and IR reflection micro-spectroscopic study of Er : YAG laser treated permanent and deciduous human teeth, J. Raman Spectrosc., 44, 1483–1490, 2013.
Litasov, K. D. and Podgornykh N. M.: Raman spectroscopy of various phosphate minerals and occurrence of tuite in the Elga IIE iron meteorite, J. Raman Spectrosc., 48, 1518–1527, 2017
Maguregui, M., Knuutinen, U., Martínez-Arkarazo, I., Giakoumaki, A., Castro, K., and Madariaga, J. M.: Field Raman analysis to diagnose the conservation state of excavated walls and wall paintings in the archaeological site of Pompeii (Italy), J. Raman Spectrosc., 43, 1747–1753, 2012.
Markovic, M., Fowler, B. O., and Tung, M. S.: Preparation and comprehensive characterization of a calcium hydroxyapatite reference material, J. Res. Natl. Inst. Stand. Technol., 109, 553–568, 2004.
Martínez-Arkarazo, I., Smith, D. C., Zuloaga, O., Olazabal, M. A., and Madariaga, J. M.: Evaluation of three different mobile Raman microscopes employed to study deteriorated civil building stones, J. Raman Spectrosc., 39, 1018–1029, 2008.
Matousek, P., Conti, C., Realini, M., and Colombo, C.: Micro-scale spatially offset Raman spectroscopy for non-invasive subsurface analysis of turbid materials, Analyst, 141, 731–739, 2016.
Moropoulou, A., Bisbikou, K., Torfs, K., Van Grieken, R., Zezza, F., and Macri, F.: Origin and growth of weathering crusts on ancient marbles in industrial atmosphere, Atmos. Environ., 32, 967–982, 1998.
Petrov, I. and Šoptrajanov, B.: Infrared spectrum of whewellite, Spectrochim. Acta A., 31, 309–316, 1975.
Pinna, D., Galeotti, M., and Rizzo, A.: Brownish alterations on the marble statues in the church of Orsanmichele in Florence; what is their origin?, Herit. Sci., 3, p. 7, https://doi.org/10.1186/s40494-015-0038-1, 2015.
Powers, J., Clinton, N. D., Huang, R., Smilgies, D. M., Bilderback, D., Clinton, K., and Thorne, R. E.: X-ray fluorescence recovers writing from ancient inscriptions, Z. Papyr. Epigr., 152, 221–227, 2005.
Prasad, P. S. R., Pradhan, A., and Gowd, T. N.: In situ micro-Raman investigation of dehydration mechanism in natural gypsum, Curr. Sci., 80, 1203–1207, 2001.
Prencipe, M., Pascale, F., Zicovich-Wilson, C.M., Saunders, V.R., Orlando, R., and Dovesi, R.: The vibrational spectrum of calcite (CaCO3): an ab initio quantum-mechanical calculation, Phys. Chem. Mineral., 31, 559–564, 2004.
Rampazzi, L., Andreotti, A., Bonaduce, I., Colombini, M. P., Colombo, C., and Toniolo, L.: Analytical investigation of calcium oxalate films on marble monuments, Talanta, 63, 967–977, 2004.
Realini, M., Botteon, A., Conti, C., Colombo, C., and Matousek, P.: Development of portable defocusing micro-scale spatially offset Raman spectroscopy, Analyst, 141, 3012–3019, 2016.
Realini, M., Conti, C., Botteon, A., Colombo, C., and Matousek, P.: Development of a full micro-scale spatially offset Raman spectroscopy prototype as a portable analytical tool, Analyst, 142, 351–355, 2017.
Sahoo, S., Arora, A. K., and Sridharan V.: Raman line shapes of optical phonons of different symmetries in anatase TiO2 nanocrystals, J. Phys. Chem. C, 113, 16927–16933, 2009.
Saikia, B. J., Parthasarathy, G., and Sarmah, N. C.: Fourier transform infrared spectroscopic estimation of crystallinity in SiO2 based rocks, Bull. Mater. Sci., 31, 775–779, 2008.
Schauble, E. A., Ghosh, P., and Eiler, J. M.: Preferential formation of 13C-18O bonds in carbonate minerals, estimated using first-principles lattice dynamics, Geochim. Cosmochim. Ac., 70, 2510–2529, 2006.
Singha, M. and Singh, L.: Vibrational spectroscopic study of muscovite and biotite layered phyllosilicates, Indian J. Pure Appl. Phys., 54, 116–122, 2016.
Smith, D. C.: In situ mobile subaquatic archaeometry evaluated by non-destructive Raman microscopy of gemstones lying under impure waters, Spectrochim. Acta A, 59, 2353–2369, 2003.
Sodo, A., Tortora, L., Biocca, P., Municchia, A. C., Fiorin, E., and Ricci, M. A.: Raman and time of flight secondary ion mass spectrometry investigation answers specific conservation questions on Bosch painting Saint Wilgefortis Triptych, J. Raman Spectrosc., 50, 150–160, 2019.
Stammeier, J. A., Purgstaller, B., Hippler, D., Mavromatis V., and Dietzel, M.: In-situ Raman spectroscopy of amorphous calcium phosphate to crystalline hydroxyapatite transformation, Methods X, 5, 1241–1250, 2018.
Takahashi, H., Maehara, I., and Kaneko, N.: Infrared reflection spectra of gypsum, Spectrochim. Acta A, 39, 449–455, 1983.
Tomasini, E. P., Halac, E. B., Reinoso, M., Di Liscia, E. J., and Maier, M. S.: Micro-Raman spectroscopy of carbon-based black pigments, J. Raman Spectrosc., 43, 1671–1675, 2012.
Twilley, J.: Raman spectroscopy investigations of the weathering alteration of a predazzite marble mouflon of the Indus Valley Culture, J. Raman Spectrosc., 37, 1201–1210, 2006.
Wentzel, M., Gorzawski, H., Naumann, K.-H., Saathoff, H., and Weinbruch, S.: Transmission electron microscopical and aerosol dynamical characterization of soot aerosols, J. Aerosol Sci., 34, 1347–1370, 2003.
Zhang, W. F., He, Y. L., Zhang, M. S., Yin, Z., and Chen, Q.: Raman scattering study on anatase TiO2 nanocrystals, J. Phys. D, 33, 912–916, 2000.