the Creative Commons Attribution 4.0 License.
the Creative Commons Attribution 4.0 License.
 | 13 Apr 2021
OH point defects in quartz – a review
Roland Stalder
Research results of the past 6 decades on the incorporation of OH point defects in quartz are summarised and evaluated in terms of their application to natural samples and processes, and a link between experimental petrology, natural archives, and model calculations is made. A strong focus is put on recent studies on quartz as a rock-forming mineral, as a geochemical and/or petrological tracer, and as a tool for provenance analysis in sediments and sedimentary rocks.
The most relevant defects for natural specimens are generated by coupled substitution involving mono- and trivalent cations, the most prominent being Li+, Al3+, and B3+. OH incorporation is rather a function of the availability of trace metals and water than of pressure and temperature, though temperature indirectly influences the incorporation by the solubility of trace metals in the fluid. Pressure has a negative influence on the formation of OH defects, so the most pure quartzes are probably formed in the deep crust close to the quartz/coesite transition.
Natural quartz grains from the Earth's crust have on average 10 wt ppm (weight parts per million) water (5 wt ppm median), but grains with OH defect contents corresponding to up 250 wt ppm water have been discovered in sedimentary archives, matching the concentration of quartz from high-pressure experiments <4 kbar under water-saturated conditions in granitic systems. A rough division into three classes is suggested: (1) grains with pristine igneous and/or hydrothermal origin, (2) mildly thermally annealed grains, and (3) strongly dehydrated grains. While samples derived from the currently exposed Scandinavian Shield are dominated by the third class, considerable contributions of the first two classes are found in the younger rock systems in Central Europe. OH defect contents may be used to estimate mixing ratios for sediments with different sources, provided that a sufficiently large data set exists and that the different sources can be clearly distinguished by their OH inventory. Furthermore, metamorphic overprint leads to a higher degree of equilibration of OH defects between individual grains and may thus be used as a geothermometer. Finally, OH defect retention in quartz allows for estimating timescales of volcanic processes.
- Article
(3409 KB) - Full-text XML
- BibTeX
- EndNote


Quartz is formed under nearly all conditions realised within the Earth's crust, ranging from the Earth's surface down to the base of the continents. Depending on crystallisation-relevant physical and chemical parameters (pressure, stress, temperature, temperature gradients, time, presence and composition of melts and fluids) and geological circumstances (cracks and voids in the surrounding rock), the resulting habit and size of quartz crystals is very diverse, ranging from microcrystalline fibrous chalcedony to decimetre- and metre-sized euhedral crystals. Although both crystal size extremes are not representative of the main portion of quartz as a rock-forming mineral (12 vol % of the Earth's crust; Ronov and Yaroshevski, 1969), they are very prominent in our mind and important to human history because they were used since prehistoric times as precious stones (such as agate, amethyst, and rock crystal) or for tools and weapons (such as flint and rock crystal). Owing to the high appeal to the human eye and the technical applicability in modern times (Jung, 1992a, b), it is understandable that the first systematic studies on “water” in quartz were performed on large hydrothermal (natural or synthetic) crystals. The major portion of quartz, however, forms as millimetre-sized, often anhedral crystals in igneous systems (50 % of the Earth's continental crust consists of felsic igneous rocks (Wedepohl, 1995) that in turn consist of >20 % quartz). Furthermore, as a hard and chemically resistant mineral, quartz survives weathering and transport and comprises a significant fraction in siliciclastic sediments, sedimentary rocks, and their metamorphic counterparts.
This review summarises early findings on “water” in quartz and its influence on physical properties, followed by a review of theoretical and experimental considerations on OH point defects, and finally reports recent data on OH point defects in common quartz as a rock-forming mineral from igneous rocks, metamorphic rocks, and sedimentary archives. As will be outlined in this study, molecular water follows different incorporation laws than OH point defects, and, consequently, the wealth of studies on fluid inclusions in quartz, as well as on OH species (molecular water and OH point defects) in microcrystalline and/or amorphous silica such as opal and chalcedony (Langer and Flörke, 1974; Frondel, 1982; Adams et al., 1991; Chauviré et al., 2017) and moganite (Flörke et al., 1984; Heaney and Post, 1992; Hardgrove and Rogers, 2013), are not considered in this review.
The existence of a significantly polarised absorption band at 3400 cm−1 with a more pronounced absorption for than has been known since the end of the 19th century (Merritt, 1895) but was not linked to a specific impurity until several decades later. In the first half of the 20th century quartz became more and more interesting for the upcoming electronic industries (e.g. chronometry and radio engineering), and research on physical properties and chemical impurities of (preferentially large) natural and synthetic quartz crystals was promoted. The analysis of “water” in quartz reached its first prime in the early 1960s (Bambauer, 1961; Brunner et al., 1961; Kats, 1962; Bambauer et al., 1962, 1963), focussed on detailed investigations on the spatial distribution of chemical impurities, hydrogen mobility, charge balance, and assignment of infrared (IR) absorption bands to specific OH defects in natural hydrothermal quartzes. Although a distinction between different species such as molecular water and OH point defects (protons that are charge balanced by metal impurities or vacancies) was made, both species were often subsumed as water. The research on water in quartz was further fuelled by the discovery of hydrolytic weakening (Carter et al., 1964; Griggs and Blacic, 1965; Griggs et al., 1966) and its importance for structural geology. In the following decades research on OH in quartz experienced several flares accompanying technical improvements of microanalysis, such as secondary ion mass spectrometry (Rovetta et al., 1989), transmission electron microscopy (Gerretsen et al., 1989; Cordier and Doukhan, 1991), and calculation capacities (Purton et al., 1992; McConnell et al., 1995; Rosa et al., 2005). Predominant study objects during these periods still were large hydrothermal (natural and synthetic) single crystals. It was not until the early 21st century that common quartz – representing the main portion of quartz as a rock forming mineral – came into focus, and systematic studies on metamorphic (Müller and Koch-Müller, 2009), sedimentary (Stalder and Neuser, 2013; Stalder, 2014; Stalder et al., 2017, 2019; Jaeger et al., 2019), volcanic (Biró et al., 2016, 2017), and plutonic (Müller et al., 2009; Stalder et al., 2017; Potrafke et al., 2020) quartz grains were performed.
Impurities in quartz can be incorporated by a plethora of cation exchanges, either by the simple exchange of Si4+ by other tetravalent cations such as Ti4+ or Ge4+ or by coupled substitutions involving monovalent cations such as alkalis or protons. Within the scope of this work, defects involving protons are called “hydrous defects”, and those without protons are called “dry defects”.
Even before quartz was systematically investigated for impurities and chemical zoning, it was known that β-eucryptite (LiAlSiO4) is isostructural to high quartz (Winkler, 1948; Cohen, 1960; London, 1984) and that a metastable solid solution series exists in the system SiO2 – LiAlO2 (Roy and Osborn, 1949), indicating the possibility of a “dry” AlLi defect through the exchange SiAlLi+. Consequently, the first charge balance equations involving incorporation of defect protons into the quartz structure considered Al3+ and alkali cations as the most relevant impurities (Bambauer, 1961; Kats, 1962, Chakraborty and Lehmann, 1976a). Other tri- and pentavalent cations were subsequently added to the equation, suggesting a charge balance equation,
for natural samples (Müller and Koch-Müller, 2009) that later was confirmed for experimentally grown quartz crystals from natural starting material (Baron et al., 2015; Potrafke et al., 2019, 2020), while a modified equation for small Li contents and crystallisation at moderate pressure (<10 kbar) was proposed [Al,B,Li]=[H,Na,K,P], taking into account a neutral LiOH species (Frigo et al., 2016).
Large hydrothermal quartz crystals are very heterogeneous with respect to OH (Kats, 1962), and the highest concentrations are often found in the centre of the crystal (Chakraborty and Lehmann, 1976a). A similar systematic zoning from core to rim was observed for metal impurities such as Al3+ (Müller et al., 2003; Miyoshi et al., 2005), suggesting that metal impurities are linked to OH defects and that the impurity incorporation is controlled by the fluid chemistry and growth rate. Strong chemical zoning was recently also discovered within individual phenocrysts from the Mesa Falls Tuff pyroclastic succession (Tollan et al., 2019) and from Bishop Tuff (Jollands et al., 2020b), where a decrease in OH from core to rim mirrored a strong zoning for Al and the formation of a “dry” LiAl defect at the outermost rim by the exchange of H by Li.
As a chemical component, water in quartz is hosted in at least two totally different ways: (1) molecular water such as fluid inclusions and (2) OH point defects, in which protons are charge balanced by vacancies or metal impurities. Further hosts of water are micro inclusions of melts and hydrous minerals such as mica (Stalder and Neuser, 2013; Kronenberg et al., 2017), as well as amorphous gel-like material (Brunner et al., 1961). The different OH species were identified and characterised by a number of different strategies, such as freezing behaviour, D/H exchange, and absorption features in the IR region. Amorphous gel-like material, for example, causes a rather broad, isotropic absorption band at 3400 or 3500 cm−1 and leads to the formation of molecular water upon heat treatment () that gives the crystal a milky appearance (Bambauer et al., 1969). It further does not show evidence for exchange (Brunner et al., 1961) and probably is formed during low temperature processes. Such absorption bands are typical for precious varieties of quartz such as amethyst, citrin, and rock crystal (Chakraborty and Lehmann, 1976b).
It has already been repeatedly mentioned since the first studies that molecular water (mostly as fluid inclusions) is the dominant OH species in quartz (Bambauer, 1961; Aines et al., 1984; Gerretsen et al., 1989; Cordier and Doukhan, 1991; Müller and Koch-Müller, 2009; Kronenberg et al., 2017) and that these fluid inclusions in turn are strongly enriched in alkalis (Bambauer, 1961; Müller et al., 2003). Some of the molecular water is hosted in nano-inclusions (Gerretsen et al., 1989; Cordier and Doukhan, 1991) that are often too small to build ice upon freezing (Aines and Rossman, 1984; Müller and Koch-Müller, 2009). Furthermore, no correlation could be found between the amount of molecular water incorporation and OH point defects (Aines et al., 1984; Biró et al., 2016), which implies that the amount of molecular water in quartz is not a diagnostic for the formation conditions and thermal history of an individual grain. While point defect formation is controlled by thermochemical parameters (Paterson, 1986), the amount of fluid inclusions is often heterogeneously distributed even within one individual and otherwise chemically homogeneous grain. Fluid inclusions are often concentrated along healed cracks and were taken up under deformation, which in early studies led to estimates of water solubility that are too high (Gerretsen et al., 1989). Therefore, the present article will be focused on OH point defects, and molecular water will not be discussed in detail.
Proton incorporation as OH defects leads to the formation of characteristic OH dipoles that can be detected and distinguished depending on the charge compensation by their absorption frequency in the IR range of electromagnetic radiation. Since oxygen is the only charge-balancing anion in the crystal, the relevant geochemical component in mineralogical and petrological literature is often expressed as a neutral water component. Therefore, throughout this article OH contents are expressed as weight parts per million (wt ppm) water (identical to H2O), in which 0.01 wt % water corresponds to 100 ppm water, 11.1 () ppm H, or 667 () H/106Si.
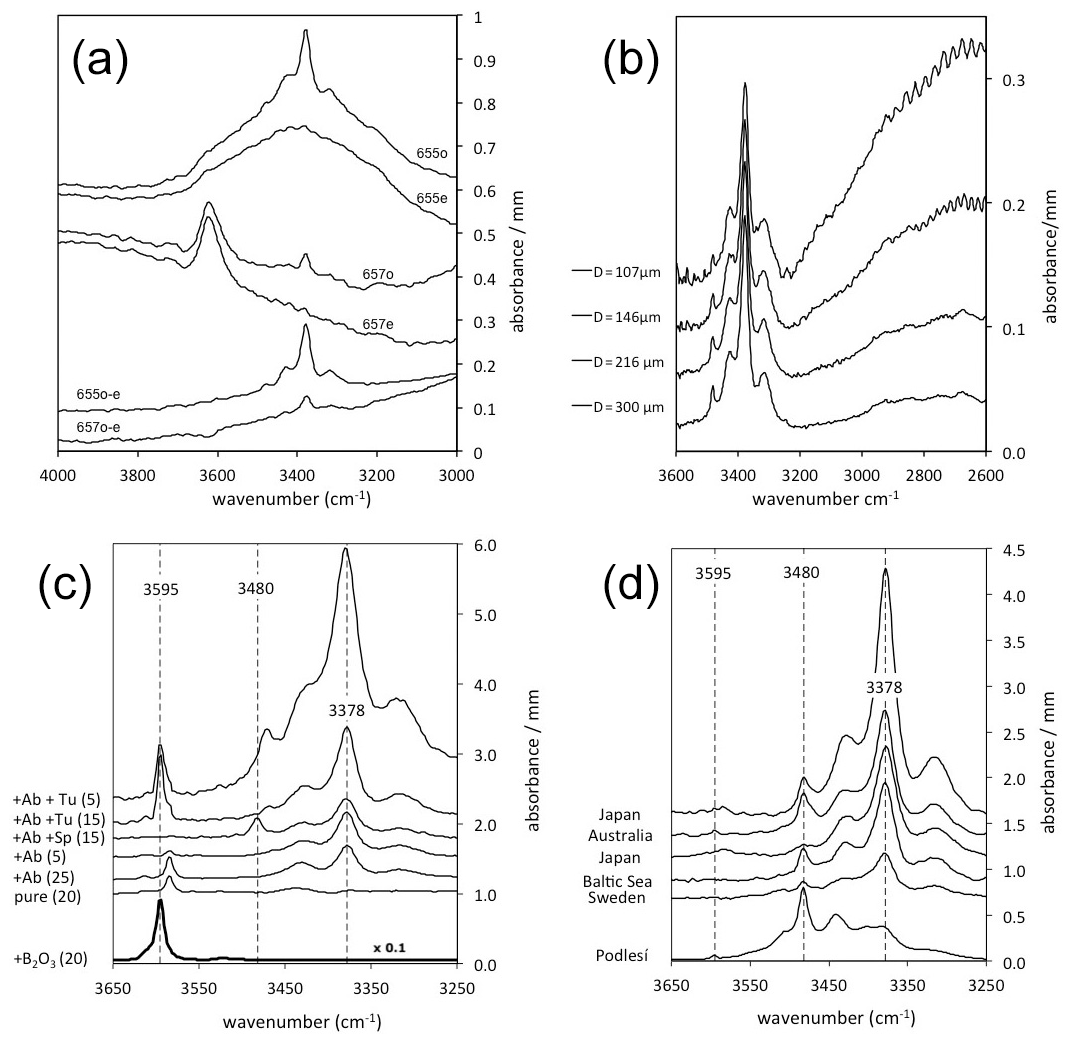
Figure 1IR spectra of quartz normalised to 1 mm thickness. Spectra are offset for graphical reasons. (a) Polarised ( and ) spectra of quartz grains (#655 and #657) from granites from Vånga, Sweden (Stalder et al., 2017), showing strong absorptions for molecular water around 3400 cm−1 (#655) and mica inclusions around 3620 cm−1 (#657). By subtraction of both spectra () the isotropic signal is erased, and the absorption feature for the OH defects (655o–e and 657o–e) is extracted. This procedure was followed in all other spectra in (b)–(d). (b) Quartz grain from a granite from Vånga, Sweden (Stalder et al., 2017). The grain was repeatedly thinned out and re-measured. (c) Quartz crystals grown in high-pressure experiments from Stalder and Konzett (2012), Baron et al. (2015), Frigo et al. (2016), and unpublished results. Added phases to the starting material are Ab (albite), Sp (spodumene), and Tu (tourmaline), and numbers in parentheses indicate the pressure in kilobars (kbar). Impurity-specific absorption bands (at 3378, 3480, and 3595 cm−1) are indicated by broken lines. Note that the sample from the B2O3 doped run was further minimised by a factor of 10 for graphical reasons. (d) OH-rich natural quartz crystal from a pegmatitic quartz (Podlesí, Czech Republic; Breiter et al., 2005) compared to crystals from sedimentary archives reported in Jaeger et al. (2019) for Japan, Stalder (2014) for Australia and Sweden, and Stalder et al. (2017) for the Baltic Sea. Impurity-specific absorption bands (at 3378, 3480, and 3595 cm−1) are indicated by broken lines. The LiOH band (3480 cm−1) is typically dominant in the pegmatitic sample but poorly preserved in the sedimentary grains.
Although several different instrumental methods to measure OH in nominally anhydrous minerals has been established, the by far most used technique to analyse OH in quartz is IR spectroscopy that detects absorption of IR radiation due to vibrations in the respective material. Different structural environments differ in their bond strength, length, and orientation and thus have different vibration properties. Based on the absorption band characteristics such as vibration frequency, anisotropy, and band sharpness (Fig. 1a), IR spectroscopy is able to distinguish between different OH species, such as (1) molecular water, (2) nominally OH-bearing minerals, and (3) several specific OH point defects. Since the absorbance is linearly correlated to the concentration (Eq. 2), the sensitivity depends on the sample thickness, and for 200 µm thick sections of crystals a detection limits down to the parts per million (ppm) level can be reached. For thicker samples even lower concentrations can be detected. Analysis can now be performed on surfaces below 0.001 mm2 (compared to 10 mm2 in early studies such as Brunner et al., 1961), enabling the possibility to reveal micrometre-sized colourless inclusions (Stalder and Neuser, 2013) and complex internal zonings (Potrafke et al., 2020). In order to turn IR absorptions into concentrations, OH contents have to be determined by an independent method on reference material, and in the past 6 decades different methods were used, such as (1) H-alkali exchange via electrolysis (Brunner et al., 1961), (2) secondary ion mass spectrometry (Rovetta et al., 1989; Thomas et al., 2009), (3) proton–proton-scattering (Thomas et al., 2009), and (4) the theoretical calculation of extinction coefficients (Balan et al., 2008; Jollands et al., 2020a). The formulations deviate from each other with respect to the measurement protocol (unpolarised versus polarised) and in terms of the resulting units (concentrations expressed as wt ppm water or H/106Si), and thus different integral extinction coefficients ε (Eq. 2) were obtained, which finally all lead to the similar results: the mineral-specific calibration of Thomas et al. (2009) determined a value for the extinction coefficient as L mol−1 cm−2, which is in excellent agreement with of Libowitzky and Rossman (1997) that would receive the same value for ε for a wavenumber ν=3390 cm−1. As the main absorption band of OH in quartz is exactly in this region for most quartz specimens, both calibrations obtain nearly identical results. Only in a few cases in which high-wavenumber bands are over-represented (Stalder and Konzett, 2012) does the wavenumber-dependent calibration lead to systematically higher OH concentrations. Considering that OH dipoles are nearly totally polarised (perpendicular to the c axis) and using the Lambert–Beer equation,
with the concentration c, the extinction coefficient ε, and the thickness normalised absorbance , Thomas et al. (2009) would receive for one polarised measurement the relation
with the molar mass of water M=18 g mol−1, the density of quartz D=2.65 g cm−3, and the thickness t in centimetres. The factor 2 represents the twofold contributions of no (out of the three directions in space), and the factor 1000 is obtained from the conversion of litres to cubic centimetres (cm3). The obtained value is equivalent to
while Aines et al. (1984) receive only very slightly higher values:
Taking into account the different measurement protocols and different units, the extinction coefficients of ε=14 000 cm mol−1 used by Brunner et al. (1961), Bambauer (1961), and Chakraborty and Lehmann (1976a) would be recalculated to the sixfold value ε=84 000 L mol−1 cm−2, which is in excellent agreement with the other calibrations. The mineral-specific calibration of Rovetta et al. (1989) leads to 30 % higher OH contents. There is an ongoing debate whether a mineral- or wavenumber-specific calibration is more reliable. On the one hand, a pronounced dependence of the extinction coefficient on the wavenumber for OH dipoles in quartz was theoretically predicted by density functional theory (DFT) calculations (Balan et al., 2008; Jollands et al., 2020a), and a nearly linear correlation has been observed for OH dipoles in hydrous minerals (Libowitzky and Rossman, 1997). On the other hand, a less pronounced dependence was observed for different OH absorption bands in quartz in the calibration of Thomas et al. (2009), and finally, one mineral-specific extinction coefficient of 89 000 L mol−1 cm−2 was proposed. While the theoretically calculated extinction coefficients (Balan et al., 2008; Jollands et al., 2020a) are significantly higher than suggested by the analytical calibrations and would lead to lower OH concentrations by up to a factor a 2, the general wavenumber-specific (and not quartz-specific) calibration of Libowitzky and Rossman (1997) leads nearly to identical OH contents for most samples compared to the mineral-specific calibrations of Brunner et al. (1961) and Thomas et al. (2009). Since all calibrations finally obtain very similar OH contents, no a posteriori corrections concerning the originally published values were made in the data compilation (Table 1) of published OH contents in quartz. A more complicating factor for the comparison of published data from different references is the circumstance that some studies did not make a distinction between molecular water and OH from point defects, leading to higher OH for some samples, especially those in which molecular water was an important species. Since molecular water gives rise to broad isotropic absorption bands and hydrous defects are nearly perfectly polarised (Brunner et al., 1961), a distinction between both fundamentally different groups of species was made early by only taking into account the sharp polarised absorption bands (Bambauer et al., 1962) or by the separate quantification of point defects and molecular water (Müller and Koch-Müller, 2009; Biró et al., 2016). Another strategy to overcome the contribution of non-defect OH (actually originally proposed by Brunner et al., 1961) is a revised protocol for the treatment of IR absorption spectra (Stalder and Konzett, 2012), in which all measurements are performed on oriented sections for both crystallographic directions ( and ) on the same spot. Subtraction of both spectra () eliminates the isotropic contributions of molecular water, hydrous melts, and randomly oriented mica inclusions (Fig. 1a). For the BOH defect that exhibits one third of its absorbance , the proposed protocol was later refined (Stalder and Neuser, 2013; Baron et al., 2015). This strategy is in general in accordance with many previous studies, in which all measurements were performed (Bambauer, 1961) and/or only the contribution was used for OH quantification (Brunner et al., 1961; Aines et al., 1984). Besides the OH absorption bands, IR spectroscopy also reveals information on the orientation and thickness of a sample by using lattice overtones (Biró et al., 2016; Stalder et al., 2017; Jollands et al., 2020b) and offers an independent alternative to mechanical measurements of the sample thickness that is needed to calculate concentrations from the measured absorbance (Eq. 2).
Table 1OH defects in natural quartz samples.
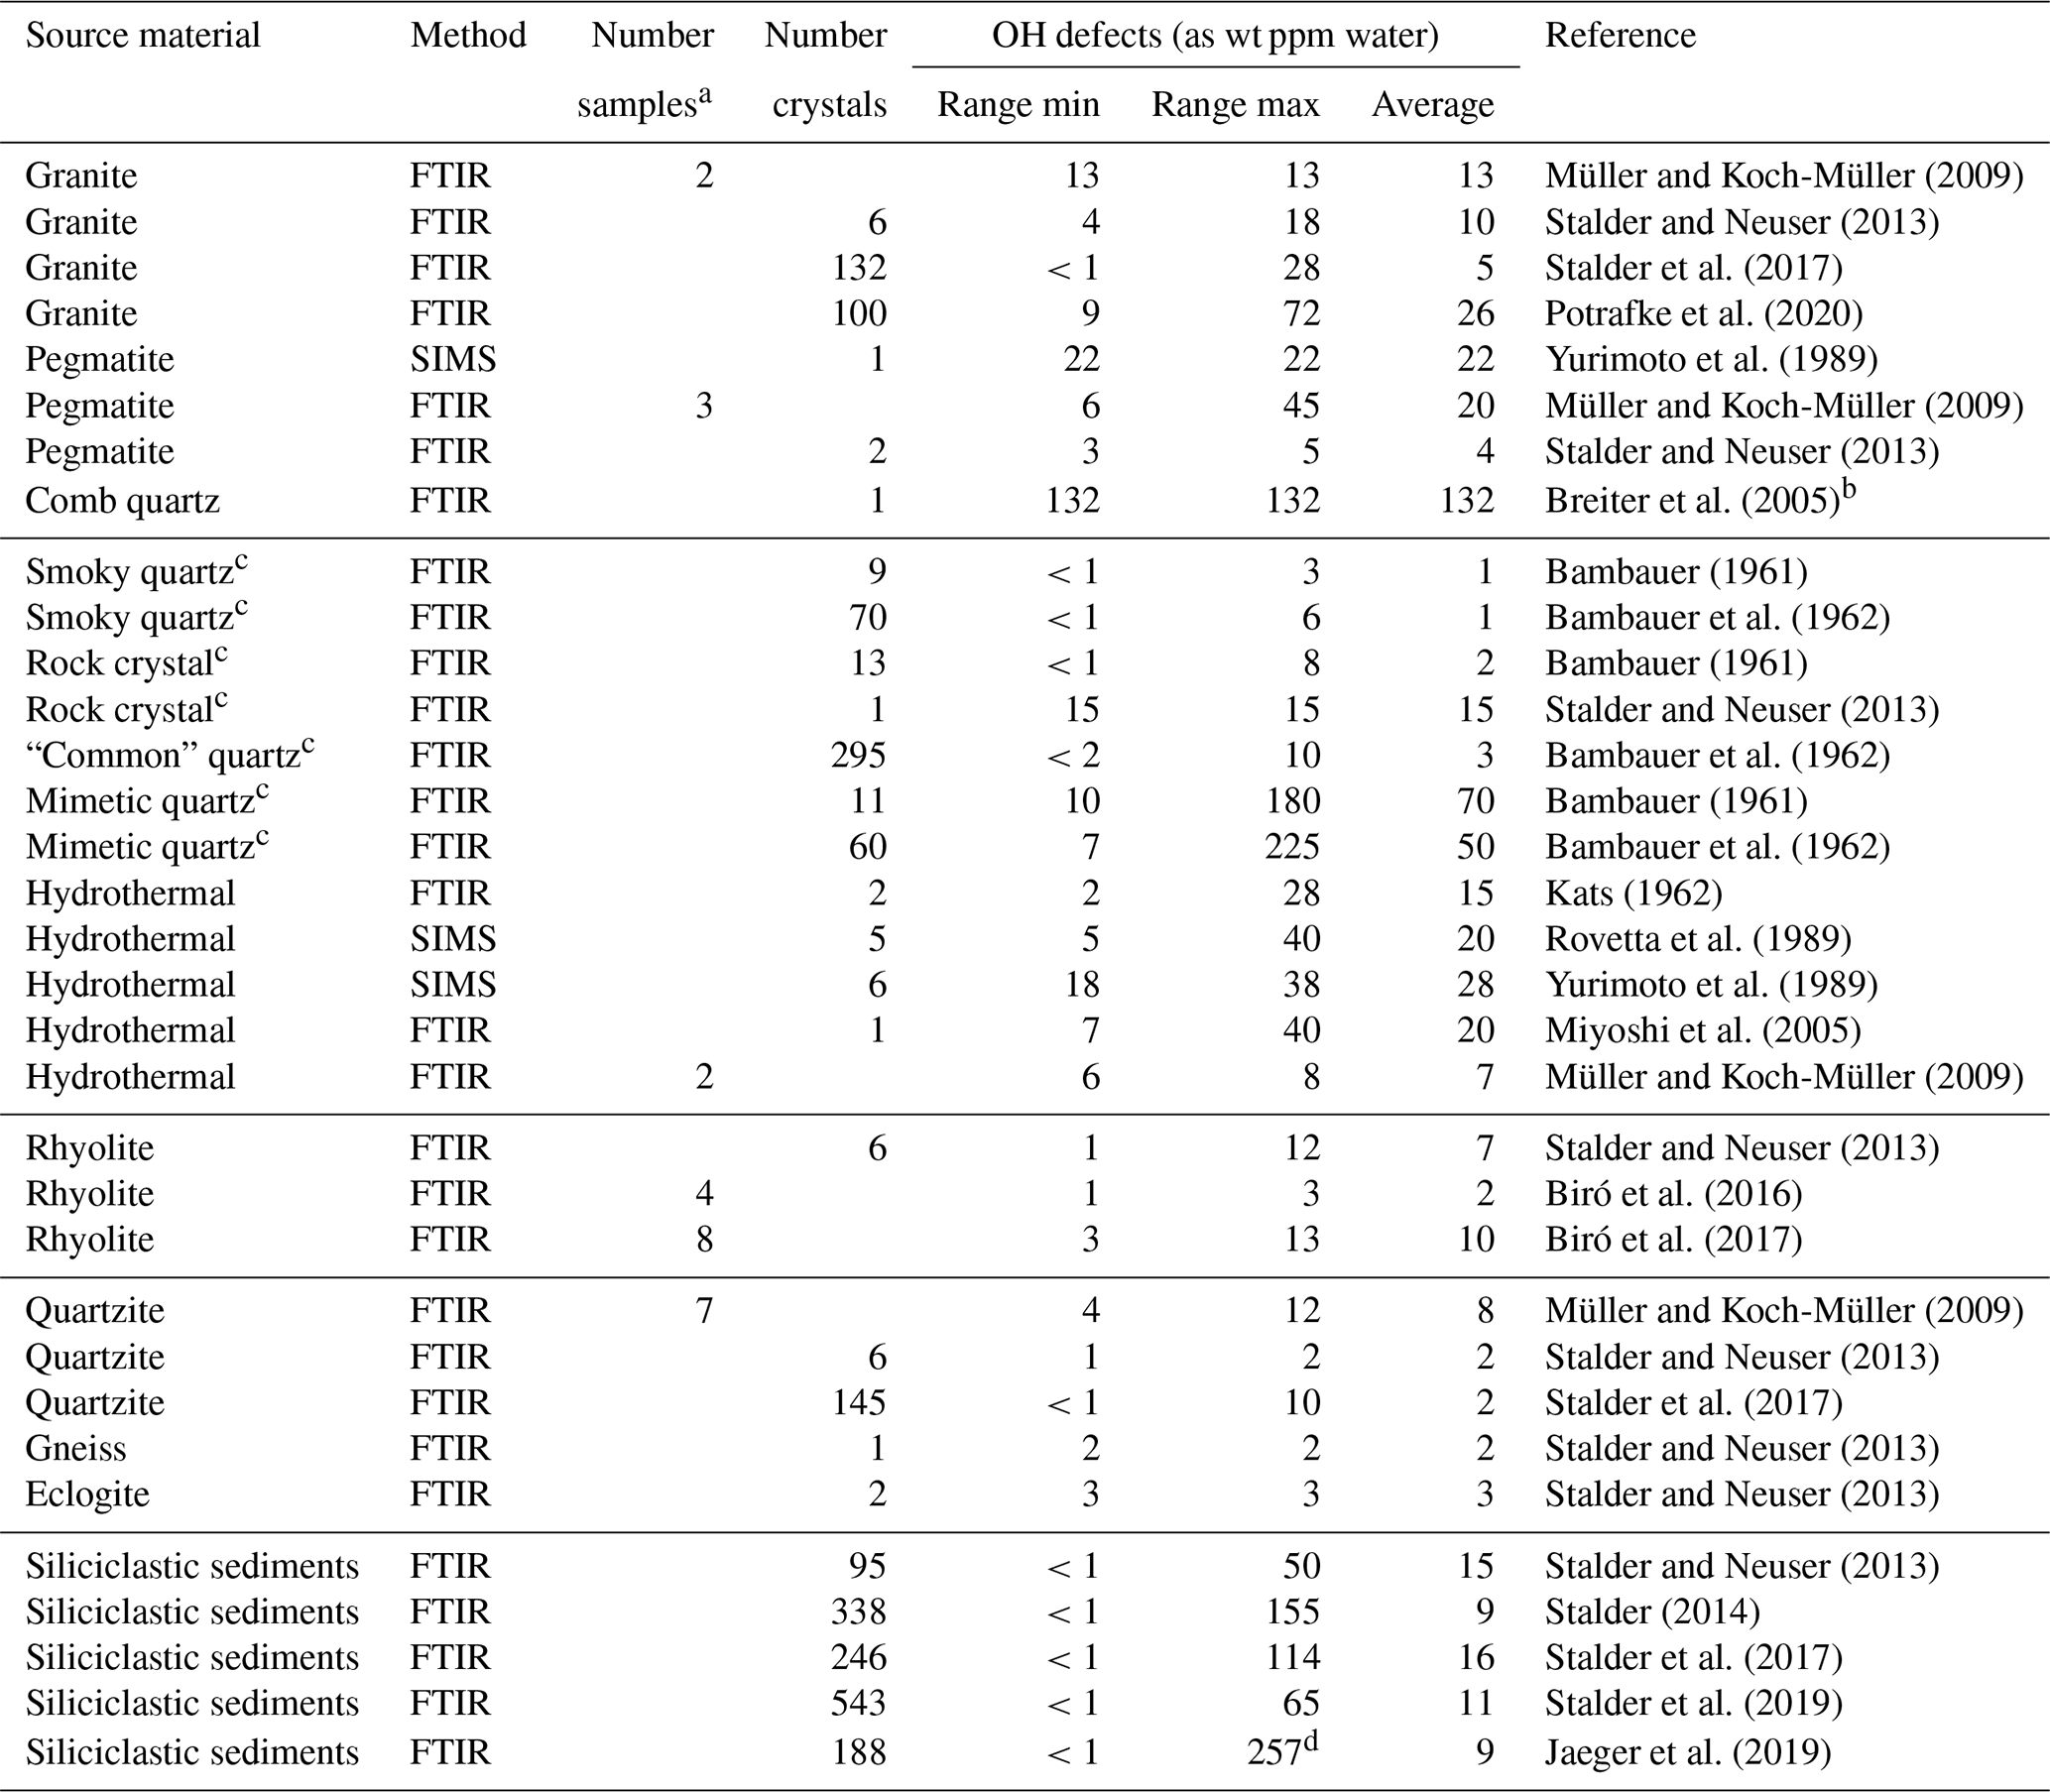
FTIR signifies Fourier transform infrared spectroscopy, and SIMS signifies secondary ion mass spectrometry. a Averaged value of several unpolarised measurements on unoriented crystals; b OH content determined in this study; c formed under hydrothermal conditions;
d value higher than initially reported (211 ppm) after re-examination.
Several dozens of OH absorption bands in quartz have been reported in the literature (for a summary see Aines and Rossman, 1984) and linked to specific defect species based on chemical correlations, thermal stability, exchange experiments, and spectral characteristics such as sharpness and polarisation. It is understandable that reported band positions deviate from each other by some wavenumbers due to different spectrometer calibrations and different temperatures during analysis (e.g. room and liquid nitrogen temperature). A particular example of a band shift is reported for the most prominent AlOH band at 3378 cm−1, which is shifted to 3395 cm−1 at 550 ∘C and drops to 3386 cm−1 at the transition of quartz at 573 ∘C (Suzuki and Nakashima, 1999). During cooling from room temperature to liquid nitrogen temperature, the AlOH band is shifted by 15–20 cm−1 towards lower wavenumbers, while the LiOH band at 3470 cm−1 (at room temperature) is only shifted by 10 cm−1 (Brunner et al., 1961; Suzuki and Nakashima, 1999). Therefore, wavenumbers given below may deviate slightly from the values reported in the original publications.
Apart from the aforementioned broad and isotropic absorption feature for molecular water, the most important OH absorption bands are strongly polarised and have been assigned to specific metal impurities. The by far most important metal impurity is Al3+, followed by Li+ and B3+.
6.1 AlOH band
The most prominent absorption band occurs at 3378 cm−1 and is accompanied by two side bands at 3310 and 3440 cm−1 (Fig. 1). This band is rather sharp and strongly polarised (Kats, 1962), is the most stable band against thermal treatment (Brunner et al., 1961; Bambauer et al., 1963; Aines and Rossman, 1984), and exhibits the slowest diffusion rates. Based on exchange experiments this band has unequivocally been identified as the OH absorption band (Kats, 1962), and due to chemical correlations to the Al content of the sample, this triplet was assigned as the AlOH defect (Bambauer, 1961; Brown and Kahan, 1975; Aines and Rossman, 1984) that results from the coupled substitution . The AlOH defect was also characterised by electron paramagnetic resonance (Halliburton et al., 1981; Nuttall and Weil, 1981), and the band assignment has in general been confirmed by DFT calculations (Jollands et al., 2020a).
6.2 LiOH band
The second most pronounced sharp absorption band in most hydrothermal quartz specimens is detected at 3470–3480 cm−1 (Fig. 1). Like AlOH it was identified as the OH band by exchange experiments, and it is strongly polarised (Kats, 1962) and accompanied by several side bands between 3400 and 3520 cm−1 (Brunner et al., 1961; Kats, 1962; Aines and Rossman, 1984). Based on chemical correlations it was assigned as the Li-specific defect and is commonly referred to as LiOH (Kats, 1962; Bambauer et al., 1963; Aines and Rossman, 1984). Its incorporation into the crystal lattice was proposed as an interstitial molecule (Kats, 1962; Bambauer et al., 1963), as the Li-perturbed AlOH band (Kats, 1962), or (equivalently) as the proximity of an AlOH to a dry AlLi defect (Miyoshi et al., 2005) that also contributes to the high-energy band of the AlOH triplet at 3440 cm−1. The formation of dry defects, in which Li+ concurs with H+, is supported by the general charge balance equation (Eq. 1) (Bambauer, 1961; Müller and Koch-Müller, 2009) and has recently been documented in quartz phenocrysts interacting with its degassing host magma (Tollan et al., 2019). Upon thermal (or hydrothermal) treatment the LiOH bands decrease irreversibly while AlOH increases (Brunner et al., 1961; Rovetta et al., 1986; Kronenberg et al., 1986; Suzuki and Nakashima, 1999; Stalder et al., 2017), suggesting that the LiOH environment is destroyed, while the OH is retained in the crystal. As a consequence of the low thermal stability of LiOH, these bands are much weaker (or even absent) in quartz from metamorphic origin (Müller and Koch-Müller, 2009). DFT calculations (Jollands et al., 2020a) corroborate the suggested band assignment.
6.3 BOH band
Another frequently observed absorption band occurs at 3595 cm−1 (Fig. 1c) and has been correlated to boron impurities in the crystal lattice forming by the coupled substitution (Staats and Kopp, 1974; Müller and Koch-Müller, 2009). Its pleochroic behaviour is different from all other impurity-related OH vibrations, with contributing only two thirds of the total absorbance and contributing one third (Thomas et al., 2009; Stalder, 2014; Baron et al., 2015). Furthermore, it is thermally stable up to 600 ∘C (Niimi et al., 1999), and consequently, BOH has a better chance than LiOH to survive metamorphic overprint. Finally, this band is sharper in natural than in synthetic amethyst and has been used as discrimination tool (Karampelas et al., 2005). The band assignment has been confirmed by DFT calculations (Jollands et al., 2020a).
6.4 Intrinsic band
A further absorption band occurs at 3585 cm−1; this band is not relevant for average natural quartz (Stalder, 2014) but frequently observed in synthetic quartz (Chakraborty and Lehmann, 1976a) and natural amethyst (Chakraborty and Lehmann, 1976b; Aines and Rossman, 1984; Karampelas et al., 2005). Due to its occurrence in pure synthetic quartz and its missing correlation to metal impurities leading to an excess OH in the charge balance equation (Eq. 1), it is widely accepted as an intrinsic defect (Paterson, 1986; Rovetta, 1989; Rovetta et al., 1989; Stalder and Konzett, 2012). There has been some debate concerning its possible or probable assignment as a hydrogarnet [4H]Si defect (Paterson, 1986; Stalder and Konzett, 2012). On the one hand, the theoretically predicted existence of a concentration maximum of [4H]Si (around a pressure of 10–15 kbar; Paterson, 1986) has experimentally been reproduced (though at 20–25 kbar; Stalder and Konzett, 2012), and on the other hand, recent DFT calculations suggest that a hydrogarnet defect should lead to four different OH stretching bands. The preferred explanation for the 3585 cm−1 band from these calculations are isolated OH− groups with non-local charge compensation (Jollands et al., 2020a).
6.5 Further bands
A further weak and only occasionally visible band occurs at 3614 cm−1 (Stalder and Konzett, 2012, and unpublished results), potentially related to the 3585 cm−1 band. This band is only visible at very high intrinsic defect concentrations and may additionally be blurred by mica inclusions that exhibit strong absorptions around 3620 cm−1 (Stalder and Neuser, 2013).
In some studies a very weak absorption band was detected at 4500 cm−1 (Brunner et al., 1961; Cordier and Doukhan, 1991) and later was assigned as hydrogarnet (Cordier et al., 1994). Upon thermal treatment it is replaced by an absorption band at 5200 cm−1 (Brunner et al., 1961), which was interpreted as a combination band of molecular water (Cordier and Doukhan, 1991).
Several suggestions for the assignment of a further absorption feature at around 3200 cm−1 have been put forward. Possibly, this band is generated by molecular surface water or Si-O overtones (Biró et al., 2016), and hence it was often ignored for OH quantification in recent studies. Absorption features for the anisotropic contribution () below 3250 cm−1 have, however, to be regarded with caution because their thickness-normalised absorbance changes with thickness (Fig. 1b), which can be explained neither by Si-O overtones (which should stay constant when normalised to thickness), nor by molecular surface water (which should be isotropic).
Several attempts have been made to model OH defect species based on thermodynamics (Doukhan and Trépied, 1985; Paterson, 1986; Rovetta, 1989) and ab initio calculations (Purton et al., 1992; McConnell et al., 1995; Rosa et al., 2005; Jollands et al., 2020a). Until recently calculations were strongly focussed on the two concurring intrinsic defects: hydrogarnet defect [4H]Si and the so called Griggs defect according to the reaction Si-O-Si + H2O = 2 SiOH (Griggs et al., 1966). There is consent that [4H]Si concentrations are positively correlated with pressure up to 10 kbar (Doukhan and Trépied, 1985; Paterson, 1986) at oxygen fugacities above NNO-2. As to temperature, both negative (Doukhan and Trépied, 1985) and positive (Paterson, 1986) correlations were predicted. Assuming a [4H]Si formation by the reaction of the dissociated species (Paterson, 1986),
where H4O2 (crystal) represents the [4H]Si defect. It was predicted that [4H]Si concentrations drop to nearly zero below oxygen fugacities of NNO-6 (Paterson, 1986). Similarly, thermodynamic models for the Griggs-type SiOH defect calculated for pressure conditions at 15 kbar suggest increasing concentrations with decreasing oxygen fugacity and a positive correlation to temperature (Rovetta, 1989) and maximum OH concentrations corresponding to up to 300 wt ppm water. Ab initio calculations (using density functional theory, DFT) suggest that (i) [4H]Si is energetically the most favourable intrinsic defect species (Purton et al., 1992; McConnell et al., 1995; Rosa et al., 2005), which (ii) converts to molecular water during the development of dislocations (McConnell et al., 1995), and (iii) that the Griggs defect is unstable in unstrained quartz (Purton et al., 1992).
The incorporation of OH species influences the physical properties in different ways: (1) the high mobility of protons enhance the electrical conductivity by acting as charge carrier, and (2) protons modify the chemical bonds and thereby the mechanical properties of the silica network itself. The electrical conductivity depends on the concentration and mobility of mobile species and can be described by the Nernst–Einstein equation:
where σ is the bulk electrical conductivity, kB is the Boltzmann constant, T is the absolute temperature, and Di, ci, and zi are the diffusion coefficients, the concentration, and the charge, respectively, of the mobile species i. In quartz, the principle charge carriers are protons and thus crucial for long-term DC (direct current) conductivity (Kronenberg and Kirby, 1987). In order to calculate the electrical conductivity according to Eq. (4), the diffusivities of protons from different OH species (H not linked to Al, and H linked to Al) have to be known.
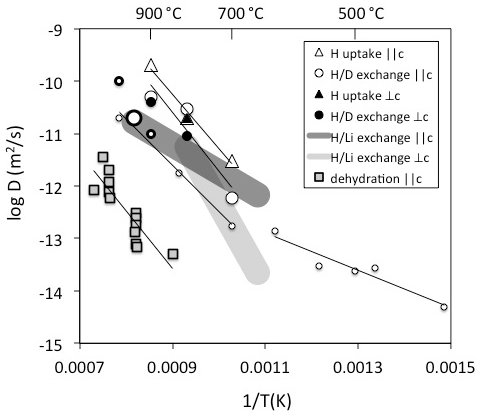
Figure 2Diffusivities of H determined on natural quartz crystals. Data are derived from Brunner et al. (1961) – open large thick circle, Kats (1962) – open small thin circles, Rovetta et al. (1986) – open small thick circle, Kronenberg et al. (1986) – open large thin circles and triangles and filled circles and triangle, Bachheimer (1998) – grey squares, Jollands et al. (2020b) – dark grey field, and Stalder (unpublished data) – light grey field. Method and diffusion direction are given in the legend.
A number of different strategies to determine H diffusivities have been followed, such as hydrogen uptake (Shaffer et al., 1974; Kronenberg et al., 1986), hydrogen extraction (Bachheimer, 1998), exchange (Brunner et al., 1961; Kats, 1962; Rovetta et al., 1986), and exchange (Jollands et al., 2020b). All methods represent different processes with different rate-limited steps. In addition, diffusion experiments were performed with different starting materials (although mostly with natural hydrothermal rock crystals with AlOH > LiOH). Consequently, they reflect different diffusion mechanisms, and the results spread by several log units at a given temperature (Fig. 2): the inter-diffusion coefficient is a good approximation for the self-diffusion of H; in contrast, H uptake or extraction can be rate-limited by other diffusivities depending on the charge balance it is based on and may in fact be slower by orders of magnitude. The hitherto reported exchange experiments above 700 ∘C all fall into a narrow range (Fig. 2) and exhibit a rather high activation energy around 200 kJ/mol. Experiments at lower temperatures reveal a marked drop in the activation energy to approximately 70 kJ/mol (Kats, 1962). This remarkable change has been interpreted as the transition between two regimes, in which the diffusing species is dominated by H not linked to Al at low temperatures in contrast to the results at high temperatures, in which H is predominantly linked to Al (Kronenberg and Kirby, 1987). H uptake experiments by Kronenberg et al. (1986) show a similar diffusion law as exchange until the charge neutrality [Al] = [H] is reached, which suggests that the diffusion probably relies on a similar mechanism to exchange. IR spectra revealed a defect ratio AlOH > LiOH at the beginning of the experiment, and AlOH >> LiOH (with nearly no LiOH) at the end of the experiments. This finding insinuates that to some extent exchange (and H exchange with other alkalis) occurred, but the majority of the protons incorporated during the experiment has to combine with the existing Al defects (a dry defect, in which Al is on a tetrahedral position and exhibits a local charge deficit) to an AlOH defect. It is furthermore noteworthy that initial samples used for H extraction (Bachheimer, 1998) reveal IR absorption spectra that are similar to the hydrated sample of Kronenberg et al. (1986), but H extraction still does not seem to follow the reverse process of H uptake. Some of the differences between these two studies may partly be explained by missing exchange options by alkalis in the extraction experiments. Interestingly, the activation energies are similar, but diffusivities for H extraction are shifted towards lower values by 3 log units (compare H uptake and dehydration in Fig. 2). For crystals without other defects than those that follow the charge neutrality [Al] = [H], a lower diffusivity for H extraction than from self-diffusion is expected since another – negatively charged – species is involved. A possible candidate for this negatively charged species is oxygen, which is several orders of magnitude slower. Other explanations for the discrepancies between H uptake and dehydration are the redox behaviour of trace amounts of Fe (not reported in these studies) or pre-existing other defects.
For the exchange process in quartz a lower activation energy of 100 kJ/mol was recently determined (Jollands et al., 2020b), which is rather similar to the low temperature exchange data of Kats (1962) and in accordance with the interpretation that the diffusing H species is not linked to Al (Kronenberg and Kirby, 1987). exchange is influenced by the Li mobility. Estimates for Li diffusion in quartz yield similar to slightly higher values than for H (Charlier et al., 2012). Considering the inter-diffusivity,
with D= diffusivity and X= mole fraction, the mismatch between the observed H mobility in exchange (Jollands et al., 2020b) and exchange experiments < 600 ∘C (Kats, 1962) by up to a factor of 3 (half a log unit) may be explained (Fig. 2). Taking into account that the samples from both studies differed strongly with respect to absolute H and Li content, diffusion can be considered concentration independent and DH and DLi very similar.
No significant dependence of H mobility on pressure (Kronenberg et al., 1986) and oxygen fugacity (Jollands et al., 2020b) was observed. Similarly, no pronounced anisotropy (difference between diffusivity and ⊥c) was found for H uptake and exchange (Kronenberg et al., 1986) and H extraction (Bachheimer, 1998); the effect for exchange was not quantified with regard to crystal orientation in these studies, but a slower diffusivity for diffusion ⊥c than was reported (Jollands et al., 2020b).
The presence of defect protons has an indirect impact on other physical properties. In this context it has been shown that the incorporation of protons enhance the diffusivity of O within the crystal lattice and thus indirectly influence the mechanical properties of quartz (Elphick and Graham, 1988). After the first observation of hydrolytic weakening of quartz (Griggs and Blacic, 1965; Griggs et al., 1966), the nature of the relevant OH species assumed to facilitate the deformation was extensively debated. The discussion primarily concentrated on intrinsic defects such as SiOH, while AlOH as a chemically very stable defect was not considered as a relevant species for hydrolytic weakening (Cordier and Doukhan, 1991). The initial model assumed that weakening was caused by the formation of Griggs-type defects by the following reaction (Griggs et al., 1966; Aines et al., 1984):
Later on it was suggested that actually hydrogarnet defects [4H]Si are the relevant species that help activating dislocations and thus facilitate hydrolytic weakening (Doukhan and Trépied, 1985; Cordier et al., 1994). Based on the observation of the precipitation of molecular water bubbles during the formation of dislocations (Cordier et al., 1988; Cordier and Doukhan, 1991), a conversion of hydrogarnet defects to molecular water during dislocation (according to Eq. 4) was suggested (McConnell et al., 1995). A transformation between different OH species was also observed during the thermal annealing of previously deformed quartz, in which recrystallised samples contained less molecular water due to the conversion into point defects (Niimi et al., 1999).
It has been shown early by hydrothermal annealing at 15 kbar and 900 ∘C (Mackwell and Paterson, 1985; Rovetta, 1989) that quartz is able to incorporate high amounts of OH (up to 150 wt ppm water) and, furthermore, that OH incorporation is enhanced at low oxygen fugacities (Rovetta, 1989). The interpretation of incorporation as point defects was soon challenged, and it has been argued that OH is mainly hosted in fluid inclusion (Gerretsen et al., 1989). Experimental research activities in the following years were focussed on the role of OH during deformation of quartz and studying OH in other nominally anhydrous minerals, and relevant data from experimental petrological studies on OH in quartz, which were applicable to granitic systems, were not published until the beginning of the past decade. By using a new analytical protocol (Stalder and Konzett, 2012), the isotropic contribution of molecular water (and species in melts and other amorphous material) could be erased from the IR absorption spectrum, and the contribution from OH point defects could be determined even in sub-millimetres, inclusion-rich crystals from high-pressure experiments.
Synthesis experiments in simple systems allow for the assignment of OH bands to metal impurities by investigating pure systems and systems doped with the respective metal ions. This allowed us to verify the nature of intrinsic defects (in the following referred to as hydrogarnet) and impurity-specific defects in particular, and the substantial influence of B on OH incorporation was shown (Fig. 1).
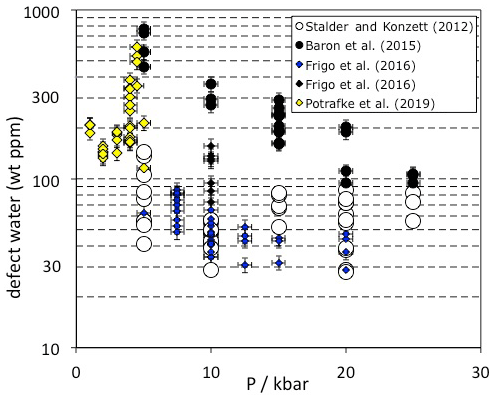
Figure 3Pressure dependence of OH incorporation in quartz. Data are from experimental studies in granitic and haplogranitic systems with final run temperatures between 800 and 900 ∘C. Each data point represents one measured oriented crystal. Experiments from Baron et al. (2015) were doped with tourmaline and Frigo et al. (2016) with spodumene (blue symbols) or tourmaline (black symbols).
Quartz from high-pressure experiments in granitic systems exhibit OH defect contents between 30 and 600 wt ppm water, depending on the pressure and composition of the system (Fig. 3). The influence of crystallisation temperature is not very well constrained because melt viscosities and the P-T circumstances in the phase diagrams for realistic scenarios set rather narrow limits for successful experiments which are expected to provide sufficiently large quartz crystals for further analysis. However, no clear temperature trend on OH incorporation was established in a haplogranitic system (Stalder and Konzett, 2012). Between 1 and 5 kbar, pressure seems to have a rather small systematic influence (Potrafke et al., 2019), except for a narrow region at 4 to 4.5 kbar close to the high/low quartz transition in which a sudden increase in OH and metal impurities was observed. Between 5 and 25 kbar, a negative pressure trend (Fig. 3) was observed in each studied system (Stalder and Konzett, 2012; Baron et al., 2015; Frigo et al., 2016), leading to the suggestion that the most pure quartz (inclusive of the charge-balancing metal ions) is formed at the quartz/coesite transition (Frigo et al., 2019). IR spectra recorded on quartz from high-pressure syntheses in granitic systems are usually dominated by the AlOH triplet (Fig. 1c). If the system is saturated with tourmaline (Baron et al., 2015) and/or Li (Frigo et al., 2016; Potrafke et al., 2019), specific BOH and LiOH are observed in addition. More detailed studies (Stalder and Konzett, 2012; Baron et al., 2015) observed a negative pressure trend for AlOH that may be explained by the unfavourable size of Al3+ in the tetrahedral site at high pressure (Potrafke et al., 2019). Furthermore, LiOH is strongly decreased with pressure especially around the high/low quartz transition (Frigo et al., 2016), while BOH does not show a clear pressure trend (Baron et al., 2015). These observed trends lead to the situation that at low pressure the linear absorbance of the LiOH band may nearly reach the absorbance of the AlOH main band (Potrafke et al., 2019), and at high pressure the BOH band may even exceed the linear absorbance of the main AlOH band in some cases (Baron et al., 2015). The hydrogarnet defect shows a positive pressure dependence, possibly culminating in a maximum at 20–25 kbar (Stalder and Konzett, 2012), but it never reaches the absorbance of the AlOH band in granitic systems.
In contrast to experimentally grown quartz from granitic systems (Baron et al., 2015; Frigo et al., 2016; Potrafke et al., 2019) in which high OH defect contents ranging between 30 wt ppm and 600 wt ppm water were observed (Fig. 3), natural quartz from granitic and hydrothermal systems show large variation and median values around 20 ppm water (Table 1). Average crustal quartz represented by siliciclastic sediments hosts only 10 wt ppm water as OH defects (Stalder, 2014), while metamorphic and volcanic samples cluster around 5 wt ppm (Table 1). The large discrepancy between natural and experimentally grown quartz from water-saturated systems may have several reasons, such as (1) reduced water activity during crystallisation in natural systems leading to reduced OH incorporation (Stalder and Konzett, 2012) and (2) metamorphic overprint leading to partial or total OH loss (Stalder et al., 2017). In accordance with the high-pressure experiments, the highest reported values in natural quartz closely reach values above 200 wt ppm water (Bambauer et al., 1962), and even in the sedimentary archives a handful of grains with OH defect contents >100 ppm water are preserved (Stalder, 2014; Jaeger et al., 2019, see Table 1). Interestingly, most of the OH-rich grains from sediments that retained a high OH defect content are dominated by AlOH defects, which is in contrast to the late-stage igneous samples with high OH contents (Fig. 1d). Possibly, these grains underwent very low-grade thermal treatment after formation (and before sedimentation) that led to a transformation of the LiOH to AlOH absorption bands, comparable to thermal annealing experiments on quartz (Brunner et al., 1961; Rovetta et al., 1986; Stalder et al., 2017).
10.1 Granites and granitic pegmatites
OH contents in quartz from hitherto analysed granites vary between 0 wt ppm and 72 wt ppm water (Table 1) with a median value around 3 wt ppm for Proterozoic samples from Scandinavia with ages around 1.8 Ga and median values around 20–35 wt ppm for Variscan samples with ages around 0.3 Ga (Stalder et al., 2017; Potrafke et al., 2020). Neoproterozoic samples (ages around 0.9 Ga), and some samples from the Paleoproterozoic Transscandinavian Igneous Belt, may reach 10–20 wt ppm (Müller and Koch-Müller, 2009; Stalder et al., 2017). The observed differences may either reflect (i) primary igneous incorporation, (ii) secondary processes such as dehydration, or (iii) a combination of both. Specifically, the observed differences could be explained by the different crustal levels that were sampled (having in mind the experimentally determined pressure trend) or by a long-term low-grade metamorphic overprint that caused a partial dehydration. In this context it is interesting that older sedimentary archives from Scandinavia (such as the 1.4 Gyr old Dalarna subarkose sandstone) reveal information about the upper portion of the same Paleoproterozoic source that is exposed today. During the sedimentation of the Dalarna sandstone (1.4 Gyr ago), the igneous rocks had a similar age as Variscan samples have today, and a significant fraction of very OH-rich grains was preserved (Stalder, 2014). The interpretation of the long-term low-grade overprint is supported by the observations that IR spectra of quartz from old granitic bodies are typically dominated by AlOH absorption bands, the thermally less stable LiOH band is not observed, and there is a tendency of higher OH contents towards the centre of the body (Stalder et al., 2017). Variscan granites are dominated by AlOH, too, but in contrast often exhibit strong LiOH bands (Stalder et al., 2017; Potrafke et al., 2020) even if they are subordinate or missing in some cases (Müller et al., 2009).

Figure 4Spectral characteristic (ratio of the linear absorbances , representing the ratio ) plotted against absolute OH content for quartz from river samples from the Elbe and Rhine (grey solid dots) compared to quartz from Variscan plutons (coloured fields; see legend). Sediment data are derived from Stalder et al. (2017, 2019), granite data for the Black Forest samples from Stalder et al. (2017), and for Podlesí and Zinnwald from Potrafke et al. (2020). Numbers refer to the components defined in the text.
In order to better understand the systematics of OH incorporation in quartz during igneous rock formation, several granitic bodies were investigated in more detail. For the Variscan samples from the Black Forest, spectral characteristics show an array with a negative correlation of LiOH versus total OH (Stalder et al., 2017). A similar trend is observed for the Zinnwald samples (a modally zinnwaldite-bearing granite) in their dependence on depth, with moderate LiOH and high total OH at low depth, followed by a decrease in total OH and an increase in LiOH towards greater depth (Fig. 4). A different trend with increasing depth is observed for the Podlesí stock granite, in which low LiOH and moderate total OH contents are followed by an increase in LiOH and subsequently a decrease in LiOH and an increase in total OH (Fig. 4). Due to the rather small depth interval, the pressure effect can probably be neglected. The process behind the OH defect variations is possibly controlled by the activity of Li and water in the system similar to experimentally determined trends, in which more Li in the system causes a shift towards higher LiOH and lower total OH due to the formation of dry AlLi defects (Frigo et al., 2016), and a reduced water activity generally leads to lower total OH contents (Stalder and Konzett, 2012).
Reported OH contents for quartz from granitic pegmatites (Table 1) cluster around 20 wt ppm water with a range between 6 wt ppm and 45 wt ppm (Müller and Koch-Müller, 2009). One pegmatitic comb quartz from the granite stock in Podlesí, Czech Republic (Breiter et al., 2005), revealed an OH content of 132 wt ppm (Fig. 1d, Table 1).
10.2 Rhyolitic tuffs and ignimbrites
OH contents in quartz from felsic volcanic rocks up to 13 wt ppm water and average values of 6 wt ppm were reported from different studies (Table 1). IR absorption spectra of all studies reveal nearly exclusively AlOH defects (Müller et al., 2009; Stalder and Neuser, 2013; Biró et al., 2016, 2017; Tollan et al., 2019), and a clear intra-crystalline zoning pattern was observed with decreasing Al and OH contents from core to rim (Tollan et al., 2019). In accordance with the charge balance equation established above (Eq. 1), protons are charge balanced by Al3+ and are in concurrence with alkali cations. Diffusive exchange at the rim can lead to a further decrease in OH as observed in quartz phenocrysts from Mesa Falls Tuff, Idaho (Tollan et al., 2019), and from Bishop Tuff, California (Jollands et al., 2020b). A pronounced decrease from the base towards the middle part of thick pyroclastic density current deposits in the Bükk Foreland volcanic area, Hungary, was observed, which was explained by diffusional loss after deposition and slow cooling (Biró et al., 2017). After all, it seems to be clear that the observed differences between crystals from the same eruption cannot be explained by processes in the magma chamber but rather reflect a snapshot of ongoing late-stage modifications of the OH defect inventory that can be quantified in terms of diffusional loss and allows for an estimate on the timescales of long-lasting cooling.
10.3 Hydrothermal quartz
Hydrothermal quartz specimens have been investigated for decades, and the range of OH contents is rather large (0–225 wt ppm water; Table 1); individual crystals reveal strong internal zoning (Chakraborty and Lehmann, 1976a) with respect to OH and vary even between zero and high defect contents (>20 wt ppm water) within one specimen (Stalder et al., 2017). In contrast to quartz from most other formation processes (notably except pegmatites), hydrothermal quartz often exhibits strong LiOH absorption bands (Brunner et al., 1961; Chakraborty and Lehmann, 1976b; Müller and Koch-Müller, 2009) that may match or even exceed the intensity of AlOH bands (Yurimoto et al., 1989; Stalder and Neuser, 2013). An increasing defect ratio shows a positive correlation to the total OH content (Bambauer et al., 1963) and reaches values around unity for the most OH-rich specimens.
Different populations of hydrothermal quartz have been distinguished (Bambauer, 1961): (1) “usual” hydrothermal quartz with moderate OH defect contents with up to 8 wt ppm water and (2) mimetic quartz with OH defect contents corresponding to up to 180 wt ppm water. Common colourless rock crystals often have a few weight parts per million water as OH defects (Table 1), while smoky quartz on average even contains OH contents which are lower by a factor of 2 to 10 (Brunner et al., 1961; Bambauer, 1961; Bambauer et al., 1962). Higher OH contents (comparable to values of rock crystals) are observed in weakly coloured smoky quartz and their colourless cores (Bambauer et al., 1962).
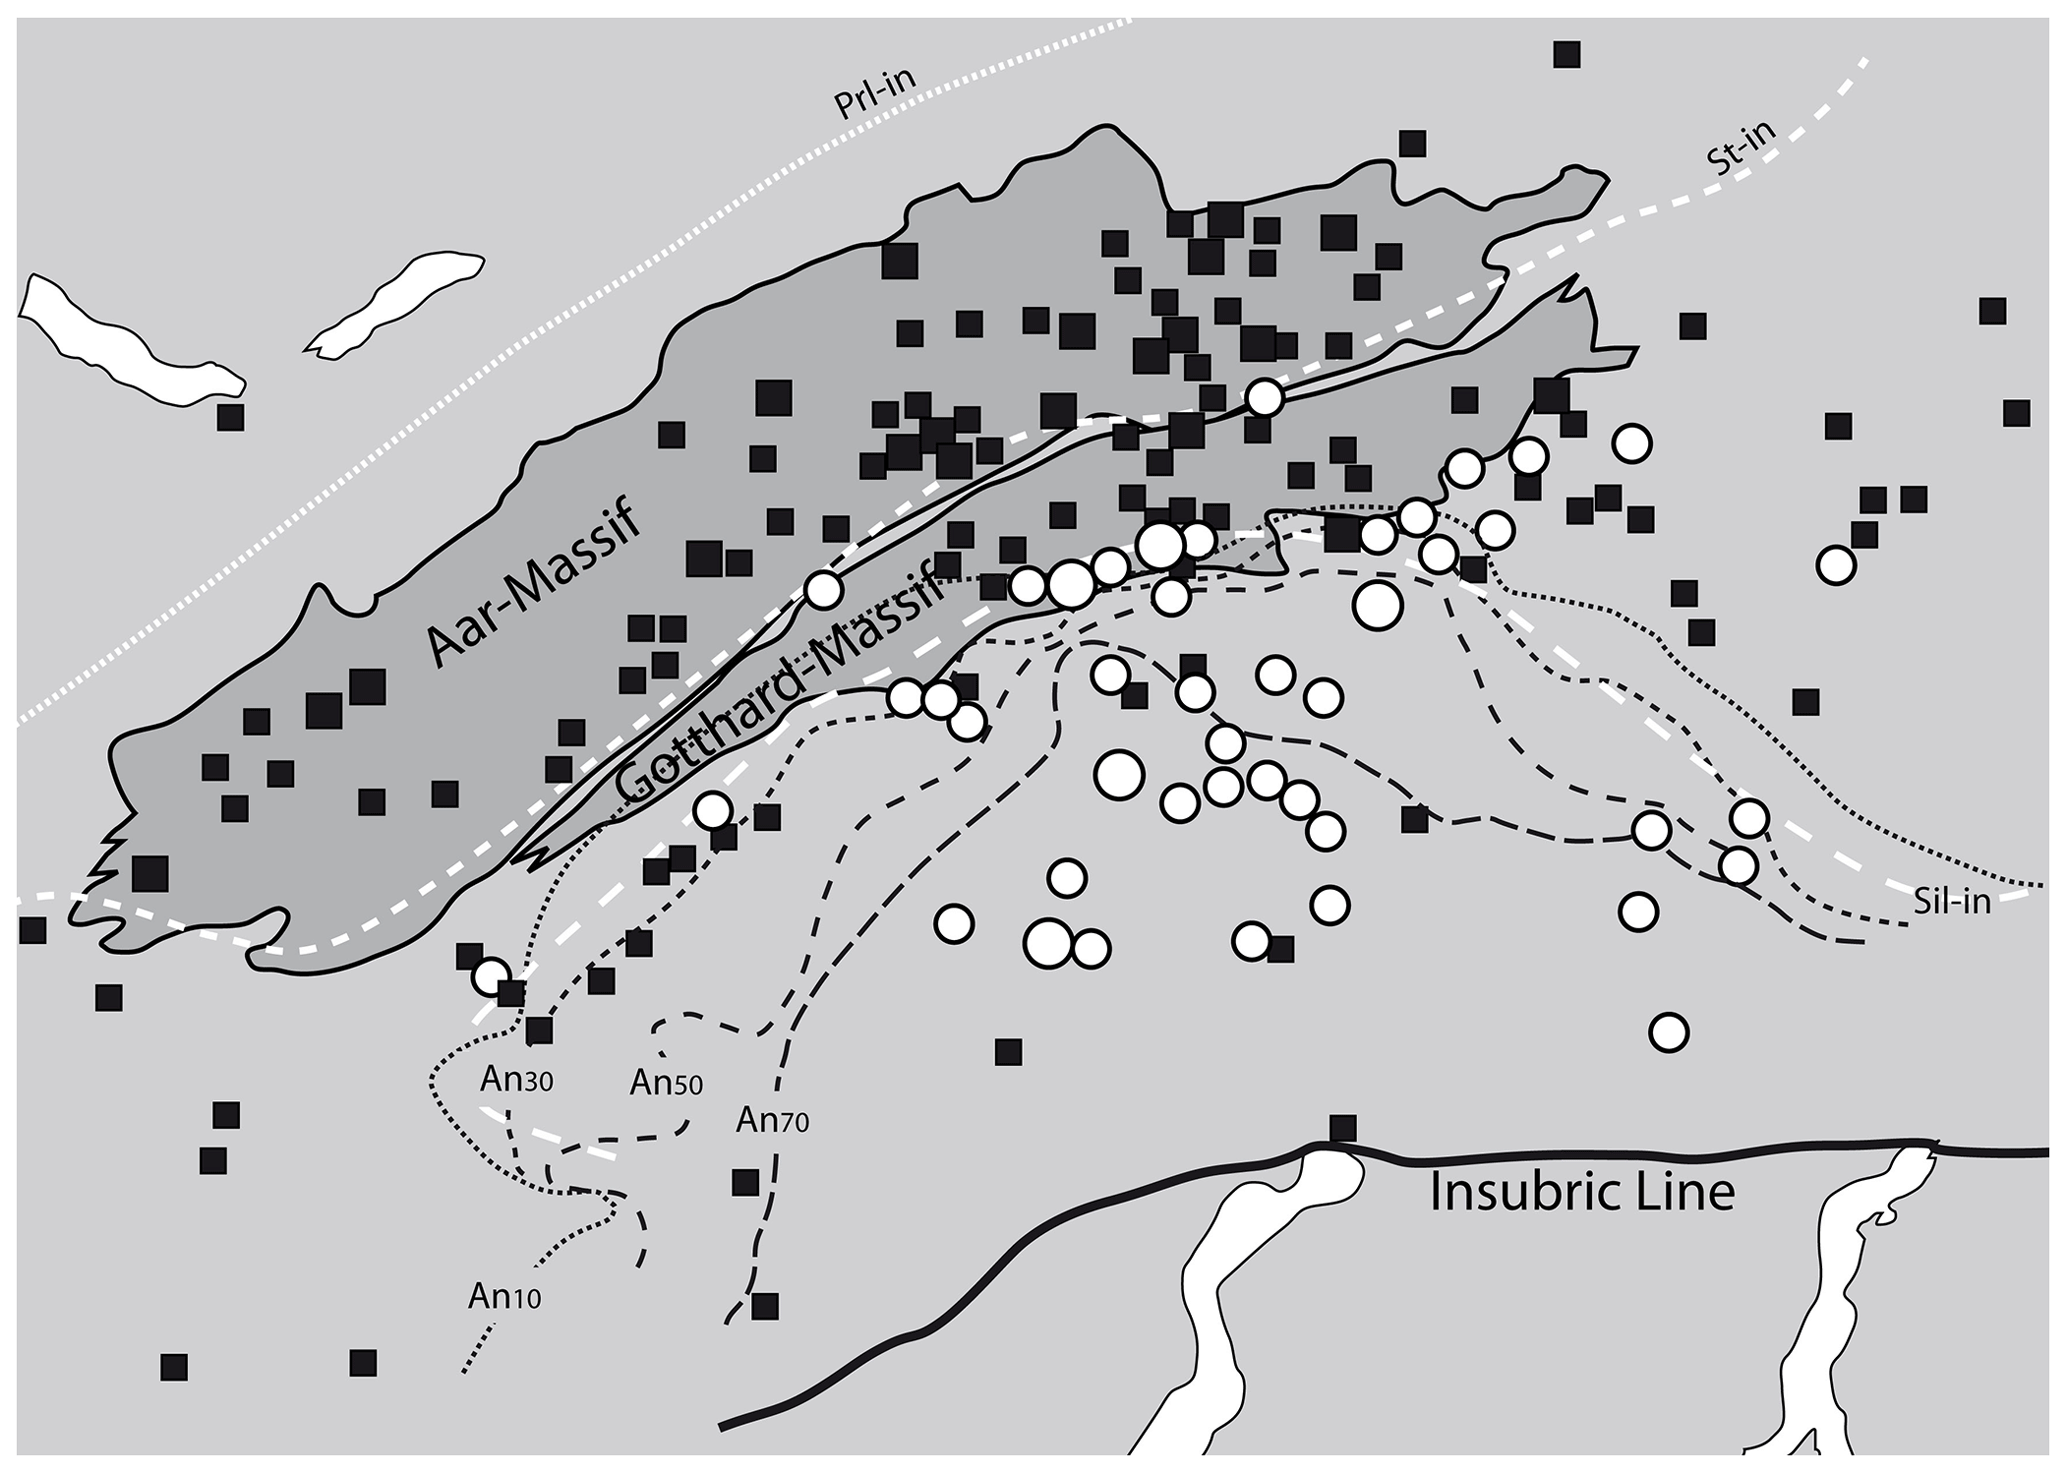
Figure 5Correlation of OH-poor and OH-rich fissure quartz (data from Bambauer et al., 1962) to metamorphic isograds (plagioclase composition – Wenk, 1962; isograds in metapelites – Frey and Ferreiro-Mählmann, 1999). Prl: pyrophyllite; St: staurolite; Sil: sillimanite; An: anorthite. Solid squares represent OH-poor (<2 wt ppm water) and open circles OH-rich (>4 wt ppm water) common fissure quartz. Large symbols summarise several samples from nearby localities.
The areal distribution of OH in fissure quartz of the central Alps (Bambauer et al., 1962) revealed a regional pattern depending on formation conditions, locally superimposed by the country rock and fluid chemistry. In detail, a correlation between the OH contents of fissure quartz and the metamorphic grade in the regional context could be established (Fig. 5), in which feldspar compositions towards more Na-rich (up to Ab17) adularia and anorthite-rich plagioclase in metacarbonates (representing high temperature) accompany quartz with high OH content, and Na-poor adularia and albite (representing low temperature) were found in fissures containing quartz with low OH contents. Even if it was pointed out (Bambauer et al., 1962) that fissure quartz is formed under different conditions (not only at peak metamorphism), higher metamorphic temperature implies an earlier start of crystallisation in which the fluid phase was more enriched in the charge-balancing trace metals that finally lead to the increased incorporation of OH defects.
10.4 Metamorphic rocks
OH defect contents in quartz from metamorphic rocks are generally low (<5 wt ppm water) and seldom exceed 10 wt ppm water (Table 1). IR spectra are generally strongly dominated by the AlOH triplet (Müller and Koch-Müller, 2009; Stalder et al., 2017) in accordance with the observed limited thermal stability of LiOH. Thus, low combined with low total OH is typical – although not unequivocally diagnostic – for metamorphic quartz. In contrast to LiOH, but in accordance with a high thermal stability of BOH, the absorption band at 3595 cm−1 was detected in quartz grains from a tourmaline-bearing Qz eclogite (Stalder and Neuser, 2013). A systematic study on quartzites from Norway (Müller and Koch-Müller, 2009) suggests a rough tendency towards higher OH contents for quartz from kyanite-bearing quartzites (9 wt ppm) compared to kyanite-free quartzites (6 wt ppm). It is not clear whether this putative difference is caused by pressure and/or availability of Al (both properties ascribed to the presence of kyanite). Pressure is probably not an important factor because there is no systematic difference in the equilibration pressure of the studied kyanite-bearing and kyanite-free quartzites, and, furthermore, a pressure trend is not expected with respect to the experimental results. The availability of Al is not a very probable explanation either because the AlOH defect is dominant in all quartzites and Al diffusion is much too slow (around 10−22 m2/s at 600 ∘C; Tailby et al., 2018) to account for incorporation of new AlOH defects at metamorphic conditions. Based on the present data set it is not clear whether the difference between kyanite-bearing and kyanite-free samples is significant at all. A clear temperature trend has not been established, at least not for the kyanite-free quartzites (Fig. 6). Information concerning the equilibration temperature in quartz-rich metasediments may be gained from the distribution of OH between different grains. While a homogeneous defect distribution was observed in a quartzite from Hohe Tauern, Austria, that was metamorphosed at 600 ∘C (Stalder et al., 2017), quartzites from Vredefort, South Africa, with a metamorphic overprint at 350 ∘C revealed strongly different OH contents from grain to grain, suggesting that at low temperatures the originally variable sedimentary OH content of the individual grains may (partly) be preserved. The influence of deformation has not been assessed in detail yet. In particular, the presence of OH may not only be crucial for hydrolytic weakening, but in turn, deformation probably also promotes the equilibration of OH defects.
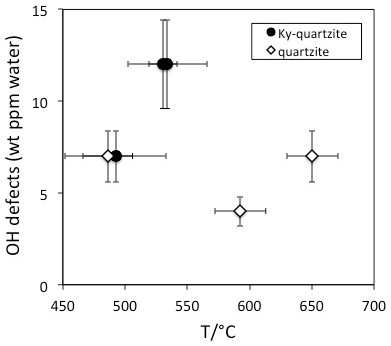
Figure 6OH defect contents in quartzites from Norway. Data are from Müller and Koch-Müller (2009).
10.5 Siliciclastic sediments
Most quartz crystals in the Earth originally crystallised in felsic igneous bodies that comprise about half of the volume of the continental crust (Wedepohl, 1995) and – due to their low density – sooner or later are uplifted, exposed, eroded, and transported into sedimentary basins where they are mixed with other sources from metamorphic rocks and/or recycled sediments. Finally, a sedimentary quartz grain either retained its original igneous OH signature or experienced a decrease in by mild thermal treatment or additionally a strong decrease in total OH by more intense thermal treatment. Consequently, variations in spectral characteristics of sedimentary quartz show a fair overlap to their igneous source rocks (Fig. 4) supplemented by a variable amount of low OH grains from metamorphic sources. Remarkably, most data points fall within an array that can be defined as a triangle (similar to the one defined by the quartz crystals from granites) with the edges at (1) low OH content and low , (2) moderate OH contents and high , and (3) high OH contents and moderate . Siliciclastic sediments therefore provide a wealth of information of eroded parts of felsic plutons. Furthermore, they serve as good proxy for average crustal quartz (Stalder, 2014).
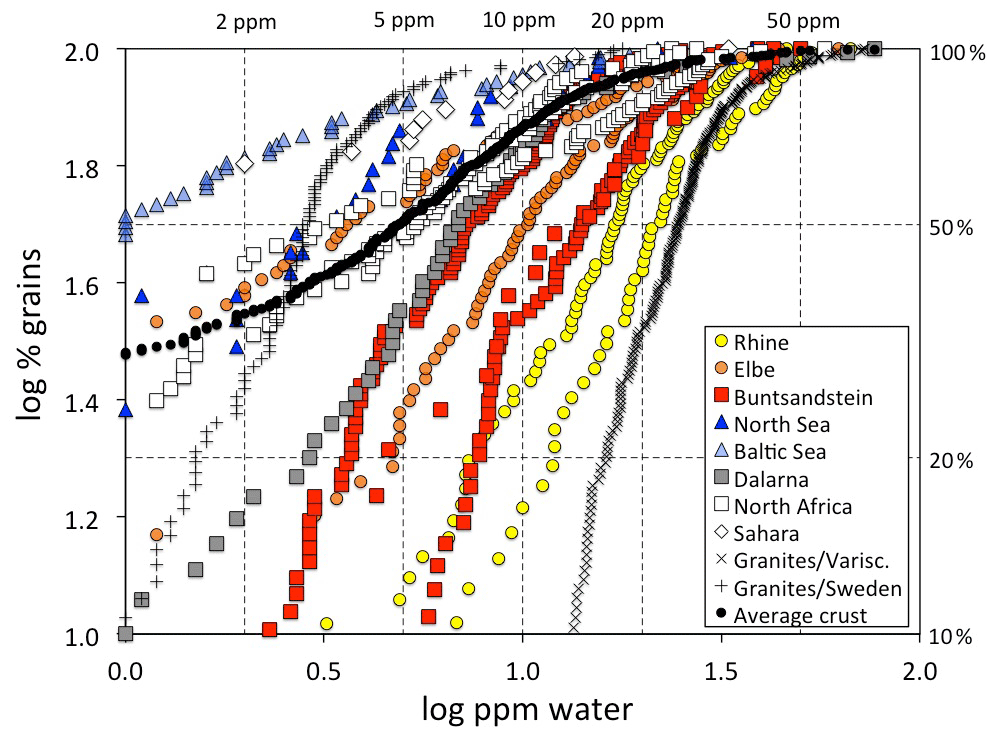
Figure 7OH defect distribution of quartz grains from sedimentary samples (squares: sandstones; circles: river sediments; triangles: beach/dune sands). The right hand y axis gives the percentage of grains below the respective defect water content. Data points below 1 wt ppm water are not plotted due to the large uncertainty. Data for the sedimentary samples are derived from Stalder and Neuser (2013) for the North Sea and Buntsandstein; Stalder (2014) for Dalarna, North Africa, Sahara, and average crust; Stalder et al. (2017) for the Rhine and Baltic Sea; and Stalder et al. (2019) for the Elbe, Buntsandstein, and North Africa. Data for European granites (Proterozoic from Sweden and Variscan from Central Europe are shown for comparison and are derived from Stalder et al. (2017) and Potrafke et al. (2020). For some systems (Rhine, Elbe, Buntsandstein, North Sea, North Africa) several samples are plotted with the same symbol (see text for further details).
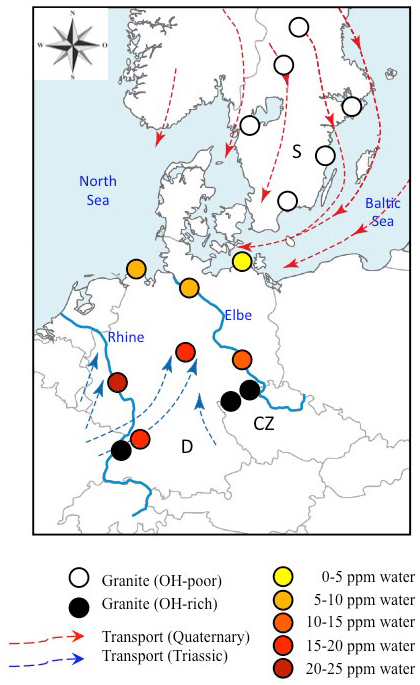
Figure 8Geographical distribution of analysed sediments and Variscan granites from Central (Germany: D; Czech Republic: CZ) and Northern Europe (Sweden: S). Data for OH-rich (average >20 wt water) granites are from Stalder et al. (2017) and Potrafke et al. (2020), and those for OH-poor (average <5 wt ppm water) granites are from Stalder et al. (2017). Average OH contents for sedimentary quartz are colour-coded. Transport directions during the Mesozoic (Ziegler, 1990) and Quaternary (Eissmann, 1986) are indicated by blue and red arrows, respectively. Large recent rivers (Rhine and Elbe) are shown as blue lines and have transport directions to the north.
Average spectra from large sedimentary reservoirs are dominated by grains with absorption bands derived from AlOH defects (Stalder and Neuser, 2013; Stalder, 2014), but average spectra of more local sources and of individual grains may exhibit strong BOH and/or LiOH (Stalder et al., 2017). OH contents in quartz from sedimentary systems hitherto investigated exhibit a wide variability (Fig. 7) and average OH concentrations in quartz sands vary even within Central Europe by a factor of 5, ranging from 4 wt ppm water for a beach sand from the Baltic Sea to more than 20 wt ppm water in a river sand from the Rhine (Stalder et al., 2017). Estimations based on large siliciclastic reservoirs suggest that 50 % of all quartz grains contain >5 wt ppm water on average globally (Fig. 7). River sediments exhibit a large spread, and in Central Europe there is a general tendency of high OH contents (plotting to the right in Fig. 7) towards the south and west (e.g. the Rhine) and low OH contents towards the north (e.g. Baltic Sea, North Sea, and northern Elbe). Taking into account the main transport directions from north to south during the quaternary glaciations and from south to north for the recent main river systems (Rhine and Elbe) and during the erosion of the Variscan Mountains in the Mesozoic, a clear correlation to the OH content of the granites in the source regions emerges (Fig. 8), linking samples with predominantly OH-poor quartz to old sources (in this case the Proterozoic Scandinavian Shield) and OH-rich quartz samples to much younger (in this case late Palaeozoic) sources. Due to this clear contrast, OH defects in quartz can even be used to estimate mixing relations of fluvial sources (from the Variscan basement) and glacial sources (from Scandinavia, also called “Nordic signal”) in Central Europe. In sediments from the northern Elbe a significant fraction shows OH defect contents in quartz >10 wt ppm water, suggesting a smaller Nordic fraction of only 30 %–50 % (Stalder et al., 2019) compared to estimates based on heavy mineral assemblages and the age spectra of detrital zircons (Führing, 2017). Another example that the OH inventory records complementary information is revealed in Mesozoic sandstones such as the Buntsandstein (Lower Triassic), in which significant differences in OH were detected in a sequence, in which neither heavy mineral spectra nor ages revealed significant changes despite a clear change in sedimentary facies. The observed higher OH content in the lower sedimentary unit (Stalder et al., 2019) is in agreement with the interpretation that some plutons host the most OH rich quartz crystals in their roof region (Potrafke et al., 2020) and that OH incorporation decreases with increasing pressure (Baron et al., 2015; Frigo et al., 2016). In addition, erosion of deeper parts of a pluton down to its roots takes place later, which increases the possibility that OH defects are lost during metamorphism. OH contents in quartz crystals in the sedimentary succession will thus show a depth profile which is inverse to the respective eroded plutonic body (Fig. 9).
A combination of the different approaches to study OH point defects in quartz enables a link between understanding the incorporation behaviour depending on physical and chemical conditions, the evolution of igneous systems, and the recycling in sedimentary systems. Ideally, clusters of sedimentary quartz grains can be identified and then traced back to their possible sources and can give insights to their geological past. In detail the link may not be unequivocal, especially if the original sources are removed by erosion. However, a rough general estimate concerning the thermal history of the source can still be made. If the origin of quartz grains is unknown, one may divide them into three large classes: (1) pristine igneous and/or hydrothermal origin with moderate to high total OH and variable , (2) mildly thermally annealed (late-stage) igneous grains with moderate to high total OH and low , and (3) strongly dehydrated grains with very low OH contents and low such as metamorphic grains or grains from the middle part of pyroclastic density current deposits characterised by slow cooling. Different classes are not strictly divided and exhibit a continuous transition between each other: while group (1) covers nearly the whole range in Fig. 4, group (2) is confined to the low edge, and (3) is confined to the low and to the low OH corner. The very close match of OH contents of 250 wt ppm water in quartz from high-pressure experiments ≤4 kbar under water-saturated conditions in a granitic system (Potrafke et al., 2019) and the highest contents observed in natural grains (Jaeger et al., 2019) suggests that the natural processes can be realistically simulated by high-pressure experiments. Linking the sedimentary grains to quartz specimens found in situ (such as directly sampled from igneous bodies or hydrothermal veins and fissures) is not straightforward, and candidates that might be the precursors for the most OH-rich sedimentary grains were not identified yet. Basically all hitherto identified grains from sediments with very high (>100 wt ppm water) OH contents (Fig. 1d) would belong to the above-defined class (2) but otherwise cannot be linked to natural specimens found in situ, which either belong to class (1) and show a much higher (as the mimetic quartzes; Bambauer, 1961) or have lower total OH contents (Table 1). Possibly, the OH-rich grains were originally formed with high and were later annealed at sufficiently low temperature (and/or over a sufficiently short time) so that LiOH was destroyed, but the high OH content was preserved. With respect to the low thermal stability of LiOH the available data led to a consensus that fully explains that LiOH is absent in old plutonic bodies and metamorphic rocks.
Generally, OH incorporation is probably controlled predominantly by the availability of Li and water (provided that also Al is present), and an increase in Li leads to a decrease in LiOH by the formation of dry LiAl defects (Frigo et al., 2016), and, further, an increase in water activity leads to an increase in total OH. The observed trend on a larger scale suggests a general decrease in OH with pressure and depth – that is mainly driven by an unfavourable Al incorporation on the tetrahedral site (Stalder and Konzett, 2012; Frigo et al., 2016) – implying that quartz from large batholiths should exhibit less OH defects in their roots. Consequently, deep (late) erosion furnishes less OH-rich quartz grains compared to shallow (early) erosion (Fig. 9). This effect is further reinforced by the longer (and stronger) subjection to metamorphic overprint of the more basal portions of the plutonic bodies.

Figure 9Sequence of schematic continental crust sections with granitic plutons (marked by crosses) that erode over time. In the sedimentary record the upper portion of a pluton is deposited as lower units (b) and the lower portion as upper units (c). Darker colours represent higher OH contents, taking into account that the OH incorporation exhibits a negative pressure trend and that lower parts of plutons are subjected to longer and more intense metamorphic overprint.
In conclusion, OH defects in quartz may be used to quantify geological processes, provided that a sufficiently large data set is present.
-
A statistical distribution of OH defects in metamorphic rocks could be used as a geothermometer, in which a higher degree of equilibration between the individual grains is reached at higher temperature.
-
In pyroclastic density current deposits (ignimbrites) the distribution of OH defects can be modelled in terms of diffusional loss allowing for an estimate on depositional temperature and the timescales of long-lasting cooling.
-
In specific cases the classification low OH = old and high OH = young may be a valuable tool. However, the application as a geochronometer is generally not possible since OH-rich grains primarily reflect their formation conditions independent of the age of the host rock, and OH-rich grains may be preserved in old sedimentary rocks, such in the 1.4 Gyr old Dala sandstone in Sweden.
-
Provided that a sufficiently large data set exists and that the different sources can be distinguished by their OH inventory, the quantification of mixing ratios of different reservoirs is possible.
Despite the progress during the past decade, several knowledge gaps persist. Further research directions could be addressed to (1) the formation and stability of hydrous defects during deformation, (2) experiments in a more narrow grid at 1–5 kbar, (3) the influence of high/low quartz transition, (4) experiments <1 kbar to verify the rapid increase in the low pressure regime and for application to volcanic rocks, (5) Li-H exchange in quartz from volcanic samples for quantification of eruption timescales, and (6) the nature of the band at 3200 cm−1.
Other hitherto unsolved questions refer to the link between IR spectroscopy and other spectroscopic methods such as cathodoluminescence (CL) and optical stimulated luminescence spectroscopy (OSL). Despite several systematic studies a clear correlation between the spectral characteristics of IR and CL could so far not be established, and both methods seem to give complementary information (Müller et al., 2009; Stalder and Neuser, 2013; Potrafke et al., 2020). Very few studies combining IR and OSL were so far performed, and the existing data set does not reveal a clear correlation between IR and OSL characteristics. Hydrous point defects show a vague but barely significant positive correlation to the intensity of the OSL signal (Thamóné et al., 2020), and for molecular water (fluid inclusions) contrasting results – positive trends (Sharma et al., 2017) and no correlation (Thamóné et al., 2020) – were reported. The fact that for these methods the ideal grain size is different – typically 90–250 µm for OSL (Rhodes, 2011) and 250–1000 µm for IR – is unfavourable for combining both methods for the same sample material.
No data sets were used in this article.
The author declares that there is no conflict of interest.
This article is part of the special issue “Probing the Earth: reviews of OH groups in anhydrous and hydrous minerals”. It is not associated with a conference.
This project was supported by the Austrian Science Fund (FWF): P29145-N34 and P33038-N. Over the past decade, many colleagues and students contributed significantly by critical discussions, by providing sample material and analytical facilities, and by performing experimental and analytical work, and they have helped to successfully perform current and previous projects on OH in quartz. In this context, I would like to thank Marzena Baron, Kjell Billström, Karel Breiter, Hilmar von Eynatten, Corinne Frigo, Christoph Hauzenberger, Dominik Jaeger, Jürgen Konzett, Thomas Ludwig, Guido Meinhold, Peter Mirwald, Rolf Dieter Neuser, Alexander Potrafke, Burkhard Schmidt, Henrik Skogby, Michael Strasser and many others for constructive cooperation. Hans Ulrich Bambauer is thanked for talking about his work. Axel Müller, Mike Jollands, and an anonymous reviewer are thanked for their thorough and constructive reviews.
This paper was edited by István Kovács and reviewed by Axel Müller, Michael Jollands, and one anonymous referee.
Adams, S. J., Hawkes, G. E., and Curzon, E. H.: A solid state 29Si nuclear magnetic resonance study of opal and other hydrous silicas, Am. Mineral., 76, 1863–1871, 1991.
Aines, R. D. and Rossman, G. R.: Water in minerals? A peak in the infrared, J. Geophys. Res., B89, 4059–4071, 1984.
Aines, R. D., Kirby, S. H., and Rossman, G. R.: Hydrogen speciation in synthetic quartz, Phys. Chem. Miner., 11, 204–212, 1984.
Bachheimer, J. P.: An investigation into hydrogen stability in synthetic, natural and air-swept synthetic quartz in air temperatures up to 1100 ∘C, J. Phys. Chem. Solids, 59, 831–840, 1998.
Balan, E., Refson, K., Blanchard, M., Delattre, S., Lazzeri, M., Ingrin, J., Mauri, F., Wright, K., and Winkler, B.: Theoretical infrared absorption coefficient of OH groups in minerals, Am. Mineral., 93, 950–953, https://doi.org/10.2138/am.2008.2889, 2008.
Bambauer, H. U.: Spurenelementgehalte und γ-Farbzentren in Quarzen aus Zerrklüften der Schweizer Alpen, Schweiz. Min. Petr. Mitt., 41, 335–369, 1961.
Bambauer, H. U., Brunner, G. O., and Laves, F.: Wasserstoff-Gehalte in Quarzen aus Zerrklüften der Schweizer Alpen und Deutung ihrer regionalen Abhängigkeit, Schweiz. Min. Petr. Mitt., 42, 221–236, 1962.
Bambauer, H. U., Brunner, G. O., and Laves, F.: Merkmale des OH-Spektrums alpiner Quarze (3 µ-Gebiet), Schweiz. Min. Petr. Mitt., 43, 259–268, 1963.
Bambauer, H. U., Brunner, G. O., and Laves, F.: Light scattering of heat-treated quartz in relation to hydrogen-containing defects, Am. Mineral., 54, 718–724, 1969.
Baron, M. A., Stalder, R., Konzett, J., and Hauzenberger, C. A.: Formation conditions of quartz recorded by OH-point defects – experimental and analytical approach, Phys. Chem. Miner., 42, 53–62, https://doi.org/10.1007/s00269-014-0699-4, 2015.
Biró, T., Kovács, I. J., Király, E., Falus, G., Karátson, D., Bendö, Z., Fancsik, T., and Sándorné, J. K.: Concentration of hydroxyl defects in quartz from various rhyolitic ignimbrite horizons: results from unpolarized micro-FTIR analyses on unoriented phenocryst fragments, Eur. J. Mineral., 28, 313–327, https://doi.org/10.1127/ejm/2016/0028-2513, 2016.
Biró, T., Kovács, I. J., Karátson, D., Stalder, R., Király, E., Falus, G., Fancsik, T., and Sándorné, J. K.: Evidence for post-depositional diffusional loss of hydrogen in quartz phenocryst fragments within ignimbrites, Am. Mineral., 102, 1187–1201, https://doi.org/10.2138/am-2017-5861, 2017.
Breiter, K., Müller, A., Leichmann, J., and Gabasová, A.: Textural and chemical evolution of a fractionated granitic system: the Podlesí stock, Czech Republic, Lithos, 80, 323–345, https://doi.org/10.1016/j.lithos.2003.11.004, 2005.
Brown, R. N. and Kahan, A.: Optical absorption of irradiated quartz in the near i.r., J. Phys. Chem. Solids, 36, 467–476, https://doi.org/10.1016/0022-3697(75)90076-1, 1975.
Brunner, G. O., Wondratschek, H., and Laves, F.: Ultrarotuntersuchungen über den Einbau von H in natürlichem Quarz, Zeitschrift für Elektrochemie, 65, 735–750, 1961.
Carter, N. L., Christie, J. M., and Griggs, D. T.: Experimental deformation and recrystallization of quartz, J. Geol., 72, 687–733, 1964.
Chakraborty, D. and Lehmann, G.: Distribution of OH in synthetic and natural quartz crystals, J. Solid State Chem., 17, 305–311, 1976a.
Chakraborty, D. and Lehmann, G.: On the structure and orientations of hydrogen defects in natural and synthetic quartz crystals, Phys. Stat. Solidi A, 34, 467–474, https://doi.org/10.1002/pssa.2210340206, 1976b.
Charlier, B. L. A., Morgan, D. J., Wilson, C. J. N., Wooden, J. L., Allan, A. S. R., and Baker, J. A.: Lithium concentration gradients in feldspar and quartz record the final minutes of magma ascent in an explosive supereruption, Earth Planet. Sc. Lett., 319–320, 218–227, https://doi.org/10.1016/j.epsl.2011.12.016, 2012.
Chauviré, B., Rondeau, B., and Mangolg, N.: Near infrared signature of opal and chalcedony as a proxy for their structure and formation conditions, Eur. J. Mineral., 29, 409–421, https://doi.org/10.1127/ejm/2017/0029-2614, 2017.
Cohen, A. J.: Substitutional and interstitial aluminium impurity in quartz, structure and color center interrelationships, J. Phys. Chem. Solids, 13, 321–325, https://doi.org/10.1016/0022-3697(60)90016-0, 1960.
Cordier, P. and Doukhan, J. C.: Water speciation in quartz: a near infrared study, Am. Mineral., 76, 361–369, 1991.
Cordier, P., Boulogne, B., and Doukhan, J. C.: Water precipitation and diffusion in wet quartz and wet berlinite AlPO4, Bull. Minéral., 111, 113–137, 1988.
Cordier, P., Weil, J. A., Howarth, D. F., and Doukhan, J. C.: Influence of the (4H)Si defect on dislocation motion in crystalline quartz, Eur. J. Mineral., 6, 17–22, 1994.
Doukhan, J. C. and Trépied, L.: Plastic deformation of quartz single crystals, Bull. Minéral., 108, 97–123, 1985.
Eissmann, L.: Quartärgeologie und Geschiebeforschung im Leipziger Land mit einigen Schlußfolgerungen zu Stratigraphie und Vereisungsablauf im Norddeutschen Tiefland, p. 105–133, in: Die Eiszeitgeschiebe in der Umgebung von Leipzig. Bestand, Herkunft, Nutzung und quartärgeologische Bedeutung, edited by: Richter, E., Baudenbacher, R., and Eissmann, L., Altenburger Naturwissenschaftliche Forschung, 3, 1–136, 1986 (in German).
Elphick, S. C. and Graham, C. M.: The effect of hydrogen on oxygen diffusion in quartz: evidence for fast proton transients?, Nature, 335, 243–245, 1988.
Flörke, O. W., Flörke, U., and Giese, U.: Moganite. A new microcrystalline silica-mineral, N. Jb. Mineral. Abh., 149, 325–336, 1984.
Frey, M. and Ferreiro-Mählmann, R.: Alpine metamorphism of the Central Alps, Schweiz. Min. Petr. Mitt., 79, 135–154, 1999.
Frigo, C., Stalder, R., and Hauzenberger, C. A.: OH-defects in quartz in granitic systems doped with spodumene, tourmaline and/or apatite: experimental investigations at 5–20 kbar, Phys. Chem. Miner., 43, 717–729, https://doi.org/10.1007/s00269-016-0828-3, 2016.
Frigo, C., Stalder, R., and Ludwig, T.: OH defects in coesite and stishovite during ultrahigh-pressure metamorphism of continental crust, Phys. Chem. Miner., 46, 77–89, https://doi.org/10.1007/s00269-018-0987-5, 2019.
Frondel, C.: Structural hydroxyl in chalcedony (Type B quartz), Am. Mineral., 67, 1248–1257, 1982.
Führing, P.: Provenienz und Verteilung rezenter Sande der Nordseeküste (West- bis Ostfriesland) und der Flüsse Elbe, Weser und Ems, MSc-thesis, University of Göttingen, Göttingen, Germany, 167 pp., 2017 (in German with English abstract).
Gerretsen, J., Paterson, M. S., and McLaren, A. C.: The uptake and solubility of water in quartz at elevated pressure and temperature, Phys. Chem. Miner., 16, 334–342, 1989.
Griggs, D. T. and Blacic, J. D.: Quartz: anomalous weakness of synthetic crystals, Science, 147, 292–295, 1965.
Griggs, D. T., Blacic, J. D., Christie, J. M., McLaren, A. C., and Frank, F. C.: Hydrolytic weakening of quartz crystals, Science, 152, 674, 1966.
Halliburton, L. E., Koumvakalis, N., Markes, M. E., and Martin, J. J.: Radiation effects in crystalline SiO2: the role of aluminium, J. Appl. Phys., 52, 3565–3574, https://doi.org/10.1063/1.329138, 1981.
Hardgrove, C. and Rogers, D.: Thermal infrared and Raman microspectroscopy of moganite-bearing rocks, Am. Mineral., 98, 78–84, https://doi.org/10.2138/am.2013.4152, 2013.
Heaney, P. J. and Post, J. E.: The widespread distribution of a novel silica polymorph in microcrystalline quartz varieties, Science, 255, 441–443, https://doi.org/10.1126/science.255.5043.441, 1992.
Jaeger, D., Stalder, R., Masago, H., and Strasser, M.: OH defects in quartz as a provenance tool: application to fluvial and deep marine sediments from SW Japan, Sed. Geol., 388, 66–80, https://doi.org/10.1016/j.sedgeo.2019.05.003, 2019.
Jollands, M. C., Blanchard, M., and Balan, E.: Structure and theoretical infrared spectra of OH defects in quartz, Eur. J. Mineral., 32, 311–323, https://doi.org/10.5194/ejm-32-311-2020, 2020a.
Jollands, M. C., Ellis, B., Tollan, P., and Müntener, O.: An eruption chronometer based on experimentally determined H-Li and H-Na diffusion in quartz applied to the Bishop Tuff, Earth Planet. Sc. Lett., 551, 116560, https://doi.org/10.1016/j.epsl.2020.116560, 2020b.
Jung, L.: High purity natural quartz, Part I: High purity natural quartz for industrial use, Quartz Technology Inc., Liberty Corner, New Jersey, 538 pp., 1992a.
Jung, L.: High purity natural quartz, Part II: High purity natural quartz markets for supplier and users, Quartz Technology Inc., Liberty Corner, New Jersey, 131 pp., 1992b.
Karampelas, S., Fritsch, E., Zorba, T., Paraskevopoulos, K. M., and Sklavounos, S.: Distinguishing natural from synthetic amethyst: the presence and shape of the 3595 cm−1 peak, Mineral. Petrol., 85, 45–52, https://doi.org/10.1007/s00710-005-0101-9, 2005.
Kats, A.: Hydrogen in alpha quartz, Philips Research Reports, 17, 133–279, 1962.
Kronenberg, A. K. and Kirby, S. H.: Ionic conductivity of quartz: DC time dependence and transition in charge carriers, Am. Mineral., 72, 739–747, 1987.
Kronenberg, A. K., Kirby, S. H., Aines, R. D., and Rossman, G. R.: Solubility and diffusional uptake of hydrogen in quartz at high water pressures: implications for hydrolytic weakening, J. Geophys. Res., B91, 12723–12744, 1986.
Kronenberg, A. K., Hasnan, H. F. B., Holyoke III, C. W., Law, R. D., Liu, Z., and Thomas, J. B.: Synchrotron FTIR imaging of OH in quartz mylonites, Solid Earth, 8, 1025–1045, https://doi.org/10.5194/se-8-1025-2017, 2017.
Langer, K. and Flörke, O. W.: Near infrared absorption spectra (4000–9000 cm−1) of opals and the role of “water” in these SiO2-nH2O minerals, Fortschr. Mineral., 52, 17–51, 1974.
Libowitzky, E. and Rossman, G. R.: An IR calibration for water in minerals, Am. Mineral., 82, 1111–1115, https://doi.org/10.2138/am-1997-11-1208, 1997.
London, D.: Experimental phase equilibria in the system LiAlSiO4–SiO2–H2O: a petrogenetic grid for lithium-rich pegmatites, Am. Mineral., 69, 995–1004, 1984.
Mackwell, S. J. and Paterson, M. S.: Water related diffusion and deformation effects in quartz at pressures of 1500 and 300 MPa. In: Schock, R.N. (Ed.) Point defects in minerals, Am. Geophys. Union, Geophys. Monogr., 31, 141–150, 1985.
McConnell, J. D. C., Lin, J. S., and Heine, V.: The solubility of [4H]Si defects in a-quartz and their role in the formation of molecular water and related weakening on heating, Phys. Chem. Miner., 22, 357–366, https://doi.org/10.1007/BF00213332, 1995.
Merritt, E.: Ueber den Dichroismus von Kalkspath, Quarz und Turmalin für ultrarothe Strahlen, Annalen der Physik und Chemie, 55, 49–64, 1895.
Miyoshi, N., Yamaguci, Y., and Maino, K.: Successive zoning of Al and H in hydrothermal vein quartz, Am. Mineral., 90, 310–315, 2005.
Müller, A. and Koch-Müller, M.: Hydrogen speciation and trace element contents of igneous, hydrothermal and metamorphic quartz from Norway, Mineral. Mag., 73, 569–583, https://doi.org/10.1180/minmag.2009.073.4.569, 2009.
Müller, A., Wiedenbeck, M., van den Kerkhof, A. M., Kronz, A., and Simon, K.: Trace elements in quartz – a combined electron microprobe, secondary ion mass spectrometry, laser ablation ICP-MS, and cathodoluminescence study, Eur. J. Mineral., 15, 747–763, https://doi.org/10.1127/0935-1221/2003/0015-0747, 2003.
Müller, A., van den Kerkhof, A. M., Behr, H.-J., Kronz, A., and Koch-Müller, M.: The evolution of late-Hercynian granites and rhyolites documented by quartz – a review, Earth Environ. Sci. Trans. Royal Soc. Edinburgh, 100, 185–204, https://doi.org/10.1017/S1755691009016144, 2009.
Niimi, N., Aikawa, N., and Shinoda, K.: The infrared absorption band at 3596 cm−1 of the recrystallized quartz from Mt. Takamiyama, southwest Japan, Mineral. Mag., 63, 693–701, https://doi.org/10.1180/002646199548853, 1999.
Nuttall, R. H. D. and Weil, J. A.: The magnetic properties of the oxygenhole aluminium centers in crystalline SiO2. II. [AlO4/H+] and [AlO4/Li+], Can. J. Phys., 59, 1709–1718, https://doi.org/10.1139/p81-228, 1981.
Paterson, M. S.: The thermodynamics of water in quartz, Phys. Chem. Miner., 13, 245–255, 1986.
Potrafke, A., Stalder, R., Schmidt, B. C., and Ludwig, T.: OH defect contents in quartz in a granitic system at 1–5 kbar, Contrib. Mineral. Petrol., 174, 98, https://doi.org/10.1007/s00410-019-1632-0, 2019.
Potrafke, A., Breiter, K., Ludwig, T., Neuser, R. D., and Stalder, R.: Variations of OH defects and chemical impurities in quartz within igneous bodies, Phys. Chem. Miner., 47, 24, https://doi.org/10.1007/s00269-020-01091-w, 2020.
Purton, J., Jones, R., Heggie, M., Öberg, S., and Catlow, C. R. A.: LDF pseudopotential calculations of the a-quartz structure and hydrogarnet defect, Phys. Chem. Miner., 18, 389–392, https://doi.org/10.1007/BF00199421, 1992.
Rhodes, E. J.: Optically stimulated luminescence dating of sediments over the past 200 000 years, Ann. Rev. Earth Planet. Sc., 39, 461–488, https://doi.org/10.1146/annurev-earth-040610-133425, 2011.
Ronov, A. B. and Yaroshevski, A. A.: Chemical composition of the Earth's crust, in: The Earths's crust and upper mantle, edited by: Hart, P. J., Geophysical Monograph Series, Amer. Geophys. Union, 13, 37–57, https://doi.org/10.1029/GM013p0037, 1969.
Rosa, A. L., El-Barbary, A. A., Heggie, M. I., and Briddon, P. R.: Structural and thermodynamic properties of water related defects in a-quartz, Phys. Chem. Miner., 32, 323–331, https://doi.org/10.1007/s00269-005-0005-6, 2005.
Rovetta, M. R.: Experimental and spectroscopic constraints on the solubility of hydroxyl in quartz, Phys. Earth Planet. Int., 55, 326–334, 1989.
Rovetta, M. R., Holloway, J. R., and Blacic, J. D.: Solubility of hydroxyl in natural quartz annealed in water at 900 ∘C and 1.5 GPa, Geophys. Res. Lett., 13, 145–148, 1986.
Rovetta, M. R., Blacis, J. D., Hervig, R. L., and Holloway, J. R.: An experimental study of hydroxyl in quartz using infrared spectroscopy and ion microprobe techniques, J. Geophys. Res., 94B, 5840–5850, 1989.
Roy, R. and Osborn, E. F.: The system lithium metasilicate-spodumene-silica, J. Am. Cer. Soc., 71, 2086–2095, 1949.
Shaffer, E. W., Sang, J. S. L., Cooper, A. R., and Heuer, A. H.: Diffusion of tritiated water in β-quartz, in: Geochemical Transport and Kintetics, edited by: Hofmann, A. W., Giletti, B. J., Yoder, H. S., and Yund, R. A., Carnegie institution Washington, Publication 634, 131–138, 1974.
Sharma, S. K., Chawla, S., Sastry, M. D., Gaonkar, M., Mane, S., Balaram, V., and Singhvi, A. K.: Understanding the reasons for variations in luminescence sensitivity of natural quartz using spectroscopic and chemical studies, Proc. Ind. Nat. Sci. Acad., 83, 645–653, https://doi.org/10.16943/ptinsa/2017/49024, 2017
Staats, P. A. and Kopp, O. C.: Studies of the origin of the 3400 cm−1 region infrared bands of synthetic and natural α-quartz, J. Phys. Chem. Solids, 35, 1029–1033, https://doi.org/10.1016/S0022-3697(74)80118-6, 1974.
Stalder, R.: OH-defect content in detrital quartz grains as an archive for crystallization conditions, Sed. Geol., 307, 1–6, https://doi.org/10.1016/j.sedgeo.2014.04.002, 2014.
Stalder, R. and Konzett, J.: OH-defects in quartz in the system quartz – albite – water and granite – water between 5 and 25 kbar, Phys. Chem. Miner., 39, 817–827, https://doi.org/10.1007/s00269-012-0537-5, 2012.
Stalder, R. and Neuser, R. D.: OH-defects in detrital quartz grains: potential for application as tool for provenance analysis and overview over crustal average, Sed. Geol., 294, 118–126, https://doi.org/10.1016/j.sedgeo.2013.05.013, 2013.
Stalder, R., Potrafke, A., Billström, K., Skogby, H., Meinhold, G., Gögele, C., and Berberich, T.: OH defects in quartz as monitor for igneous, metamorphic, and sedimentary processes, Am. Mineral., 102, 1832–1842, https://doi.org/10.2138/am-2017-6107, 2017.
Stalder, R., von Eynatten, H., Costamoling, J., Potrafke, A., Dunkl, I., and Meinhold, G.: OH in detrital quartz grains as tool for provenance analysis: case studies on various settings from Cambrian to Recent, Sed. Geol., 389, 121–126, https://doi.org/10.1016/j.sedgeo.2019.06.001, 2019.
Suzuki, S. and Nakashima, S.: In-situ IR measurements of OH species in quartz at high temperatures, Phys. Chem. Miner., 26, 217–225, https://doi.org/10.1007/s002690050180, 1999.
Tailby, N. D., Cherniak, D., and Watson, E. B.: Al diffusion in quartz, Am. Mineral., 103, 839–847, https://doi.org/10.2138/am-2018-5613, 2018.
Thamóné, B. E., Füri, J., Kovács, I. J., Biró, T., Király, E., Nagy, A., Törökné Sinka, M., Kónya, P., Mészárosné Turi, J., and Vígh, C.: Characteristics of quartz separates of different formations in Hungary from the aspect of OSL dating, Bull. Hung. Geol. Soc., 150, 61–80, https://doi.org/10.23928/foldt.kozl.2020.150.1.61, 2020 (in Hungarian with English abstract).
Thomas, S. M., Koch-Müller, M., Reichart, P., Rhede, D., Thomas, R., and Wirth, R.: IR calibrations for water determination in olivine, r-GeO2 and SiO2 polymorphs, Phys. Chem. Miner., 36, 489–509, https://doi.org/10.1007/s00269-009-0295-1, 2009.
Tollan, P., Ellis, B., Troch, J., and Neukampf, J.: Assessing magmatic volatile equilibria through FTIR spectroscopy of unexposed melt inclusions and their host quartz: a new technique and application to the Mesa Falls Tuff, Yellowstone, Contrib. Mineral. Petrol., 174, 24, https://doi.org/10.1007/s00410-019-1561-y, 2019.
Wedepohl, K. H.: The composition of the continental crust, Geochim. Cosmochim. Ac., 59, 1217–1232, https://doi.org/10.1016/0016-7037(95)00038-2, 1995.
Wenk, E.: Plagioklas als Indexmineral in den Zentralalpen. Die Paragenese Calcit – Plagioklas, Schweiz. Min. Petr. Mitt., 42, 139–152, 1962.
Winkler, H. G. F.: Synthese und Kristallstruktur des Eucryptits, Acta Cryst., 1, 27–34, 1948.
Yurimoto, H., Kurosawa, M., and Sueno, S.: Hydrogen analysis in quartz crystals and quartz glasses by secondary ion mass spectrometry, Geochim. Cosmochim. Ac., 53, 751–755, 1989.
Ziegler, P. A.: Geological Atlas of Western and Central Europe, Shell Internationale Petroleum Maatschappij B.V., The Hague, 239 pp., 1990.
- Abstract
- Introduction
- Brief history
- Dry and hydrous point defects in quartz
- Hydrous species in quartz
- Methods to characterise and quantify OH in quartz
- IR band assignment and their chemical correlation to metal impurities
- Thermodynamic modelling and ab initio calculations
- Influence of OH point defects on physical properties
- OH incorporation in quartz in experimental petrology
- OH in natural quartz from different origin
- Conclusions and implications
- Open problems and further research directions
- Data availability
- Competing interests
- Special issue statement
- Acknowledgements
- Review statement
- References