the Creative Commons Attribution 4.0 License.
the Creative Commons Attribution 4.0 License.
 | 15 Jan 2020
Characterization of recovery onset by subgrain and grain boundary migration in experimentally deformed polycrystalline olivine
Billy Clitton Nzogang
Manuel Thieme
Alexandre Mussi
Sylvie Demouchy
Patrick Cordier
To apprehend plate tectonics and the dynamics of the lithosphere–asthenosphere boundary, composed principally of olivine, we need to understand the mechanisms that control plastic deformation of olivine in the relevant temperature domain. After more than 50 years of laboratory studies and investigations on natural rocks, the interplay of several key parameters (e.g. temperature, pressure, vacancy concentration, dislocation densities, grain size, strain rate) controlling polycrystalline olivine plasticity remains difficult to assess. Here, we study four olivine polycrystals, which have been deformed in axial compression under a confining pressure of 300 MPa, at 1273 or 1473 K. Despite significant differences in mechanical properties (stress–strain curves), previous characterization by scanning (SEM) and transmission electron microscopy (TEM) did not reveal significant differences in dislocation microstructures which could explain these contrasted behaviours. We have undertaken automatic crystallographic orientation mapping (ACOM) analyses in TEM to increase the spatial resolution of characterization compared to previously obtained electron backscatter diffraction maps to further decipher the microstructures at nanoscale. With this novel technique applied to olivine, a noticeable difference in the onset of microstructural recovery has been identified between specimens deformed at 1273 and 1473 K. The microstructures of the olivine polycrystals deformed at 1473 K exhibit numerous curved grain and subgrain boundaries, advocating for recovery by boundary migration. In contrast, the microstructures of the olivine polycrystals deformed at 1273 K have significantly fewer subgrain boundaries and show more straight boundaries (i.e. closer to an equilibrium microstructure) than in the specimen deformed at 1473 K. Characterization by ACOM-TEM has permitted the identification of the onset of recovery, which is led by boundary migration even for very low macroscopic finite strains.
- Article
(39874 KB) - Full-text XML
- BibTeX
- EndNote


Olivine is the most abundant mineral phase in the Earth's upper mantle, representing 60 %–80 % in volume. It is the only mineral phase interconnected at centimetric and metric scales in peridotites. Thus, its rheological properties are expected to control the plastic deformation of the upper mantle, especially at the base of tectonic plates (i.e. lithosphere–asthenosphere boundary). As such an important mineral, its ductile deformation has been intensively studied by characterizing natural mantle specimens, from peridotite xenoliths or tectonic massifs (e.g. Avé Lallemant et al., 1970; Gueguen, 1979; Ben Ismail and Mainprice, 1998; Warren and Hirth, 2006; Le Roux et al., 2007, 2008; Drury and Pennock, 2007; Jung, 2009; Drury et al., 2011; Précigout and Hirth, 2014; Satsukawa and Michibayashi, 2014; Behr and Platt, 2014) and by laboratory deformation experiments at high pressure and high temperature on single crystals and polycrystals (e.g. Goetze, 1978; Bai and Kohlstedt, 1992; Hirth and Kohlstedt, 2003; Mainprice et al., 2005; Hanson and Spetzler, 1994; Demouchy et al., 2009, 2013, 2014; Thieme et al., 2018). The primary aim of deformation experiments was to provide generic (semi-empirical) flow laws, which can be extrapolated to mantle strain rates (10−13–10−15 s−1) and temperatures (773–1673 K). Over the last five decades, laboratory experiments and numerical models have provided a variety of flow laws (e.g. Mei and Kohlstedt, 2000a, b; Hirth and Kohlstedt, 2003; Tielke et al., 2017; Boioli et al., 2015a, b; Gouriet et al., 2019), which can be used to estimate the stress level in the mantle asthenosphere in both the diffusion creep and the dislocation creep regimes. For the asthenospheric mantle, deformation experiments at high temperatures (>1473 K) permit one to reach steady-state flow easily for a small amount of finite strain during creep tests (<1 %; e.g. Zimmerman and Kohlstedt, 2004). As in metals, and in coarse-grain samples or single crystals, development of strain hardening is commonly related to the developed of dislocation entanglements (the so-called forest hardening; e.g. Hanson and Spetzler, 1994; Gaboriaud et al., 1981). Dislocations microstructures can be characterized by transmission electron microscopy (TEM) or by scanning electron microscopy (SEM) after dislocation decoration by heat treatment (e.g. Kohlstedt, 1976). For fine-grained olivine specimens (a few micrometres), intragranular dislocation activity was proposed to be supplanted by grain boundary sliding (e.g. based on creep test; see Hansen et al., 2011, Ree, 1994, or Landgon, 2006, for a review on grain boundary sliding). Yet, this issue is still under debate as its applicability to upper mantle remains very specific (e.g. Platt and Behr, 2011; Bollinger et al., 2019b; Gasc et al., 2019).
Table 1Experimental deformation conditions and key parameters from EBSD maps reported from Thieme et al. (2018). T stands for temperature; the confining pressure was 300 MPa of Ar for each experiment. Stress is the differential stress.
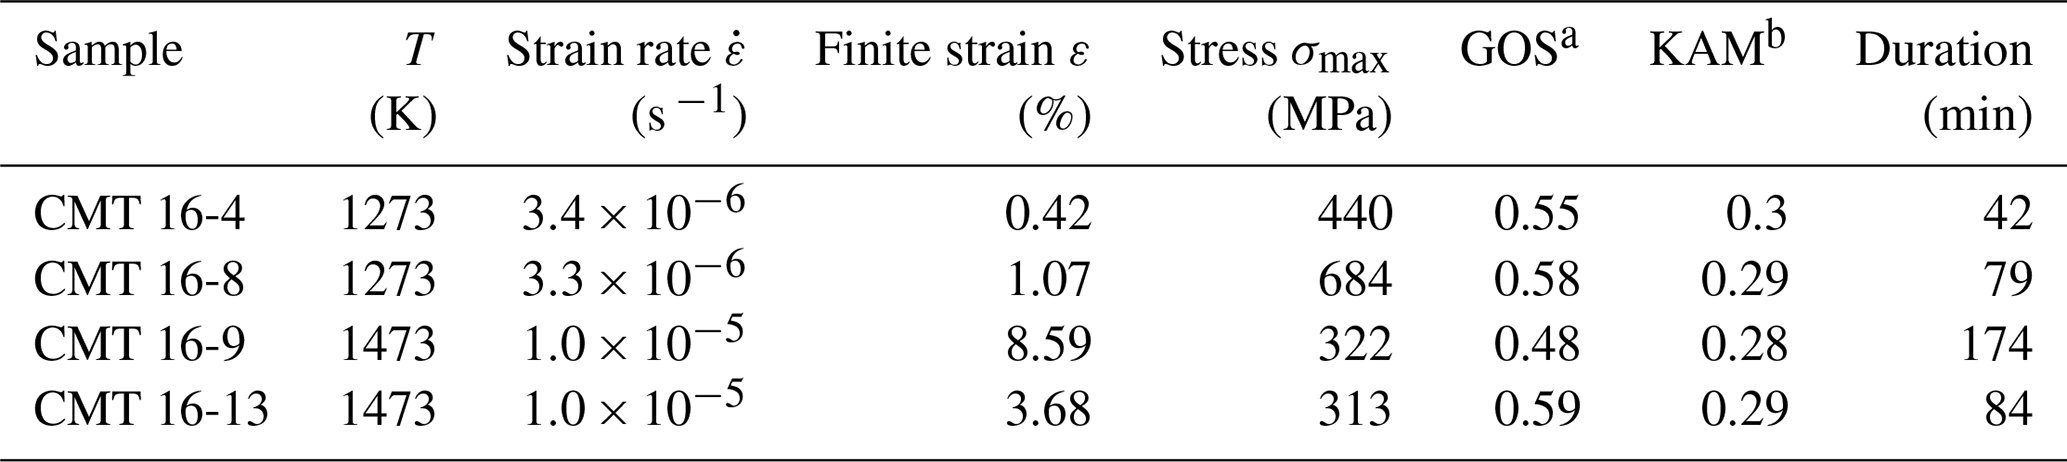
a The grain orientation spread (GOS) is the average deviation in orientation between each point in a grain and the average orientation of the respective grain. b Geometric mean of the log-normal distribution of the kernel average misorientation (proxy for density of geometrically necessary dislocations), 2nd order, threshold of 5∘.
However, for the lithospheric mantle, the experiments are facing a challenge as stresses obtained in deformation experiments below 1073 K and at laboratory strain rates (e.g. 10−5 s−1) do not reach steady state and consequently render extrapolation to natural strain rates rather imprecise (e.g. lower bound for stresses only; see Demouchy et al., 2013, and Tielke et al., 2017, for discussion). In addition, microstructural investigations confirm that the active slip systems at low and high temperatures are different (e.g. Raleigh, 1968; Phakey et al., 1972; Demouchy et al., 2009, 2013, 2014), with a high variety of glide planes for [001] dislocations in olivine (Demouchy et al., 2013; Mussi et al., 2014, 2017).
To investigate the plastic behaviour of olivine at lithospheric temperatures (773–1173 K), where steady state cannot be reached experimentally, an alternative approach is to use dislocation interactions identified in experimentally deformed samples in glide and/or climb configurations at the microscopic scale to implement specific rules into 2.5-dimension dislocation dynamics models (e.g. Boioli et al., 2015a, b; Gouriet et al., 2019). With such numerical models, deformation of crystalline solids at the slow strain rates relevant for natural conditions can be reproduced (10−13–10−15 s−1 and for a large temperature range). However so far, 2.5-D models can only be applied to single crystals (e.g. Boioli et al., 2015b; Gouriet et al., 2019). Recently, another attempt to extract flow law from deformation experiments at high stress (2.7–5.3 GPa) and low temperature (298–873 K) was made by Hansen et al. (2019), using a phenomenological approach and based on dislocation activity; however, no microstructural characterization was provided.
In a further attempt at constraining how polycrystalline olivine plastically deforms at lithospheric mantle temperatures, Thieme et al. (2018) reported the results of deformation of very fine-grained iron-bearing polycrystalline olivine at two temperatures (1273 and 1473 K) for small finite strains. This study has yielded very contrasted results at 1273 and 1473 K. At 1273 K a strong hardening is observed. This is not the case at 1473 K where deformation curves show a quasi-steady-state mechanical behaviour. The microstructural investigation, based on electron backscatter diffraction (EBSD) and transmission electron microscopy (TEM), could not identify the origin for this difference in behaviour. Statistical parameters, such as grain orientation spread (GOS) and kernel average misorientation (KAM), which are considered suitable proxies for geometrically necessary dislocation (GND) density (e.g. Wallis et al., 2016), did not reveal significant variations (see Fig. 4 and Table 2 in Thieme et al., 2018, and Table 1 here). This difficulty is probably related to the small finite strains involved. Indeed, TEM investigation showed large heterogeneities and, even at 1473 K, multiple olivine grains remained free of dislocations. These observations question the transferability of the standard description of strain hardening established in metals at high temperature (i.e. increase in dislocation density and dislocations–forest interactions; Evans and Goetze, 1979) to olivine deformed at low strains (<3 %) and far from its melting temperature (e.g. transient creep at 1273–1473 K relative to melting temperature for Fo90 ≃1973 K). Since the dislocation microstructures observed by Thieme et al. (2018) were not significantly modified with increasing stress or finite strain, we propose here to change the scale of observation, as compared to previous studies on plastically deformed polycrystalline olivine (e.g. Demouchy et al., 2013, 2014; Thieme et al., 2018) and to investigate the structure and behaviour of (sub)grain boundaries which can contribute to recovery. Here recovery is used as a collective term for all processes which restore the microstructure after plastic deformation (e.g. annihilation and rearrangement of dislocations) but also subgrain growth, grain boundary migration, etc. The release of stored energy provides the driving force for recovery although the nature of the microstructure (including grain boundaries) is the controlling mechanisms.
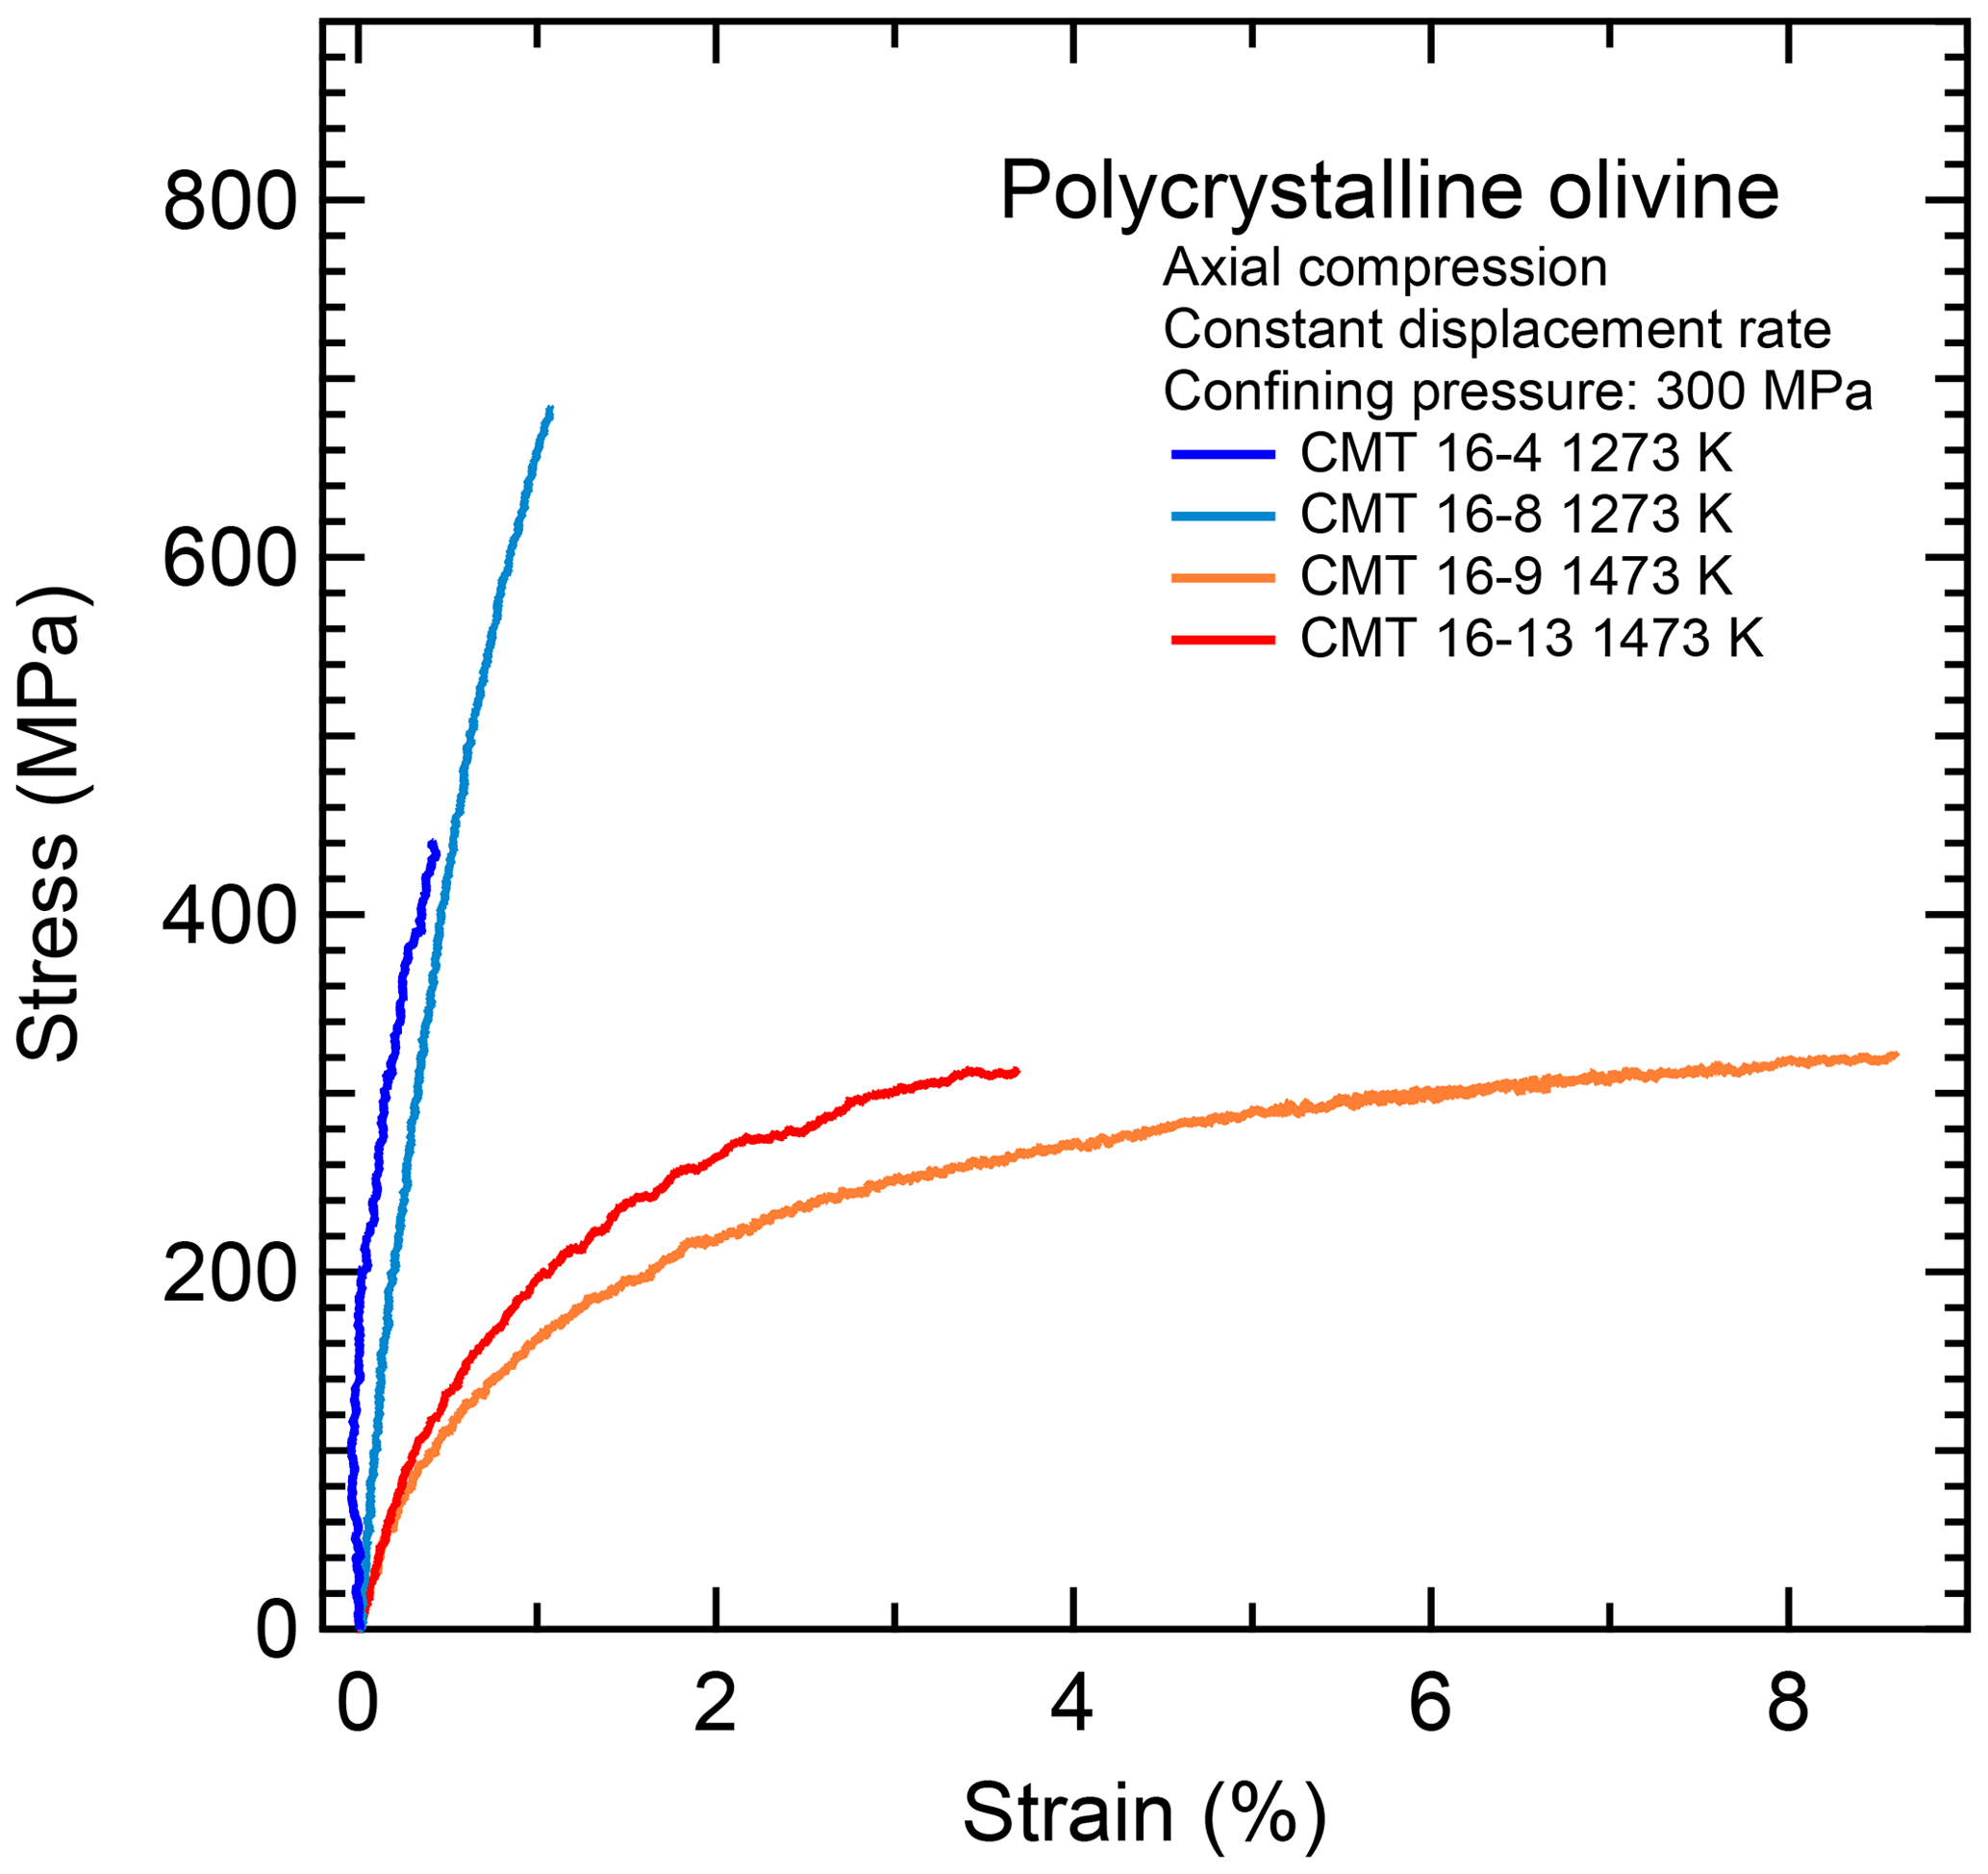
Figure 1Differential stress versus strain curves for the four deformation experiments in axial compression (Thieme et al., 2018) investigated in this study.

Figure 2Morphology of the grains and grain boundaries in CMT16-13 deformed at 1473 K. (a) Inverse pole figure (IPF) corresponding to the direction normal to the figure superimposed with the indexation quality (IQ; see Eq. 1 and main text for details). The colour code refers to Pnma (b) Mis2Mean distribution, from 0 to 15∘. (c) KAM distribution (3rd neighbours), from 0 to 2∘.
In this study, we use automatic crystallographic orientation mapping in transmission electron microscopy (ACOM-TEM) on experimentally deformed polycrystalline olivine to identify the differential activity of grain-boundary processes during plastic deformation.
The samples analysed here were already described (Thieme et al., 2018). We recall briefly the experimental conditions and the main results of the mechanical data and microstructure characterization below. From the study of Thieme et al. (2018), we have selected four fine-grained polycrystalline olivine samples (CMT16-4, CMT16-8, CMT16-9, and CMT16-13) deformed in axial compression at constant displacement rates (Table 1) with small finite strains (below 9 %) under identical confining pressure (300 MPa of Ar), but at different temperatures (1273 K for CMT16-4 and CMT16-8 and 1473 K for CMT16-9 and CMT16-13). The polycrystalline samples were prepared from the same fine-grained powder of San Carlos olivine (Arizona, USA), with an initial grain size of 1.8–2 µm. The polycrystalline powder was first cold pressed (2–20 MPa), then hot pressed for 3 h at 1473 K and 300 MPa of confining pressure to reduce the porosity to less than 3 % (see also Thieme et al., 2018). The hot-press step was directly followed by axial compression when the targeted temperature was reached for deformation at 1473 K. For deformation at 1273 K (i.e. temperature lower than the hot press) the temperature was decreased at a rate of 6.5 K min−1 and then kept constant at 1273 K for at least 30 min to ensure satisfying stability of the temperature distribution along the samples prior to axial compression. Additional technical details are given in Thieme et al. (2018). The deformation experiments were performed using a high-pressure, high-temperature deformation apparatus (Paterson, 1990). Deformation conditions are summarized in Table 1. Although the samples were deformed at the same constant displacement rate, CMT 16-4 and CMT 16-8 did not reach steady state (i.e. finite strain 1 %). Indeed, the strain must be corrected for the ongoing elastic deformation of the vessel (stiffness of 82.5 kN mm−1) and elasticity of the olivine (Young modulus E=152 GPa at 1273 K and 146 GPa at 1473 K, Liu et al., 2005) since they accommodate part of the imposed displacement rate, resulting in different (slower) strain rates than for quasi-steady-state experiments (i.e. CMT-16-8 and CMT 16-13).
As expected from the low finite strain for the four deformation experiments, the mechanical curves displayed in Fig. 1 indicate that steady state was not reached, even for the two samples deformed at 1473 K: CMT16-13 and CMT16-9. For these samples, the total finite strain is different (3.68 % and 8.59 % respectively), but the maximum stresses are comparable (313 and 322 MPa respectively) and slightly above the confining pressure. At 1273 K, deformation experiments have been interrupted in a strong hardening regime at 0.42 % for sample CMT16-4 and 1.07 % for CMT16-8. The corresponding stresses are 440 and 684 MPa respectively, well above the confining pressure of 300 MPa. The difference in stresses between the two pairs of experiments is very high (> factor of 1.5) and was expected to induce markedly different microstructures. The first round of microstructural characterization by scanning electron microscopy (SEM) and EBSD, at the scale of the sample sections (large maps of ≈20 000 µm2 and small maps ≈2400 µm2), led to the following results: there are no significant differences in grain size (1.6±0.2 µm), aspect ratio (1.5±0.4), internal misorientation from mean orientation (Mis2Mean), grain orientation spread (GOS, 0.58–0.59∘), and kernel average misorientation (KAM) between the samples. The KAM parameter is considered as a proxy for dislocation density (at least for GNDs; see Pantleon, 2008; Wheeler et al., 2009; Wallis et al., 2016), and values reported by Thieme et al. (2018, between 0.28 and 0.3, Table 1) thus indicate that the dislocation density is not observed to increase with the apparent strain hardening.
After deformation, doubly-polished thin sections (∼30 µm thick) parallel to the deformation axis were prepared. The sections were glued on a grid (Cu or Mo) and ion milled at 5 kV under a low beam angle of 15∘ with a Gatan® DuoMill™ model 600 until electron transparency was reached. The foils were subsequently covered with a thin layer of carbon. The TEM observations were carried out at the University of Lille (France) using an FEI® Tecnai G2-20 twin microscope operating at 200 kV and a Philips CM30 microscope operating at 300 kV, both equipped with a LaB6 filament and using a double-tilt sample holder.
Conventional TEM investigations had been performed previously (Thieme et al., 2018) and had reported, in the four samples, a heterogeneous distribution of dislocations, with some olivine grains containing a high density of dislocations (e.g. 7×10¹³ m−2 in CMT16-9), and other grains free of defects. Also, TEM images did not report the formation of more dislocation entanglements (as an indicator of forest hardening) in the high-stress sample (CMT16-8), as compared to the low-stress samples.
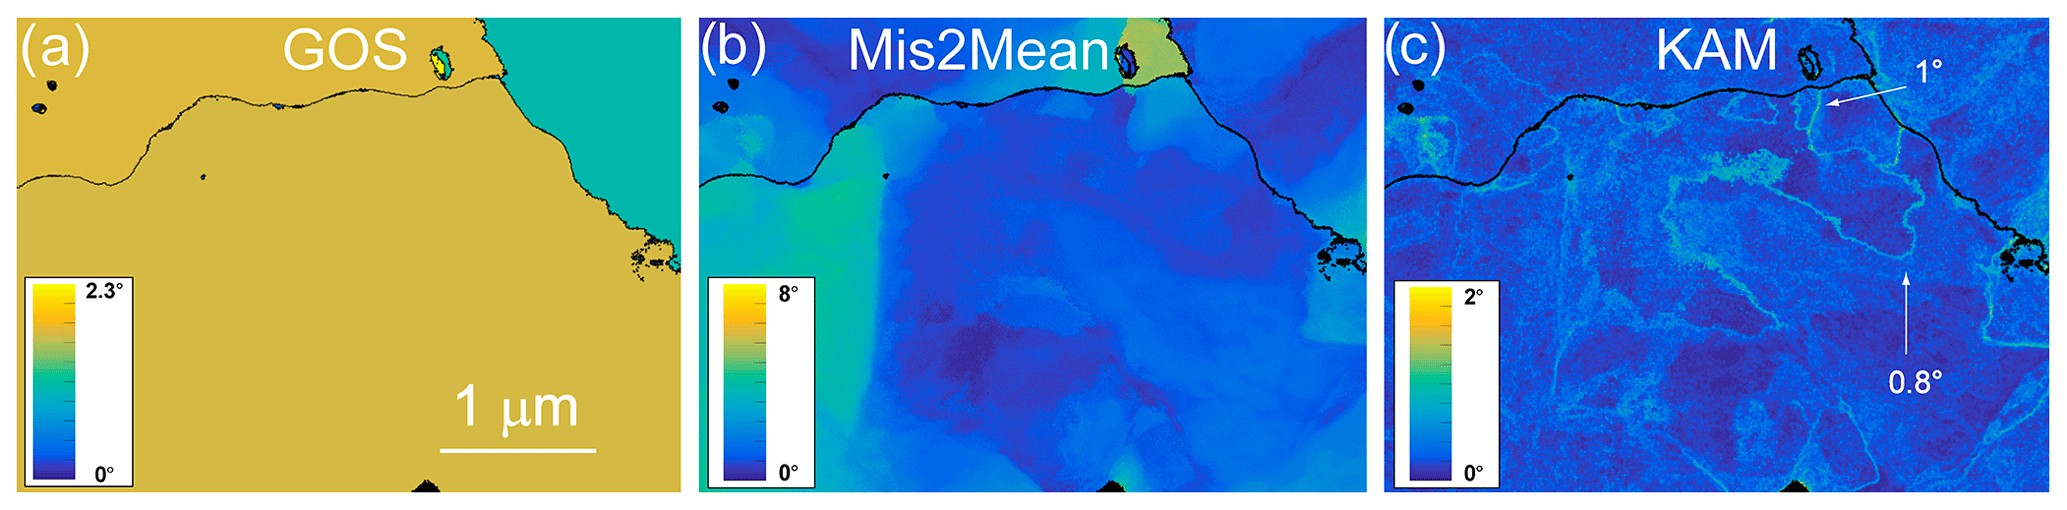
Figure 3Morphology of the grains and grain boundaries in CMT16-13 deformed at 1473 K. (a) GOS distribution; (b) Mis2Mean distribution, from 0 to 8∘; (c) KAM distribution (3rd neighbours), from 0 to 2∘.
In the present study, ACOM-TEM was operated in the TEM with the ASTAR™ tool from NanoMEGAS (Rauch and Véron, 2014) to improve the spatial resolution of characterization. The TEM was set in micro-beam mode with a nominal spot size ∼6 nm without precession, thus better than the 70 nm achieved in Thieme et al. (2018) and the 250 nm in Wallis et al. (2016). Here, the incident electron beam, which was focused on the sample, was scanned over the area with a step size of 6 nm, thanks to a dedicated hardware control system of the TEM deflecting coils. In this mode, where a convergent beam illuminates the sample, the diffraction pattern consists of discs. Using the smallest condenser aperture (50 µm) the diffraction patterns are made of very small spot-like discs and can be indexed as spot patterns. The individual exposure time at each location was 10 ms. In this study, we used precession illumination (with a precession angle of 0.5∘) in the TEM, which allows many more reflections to be seen in the diffraction pattern with intensities closer to the kinematical diffraction conditions. Diffraction patterns were collected with an external Stingray CCD camera directed toward the TEM phosphorous screen and are stored in the computer memory for further indexation and post-processing. The diffraction patterns were collected as 144×144 pixels at a camera length of 89 mm. This distance was chosen to optimize the diffraction pattern for indexation. Using the ASTAR™ software, electron diffraction spot patterns were indexed (providing the local crystal orientations) by comparing individually obtained patterns via cross-correlation matching techniques with pre-calculated electron diffraction templates which are generated every 0.5∘ (orientation resolution). For iron-bearing olivine, templates have been generated from the crystallographic data of Birle et al. (1968) for forsterite. From this indexation within the Pnma space group, one obtains crystallographic orientation maps, which display, with a colour-coding, the most probable orientation at each scanned beam position.
The indexation quality (IQ) of the ACOM-TEM images is calculated from template matching and is quantified by the following image correlation index (Rauch and Dupuy, 2005):
In Eq. (1), the diffraction pattern is represented by the intensity function P(x,y) and every template i is described by the function Ti(x,y). The highest IQ value corresponds to the retained solution. The reliability of this solution can be quantified by the ratio of the matching indexes for the two best solutions IQ1 and IQ2:
In reliability maps, the brighter the pixel (i.e. the higher the reliability index), the more reliable the proposed indexation is. On the contrary, darker pixels correspond to less reliable solutions. The latter is typically the case at grain boundaries where two solutions of co-existing grains overlap.
The datasets were processed with MTEX (free and open-source MATLAB™ Toolbox from Bachmann et al., 2011). Grain boundaries were identified where the misorientation to the next pixel is higher than 15∘ (Bachmann et al., 2011). Groups of pixels below a size of 10 points have been ignored.
Note that the orientation dataset was a square-shaped grid for ASTAR, and has been converted to a Channel5 file (i.e. .ctf file) for usage in MTEX. To be able to detect deformation details in the microstructures, one must use other tools than only the inverse pole figure colour-coding. In this study, we use the orientation maps to calculate local misorientations as recently developed in the EBSD community (e.g. Wright et al., 2011). As commonly used in EBSD, several quantities can be calculated from the orientation maps:
-
The kernel average misorientation (KAM) calculates the average misorientation between a pixel and its neighbours, provided that the misorientation does not exceed a predefined threshold value (e.g. 5∘); thus the incorporation of well-defined grain boundaries is avoided. If plastic deformation results from dislocation glide and crystal-lattice rotation, this approach allows quantitative evaluation of the local plastic strain gradients (Godfrey et al., 2005) and provides a proxy for GND density (e.g. Pantleon, 2008; Wheeler et al., 2009; Wallis et al., 2016). A kernel is a set of points of prescribed size surrounding the scan point of interest. The size of the kernel is generally prescribed to the nth nearest neighbours. Hence this parameter is sensitive to the step size of the measurement grid and can be adjusted by the user as well. All KAM maps presented in this study were calculated with a fixed kernel to the 3rd neighbours.
-
The grain orientation spread (GOS) is the average deviation in orientation between each point in a grain and the average orientation of the grain. This approach leads to assigning the same value of the GOS to every scan point contained within a grain.
-
The grain reference orientation deviation (GROD) is based on the misorientation between a reference point of the considered grain and the other points. The reference point can be the point of the grain where the KAM is the lowest or the mean orientation of the considered grain. For the latter specific case, the GROD is called the “Mis2Mean”. As for the GOS values, the Mis2Mean values depend not only on the plastic strain, but also on the mapped grain area fraction. Here, since at the TEM scale many grains are not entirely mapped, the Mis2Mean value should be regarded as a semi-quantitative tool only. The KAM, GROD, and GOS approaches provide complementary information.
The ACOM areas mapped here are much smaller than previous maps obtained by Thieme et al. (2018) with SEM-EBSD. Thus, we focus on the morphologies of the grain and their boundaries, and on the intragranular microstructures instead of a statistical approach. Indeed, from orientation maps shown in Fig. 2a, the morphologies of the grain boundaries are defined at a higher spatial resolution than in conventional EBSD-SEM and are more easily identified than in conventional TEM, where images are impacted by the very strong superimposed diffraction contrasts (see TEM images in subsequent figure panels). On the ACOM maps, slight colour variations are indicative of misorientations within grains, which are quantified by the GROD.

Figure 4Morphology of the grains and grain boundaries in CMT16-13 deformed at 1473 K. (a) GOS map (b) Mis2Mean map, from 0 to 15∘. (c) KAM map (3rd neighbours), from 0 to 2∘. GROD and KAM maps permit the identification of numerous subgrain boundaries; the misorientation of some of them is indicated.
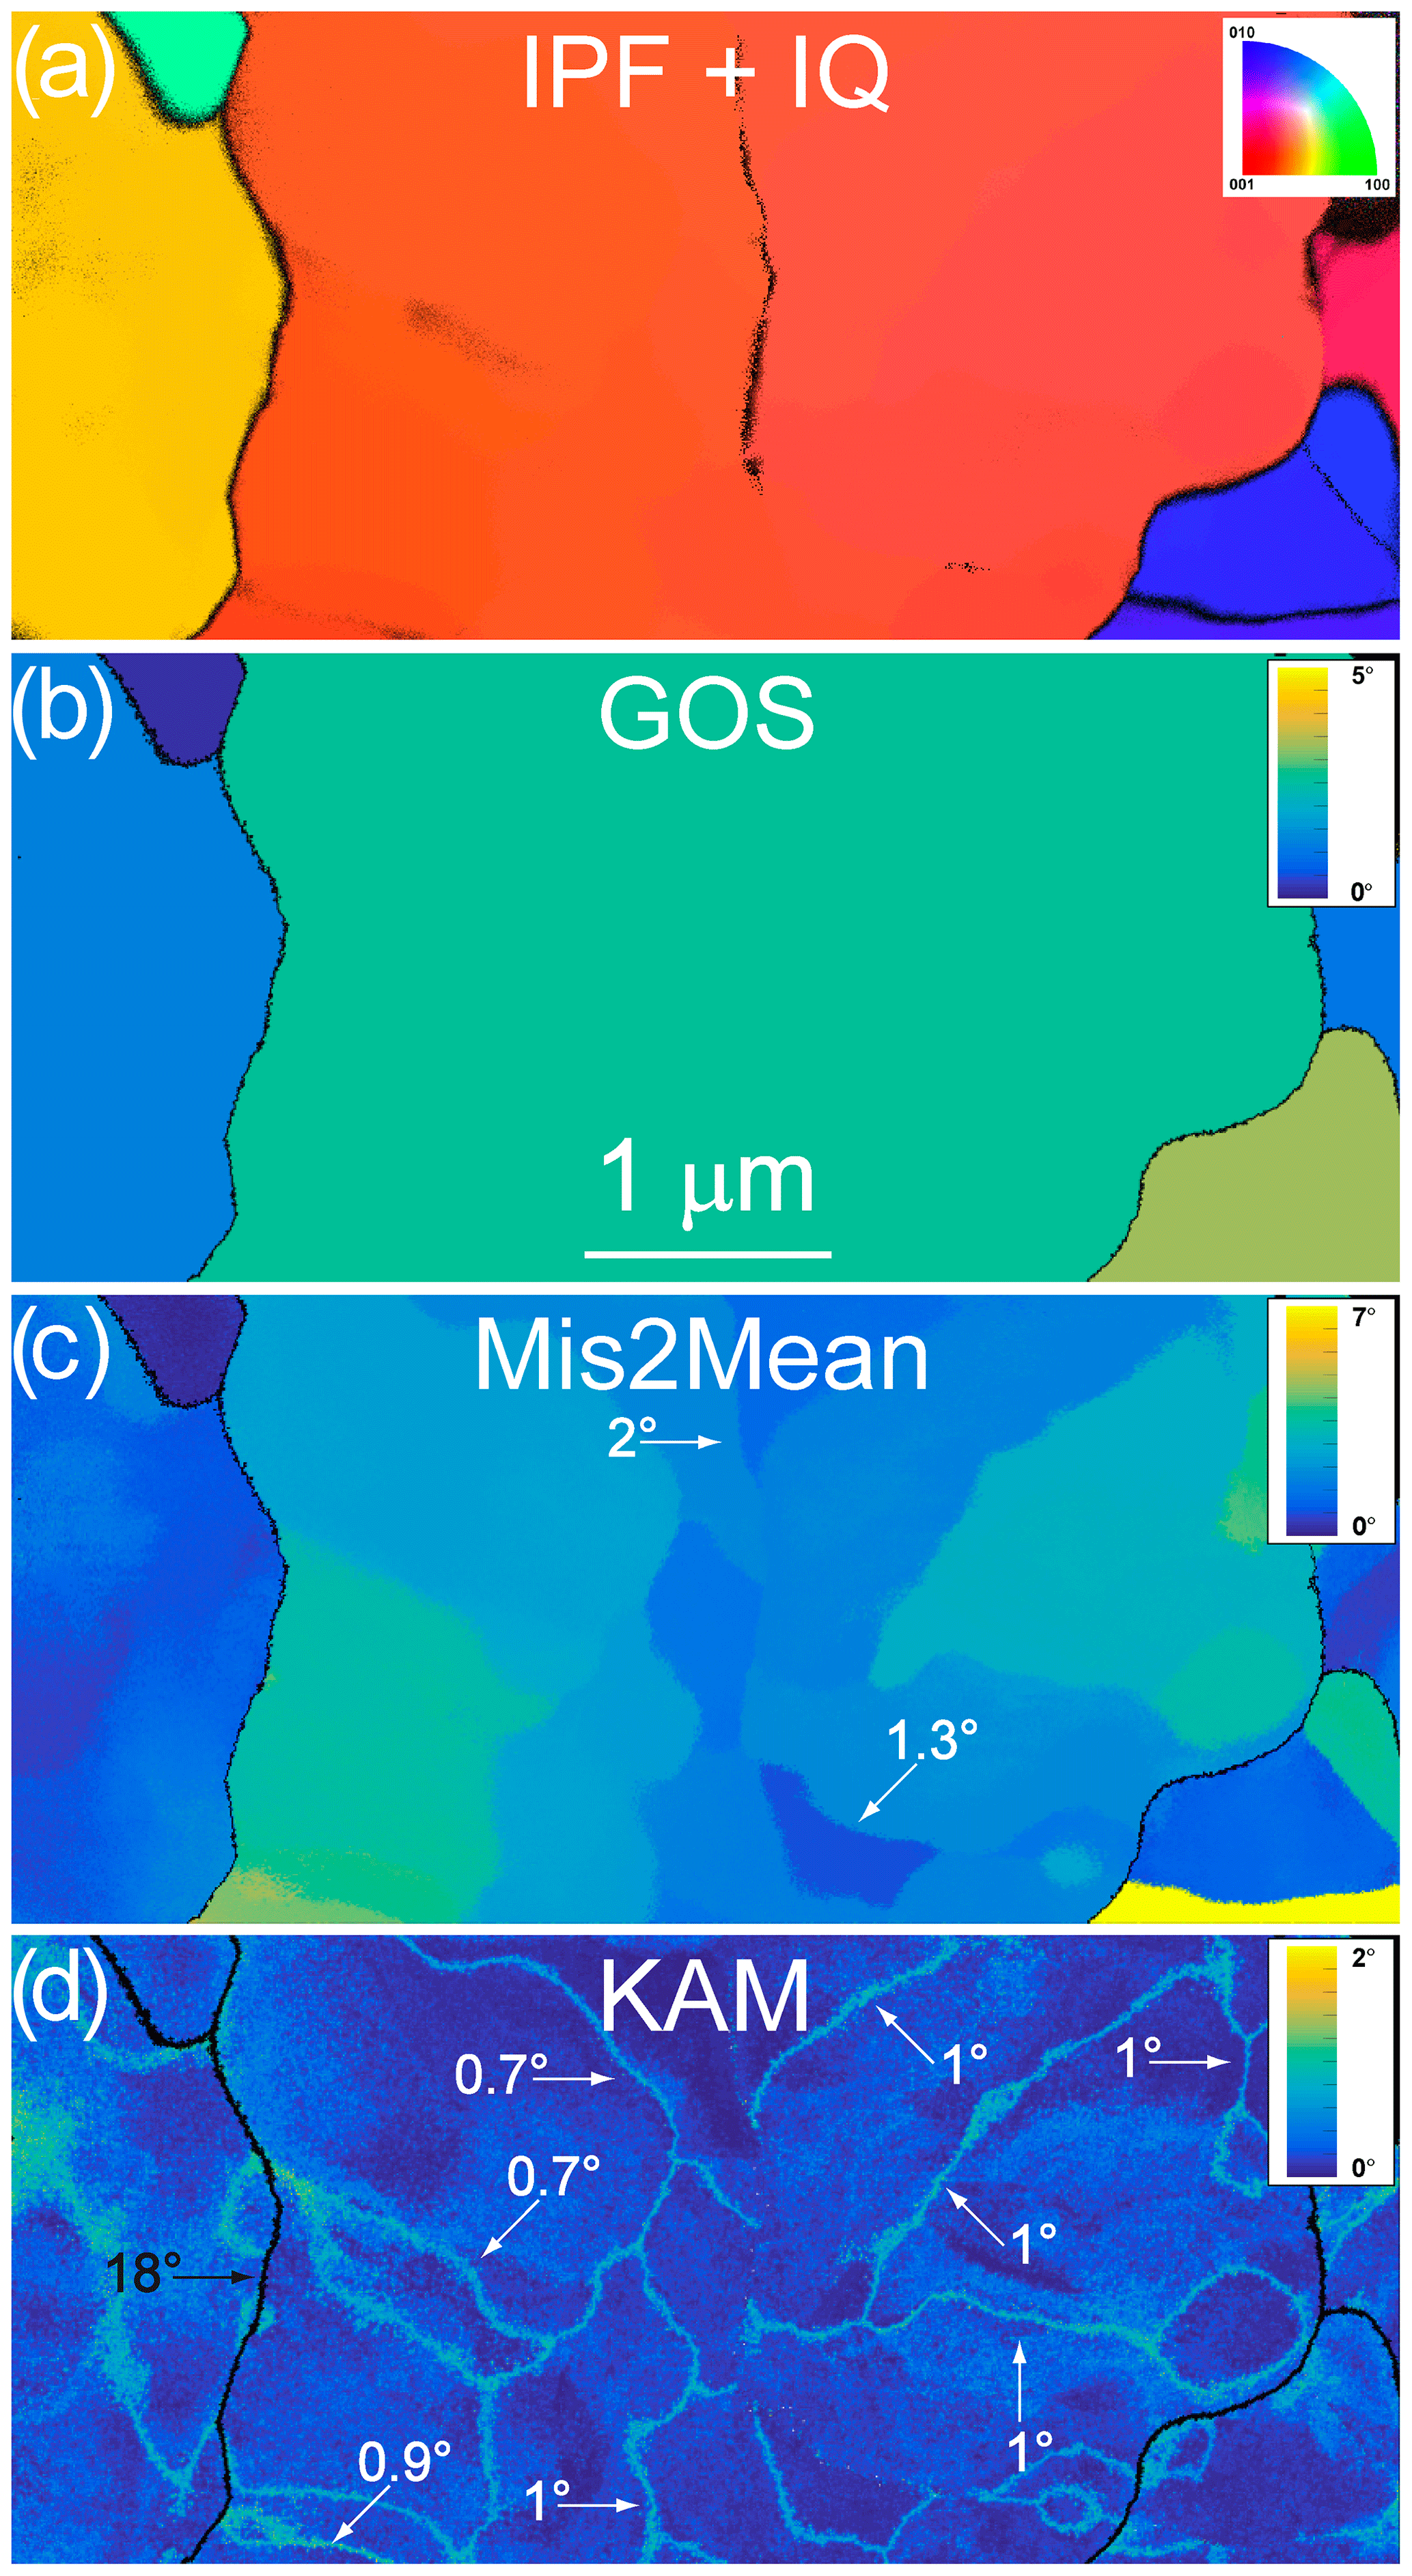
Figure 5Morphology of the grains and grain boundaries in CMT16-13 deformed at 1473 K. (a) Inverse pole figure (IPF) corresponding to the direction normal to the figure, superimposed with the indexation quality (IQ; see Eq. 1 and main text). (b) GOS map (c) Mis2Mean map, from 0 to 7∘. (d) KAM map (3rd neighbours), from 0 to 2∘. GROD and KAM maps permit the identification of numerous subgrain boundaries; the misorientation of some of them is indicated.

Figure 6Morphology of the grains and grain boundaries in CMT16-9 deformed at 1473 K. (a) Conventional multi-beam TEM bright field. (b) Inverse pole figure (IPF) corresponding to the direction normal to the figure, superimposed with the indexation quality (IQ; see Eq. 1 and main text). (c) GOS map (d) Mis2Mean map, from 0 to 10∘. (c) KAM map (3rd neighbours), from 0 to 2∘. Mis2Mean and KAM maps are consistent in indicating stored elastic energy where dislocation density is larger.
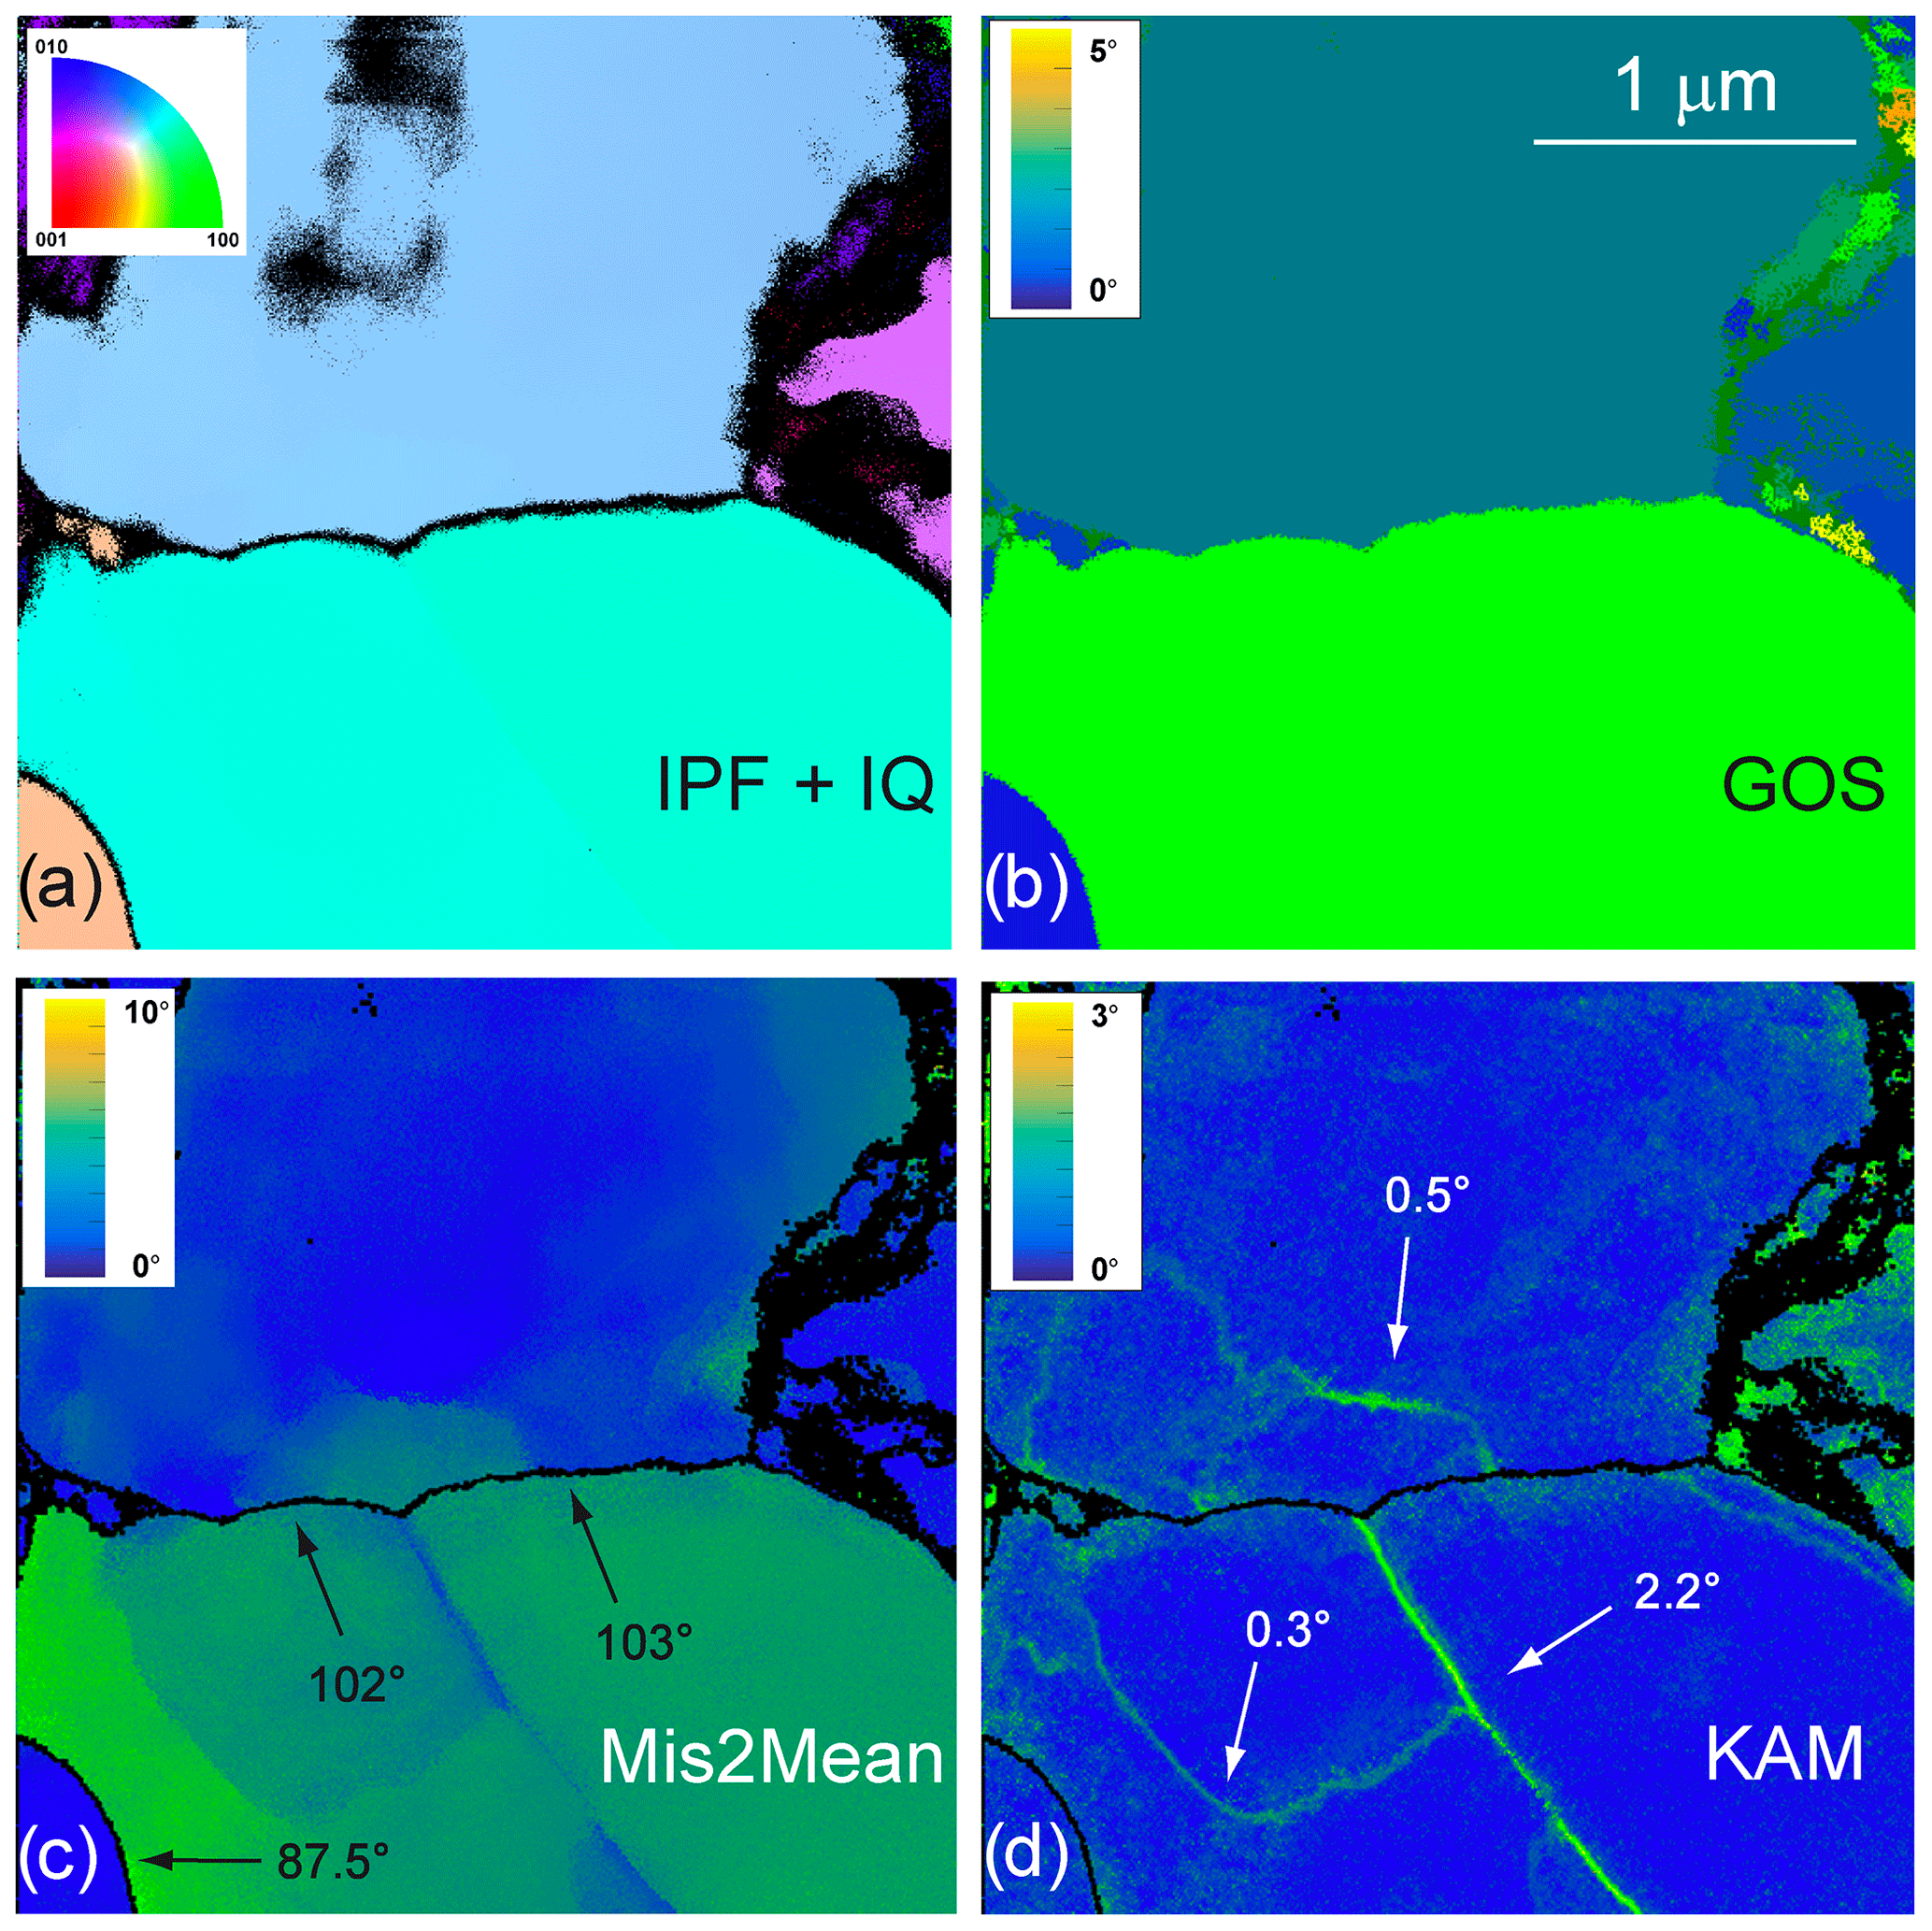
Figure 7Morphology of the grains and grain boundaries in CMT16-9 deformed at 1473 K. (a) Inverse pole figure (IPF) corresponding to the direction normal to the figure, superimposed with the indexation quality (IQ; see Eq. 1 and main text). (b) GOS map (c) Mis2Mean map, from 0 to 10∘. (d) KAM map (3rd neighbours), from 0 to 3∘. The pinning effect of the 2.2∘ subgrain boundary on the 102–103∘ grain boundary is clearly visible.
3.1 Microstructures at high temperature (1473 K)
A representative selection of ACOM images from samples CMT16-13 and CMT16-9 deformed at 1473 K are shown in Figs. 2 to 7. The inverse pole figure (IPF) orientation maps and GOS maps in Figs. 2a, 3a, 4a, 5a, b, 6b, c, 7a and b show that, in these samples, the grain boundaries are strongly curved, even in case of small grains (Fig. 2a, the pink grain). Radii of curvature can be locally of the order of only a few tens of nanometres. The merit of ACOM-TEM is also to go beyond the statistical average per grain value of the GOS and to map intragranular misorientation at higher spatial resolution than EBSD (see Fig. 3 in Thieme et al., 2018, for a comparison). In Figs. 3, 4, and 5, grain division into multiple crystallographic domains is visible. Misorientation profiles across these domain boundaries (highlighted in the Mis2Mean and the KAM maps) confirm their subgrain-boundary character and permit the quantification of their individual misorientations. Examples of angular determinations are reported directly in Figs. 2b, 3c, 4b, 4c, 5c, d, 6d, e, 7c and d. The horizontal black arrow in Fig. 6 indicates bulging of the 95∘ grain boundary, which is associated with a differential dislocation density across the boundary (visible on the bright-field image and leading consistently to the highest Mis2Mean contrast). In Fig. 7, a horizontal 102–103∘ grain boundary appears to be pinned by a 2.2∘ subgrain boundary.
3.2 Microstructures at low temperature (1273 K)
Representative orientation maps gathered on samples deformed at the lowest temperature (samples CMT16-4 and CMT16-8) are presented in Figs. 8 to 11. The grain boundaries are significantly less sinuous/curved than at high temperature; more importantly, the interior of the grains show less misoriented domains and subgrain boundary development, as demonstrated by GOS maps in Figs. 8b, 9b, 10b and 11b and Mis2Mean maps in Figs. 8c, 9c, 10c and 11c. The maps show a very different morphology than at high temperature, with high heterogeneity of dislocation activity, even if very locally one can also find some evidence of curved subgrain boundaries in samples deformed at 1273 K (Fig. 12a, c, d). Also in Fig. 12, the 46∘ grain boundary is not fully straight; indeed, the KAM map in Fig. 12d shows a difference of intensity across the boundary and hence a difference of stored strain energy, which can act as a driving force for boundary migration. It is interesting to note in Fig. 8 a quadruple junction, with a void, which could be indicative of damage due to grain boundary sliding (Ashby and Verrall, 1973). Nevertheless, it is difficult to draw firm conclusions from a single observation. Still, as an ensemble, the high-temperature and low-temperature microstructures are different. In sample CMT16-8, one can even find microstructures matching the formation of neograins. For example, two bulges are identified in Fig. 13, which are associated with misoriented domains terminated by a subgrain boundary (see the misorientation profiles).
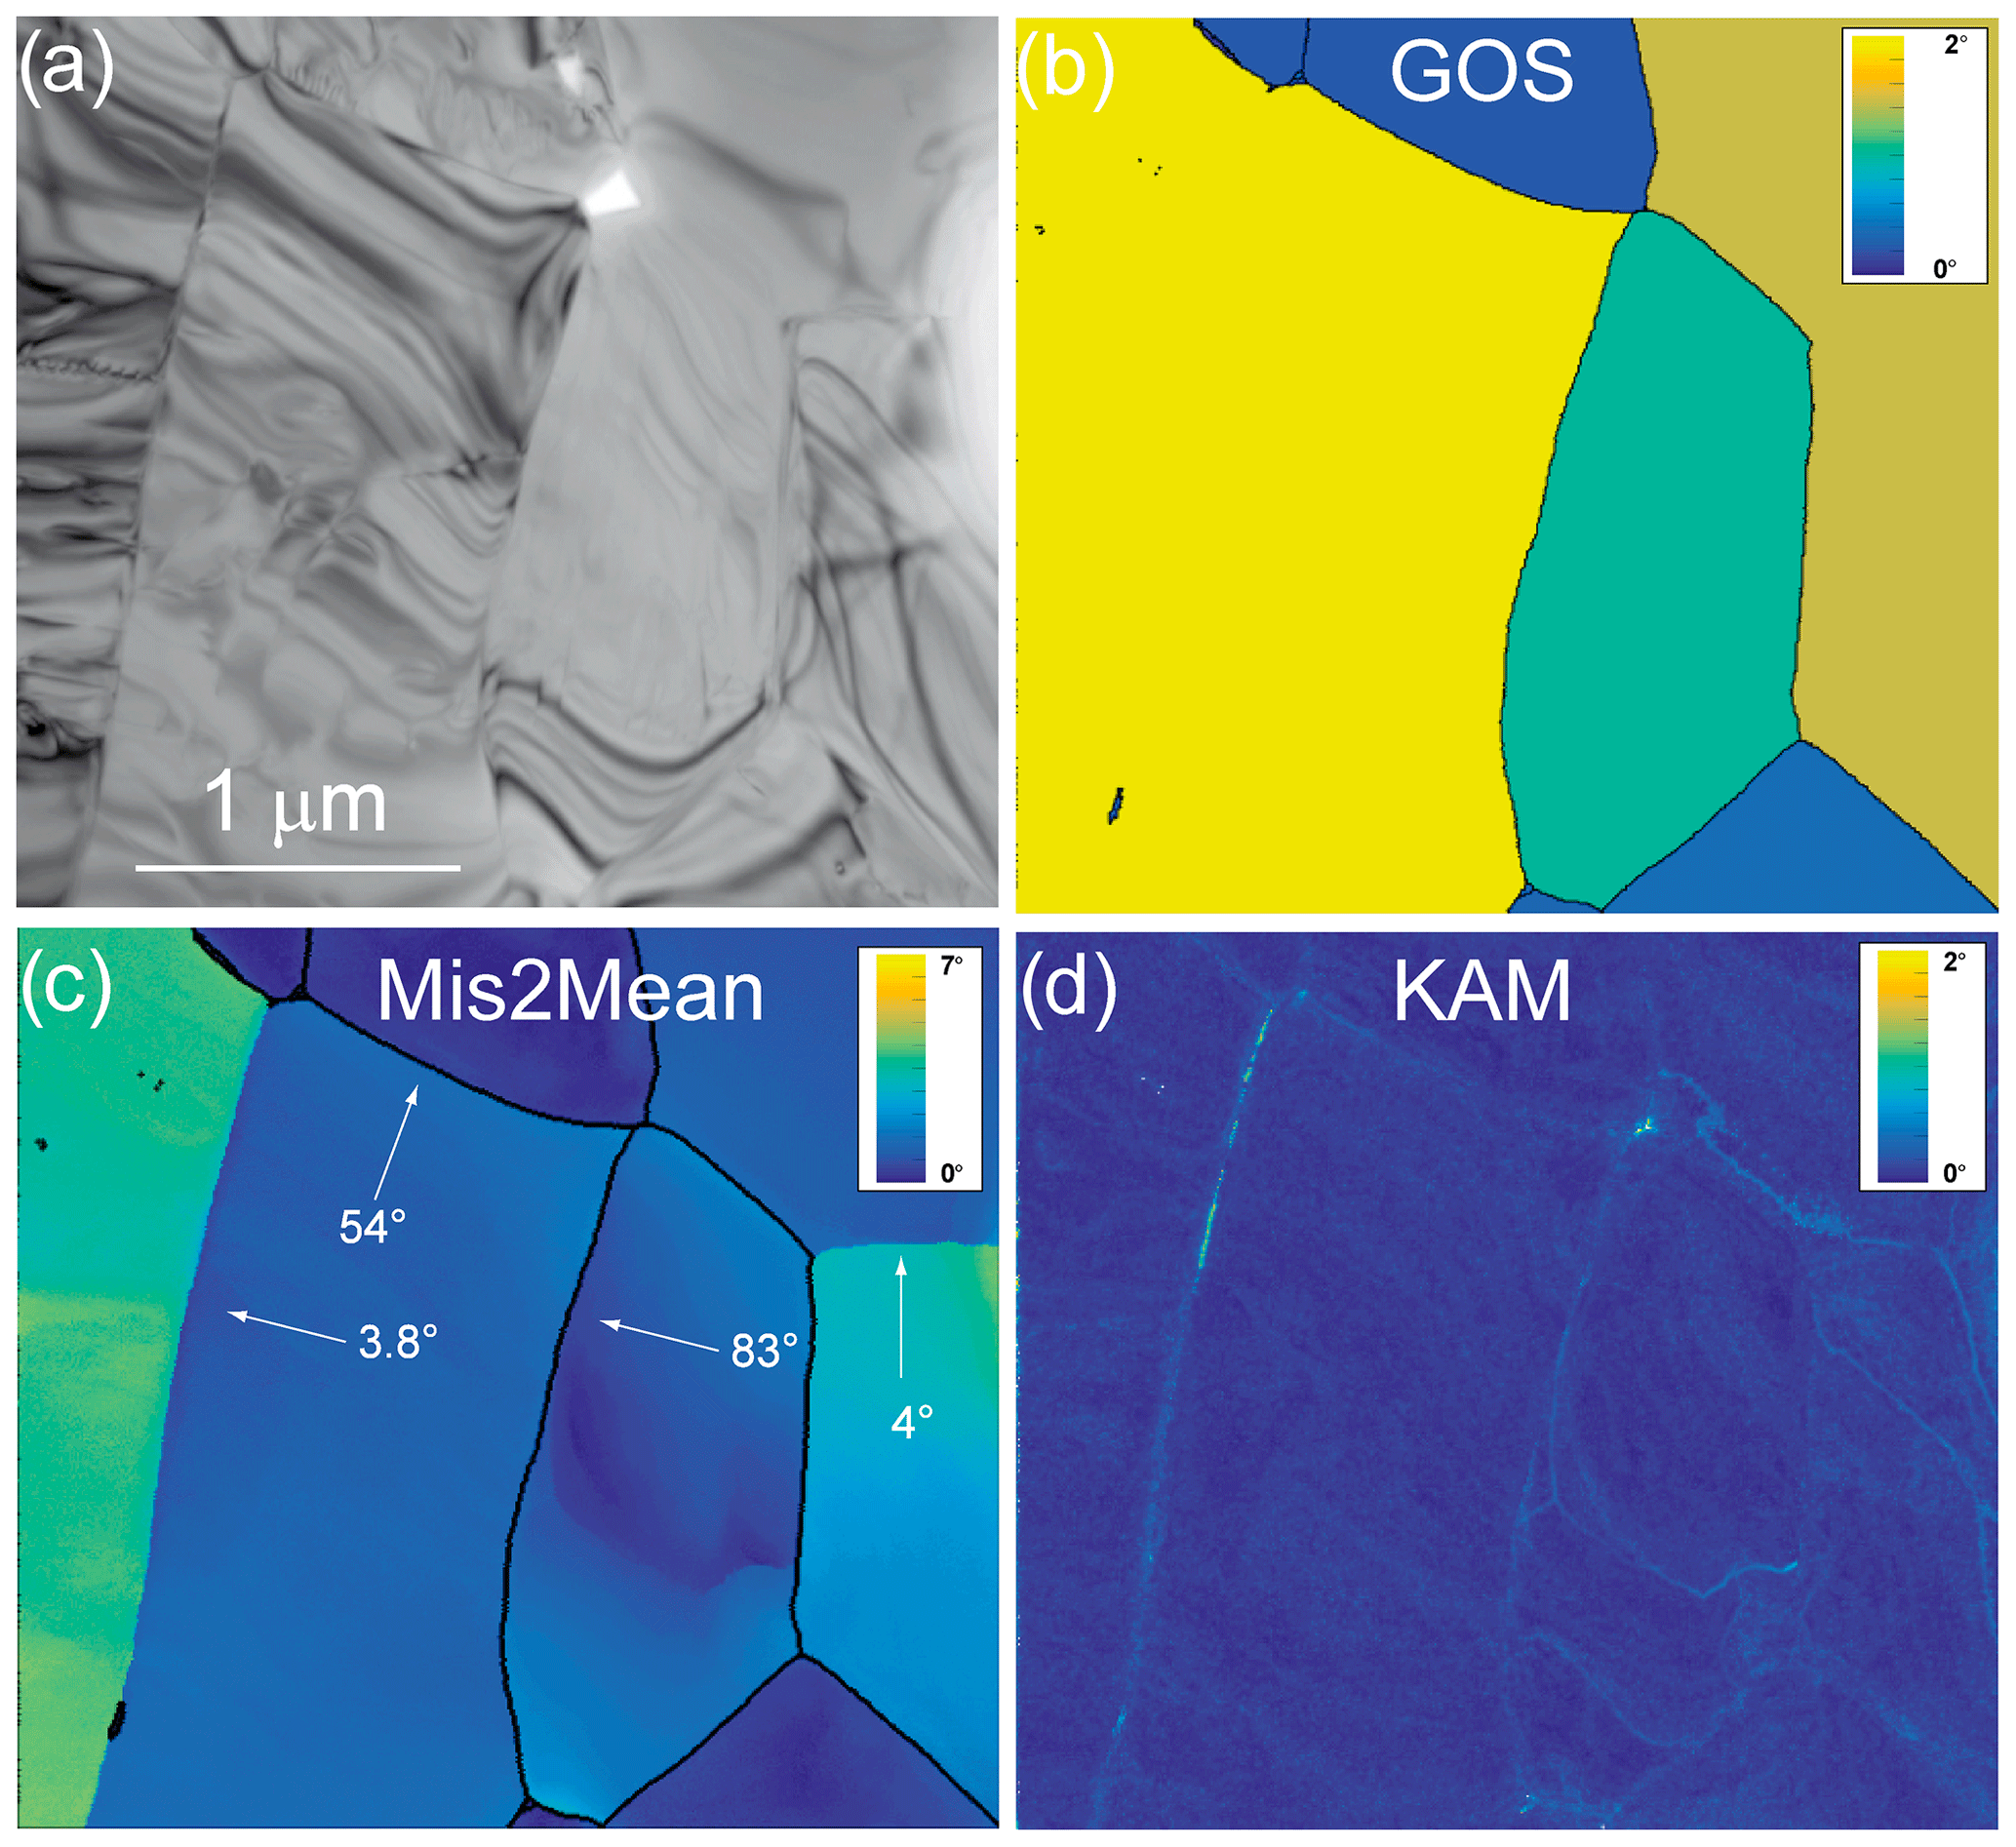
Figure 8Morphology of the grains and grain boundaries in CMT16-8 deformed at 1273 K. (a) Conventional multi-beam TEM bright field (b) GOS map (c) Mis2Mean map, from 0 to 7∘. (d) KAM map (3rd neighbours), from 0 to 2∘.
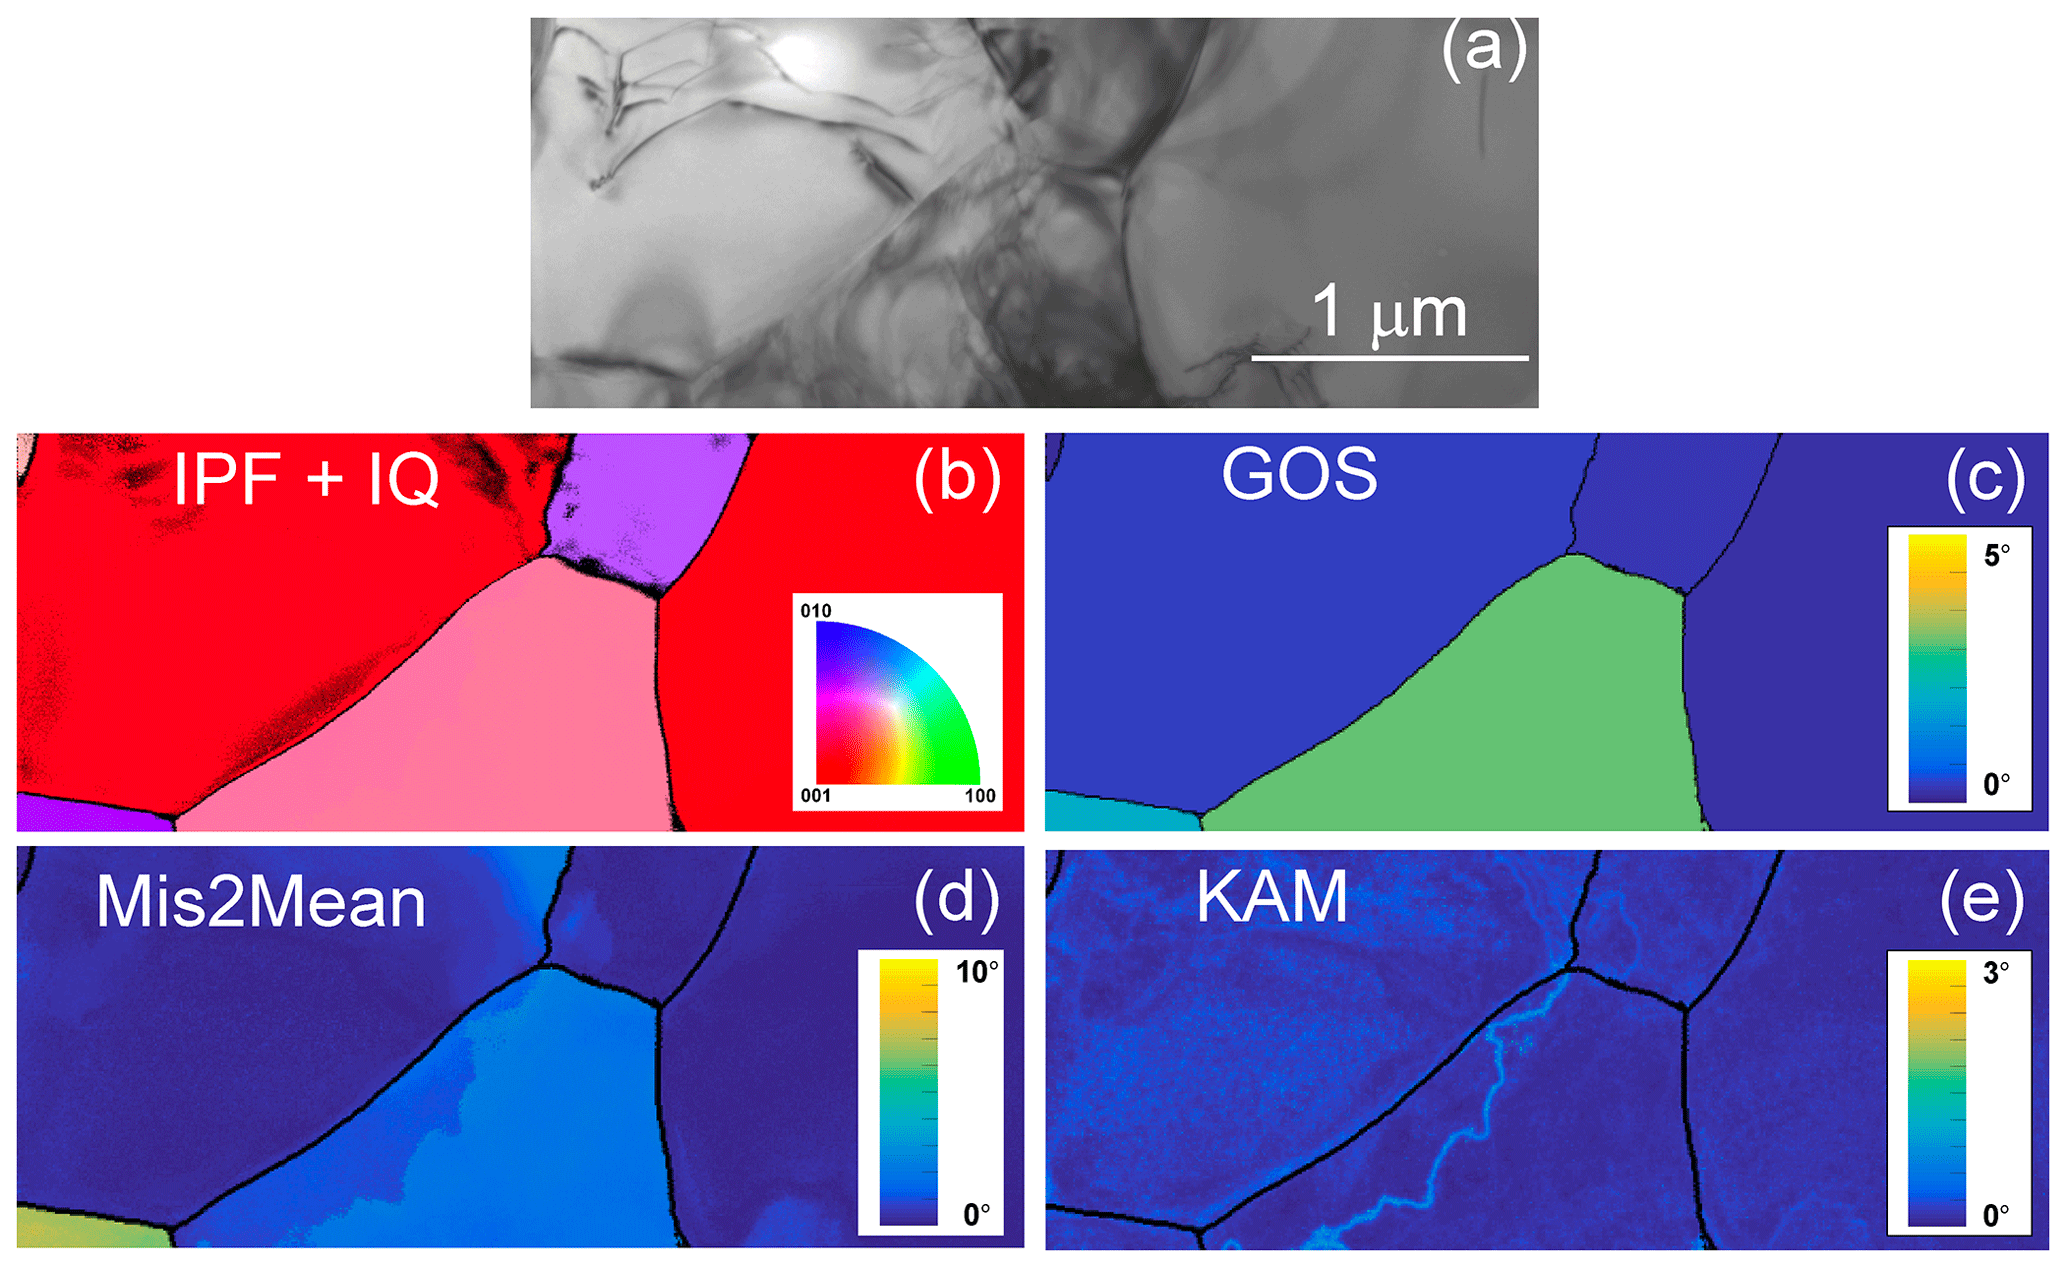
Figure 9Morphology of the grains and grain boundaries in CMT16-4 deformed at 1273 K. (a) Conventional multi-beam TEM bright field. (b) Inverse pole figure (IPF) corresponding to the direction normal to the figure, superimposed with the indexation quality (IQ; see Eq. 1 and main text). (c) GOS map (d) Mis2Mean map, from 0 to 10∘. (e) KAM map (3rd neighbours), from 0 to 3∘.
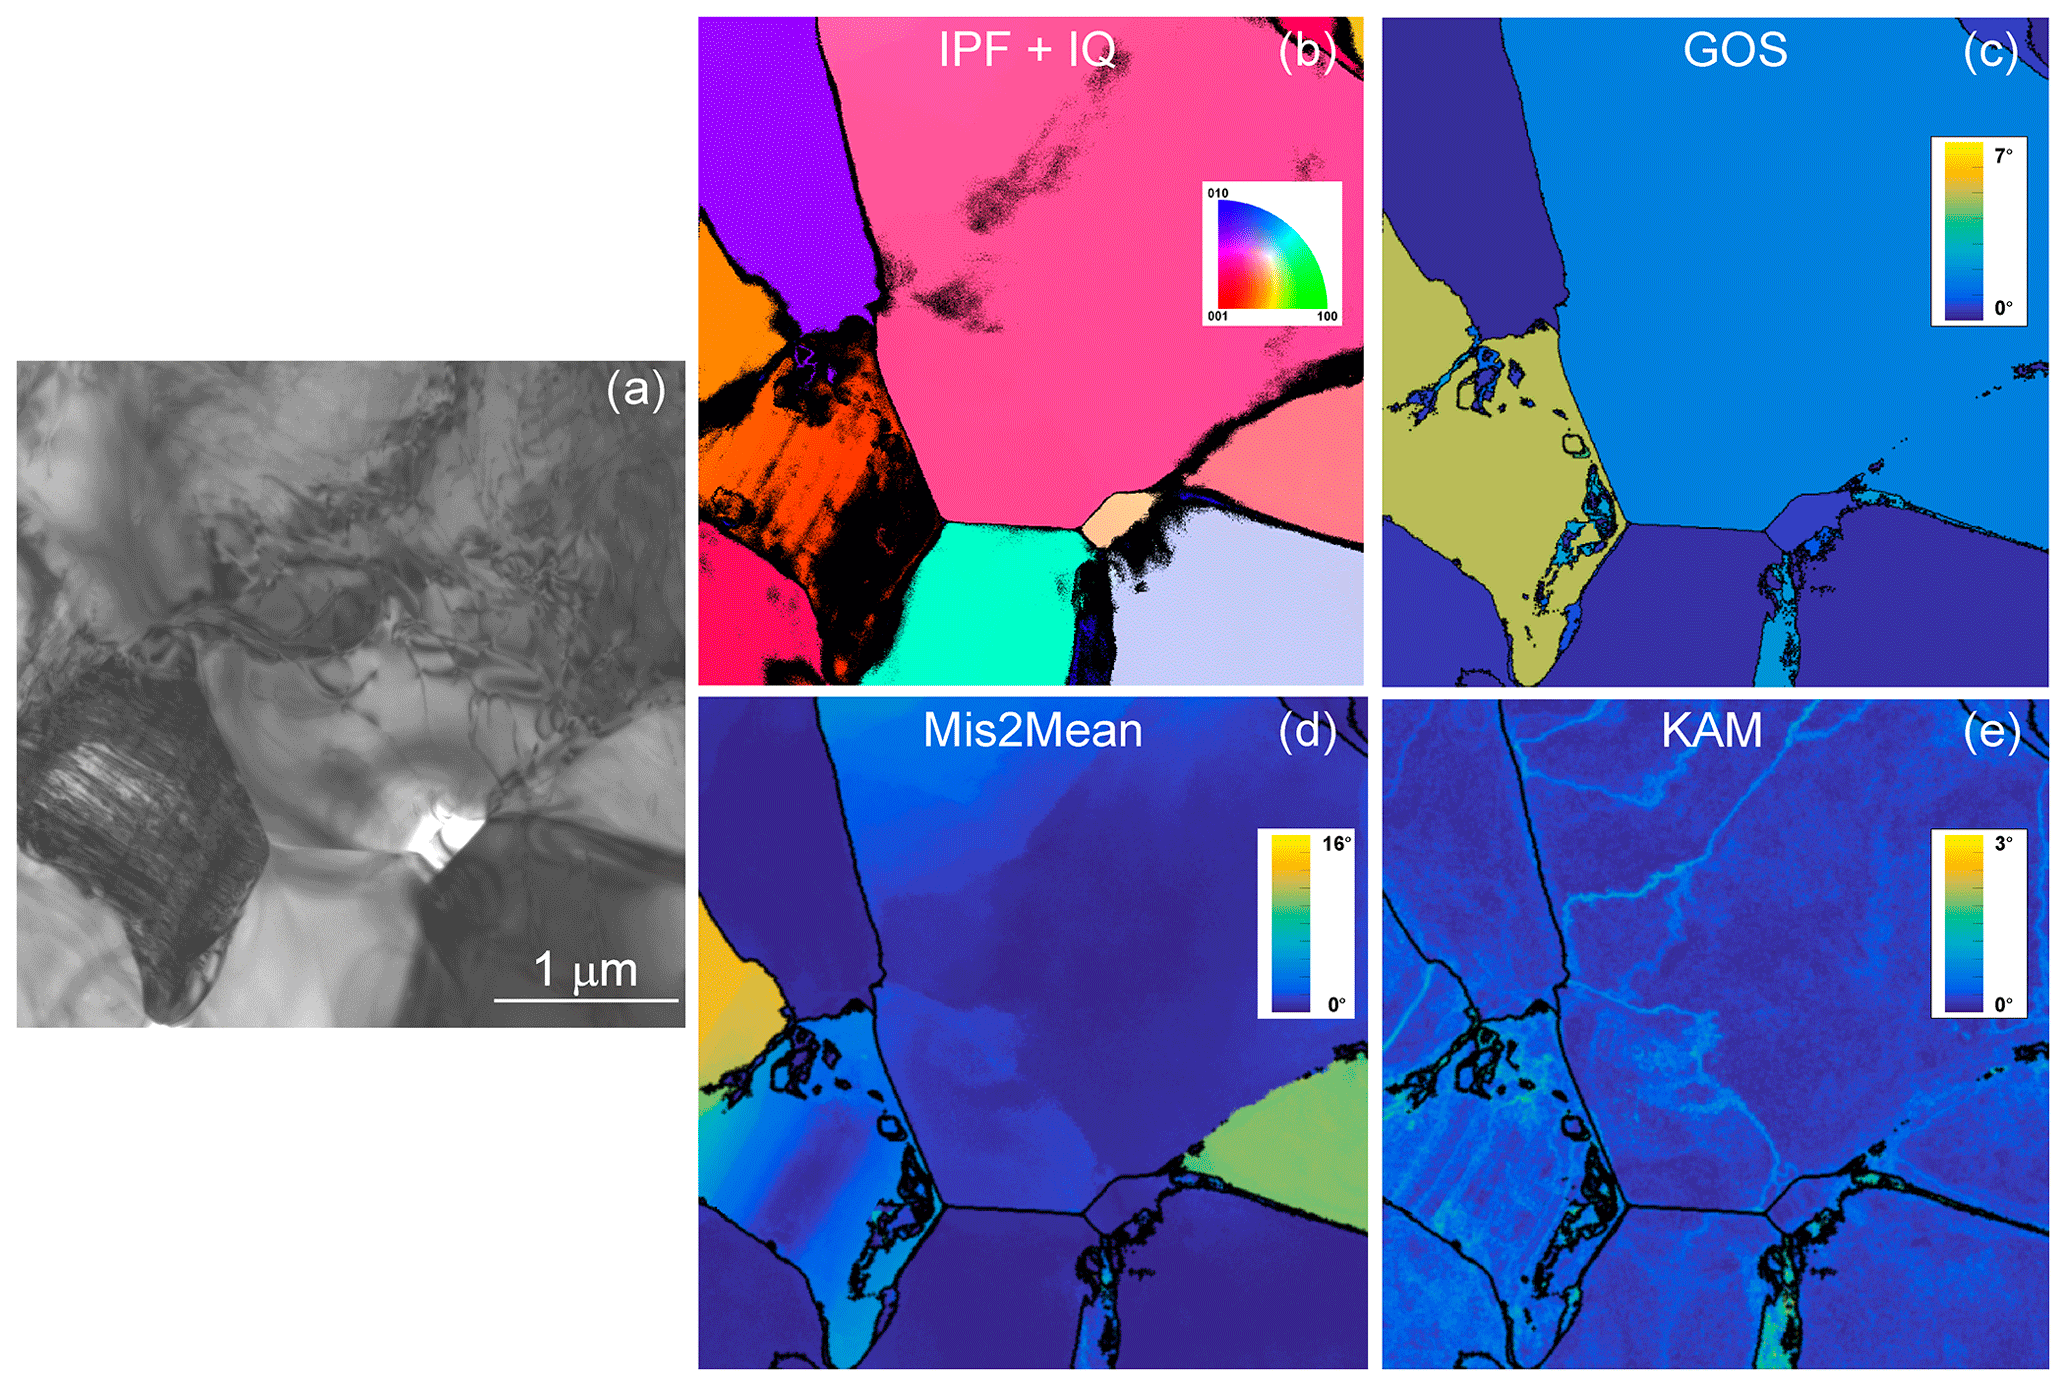
Figure 10Morphology of the grains and grain boundaries in CMT16-4 deformed at 1273 K. (a) Conventional multi-beam TEM bright field. (b) Inverse pole figure (IPF) corresponding to the direction normal to the figure, superimposed with the indexation quality (IQ; see Eq. 1 and main text). (c) GOS map (d) Mis2Mean map, from 0 to 10∘. (e) KAM map (3rd neighbours), from 0 to 3∘.
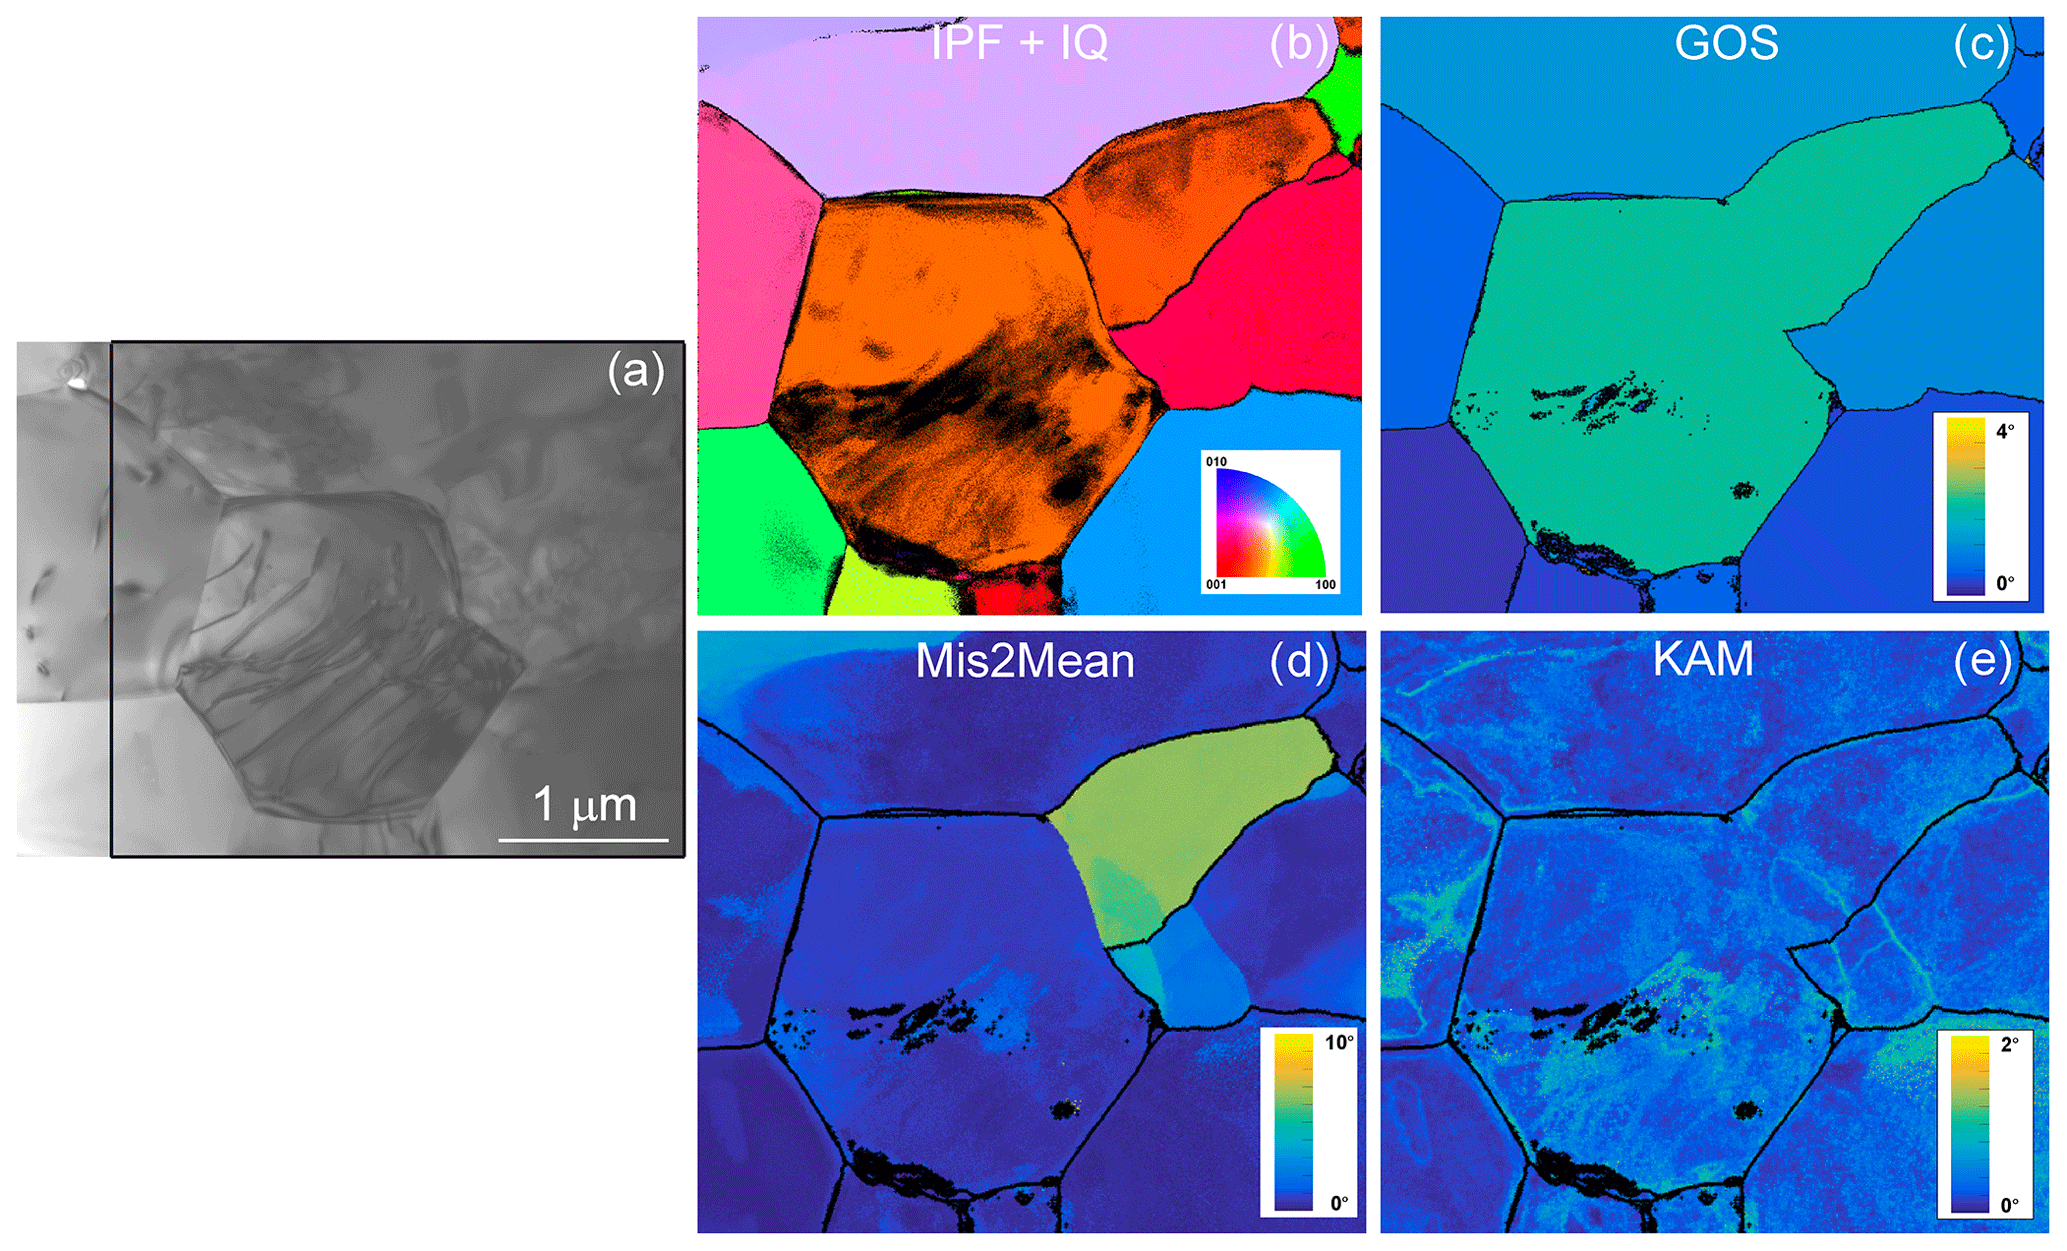
Figure 11Morphology of the grains and grain boundaries in CMT16-4 deformed at 1273 K. (a) Conventional multi-beam TEM bright field. (b) Inverse pole figure (IPF) corresponding to the direction normal to the figure, superimposed with the indexation quality (IQ; see Eq. 1 and main text). (c) GOS map (d) Mis2Mean map, from 0 to 10∘. (e) KAM map (3rd neighbours), from 0 to 2∘.
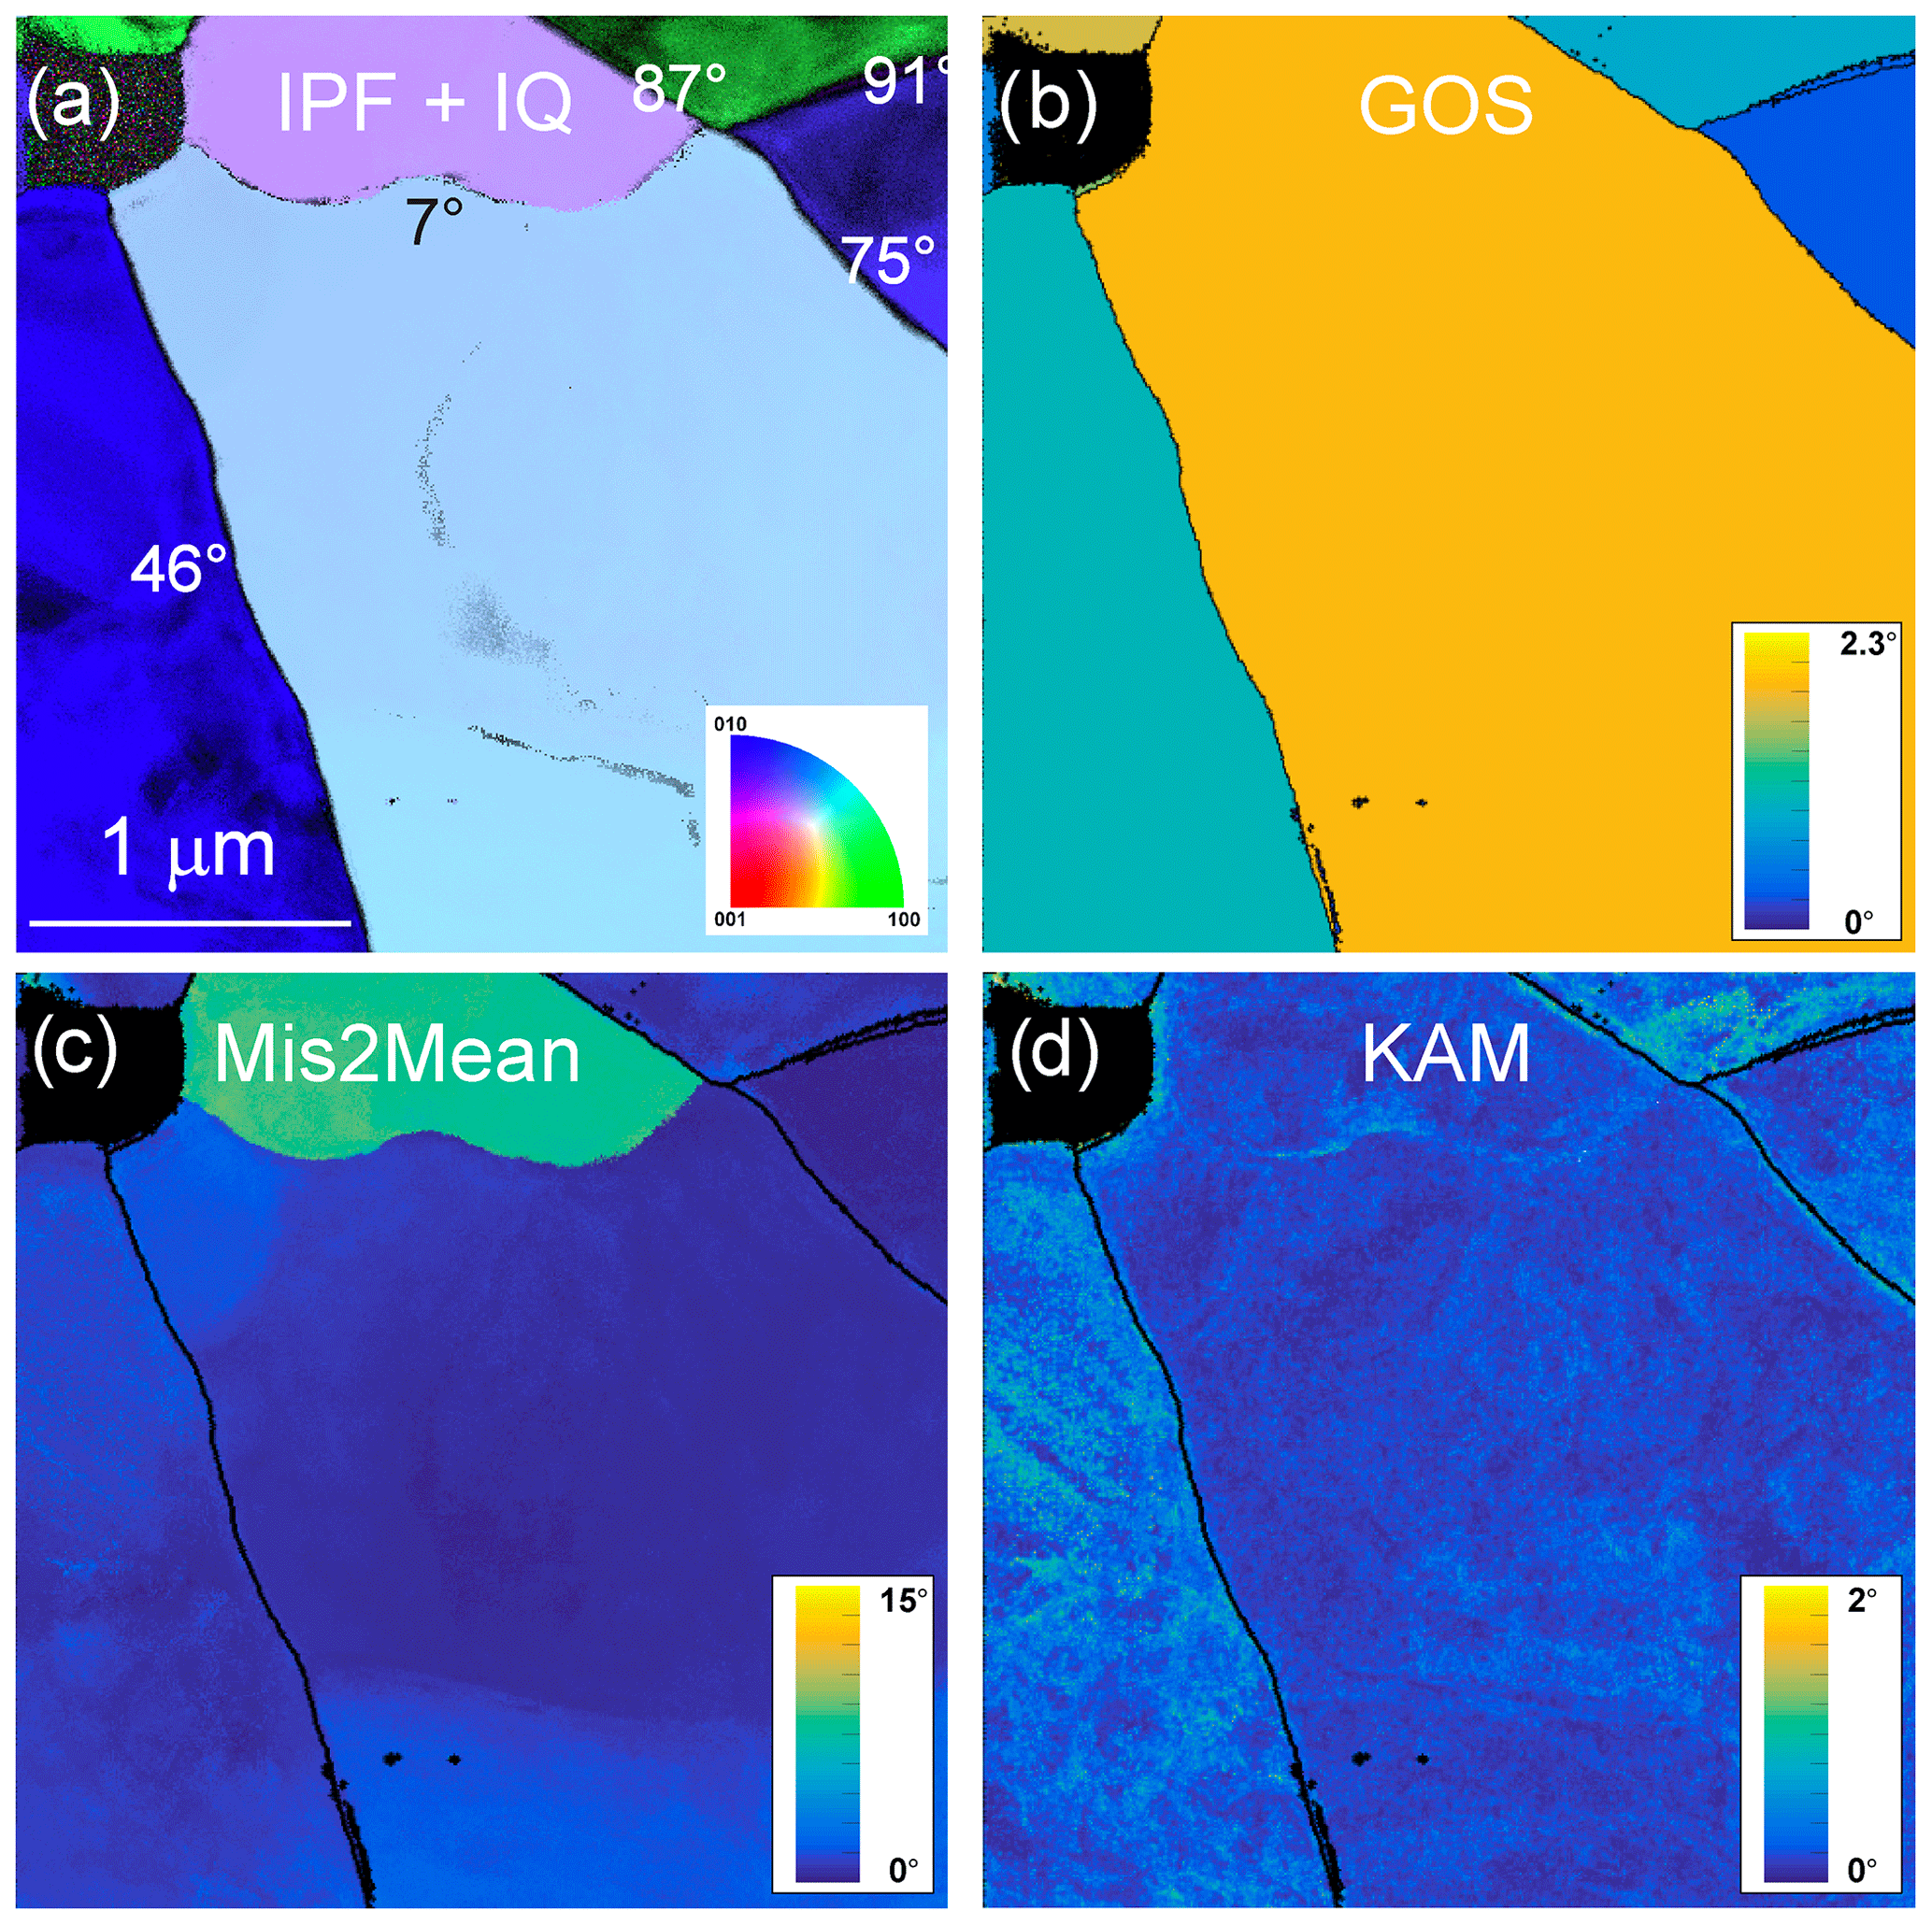
Figure 12Morphology of the grains and grain boundaries in CMT16-8 deformed at 1273 K. (a) Inverse pole figure (IPF) corresponding to the vertical direction, superimposed with the indexation quality (IQ; see Eq. 1 and main text); (b) GOS map; (c) Mis2Mean map, from 0 to 15∘, and (d) KAM map (3rd neighbours), from 0 to 2∘.
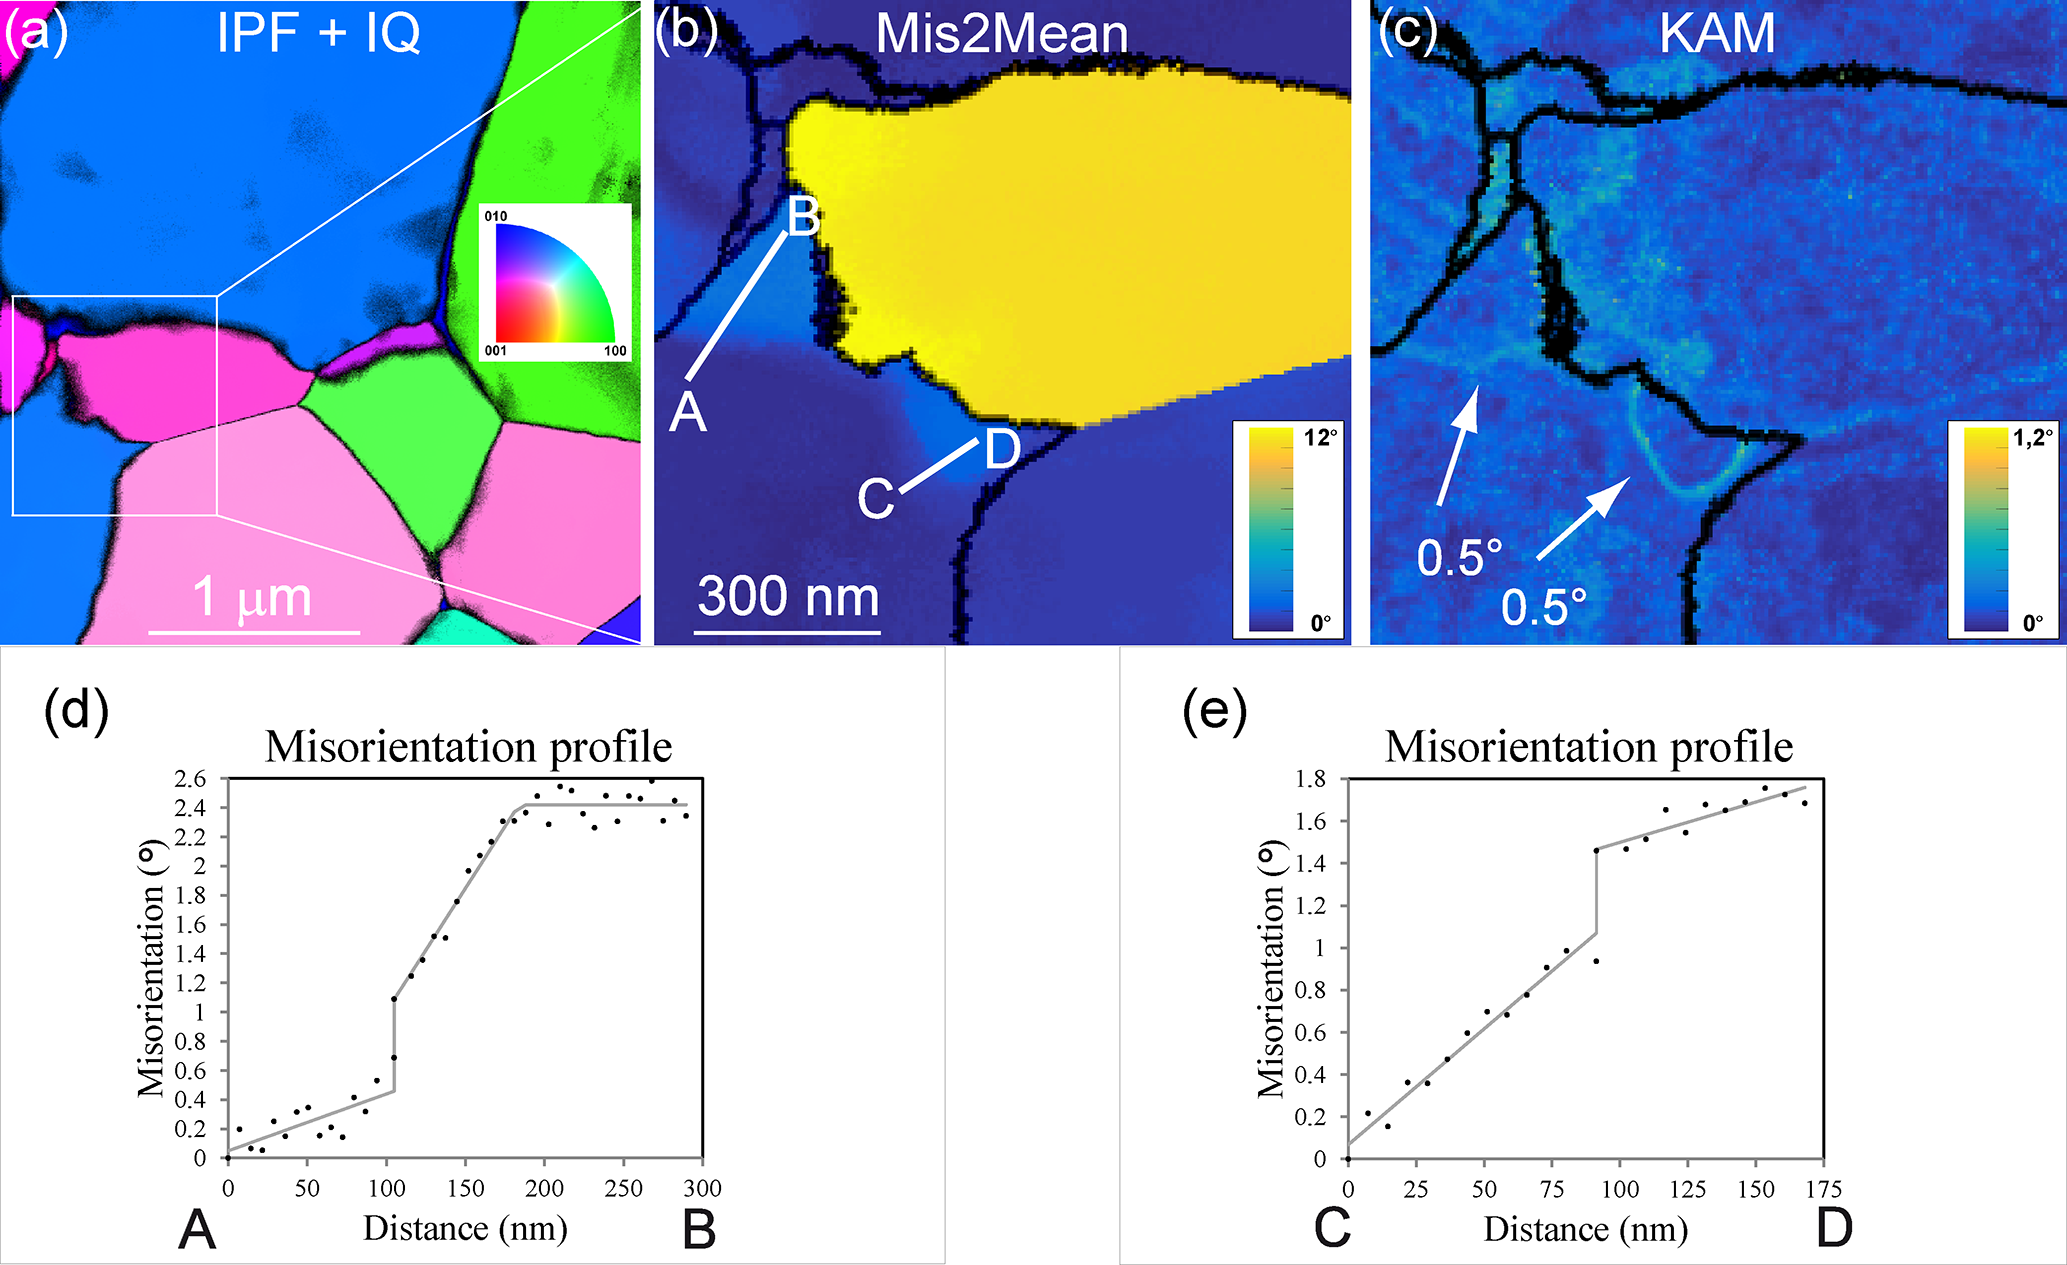
Figure 13Morphology of the grains and grain boundaries in CMT16-8 deformed at 1273 K. (a) Inverse pole figure (IPF) corresponding to the direction normal to the figure, superimposed with the indexation quality (IQ; Eq. 1); (b) Mis2Mean map, from 0 to 12∘; (c) KAM map (3rd neighbours), from 0 to 1.2∘; (d) and (e) show misorientation profiles across subgrain boundaries from (b).
4.1 Comparison with previous EBSD characterization
The deformation experiments conducted at 1273 and 1473 K on fine-grained olivine polycrystals by Thieme et al. (2018) show markedly contrasted mechanical behaviours, which are well illustrated in Fig. 1. At 1273 K, the stress–strain curves exhibit significant strain hardening leading to brittle failure after ca. 1 % of strain. In contrast, at 1473 K, the sample is fully ductile and approaches mechanical steady state after ca. 3 % of strain. Despite such markedly different mechanical behaviours and maximum final stress, the dislocation microstructures and characterizations performed in EBSD-SEM did not show any clear differences (e.g. GOS, KAM, average grain size). Our results show that further investigation at higher spatial resolution is necessary to identify the active mechanisms behind microstructural recovery at lithospheric temperatures.
4.2 Strain-hardening versus thermally activated recovery
Plastic strain hardening is commonly observed in metals during cold working. Indeed, contrary to silicates and ceramics, metals are significantly ductile at low homologous temperatures (<0.5 melting temperature). In metals, during low-temperature deformation the dislocation density increases due to mutual trapping of dislocations resulting from long-range interactions and/or short-range junctions. This is facilitated in cubic metals since, by symmetry, they have a large number of slip systems leading to numerous configurations of junctions. This dislocation storage capacity leads to an increase of the free energy of the material as dislocations are sources of long-range elastic fields. This increase of free energy is the driving force for an evolution to low-energy configurations (see Rollett et al., 2004, for a general description of these processes). This evolution is only possible if the temperature is high enough (i.e. relative to melting temperature) for specific mechanisms involved in recovery process to operate.
In olivine, the situation is different. In such a silicate, dislocation mobility is strongly thermally activated and slower than in cubic metals and alloys. This fact has already been mentioned in Thieme et al. (2018); it is however difficult to assess dislocation mobility quantitatively on bulk specimens. Here we focus on another aspect at mesoscopic scale. A major characteristic of olivine is its plastic anisotropy. There exist only two slip directions in olivine (Raleigh, 1968): [100] and [001]. Having orthogonal Burgers vectors, dislocations from these slip systems have a very weak propensity to form junctions (e.g. Durinck et al., 2007; Mussi et al., 2015). Hence the tendency for dislocation storage is lower than in other crystallographic structures such as cubic metals; indeed, we did not observe a clear correlation between the total finite plastic strain and the dislocation density. Nevertheless, since olivine does not exhibit enough independent slip systems to fulfil the von Mises–Taylor criterion (Mises, 1928; Taylor, 1938; Ribe and Yu, 1991), dislocation activity rapidly builds internal stresses due to incompatibilities between grains. This back stress is likely the origin of the strong strain hardening observed at 1273 K (Fig. 1) reaching up to twice the confining pressure, and which cannot be compensated by recovery processes such as grain boundary migration driven by ionic diffusion.
At higher temperature (1473 K), the activation of recovery processes is identified as the formation of mobile boundaries. We observe that, unlike well-annealed structures commonly observed in natural samples, subgrain boundaries are very curved or wavy, thus far from equilibrium. This morphology is indicative of a driving force for migration (since surface tension will tend to straighten the boundary). We propose that it is indicative of recovery, essentially by boundary migration as reported by Bollinger et al. (2019a).
4.3 Dynamics recrystallization
Another mechanism that allows relaxation of stored strain energy is the formation of new, dislocation-free grains (i.e. discontinuous dynamic recrystallization, dDRX). This mechanism was observed in polycrystalline olivine (Bollinger et al., 2019a), deformed at high pressure and at larger strains (ca. 40 %). Here, finite strains are much smaller than in Bollinger et al. (2019a, b); however we found indications that, locally, stress heterogeneities can be strong enough to trigger small localized misoriented domains, which can lead to the formation of neoformed grains as illustrated by Fig. 13. It is important to remember that in an anisotropic structure like olivine, the plastic strains reported in Table 1 represent macroscopic average values, and that at the microscopic scale of our observations, actual local strains and stress can deviate very significantly from these values (see for instance Barbe et al., 2001).
Strictly speaking, dynamic recrystallization (DRX) is known to induce strain-softening in olivine in the temperature range between 973 and 1573 K (Drury, 2005) and to involve a wide range of possible mechanisms (Drury and Urai, 1990; Rollett et al., 2004). The formation of new, undeformed grains represents a strong indication of dynamic recrystallization, which usually requires a large strain to develop (Bollinger et al., 2019a, b). Here we analyse experiments with low macroscopic strains, although evidence for neoformed grains in formation could be postulated (e.g. Fig. 13), and we propose that boundary migration is already an active mechanism in our samples at high temperature even for low macroscopic finite strain. The role of boundary migration in dynamic recrystallization has already been proposed (Drury and Urai, 1990; Drury and Pennock, 2007) as part of rotation recrystallization mechanisms (rDRX; see Drury and Pennock, 2007). The microstructure observed in Fig. 13 is comparable to those reported in polycrystalline copper (Miura et al., 2007) and ice (Chauve et al., 2017), which were interpreted as nuclei for neograins during discontinuous dynamic recrystallization (dDRX). This mechanism has also been identified recently by Bollinger et al. (2019a) in polycrystalline forsterite deformed at high pressure (3.5–5 GPa) to large strains (25 %–40 %). Here, although there is no evolution in the average grain size (1.6 µm for the four samples), evidence for the onset of DRX is indicated by discrete grain-boundary migration.
Our study, using a novel ACOM-TEM technique, has permitted us to further address the role of grain and subgrain boundaries as an active agent of recovery at lithospheric temperatures in polycrystalline olivine. It indicates that grain-boundary migration and bulging play a noticeable role during the onset of recovery (low macroscopic finite strain), before variation of the average grain size can be observed. Several issues remain to be investigated such as the role of other grain-boundary degrees of freedom, namely sliding (i.e. motion restricted to direction parallel to grain interfaces), which could also contribute to either recovery or strain but for which, with the technique employed here, we lack clear markers.
The raw data (orientation maps for Figs. 2 to 13) supporting this publication can be accessed at https://doi.org/10.5281/zenodo.3492179 (Nzogang et al., 2019).
MT and SD provided the specimens. BCN, AM, and PC performed the TEM observations. BCN processed the data. All authors discussed and interpreted the results and implications. PC, SD, and AM wrote the manuscript with contributions from all authors.
The authors declare that they have no conflict of interest.
We thank Christophe Nevado and Doriane Delmas for providing high-quality thin sections for TEM. The TEM in Lille is supported by the Institut National de Sciences de l'Univers (INSU) du Centre National de la Recherche Scientifique (CNRS, France), and by the Conseil Régional des Hauts-de-France (France). We thank the editors of EJM for handling the manuscript and David Wallis and an anonymous reviewer for constructive reviews.
This research has been supported by the European Commission (RHEOMAN (grant no. 290424)) and the European Commission (CREEP (grant no. 642029)).
This paper was edited by Elisabetta Rampone and reviewed by David Wallis and an anonymous referee.
Ashby, M. F. and Verrall, R. A.: Diffusion-accommodated flow and superplasticity, Acta Met., 21, 149–163, https://doi.org/10.1016/0001-6160(73)90057-6, 1973.
Avé Lallemant, H. G. and Carter, N. L.: Syntectonic recrystallization of olivine and modes of flow in the upper mantle, Geol. Soc. Am. Bull., 81, 2203–2220, https://doi.org/10.1130/0016-7606(1970)81[2203:SROOAM]2.0.CO;2, 1970.
Bachmann, F., Hielscher, R., and Schaeben, H.: Grain detection from 2d and 3d EBSD data – Specification of the MTEX algorithm, Ultramicroscopy, 111, 1720–1733, https://doi.org/10.1016/j.ultramic.2011.08.002, 2011.
Bai, Q. and Kohlstedt, D. L.: High-temperature creep of olivine single crystals III. Mechanical results for unbuffered samples and creep mechanisms, Philos. Mag. A, 66, 1149–1181, https://doi.org/10.1080/01418619208248011, 1992.
Barbe, F., Forest, S., and Cailletaud, G.: Intergranular and intragranular behavior of polycrystalline aggregates. Part 2: Results, Int. J. Plasticity, 17, 537–563, https://doi.org/10.1016/S0749-6419(00)00062-0, 2001.
Behr, W. M. and Platt, J. P.: Brittle faults are weak, yet the ductile middle crust is strong: Implications for lithospheric mechanics, Geophys. Res. Lett., 41, 8067–8075, https://doi.org/10.1002/2014GL061349, 2014.
Ben Ismail, W. and Mainprice, D.: An olivine fabric database: an overview of upper mantle fabrics and seismic anisotropy, Tectonophysics, 296, 145–158, https://doi.org/10.1016/S0040-1951(98)00141-3, 1998.
Birle, J. D., Gibbs, G. V., Moore, P. B., and Smith, J. V.: Crystal structures of natural olivines, Am. Mineral., 53, 807–824, 1968.
Boioli, F., Carrez, P., Cordier, P., Devincre, B., and Marquille, M.: Modeling the creep properties of olivine by 2.5-dimensional dislocation dynamics simulations, Phys. Rev. B, 92, 014115, https://doi.org/10.1103/PhysRevB.92.014115, 2015a.
Boioli, F., Tommasi, A., Cordier, P., Demouchy, S., and Mussi, A.: Low steady-state stresses in the cold lithospheric mantle inferred from dislocation dynamics models of dislocation creep in olivine, Earth Planet. Sc. Lett., 432, 232–242, https://doi.org/10.1016/j.epsl.2015.10.012, 2015b.
Bollinger, C., Nzogang, B. C., Mussi, A., Bouquerel, J., Molodov, D. A., and Cordier, P.: Microstructural evidence for grain boundary migration and dynamic recrystallization in experimentally deformed forsterite aggregates, Minerals, 9, 17, https://doi.org/10.3390/min9010017, 2019a.
Bollinger, C., Marquardt, K., and Ferreira, F.: Intragranular plasticity vs. grain boundary sliding (GBS) in forsterite: Microstructural evidence at high pressures (3.5–5.0 GPa), Am. Mineral., 104, 220–231, https://doi.org/10.2138/am-2019-6629, 2019b.
Chauve, T., Montagnat, M., Barou, F., Hidas, K., Tommasi, A., and Mainprice, D.: Investigation of nucleation processes during dynamic recrystallization of ice using cryo-EBSD, Philos. T. R. Soc. A, 375, 20150345, https://doi.org/10.1098/rsta.2015.0345, 2017.
Demouchy, S., Schneider, S. E., Mackwell, S. J., Zimmerman, M. E., and Kohlstedt, D. L.: Experimental deformation of olivine single crystals at lithospheric temperatures, Geophys. Res. Lett., 36, 1–55, https://doi.org/10.1029/2008GL036611, 2009.
Demouchy, S., Tommasi, A., Ballaran, T. B., and Cordier, P.: Low strength of Earth's uppermost mantle inferred from tri-axial deformation experiments on dry olivine crystals, Phys. Earth Planet. In., 220, 37–49, https://doi.org/10.1016/j.pepi.2013.04.008, 2013.
Demouchy, S., Mussi, A., Barou, F., Tommasi, A., and Cordier, P.: Viscoplasticity of polycrystalline olivine experimentally deformed at high pressure and 900 ∘C, Tectonophysics, 623, 123–135, https://doi.org/10.1016/j.tecto.2014.03.022, 2014.
Drury, M. R.: Dynamic recrystallization and strain softening of olivine aggregates in the Laboratory and the Lithosphere, Geol. Soc., 243, 143–158, https://doi.org/10.1144/GSL.SP.2005.243.01.11, 2005.
Drury, M. R., Avé Lallemant, H. G., Pennock, G. M., and Palasseac, L. N.: Crystal preferred orientation in peridotite ultramylonites deformed by grain size sensitive creep, Étang de Lers, Pyrenees, France, J. Struct. Geol., 33, 1776–1789, https://doi.org/10.1016/j.jsg.2011.10.002, 2011.
Drury, M. R. and Pennock, G. M.: Subgrain Rotation Recrystallization in Minerals, Mater. Sci. Forum, 550, 95–104, https://doi.org/10.4028/www.scientific.net/MSF.550.95, 2007.
Drury, M. R. and Urai, J. L.: Deformation-related recrystallization processes, Tectonophysics, 172, 235–253, https://doi.org/10.1016/0040-1951(90)90033-5, 1990.
Durinck, J., Devincre, B., Kubin, L., and Cordier, P.: Modeling the plastic deformation of olivine by dislocation dynamics simulations, Am. Mineral., 92, 1346–1357, https://doi.org/10.2138/am.2007.2512, 2007.
Evans, B. and Goetze, C.: The temperature variation of hardness of olivine and its implication for polycrystalline yield stress, J. Geophys. Res., 84, 5505–5524, https://doi.org/10.1029/JB084iB10p05505, 1979.
Gaboriaud, R. J., Darot, M., Gueguen, Y., and Woirgard, J.: Dislocations in olivine indented at low-temperatures, Phys. Chem. Miner., 7, 100–104, https://doi.org/10.1007/BF00309460, 1981.
Gasc, J., Demouchy, S., Barou, F., Koizumi, S., and Cordier, P.: Creep mechanisms in the lithospheric mantle inferred from deformation of iron-free forsterite aggregates at 900–1200 ∘C, Tectonophysics, 761, 16–30, https://doi.org/10.1016/j.tecto.2019.04.009, 2019.
Godfrey, A., Cao, W. Q., Hansen, N., and Liu, Q.: Stored energy, microstructure, and flow stress of deformed metals, Metall. Mater. Trans. A, 36, 2371–2378, https://doi.org/10.1007/s11661-005-0109-0, 2005.
Goetze, C.: The mechanism of creep in olivine, Philos. T. R. Soc A, 288, 99–119, https://doi.org/10.1098/rsta.1978.0008, 1978.
Gouriet, K., Cordier, P., Garel, F., Thoraval, C., Demouchy, S., Tommasi, A., and Carrez, P.: Dislocation Dynamics modelling of the power-law breakdown in olivine single crystals: toward a unified creep law for the upper mantle, Earth Planet Sc. Lett., 506, 282–291, https://doi.org/10.1016/j.epsl.2018.10.049, 2019.
Gueguen, Y.: Dislocations in naturally deformed terrestrial olivine: classification, interpretation, application, B. Mineral., 102, 178–183, https://doi.org/10.3406/bulmi.1979.7273, 1979.
Hansen, L. N., Zimmerman, M. E., and Kohlstedt, D. L.: Grain boundary sliding in San Carlos olivine: Flow law parameters and crystallographic preferred orientation, J. Geophys. Res., 116, B08201, https://doi.org/10.1029/2011JB008220, 2011.
Hansen, L. N., Kumamoto, K. M., Thom, C. A., Wallis, D., Durham, W. B., Goldsby, D. L., Breithaupt, T., Meyers, C. D., and Kohlstedt, D. L.: Low-temperature plasticity in olivine: Grain size, strain hardening, and the strength of the lithosphere, J. Geophys. Res.-Sol. Ea., 116, B08201, https://doi.org/10.1029/2018JB016736, 2019.
Hanson, D. R. and Spetzler, H. A.: Transient creep in natural and synthetic, iron-bearing olivine single crystals: mechanical results and dislocation microstructures, Tectonophysics, 235, 293–315, https://doi.org/10.1016/0040-1951(94)90191-0, 1994.
Hirth, G. and Kohlstedt, D. L.: Rheology of the upper mantle and the mantle wedge: a view from the experimentalists, in: Inside The Subduction Factory, AGU, Washington, 83–105, https://doi.org/10.1029/138GM06, 2003.
Jung, H.: Deformation fabrics of olivine in Val Malenco peridotite found in Italy and implications for the seismic anisotropy in the upper mantle, Lithos, 109, 341–349, https://doi.org/10.1016/j.lithos.2008.06.007, 2009.
Kohlstedt, D. L., Goetze, C., Durham, W. B., and Vander Sande, J.: New technique for decorating dislocations in olivine, Science, 191, 1045–1046, https://doi.org/10.1126/science.191.4231.1045, 1976.
Langdon, T. G.: Grain boundary sliding revisited: Developments in sliding over four decades, J. Mater Sci., 41, 597–609 https://doi.org/10.1007/s10853-006-6476-0, 2006.
Le Roux, V., Bodinier, J. L., Tommasi, A., Alard, O., Dautria, J. M., Vauchez, A., and Riches, A. J. V.: The Lherz spinel lherzolite: refertilized rather than pristine mantle, Earth Planet. Sc. Lett., 259, 599–612, https://doi.org/10.1016/j.epsl.2007.05.026, 2007.
Le Roux, V., Tommasi, A., and Vauchez, A.: Feedback between melt percolation and deformation in an exhumed lithosphere-asthenosphere boundary, Earth Planet. Sc. Lett., 274, 401–413, https://doi.org/10.1016/j.epsl.2008.07.053, 2008.
Liu, W., Kung, J., and Li, B.: Elasticity of San Carlos olivine to 8 GPa and 1073 K, Geophys. Res. Lett., 32, L16301, https://doi.org/10.1029/2005GL023453, 2005.
Mainprice, D., Tommasi, A., Couvy, H., Cordier, P., and Frost, D. J.: Pressure sensitivity of olivine slip systems and seismic anisotropy of the Earth's upper mantle, Nature, 433, 731–733, https://doi.org/10.1038/nature03266, 2005.
Mei, S. and Kohlstedt, D. L.: Influence of water on plastic deformation of olivine aggregates: 1. Diffusion creep regime, J. Geophys. Res. 105, 21457–21469, https://doi.org/10.1029/2000JB900179, 2000a.
Mei, S. and Kohlstedt, D. L.: Influence of water on plastic deformation of olivine aggregates 2. Dislocation creep regime, J. Geophys. Res., 105, 21471–21481, https://doi.org/10.1029/2000JB900180, 2000b.
Mises, R. V.: Mechanik der plastischen Formänderung von Kristallen, Z. Angew. Math. Me., 8, 161–185, https://doi.org/10.1002/zamm.19280080302, 1928.
Miura, H., Sakai, T., Mogawa, R., and Jonas, J. J.: Nucleation of dynamic recrystallization and variant selection in copper bicrystals, Philos. Mag., 87, 4197–4209, https://doi.org/10.1080/14786430701532780, 2007.
Mussi, A., Cordier, P., Demouchy, S., and Vanmansart, C.: Characterization of the glide planes of the [001] screw dislocations in olivine using electron tomography, Phys. Chem. Miner., 41, 537–545, https://doi.org/10.1007/s00269-014-0665-1, 2014.
Mussi, A., Cordier, P., and Demouchy, S.: Characterization of dislocation interactions in olivine using electron tomography, Philos. Mag., 95, 335–345, https://doi.org/10.1080/14786435.2014.1000996, 2015.
Mussi, A., Cordier, P., Demouchy, S., and Hue, B.: Hardening mechanisms in olivine single crystal deformed at 1090 ∘C: an electron tomography study, Philos. Mag., 97, 3172–3185, https://doi.org/10.1080/14786435.2017.1367858, 2017.
Nzogang, B. C., Thieme, M., Mussi, A., Demouchy, S., and Cordier, P.: Research data supporting for “Characterization of recovery onset by subgrain and grain boundary migration in experimentally deformed polycrystalline olivine” [Data set], Zenodo, https://doi.org/10.5281/zenodo.3492179, 2019.
Pantleon, W.: Resolving the geometrically necessary dislocation content by conventional electron backscattering diffraction, Scripta Mater., 58, 994–997, https://doi.org/10.1016/j.scriptamat.2008.01.050, 2008.
Paterson, M. S.: Rock deformation experimentation, in: The Brittle-Ductile transition in rocks: the Heard volume, edited by: Duba, A. G., Durham, W. B., Handin, J. W., and Wang, H. F., Geophysical Monograph Series, AGU, Washington, 187–194, https://doi.org/10.1029/GM056p0187, 1990.
Phakey, P., Dollinger, G., and Christie, J.: Transmission electron microscopy of experimentally deformed olivine crystals, in: Flow and Fracture of Rocks, American Geophysical Union, https://doi.org/10.1029/GM016p0117, 1972.
Platt, J. P. and Behr, W. M.: Grainsize evolution in ductile shear zones: Implications for strain localization and the strength of the lithosphere, J. Struct. Geol., 33, 537–550, https://doi.org/10.1016/j.jsg.2011.01.018, 2011.
Précigout, J. and Hirth, G.: B-type olivine fabric induced by grain boundary sliding, Earth Planet. Sc. Lett., 395, 231–240, https://doi.org/10.1016/j.epsl.2014.03.052, 2014.
Raleigh, C. B.: Mechanisms of plastic deformation of olivine, J. Geophys. Res., 73, 5391–5406, https://doi.org/10.1029/JB073i016p05391, 1968.
Rauch, E. F. and Dupuy, L.: Rapid spot diffraction patterns identification through template matching, Arch. Metall. Mater., 50, 87–99, 2005.
Rauch, E. F. and Véron, M.: Automated crystal orientation and phase mapping in TEM, Mater. Charact., 98, 1–9, https://doi.org/10.1016/j.matchar.2014.08.010, 2014.
Ree, J. H.: Grain boundary sliding and development of grain boundary opening in experimentally deformed octachloropropane, J. Struct. Geol., 16, 403–418, https://doi.org/10.1016/0191-8141(94)90044-2, 1994.
Ribe, N. and Yu, Y.: A theory for plastic deformation and textural evolution of olivine polycrystals, J. Geophys. Res., 96, 8325–8335, https://doi.org/10.1029/90JB02721, 1991.
Rollett, A., Humphreys, F. J., Rohrer, G. S., and Hatherly, M.: Recrystallization and Related Annealing Phenomena, 2nd Edn., Elsevier, Oxford, UK, 658 pp., ISBN 9780080441641, 2004.
Satsukawa, T. and Michibayashi, K.: Flow in the uppermost mantle during back-arc spreading revealed by Ichinomegata peridotite xenoliths, NE Japan, Lithos, 189, 89–104, https://doi.org/10.1016/j.lithos.2013.10.035, 2014.
Taylor, G. I.: Plastic strain in metals, J. l. Met., 62, 307–324, 1938.
Thieme, M., Demouchy, S., Mainprice, D., Barou, F., and Cordier, P.: Stress evolution and associated microstructure during transient creep of olivine at 1000–1200 ∘C, Phys. Earth Planet. In., 278, 34–46, https://doi.org/10.1016/j.pepi.2018.03.002, 2018.
Tielke, J. A., Zimmerman, M. E., and Kohlstedt, D. L.: Hydrolytic weakening in olivine single crystals, J. Geophys. Res., 122, 3465–3479, https://doi.org/10.1002/2017JB014004, 2017.
Wallis, D., Hansen, L. N., Ben Britton, T., and Wilkinson, A. J.: Geometrically necessary dislocation densities in olivine obtained using high-angular resolution electron backscatter diffraction, Ultramicroscopy, 168, 34–45, https://doi.org/10.1016/j.ultramic.2016.06.002, 2016.
Warren, J. M. and Hirth, G.: Grain size sensitive deformation mechanisms in naturally deformed peridotites, Earth Planet. Sc. Lett., 248, 438–450, https://doi.org/10.1016/j.epsl.2006.06.006, 2006.
Wheeler, J., Mariani, E., Piazolo, S., Prior, D. J., Trimby, P., and Drury, M. R.: The weighted Burgers vector: a new quantity for constraining dislocation densities and types using electron backscatter diffraction on 2D sections through crystalline materials, J. Microscopy, 233, 482–494, https://doi.org/10.1111/j.1365-2818.2009.03136.x, 2009.
Wright, S. I., Nowell, M. M., and Field, D. P.: A review of strain analysis using electron backscatter diffraction, Microsc. Microanal., 17, 316–329, https://doi.org/10.1017/S1431927611000055, 2011.
Zimmerman, M. E. and Kohlstedt, D. L.: Rheological properties of partially molten lherzolite, J. Petrol., 45, 275–298, https://doi.org/10.1093/petrology/egg089, 2004.