the Creative Commons Attribution 4.0 License.
the Creative Commons Attribution 4.0 License.
 | 20 Oct 2026
Experimental constraints on the stability of Mg-rich tourmaline and the boron concentration of hydrothermal fluids
Julien Fort
Stanislas Sizaret

Michel Pichavant
Arnault Lassin
Johann Tuduri
Olivier Blein
Assemblages of natural tourmaline and cordierite were equilibrated experimentally in the presence of albite, andalusite, quartz, and H2O–B2O3 solutions to constrain the boron concentration of hydrothermal fluids. The experiments were carried out at constant pressure (200 MPa) and at 400, 500, and 600 °C under fO2-controlled conditions ranging from NNO + 0.8 to NNO + 5.3 and for durations from 2 to 8 weeks. Both forward and reversal experiments, starting from tourmaline-free and tourmaline-bearing assemblages respectively, were performed. Under moderately oxidizing conditions (NNO + 0.8 to NNO + 2.64), cordierite plus albite and andalusite react to tourmaline plus quartz for [B2O3]fluid>3.4 wt % at 600 °C and for [B2O3]fluid>2.1 wt % at 500 °C. At 400 °C, tourmaline appears for [B2O3]fluid>2.0 wt %, but smectite replaces cordierite in the reacting assemblage. Experiments under strongly oxidizing conditions (NNO + 2.7 to NNO + 5.3) show that the [B2O3]fluid necessary for tourmaline to appear does not vary significantly with fO2. Our determinations of [B2O3]fluid at equilibrium with tourmaline and cordierite are broadly consistent with previous experimental tourmalinization studies, but the comparison also highlights the potential effect of other variables such as the fluid chemistry (pH and NaCl concentration) on tourmaline stability. The experimental results have been complemented by thermodynamic calculations of cordierite–tourmaline equilibria using end-member tourmaline compositions and simple solid-solution models. The calculated equilibrium [B2O3]fluid values are in broad agreement with the experimentally determined brackets and suggest a complex effect of solid solution between dravite and schorl end-members. The low boron concentrations required to form tourmaline from cordierite are also consistent with compositional constraints from natural hydrothermal fluids and peraluminous melts.
- Article
(6734 KB) - Full-text XML
-
Supplement
(1360 KB) - BibTeX
- EndNote


Tourmaline is a common accessory mineral of magmatic–hydrothermal environments from various tectonic settings (Slack and Trumbull, 2011). It is ubiquitous in hydrothermal veins (e.g., Lecumberri-Sanchez et al., 2017; Broska and Kubiš, 2018; Harlaux et al., 2020), in metasomatized rocks developed around and within granitic plutons (Codeço et al., 2017; Williamson et al., 2000), and in potassic alteration and advanced argillic zones (Beckett-Brown et al., 2023; Lynch and Ortega, 1997; Tuduri et al., 2018).
The occurrence of tourmaline in a variety of geological settings reflects its stability over a wide range of pressure (P) and temperature (T) conditions (Henry and Dutrow, 1996; van Hinsberg et al., 2011b). This is partly due to the ability of tourmaline to adjust its composition by incorporating a large number of major and trace elements (Dutrow and Henry, 2011; van Hinsberg et al., 2011a). Thus, tourmaline chemistry is commonly used to probe crystallization environments. Its composition correlates with host-rock composition (Henry and Dutrow, 1996; Henry and Guidotti, 1985; Sciuba et al., 2021; Slack and Trumbull, 2011). Additionally, tourmaline retains information on P–T and fO2 conditions (Fuchs et al., 1998; von Goerne et al., 2011; van Hinsberg et al., 2011b; Berryman et al., 2016; Dutrow and Henry, 2016). Element partitioning between tourmaline sectors has been used for thermometric purposes (van Hinsberg and Schumacher, 2009). Combined with stable isotope (H, B, O) data, tourmaline composition can provide information about the origin of hydrothermal fluids (e.g., Nakano and Nakamura, 2001; Slack and Trumbull, 2011; Kelly et al., 2020; Sciuba et al., 2021). Tourmaline–fluid-partitioning studies (von Goerne et al., 2001, 2011; Williamson et al., 2010; van Hinsberg et al., 2017) constrain element concentrations in the fluid. Therefore, tourmaline serves as a proxy for characterizing fluids and records hydrothermal processes, including ore formation. However, the lack of calibrated experimental information on tourmaline stability presently limits its practical application (see van Hinsberg and Schumacher, 2007; Dutrow and Henry, 2011). This study addresses this issue by providing new experimental data on tourmaline stability in aqueous hydrothermal fluids.
Tourmaline is a highly complex mineral with a chemical composition that depends on numerous chemical variables, including P and T (Dutrow and Henry, 2011; London, 2011). Constraints on tourmaline stability are derived from both natural occurrences and experimental studies. However, most experimental investigations have focused on either tourmaline synthesis or tourmalinization experiments (von Goerne et al., 1999a; Orlando et al., 2017). These studies generally employ high boron concentrations to promote tourmaline formation. A disadvantage of these studies is that tourmaline stability limits as a function of chemical variables are poorly defined. In particular, the equilibrium boron concentration in the fluid ([B2O3]fluid_EQ) is a critical parameter controlling tourmaline stability in aqueous systems. It constrains the range of boron concentrations in natural hydrothermal fluids (Legros et al., 2022; Prokof'ev et al., 2002; Qiu et al., 2021) and the conditions of boron metasomatism in and around granitic plutons (Cheng et al., 2019; Codeço et al., 2017; Drivenes et al., 2015; Harlaux et al., 2020; Hong et al., 2017). It also serves as a proxy for the boron concentration in silicic magmas (Dingwell et al., 1996; London, 2011; Pichavant and Manning, 1984). Previous experimental work on this topic is almost non-existent, with only limited contributions such as those of Morgan and London (1989) and Cheng et al. (2019). Only one fully dedicated study exists in abstract form (Weisbrod et al., 1986). To address this gap, experiments were conducted at 200 MPa from 400 to 600 °C and under fO2-controlled conditions to determine the boron content of the fluid in equilibrium with tourmaline. The experimental results are presented and interpreted using a thermodynamic model, and the implications for the boron content of natural fluids are discussed.
2.1 Strategy
Tourmaline-bearing mineral assemblages buffer the boron concentration of hydrothermal fluids ([B2O3]fluid). This occurs when tourmaline coexists with quartz, albite, andalusite, and cordierite at equilibrium (Weisbrod et al., 1986; von Goerne et al., 1999a). For a purely magnesian system (at. ), the corresponding equilibrium reaction (Reaction R1) involves dravite as the tourmaline end-member.
The reaction for the ferrous equivalent system (R1Fe, not written) involves schorl as the tourmaline end-member, assuming that all Fe is ferrous. For an albite-free assemblage, the buffering equilibrium reaction in the purely magnesian system (Reaction R2) is as follows:
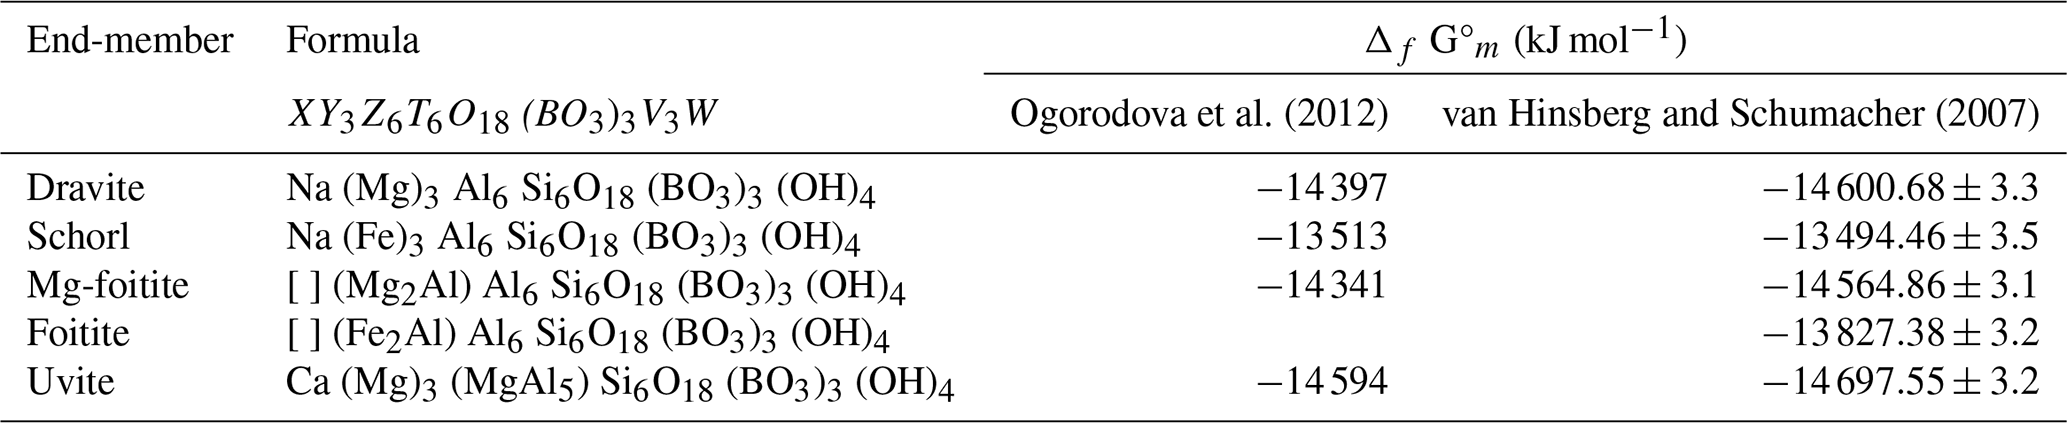
where magnesiofoitite is the tourmaline end-member (foitite in the equivalent ferrous reaction, Reaction R2Fe, not written). The chemical formulae of tourmaline end-members involved in the four reactions above (plus a fifth tourmaline end-member relevant to this study, uvite) are given in Table 1.
Table 1Chemical formulae and estimated thermodynamic properties of tourmaline end-members of relevance in this study.
In this study, the equilibrium [B2O3]fluid has been experimentally calibrated for Mg-rich (dravitic) tourmaline solid solutions (instead of individual end-members) coexisting with quartz, albite, andalusite and cordierite, meaning that the four buffering reactions above have been investigated simultaneously. Although mica-free, the buffering mineral assemblage studied is representative of pelitic metamorphic country rocks found near granitic plutons where B metasomatism and tourmalinization may occur (Drivenes et al., 2015; Codeço et al., 2017).
2.2 Starting materials
The forward experiments started from mixtures of cordierite, albite, quartz, and andalusite (all natural minerals; compositions are in Table S1 in the Supplement) in 65, 10, 5, and 20 wt % proportions. The cordierite single crystal used (unknown provenance) is magnesian (at. ). The plagioclase, also of unknown provenance, is albitic (An3Or4Ab93) and contains K-feldspar and quartz inclusions. The quartz and andalusite (from the active quarries in Ploemeur and Glomel, France, respectively) contain solid inclusions of apatite, ilmenite, and chlorite. As will be shown below, inclusions in the starting minerals gave rise to the experimental accessory phases (K-feldspar and ilmenite), whereas albite and apatite supplied Ca for the experimental tourmalines (uvite end-member; Table 1). Some forward experiments were seeded with a few large (∼1 mm) natural tourmaline crystals from quartz veins in the Huelgoat granite (France) to evaluate the development of tourmaline overgrowths. These mainly Fe-rich tourmalines (Table S2) contain quartz and zircon inclusions. The reversal experiments started with tourmaline-bearing mineral mixtures (vs. tourmaline-free in the forward experiments) made from the natural tourmaline, quartz, andalusite, and albite in 65, 10, 5, and 20 wt % proportions.
The starting minerals were crushed in an agate mortar and then sieved. Only the 40–80 µm size fraction was retained. Mineral mixtures (50 mg) were reacted with an aqueous fluid phase (100 mg) of varying composition in the H2O–B2O3 system, obtained by dissolving boric acid (H3BO3) crystals in distilled water. Initial boron contents of the fluid ranged from 0 wt % to 10 wt % [B2O3] fluid. The addition of B(OH)3 leads to fluid acidification (pH 7–4.3), as indicated by PHREEQC simulations (Parkhurst and Appelo, 2013) using the Thermoddem database (v1.10; Blanc et al., 2012) at 25 °C and 1 atm. Although obtained under ambient P–T conditions, the calculated pH range is comparable in magnitude to that inferred for tourmaline crystallization (Morgan and London, 1989).
2.3 Experimental procedure
All experiments used Au or Pt capsules as containers; these were approximately 35 mm long, with a 5.4 mm outer diameter and a wall thickness of 0.2 mm. The higher H2 permeability of Pt compared to Au (Gunter et al., 1987) initially seemed to be a key advantage for constraining the fO2 in the low-temperature (500 and 400 °C) experiments. However, it was found that charges contained in Pt capsules suffered some Fe loss. Thus, duplicate experiments were performed in Au at 500 and 400 °C (and also in Pt at 600 °C) to fully evaluate the influence of capsule material. About 100 mg of fluid and 50 mg of the powdered mineral mixture were loaded into the capsules. These were then welded, plunged into boiling oil to check for leaks, and then kept in an oven for at least 12 h at 120 °C to homogenize the fluid inside the capsules. Before and after each of those steps, capsules were weighed, and no fluid loss was detected.
Experiments were performed in an internally heated pressure vessel, operating vertically and pressurized with Ar–H2 gas mixtures (ISTO, Orléans). Up to seven capsules were loaded into the vessel and ran simultaneously under the same P, T, and fH2 conditions. A total of six experimental runs were completed in this study. Pressure was recorded by a transducer calibrated against a Heise Bourdon tube gauge (uncertainty ±2 MPa). A Kanthal furnace was used, and the temperature was continuously controlled by two type-K thermocouples located at the base and the top of the furnace hotspot (uncertainty ±5 °C). At the end of the experiments, the furnace power was switched off, allowing the system to cool to room temperature within ∼5 min. The capsules were then removed from the vessel and weighed: no leakage was identified. They were subsequently opened, and their contents were rinsed with ultrapure H2O using a Büchner filtration system equipped with a nylon membrane. Solid fractions >0.45 µm were collected, dried in an oven at 120 °C for 20 min, and prepared for analysis. In this study, the fluid phases were not recovered and therefore were not analyzed.
Previous experimental studies on tourmaline crystallization typically lasted between 140 and 240 h at 600 °C (Cheng et al., 2019; Morgan and London, 1989; von Goerne et al., 1999a, 2001; Orlando et al., 2017). However, the attainment of equilibrium in some of these experiments has been questioned (Orlando et al., 2017). Accordingly, in the present study, the duration of the 600 °C experiments was extended to 336–361 h. At 500 °C, run durations were approximately 1 month (666 h for run 3 and 694 h for run 4; Table 2), whereas, at 400 °C, they reached up to 2 months (1379 h).
Table 2Experimental conditions and results.
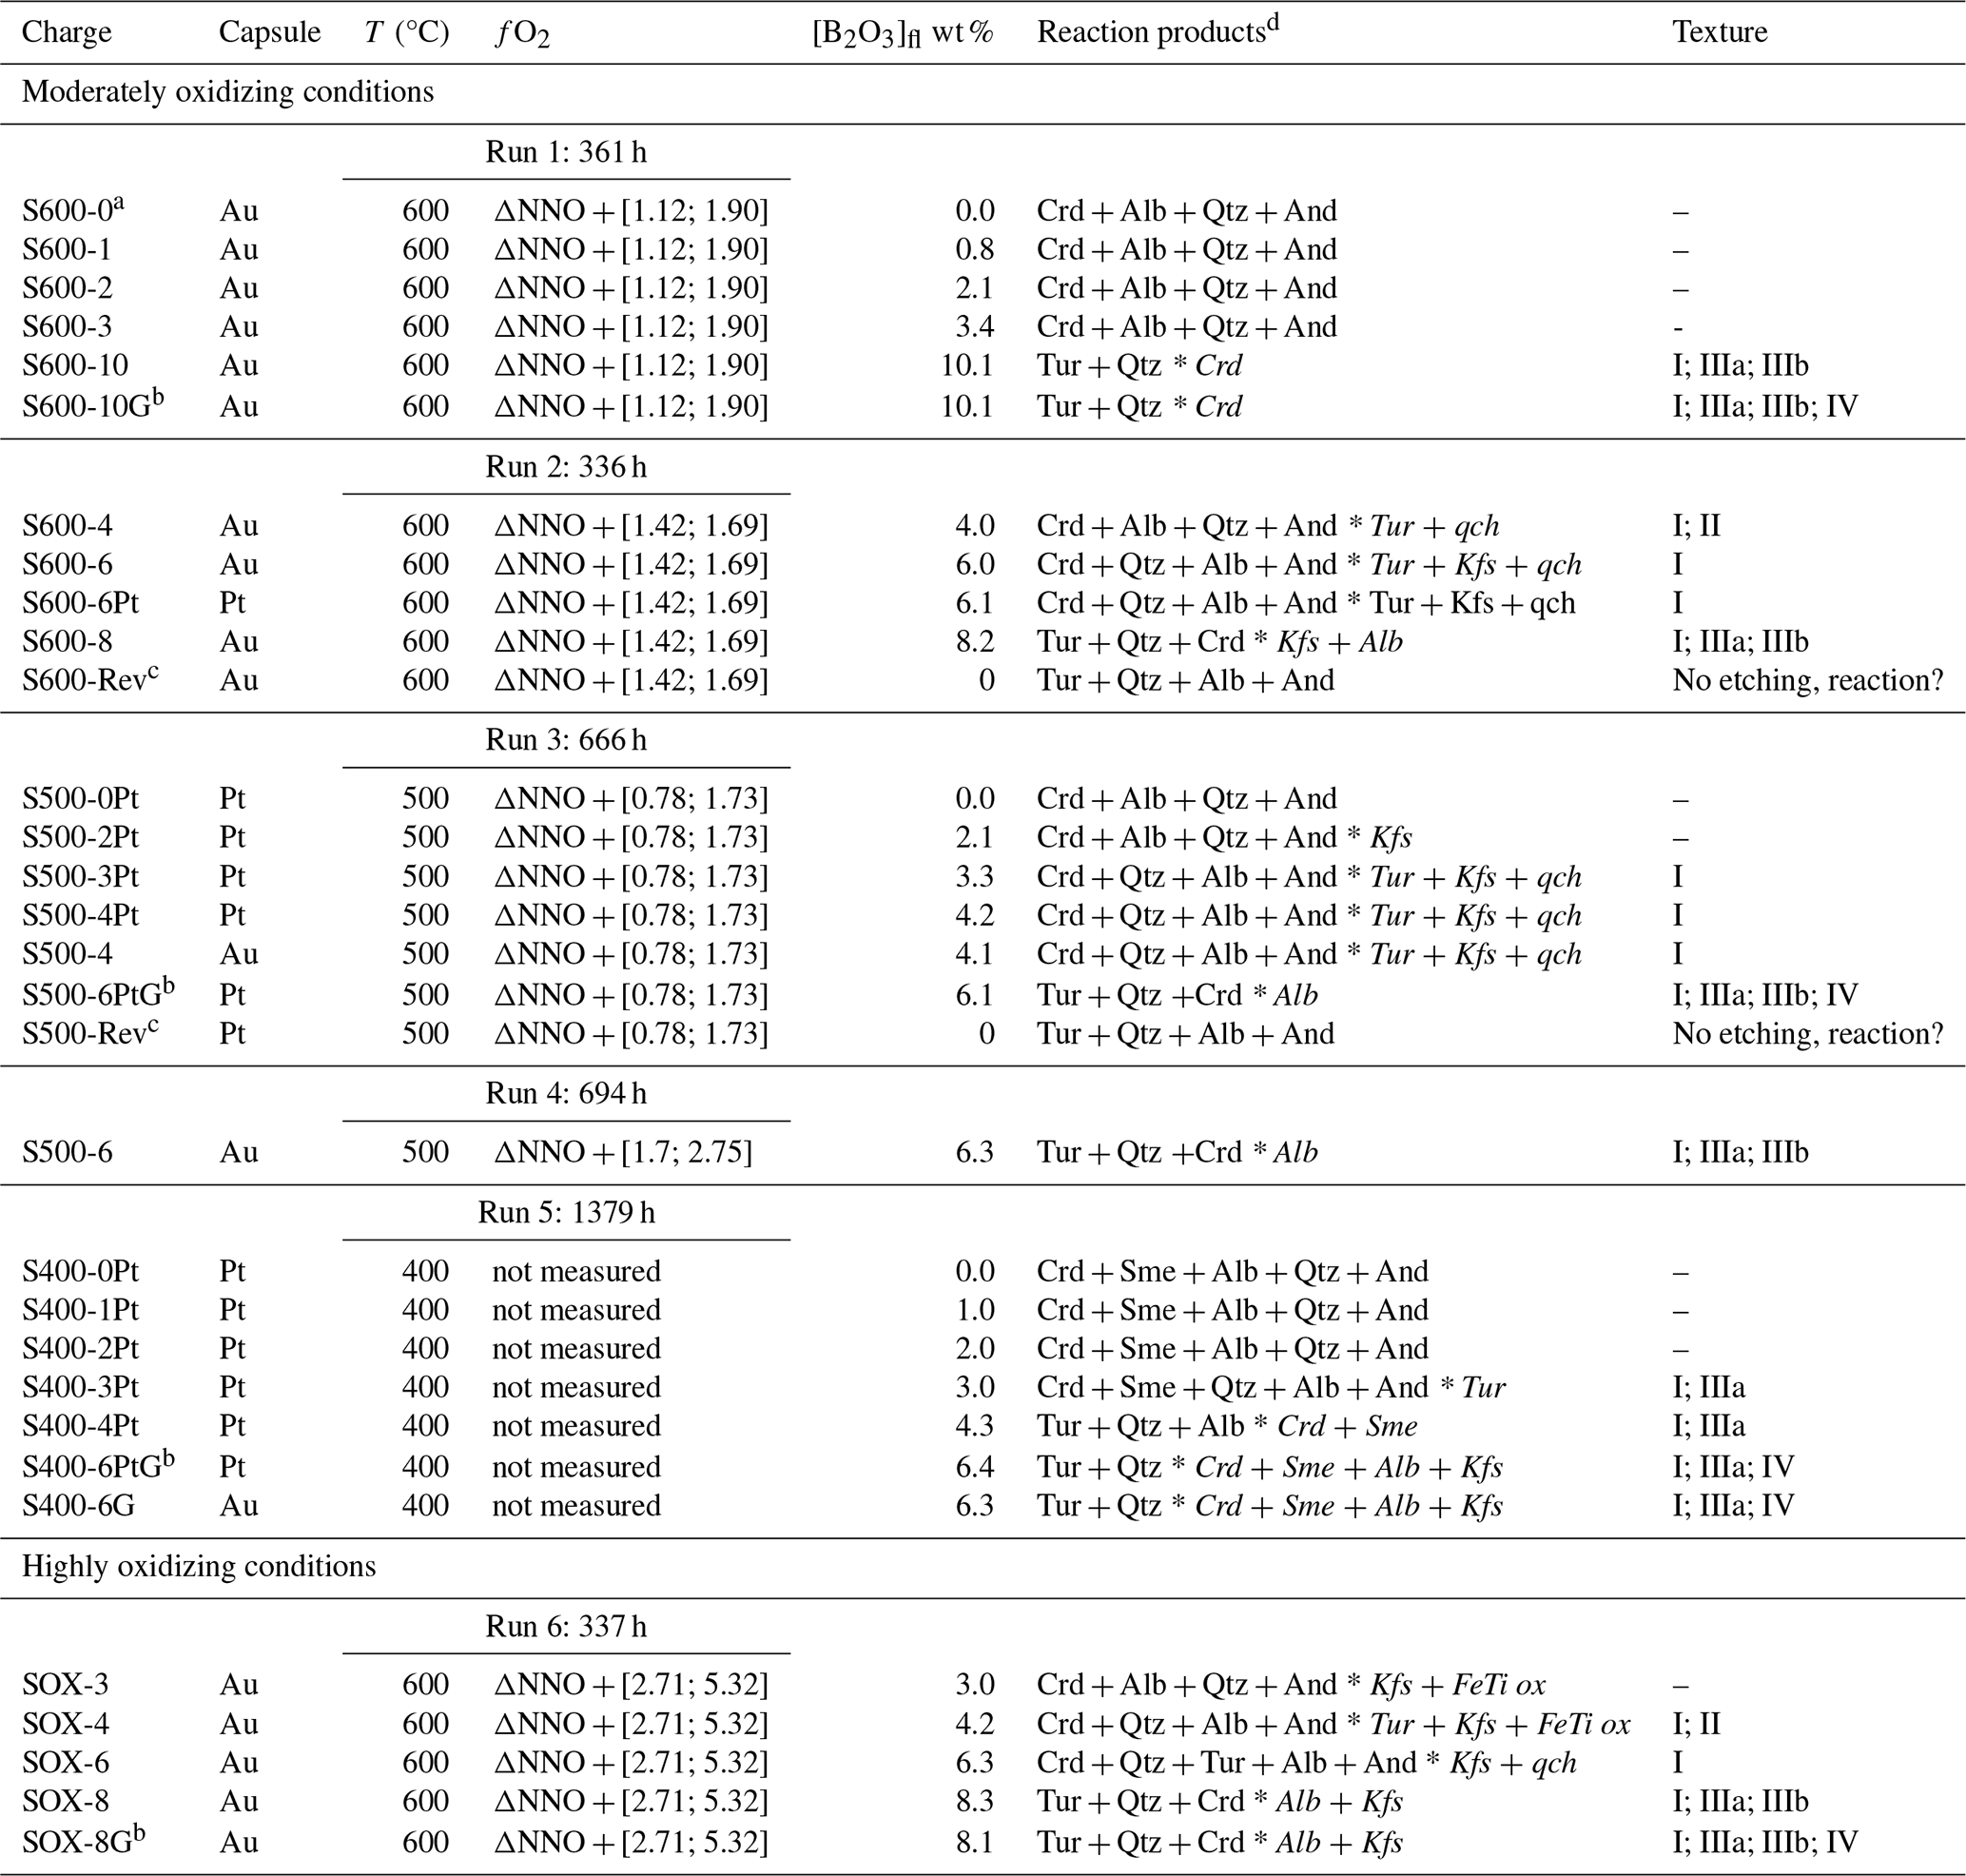
a Forward experiment performed with a starting tourmaline-free mixture except when otherwise noted. b Forward experiment with tourmaline seeds added. c Reversal experiment performed with a tourmaline-bearing starting mixture (see text). The asterisk separates the phases confirmed by XRD (left side, ordered by proportion) from the others, identified by SEM and EDS (right side, in italic). Mineral abbreviation: Alb – albite; And – andalusite; Crd – cordierite; FeTi ox – Fe Ti oxides; Kfs – potassium feldspar; Qtz – quartz; Sme – smectite; Tur – tourmaline. qch: quench phases.
Redox conditions were controlled by adjusting the proportion of H2 in the pressurizing Ar-H2 gas (Scaillet et al., 1992). First, H2 was introduced at room temperature, followed by Ar. Most experiments were performed with an initial pH2 of 0.2 MPa and one highly oxidizing experiment with an H2-free gas mixture. In the 600 and 500 °C experiments, experimental fH2 and fO2 were measured with solid sensors (Taylor et al., 1992). Each sensor comprised two NiO–NiPd pellets plus about 15 mg H2O loaded in a separate capsule, mostly made of Pt and, in one case, of Au since H2 permeability is higher in Pt than in Au (Gunter et al., 1987). Pellets were made from NiPd powders of given Ni atomic fractions (XNi), either 0.15 or 0.5, mixed with NiO powder in a weight proportion. The fO2 in the sensor was determined from XNi measured via microprobe after the experiment using the Pownceby and O'Neill (1994) calibration, which was extrapolated down to 500 °C (Fig. S1 in the Supplement). At 500 and 600 °C, calculations show that H2 permeabilities in Pt and Au are sufficient to equilibrate fH2 across all capsules present given our experimental durations. Thus, for a given run (fixed P–T-fH2), the fH2 in the sensor and experimental capsules are identical. The fO2 values in the sensor and experimental capsules are also identical since fH2O ∼fH2O° (the fugacity of pure water at experimental P and T) if pure H2O fluids are assumed in both the sensor and experimental capsules. At 400 °C, very long timescales are necessary for NiPd to react and for fH2 to equilibrate across all capsules present because 400 °C lies well below the calibration range of the NiO–NiPd sensor (Pownceby and O'Neill, 1994). The redox conditions in the 400 °C experiment were not measured with the sensor but were assumed to be of the same range as in the higher-temperature experiments performed with initial pH2=0.2 MPa.
2.4 Analytical procedure
All experimental products were examined with an optical microscope using an immersion oil. The starting and experimentally reacted powders were examined with a Merlin compact ZEISS scanning electron microscope (SEM, ISTO, Orléans) operated at 15 kV and equipped with a Bruker EDS (Energy Dispersive Spectroscopy) detector (QUANTAX-Xflash6). The morphology of the grains was studied under secondary electron imaging (SEI). Backscattered electron imaging (BSE) was employed for phase identification and textural characterization.
Starting and experimental powders were analyzed by X-ray diffraction (XRD) using an INEL transmission diffractometer with a Debye-Scherrer geometry (ISTO, Orléans). The powders were loaded in Mark capillary glass (diameter 0.3 mm), and the INEL CPS 120 curved detector and CoKα1 monochromator (λKα1Co=1.78897 Å) allowed data acquisition between 3 and 90° 2θ with a resolution of 0.03°. The standard ICDD PDF 2004 database was used to identify mineral phases and to qualitatively estimate their relative proportions. It should be noted that X-ray diffraction may not detect tourmaline if it is below ∼10 wt % due to the small volume analyzed.
Mineral phases were analyzed with a CAMECA SX Five electron microprobe (ISTO-BRGM, Orléans) operated under an acceleration voltage of 15 kV, a beam current of 7 nA, a counting time of 10 s on peak and 5 s on background, and a 1–2 µm beam. Na was analyzed first to minimize any migration problems. Standards included albite (SiKα and NaKα), synthetic MnTiO3 (MnKα and TiKα), andalusite (AlKα), Fe2O3 (FeKα), MgO (MgKα), andradite (CaKα), and orthoclase (KKα). As neither boron nor hydrogen were measured, tourmaline analyses with totals between 84 wt % and 89 wt % were considered to be satisfactory (see below), and those outside these limits were rejected. Tourmaline structural formulae were calculated according to Morgan (2016), assuming 4 atoms per formula unit (apfu) OH and 3 apfu IIIB.
Difficulties were encountered during electron microprobe analysis of tourmaline due to their fine-grained textures and morphologies. Experimental tourmaline crystals rarely exceeded ∼2 µm in width, making the accurate analysis of isolated fibers impracticable. However, reliable analyses could be obtained where several fibers intersected, providing sufficient analytical volume. Consequently, not all tourmaline types could be characterized, and only those displaying favorable textures (see below) were suitable for reproducible quantitative analysis.
2.5 Rationale behind the P–T–fO2 experimental setup
Boron metasomatism and tourmalinization in granitic bodies and their country rock aureoles mostly occur between 100 and 300 MPa (e.g., Kontak and Clark, 2002; Drivenes et al., 2016; Launay et al., 2018; Korges et al., 2020; Legros et al., 2022) and between 300 and 600 °C (Charoy, 1979; Kontak and Clark, 2002; Frikken et al., 2005; Codeço et al., 2017; Orlando et al., 2017; Harlaux et al., 2020; Legros et al., 2022). For this study, a pressure of 200 MPa and temperatures between 400 and 600 °C were selected. Hydrothermal boron-rich systems developed around and within granitic plutons are generally oxidizing, with an fO2 varying from above HM down to NNO (Williamson et al., 2000; Frikken et al., 2005; Li et al., 2017; Harlaux et al., 2020). Experiments in this study cover the appropriate fO2 range (ΔNNO ∼1 to 5, Table 2; ΔNNO is the deviation from the fO2 of the NNO oxygen buffer calculated at the P and T of interest; Pownceby and O'Neill, 1994). The moderately oxidizing experiments performed with 0.2 MPa initial pH2 have ΔNNO mostly between ∼1 to 2, increasing to 1.8 to 2.6 in run 4, as detailed in Sect. S1 and Fig. S1. The fO2 in run 6 (ΔNNO = 2.7 to 5.3) is appropriate for the highly oxidizing conditions of some hydrothermal systems (Williamson et al., 2000).
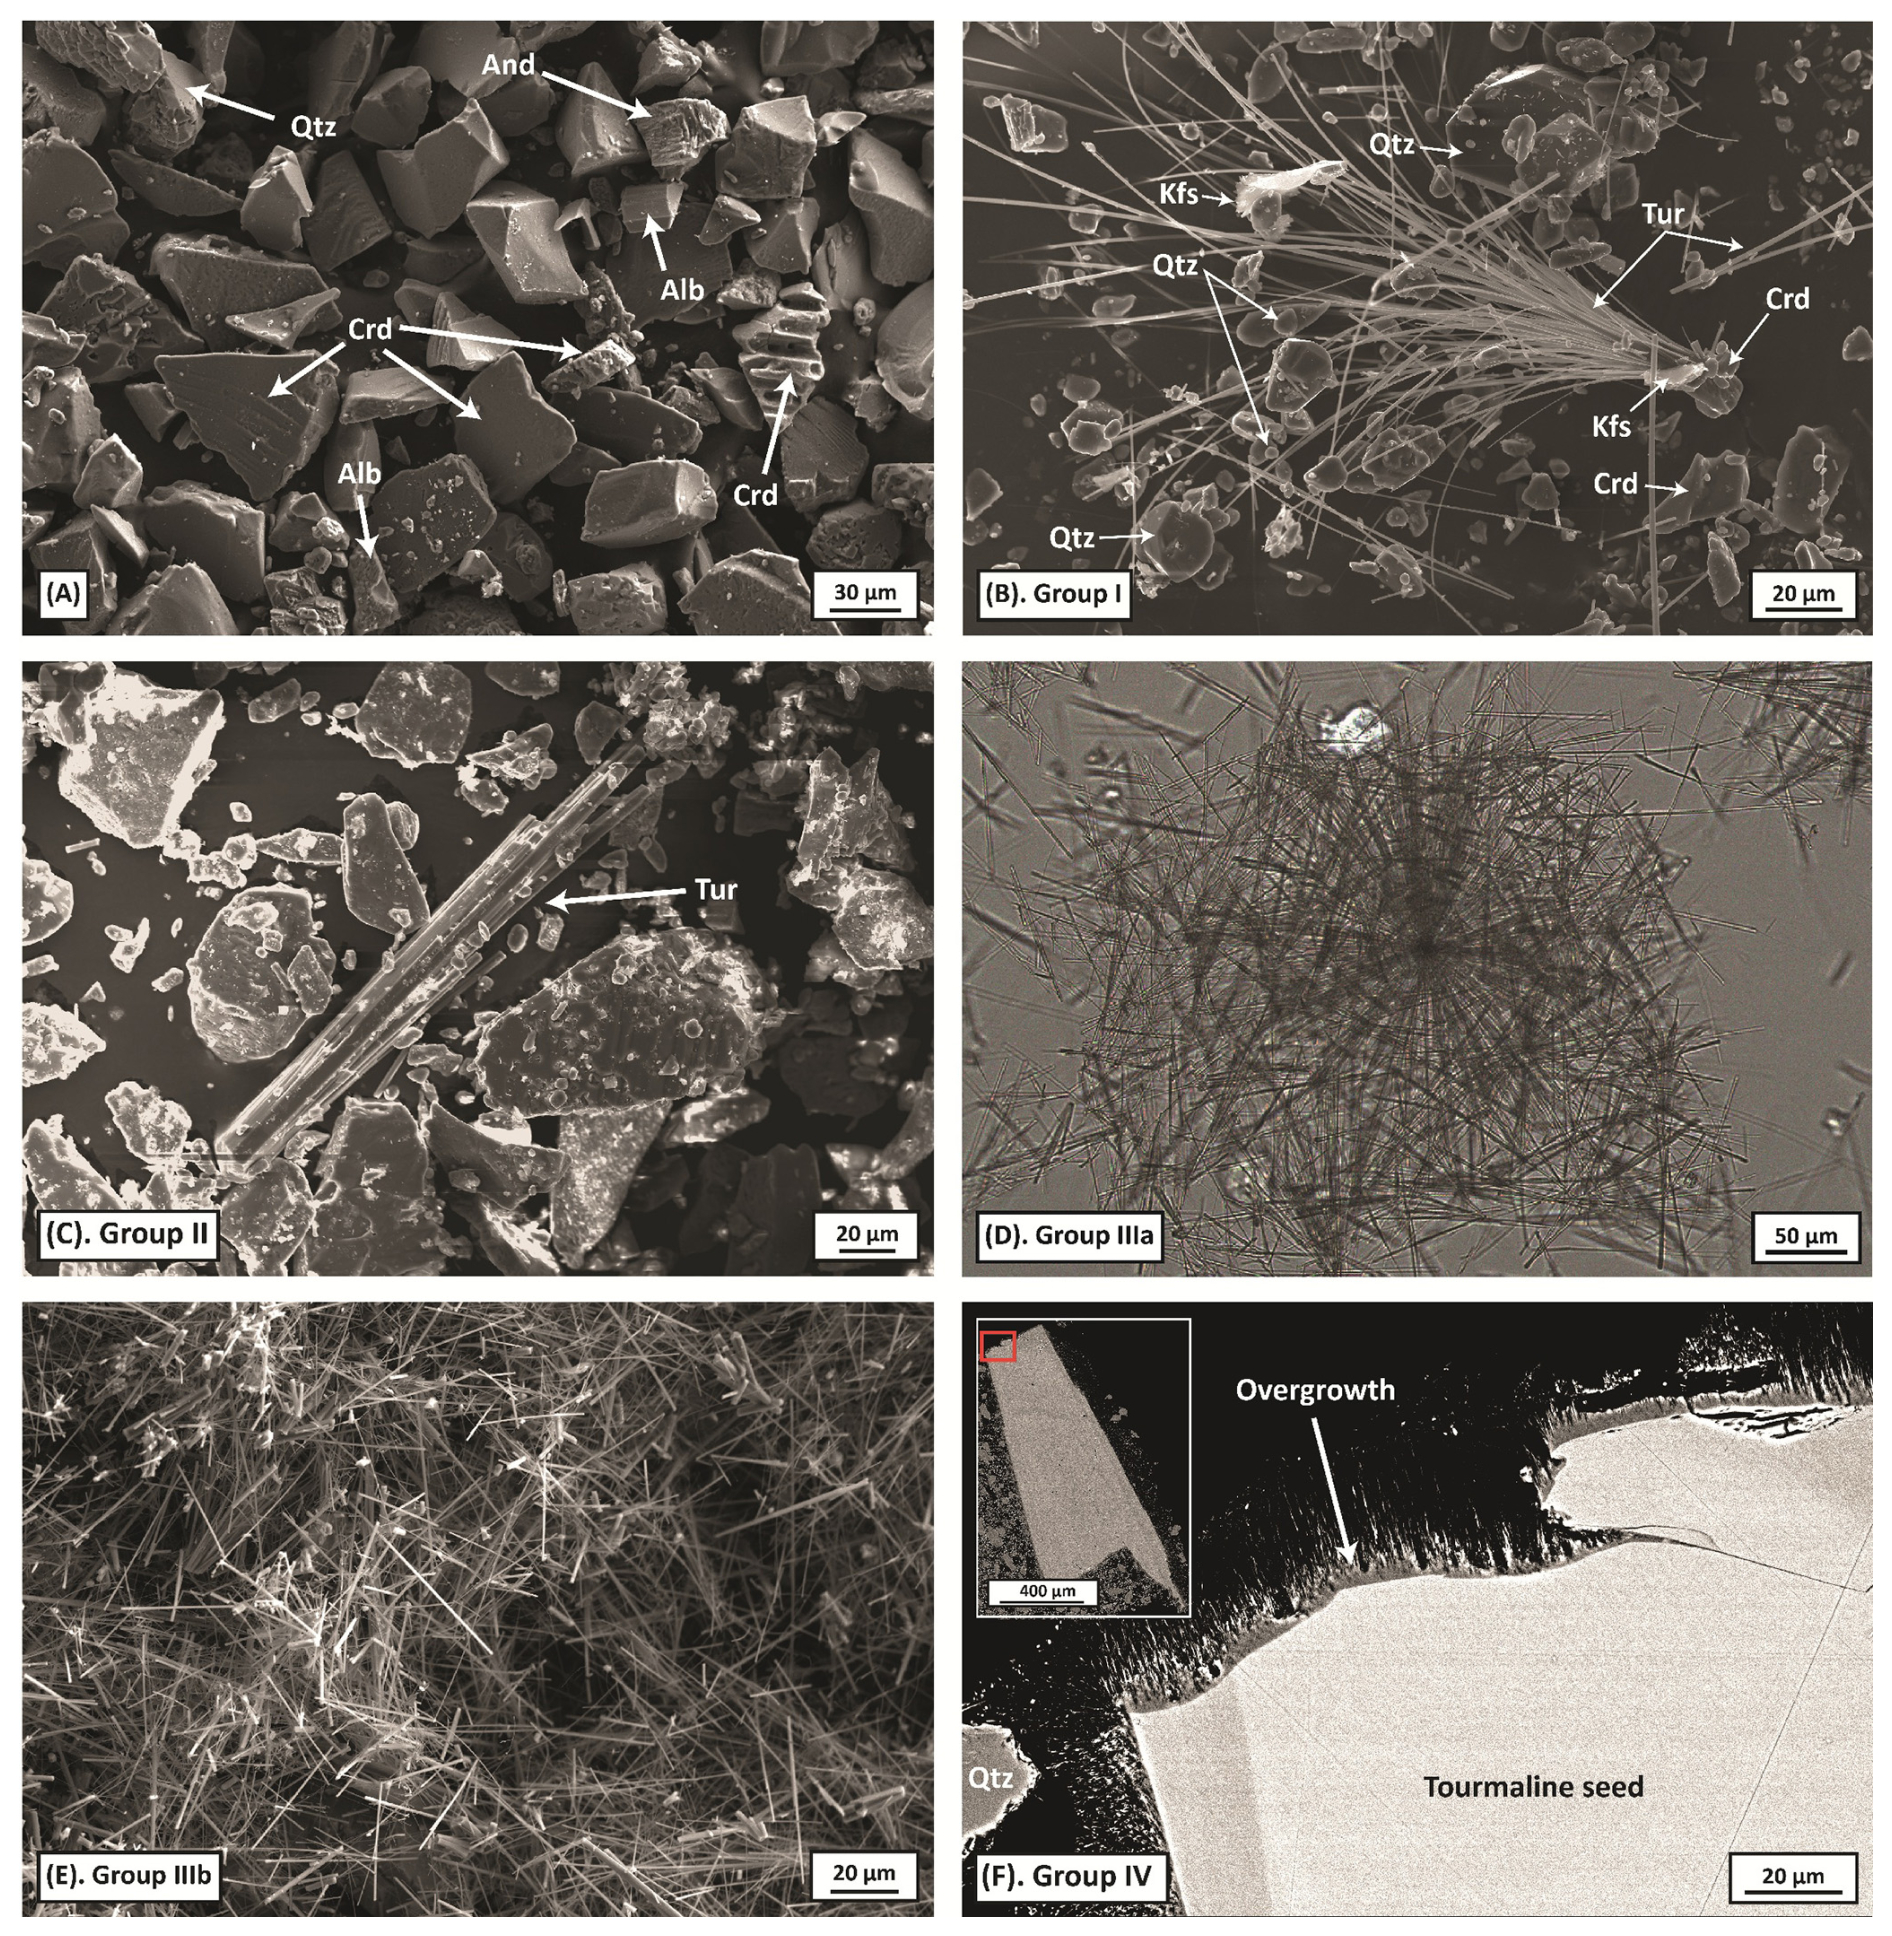
Figure 1SEM and optical microscope images of products from forward experiments. Experimental conditions are given in Table 2. (A) Charge S600-0. All starting mineral phases coexist (Alb: albite; And: andalusite; Crd: cordierite; Kfs: K-feldspar; Qtz: quartz) with etch pits on the rightmost cordierite grain. (B) Charge S600-6. Group I tourmaline (Tur) sheaves nucleated on Crd. Platy Kfs crystals and small Qtz crystallized along the sheaves. Note the larger size and euhedral edges of starting Qtz crystals. (C) Charge SOX-4 showing a Group-II tourmaline (Tur). (D) Charge S600-10 showing a Group-IIIa tourmaline aggregate in the solid fraction. (E) Charge S600-10 showing Group-IIIb tourmaline aggregates found floating at the surface of the fluid. (F) Charge S500-6PtG showing Group-IV tourmaline overgrowths forming a hairy texture parallel to the long axis of the seed. Note that the texture is less developed on other faces of the seed.
3.1 Experimental products
All experimental products comprised a free fluid and solid materials. In B-rich charges, a thin film of solid products was found floating on the surface. At 600 and 500 °C, the major mineral phases, systematically present in XRD spectra of experimental products (Table 2), are cordierite, albite, andalusite, quartz, and tourmaline. When tourmaline was absent, mineral sizes were generally reduced, and dissolution textures were developed on cordierite, andalusite, and albite (Fig. 1A). At 400 °C (run 5, Table 2), cordierite was replaced by sheeted minerals (Fig. S2), identified as belonging to the smectite group by XRD. Accessory phases, detected only by SEM, include K-feldspar and Fe–Ti oxides. The former is common (Table 2) and often euhedral (Fig. 1B), and it may contain cores of relict albite. The latter is restricted to the highly oxidizing run 6 (Table 2). SEM imaging and EDS analyses show that Fe–Ti oxides are small (<10 µm) and consist of an anhedral Ti-rich core (presumably a former ilmenite inclusion) surrounded by a euhedral Fe-rich overgrowth (probably an Fe oxide).
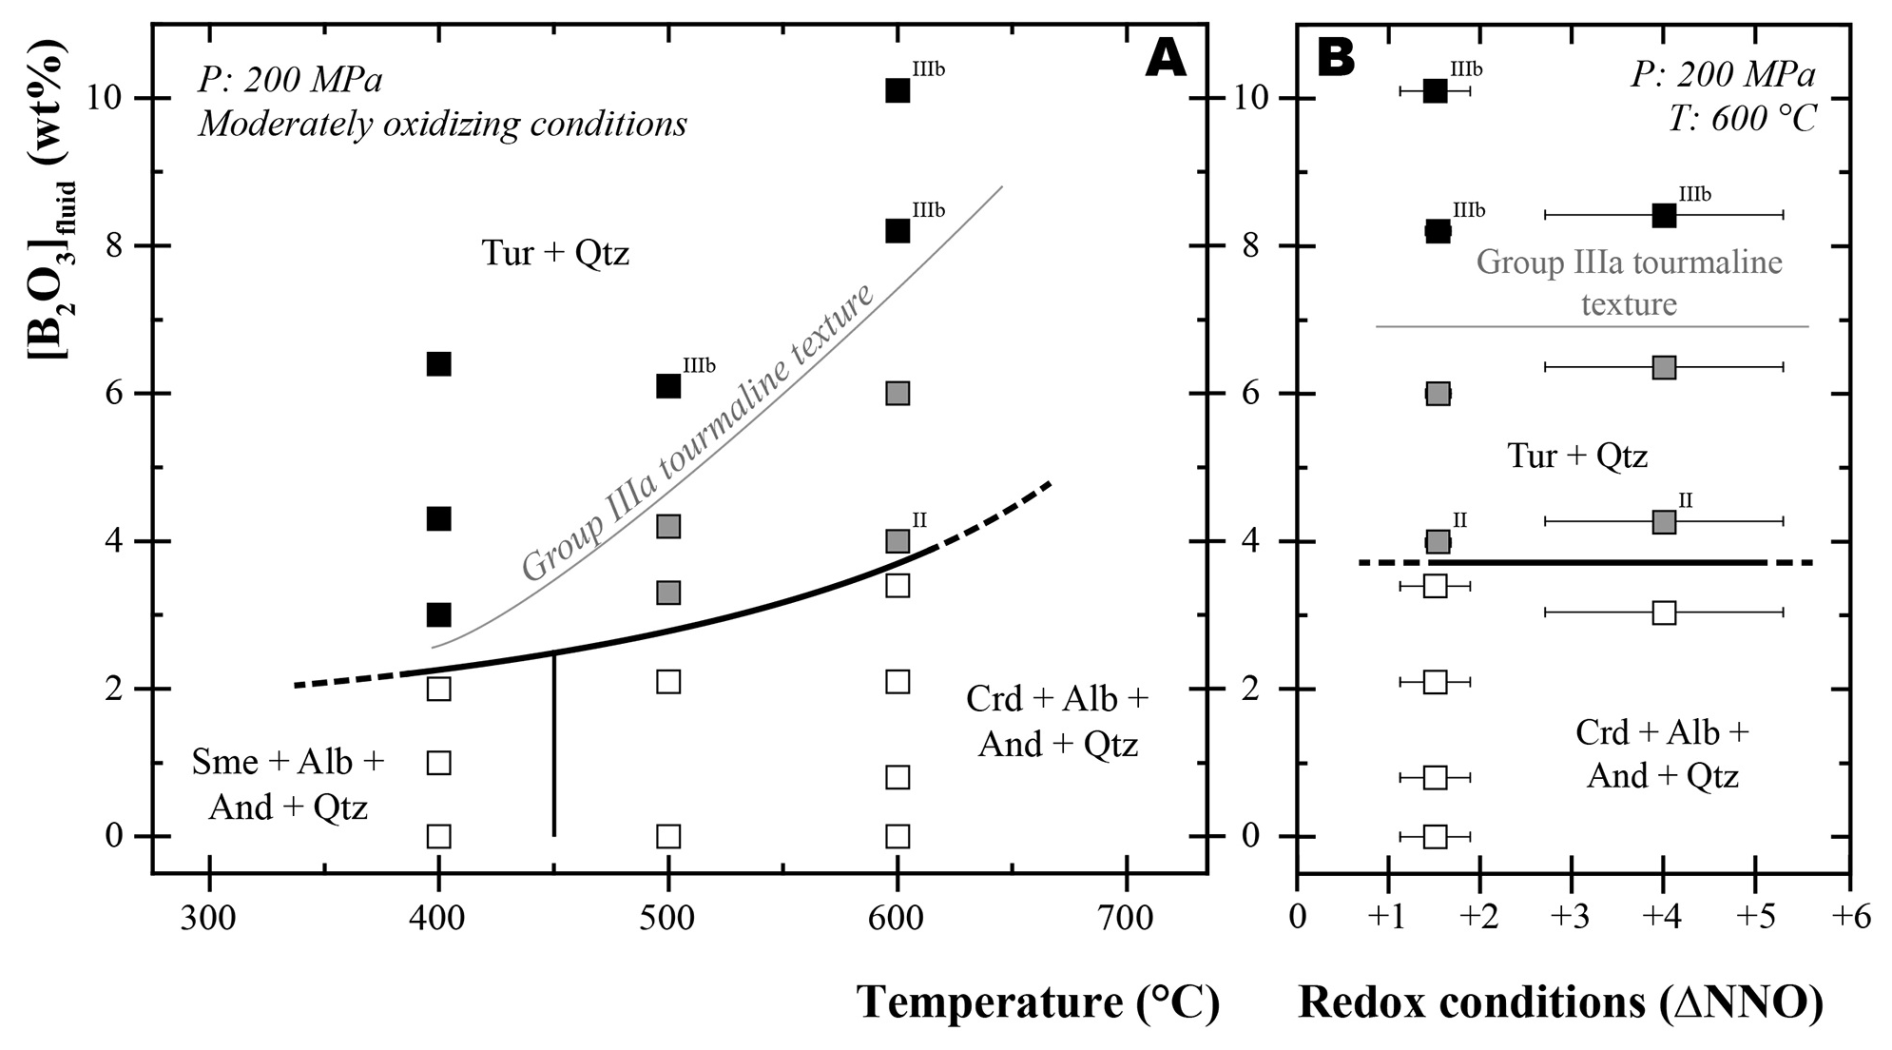
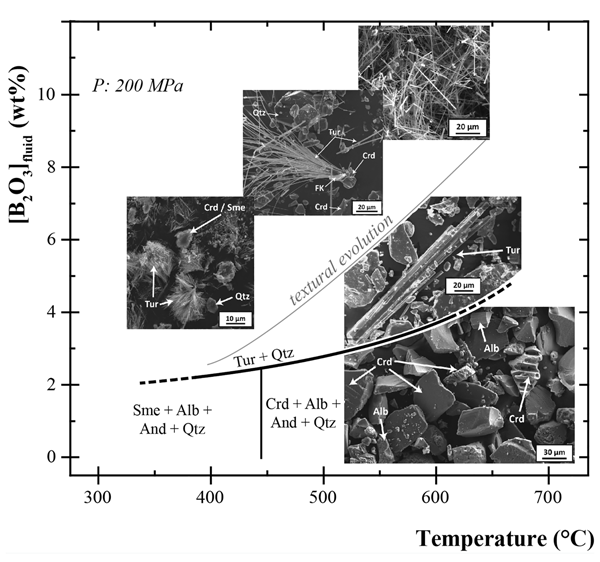
Figure 2Phase assemblages and tourmaline textures as a function of [B2O3]fluid, i.e., the fluid concentration in the starting material, used for bracketing the equilibrium concentration (see Sect. 4). (A) At different temperatures under moderately oxidizing conditions. (B) At variable fO2 in the 600 °C experiments. ΔNNO denotes the deviation from the Ni–NiO buffer calculated at the experimental P and T (see text). Solid and open symbols are used for tourmaline-bearing and tourmaline-free charges, respectively, whereas black and gray symbols indicate Group-IIIa-bearing and Group IIIa-free textures, respectively. Charges with Group-II and Group-IIIb tourmaline present are labeled with the superscripts II and IIIb. The thick black lines are stability boundaries, and the gray lines delimit conditions of the appearance of Group-IIIa tourmalines. Abbreviations as in Fig. 1; Sme: smectite.
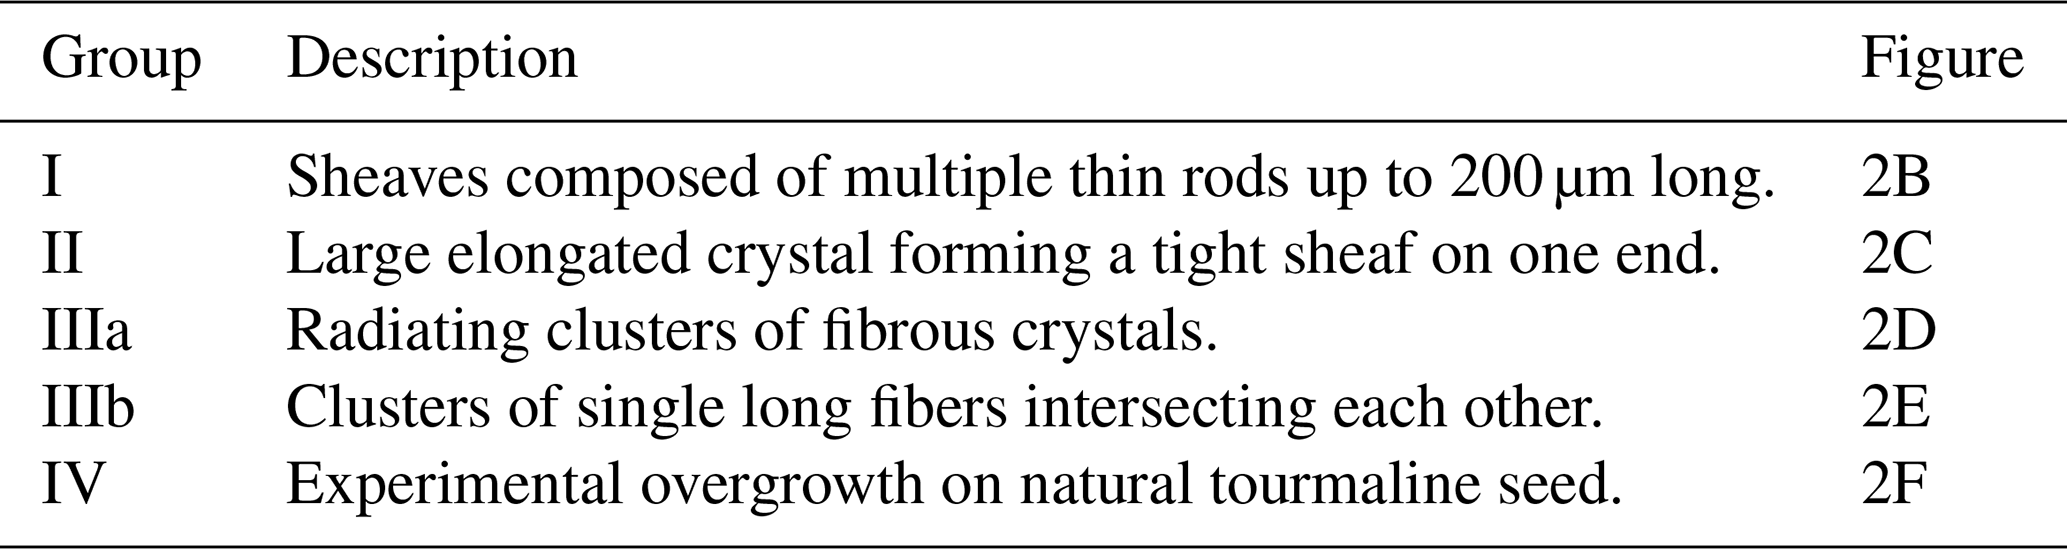
Tourmaline textures were subdivided into four groups (Table 3, Fig. 2A). Group-I tourmalines, mostly <1 µm wide, occur as sheaves up to 200 µm long. Albite, cordierite, and K-feldspar, with a relict of albite core, occur at the base of the sheaf with small quartz crystals present along the rods. The submicrometric materials around the sheaves probably represent quench products. Group-II tourmalines form large (10 to 20 µm wide) individual crystals (Fig. 1C) that are relatively rare, whereas Group III refers to radiating clusters of fibrous tourmaline crystals (fibro-radiated aggregates, Fig. 1D). These clusters were found both within the solid portion of the charge (Group IIIa) and forming the thin film floating in the fluid (Group IIIb, Fig. 1E). Phases associated with the Group-IIIa crystals include euhedral quartz and strongly reacted cordierite and albite. The Group-IV tourmalines correspond to overgrowths on tourmaline seeds (Fig. 1F). They develop on specific crystallographic faces, grow parallel to the seed long axis, and form a hairy texture with thin fibers.
3.2 Phase assemblages, tourmaline appearance, and associated textures
These are detailed in Table 2. No systematic differences were noted with respect to the capsule material, and experiments performed in Au and Pt capsules yielded mutually compatible results.
3.2.1 Effect of [B2O3]fluid
At 600 °C in the moderately oxidizing run 1, tourmaline is absent (undetected by SEM or XRD) at low [B2O3]fluid (0 wt %, 0.8 wt %, 2.1 wt %, 3.4 wt %), and the starting assemblage cordierite + albite + andalusite + quartz is stable (Table 2, Fig. 1A). As [B2O3]fluid increases, tourmaline, in the form of mostly Group-III and Group-I crystals, appears in S600-10 and S600-10G ([B2O3]fluid=10.1 wt %, Table 2). In run 2, SEM observations reveal that tourmaline is present at the lowest boron concentration ([B2O3]fluid=4 wt %, S600-4, Table 2) and appears mainly as Group I, with a few Group-II crystals. Therefore, the two 600 °C moderately oxidizing experiments consistently indicate that tourmaline appears for an initial boron fluid concentration ≥4 wt %. At 500 °C, tourmaline is found for [B2O3]fluid>3.3 wt % and, at 400 °C, for [B2O3]fluid>3 wt % (Fig. 2).
For a higher [B2O3]fluid, the proportions of reactant phases (albite, andalusite, cordierite) decrease markedly, and tourmaline + quartz becomes the predominant phase assemblage in experimental products, accompanied mainly by cordierite (at 600 and 500 °C) and smectite (at 400 °C) plus additional minor phases including K-feldspar (Table 2). These changes in phase assemblages are paralleled by an evolution in tourmaline textural types. Increasing the fluid boron concentration increases the proportions of Group-I tourmalines (and also their length and width), while Group-II crystals disappear (S600-4 and S600-6, Run 2, Table 2). The Group-IIIa and Group-IIIb tourmaline textural types become dominant in charges with the highest boron concentrations at 600 and 500 °C, where they coexist with Group I. At 400 °C, only Group IIIa is present with Group I (Table 2).
The two reversal experiments performed with the addition of tourmaline and [B2O3]fluid=0 wt % at 600 and 500 °C (S600-Rev, Run 2, S500-Rev, Run 3, Table 2) yielded unchanged phase assemblages compared to the starting mixture. Quartz, albite, and andalusite partially dissolved, and they experienced a grain size reduction. Tourmalines were carefully checked by SEM for the presence of etching textures at their edges and surfaces, but none were clearly recognized (Fig. S3). Therefore, no evidence was found that cordierite was formed or that tourmaline had been consumed in the reversal experiments.
3.2.2 Effect of temperature
Decreasing temperature leads to a slight reduction in the required [B2O3]fluid for tourmaline appearance (Table 2, Fig. 2A). The evolution toward a dominant tourmaline + quartz phase assemblage requires progressively lower [B2O3]fluid from 600 to 400 °C. Similarly, Group-IIIa tourmalines appear at progressively lower [B2O3]fluid at lower temperatures (Table 2). At 400 °C, tourmaline and smectite are intergrown. Group-I tourmaline fibers become more numerous and thinner and Group-IIIa aggregates become smaller than at higher temperatures (Fig. S4).
3.2.3 Effect of fO2
Phase assemblages in the highly oxidizing 600 °C experiment are not significantly different from their moderately oxidizing counterparts. Experimental charges evolve from tourmaline-free to tourmaline-bearing assemblages when the boron fluid concentration is increased. However, fO2 has no detectable influence on the [B2O3]fluid required for tourmaline to appear (Fig. 2B). Similarly, a tourmaline + quartz assemblage stabilized at elevated [B2O3]fluid (Table 2). Texturally, the differences between the highly and moderately oxidizing experiments are minor. Proportions of Group-II tourmaline and widths of tourmaline fibers are slightly larger under highly oxidizing conditions compared to under moderately oxidizing conditions (SOX-4 vs. S600-4, Table 2).
3.3 Experimental tourmaline compositions
Not all tourmaline textural types were analyzed. Satisfactory electron microprobe data were obtained for Group-IIIa and Group-IV tourmalines. Analysis of Group-I and Group-IIIb crystals was more difficult, and fewer data are available (only three analyses for Group I). Group-II tourmalines were not analyzed because none were exposed at the surface of the polished mounts. Additionally, core compositions were evaluated only once on a large cluster of Group-IIIa crystals, but the rim could not be analyzed separately.
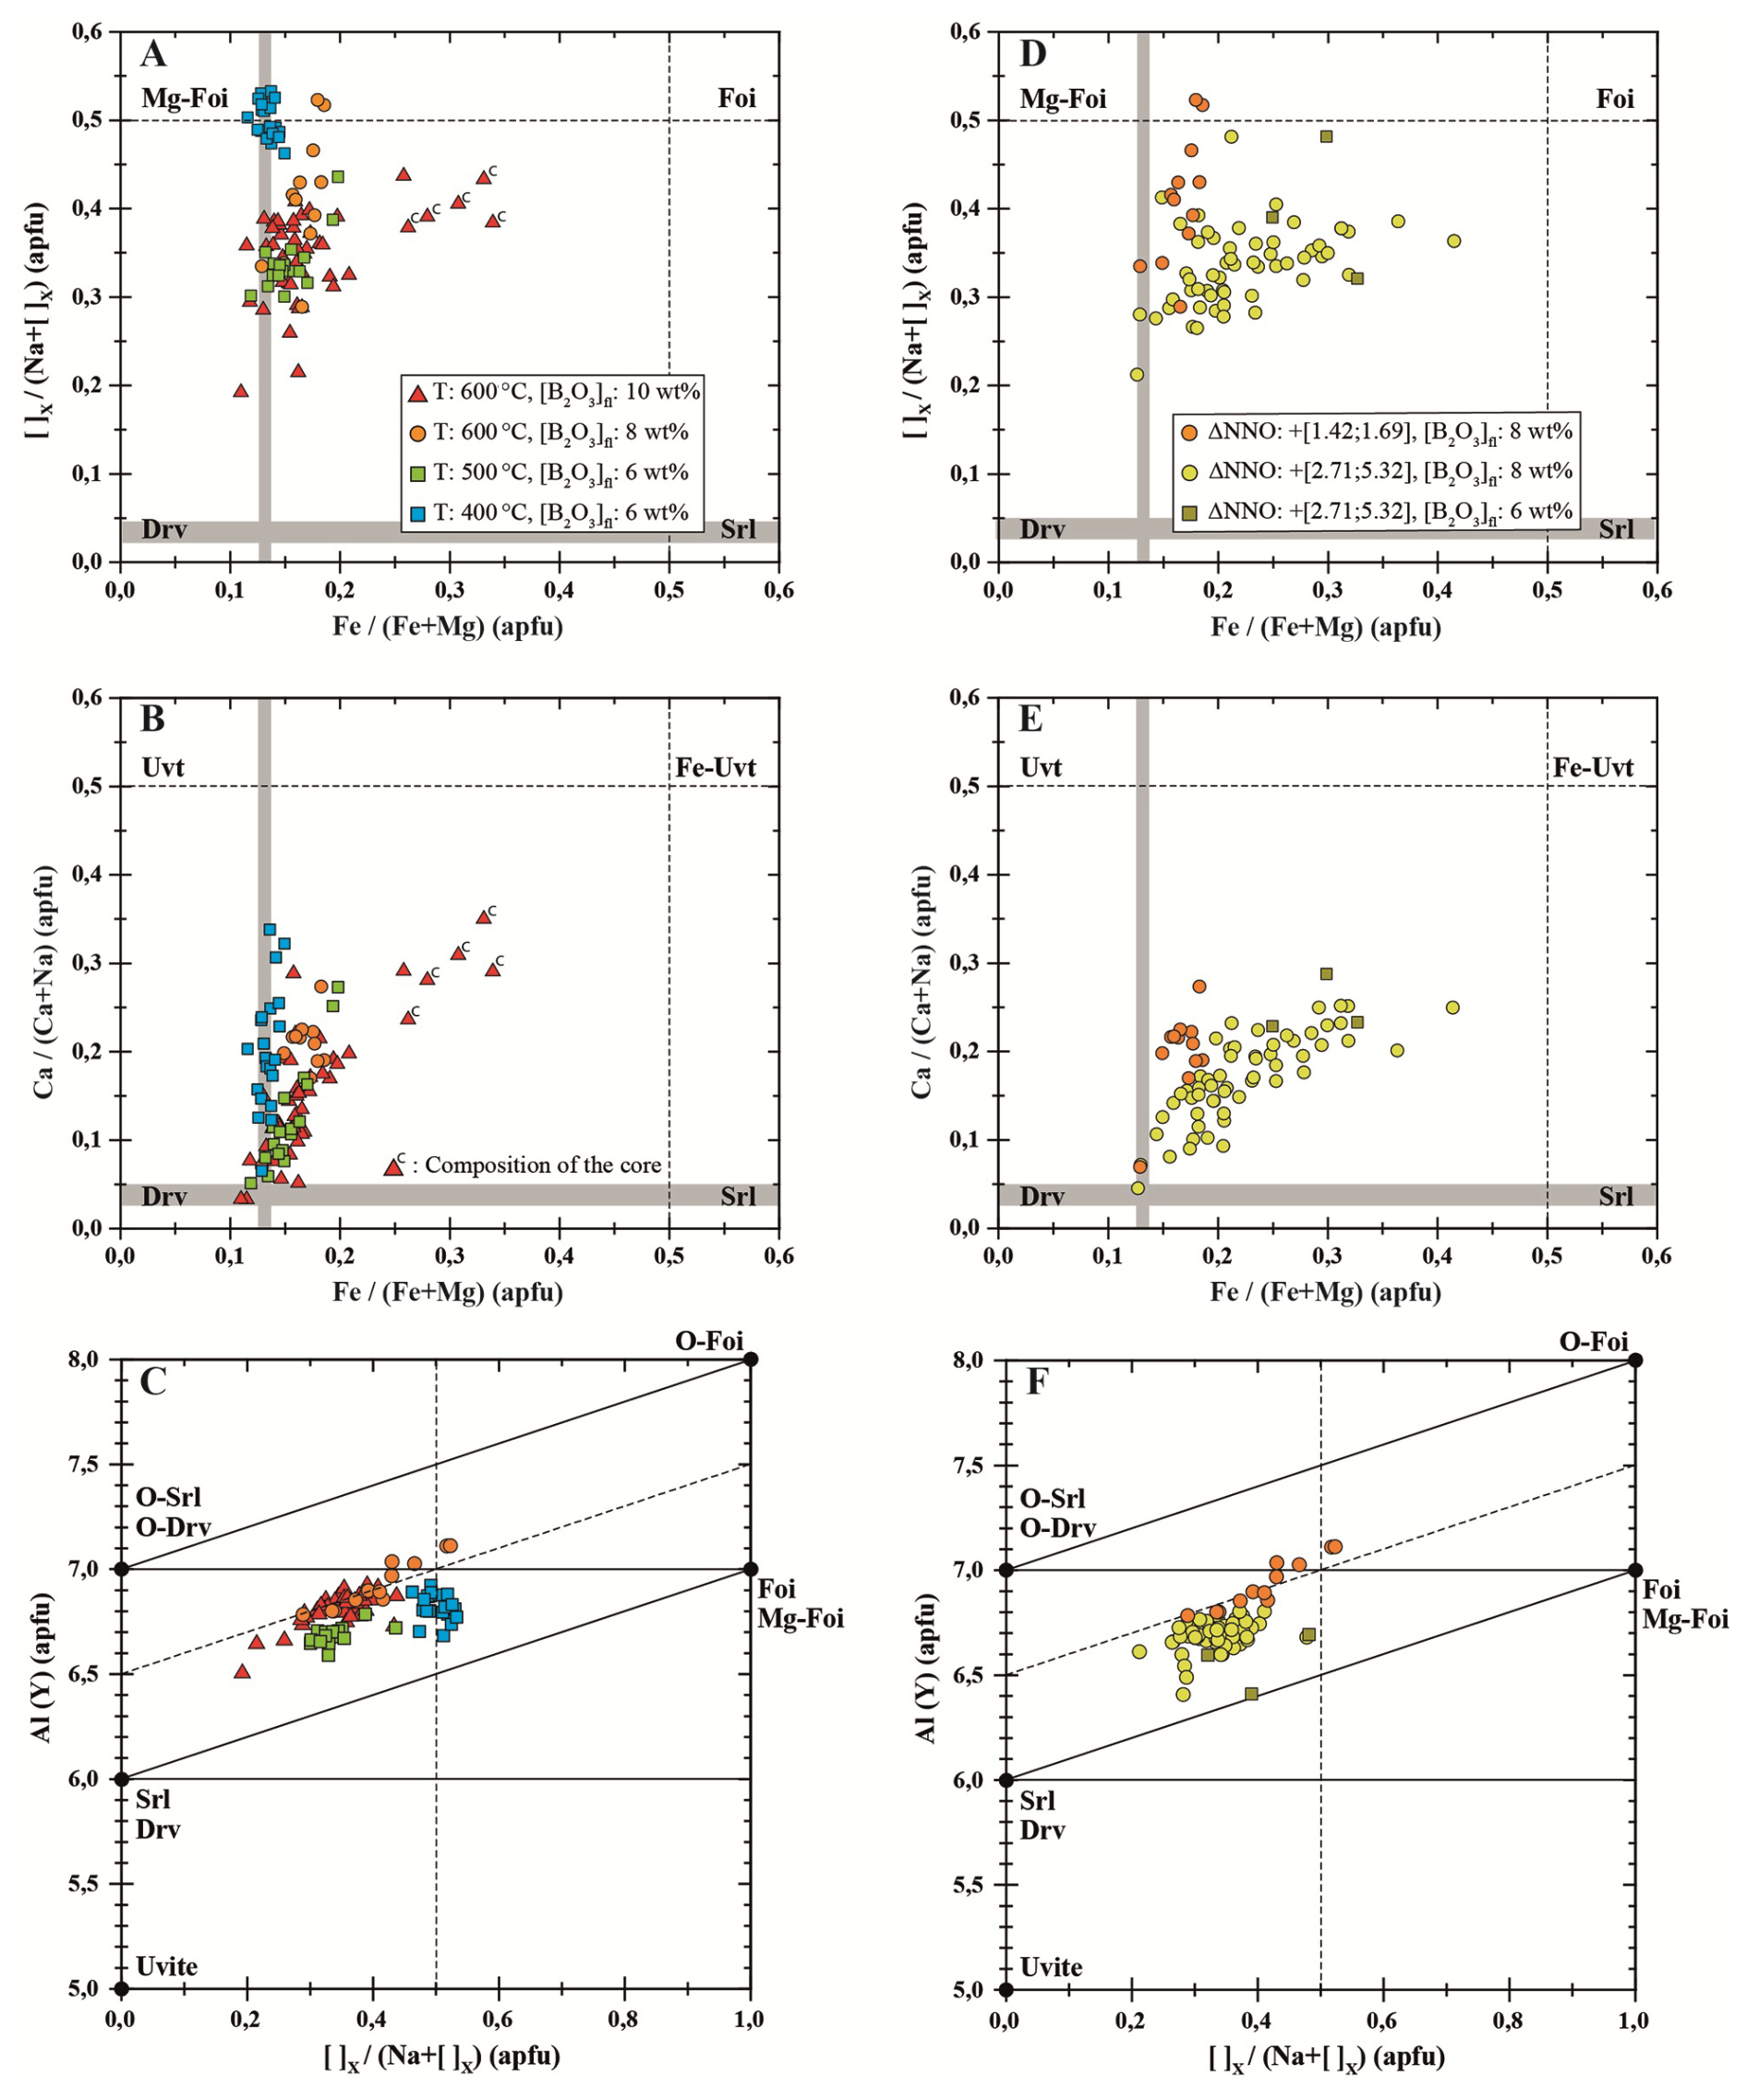
Figure 3Compositions of experimental tourmalines at different temperatures (A–C) and different fO2 values (D–F); ΔNNO is the deviation from the Ni–NiO buffer calculated at the experimental P and T (see text). Diagrams (A), (B), (D), and (E) are from Hawthorne and Henry (1999), and (C) and (F) are from Bačík et al. (2017). Tourmaline electron microprobe analyses were recalculated to atomic proportions assuming 4 atoms per formula unit (apfu) OH and 3 apfu B (Morgan, 2016). Data sources are listed in Table 4. The vertical gray bands represent the at. of the starting cordierite, whereas the horizontal gray bands represent the at. of the starting plagioclase. The thin dashed lines separate the different tourmaline domains. In (B), the data points labeled “c” refer to core (Fig. 4). The analytical resolution was insufficient to precisely determine the rim compositions. Abbreviations: Drv: dravite, Srl: schorl, Mg-Foi: Mg-Foitite, Foi: foitite, Uvt : uvite, Fe-Uvt : Fe-uvite. The “O” prefix refers to “Oxy” (Oxy-foitite, Oxy-dravite, Oxy-schorl).
Table 4Average composition of experimental tourmaline.
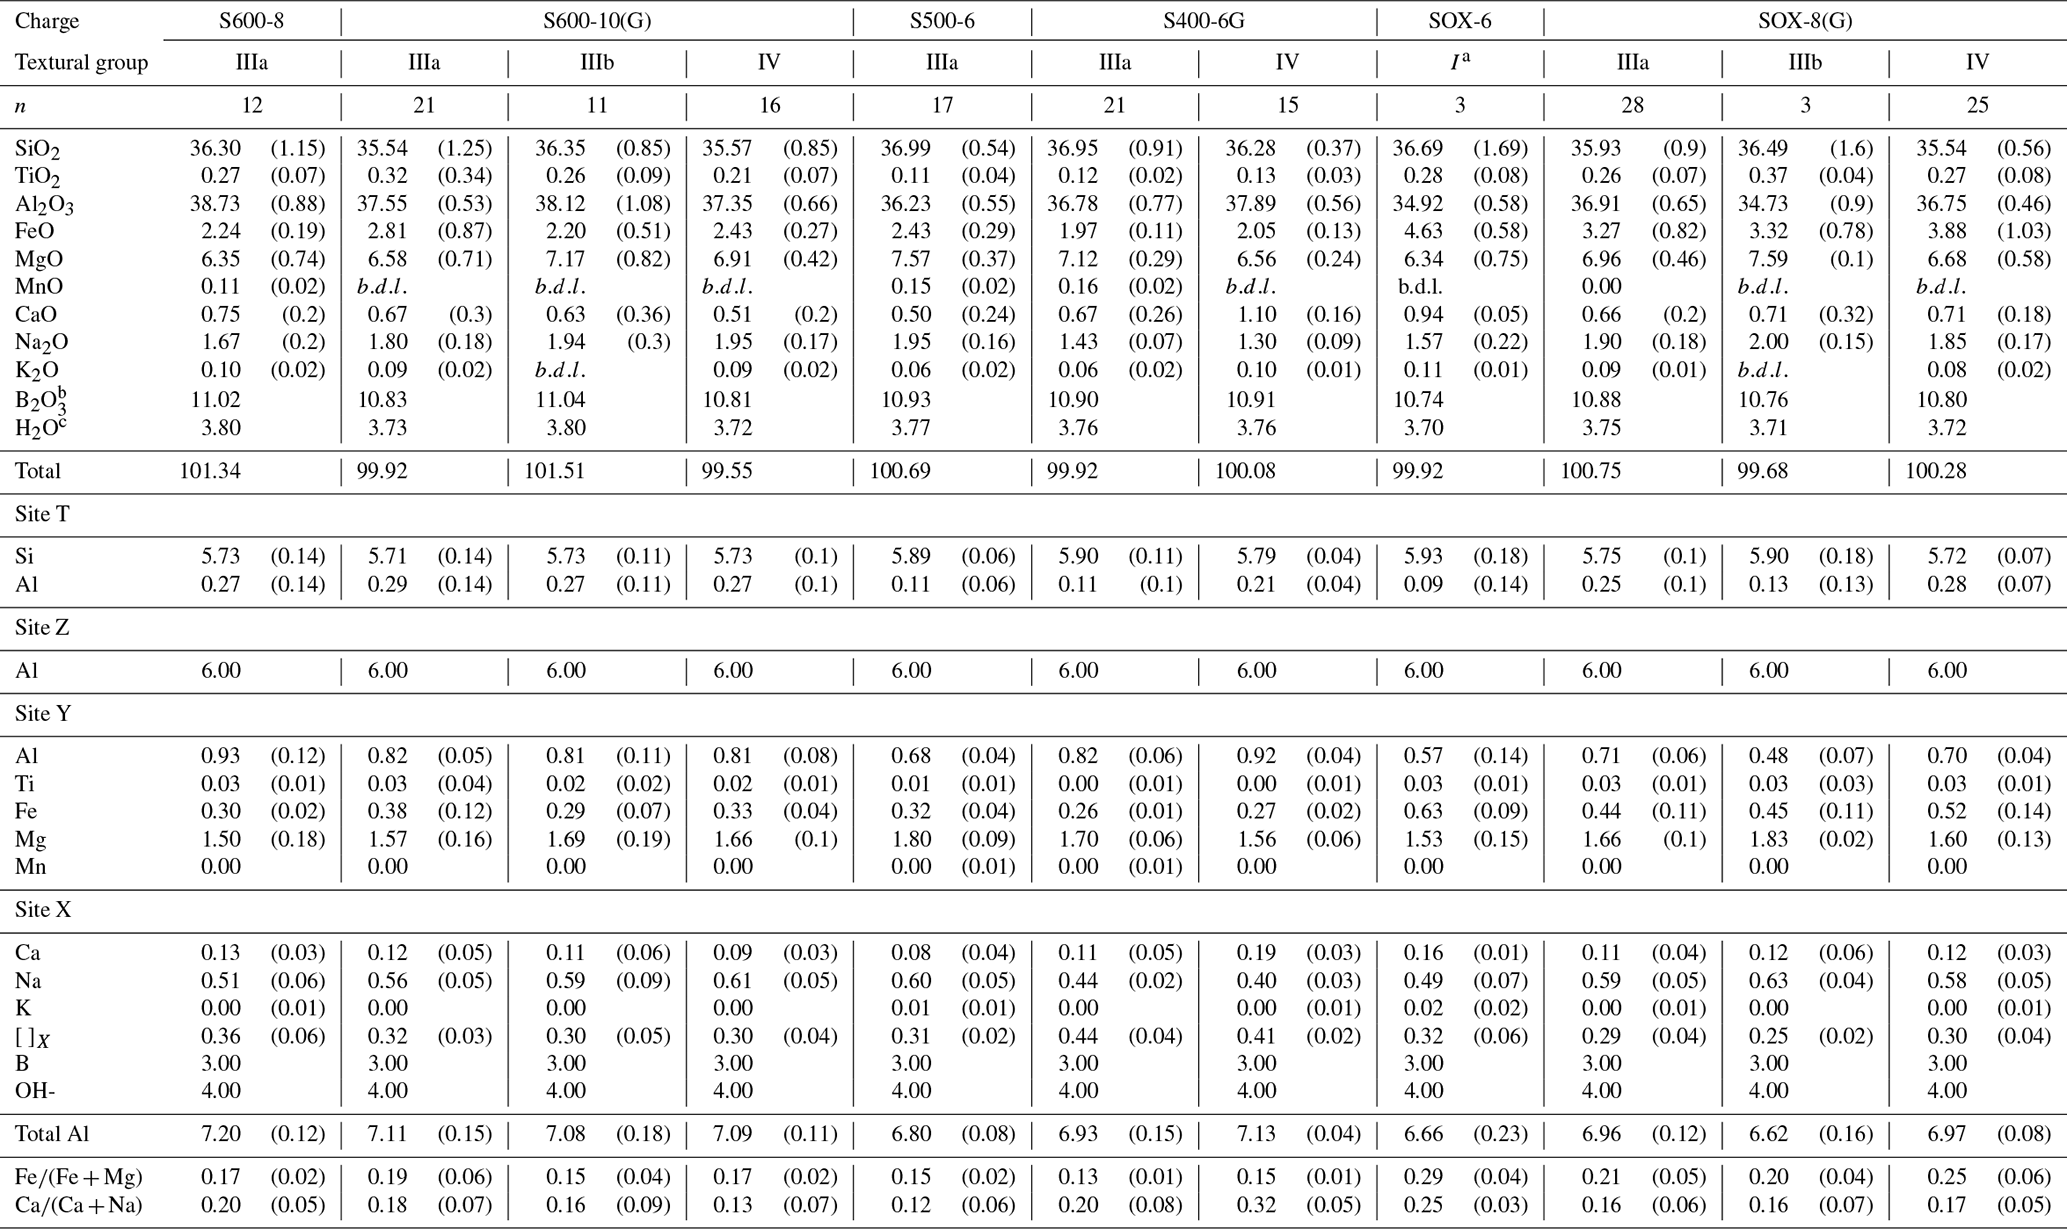
a The Group-I tourmaline analyzed in SOX-6 corresponds to a zone where sheaves were covering each other, allowing correct analyses to be obtained. b B2O3 calculated assuming 3 apfu. d H2O calculated assuming 4 apfu of OH−. n: number of analyses. b.d.l.: below detection limit.
Representative compositions of experimental tourmalines are given in Table 4. They are all solid solutions, primarily between magnesio-foitite and dravite, with small amounts of foitite, schorl, and uvite (Fig. 3A–F). Most 500 and 600 °C compositions have at. values higher than starting cordierite (vertical gray bands in Fig. 3A, B, D, and E). This indicates a slight preferential partitioning of Fe relative to Mg into tourmaline compared to cordierite. Atomic values are higher than those of the starting albite (horizontal gray bands in Fig. 3B and E), and a source of Ca in addition to albite, presumably the apatite inclusions, is required. At 600 °C, increasing the fluid boron content generates tourmalines closer to the dravite end-member, although the data for 8 wt % and 10 wt % [B2O3]fluid overlap (Fig. 3A). Significant variations in the Na proportion in the X site are observed at 600 °C, decreasing progressively with temperature (Fig. 3A) and accompanied by large changes in at. at the three investigated temperatures (Fig. 3B). In comparison, at. values are less variable, with the exception of the 600 °C, [B2O3]fluid=10 wt % compositions, which show a large spread (Fig. 3A, B). In those charges, the five compositions labeled with “c” all come from the core of a Group-IIIa tourmaline aggregate (Fig. 4). Rim compositions are comparatively more Mg-, Na-rich and Fe-, Ca-poor (Fig. 4), although the available electron microprobe data likely represent mixed core–rim analyses due to limited spatial resolution. These analyses plot together (Fig. 3A; B). Thus, the chemical zonation in the aggregate is consistent with the at. vs. variations defined by individual analyses. The 600 and 500 °C tourmaline compositions overlap, but the former are slightly more Al-rich than the latter (Fig. 3C). The 400 °C compositions are distinctive with lower (and more grouped) Na proportions in the X site than at higher temperatures, and they have constant at. , identical to that of the starting cordierite (Fig. 3A, B).
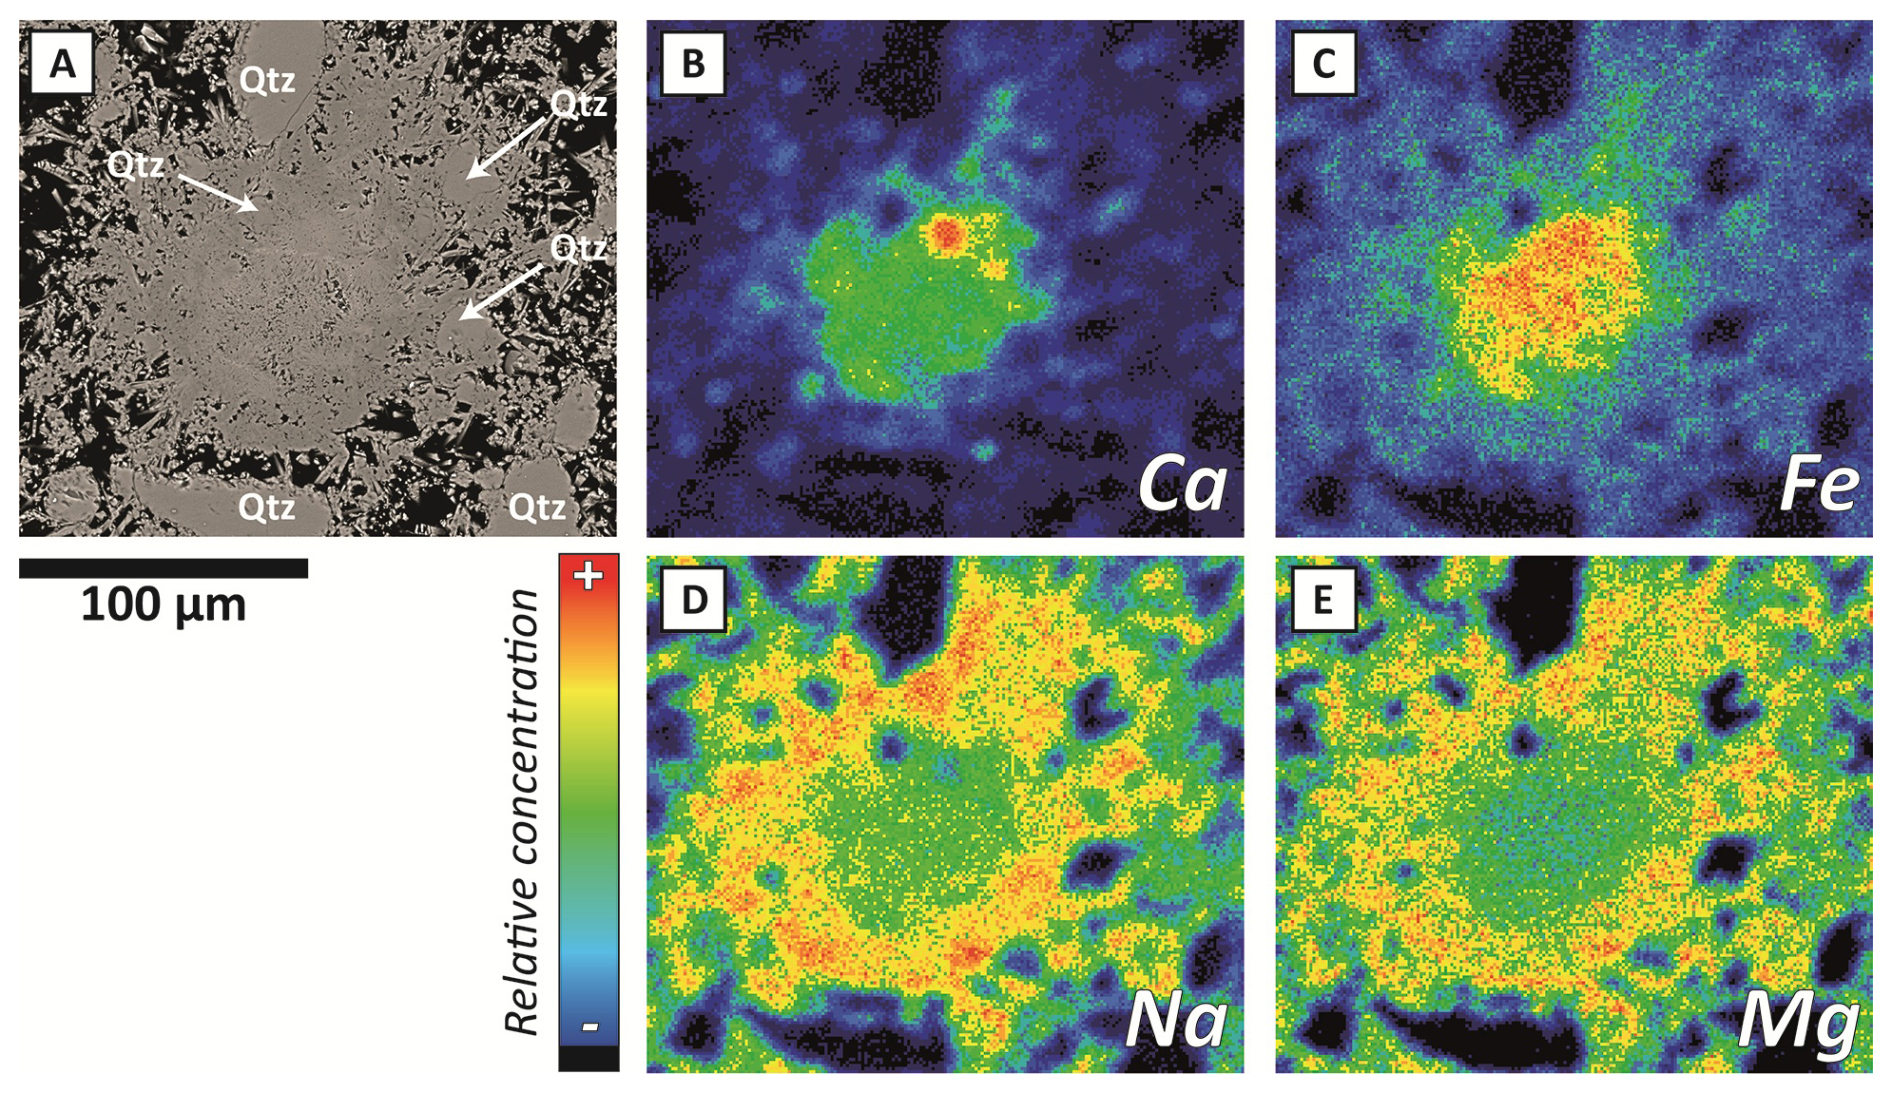
Figure 4BSE image (A) and Ca, Fe, Na, and Mg (B–E) X-ray element maps of a large Group-IIIa tourmaline aggregate in S600-10 charge (Table 2). In each map, the relative abundance of the element is represented by the color scale, with dark blue corresponding to the low concentrations and red corresponding to high concentrations. Mineral abbreviations as in Fig. 1.
Compositions from the highly and moderately oxidizing experiments are similar. The former have equal to slightly lower Na proportions in the X site, at. , and lower Al contents than the latter (Fig. 3D, E, F). The at. dispersion appears to be larger in the highly oxidizing charges than in the moderately oxidizing ones. Tourmaline compositions extend to higher at. values in the former than in the latter, though the number of moderately oxidizing data points is limited. The three Group-I tourmalines analyzed in charge SOX-6 plot in the same range as Group III in SOX-8 (Fig. 3D, E, F). At 600 °C, Group III- and Group-IV compositions overlap, whereas, at 400 °C, most tourmaline aggregates (Group III) are less calcic and aluminous than the overgrowths (Group IV; Fig. S5).
4.1 Attainment of equilibrium
Three main lines of evidence suggest that the experiments have closely approached equilibrium. First, tourmaline appears in the forward experiments when the fluid boron content increases progressively and exceeds a minimum threshold. This is consistent with the displacement from left to right of theoretical Reactions (R1Mg) and (R2Mg). [B2O3]fluid_EQ is experimentally bracketed by charges with and without tourmaline present. Reaction (R1Mg) and (R2Mg) indicate that, in charges without tourmaline, the fluid boron concentration is the same as in the starting solution. When tourmaline forms, part of the boron is consumed, and the fluid boron content becomes lower than the initial concentration. In B-rich systems, fluid phases are silica- and solute-rich, yielding amorphous and crystalline phases upon quenching (Pichavant, 1981, 1983), as was observed in this study. Therefore, no attempt was made to analyze the boron content of experimental fluids, and [B2O3]fluid_EQ was constrained by the starting concentrations only (Fig. 2). Yet, our determinations are reproducible and internally consistent; i.e., at 600 °C the [B2O3]fluid_EQ brackets in run 1 (3.4 wt %–10.1 wt %), Run 2 (<4 wt %) and run 6 (3 wt %–4.2 wt %) overlap (Table 2). The 600 °C experiments represent triplicates, which provide confidence in the [B2O3]fluid_EQ constraints. The [B2O3]fluid_EQ determined at the three temperatures are also mutually consistent. Second, for charges near [B2O3]fluid_EQ, experimental phase assemblages include the five major phases involved in the buffering reactions (see S600-4, SOX-4, SOX-6; Table 2). These phases evolve systematically as fluid boron contents increase above [B2O3]fluid_EQ. Andalusite; albite; and, lastly cordierite progressively disappear; tourmaline and quartz proportions increase, and tourmaline + quartz becomes the main phase assemblage in experimental products. These changes are consistent with the expected results of the tourmaline-forming equilibrium reactions. Third, compositions of experimental tourmalines (solid solutions between magnesio-foitite and dravite with small amounts of foitite, schorl, and uvite) are consistent with tourmaline formation through four theoretical buffering reactions. However, a fifth reaction is required to account for the uvite component in the experimental tourmalines. It should be noted that experimental tourmaline compositions depart from equilibrium with the starting albite if -partitioning systematics are applied (Henry and Guidotti, 1985; data in Tables 4 and S1), reflecting the involvement of apatite in the control of tourmaline . Regarding partitioning, experimental tourmalines are only slightly too Fe-rich compared to compositions expected at equilibrium with the starting cordierite, according to Henry and Guidotti (1985; data in Tables 4 and S1). However, the distribution of Mg and Fe between mineral phases depends strongly on tourmaline inter-site partitioning (van Hinsberg and Schumacher, 2009). Therefore, we conclude that the tourmaline compositions, together with the consistent [B2O3]fluid_EQ determinations and the nature and evolution of phase assemblages, suggest a close approach toward equilibrium in our experiments.
The appearance of tourmaline has not been reversibly demonstrated since no tourmaline reaction or production of B-free phases was observed in the reversal experiments. In these experiments, phase assemblages did not change compared to the starting mixture. This is attributed to the refractory nature of tourmaline, as discussed in previous studies (Henry and Dutrow, 1996; von Goerne et al., 1999a; van Hinsberg et al., 2011b) and explained by various factors (Morgan and London, 1989; Henry and Dutrow, 1996; Zimmermann et al., 1996; Dutrow and Henry, 2018). In contrast, von Goerne et al. (1999a) reacted tourmaline + quartz to form cordierite at 680 °C, which is close to the upper thermal activity of tourmaline defined in this study (Fig. 5). Our inability to demonstrate reversibility for the tourmaline-forming reactions implies that the boron fluid concentration brackets (defined from the presence and absence of tourmaline in the forward experiments) represent maximum and minimum limits on [B2O3]fluid_EQ, respectively.
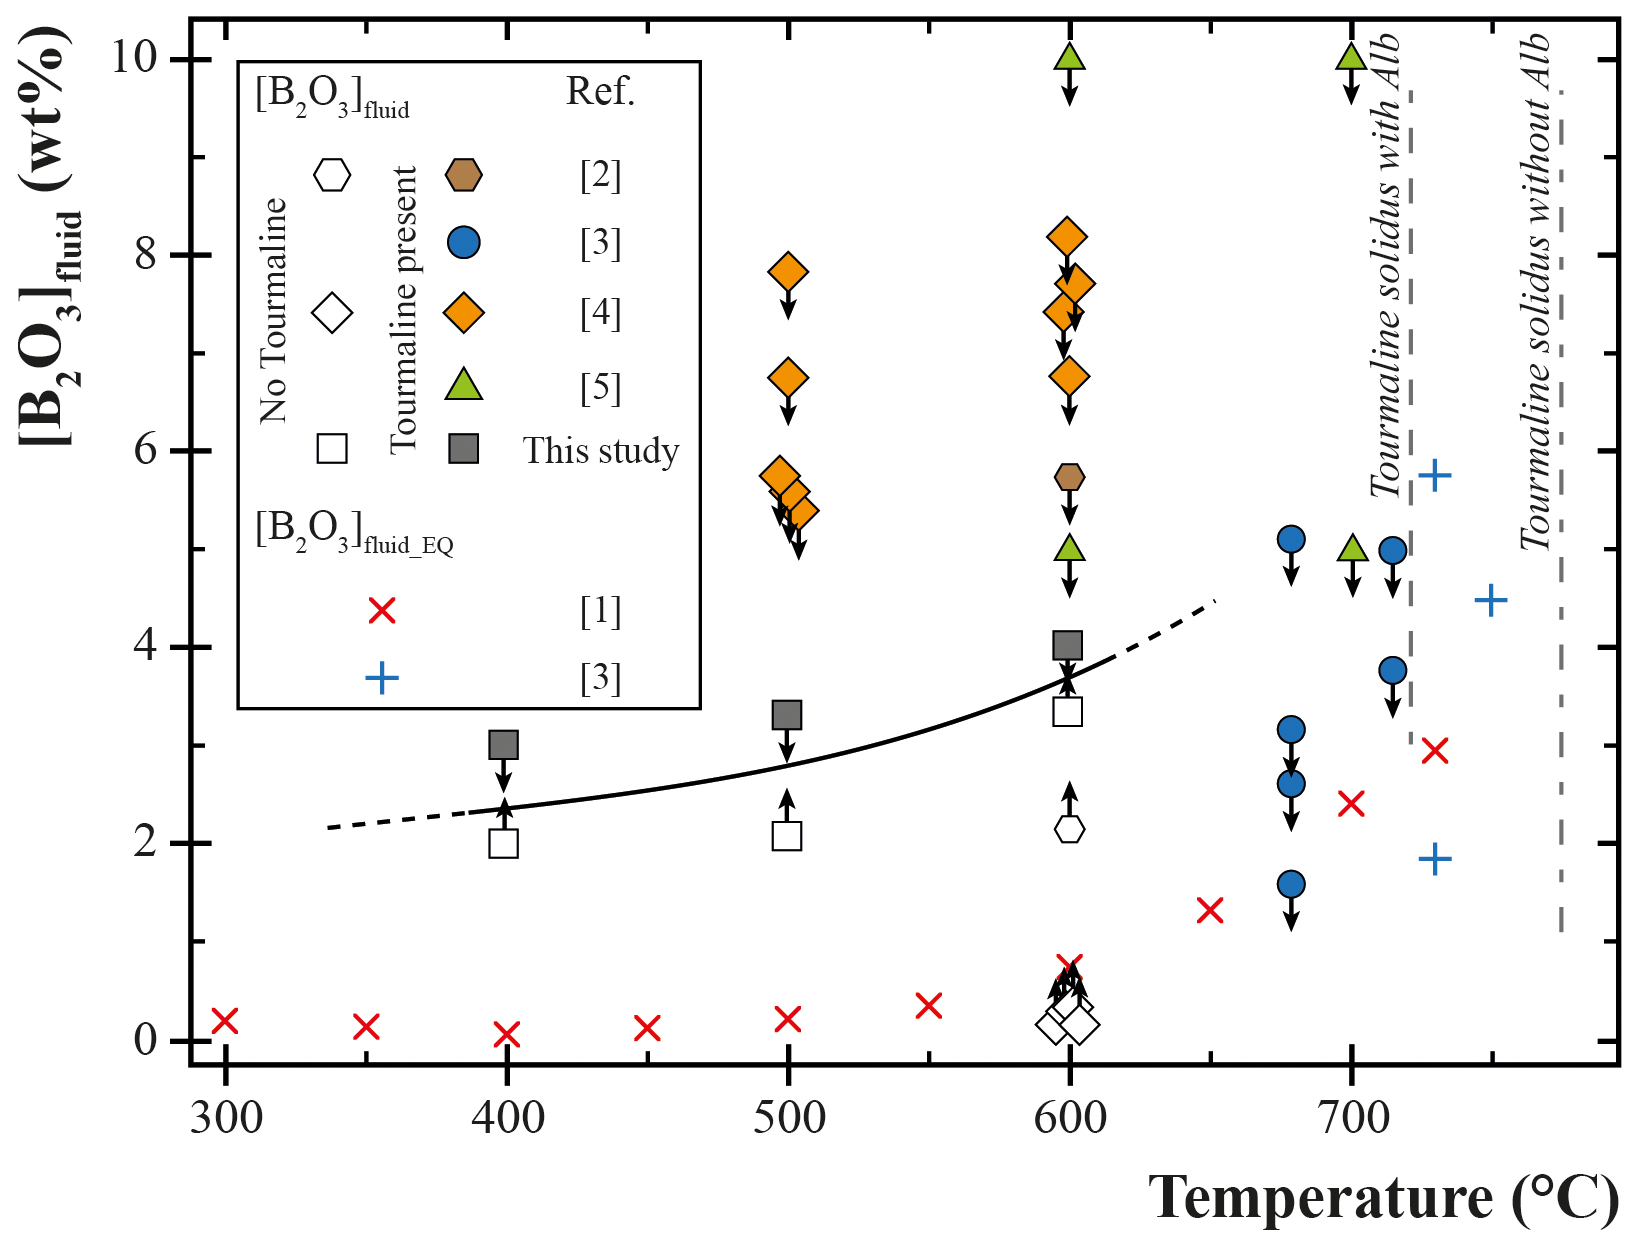
Figure 5Compilation of experimental results on tourmaline stability in a [B2O3]fluid vs. T( °C) diagram. Crosses are for experiments where the final boron concentration at equilibrium with tourmaline ([B2O3]fluid_EQ) has been measured. Other symbols represent experiments where [B2O3]fluid_EQ has not been determined. Open symbols are for tourmaline-absent runs, and filled symbols are for tourmaline-present runs. Upward- and downward-pointing arrows indicate the direction toward equilibrium. Solidi with and without albite are approximatively located. Sources of data: [1] Weisbrod et al. (1986); [2] Morgan and London (1989); [3] von Goerne et al. (1999a); [4] Orlando et al. (2017); [5] Cheng et al. (2019).
4.2 Tourmaline crystallization
Results of this study confirm that experimentally grown tourmalines are generally fine-grained, as noted in most previous studies (Frondel et al., 1947; Morgan and London, 1989; von Goerne et al., 1999a; London, 2011; Berryman et al., 2015, 2016), except in a few cases using growth chamber methods (e.g., von Goerne et al., 1999b; Setkova et al., 2019). Tourmaline nucleation can be complex and proceeds through precursor phases; for instance, jeremejevite is a precursor of olenite in high-pressure syntheses. Clearly visible during the first hours, it may then persist as relics within the tourmaline (Kutzschbach et al., 2017). We did not find such relics in our experimental products. The tourmalines produced exhibit fibrous morphologies with a strong preference for growth along the c axis, while growth along the a axis is inhibited (Dutrow and Henry, 2016). Nevertheless, four tourmaline textural types were identified in this study. These types suggest two main growth mechanisms under contrasting regimes of supersaturation of the tourmaline-forming components in the fluid.
When fluid boron concentrations are near equilibrium ([B2O3]fluid≈ [B2O3]fluid_EQ), dissolution of reactant minerals is limited. Consequently, fluids are weakly supersaturated with respect to the tourmaline-forming components. Growth is controlled by a local balance between elements coming from the reactant minerals and from the fluid. Tourmaline forms Group-I crystals (heterogeneously nucleating on albite or cordierite grains) and a few coarser Group-II crystals (Fig. 1). The latter are present only at 600 °C. At low fluid supersaturation levels, the energy barrier for crystal nucleation is high. Thus, growth on crystallographic surfaces is favored, leading to mainly sheaf morphologies (Group I) growing over starting minerals (cordierite, albite) and already formed tourmaline. The absence of Group II at 400 and 500 °C and the observation that Group-II crystals disappear rapidly when the fluid boron content increases indicate that crystallization of multiple Group Is is favored over the growth of a few crystals.
In contrast, for higher [B2O3]fluid (> [B2O3]fluid_EQ), acicular aggregates (Group III) become the main tourmaline textural type at all temperatures and redox conditions investigated. Nucleation is probably heterogeneous on reactant minerals in the case of Group IIIa (Fig. 1D). Long isolated tourmaline fibers (Group IIIb, Fig. 1E) are present at 500 and 600 °C, although they could partly correspond to fragments of Group IIa; their abundance rather suggests homogeneous nucleation in the fluid. Thus, the growth proceeds from a fluid that is strongly supersaturated with the tourmaline-forming components. The level of supersaturation (deviation of [B2O3]fluid from [B2O3]fluid_EQ) varies during the experiment and is at maximum during the initial stages. Crystallization of tourmaline and possible precursor phases dissipate this initial supersaturation. Boron is removed from the fluid, and global equilibrium is established in the whole charge (Lasaga, 1998). At 400 °C, the Group IIIb is absent, and tourmaline appears only as Group IIIa. Their composition of at. is identical to that of the starting cordierite (Fig. 3A) and suggests local rather than global supersaturation in the charge. Additionally, it is possible that the fluid chemistry at 400 °C differs from that at higher temperatures because cordierite is destabilized to smectite.
Crystallization of Group-IV tourmalines is distinctive. At all temperatures, the Group-IV crystals are mainly found at one end of the c axis of the seed (Fig. 1F), probably the pole. These overgrowths have been observed both in experiments (Cheng et al., 2019; von Goerne et al., 1999b; Setkova et al., 2019) and in natural rocks (Dutrow and Henry, 2016, 2018; van Hinsberg et al., 2011a). They indicate very early nucleation since, for a given fluid saturation level, heterogeneous nucleation is favored on irregular surfaces, which offer abundant high-energy sites (defects, steps) that lower the nucleation barrier, rather than on well-developed crystal faces. The latter correspond to slow-growth, low-energy surfaces that provide fewer favorable nucleation sites. Therefore, the Group-IV overgrowths likely represent the first tourmalines to form in the charge.
4.3 Controls on tourmaline composition
Compositions of our experimental tourmalines, especially at. and at. , vary significantly within several charges (Fig. 3B, E). Similarly, previous studies have commonly produced zoned and/or compositionally variable experimental tourmalines (Morgan and London, 1989; von Goerne et al., 2011; Berryman et al., 2015; Kutzschbach et al., 2017; Orlando et al., 2017; Cheng et al., 2019). To explain this compositional variability, volume diffusion can be discarded given the slow element diffusivities in tourmaline and the range of experimental durations (van Hinsberg et al., 2011b). Morgan and London, (1989) attributed the chemical zonation of their tourmalines to the evolution of the fluid composition during the experiment. Similarly, natural occurrences have demonstrated that the fluid exerts a first-order control on tourmaline composition (Henry and Dutrow, 1996; Williamson et al., 2000; Dutrow and Henry, 2011, 2016; van Hinsberg et al., 2011a, b; Harlaux et al., 2020).
The Group-IIIa tourmaline aggregate analyzed in charge S600-10 (Table 2) demonstrates a systematic evolution from an Fe-, Ca-rich core to an Mg-, Na-rich rim (Fig. 4). The Fe-, Ca-rich compositions correspond to an early stage of tourmaline growth, while the Mg-, Na-rich compositions correspond to a later stage. Thus, tourmaline composition depends on when crystallization begins during the experiment. The core compositions show the strongest chemical contrast with the reactants (Mg-rich for cordierite and Ca-poor for albite; gray bands in Fig. 3). Therefore, recalling that quartz is the main product phase besides tourmaline, mass balance requires the presence of an Na-, Mg-rich phase, most likely the fluid, at equilibrium with the core tourmaline compositions. Recrystallization of a precursor phase could be an alternative origin for the zonation (Kutzschbach et al., 2017); however, no such precursor relics were identified in our products. We therefore interpret the zonation as evidence that the precipitated solids and the equilibrium fluid have contrasting compositions, i.e., that crystallization is fractional in our experiments. This crystallization mechanism explains the zonation observed in the aggregate and also the dispersion of individual tourmaline analyses in a given charge (Fig. 3).
The Fe- and Ca-rich compositions reflect nucleation and growth during the initial experimental stages, when the supersaturation level in the fluid is at a maximum. One way to generate such an Fe- and Ca-rich tourmaline growth medium is for the Fe-cordierite and anorthite components to dissolve faster than the Mg-cordierite and albite components. Dissolution of apatite and ilmenite inclusions during the initial experimental stages could have also enriched the fluid in Fe and Ca. Later, more Mg- and Na-rich tourmalines crystallize due to gradual changes in the fluid composition and a decrease in the level of supersaturation. At 400 °C, Group-IIIa tourmaline compositions reflect control by a fluid that is locally buffered by cordierite (Fig. 3A). They contrast with the Group-IV compositions (Fig. S5), reflecting global vs. local supersaturation in the fluid for the two groups, respectively. This implies that, at 400 °C, crystallization of Group IV occurs much earlier than that of Group IIIa. In contrast, the compositional similarity between the two tourmaline groups at 500 and 600 °C suggests that both crystallized within a narrower time frame. Our experiments emphasize the close relationship between tourmaline compositions and growth mechanisms and stress the importance of the fluid in controlling supersaturation levels and the compositions of precipitated tourmalines. Tourmaline has been used to record boundary-layer melt crystallization in some pegmatites (Van Der Does et al., 2024), but we stress that variations in tourmaline compositions can also result from crystallization from a hydrothermal fluid.
4.4 Tourmaline stability and fluid boron concentration
The [B2O3]fluid_EQ brackets from this study are compared with those from previous studies (Weisbrod et al., 1986; Morgan and London, 1989; von Goerne et al., 1999a; Orlando et al., 2017; Cheng et al., 2019, Fig. 5). [B2O3]fluid_EQ was measured in two studies (von Goerne et al., 1999a), and the others provide upper and lower bounds. Our [B2O3]fluid_EQ data at 500 and 600 °C are consistent with the results of von Goerne et al. (1999a) above 600 °C (Fig. S5). However, they are significantly higher than the [B2O3]fluid_EQ at equilibrium, with an Fe-free tourmaline + cordierite + quartz + albite + andalusite + fluid assemblage (≈0.21 wt % at 500 °C and ≈0.75 wt % at 600 °C; Weisbrod et al., 1986; Fig. S5). Although their experiments were performed at 100 MPa with the addition of 3 wt % NaCl to the fluid, we interpret the contrasted [B2O3]fluid_EQ values as mainly reflecting differences in tourmaline compositions between the two studies. Thermodynamic calculations (see below) show that [B2O3]fluid_EQ increases from Reaction (R1Mg) to (R1Fe) at a given T (Fig. 6). Therefore, our higher [B2O3]fluid_EQ values are qualitatively consistent with schorl-bearing vs. schorl-free tourmalines in Weisbrod et al. (1986). We conclude that our experimental results are not significantly incompatible with those of Weisbrod et al. (1986).
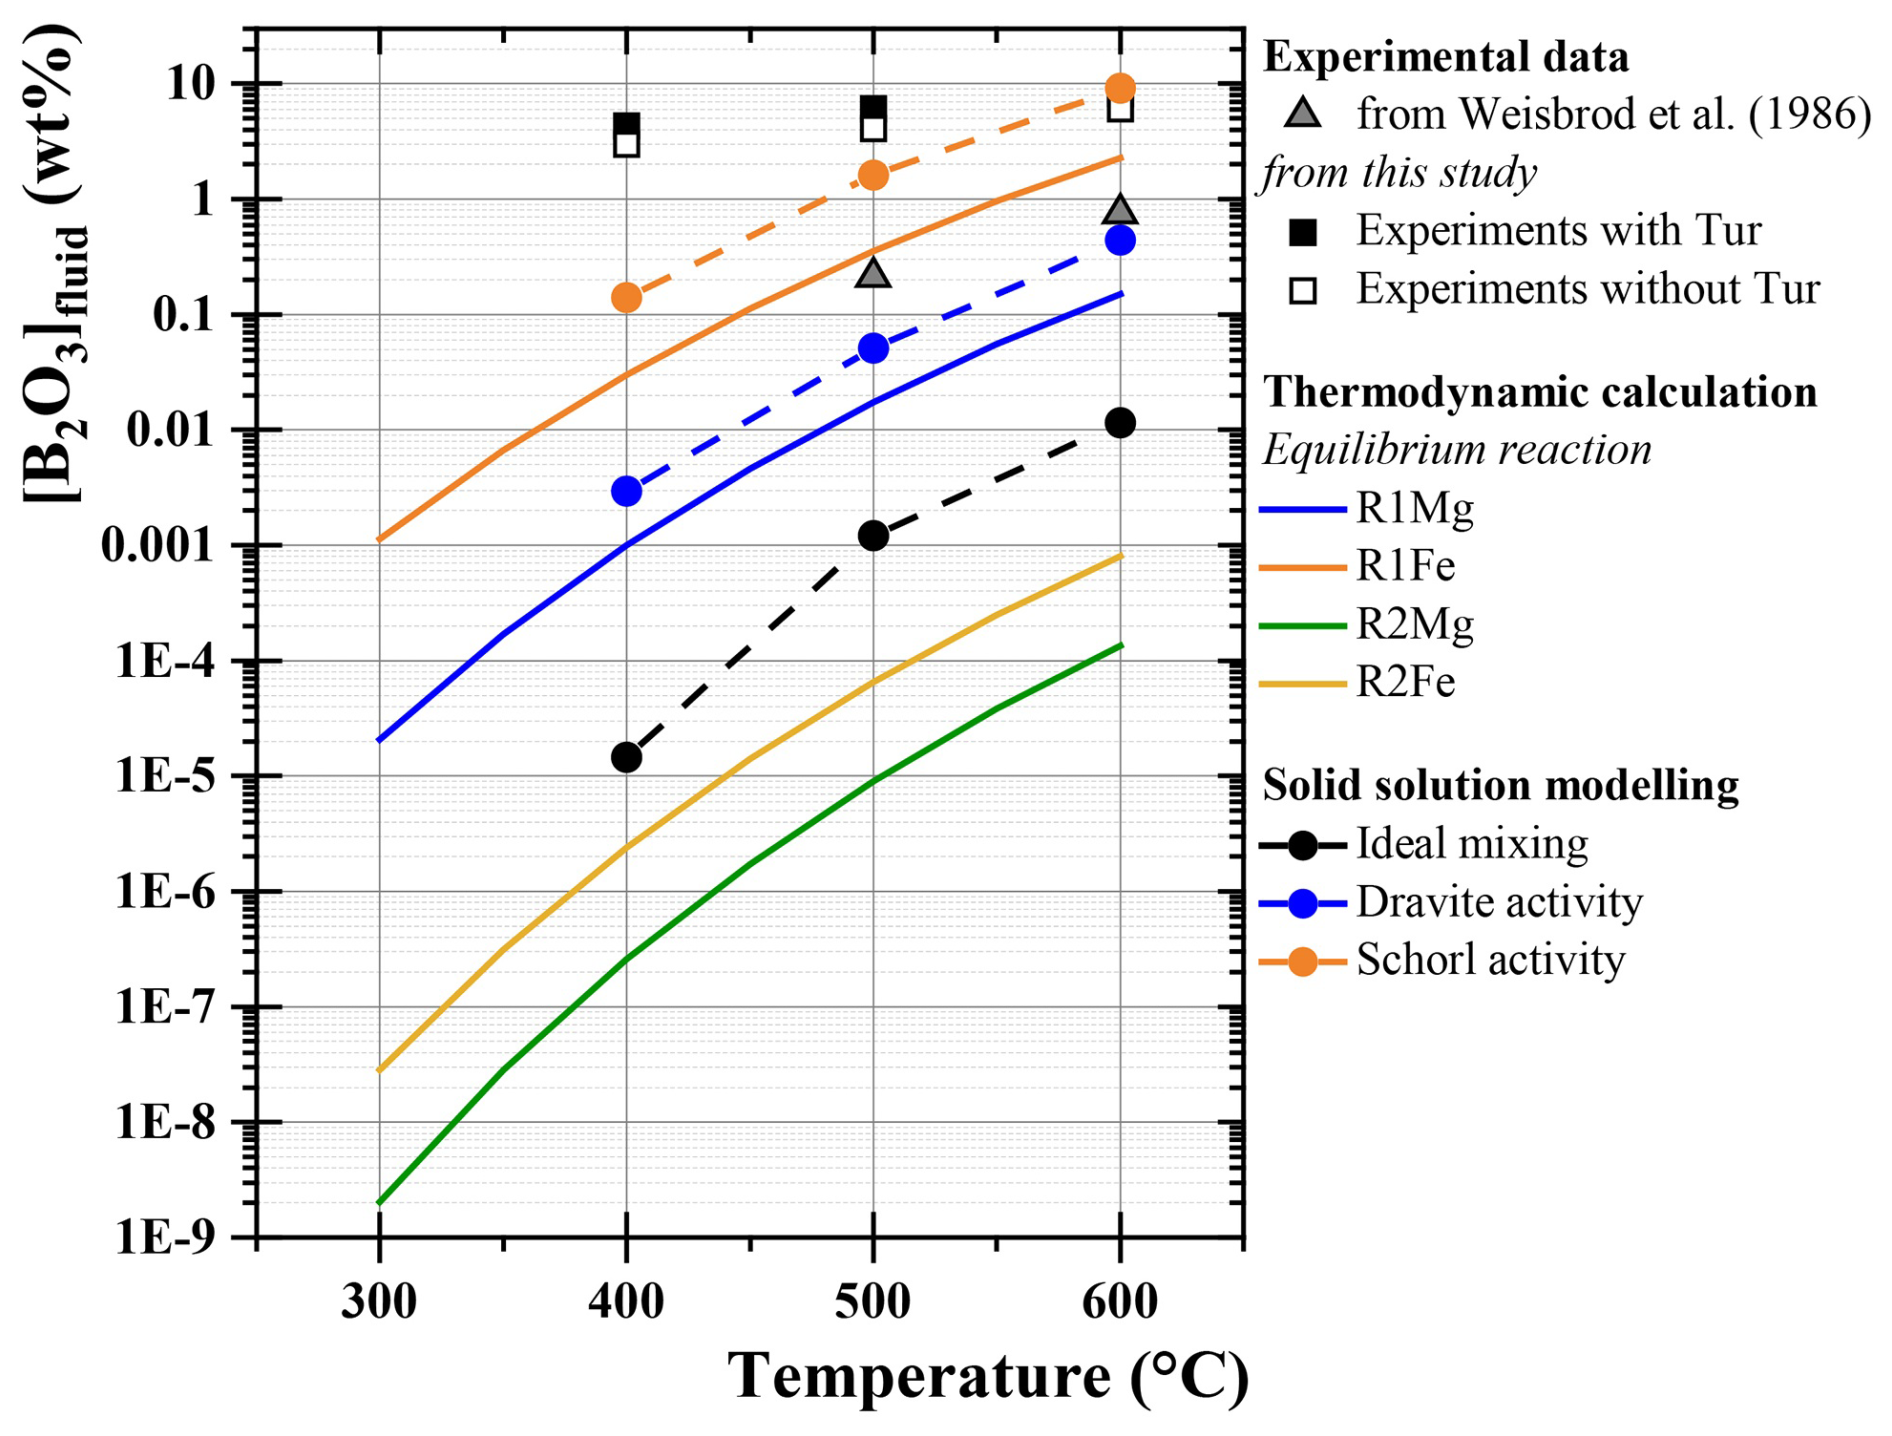
Figure 6Calculated [B2O3]fluid_EQ as a function of temperature for the four tourmaline-forming reactions considered (Reactions R1Mg, R1Fe, R2Mg, R2Fe; see text). Three solid-solution models were evaluated: ideal mixing (black line) and models based on dravite and schorl activities within the solid solution, calculated from their respective end-members and the compositions listed in Table S5. Dravite is shown as blue dots with a dashed line, and schorl is shown as orange dots. See Sect. S4: “Extension to Tourmaline solid solutions”. Experimental brackets of [B2O3]fluid_EQ from this study are shown by solid (tourmaline present) and open (tourmaline absent) symbols.
5.1 Equilibrium constant
The four model tourmalinization Reactions (R1Mg), (R1Fe), (R2Mg), and (R2Fe) involve pure phases (quartz, andalusite), solid solutions (plagioclase, cordierite, tourmaline), and fluid components. The corresponding mass action law equations are of the same form, e.g., for Reaction (R1Mg):
where KR1Mg is the equilibrium constant of Reaction (R1Mg); , , and are the activities of the dravite, Mg-cordierite and albite components in tourmaline, cordierite, and plagioclase solid solutions, respectively; is the water fugacity; and is the activity of boric acid in the fluid, which, for a neutral aqueous species, is assumed to be equivalent to the H3BO3 molality, [H3BO3]fluid. If, in Eq. (1), tourmaline, cordierite and plagioclase compositions are identical to their respective end-member components, Eq. (1) is reduced to the following:
which shows that, for a given reaction and tourmaline end-member, the equilibrium constant only depends on the fluid composition. Equation (2) implies that, for constant P and T and assuming fH2O ∼fH2O° since B concentrations are low in the fluid, [H3BO3]fluid is, at equilibrium, uniquely determined. If T varies at constant P, the fluid boron content should follow a univariant curve in T-[B2O3]fluid space, as observed (Fig. 2). Experimentally, equilibrium along Reaction (R1Mg) (or the other tourmaline-forming reactions) implies that increasing the fluid boron concentration above [B2O3]fluid_EQ shifts the reaction toward the right. This produces tourmaline and consumes the reactants, as observed in the forward experiments. Conversely, lowering the fluid boron concentration below [B2O3]fluid_EQ should lead to the reaction being shifted to the left, thus consuming tourmaline and producing B-free phases. This was expected but not observed in the reversal experiments.
5.2 Calculation of [B2O3]fluid_EQ
Using Reaction (R1Mg) as an example, [H3BO3]fluid_EQ can be expressed from Eq. (2):
where values (Burnham et al., 1969) are compiled in Table S4. The calculation of the equilibrium constant (KR1Mg) is detailed in Sects. S2 and S3. The H3BO3 molality (Eq. 3) is converted into [H3BO3]fluid_EQ in wt % using the following:
where 61.81 is the molar mass of H3BO3 in g mol−1. Finally, the wt % [H3BO3]fluid_EQ is converted into wt % [B2O3]fluid EQ to allow direct comparison with the experimental data.
5.3 Thermodynamic data
The for the aqueous-species H3BO3 was calculated by the Thermo-ZNS code (Lassin et al., 2005). Four sets of HKF parameters were tested (Akinfiev et al., 2006; Pokrovski et al., 1995; Shock et al., 1989; Wang et al., 2013). The parameters from Akinfiev et al. (2006) were preferred and were used in the calculations (Table S4). The thermodynamic properties (ΔfG°; S°; V°; and heat capacity parameters a, b, c, d, e, f, and g for the Cp(T) equation) for the solid components and H2O(g) are summarized in Table S3. For tourmaline components, data derived from polyhedron models (van Hinsberg and Schumacher, 2007) and estimates from Ogorodova et al. (2012) were considered. However, calculations using the dravite end-member of Ogorodova et al. (2012) yield unrealistic results ([B2O3]fluid_EQ>100 wt %), indicating that dravite is not stable with this dataset. Therefore, only the thermodynamic data from van Hinsberg and Schumacher (2007) were finally used (Table S3).
5.4 Results
Results are shown in Fig. 6, where they are compared with the experimental [B2O3]fluid_EQ brackets from this study and from Weisbrod et al. (1986). For the four end-member reactions considered, [B2O3]fluid_EQ increases with temperature. The formation of alkali tourmaline (dravite, Reaction R1Mg) requires higher [B2O3]fluid_EQ than alkali-deficient tourmaline (Mg-foitite, Reaction R2Mg). Schorl (Reaction R1Fe) requires a higher [B2O3]fluid_EQ than dravite (Reaction R1Mg) to form. Similarly, Reaction (R2Fe) shifts toward higher [B2O3]fluid_EQ compared to Reaction (R2Mg).
The [B2O3]fluid_EQ values from this study plot above the two calculated R1Mg and R1Fe reactions, and the Weisbrod et al. (1986) [B2O3]fluid_EQ values plot between them. The discrepancy between experimental and calculated values is due to the combination of several factors. First, cordierite is unstable at 400 °C in our experiments, and direct comparison with the end-member reactions at this temperature is unwarranted. Second, our modeling uses estimated thermodynamic data for the tourmaline components; the results should still be viewed as preliminary. Our description of the fluid phase is also probably oversimplified. Only H2O and H3BO3 were considered to be aqueous species, but B-bearing hydrothermal fluids can dissolve significant amounts of aluminosilicate components (Pichavant, 1981, 1983) and form borate species (Akinfiev et al., 2006), necessitating a more elaborate treatment. Lastly, experimental tourmalines from this study are solid solutions. The [B2O3]fluid_EQ brackets determined by Weisbrod et al. (1986) are for an Fe-free experimental system. The data consistently plot closer to the calculated Reaction (R1Mg) than to the [B2O3]fluid_EQ brackets from this study, suggesting a critical influence of the tourmaline composition on experimental [B2O3]fluid_EQ. To further evaluate this factor, the thermodynamic calculations were tentatively applied to the tourmalines crystallized in this study. A simple basic formulation of activities for tourmaline solid solutions, detailed in Sect. S4, was used. The two sets of [B2O3]fluid_EQ calculated for the experimental tourmalines increase compared to their respective end-member Reactions (R1Mg) and (R1Fe) (Fig. 6). They plot globally below our experimental [B2O3]fluid_EQ, although the calculations based on Reaction (R1Fe) (schorl) more closely approach the experimental values, especially at 600 °C (Fig. 6). Therefore, the agreement between calculated and experimental [B2O3]fluid is significantly improved by taking into account the tourmaline composition. A more elaborate tourmaline activity model than the one used here (van Hinsberg and Schumacher, 2009) is expected to adequately reproduce the experimental [B2O3]fluid_EQ data.
Our experimental determinations of equilibrium [B2O3] in fluids coexisting with tourmaline + cordierite + albite + quartz + andalusite provide new insights into boron concentrations in natural hydrothermal and magmatic–hydrothermal systems. According to our data, tourmaline begins to crystallize at fluid [B2O3] concentrations of a few weight percent (see Fig. 2). These values represent minimum thresholds, and higher concentrations are likely in natural systems, particularly those characterized by a tourmaline + quartz assemblage (e.g., Baksheev et al., 2009; Fusswinkel et al., 2016; Lecumberri-Sanchez et al., 2017; Legros et al., 2022). This specific assemblage corresponds to the phase stability observed at the highest [B2O3]fluid values in our experiments (Table 2). In addition, our experiments show that fibrous tourmaline textures – and, in particular, the acicular aggregates formed at high [B2O3]fluid – develop under conditions of strong supersaturation with respect to tourmaline-forming components. In contrast, coarser and more equant crystals are associated with lower degrees of supersaturation, closer to equilibrium conditions.
A compilation of fluid inclusion analyses from various ore deposits indicates a broad range of [B2O3]fluid concentrations, from as low as up to 2.5 wt % (Prokof'ev et al., 2002). In general, hydrothermal systems with intense tourmalinization exhibit fluid compositions toward the upper end of this range. For instance, in Cornwall, [B2O3]fluid values from mineralized veins range between 0.2 wt % and 0.63 wt % (Smith et al., 1996), while at Panasqueira (Portugal), and fluids in W-mineralized veins – associated with early tourmalinization – display [B2O3]fluid values ranging from 0.09 wt % to 2.3 wt % (Lecumberri-Sanchez et al., 2017). Although these values are generally lower than our experimental bracket (Fig. 2), the difference is explained by (i) lower natural temperatures in perigranitic settings, which depress equilibrium [B2O3]fluid EQ (<400–500 °C; Audétat et al., 2000; Gleeson et al., 2000; Korges et al., 2020), and (ii) dilution and fluid–rock interaction, including mixing with meteoric components.
Natural tourmalinization processes may also be related to mica-bearing assemblages (biotite, muscovite, or sericite), which were absent from our experiments. At Panasqueira, tourmaline coexists with muscovite in the W-bearing veins (Codeço et al., 2017; Launay et al., 2018). In the Río Blanco-Los Bronces Cu–Mo porphyry deposit (Chile), the Sur–Sur breccia is cemented by tourmaline that formed from the alteration of primary biotite (Frikken et al., 2005). Similarly, at San Rafael (SE Peru), intense tourmalinization of cordierite-bearing granites primarily affects biotite (Harlaux et al., 2020). Therefore, new experiments on mica-rich assemblages are essential to better constrain [B2O3]fluid in natural systems (Fort, 2023).
Finally, natural hydrothermal fluids are more chemically complex than those modeled experimentally. They typically contain various additional ligands and cations – such as Cl−, H+, K+, Ca2+, and Li+ – that may influence [B2O3]fluid_EQ (Audétat et al., 2008). Understanding the role of these components is crucial for accurately estimating boron concentrations in natural fluid.
Estimating the boron content in hydrothermal systems also constrains the composition of late-stage silicic melts that crystallize in the presence of a fluid phase. Boron strongly partitions into the fluid relative to the melt (Pichavant, 1981; London et al., 1988; Schatz et al., 2004; Pokrovski et al., 2013). Using the experimentally derived [B2O3]fluid_EQ of ∼4 wt % at 650 °C (Figs. 2 and 5) and the fluid–melt partition coefficient of 3.0 for peraluminous compositions (Pichavant, 1981), the calculated [B2O3]melt is ∼1.3 wt %. This estimate is consistent with previous findings of ∼2 wt % B2O3 in tourmaline-saturated peraluminous melts at 750 °C and 200 MPa (Wolf and London, 1997; Acosta-Vigil et al., 2003). Previous studies by Pichavant and Manning (1984) and Dingwell et al. (1996) also indicated that up to ∼1 wt % B2O3 can be dissolved in natural magmatic–hydrothermal melts. Therefore, our experimentally derived [B2O3]fluid_EQ values lead to melt compositions in good agreement with natural observations. This reinforces the reliability of our approach to estimating boron concentrations in geological systems.
All data derived from this research are presented in the enclosed tables, figures, and Supplement.
The supplement related to this article is available online at https://doi.org/10.5194/ejm-38-635-2026-supplement.
JF performed the investigation and formal analysis. JT, OB, and SS provided supervision and project administration. JF and MP developed the methodology. AL contributed to the formal analysis (thermodynamic analysis). AL and MP were responsible for the validation. JF, SS, and MP wrote the original draft. AL, JT, and OB contributed to the writing (review and editing).
The contact author has declared that none of the authors has any competing interests.
Publisher's note: Copernicus Publications remains neutral with regard to jurisdictional claims made in the text, published maps, institutional affiliations, or any other geographical representation in this paper. The authors bear the ultimate responsibility for providing appropriate place names. Views expressed in the text are those of the authors and do not necessarily reflect the views of the publisher.
We thank Rémi Champallier (ISTO) for his help on the internally heated pressure vessel experiments and Sylvain Janiec (sample preparation, SEM, ISTO), Patricia Benoist (SEM, ISTO), Ida Di Carlo (EPMA, ISTO), and Penhoud Philippe (XRD, ISTO) for the support with the analyses. We thank Carlos Rodriguez-Navarro, editor in chief; Francois Holtz; Martin Kutzschbach; and an anonymous reviewer for their suggestions and constructive remarks.
This research was financially supported by the French Geological Survey (BRGM), the Region Centre, and the Labex Voltaire (grant no. ANR-10-LABX-100-01) as a part of the PhD project of Julien Fort.
This paper was edited by Francois Holtz and reviewed by Martin Kutzschbach and one anonymous referee.
Acosta-Vigil, A., London, D., Morgan, G. B., and Dewers, T. A.: Solubility of excess alumina in hydrous granitic melts in equilibrium with peraluminous minerals at 700–800 °C and 200 MPa, and applications of the aluminum saturation index, Contrib. Mineral. Petrol., 146, 100–119, https://doi.org/10.1007/s00410-003-0486-6, 2003.
Akinfiev, N. N., Voronin, M. V., Zotov, A. V., and Prokof'ev, V. Yu.: Experimental investigation of the stability of a chloroborate complex and thermodynamic description of aqueous species in the B-Na-Cl-O-H system up to 350 °C, Geochem. Int., 44, 867–878, https://doi.org/10.1134/S0016702906090035, 2006.
Audétat, A., Günther, D., and Heinrich, C. A.: Causes for Large-Scale Metal Zonation around Mineralized Plutons: Fluid Inclusion LA-ICP-MS Evidence from the Mole Granite, Australia, Econ. Geol., 95, 1563–1581, https://doi.org/10.2113/gsecongeo.95.8.1563, 2000.
Audétat, A., Pettke, T., Heinrich, C. A., and Bodnar, R. J.: Special Paper: The Composition of Magmatic-Hydrothermal Fluids in Barren and Mineralized Intrusions, Econ. Geol., 103, 877–908, https://doi.org/10.2113/gsecongeo.103.5.877, 2008.
Bačík, P., Dikej, J., Fridrichová, J., Miglierini, M., and Števko, M.: Chemical composition and evolution of tourmaline-supergroup minerals from the Sb hydrothermal veins in Rožňava area, Western Carpathians, Slovakia, Mineral. Petrol., 111, 609–624, https://doi.org/10.1007/s00710-017-0507-1, 2017.
Baksheev, I. A., Tikhomirov, P. L., Yapaskurt, V. O., Vigasina, M. F., Prokof'ev, V. Yu., and Ustinov, V. I.: Tourmaline of the Mramorny tin cluster, Chukotia peninsula, Russia, Can. Mineral., 47, 1177–1194, https://doi.org/10.3749/canmin.47.5.1177, 2009.
Beckett-Brown, C. E., McDonald, A. M., and McClenaghan, M. B.: Recognizing Tourmaline in Mineralized Porphyry Cu Systems: Textures and Major-Element Chemistry, Can. J. Mineral. Petrol., 61, 3–29, https://doi.org/10.3749/2200011, 2023.
Berryman, E. J., Wunder, B., Wirth, R., Rhede, D., Schettler, G., Franz, G., and Heinrich, W.: An experimental study on K and Na incorporation in dravitic tourmaline and insight into the origin of diamondiferous tourmaline from the Kokchetav Massif, Kazakhstan, Contrib. Mineral. Petrol., 169, 28, https://doi.org/10.1007/s00410-015-1116-9, 2015.
Berryman, E. J., Wunder, B., Rhede, D., Schettler, G., Franz, G., and Heinrich, W.: P–T–X controls on Ca and Na distribution between Mg–Al tourmaline and fluid, Contrib. Mineral. Petrol., 171, 31, https://doi.org/10.1007/s00410-016-1246-8, 2016.
Blanc, Ph., Lassin, A., Piantone, P., Azaroual, M., Jacquemet, N., Fabbri, A., and Gaucher, E. C.: Thermoddem: A geochemical database focused on low temperature water/rock interactions and waste materials, Appl. Geochem., 27, 2107–2116, https://doi.org/10.1016/j.apgeochem.2012.06.002, 2012.
Broska, I. and Kubiš, M.: Accessory minerals and evolution of tin-bearing S-type granites in the western segment of the Gemeric Unit (Western Carpathians), Geol. Carpathica, 69, 483–497, https://doi.org/10.1515/geoca-2018-0028, 2018.
Burnham, C. W., Holloway, J. R., and Davis, N. F.: Thermodynamic Properties of Water to 1,000 °C and 10,000 Bars, Geological Society of America, 1969.
Charoy, B.: Greisenisation, minéralisation et fluides associés à Cligga Head, Cornwall (sud-ouest de l’Angleterre), Bull. Minéralogie, 102(5), 633–641, https://doi.org/10.3406/bulmi.1979.7312, 1979
Cheng, L., Zhang, C., Yang, X., Qi, D., Zhou, Y., and Holtz, F.: Experimental investigation of reactions between two-mica granite and boron-rich fluids: Implications for the formation of tourmaline granite, Sci. China Earth Sci., 62, 1630–1644, https://doi.org/10.1007/s11430-019-9442-y, 2019.
Codeço, M. S., Weis, P., Trumbull, R. B., Pinto, F., Lecumberri-Sanchez, P., and Wilke, F. D. H.: Chemical and boron isotopic composition of hydrothermal tourmaline from the Panasqueira W-Sn-Cu deposit, Portugal, Chem. Geol., 468, 1–16, https://doi.org/10.1016/j.chemgeo.2017.07.011, 2017.
Dingwell, D. B., Pichavant, M., and Holtz, F.: Chapter 8. Experimental Studies of Boron in Granitic Melts, in: Boron_Mineralogy, Petrology and Geochemistry, vol. 33, edited by: Anovitz, L. M. and Grew, E. S., De Gruyter, Berlin, Boston, 331–386, https://doi.org/10.1515/9781501509223-010, 1996.
Drivenes, K., Larsen, R. B., Müller, A., Sørensen, B. E., Wiedenbeck, M., and Raanes, M. P.: Late-magmatic immiscibility during batholith formation: assessment of B isotopes and trace elements in tourmaline from the Land's End granite, SW England, Contrib. Mineral. Petrol., 169, 56, https://doi.org/10.1007/s00410-015-1151-6, 2015.
Drivenes, K., Larsen, R. B., Müller, A., and Sørensen, B. E.: Crystallization and uplift path of late Variscan granites evidenced by quartz chemistry and fluid inclusions: Example from the Land's End granite, SW England, Lithos, 252–253, 57–75, https://doi.org/10.1016/j.lithos.2016.02.011, 2016.
Dutrow, B. L. and Henry, D. J.: Tourmaline: A Geologic DVD, Elements, 7, 301–306, https://doi.org/10.2113/gselements.7.5.301, 2011.
Dutrow, B. L. and Henry, D. J.: Fibrous Tourmaline: A Sensitive Probe of Fluid Compositions and Petrologic Environments, Can. Mineral., 54, 311–335, https://doi.org/10.3749/canmin.1600019, 2016.
Dutrow, B. L. and Henry, D. J.: Tourmaline compositions and textures: reflections of the fluid phase, J. Geosci., 99–110, https://doi.org/10.3190/jgeosci.256, 2018.
Fort, J.: Tourmalinisation of perigranitic hydrothermal systems: experimental approach to the stability field and dynamics of metasomatic processes in borosilicate systems, Sciences de la Terre/Métallogénie, Université d'Orléans, Orléans, 237 pp., 2023.
Frikken, P. H., Cooke, D. R., Walshe, J. L., Archibald, D., Skarmeta, J., Serrano, L., and Vargas, R.: Mineralogical and Isotopic Zonation in the Sur-Sur Tourmaline Breccia, Río Blanco-Los Bronces Cu-Mo Deposit, Chile: Implications for Ore Genesis, Econ. Geol., 100, 935–961, https://doi.org/10.2113/gsecongeo.100.5.935, 2005.
Frondel, C., Hurlbut, C. S. J., and Colette, R. C.: Synthesis of Tourmaline, Am. Mineral., 32, 680–681, 1947.
Fuchs, Y., Lagache, M., and Linares, J.: Fe-tourmaline synthesis under different T and fO2 conditions, Am. Mineral., 83, 525–534, 1998.
Fusswinkel, T., Wagner, T., and Sakellaris, G.: Fluid evolution of the Neoarchean Pampalo orogenic gold deposit (E Finland): Constraints from LA-ICPMS fluid inclusion microanalysis, Chem. Geol., 450, 96–121, https://doi.org/10.1016/j.chemgeo.2016.12.022, 2016.
Gleeson, S. A., Wilkinson, J. J., Shaw, H. F., and Herrington, R. J.: Post-magmatic hydrothermal circulation and the origin of base metal mineralization, Cornwall, UK, J. Geol. Soc., 157, 589–600, https://doi.org/10.1144/jgs.157.3.589, 2000.
Gunter, W. D., Myers, J., and Girsperger, S.: Hydrogen: Metal Membranes, in: Hydrothermal Experimental Techniques, John Wiley & Sons, New-York, 100–120, 1987.
Harlaux, M., Kouzmanov, K., Gialli, S., Laurent, O., Rielli, A., Dini, A., Chauvet, A., Menzies, A., Kalinaj, M., and Fontboté, L.: Tourmaline as a Tracer of Late-Magmatic to Hydrothermal Fluid Evolution: The World-Class San Rafael Tin (-Copper) Deposit, Peru, Econ. Geol., https://doi.org/10.5382/econgeo.4762, 2020.
Hawthorne, F. C. and Darrell J. H.: Classification of the Minerals of the Tourmaline Group, Eur. J. Mineral., 11(2), 201–216, https://doi.org/10.1127/ejm/11/2/0201, 1999
Henry, D. J. and Dutrow, B. L.: Chapter 10. Metamorphic Tourmaline and its Petrologic Applications, in: Boron_Mineralogy, Petrology and Geochemistry, vol. 33, edited by: Grew, E. S. and Anovitz, L. M., De Gruyter, Berlin, Boston, 503–558, 1996.
Henry, D. J. and Guidotti, C. V.: Tourmaline as a petrogenetic indicator mineral: an example from the staurolite-grade metapelites of NW Maine, Am. Mineral., 70, 1–15, 1985.
Hong, W., Cooke, D. R., Zhang, L., Fox, N., and Thompson, J.: Tourmaline-rich features in the Heemskirk and Pieman Heads granites from western Tasmania, Australia: Characteristics, origins, and implications for tin mineralization, Am. Mineral., 102, 876–899, https://doi.org/10.2138/am-2017-5838, 2017.
Kelly, C. J., Davis, W. J., Potter, E. G., and Corriveau, L.: Geochemistry of hydrothermal tourmaline from IOCG occurrences in the Great Bear magmatic zone: Implications for fluid source(s) and fluid composition evolution, Ore Geol. Rev., 118, 103329, https://doi.org/10.1016/j.oregeorev.2020.103329, 2020.
Kutzschbach, M., Wunder, B., Meixner, A., Wirth, R., Heinrich, W., and Franz, G.: Jeremejevite as a precursor for olenitic tourmaline: consequences of non-classical crystallization pathways for composition, textures and B isotope patterns of tourmaline, Eur. J. Mineral., 29, 239–255, https://doi.org/10.1127/ejm/2017/0029-2604, 2017
Kontak, D. J. and Clark, A. H.: Genesis of the Giant, Bonanza San Rafael Lode Tin Deposit, Peru: Origin and Significance of Pervasive Alteration, Econ. Geol., 97, 1741–1777, https://doi.org/10.2113/gsecongeo.97.8.1741, 2002.
Korges, M., Weis, P., Lüders, V., and Laurent, O.: Sequential evolution of Sn–Zn–In mineralization at the skarn-hosted Hämmerlein deposit, Erzgebirge, Germany, from fluid inclusions in ore and gangue minerals, Miner. Deposita, 55, 937–952, https://doi.org/10.1007/s00126-019-00905-4, 2020.
Lasaga, A. C.: Kinetic Theory in the Earth Sciences, Princeton university press, Princeton, 811 pp., 1998.
Lassin, A., Azaroual, M., and Mercury, L.: Geochemistry of unsaturated soil systems: Aqueous speciation and solubility of minerals and gases in capillary solutions, Geochim. Cosmochim. Ac., 69, 5187–5201, https://doi.org/10.1016/j.gca.2005.05.020, 2005.
Launay, G., Sizaret, S., Guillou-Frottier, L., Gloaguen, E., and Pinto, F.: Deciphering fluid flow at the magmatic-hydrothermal transition: A case study from the world-class Panasqueira W–Sn–(Cu) ore deposit (Portugal), Earth Planet. Sci. Lett., 499, 1–12, https://doi.org/10.1016/j.epsl.2018.07.012, 2018.
Lecumberri-Sanchez, P., Vieira, R., Heinrich, C. A., Pinto, F., and Wälle, M.: Fluid-rock interaction is decisive for the formation of tungsten deposits, Geology, 45, 579–582, https://doi.org/10.1130/G38974.1, 2017.
Legros, H., Elongo, V., Laurent, O., Adlakha, E., Chelle-Michou, C., Falck, H., and Lecumberri-Sanchez, P.: Formation of the Lened W-(Be) Skarn Deposit by Neutralization of a Magmatic Fluid – Evidence from H3BO3-Rich Fluids, Geosciences, 12, 236, https://doi.org/10.3390/geosciences12060236, 2022.
Li, X., Chi, G., Zhou, Y., Deng, T., and Zhang, J.: Oxygen fugacity of Yanshanian granites in South China and implications for metallogeny, Ore Geol. Rev., 88, 690–701, https://doi.org/10.1016/j.oregeorev.2017.02.002, 2017.
London, D.: Experimental synthesis and stability of tourmaline: a historical overview, Can. Mineral., 49, 117–136, https://doi.org/10.3749/canmin.49.1.117, 2011.
London, D., Hervig, R. L., and Morgan, G. B.: Melt-vapor solubilities and elemental partitioning in peraluminous granite-pegmatite systems: experimental results with Macusani glass at 200 MPa, Contrib. Mineral. Petrol., 99, 360–373, https://doi.org/10.1007/BF00375368, 1988.
Lynch, G. and Ortega, J.: Hydrothermal alteration and tourmaline-albite equilibria at the Coxheath porphyry Cu-Mo-Au deposit, Nova Scotia, Can. Mineral., 35, 79–94, 1997.
Morgan, G. B.: A spreadsheet for calculating normative mole fractions of end-member species for Na-Ca-Li-Fe2+-Mg-Al tourmalines from electron microprobe data, Am. Mineral., 101, 111–119, https://doi.org/10.2138/am-2016-5392, 2016.
Morgan, G. B. and London, D.: Experimental reactions of amphibolite with boron-bearing aqueous fluids at 200 MPa: implications for tourmaline stability and partial melting in mafic rocks, Contrib. Mineral. Petrol., 102, 281–297, https://doi.org/10.1007/BF00373721, 1989.
Nakano, T. and Nakamura, E.: Boron isotope geochemistry of metasedimentary rocks and tourmalines in a subduction zone metamorphic suite, Phys. Earth Planet. Inter., 127, 233–252, https://doi.org/10.1016/S0031-9201(01)00230-8, 2001.
Ogorodova, L. P., Melchakova, L. V., Kiseleva, I. A., and Peretyazhko, I. S.: Thermodynamics of natural tourmalines – Dravite and schorl, Thermochim. Acta, 539, 1–6, https://doi.org/10.1016/j.tca.2012.03.008, 2012.
Orlando, A., Ruggieri, G., Chiarantini, L., Montegrossi, G., and Rimondi, V.: Experimental Investigation of Biotite-Rich Schist Reacting with B-Bearing Fluids at Upper Crustal Conditions and Correlated Tourmaline Formation, Minerals, 7, 23, https://doi.org/10.3390/min7090155, 2017.
Parkhurst, D. L. and Appelo, C. A. J.: Description of input and examples for PHREEQC version 3 – A computer program for speciation, batch-reaction, one-dimensional transport, and inverse geochemical calculations, in: US Geological Survey Techniques and Methods, US Geological Survey, Denver, CO, USA, 497 pp., https://doi.org/10.3133/tm6A43, 2013.
Pichavant, M.: An experimental study of the effect of boron on a water saturated haplogranite at 1 Kbar vapour pressure: Geological applications, Contrib. Mineral. Petrol., 76, 430–439, https://doi.org/10.1007/BF00371485, 1981.
Pichavant, M.: Melt-fluid interaction deduced from studies of silicate-B2O3-H2O systems at 1 kbar, Bull. Minéralogie, 106, 201–211, https://doi.org/10.3406/bulmi.1983.7680, 1983.
Pichavant, M. and Manning, D.: Petrogenesis of tourmaline granites and topaz granites; the contribution of experimental data, Phys. Earth Planet. Inter., 35, 31–50, https://doi.org/10.1016/0031-9201(84)90032-3, 1984.
Pokrovski, G. S., Schott, J., and Sergeyev, A. S.: Experimental determination of the stability constants of NaSO4− and NaB (OH)40 in hydrothermal solutions using a new high-temperature sodium-selective glass electrode – Implications for boron isotopic fractionation, Chem. Geol., 124, 253–265, https://doi.org/10.1016/0009-2541(95)00057-S, 1995.
Pokrovski, G. S., Borisova, A. Y., and Bychkov, A. Y.: Speciation and Transport of Metals and Metalloids in Geological Vapors, Rev. Mineral. Geochem., 76, 165–218, https://doi.org/10.2138/rmg.2013.76.6, 2013.
Pownceby, M. I. and O'Neill, H. St. C.: Thermodynamic data from redox reactions at high temperatures. III. Activity-composition relations in Ni-Pd alloys from EMF measurements at 850–1250 K, and calibration of the NiO + Ni-Pd assemblage as a redox sensor, Contrib. Mineral. Petrol., 116, 327–339, https://doi.org/10.1007/BF00306501, 1994.
Prokof'ev, V. Y., Akinfiev, N. N., and Groznova, E. O.: On the Boron Concentration and Forms of Its Occurrence in Hydrothermal Ore-Forming Fluids, Geol. Ore Depos., 44, 386–397, 2002.
Qiu, Y., Zhang, R., Chou, I.-M., Wang, X., Hu, W., Zhang, W., Lu, J., Li, G., and Li, Z.: Boron-rich ore-forming fluids in hydrothermal W-Sn deposits from South China: Insights from in situ Raman spectroscopic characterization of fluid inclusions, Ore Geol. Rev., 132, 104048, https://doi.org/10.1016/j.oregeorev.2021.104048, 2021.
Scaillet, B., Pichavant, M., Roux, J., Humbert, G., and Lefèvre, A.: Improvements of the Shaw membrane technique for measurement and control of fH2 at high temperatures and pressures, Am. Mineral., 77, 647–655, 1992.
Schatz, O. J., Dolejš, D., Stix, J., Williams-Jones, A. E., and Layne, G. D.: Partitioning of boron among melt, brine and vapor in the system haplogranite–H2O–NaCl at 800 °C and 100 MPa, Chem. Geol., 210, 135–147, https://doi.org/10.1016/j.chemgeo.2004.06.007, 2004.
Sciuba, M., Beaudoin, G., and Makvandi, S.: Chemical composition of tourmaline in orogenic gold deposits, Miner. Deposita, 56, 537–560, https://doi.org/10.1007/s00126-020-00981-x, 2021.
Setkova, T. V., Balitsky, V. S., and Shapovalov, Yu. B.: Experimental Study of the Stability and Synthesis of the Tourmaline Supergroup Minerals, Geochem. Int., 57, 1082–1094, https://doi.org/10.1134/S0016702919100094, 2019.
Shock, E. L., Helgeson, H. C., and Sverjensky, D. A.: Calculation of the thermodynamic and transport properties of aqueous species at high pressures and temperatures: Standard partial molal properties of inorganic neutral species, Geochim. Cosmochim. Ac., 53, 2157–2183, https://doi.org/10.1016/0016-7037(89)90341-4, 1989.
Slack, J. F. and Trumbull, R. B.: Tourmaline as a Recorder of Ore-Forming Processes, Elements, 7, 321–326, https://doi.org/10.2113/gselements.7.5.321, 2011.
Smith, M., Banks, D. A., Yardley, B. W. D., and Boyce, A.: Fluid inclusion and stable isotope constraints on the genesis of the Cligga Head Sn-W deposit, S.W. England, Eur. J. Mineral., 8, 961–974, https://doi.org/10.1127/ejm/8/5/0961, 1996.
Taylor, J. R., Wall, V. J., and Pownceby, M. I.: The calibration and application of accurate redox sensors, Am. Mineral., 77, 284–295, 1992.
Tuduri, J., Chauvet, A., Barbanson, L., Bourdier, J.-L., Labriki, M., Ennaciri, A., Badra, L., Dubois, M., Ennaciri-Leloix, C., Sizaret, S., and Maacha, L.: The Jbel Saghro Au(–Ag, Cu) and Ag–Hg Metallogenetic Province: Product of a Long-Lived Ediacaran Tectono-Magmatic Evolution in the Moroccan Anti-Atlas, Minerals, 8, 592, https://doi.org/10.3390/min8120592, 2018.
Van Der Does, L. M., Hulsbosch, N., Kaskes, P., Elsen, J., Claeys, P., Muchez, P., and Sirbescu, M.-L. C.: Tourmaline growth in the border and wall zones of the emmons pegmatite (maine, U.S.A.): evidence for disequilibrium crystallization and boundary layer formation, Am. Mineral., 109, 785–798, https://doi.org/10.2138/am-2023-8991, 2024.
van Hinsberg, V. J. and Schumacher, J. C.: Using estimated thermodynamic properties to model accessory phases: the case of tourmaline, J. Metamorph. Geol., 25, 769–779, https://doi.org/10.1111/j.1525-1314.2007.00728.x, 2007.
van Hinsberg, V. J. and Schumacher, J. C.: The geothermobarometric potential of tourmaline, based on experimental and natural data, Am. Mineral., 94, 761–770, https://doi.org/10.2138/am.2009.3022, 2009.
van Hinsberg, V. J., Henry, D. J., and Dutrow, B. L.: Tourmaline as a Petrologic Forensic Mineral: A Unique Recorder of Its Geologic Past, Elements, 7, 327–332, https://doi.org/10.2113/gselements.7.5.327, 2011a.
van Hinsberg, V. J., Henry, D. J., and Marschall, H. R.: Tourmaline: an ideal indicator of its host environment, Can. Mineral., 49, 1–16, https://doi.org/10.3749/canmin.49.1.1, 2011b.
van Hinsberg, V. J., Franz, G., and Wood, B. J.: Determining subduction-zone fluid composition using a tourmaline mineral probe, Geochem. Perspect. Lett., 160–169, https://doi.org/10.7185/geochemlet.1719, 2017.
von Goerne, G., Franz, G., and Robert, J. L.: Upper thermal stability of tourmaline + quartz in the system MgO-Al2O3-SiO2-B2O3-H2O and Na2O-MgO-Al2O3-SiO2-B2O3-H2O-HCl in hydrothermal solutions and siliceous melts, Can. Mineral., 37, 1025–1039, 1999a.
von Goerne, G., Franz, G., and Wirth, R.: Hydrothermal synthesis of large dravite crystals by the chamber method, Eur. J. Mineral., 11, 1061–1078, https://doi.org/10.1127/ejm/11/6/1061, 1999b.
von Goerne, G., Franz, G., and Heinrich, W.: Synthesis of tourmaline solid solutions in the system Na2O–MgO–Al2O3–SiO2–B2O3–H2O–HCl and the distribution of Na between tourmaline and fluid at 300 to 700 °C and 200 MPa, Contrib. Mineral. Petrol., 141, 160–173, https://doi.org/10.1007/s004100100243, 2001.
von Goerne, G., Franz, G., and van Hinsberg, V. J.: Experimental determination of Na-Ca distribution between tourmaline and fluid in the system CaO-Na2O-MgO-Al2O3-SiO2-B2O3-H2O, Can. Mineral., 49, 137–152, https://doi.org/10.3749/canmin.49.1.137, 2011.
Wang, P., Kosinski, J. J., Lencka, M. M., Anderko, A., and Springer, R. D.: Thermodynamic modeling of boric acid and selected metal borate systems, Pure Appl. Chem., 85, 2117–2144, https://doi.org/10.1351/pac-con-12-07-09, 2013.
Weisbrod, A., Polak, C., and Roy, D.: Experimental study of tourmaline solubility in the system Na-Mg-Al-Si-B-O-H. Applications to the boron content of natural hydrothermal fluids and tourmalinization processes., Experimental Mineralogy and Geochemistry, Nancy, France, 140–141, 1986.
Williamson, B. J., Spratt, J., Adams, J. T., Tindle, A. G., and Stanley, C. J.: Geochemical Constraints from Zoned Hydrothermal Tourmalines on Fluid Evolution and Sn Mineralization: an Example from Fault Breccias at Roche, SW England, J. Petrol., 41, 1439–1453, https://doi.org/10.1093/petrology/41.9.1439, 2000.
Williamson, B. J., Müller, A., and Shail, R. K.: Source and partitioning of B and Sn in the Cornubian batholith of southwest England, Ore Geol. Rev., 38, 1–8, https://doi.org/10.1016/j.oregeorev.2010.05.002, 2010.
Wolf, M. B. and London, D.: Boron in granitic magmas: stability of tourmaline in equilibrium with biotite and cordierite, Contrib. Mineral. Petrol., 130, 12–30, https://doi.org/10.1007/s004100050346, 1997.
Zimmermann, R., Knop, E., Heinrich, W., Pehlke, I., and Franz, G.: Disequilibrium in cation exchange experiments between Na-K-Ca amphiboles and aqueous Na-K-Ca chloride solutions: effects of fractional crystallization, Eur. J. Mineral., 9, 97–114, https://doi.org/10.1127/ejm/9/1/0097, 1996.