the Creative Commons Attribution 4.0 License.
the Creative Commons Attribution 4.0 License.
 | 15 Oct 2026
New methods for Fourier transform infrared spectroscopy investigation and quantification of OH absorption in anisotropic nominally anhydrous minerals: the example of pyroxene

Jörg Hermann
Georgia Cametti
Sonja Aulbach
Fourier transform infrared spectroscopy (FTIR) is a powerful method for investigating and quantifying structurally bound OH, commonly reported as an H2O-equivalent (wt. % or µg g−1) oxide component, in nominally anhydrous minerals (NAMs). However, anisotropy in the absorbance depending on crystal orientation relative to the direction of the incident infrared beam causes large uncertainty. For orthorhombic orthopyroxene, the crystallographic and optical indicatrix axes coincide and can be found in randomly oriented grains using characteristic Si–O overtone bands and morphological or optical features. For monoclinic clinopyroxene, the infrared indicatrices of different OH-related defects are not always aligned with the axes of the optical indicatrix, complicating the determination of the total integrated absorbance and, thus, H2O quantification.
An automatic FTIR polariser has been developed that enables the acquisition of large numbers of spectra between 0 to 180° with equal-angle intervals. With a new software solution, efficient processing, evaluation, and visualisation of the angle-resolved polarised measurements of large data sets are possible. This set-up allows recognition of spectral endmembers in the Si–O overtone region (wavenumber range 1250–2300 cm−1) that can be used to find groups of mutually perpendicular spectra and to obtain minimum and maximum OH absorption in the wavenumber range 3800–3000 cm−1 in different directions and sections. A new nomenclature for polarised FTIR measurements in low-symmetry crystals is proposed that includes the orientation of the analysed crystal section, as well as the direction of the electric field vector of the incident wave.
From a large data set of Si–O overtone bands from diopside, augite, and omphacite, five distinct spectral endmembers aligned with axes of the optical indicatrix X, Y, and Z; the crystallographic b and c axes; and the orthogonal direction (a*) were recognised. Detailed investigation using angular polarised measurements allowed the identification of combinations of endmember spectra suitable for a robust approximation of the total integrated absorbance and, thus, more accurate H2O content determination of a sample. For diopside and augite, cuts along the axes of the optical indicatrix are best suited to determine the total integrated absorbance, whereas, for omphacite, cuts along the crystallographic b and c axes and the orthogonal direction (a*) give the most reproducible results. In addition, Si–O overtones can help to evaluate sample homogeneity as spectra with the same Si–O overtone signal are measured in crystal sections with the same orientation and polarisation direction, and, thus, O–H absorption becomes directly comparable. The angular polarisation series combining Si–O overtones with OH absorbance bands analysis is a powerful tool for identifying families of bands with similar polarisation behaviour and for the detection of minor and overlapping absorption bands, leading to a better understanding of OH incorporation mechanisms in low-symmetry crystals.
- Article
(40401 KB) - Full-text XML
-
Supplement
(45732 KB) - BibTeX
- EndNote


Fourier transform infrared spectroscopy (FTIR) is an important vibrational spectroscopy method for investigating the speciation of water-derived species (H2O, H2, OH−) and their concentration. The content of hydrogen in nominally anhydrous minerals (NAMs), such as pyroxenes, garnet, or olivine, is commonly reported as an H2O-equivalent (wt. % or µg g−1) oxide component. In addition to speciation and quantification, FTIR provides insights into incorporation mechanisms, for example, the binding of H atoms to oxygen at different crystallographic sites as charge-balanced coupled substitutions and OH dipole orientation (Beran and Zemann, 1969; Skogby et al., 1990; Ingrin and Skogby, 2000; Demouchy and Bolfan-Casanova, 2016; Stalder, 2021).
In optically isotropic minerals, such as garnet, the absorption is equal in all directions, and, thus, it is possible to determine the H2O content of a sample with a single measurement using 3 times the integrated absorbance in a single orientation and measurement (Aint; e.g. Bell et al., 2003). Conversely, in anisotropic minerals belonging to the tetragonal, trigonal, hexagonal, and orthorhombic crystal systems, such as quartz and olivine or orthopyroxene, quantification of H2O content is based on a modified Beer–Lambert law that links the absorbance along three orthogonal directions (total absorbance) with the sample thickness and the H2O content (e.g. Libowitzky and Rossman, 1996; Demouchy and Bolfan-Casanova, 2016; Stalder, 2021). In such anisotropic materials, O–H bonds can be investigated by combining multiple polarised measurements of differently oriented grains and identifying “families of bands” related to a common defect group with similar polarisation behaviour (e.g. Lemaire et al., 2004; Demouchy and Bolfan-Casanova, 2016). For crystals showing strong anisotropy in the absorption of the H-related defects, the sum of polarised measurements along the three orthogonal directions (e.g. axes of the optical indicatrix X, Y, and Z or crystallographic axis a, b, or c) is needed to calculate the total absorbance. This approach is well-established and the best practice for large idiomorphic, homogeneous, inclusion-free single crystals with orthorhombic or higher symmetry, which are large enough to be oriented parallel to the principal optical or crystallographic axes (e.g. Libowitzky and Rossman, 1996).
For lower-symmetry minerals like clinopyroxene and feldspars, the determination of the total absorbance is more complex. Generally, the total absorbance is determined by measuring the principal polarised infrared spectra along the axes of the optical indicatrix (Bell et al., 2004; Withers, 2013). Practically, two orthogonal sections parallel to morphological features are prepared and can be oriented parallel to the optical indicatrix (nα, nβ, and nγ) using a polarisation microscope. Multiple grains with different orientations can then be used to calculate an average total absorbance for all measured crystals (e.g. Peslier et al., 2002; Sundvall and Stalder, 2011; Demouchy and Bolfan-Casanova, 2016; Aulbach et al., 2023). This approach is successful if the maximum and minimum absorptions (the infrared indicatrix) are aligned with the optical indicatrix. However, for minerals with monoclinic and triclinic crystal systems, three measurements along the principal polarised infrared spectra along the axes of the optical indicatrix are not sufficient to fully describe the absorption tensor, even for a single defect, or the hydrogen substitution mechanisms of these crystals. Strens et al. (1982) already established for polarised visual light spectroscopy that, in monoclinic and triclinic crystals, the direction of the principal absorption does not always coincide with either the crystallographic or the principal refractive index directions. Therefore, polarised measurements along more than three independent directions (four for monoclinic and six for triclinic) are needed for a correct description of the polarisation behaviour (Dowty, 1978; Strens et al., 1982). In fact, for a complete description, the principal directions of the largest, smallest, and intermediate absorptions are required for each important absorption band (corresponding to a specific defect type). Consequently, the orientation of the indicatrix of any single absorber cannot be assumed and must be measured, for example, by acquiring angular polarised measurements in multiple sections of a crystal, allowing us to construct the absorption indicatrix for the specific absorber. Previous work has shown that, for high-temperature augite, the main OH absorption directions are well-aligned along the axes of the optical indicatrix (Bell et al., 2004; Withers, 2013), but, for omphacite, which is the focus of this and further studies, much fewer data are available.
For the investigation of hydrogen incorporation mechanisms in monoclinic and triclinic crystals, it is thus essential to find efficient ways to determine the principal absorption directions of OH dipoles. Performing extensive measurements, including the preparation of several oriented sections or cubes, for a large set of samples and different mineral grains to obtain average H2O contents is very time-consuming and, for many projects, not practical. Additionally, in many cases, it is beneficial to maintain the textural context of the mineral analysed (Demouchy and Bolfan-Casanova, 2016). Thus, new approaches are needed for efficient polarised measurements in many directions in multiple grains in thick sections.
This work presents a new workflow for investigating a large number of grains with different orientations in multiple polarisation directions that can identify suitable spectra for H2O quantification and identify OH defects in pyroxene. The first innovation is two hardware solutions, including an automatic polariser that enables the automatic acquisition of polarised spectra between 0 to 180° with equal-angle intervals and a newly designed sample holder that allows a cuboid sample to be measured in three orthogonal directions in a single set-up. The second innovation includes software solutions for efficient processing, evaluation, and visualisation of the angle-resolved polarised measurements or other data sets containing large numbers of polarised spectra. For example, the use of spectral endmembers in the Si–O overtone region (wavenumber range 1250–2300 cm−1) allows for the finding of groups of mutually perpendicular spectra, which reduces the uncertainty on the total integrated absorbance of the O–H region (wavenumber range 3800–3000 cm−1) and leads to an improved H2O quantification. Additionally, in anisotropic minerals, combining Si–O overtones with OH absorbance band analysis can help in identifying families of bands with similar polarisation behaviour and in revealing minor absorption bands, leading to a better understanding of incorporation mechanisms. Therefore, such angular polarised measurements are very useful to characterise specific defects, as well as to measure the total absorbance, especially in omphacite. Crystals with the same Si–O overtone pattern have the same orientation and can therefore be compared directly in terms of their OH absorbance and, hence, their H2O content, providing a tool to determine whether a mineral has a homogenous H2O content or is zoned. Finally, different procedures for quantifying the total absorbance of different sets of commonly investigated types of samples are presented to improve the assessment of total absorbance and its uncertainty with regards to orientation and zonation using the improved knowledge about the absorption polarisation behaviour of Si–O overtones and OH-related defects.
2.1 Nomenclature of crystal orientation, polarisation, and measurement directions
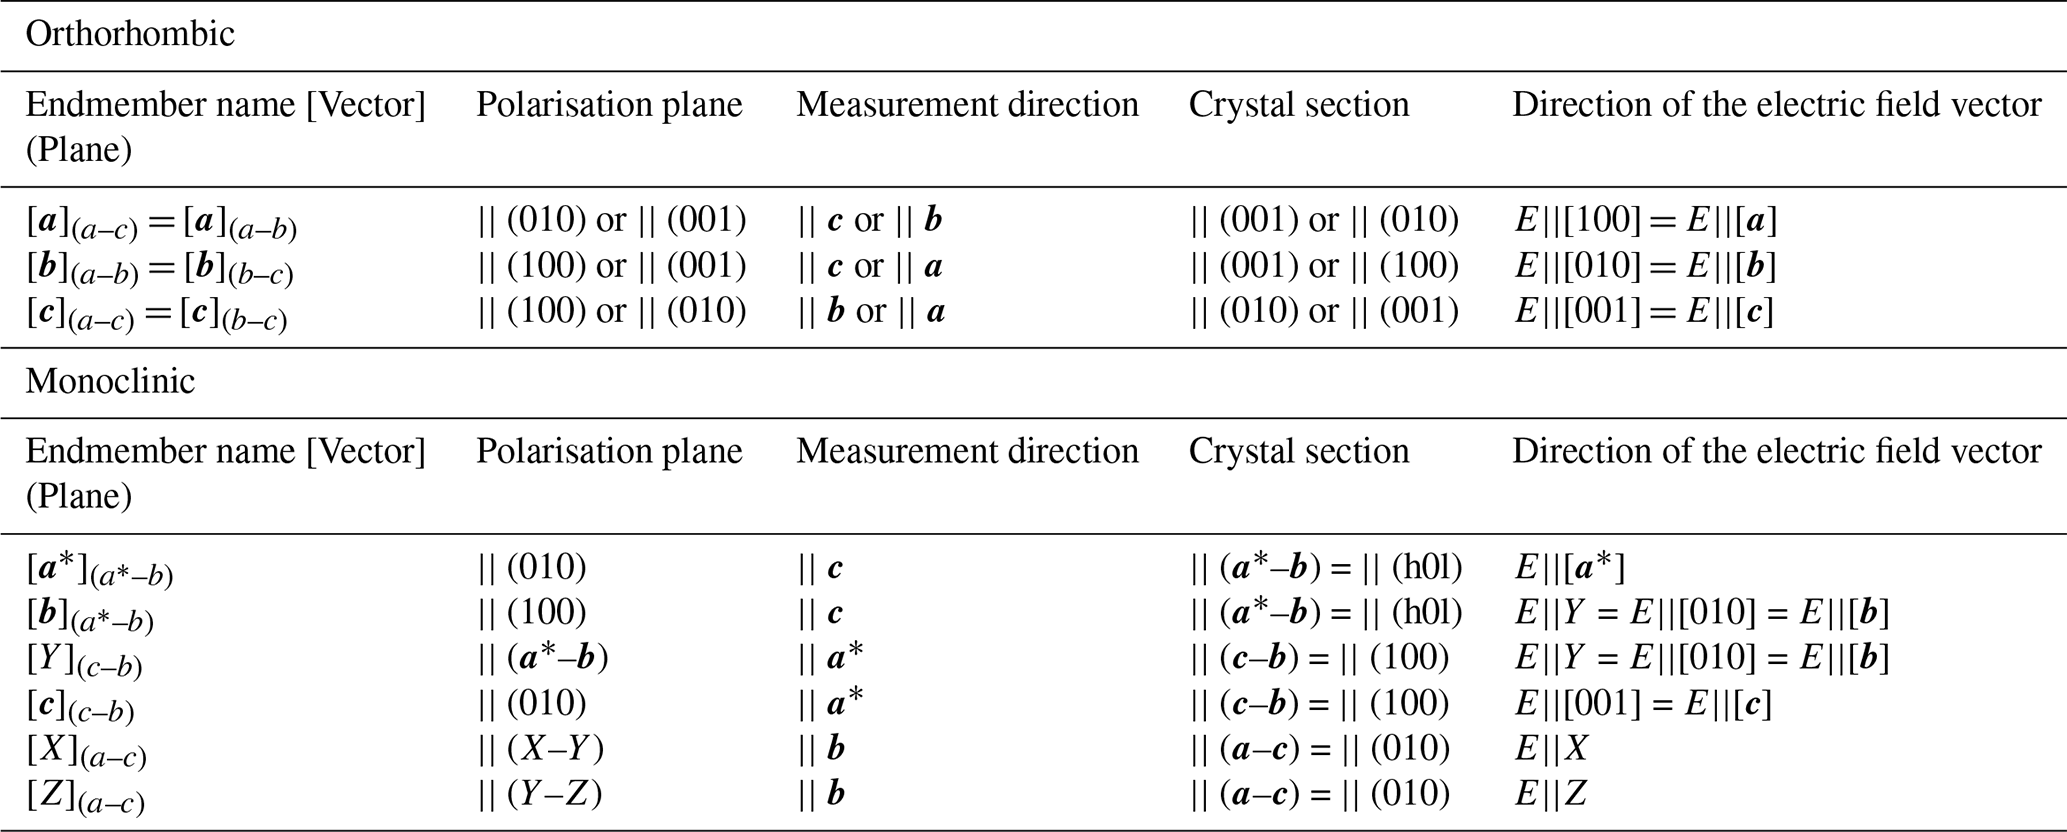
In the following, crystallographic axes are referred to as a, b, and c. For orthorhombic and monoclinic minerals, the refractive indices are labelled as nα, nβ, and nγ, and the axes of the optical indicatrix are labelled as X, Y, and Z. For orthopyroxene °, and the crystallographic axes overlap with the principal optical axes (Table 1 and Fig. 1a). Therefore, in crystal sections parallel to (100), (010), and (001), two of the three optical axes are in the plane (Table 1 and Fig. 1b).
In the monoclinic system of clinopyroxene, the angles ° and β≠90° and, thus, the a axis are not perpendicular to the (b–c) plane. Therefore, the vector a* was defined as the normal vector in relation to the (b–c) plane, resulting in three orthogonal vectors together with the b and c axes (Table 1 and Fig. 1c). To avoid confusion with previous notations, a new nomenclature is introduced for the directions of the polarised measurements of specific crystal sections, following a practical approach based on features which are common in a wide range of natural samples and that can be easily identified in polarised spectra of different samples (e.g. idiomorphic large single crystals, grain separates or thick sections). In addition to optical features that can be used to find the principal optical axes, morphological features can be used to obtain a reference orientation and two additional perpendicular planes. For example, clinopyroxene displays two cleavage planes, orthogonal to each other, and both contain the c axis; thus, the direction of the c axis can be easily identified (Table 1 and Fig. 1d).
Previous nomenclature was often constrained to the axis of the optical indicatrix in various measurement directions, which, for clinopyroxenes, has the limitation that samples with different compositions are not easily comparable. The reason for this is that the angle between the crystallographic c axis and the axes of the optical indicatrix X and Z, which are all parallel to (010), depends on the major element composition, as reflected by the extinction angle, which can vary from 4 to 94° (Tröger, 1956).
The new orientation nomenclature combines two parameters and is stated as [Vector](Plane). The first parameter [Vector] describes the polarisation direction of the incident infrared beam, which is set by rotating the polariser on the instrument. The second parameter (Plane) is the crystal section orthogonal to the [Vector], making it easier to quickly identify how a crystal needs to be prepared in order to measure a specific direction. To keep the definition compact, (Plane) is formatted as a subscript. This nomenclature is highly flexible as it can be used for any crystal system, combining Miller indices; the axes of the optical indicatrix X, Y and Z; the crystallographic axes a, b, and c; or any other defined vectors, for example, a*, being the orthogonal vector in relation to the (c–b) plane.
The important benefit of the new nomenclature is that different samples become directly comparable in terms of absorption behaviour and anisotropy. When referring to the polarisation direction, the electric field vector of the incident wave E of the polarised infrared beam is alternately oriented parallel in the corresponding planes [a*], , [Y](b–c), [c](b–c), [X](a–c), or [Z](a–c), with the propagation direction as defined in Table 1.
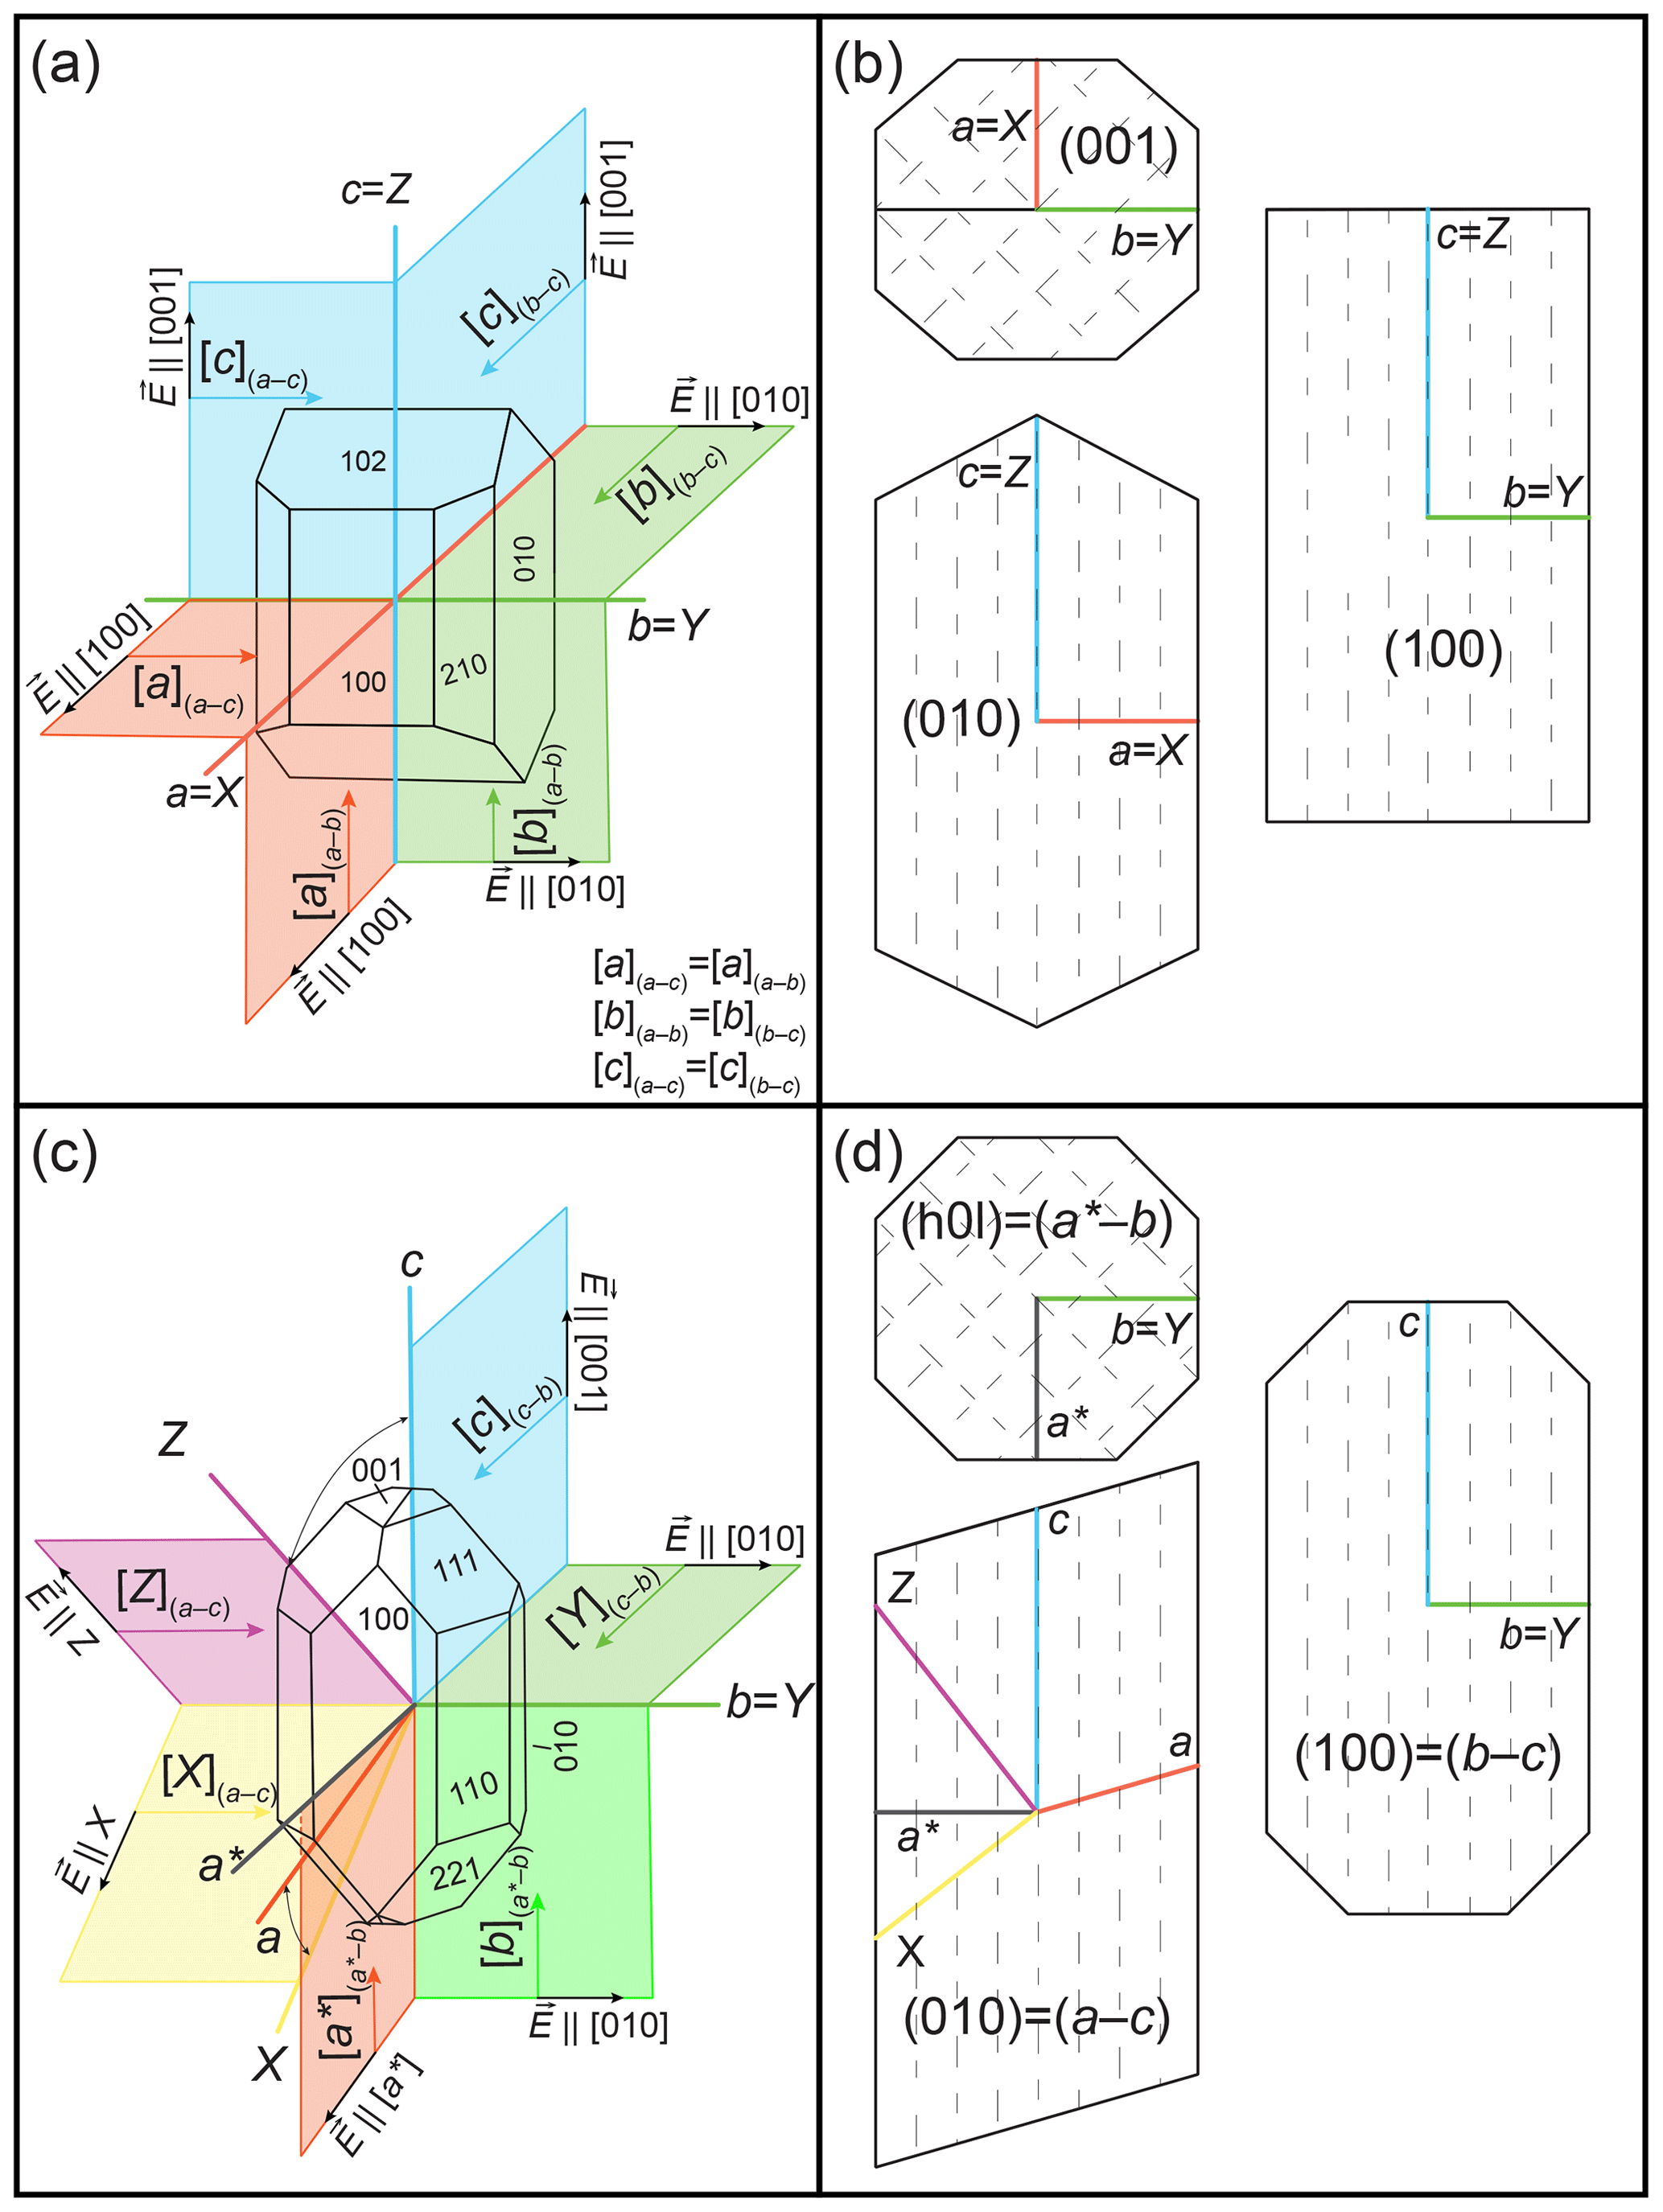
Figure 1Representative sketch of the nomenclature for orthorhombic (a and b) and monoclinic (c and d) crystals showing the crystallographic axes a, b, and c; the a* vector which is orthogonal to c and b; the axes of the optical indicatrix X, Y, and Z; and the direction of polarised measurements, defined as [a*], , [Y](b–c), [c](b–c), [X](a–c), and [Z](a–c) in a monoclinic system.
Table 1Definition of the polarisation directions and planes [a*], , [Y](b–c), [c](b–c), [X](a–c), and [Z](a–c) in which the electric field vector of the incident wave E of the polarised infrared beam is alternately oriented parallel to the corresponding planes. For the endmember name, [Vector] is the polarisation direction of the incident infrared beam (set by the orientation of the infrared polariser), (Plane) is the crystal section orthogonal to the [Vector], and a* is the orthogonal vector in relation to the (c–b) plane.
2.2 H2O Quantification in NAMs with FTIR
To quantify the H2O content of NAMs with FTIR, a modified version of the Beer–Lambert law is commonly used and can be expressed as follows:
is the H2O content (ppm H2O by weight; µg g−1), is the molecular weight of H2O (18.02 g mol−1), A* is the total linear or integrated absorbance of three orthogonal polarised measurements normalised to 1 cm (cm−1 for linear values or cm−2 for integrated values; for isotropic materials ), ρ is the density of the mineral (in g L−1), ℰ is the linear or ℰi integrated molar absorption coefficient (in L mol(H2O)−1 cm−1 or L mol(H2O)−1 for absolute values, cm−2 for integrated values), t is the path length that the infrared beam travels through the sample, defined by the thickness of the sample, to the IR light beam (in cm), and 106 is the conversion factor to obtain the results in µg g−1. When working with samples that have an inclined or rough surface (e.g. loose grains) relative to the direction of the infrared beam, it is important to consider the fact that the actual path length t can differ from the sample's thickness due to variations in the beam trajectory caused by the mineral's refractive index or scattering effects.
In homogeneous samples, it is possible to obtain the total absorption of a crystal calculated as the sum of three polarised spectra along the three axes of the optical indicatrix (Bell et al., 2003; Asimow et al., 2006) or by measuring any three mutually orthogonal polarised spectra in two perpendicular sections (Libowitzky and Rossman, 1996). These can be obtained either by using the morphologic features of a crystal, such as, for example, crystal habitus and cleavage of a clinopyroxene (Eq. 4), or the optical features (Eq. 5) or by using spectral features such as Si–O overtones to identify sets of known spectra acquired perpendicular to three orthogonal vectors.
Libowitzky and Rossman (1996) demonstrated that the unpolarised spectrum can be calculated from any orthogonal measurements (acquired with the polariser at x and x+90°) in a single cut. By using the approximation , the following equation can be used to approximate the total integrated absorbance by ideally using orthogonal sections that contain minimum and maximum absorbance of the main defects. This will then average and minimise the effect of different indicatrices, especially if the sections and spectra used are close to the maximum and minimum, and, consequently, the following formulation is used for estimating the approximated total integrated absorbance:
where , , and .
It is important to keep in mind that, in measurements of natural samples, this is often only an approximation due to errors in the orientation of the samples and should be applied using spectra acquired within the validity of the Beer–Lambert law (i.e. under nearly linear, non-saturating conditions) with absorbance below 1 before thickness normalisation, and, in samples with strong anisotropy, this approximation cannot be applied (see Withers, 2013).
For clinopyroxene in particular the determination of total absorbance comes with additional complications. Some of the OH-related defects show a polarisation behaviour that is aligned with the axes of the optical indicatrix (X, Y, and Z), while others show an orientation close to the crystallographic b and c axes and the vector a* (Dowty, 1978; Strens et al., 1982). Therefore, a framework must be established relating to how minimum, maximum, and intermediate absorbances of the main OH defects vary as a function of clinopyroxene composition. The usefulness of Si–O overtones in FTIR spectra to obtain information on mineral orientation has been recognised for several years (e.g. Jamtveit et al., 2001; Johnson et al., 2002; Lemaire et al., 2004; Asimow et al., 2006; Férot and Bolfan-Casanova, 2012; Karimova and Stalder, 2013; Mosenfelder and Rossman, 2013; Aulbach et al., 2023). However, Si–O overtones have not been systematically investigated for minerals with lower symmetries. To date, there is no general agreement in the community regarding the publication of the full spectra used in FTIR studies. Therefore, many studies do not report polarised spectra, publish only few representative spectra of the O–H region, and neglect the Si–O overtones, which could be useful in distinguishing different orientations and polarisation directions.
2.3 Theoretical behaviour of polarised absorption intensity
The approximated theoretical transmission and absorption behaviours for small absorbances as a function of polarisation angle, following Malus's Law, have been formulated and applied previously (Eq. 8, e.g. Libowitzky and Rossman, 1996; Kovács et al., 2008; Asimow et al., 2006; Sambridge et al., 2008). Theoretical equations that are important for this empirical work are summarised in Eqs. (7)–(9). Note that the true physical theoretical background and mathematical formulations, which take dispersion, refraction, scattering, and other effects into account and which are also valid for high absorbances, are far more complex than presented here. The empirical validation of the relationship between sample thickness, linear absorbance, and integration was carefully tested and is valid for absorption bands and thicknesses with low absorbances and low anisotropy (see Kovács et al., 2008; Asimow et al., 2006; Sambridge et al., 2008; Withers, 2013; Shuai and Yang, 2017).
From the absorbance of the polarised endmember spectra, the theoretical absorbance values can be calculated. A first conclusion of this work is that an orientation mismatch of ±10° close to a maximum or minimum intensity is insignificant up to a maximum absorbance of 0.5, whereas the same mismatch midway between the maximum and minimum intensity has a significant effect on the estimated absorption value and deviates even more strongly for higher absorbance (Fig. 2). An additional fundamental observation is that spectra with low absorbance, measured close to the absorption maximum and minimum, show the least deviation from the theoretical approximation (Eqs. 8–9), which is particularly useful for practical applications of anisotropic materials. Conversely, spectra recorded at intermediate angles can deviate significantly and should therefore be avoided (if possible) for quantitative analysis. This shows the importance of identifying the actual maximum and minimum OH absorbance in low-symmetry crystals rather than assuming a priori their orientations. This implies that, for natural samples, errors due to misalignment of the crystal are negligible close to a maximum or minimum but can result in a large error in intermediate domains. Additionally, the relationship of Eq. (8) only holds within the validity of the Beer–Lambert law (i.e. absorption linear to thickness and low anisotropy), which is empirically valid below an absorption of 1 for non-thickness-corrected spectra. In the case of higher absorption, Eq. (9) must be used. For most NAMs investigated, when using double-sided polished thick sections of <500 µm, the absorbance values of OH-related defects are low enough that the approximations of Eq. (8) and, thus, also , , and are applicable. In larger single crystals, NAMs with very high H2O content and hydrous phases, absorbance can easily exceed 1, and the approximations should not be applied anymore. Figure C2 in the Supplement shows how the strong absorption of Si–O overtone bands leads to a deviation from Eq. (8) for the angular polarisation, while the weaker absorption of the OH bands can be very well approximated by Eq. (8). As a result, the calculated unpolarised spectrum of the OH bands matches the measured one very well, whereas a significant derivation can be observed between the calculated and measured spectra of the Si–O overtone bands (Fig. C3).
The equations above are as presented in Libowitzky and Rossman (1996); θ is the angle between the electric field vector E of the incident light and the transition dipole moment of the absorber. ϕ is the angle between the electric field vector of E of the incident light and the maximum absorbance value (Amax) of the absorbance figure.
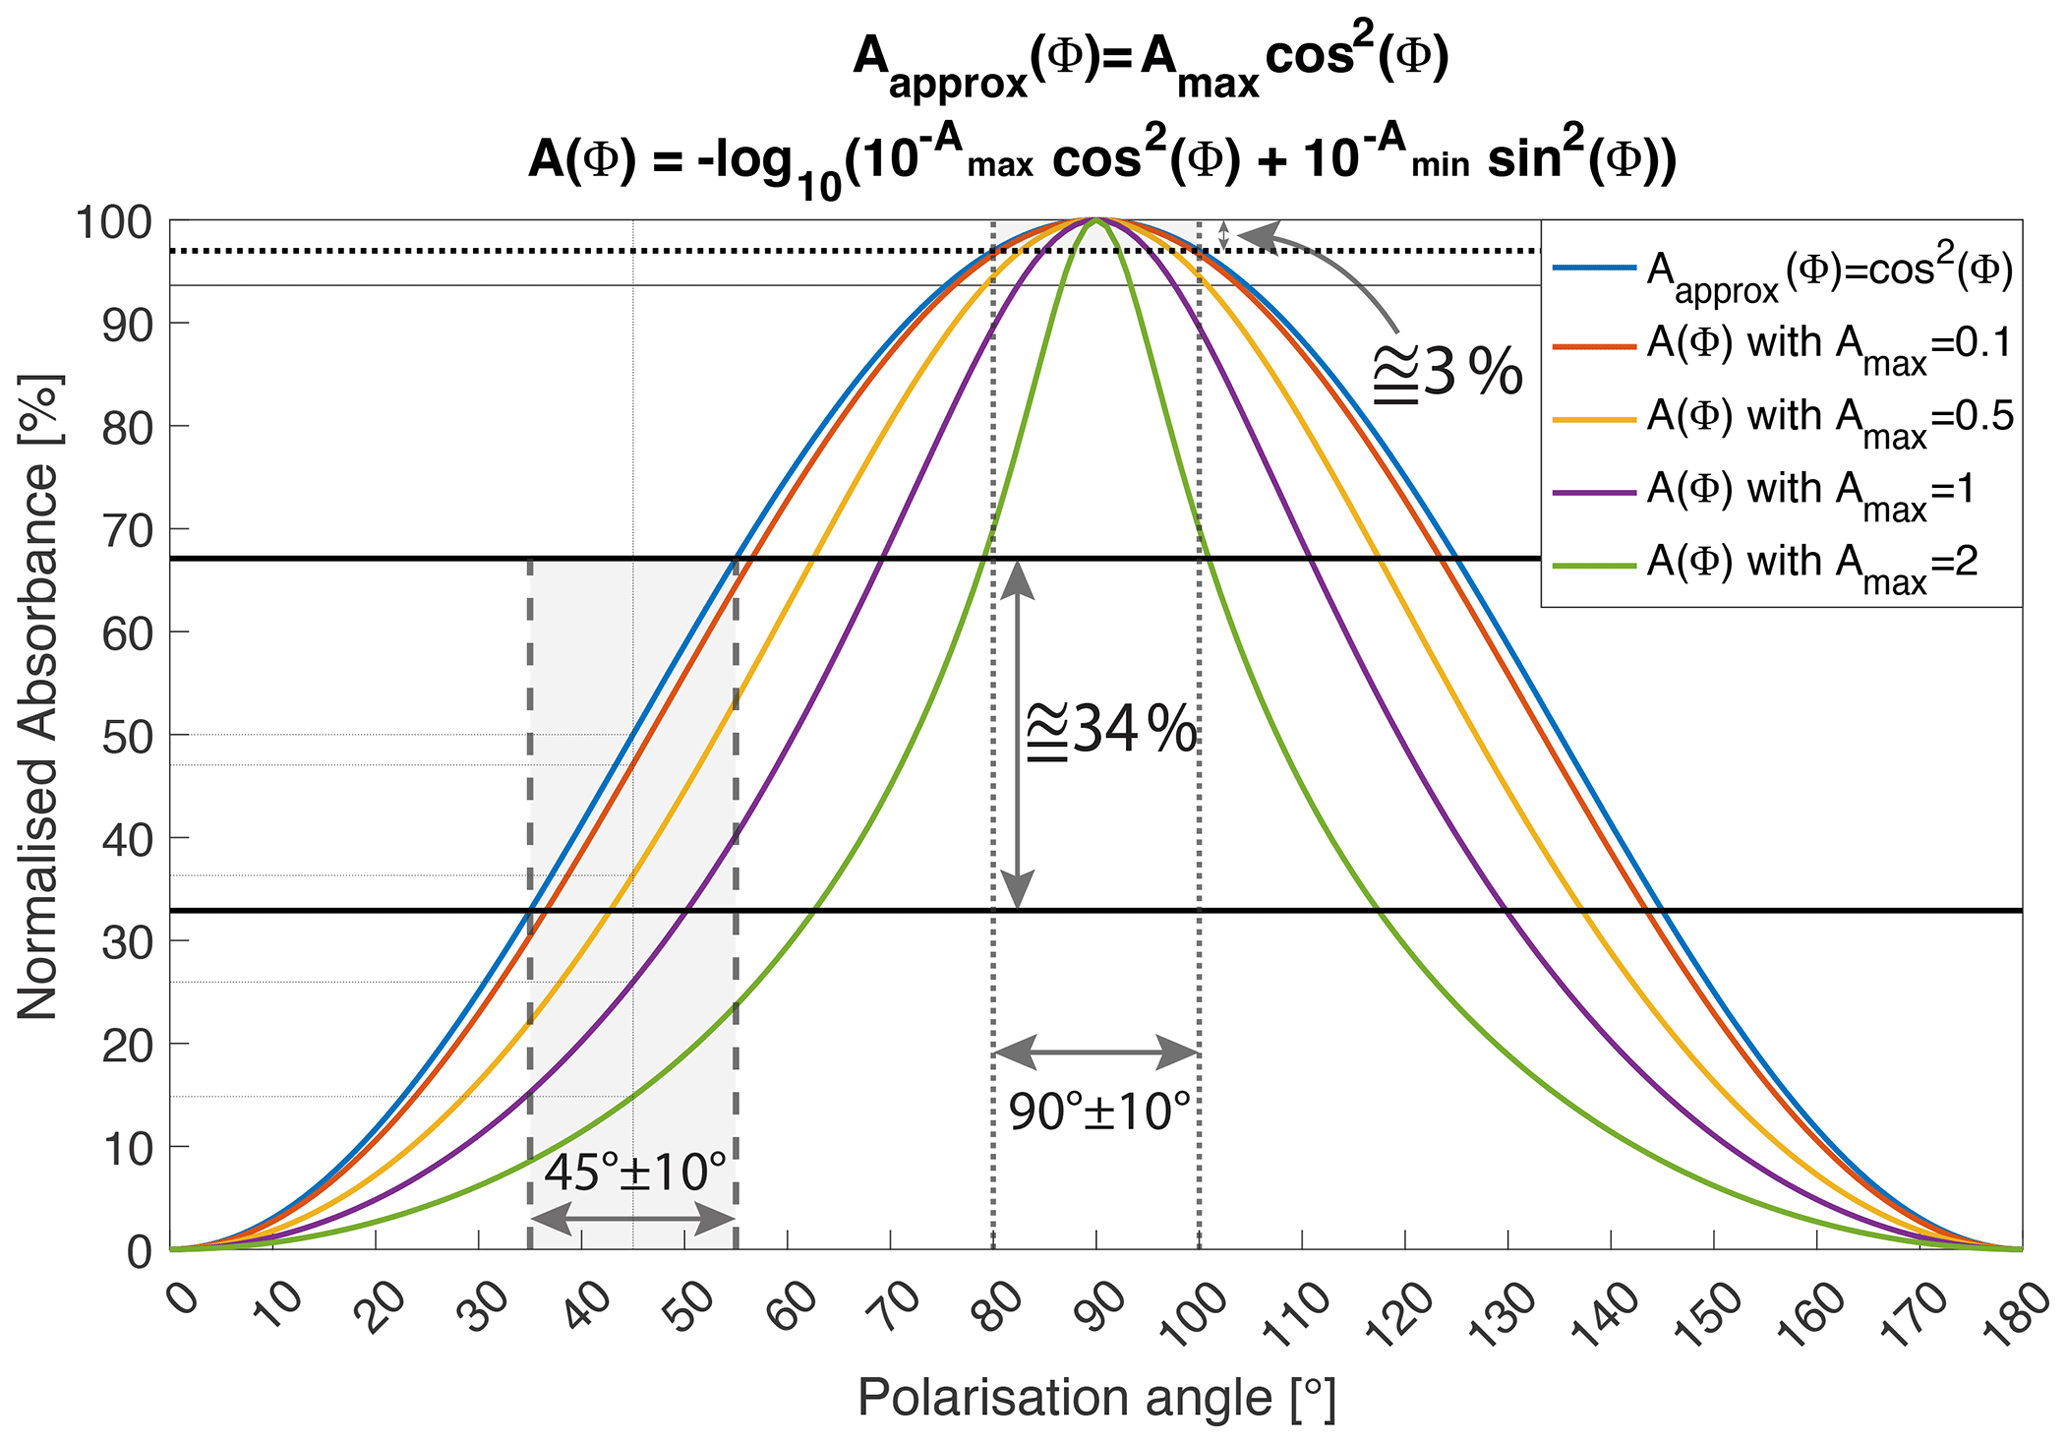
Figure 2Theoretical polarisation effect and visualised effect on the intensity by an orientation mismatch of ±10°, close to a maximum intensity and midway between the maximum and minimum intensity comparing the approximation of Eqs. (8) and (9) with different maximum absorbances. Both equations are very similar for small absorbances but deviate for high absorbances. For low absorbance, changes in absorption are at a minimum within the maximum or minimum intensity range (20° results in a 3 % variation), whereas they are at a maximum halfway (20° results in a 34 % variation). If measured angular polarised spectra follow an Amax×cos 2(ϕ) relation, the approximation is applicable. Additionally, the range over which a linear approximation is applicable decreases significantly at higher Amax.
3.1 Methodological developments
3.1.1 Automatic polariser
To automatically acquire spectra with an incrementally changing polarisation angle in a single section, an open-source, customisable, low-cost, 3D-printed automatic-rotation device for an FTIR polariser was designed. Components were chosen to be widely available, affordable, and compatible with the Arduino environment (https://www.arduino.cc/, last access: 9 September 2026) to allow for an easy substitution or exchange of individual electronic parts. This device can be attached to Bruker Hyperion microscopes (or modified to fit other instruments) and uses a stepper motor controlled by a microcontroller to automatically rotate the polariser (Fig. 3).
The Supplement includes a list of the hardware and electronic components required, 3D designs, a wiring diagram, and the source code, allowing anyone to build their own automatic polariser and to modify the design as desired. In addition, all relevant files, as well as future additions and updates, will be published on GitHub (https://github.com/NilsGies/OpenPolariser, last access: 9 September 2026). The user can connect to the microcontroller via the Wi-Fi network of the microcontroller, access the controller's web interface, adjust the settings, and control the rotation of the stepper motor. Furthermore, an additional limit switch can be attached to the microcontroller, which enables the automatic incrementation of the polariser each time the limit switch is activated.
If the background position of a movable XY stage is set to be the final point in a measurement sequence and if the limit switch is activated upon reaching the background position, the same set of points can be repeatedly measured, followed by the acquisition of a new background position. This new background position will rotate the polariser by the selected step size. By repeating the procedure n times (where n is calculated as 180 divided by the step size plus 1), it is possible to obtain automatic, simultaneous measurements of the full polarisation group for a large number of spots with an additional measurement of the background with the corresponding polarisation angle. This approach enables rapid acquisition of a substantial number of spectra, comprising sets of spectra of the same measurement positions acquired with incremental polarisation angle steps. A set of spectra of the same measurement position with incremental polarisation changes from 0 to 180° will hereafter be referred to as the “angular polarisation series” spectra. These angle-resolved polarised spectra can then be utilised, as demonstrated in the following examples, to investigate the polarisation behaviour of different mineral samples.
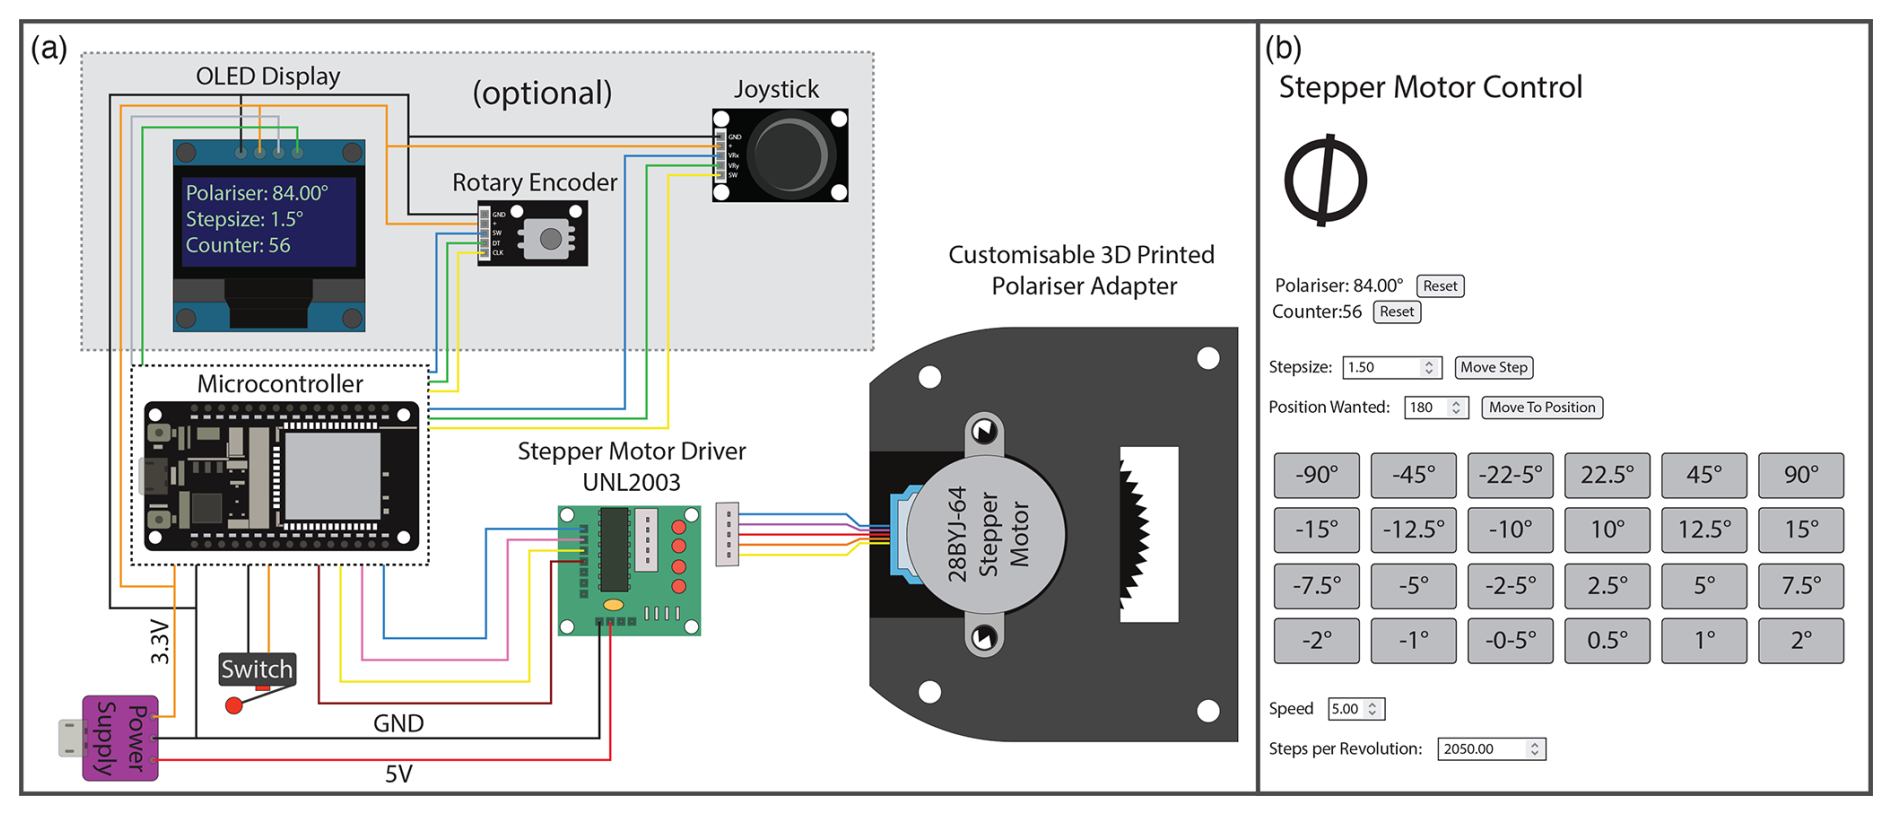
Figure 3Schematic wiring diagram and customisable 3D-printed polariser (a) and stepper motor with examples of possible optional hardware extensions and controller web interfaces (b).
3.1.2 PolPlotModule
For the data processing, the PolPlotModule for the open-source spectroscopy processing software SpecXY (Gies et al., 2024, https://github.com/NilsGies/SpecXY_Public, last access: 9 September 2026) was developed. The PolPlotModule add-on allows for the division of a set of measurements of different measurement positions with angular polarised measurements acquired with the Automatic Polariser into individual sets of spectra, where each set contains spectra acquired with incrementally changing orientation of the infrared polariser between 0 and 180° (or 360°) of the same measurement position. These angle-resolved polarised spectra allow for visualisation of angular FTIR polarisation series measurements. It is possible to choose bands from a database, add custom bands to investigate their polarisation behaviour, and plot XY and polarisation plots. Furthermore, a new MultiSpectraDeconvolution has been developed that carries out a Simplex inversion, minimising the global peak deconvolution error for the full set of spectra, considering all spectra within a set of angle-resolved polarised spectra. It is also possible to extract the spectra with the lowest and highest absorbance values at specific bands to reduce the complexity of a data set and extract spectral endmembers of the chosen band.
3.1.3 Spectral endmember estimation
To be able to deal with the large number of spectra, the two-step routine Spectral Endmember Estimation was added to SpecXY. This method first uses the N-FINDR algorithm (Winter, 1999) to estimate the spectral endmember signatures of a given data set in the chosen spectral xsignal range for a defined number of endmembers. In a second step, a non-negative linear least-squares algorithm is employed to estimate the spectral-mixing proportions of the previously estimated endmember components for each spectrum in the full data set. Finally, results are added to the database table. Spectral mixing in the context of anisotropic orientation effects is non-linear (see Eqs. 7–9), and, therefore, spectral-mixing components cannot be interpreted directly as orientation. Additionally, obtained results are only valid if the endmembers are present in the set of spectra and have distinct spectral endmember features. Furthermore, this workflow requires knowledge of the number of spectral components and is very sensitive to variations in a spectral data set (e.g. signal noise, orientation, spectral mixing, contamination, spectral intensity). Therefore, detailed knowledge about the system is required to validate the results of the Spectral Endmember Estimation, and the reliability of the results may strongly depend on the data sets.
3.1.4 New sample holder
In order to measure transmission FTIR spectra in three orthogonal planes, a new sample holder for cuboids of single crystals was developed. The 3D-printed cuboid holder consists of a ring with a set of horizontal and 54.7° inclined holes with a diameter of 1.5 mm, into which needles can be inserted. A sample can be attached to the needle and rotated around the axis of the needle. In the horizontal set-up, a sample can be measured around the central axis. In the inclined set-up, a cuboid attached to the (111) corner, a threefold rotation can be performed to take measurements in three orthogonal sections (Fig. A1 in the Appendix). Additionally, the sample holder can be used for lower-symmetry crystals which are prepared as a cuboid with two additional orthogonal polished planes or even dodecahedra or icosahedra to capture spectra in more than three directions. The most practical way of attaching the sample is to first insert the needle into the sample holder and then dip the needle into a drop of superglue that has started to harden slightly and gently touch the corner of the oriented cuboid that is sitting on a flat surface, ensuring that the cuboid is not disturbed further. In this way, it is possible to use only a small amount of glue to avoid contaminating the surface of the cuboid. When the glue is fully cured, the needle can be pulled up, and the block is free to move. An example of measurements on a quartz cube is given in Appendix A.
3.2 Samples and preparation
Seven different types of natural pyroxene samples were selected as being representative of commonly investigated sample types (e.g. single crystals, thick sections, homogeneous, zoned) out of n>100 investigated samples. These selected samples were used to demonstrate workflows for investigating absorption behaviour and the relationship of Si–O overtones and OH-related defects with respect to different crystal chemistries, orientations, and polarised angles in transmission FTIR measurements. Further data from additional samples are used in an application example to demonstrate the variability of the presented approach and are presented in Table B1. Selected representative optical images are compiled in Fig. 4 (additional images in the Supplement). The average major element composition measured with electron probe micro analyser (EPMA) is presented in Table B1. EPMA methods are documented in the Supplement. Mineral formula recalculation was performed with MinPlotX (Walters and Gies, 2025), and results are displayed in Figs. B1 and B2. For the clinopyroxene samples, prior to sample selection, a large number of samples available in our collection, as well as spectra of previously investigated samples, were screened. Out of these pre-screened samples, more than 50 different samples were investigated in detail, and, based on grain size, H2O content, number of inclusions, and contamination by inclusion or alteration of minerals, the following selection of samples was made (Table B1 and the Supplement), representing an increasing degree of complexity: (1) an oriented, metamorphic gem-quality orthopyroxene from Tanzania; (2) an oriented. gem-quality diopside from Binntal, Switzerland; (3) an idiomorphic, magmatic augite single crystal from Mount Guntur, western Java, Indonesia; (4) well-equilibrated omphacite fragments from two lightly crushed cratonic eclogite xenoliths from Koidu, West African craton; and (5) a double-sided, polished, thick section of omphacite from an orogenic eclogite from the western Gneiss region, Norway. Additionally, the data set has been supplemented with omphacitic and diopsidic clinopyroxene samples, which were prepared as double-sided, polished, thick sections, to apply the developed method and to show the results for a larger set of samples. Samples for which major element composition was determined are included in Table B1.
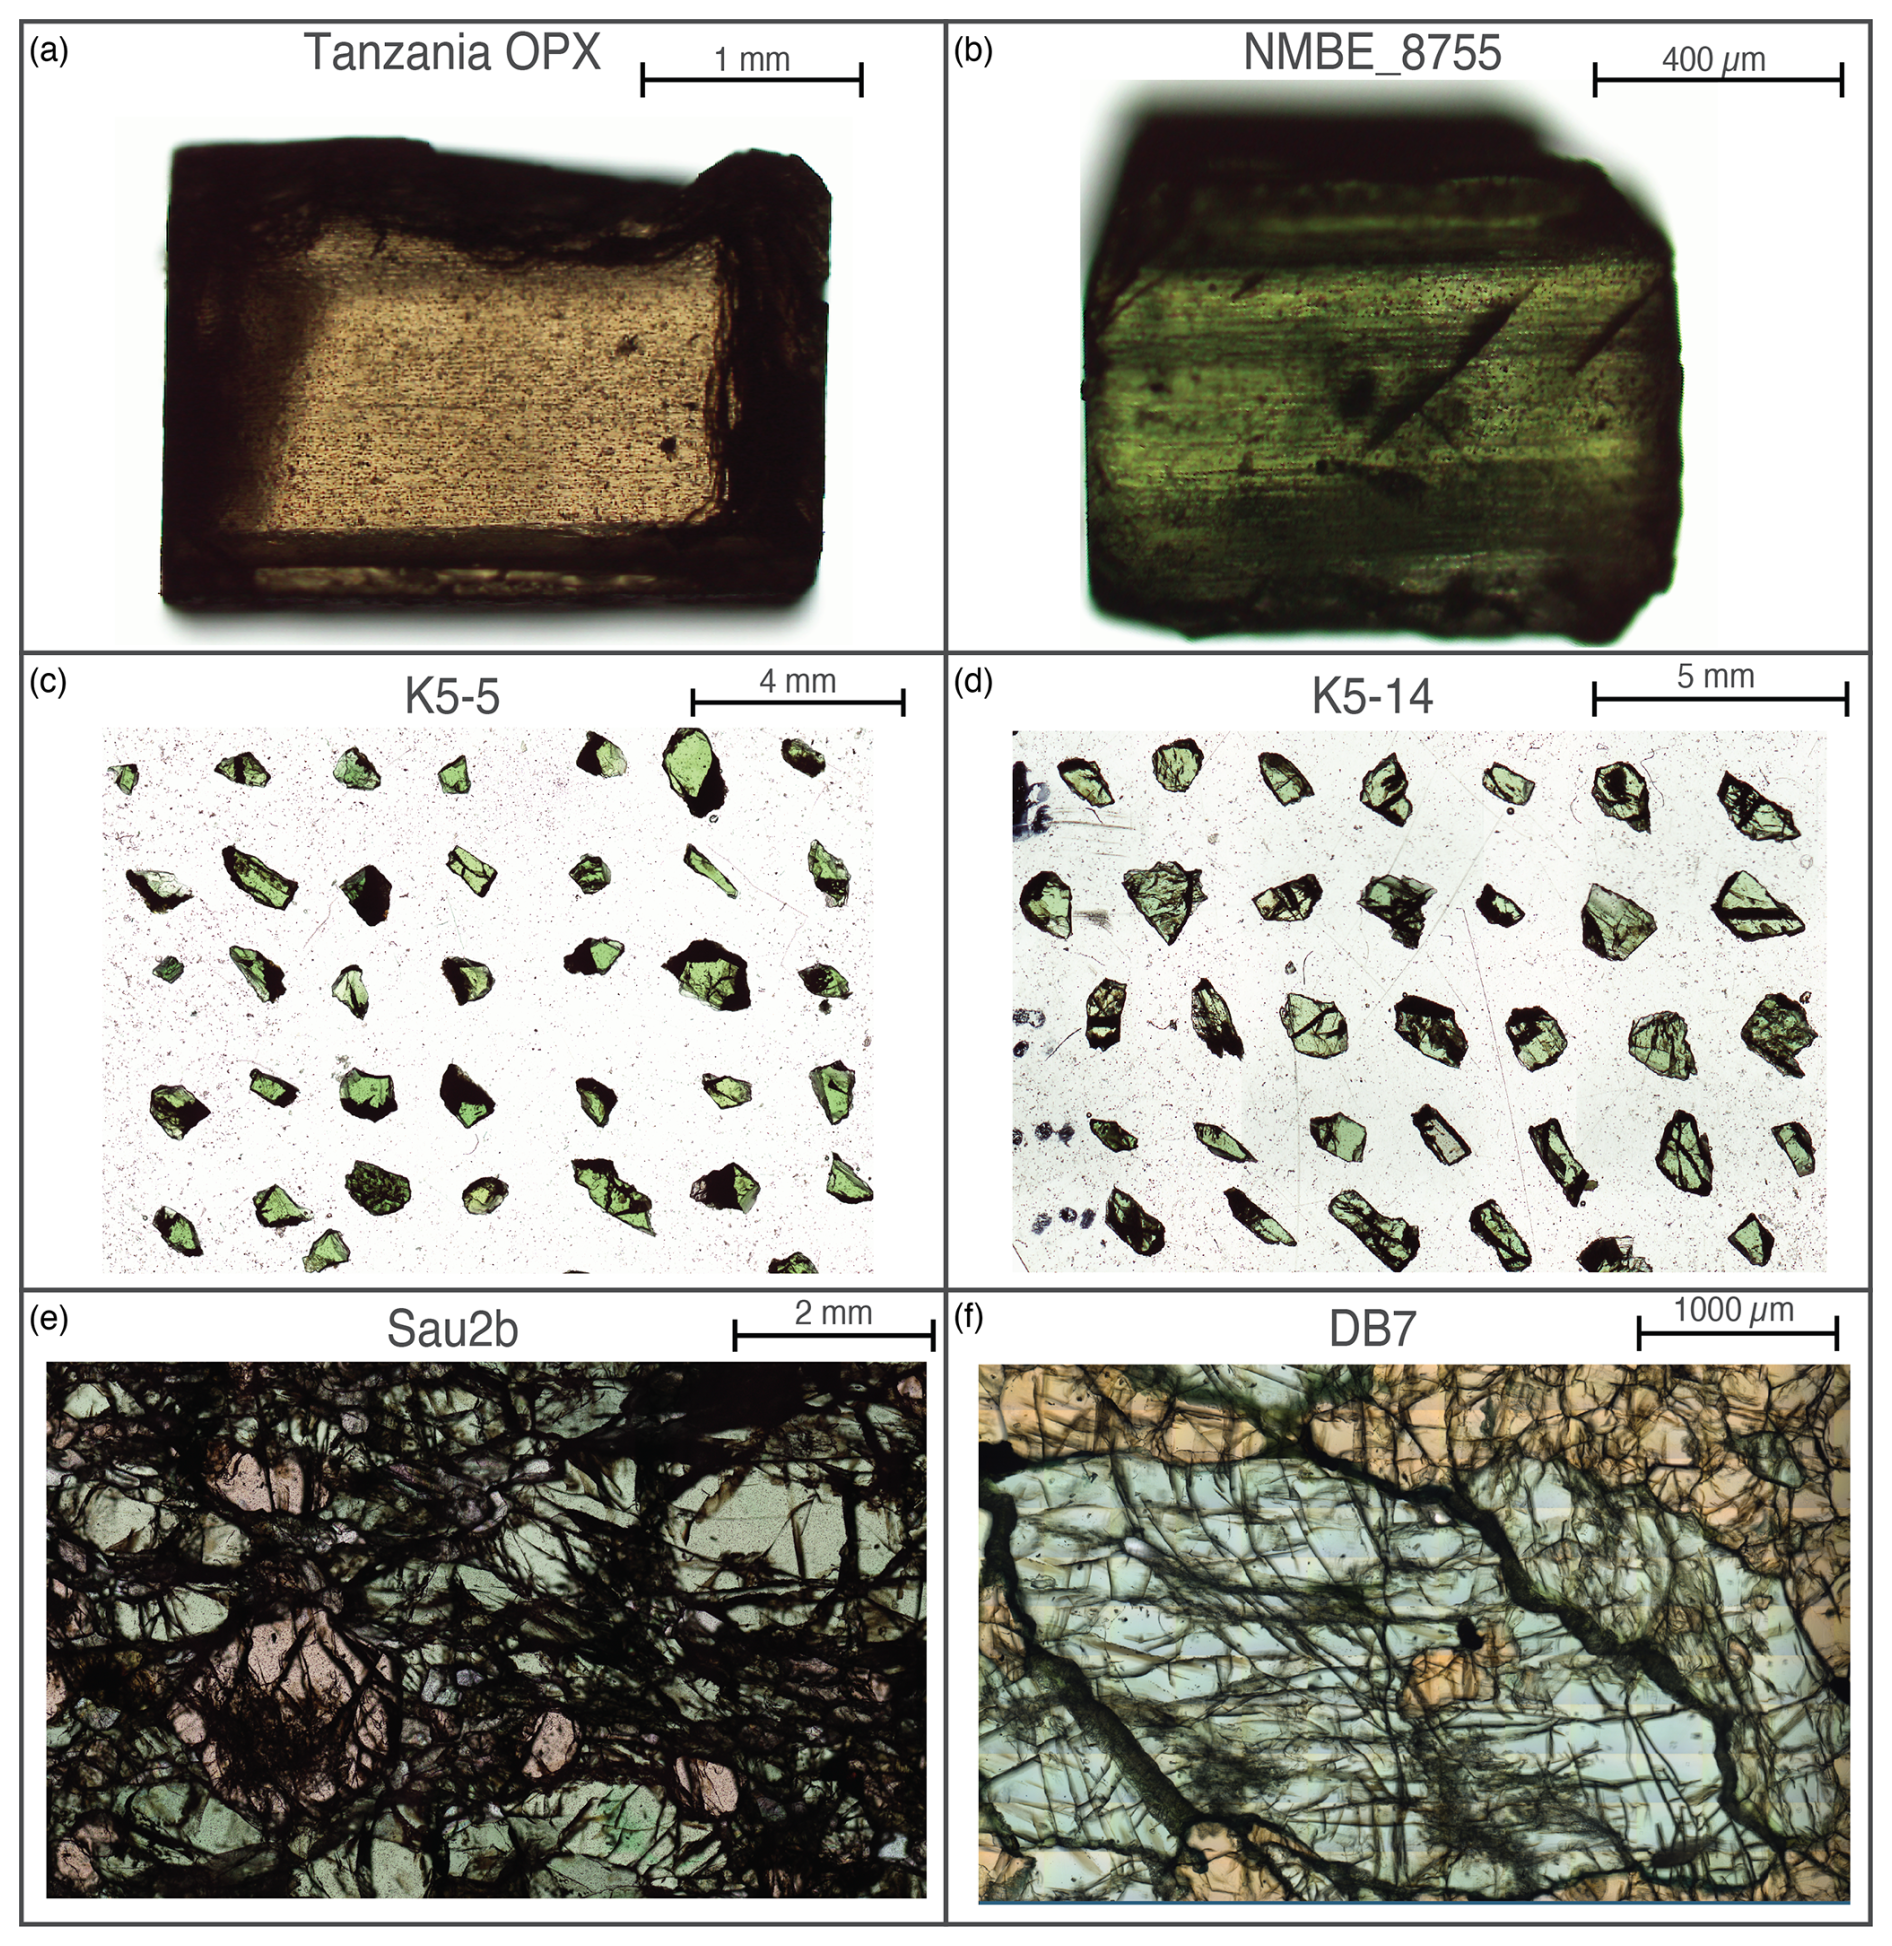
Figure 4Optical microphotographs of representative samples: (a) Tanzania orthopyroxene single-crystal cuboid, (b) NMBE_8755 diopside single-crystal cuboid, (c) K5-5 omphacite double-sided polished grain separate, (d) K5-14 omphacite double-sided polished grain separate, (e) Sau2b eclogite thick section, and (f) DB7 eclogite thick section.
3.3 FTIR spectroscopy
Transmission FTIR analyses were conducted at the Institute of Geological Sciences at the University of Bern using a Bruker Tensor II spectrometer with a globar infrared source and a KBr beam splitter, coupled to a Bruker Hyperion 3000 microscope with a dry-air-purged sample chamber, XY-stage, 15× objective, and a variable aperture. The instrument is equipped with a liquid-nitrogen-cooled mercury cadmium telluride detector and a KRS-5 (thallium bromide iodide) infrared polariser.
For each sample, polarised measurements were acquired in a wavenumber range from 6000 to 600 cm−1, with a resolution of 4 cm−1 and a variable number of scans and aperture sizes depending on the sample. The clinopyroxene in the eclogite sample CdG_19_40 (Table 2) showing representative absorbance bands in the region between 3000 and 3800 cm−1 was chosen to compare between spectra acquired with 4, 8, 16, 32, and 64 scans (Fig. C1). A total of 8 or 16 scans were chosen as the ideal time in relation to signal noise, depending on the sample thickness and spectra quality.
Multiple analytical positions were programmed and then sequentially measured with incrementally changing orientation of the polariser between 0 and 180°, followed by a background measurement using the automatic polariser described above. Hereafter, such a set of equal polariser orientations will be referred to as a “PolGroup”. The automatic polariser was incremented in equal steps between 2 and 5°, depending on the sample, until 180° was reached, resulting in a total number of 36 to 90 spectra per measurement point.
The thickness of each measurement point was measured depending on the sample size and shape using the calibrated z position of the microscopy stage, with an uncertainty of ±3 µm for small samples, and a Mitutoyo micrometre, with an accuracy of ± 2–5 µm for larger samples.
For the data processing of the FTIR, spectra were cut to the range of 4000–1250 cm−1, and the atmospheric correction and concave rubber band baseline correction with 64 points and four iterations were performed in OPUS® version 8.5. Note that, for samples with spectra showing broad peaks, for example, glasses, carbonates, and feldspar, this method is too conservative and will lead to an underestimation of the resulting integrated absorbance. Spectra were then exported and processed further with the software SpecXY (Gies et al., 2024). All spectra used in this paper are normalised to 1 cm thickness. The corresponding polarised background spectrum was subtracted from the sample spectrum, and the absorbance of characteristic bands and the integrated absorbance for the O–H region were extracted for all spectra at each measurement position in the SpecDB module of SpecXY following the workflow of Gies et al. (2024). Scatterplot matrices were generated with MinPlotX (Walters and Gies, 2025).
The polarisation effect on the baseline was tested by comparing measurements without and with background measurements in between the rotation of the measurements, and only minor differences in the Si–O overtone region between the two methods could be identified. However, these could be removed by the concave rubber band baseline correction performed in OPUS. To be able to completely rule out any effect of the corrections on the polarisation effect, it is advised to acquire the background for each corresponding polarisation angle and to correct all spectra of the corresponding PolGroup accordingly.
The following section will present the acquired results for all samples progressively, with an increasing level of complexity: each sample will be used to illustrate a distinct, common analytical problem and its corresponding solution. This information will be used to (i) establish a maximum and minimum absorption depending on orientation and composition in orthorhombic and monoclinic pyroxene, (ii) provide a link between characteristic overtones and OH absorption bands, (iii) individuate different defect types based on polarisation behaviour, and (iv) provide a fast method to determine whether H2O distribution in a complex sample is homogeneous. The absorbance values for all studied samples are compiled in the Table S1 in the Supplement.
4.1 Gem-quality Tanzania orthopyroxene
From the Tanzania orthopyroxene cuboid described in Turner et al. (2015), several smaller cuboids with variable thicknesses oriented parallel to (100), (010), and (001) were prepared (Fig. 4a), and angle-resolved polarised spectra were acquired. This sample is used to investigate the polarisation behaviour of a well-described orthopyroxene, oriented parallel to the crystallographic axes, with sharp and non-overlapping O-H absorption bands, representing the simplest possible case of pyroxene polarisation behaviour. The orthorhombic crystal symmetry allows for the orientation of the crystal using either cleavage or optical extinction. This sample can be used to identify the orthopyroxene endmember patterns in polarised spectra acquired parallel to the crystallographic axes.
Orthopyroxene spectra show a strong polarisation behaviour of the O–H region and Si–O region, with clear endmember spectra acquired with the polariser set parallel to the crystallographic axes (Fig. 5). In the Si–O overtone region, [a](a–c) has a clear maximum between 2100–1800 cm−1 and a minimum between 1750–1300 cm−1, whereas [b](b–c) shows the highest absorbance in the higher-wavenumber Si–O overtone bands > 2100 cm−1 (for the definition of the endmembers [a](a–c), [b](b–c), and [c](a–c), see Fig. 1 and Table 1). [c](a–c) is defined by the lowest absorbance in the higher-wavenumber Si–O overtones between 2300–1800 cm−1 and the highest absorbance in the lower-wavenumber Si–O overtones between 1800–1400 cm−1. The polarisation behaviour shows an excellent agreement between measurements and the theoretical approximation estimated using Eq. (8) (Fig. 6). Bands in the Si–O overtone region that are influenced by multiple absorbance bands with different polarisation behaviour or thick samples that exceed the thickness for which the Beer–Lambert law can be applied deviate from the theoretical approximation (Fig. 2).
The O–H-related bands at 3513 and 3410 cm−1 and the Si–O overtones with lower wavenumbers between 1800–1400 cm−1 show the same polarisation behaviour, with the strongest absorption parallel to [c](a–c) (Fig. 7). In contrast, the absorption of the OH-related defects parallel to [a](a–c) and [b](b–c) is weaker and similar.
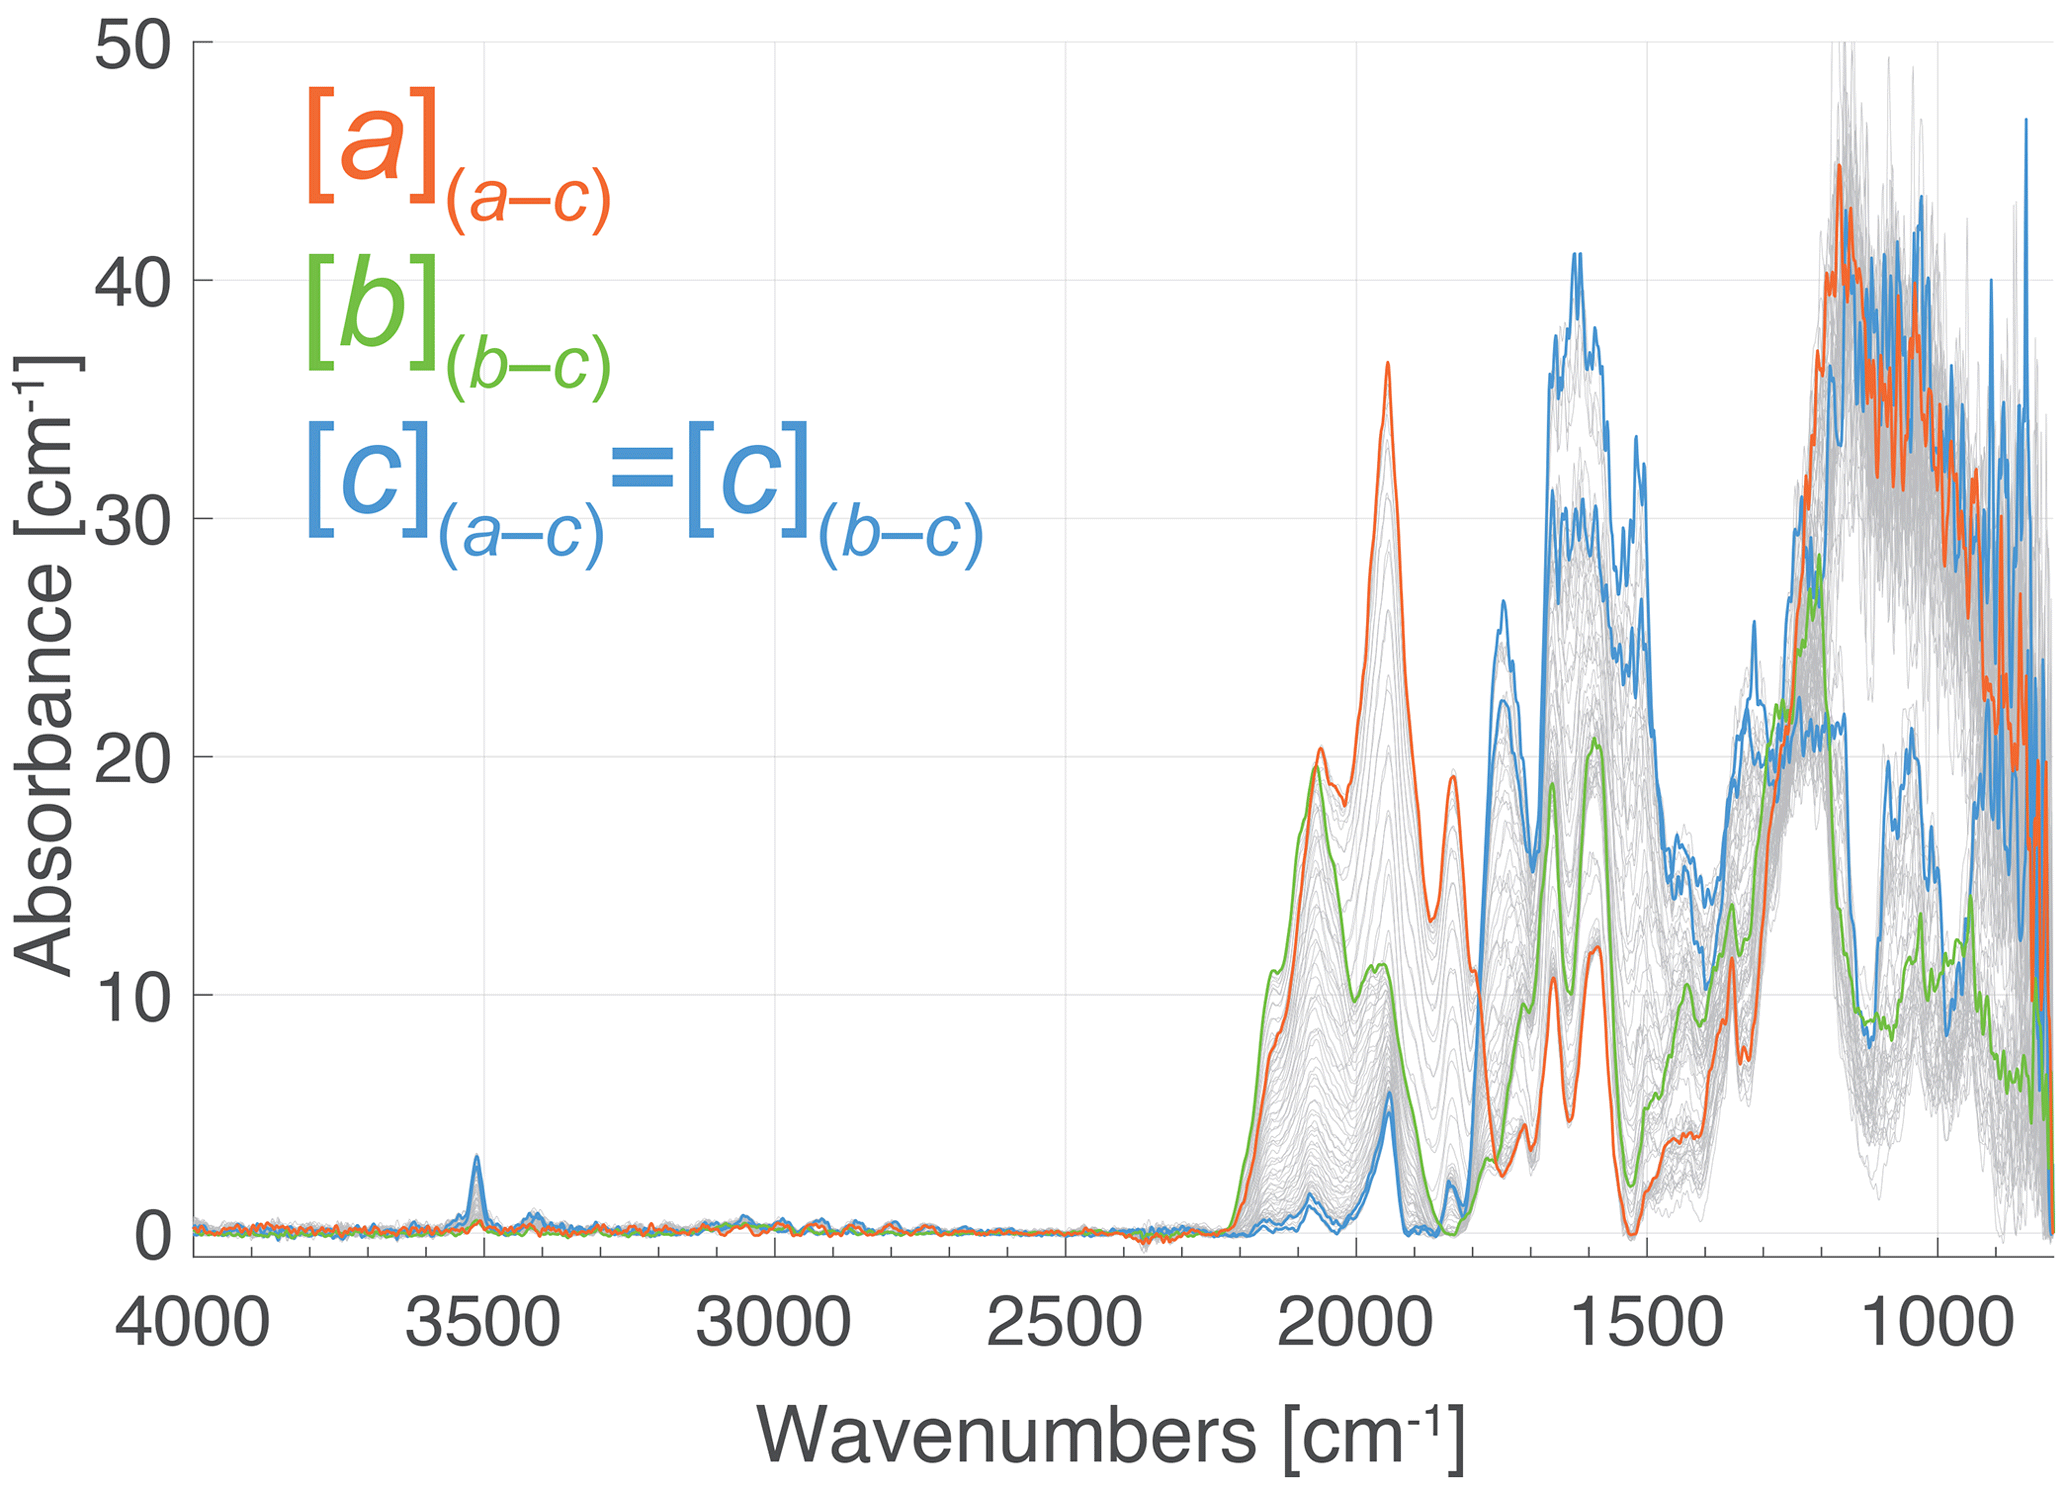
Figure 5Polarised spectra of an orthopyroxene cuboid parallel to (100) and (010) acquired with an incremental polarisation change of 4.5°. The three orthogonally measured endmember spectra [a](a–c), [b](b–c), and [c](a–c), with the electric vector parallel to the crystallographic axes a, b, and c, are displayed in colour; the maximum and minimum polarisation of the different bands are also oriented parallel to a, b, and c.
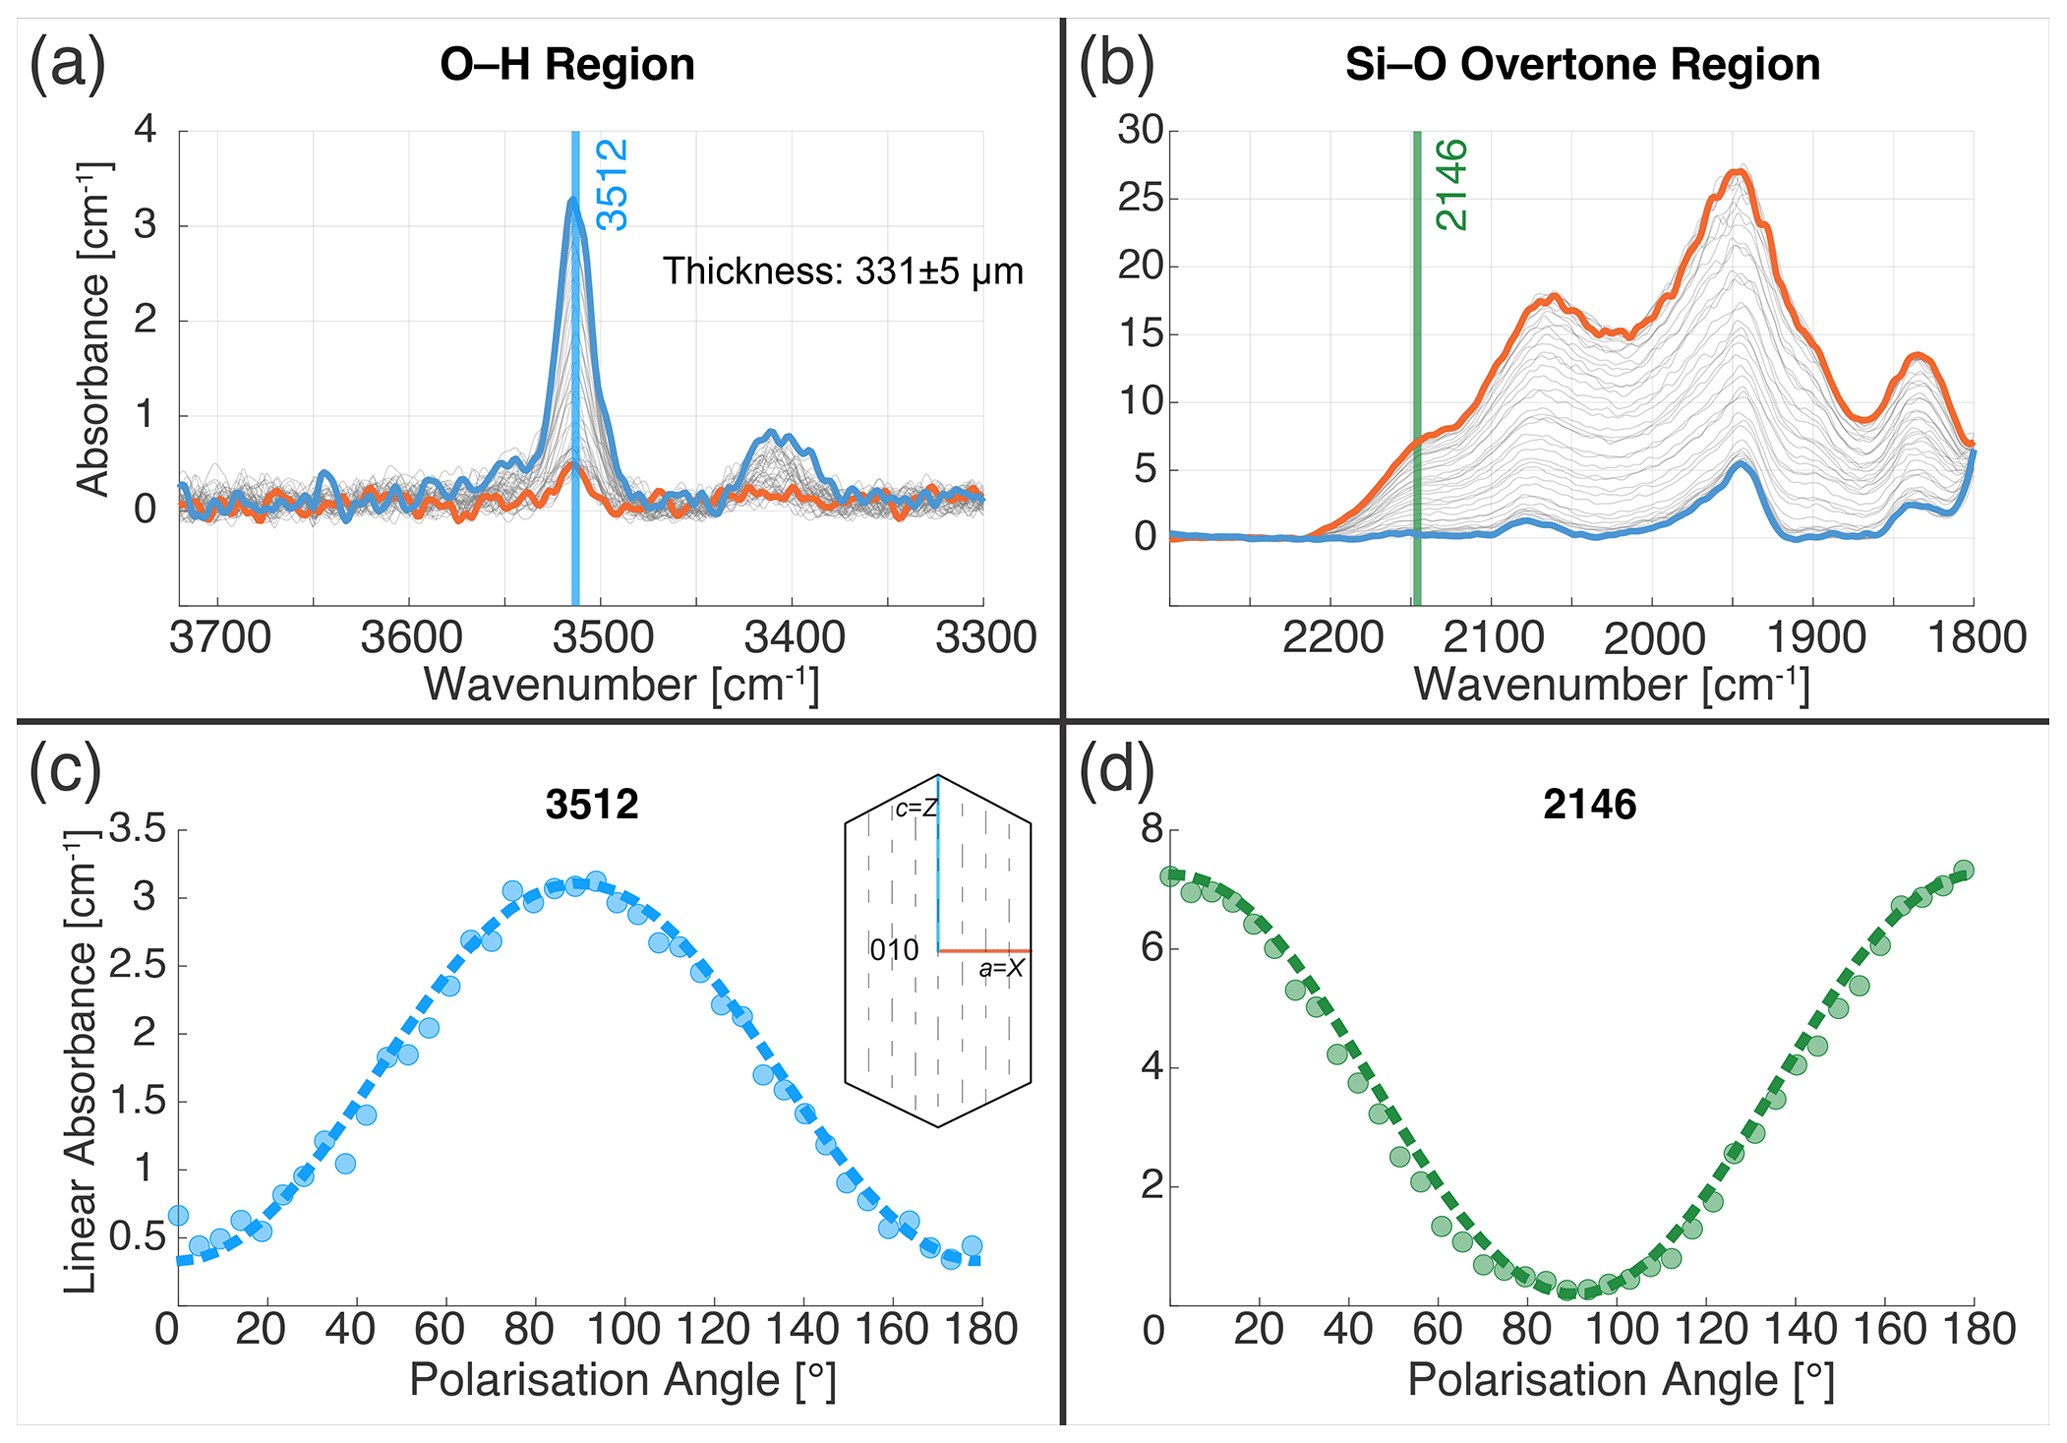
Figure 6Comparison of theoretical approximation (dashed line) and measured (dots) polarisation behaviour of representative bands of orthopyroxene at wavenumbers 3512 (left panel) and 2146 (right panel) for OH defects and Si–O overtone bands, respectively.
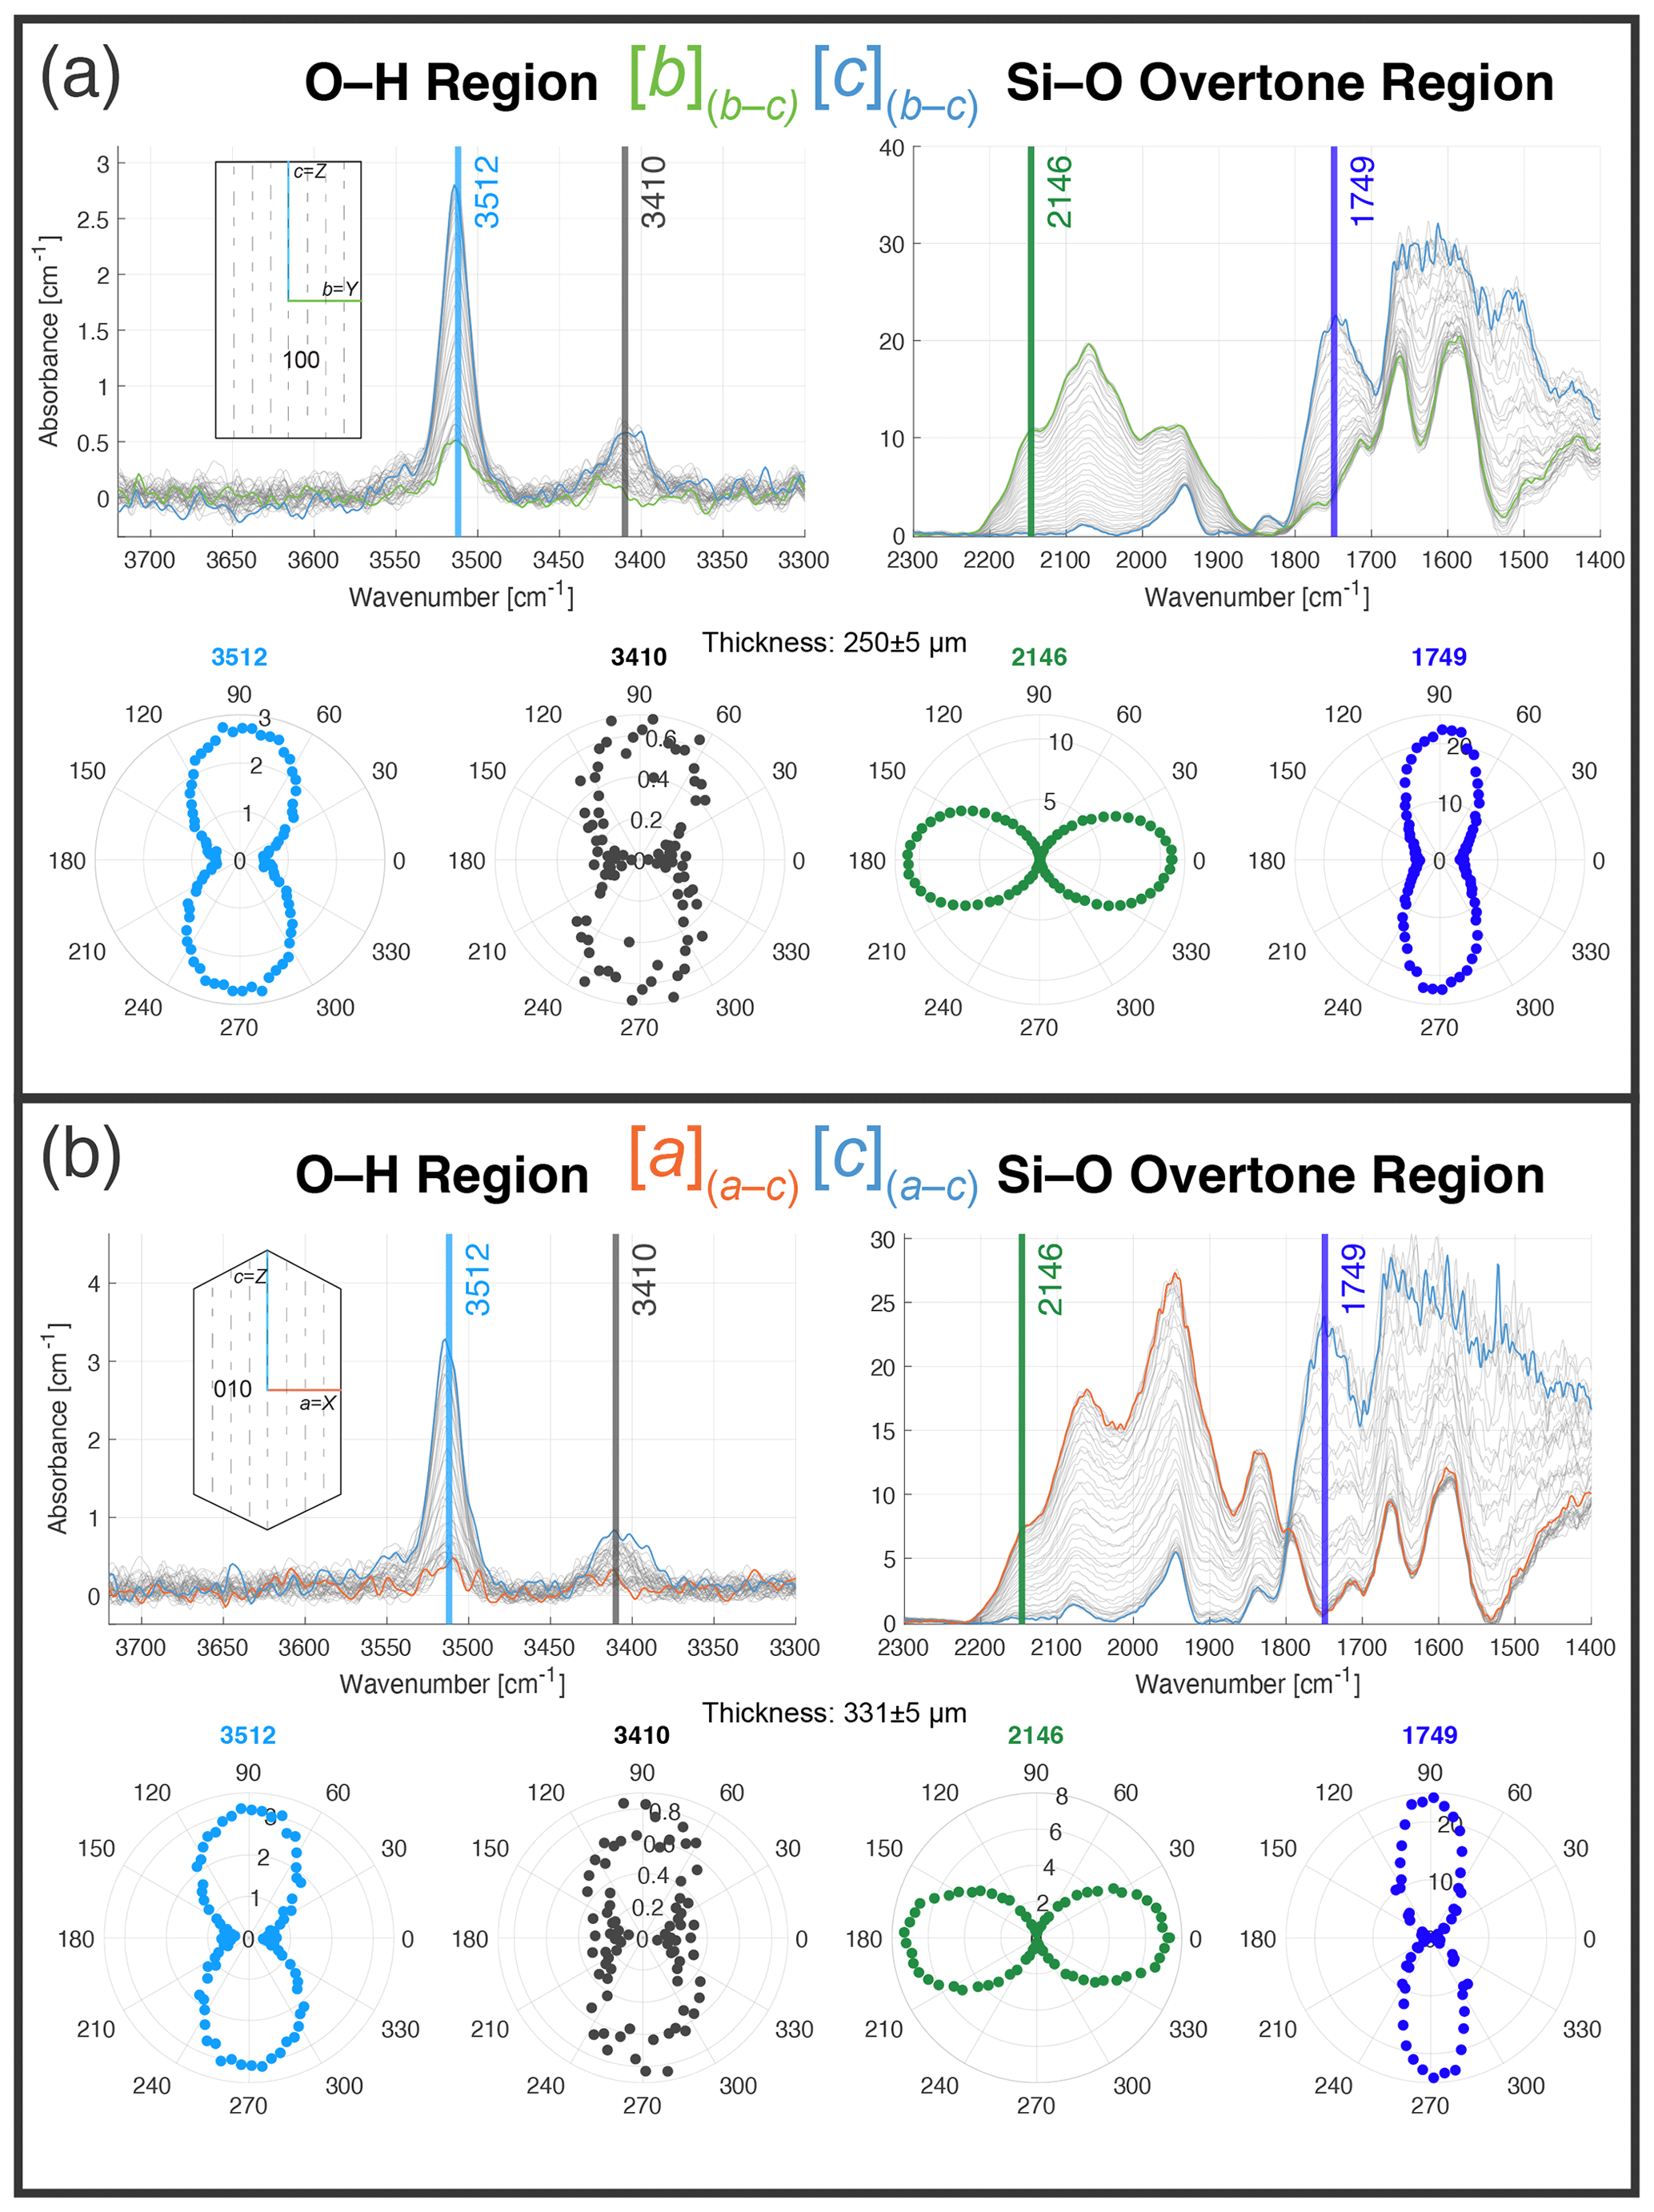
Figure 7Polarisation change visualised using selected bands with an incremental polarisation change of 4.5° of orthopyroxene wafers, parallel to (100) and (010). Coloured lines indicate spectra acquired with the polariser parallel to the orientation shown in the sketch of the crystal; spectra with intermediate polarisation angles are shown in grey. OH-related defects at wavenumbers 3512 and 3410 cm−1 (left panels) show correlations with polarisation behaviour of the Si–O overtone bands (right panels). Lower polar plots show the change in absorption of the selected bands with changing polarisation angle, extracted from the angle-resolved polarised measurements. The orientation behaviour of the polarisation of different groups of bands can be easily identified (e.g. 2146 cm−1 vs. 1749 cm−1, 3410 and 3512 cm−1).
This example illustrates the polarisation behaviour of the spectral endmembers in the orthorhombic system. Furthermore, it demonstrates how the endmember of the Si–O overtone region can be used to find the principal axes of absorbance in orthopyroxene, to investigate the orientation of an orthopyroxene crystal or preferred orientations in a sample, and to obtain three orthogonal sections for H2O determinations.
4.2 Gem-quality diopside from Binntal, Switzerland
A gem-quality diopside crystal of sample NMBE_8755 was selected from the collection of the Natural History Museum in Bern. Oriented angular polarised-transmission FTIR measurements consisting of 38 spectra were measured at 11 different positions from the top to the bottom of the crystal in two orthogonal directions ((100) and (010)) to investigate the spatial variation of O–H absorbance across the crystal. Except for the crystal base, which showed minor traces of amphibole, the concentration was found to be homogeneous. A section of the crystal was then cut out with a wire saw, resulting in an ± 10 µm cuboid with all faces orthogonal to the (010) plane. This sample was chosen to investigate the increased complexity of the monoclinic system but with the simple case of a homogeneous H2O concentration and known crystal orientation.
Spectra of the oriented diopside cuboid acquired parallel to (100), (010), and the (a*–b) plane show similar Si–O overtone endmembers for [a](a–c), [b](b–c), and [c](a–c) as the previously described orthopyroxene. However, with more complex monoclinic symmetry, two more endmembers ([X](a–c) and [Z](a–c)) can be identified in the (010) plane (Fig. 8). The orthogonal endmembers [Y](b–c), [X](a–c), and [Z](a–c) correspond to the axes of the optical indicatrix X, Y, and Z with similar extinction angles. The spectral endmember patterns of [Y](b–c) and are very similar in terms of Si–O overtones and contribution to the total integrated O–H absorption. They are thus treated as one for the H2O quantification but need to be considered separately when investigating OH incorporation mechanisms and defect assignment. The presented example also demonstrates the effect of sample thickness, where, for thick samples (>400 µm), the relation of Si–O overtone absorption no longer behaves purely linearly, and polarised spectra with high absorption in the Si–O overtone region can no longer be used quantitatively (see Fig. 7, [a*], , and [Z](a–c)). In the O–H region, there is still a good agreement between the unpolarised measured spectrum and the theoretical unpolarised spectrum approximated by the mean of the maximum polarised spectra acquired at the polarisation angles x and x+90° (see Fig. C3). However, it is not always possible to prepare an oriented micro-cuboid, especially for minerals with a well-developed cleavage, such as clinopyroxenes. Ideally, the sample should be 80–350 µm thick to investigate the Si–O overtones and to study absorption in the O–H region. The chosen sample thickness is always a trade-off between absorption in the O–H and Si–O region and the feasibility of the sample preparation. It should, therefore, be verified whether the Beer–Lambert law still applies to a particular sample in the wavenumber region of interest by comparing the measured unpolarised spectrum with the mean of the maximum polarised spectra. Nevertheless, in a section parallel to (100) or the (a*–b) plane, it is possible to distinguish between [Y](b–c) and if the +90° spectrum is either [a*] or [c](b–c).
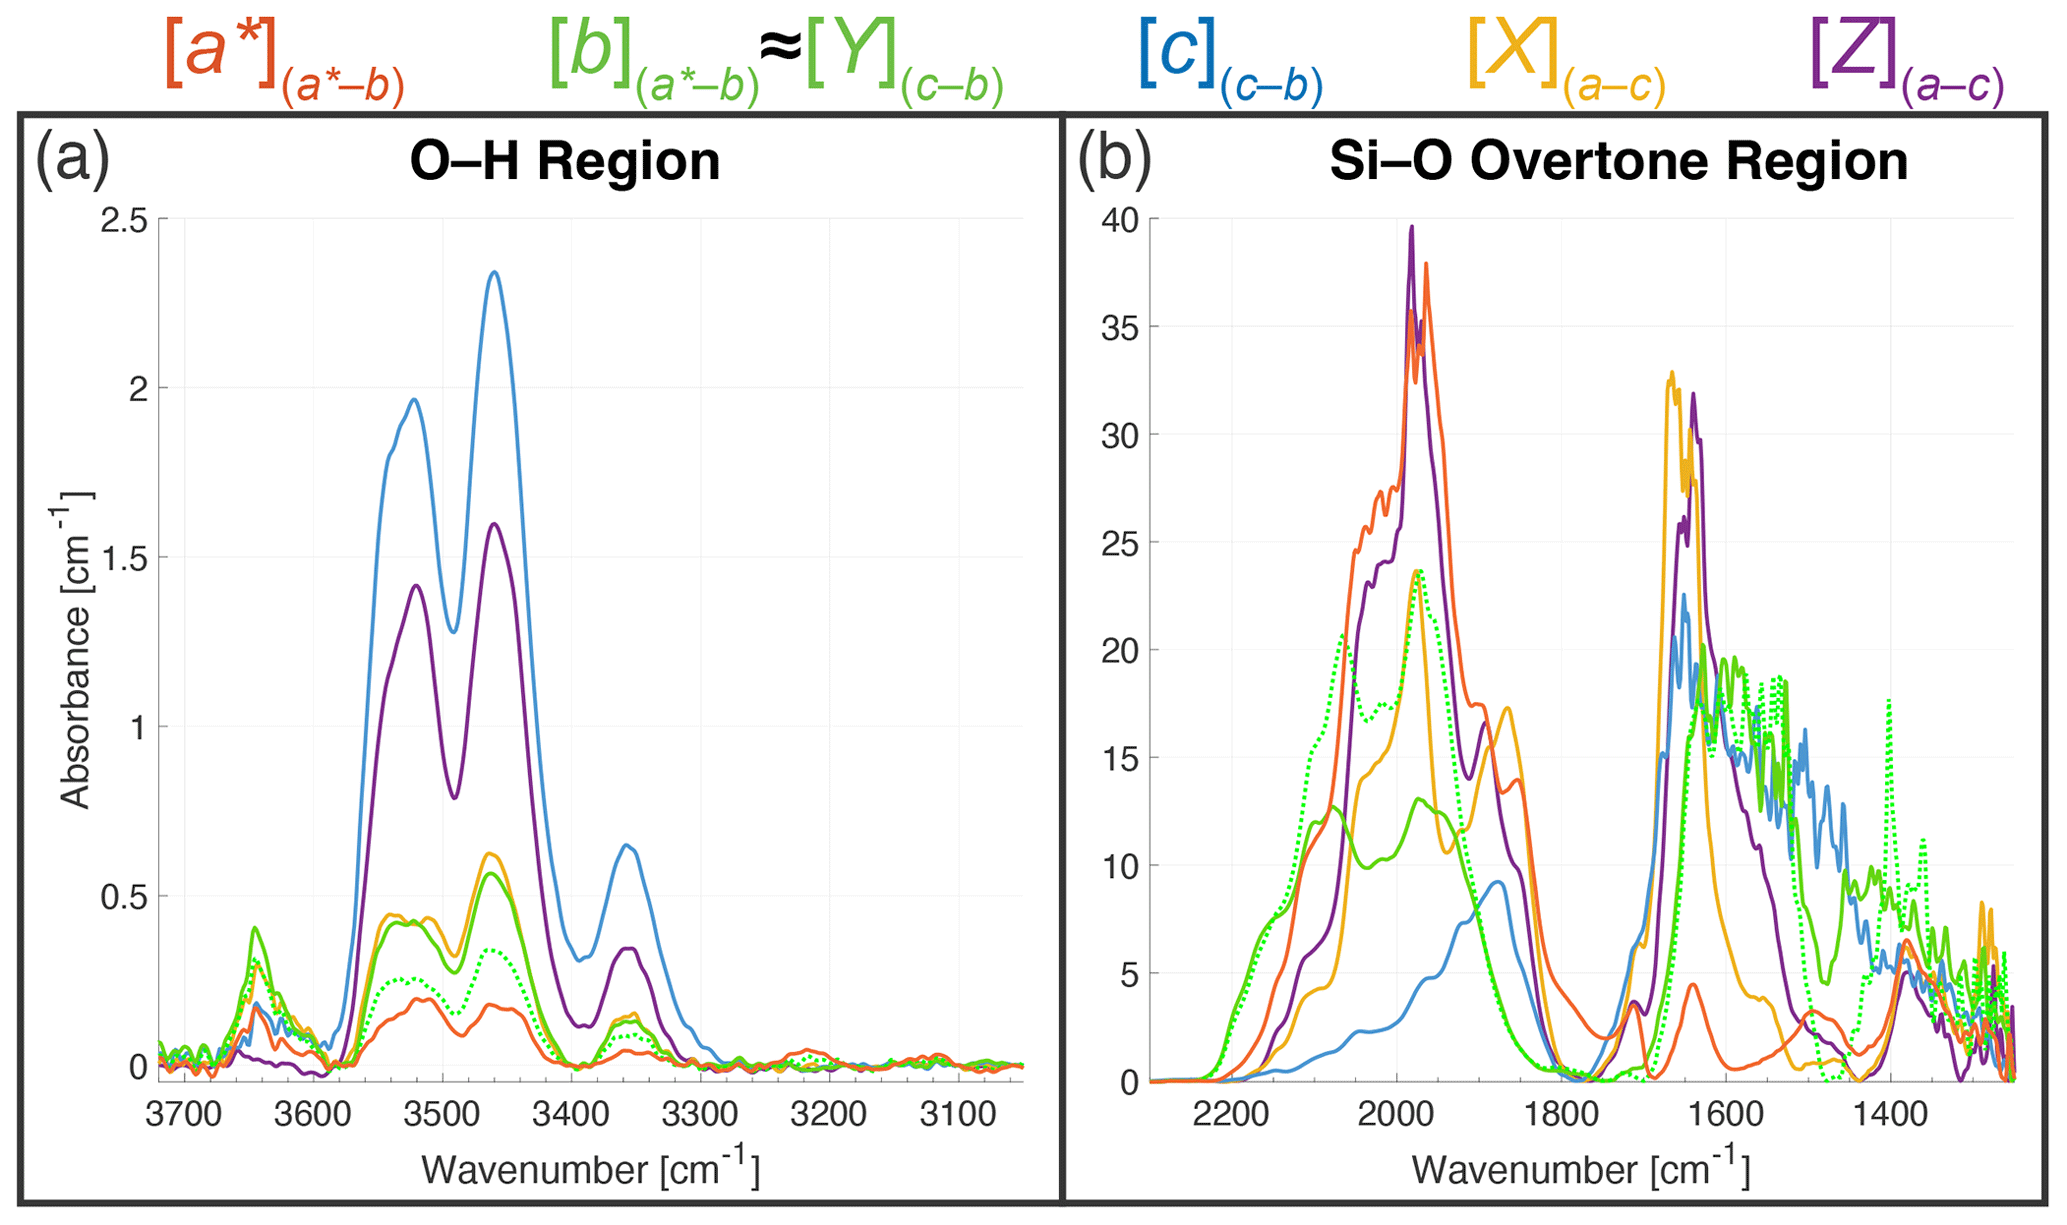
Figure 8Polarised endmember spectra [a*], , [Y](b–c), [c](b–c), [X](a–c), and [Z](a–c) of the Binntal diopside acquired from a single cuboid in three sections orthogonal to (100). Endmembers [a*], , and [c](b–c) correspond to three polarised spectra acquired perpendicular to the orthogonal vectors, b, c, and the a* vectors. The three orthogonal endmembers [Y](b–c), [X](a–c), and [Z](a–c) correspond to the axes of the optical indicatrix X, Y, and Z. OH-related defects show at least six different overlapping peaks (left panel), and Si–O overtone bands show typical shapes with sharp peaks for endmember spectra for diopside (right panels). High absorption domains in the Si–O range are close to the maximum absorbance because of the sample's thickness and therefore cannot be used quantitatively.
Hydrogen incorporation mechanisms of diopsides are complex, and at least seven different overlapping absorption bands are identifiable in the diopside from Binntal, Switzerland. From the polarisation behaviour it is possible to distinguish two groups of defect types by comparing the polarisation behaviour of OH absorption bands with that of Si–O overtones (Fig. 9). These two families of bands correspond to different incorporation mechanisms in clinopyroxenes, i.e. incorporation on the tetrahedral T site (3660–3600 cm−1) and octahedral M site (3590–3300 cm−1), as reported in Balan et al. (2020). Most importantly, the absorption maxima and minima of OH-related defects correspond to spectral endmembers in the Si–O overtone region. This makes the combination of Si–O overtones and OH-related defects a valuable tool in finding sets of spectra acquired perpendicular to three orthogonal vectors to estimate the total integrated absorbance and further investigate OH incorporation mechanisms. For example, in the (100) and (a*–b) sections, it is evident that the band 3645 cm−1 maximum corresponds to the maximum of the Si–O overtone band 2105 cm−1, which is indicative of [Y](b–c) (Figs. C3 and C4). The minimum of the Si–O overtone band 1973 cm−1, which is indicative of [c](b–c), correlates with the maximum of the OH-related defects between 3050 and 3580 cm−1 and is only detectable in a (100) section. Additionally, in the (010) section, the maxima and minima of both OH-related defects and Si–O overtone bands correlate with the optical extinction behaviour of diopside and, thus, the axes of the optical indicatrix (X, Y, and Z).
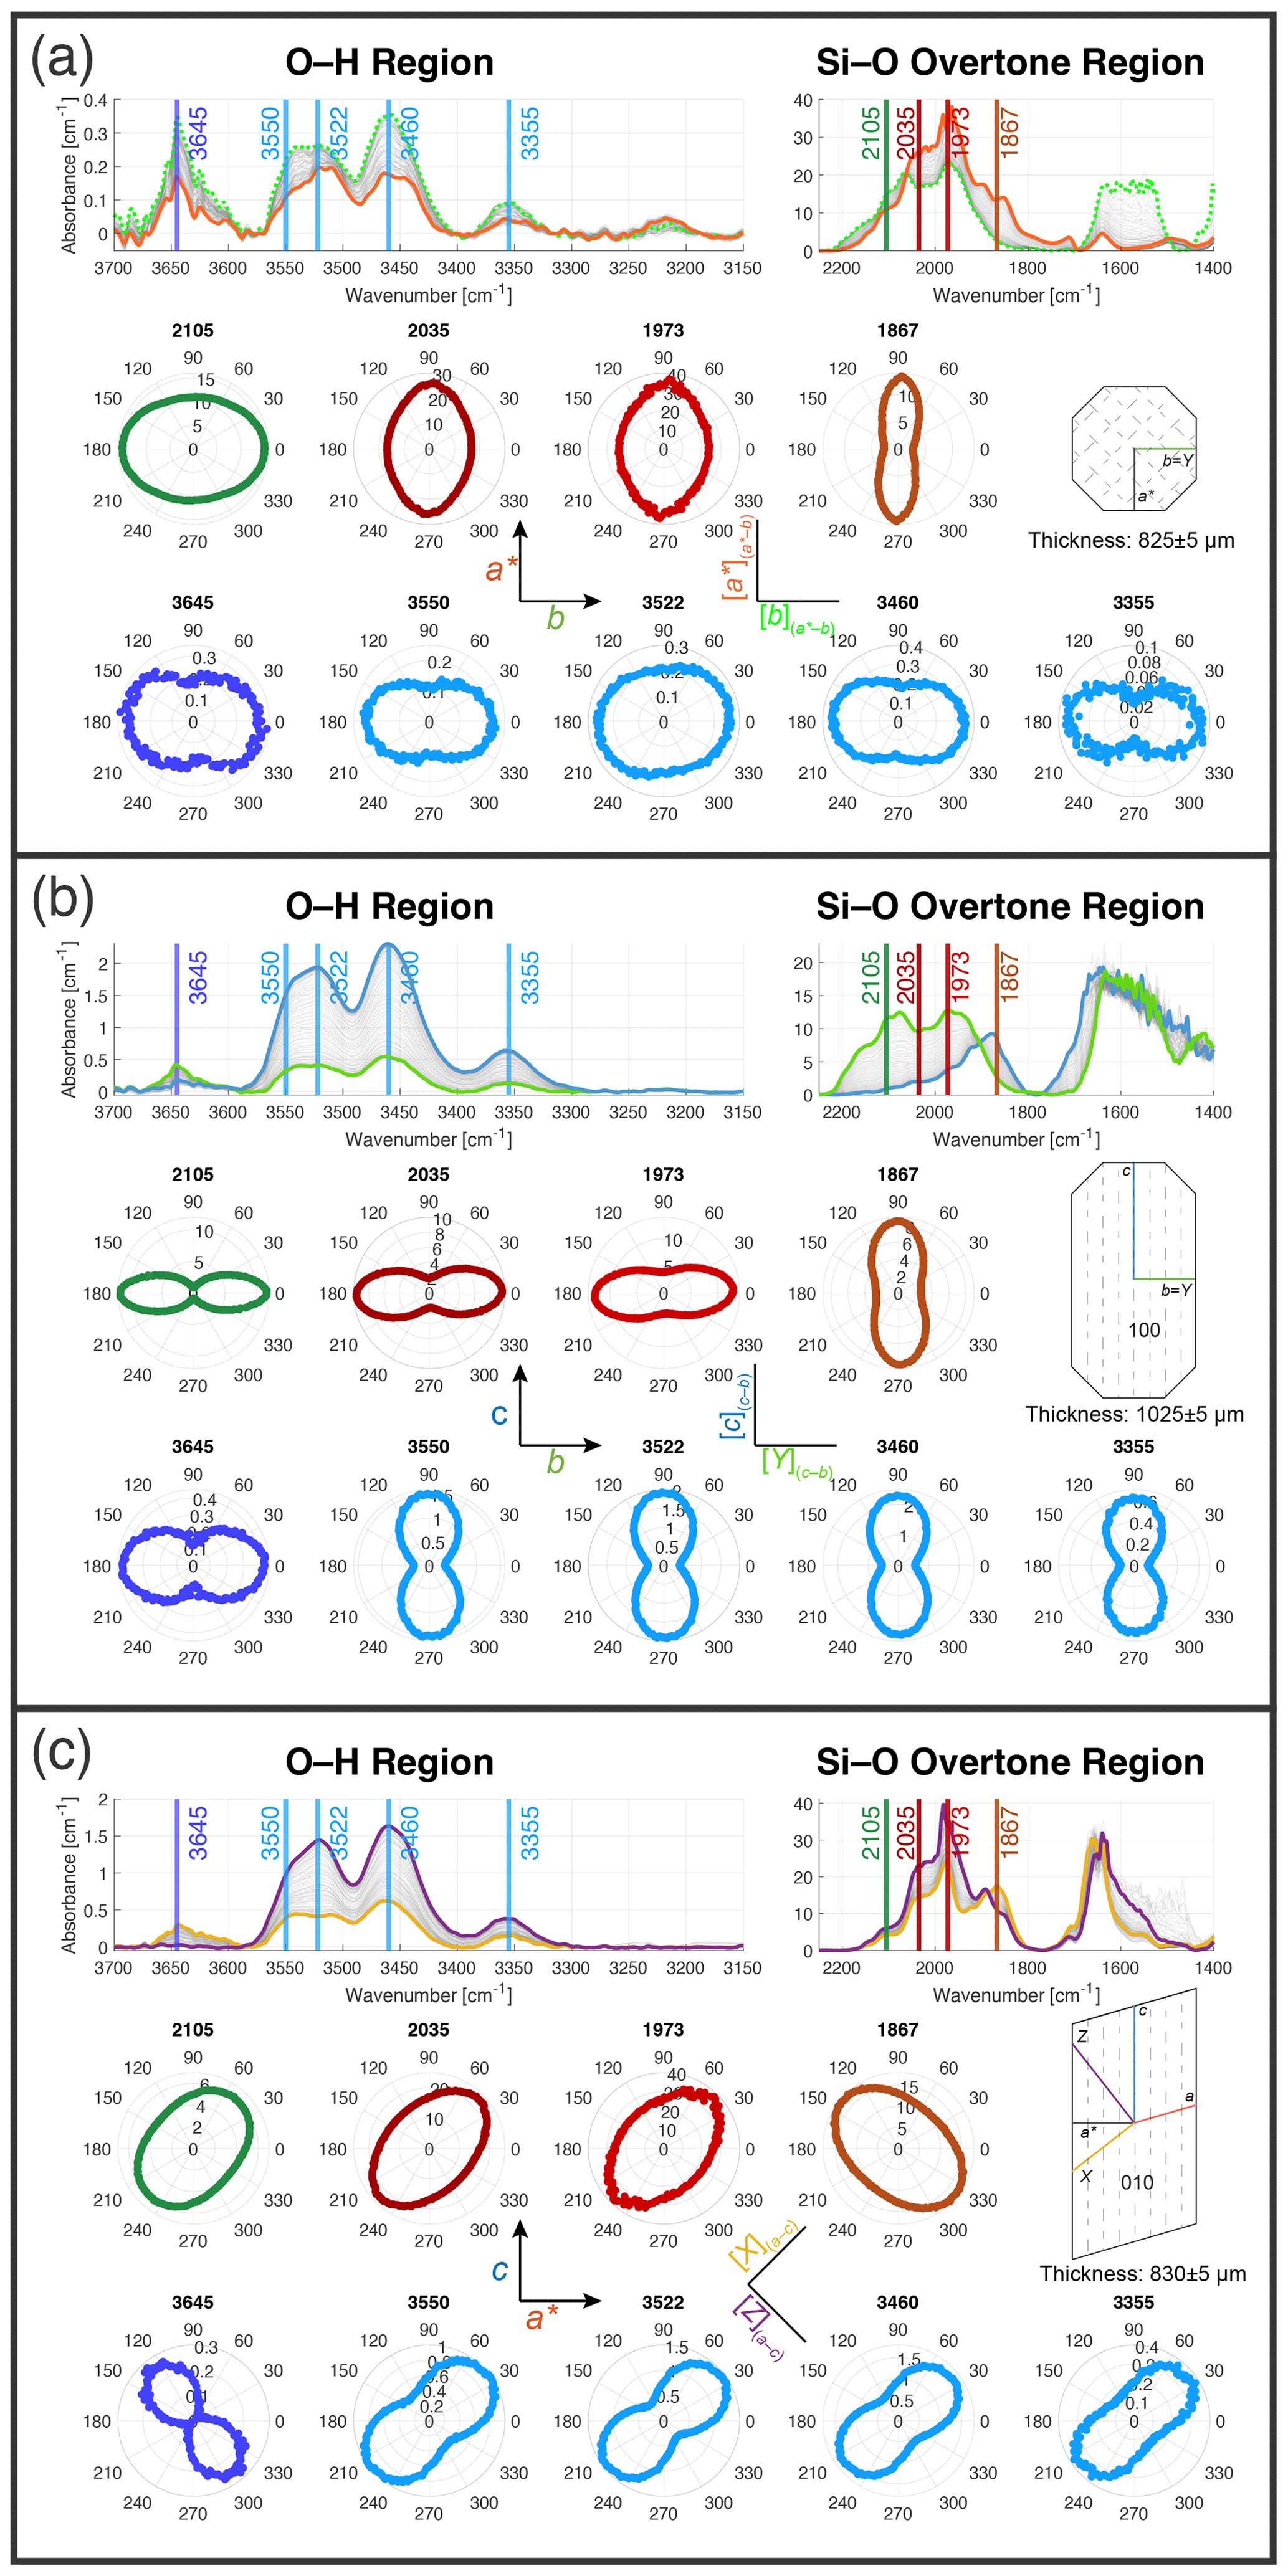
Figure 9Polarised spectra of diopside from Binntal cuboid (a) (a*–b), (b) (100), and (c) (010) acquired with an incremental polarisation change of 4.5°. The endmember spectra ([a*], , [Y](b–c), [c](b–c), [X](a–c), and [Z](a–c)) are displayed in colour, showing the maximum and minimum polarisation of the different bands. Polarisation is visualised in polar plots using selected bands of the Si–O overtone and O–H region. The T-site-related defect at 3645 cm−1 (dark blue) is a polarising 90° offset from the M-site-related defects (light blue) below 3600 cm−1 in the (100) and (010) sections.
OH-related defects do not necessarily correspond to the maximum and minimum absorbance of the different endmembers in the Si–O overtone region. This is because the maximum absorbance of OH-related defects does not necessarily have to be parallel to any of the endmembers, the principal optical directions, or the crystallographic axes and can have a different orientation. Additionally, the relationship between Si–O overtone bands and OH bands can be further investigated; however, for simplicity, only the total integrated absorbance is used here. This allows further investigation of the two sets of spectra acquired perpendicular to three orthogonal vectors, [a*], , and [c](b–c) and [Y](b–c), [X](a–c), and [Z](a–c). For example, the diopside from Binntal shows the total integrated absorbance behaviour in the O–H region of [c](b–c) > [Z](a–c) > [Y](b–c) ≈ [X](a–c) > > [a*]. Finally, this example provides the important observation that the M-site (3590–3300 cm−1) maxima and minima [c](b–c) and [a*] are present in the (100) and (a*–b) sections, whereas the maximum and minimum of the T-site (3660–3600 cm−1) defects are present in the (a*–b) and (010) sections.
4.3 Magmatic augite Java
An idiomorphic single crystal from Mount Guntur (western Java, Indonesia) from the mineral collection of the Institute of Geological Sciences at the University of Bern was prepared as a wafer parallel to (010) and the (a*–b) plane, with a thickness of 135±10 and 175±10 µm, respectively. The augite crystal shows sector zoning and oscillatory growth zoning, as well as a twinning plane parallel to the (a*–b) plane and a second smaller crystal fragment attached on one side (Fig. 10). The preparation of an inclusion-free 100-section crystal was not possible due to the complexity of the oscillatory and sector zonation in combination with the small size of the crystal. Nevertheless, this sample is valuable in investigating the polarisation behaviour in the two prepared sections and demonstrates relative changes in absorption within a single grain. The augite illustrates how complex crystals, grown in a complex and evolving environment, can be studied using orientation and polarisation effects of OH-related defect groups and Si–O overtones to (i) understand the systematics of OH-related defect groups, (ii) study relative concentration changes within a single section, and (iii) evaluate the contribution of specific polarised measurements to the calculation of the total O–H absorption value. The purpose of this example is to highlight the potential for future research, and it should not be interpreted as being applicable to all magmatic clinopyroxenes.
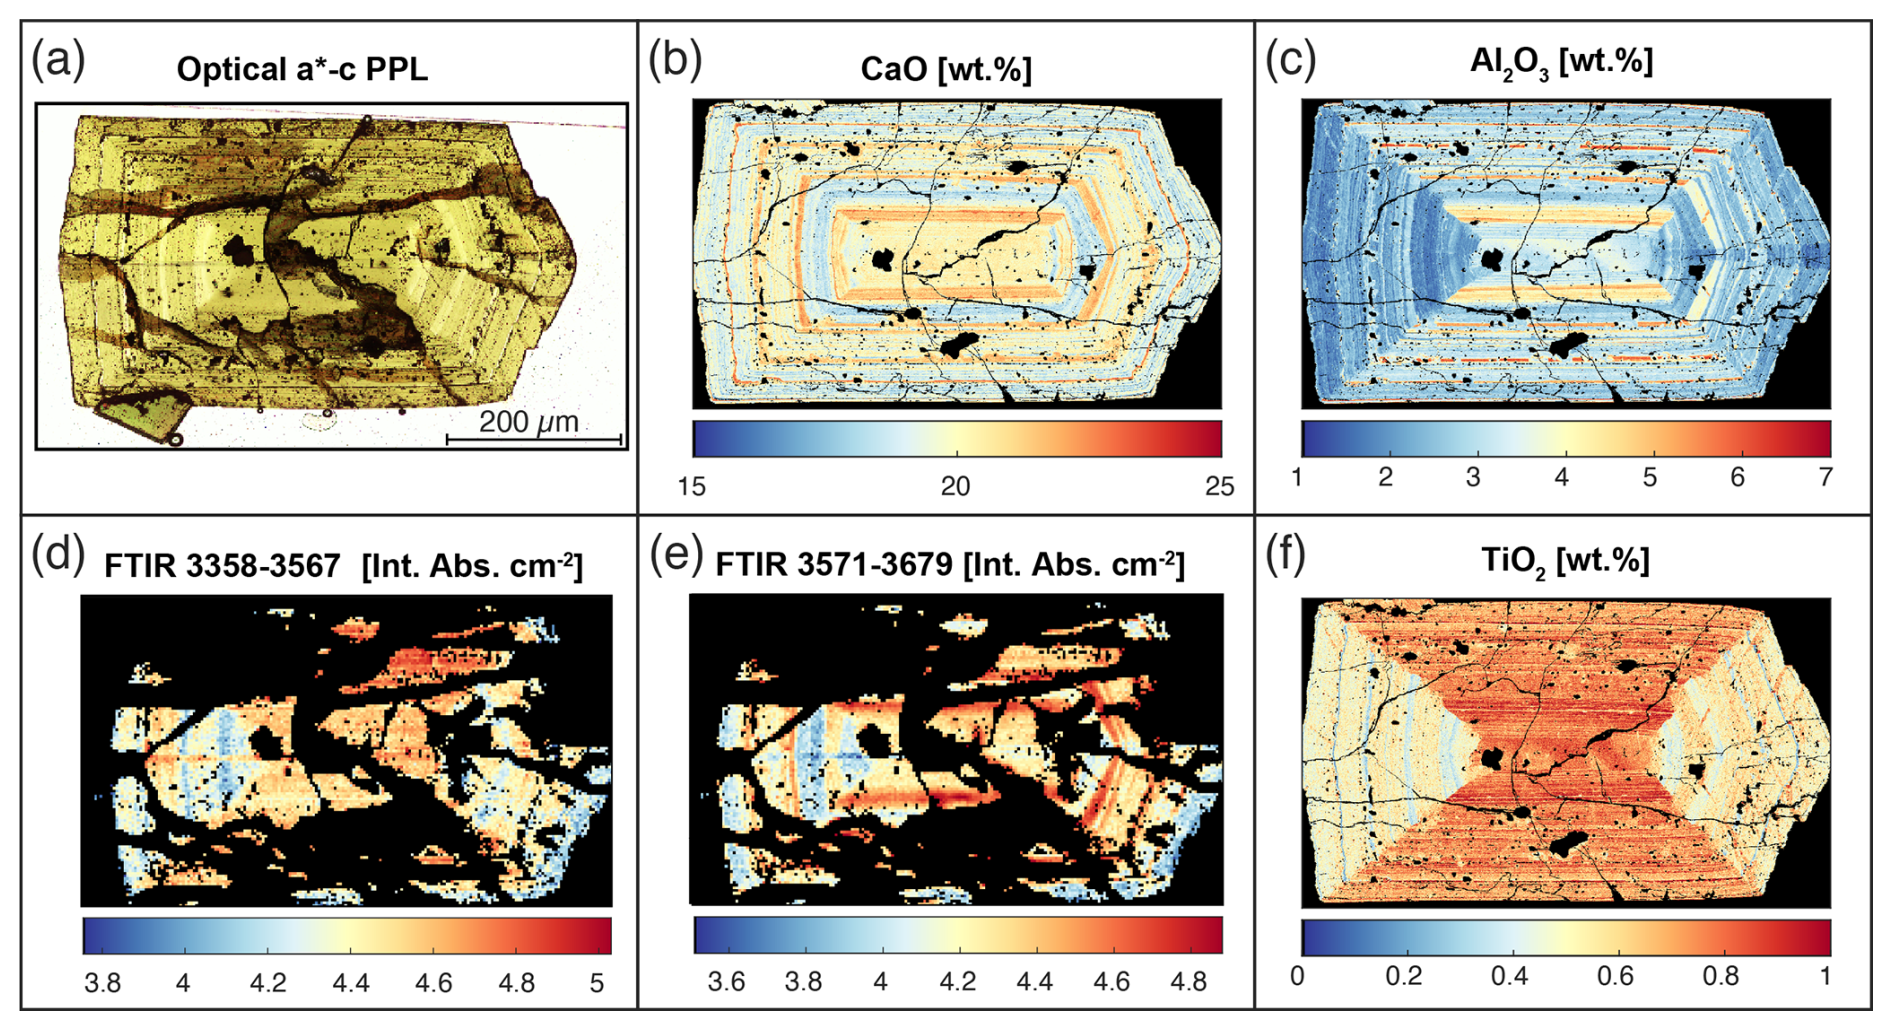
Figure 10Compilation of optical microphotograph plain-polarised light (PPL), FTIR mappings, and compositional maps of the same (a*–c) section of the magmatic augite sample from Java. Integrated absorbance maps of two different O–H-related defect groups reveal differences in O–H absorbance, which correlates with major element maps acquired by EPMA. The mappings reveal complex zoning of the clinopyroxene crystal. Growth and sector zoning is visible in the lower-wavenumber FTIR bands 3358–3567 cm−1 and in the Al2O3 and TiO2 distribution, whereas higher-wavenumber FTIR bands 3571–3679 cm−1 and CaO distribution show only growth zonation. SiO2, FeO, and C2O3 maps are presented in Fig. C5.
Three different zones, free from visible inclusions or cracks, which were identifiable in all prepared sections, and round polarised spectra were acquired and investigated. Spectra show the typical absorbance behaviour of magmatic clinopyroxenes, with a strong peak around 3634 cm−1, polarising and at least two peaks between 3600–3400 cm−1 with a polarisation behaviour of (Fig. 11). It is noteworthy that zonation of H2O is preserved in this sample at magmatic temperatures and is strongly coupled to the chemical zonation (Figs. 10, C5). When comparing the integrated absorbance maps representative of the two different families of bands with the chemical maps, it is evident that the higher-wavenumber bands (Fig. 11a) related to the exchange of M3+ + H+ for Si4+ (Balan et al., 2020) anticorrelate with Fe and correlate with Cr and Ca, showing no sector zoning, whereas the M-site-related defects (Fig. 11b) show similarities with Al, Ti, Si, and Mg, showing strong sector zoning (Fig. 10).
In the section prepared parallel to the (a*–b) plane, polarisation behaviour of the Si–O overtones correlates perfectly with the visible OH bands (see Fig. 11a; band 3634 is strong, and band 3514 is weak). In the section parallel to (a–c) the polarisation behaviour of the OH-related defects does not exhibit the same pattern as the Si–O bands. This is particularly evident when comparing the OH absorption band at 3634 cm−1 with the polarisation of the overtone band at 1525 cm−1. This relationship occurs through both sides of the twinned crystal and is consistent with polarised mapping of the transition (Fig. C6). Thus, this observation suggests that the infrared indicatrices of the 1525 cm−1 Si–O overtone bonds have a different orientation compared to the infrared indicatrices of the O–H-related defects, which coincide with the axes of the optical indicatrix (Fig. 11). This agrees with the notion of Strens et al. (1982), where the indicatrices of different bands can have different orientations, which do not necessarily have to coincide with the axes of the optical indicatrix or crystallographic axes. Clearly, more detailed high-resolution angular polarisation measurements of magmatic clinopyroxene are needed to investigate this fundamental phenomenon.
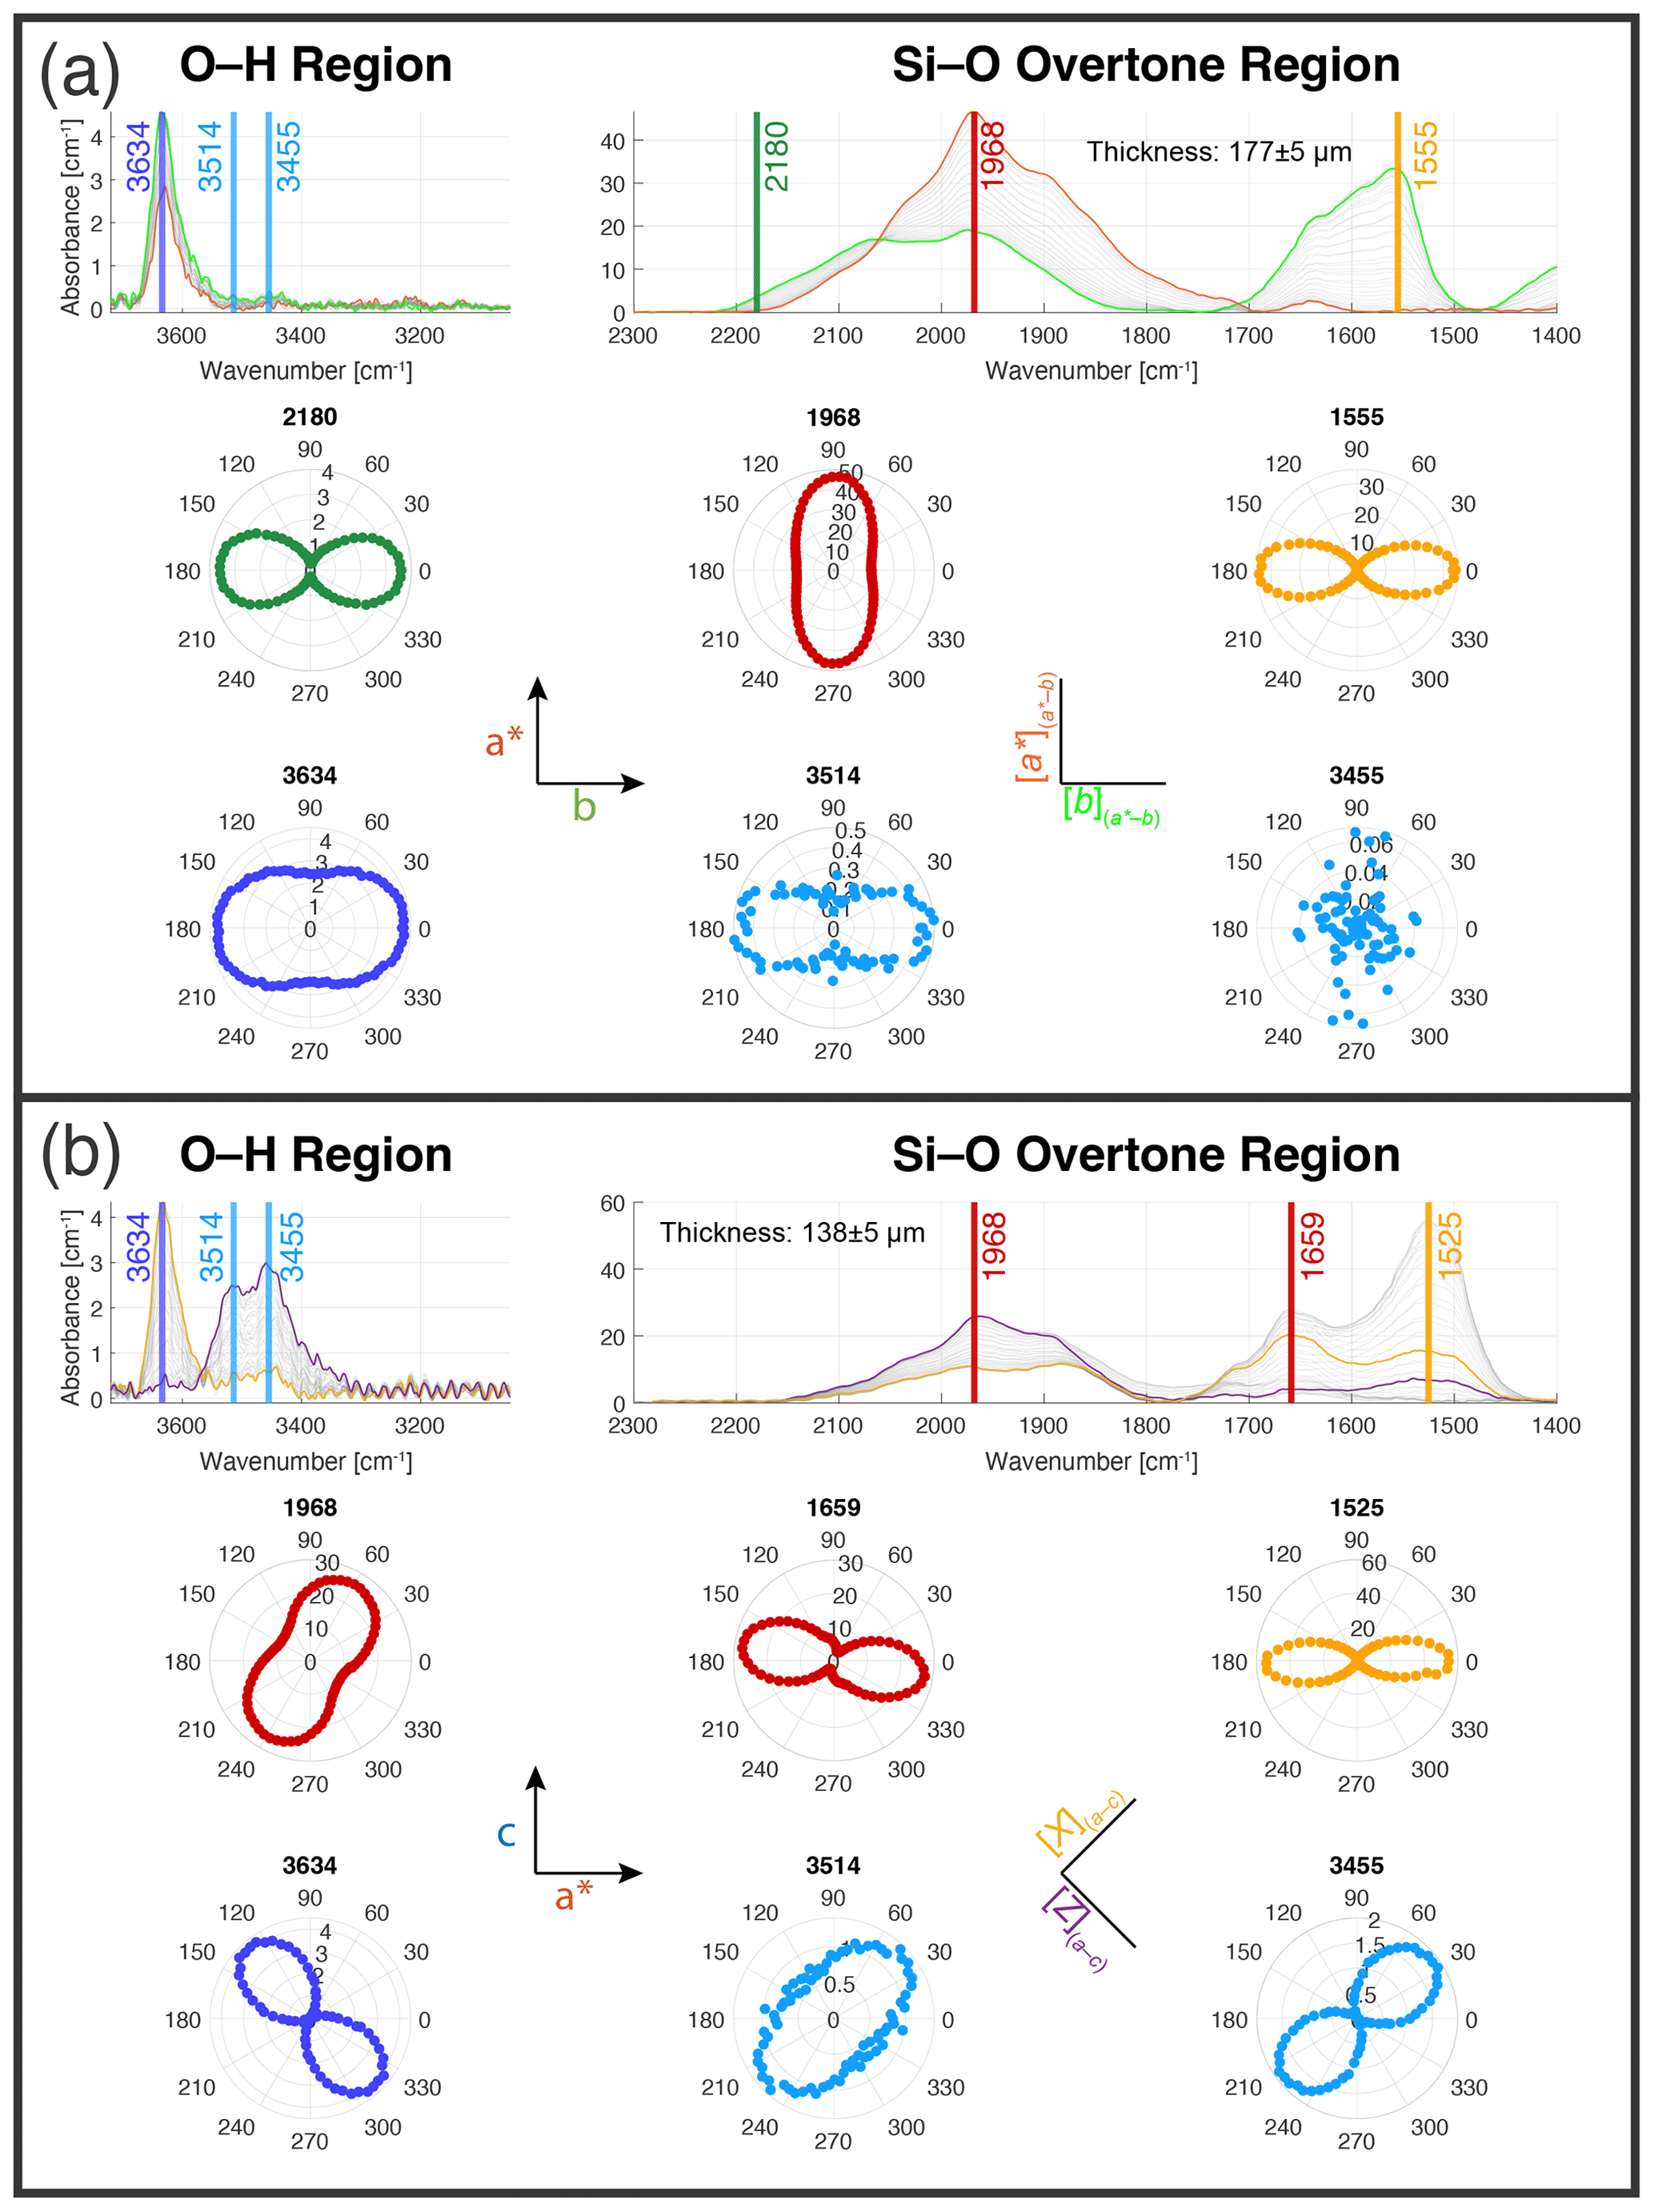
Figure 11Polar plots from the angle-resolved polarised measurements for the magmatic augite sample from Java of sections prepared parallel to the (a*–b) (a) and (a*–c) (b) planes. In the section (a*–b), Si–O overtone polarisation maxima and minima are aligned with the crystallographic axes and are orthogonal to the polarisation behaviour of OH-related defects, with small polarisation of the 3634 band and almost no absorption of the lower-wavenumber bands 3514 and 3455. In the section (a*–c), none of the maxima and minima are aligned with the crystallographic axes, but the OH-related defects show orthogonal polarisation behaviour.
4.4 Homogeneous omphacites from eclogite xenoliths
Handpicked clinopyroxene fragments from two lightly crushed cratonic eclogite xenoliths (Koidu, West African craton), K5-5 and K5-14, described in Aulbach et al. (2019) and Aulbach et al. (2024), were mounted in epoxy and double-sided polished to thicknesses of 260 ± 15 and 240 ± 15 µm, respectively. These samples were used to investigate the polarisation behaviour of multiple randomly oriented grains (Fig. 4c and d). H2O contents were shown to be homogeneous, previously demonstrated with high-resolution FTIR mappings using the focal plane array (FPA) detector, showing no gradients in several mapped grains. These crystals are usually difficult to orientate due to the small grain size and irregular grain shape. Homogeneous clinopyroxene fragments of multiple eclogite xenolith samples were investigated with the acquisition of angle-resolved polarised measurements of 40–60 grains depending on the sample. In the following, the endmember spectra for two representative samples (K5-5 and K5-14) with different OH absorption patterns are presented, along with a detailed analysis of variation in H2O quantification results from different approaches. Finally, selected classified spectral endmembers of the two samples are compared, showing different OH absorption patterns, polarisation behaviour, and families of OH absorption bands.
To obtain the five spectral endmembers [a*], [Y](b–c), [c](b–c), [X](a–c), and [Z](a–c), the previously described endmember finding approach of SpecXY was used for both samples in a range of 2200–1450 cm−1. Spectra with >90 % of endmember component were labelled as corresponding endmembers. The resulting spectra show clear spectral endmember features for [a*], [Y](b–c), and [c](b–c), whereas [X](a–c) and [Z](a–c) are in between [a*] and [c](b–c). Nevertheless, in these specific samples, [X](a–c) and [Z](a–c) can be identified by unique spectral patterns in the lower wavenumbers of the Si–O overtone region between 1800–1450 cm−1 (Fig. 12). It is now possible to determine different families of bands in the O–H region with similar polarisation behaviour and also to identify minor absorption bands, which only appear in specific endmember spectra. Surprisingly, the higher wavenumbers consist of at least two separate defects with different polarisation behaviour: (1) the higher-wavenumber peak between 3635–3655 cm−1, behaving similarly to the observed peak in diopside-rich clinopyroxenes (e.g. Fig. 8, Sample 2, Binntal) identifiable in [Y](b–c) and [a*], and (2) an additional band at 3622–3635 cm−1, with a maximum [X](a–c) and [c](b–c) similar to that seen in the previous magmatic clinopyroxene example. The higher-wavenumber defects are more dominant in sample K5-14, whereas the lower-wavenumber defects are more dominant in sample K5-5. The lower-wavenumber defects in the O–H region show similar polarisation behaviour, and only minor differences can be observed between the two samples. For example, in the [a*] spectra of K-5-14, two additional bands around 3480 and 3432 cm−1 are identifiable, which remain hidden under the more dominating bands around 3450 cm−1 in sample K5-5. By extracting the absorbance of the characteristic Si–O overtone bands and plotting them against each other and the total integrated absorbance, the orientation effect of polarised FTIR spectra becomes evident (Figs. 13, 14, C7, and C8). With this method it is possible to identify spectral endmembers, evaluate the relationship between orientation and OH absorbance, and check for homogeneity of different grains by comparing OH absorbance on grains that display identical overtones. A key observation from this example is that these two clinopyroxenes need to be oriented differently if the maximum and minimum absorbance should be present in the prepared sections. While the ideal sections for K5-14 are (a–c) and (a*–b), with the maximum in [Z](a–c), the ideal sections for K5-5 are (b–c) and (a*–b), with the maximum and minimum in [c](c–b) and [a*], respectively. To investigate the anisotropy of the different defects, theoretically, four spectra should be enough. However, in the complex case of clinopyroxenes with multiple overlapping absorption bands with differently oriented indicatrices, more sections are needed to see clear patterns for different families of bands corresponding to different defects.
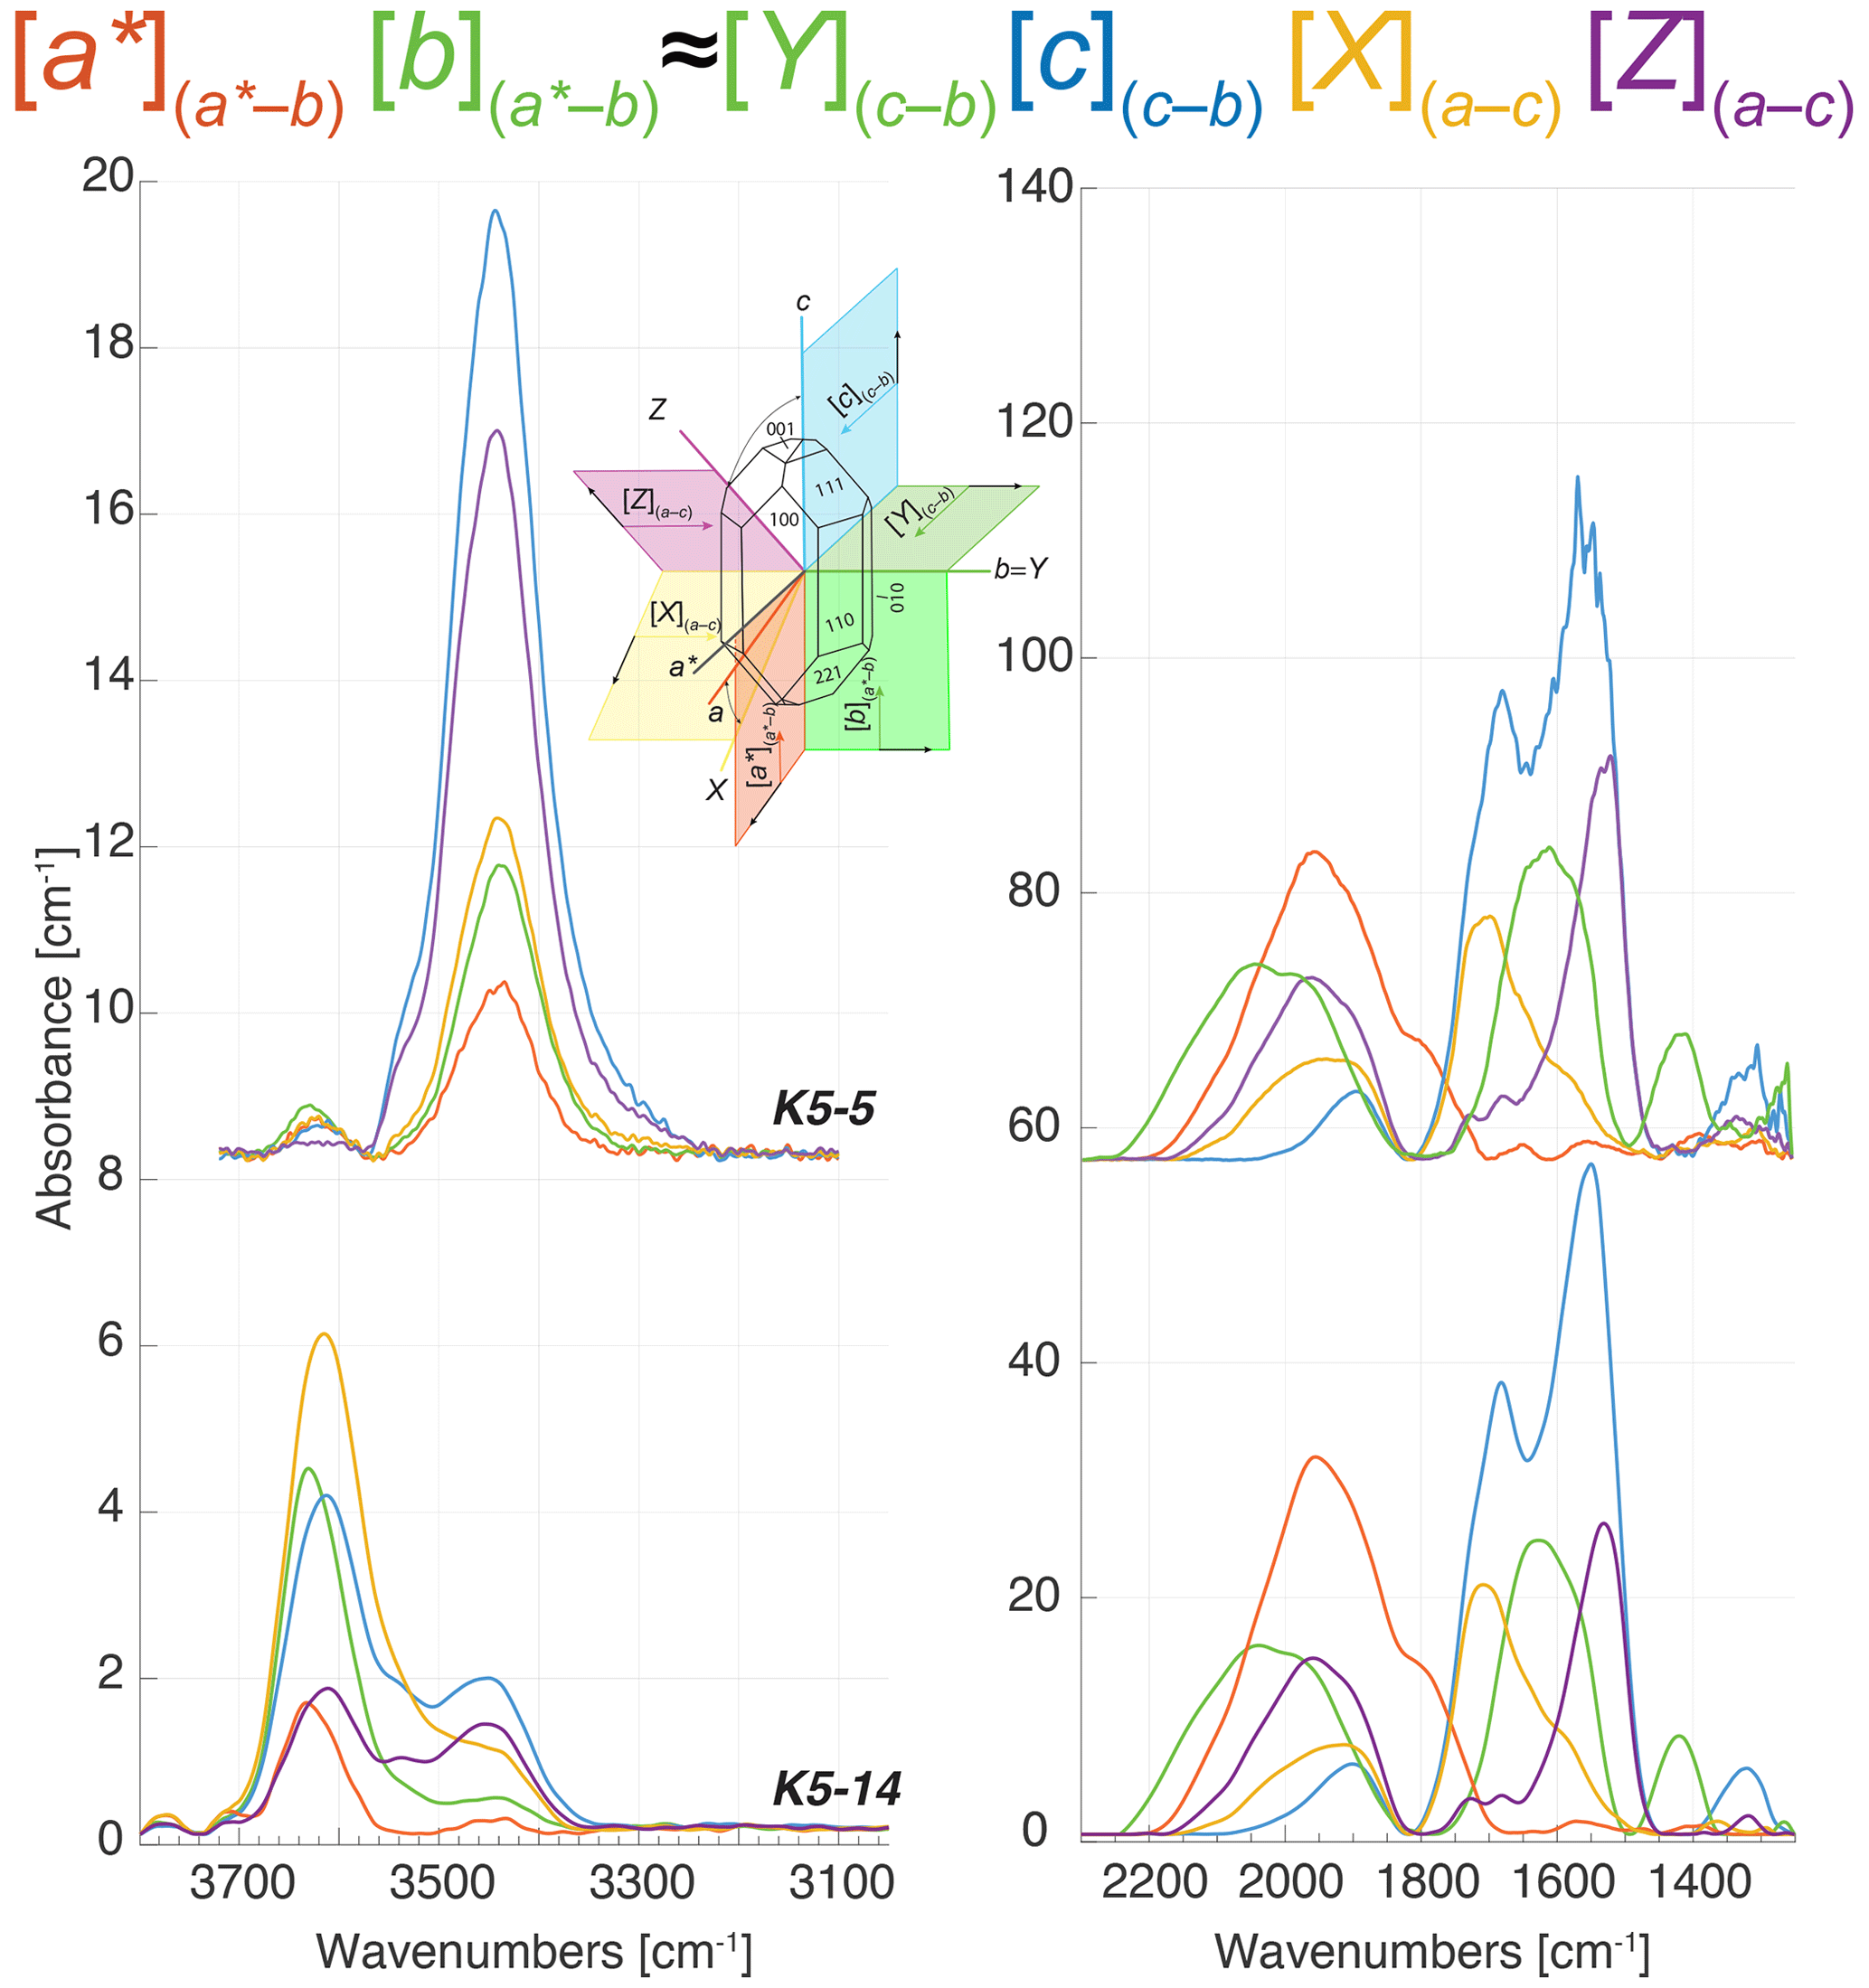
Figure 12Extracted endmember spectra [a*], [Y](b–c), [c](b–c), [X](a–c), and [Z](a–c) for omphacite in samples K5-5 and K5-14 showing different OH absorption behaviour yet similar Si–O endmembers. Endmember spectra reveal multiple, overlapping OH-related defects by a change of the slope and/or peak position, caused by different polarisation behaviour of the different H incorporation mechanisms.
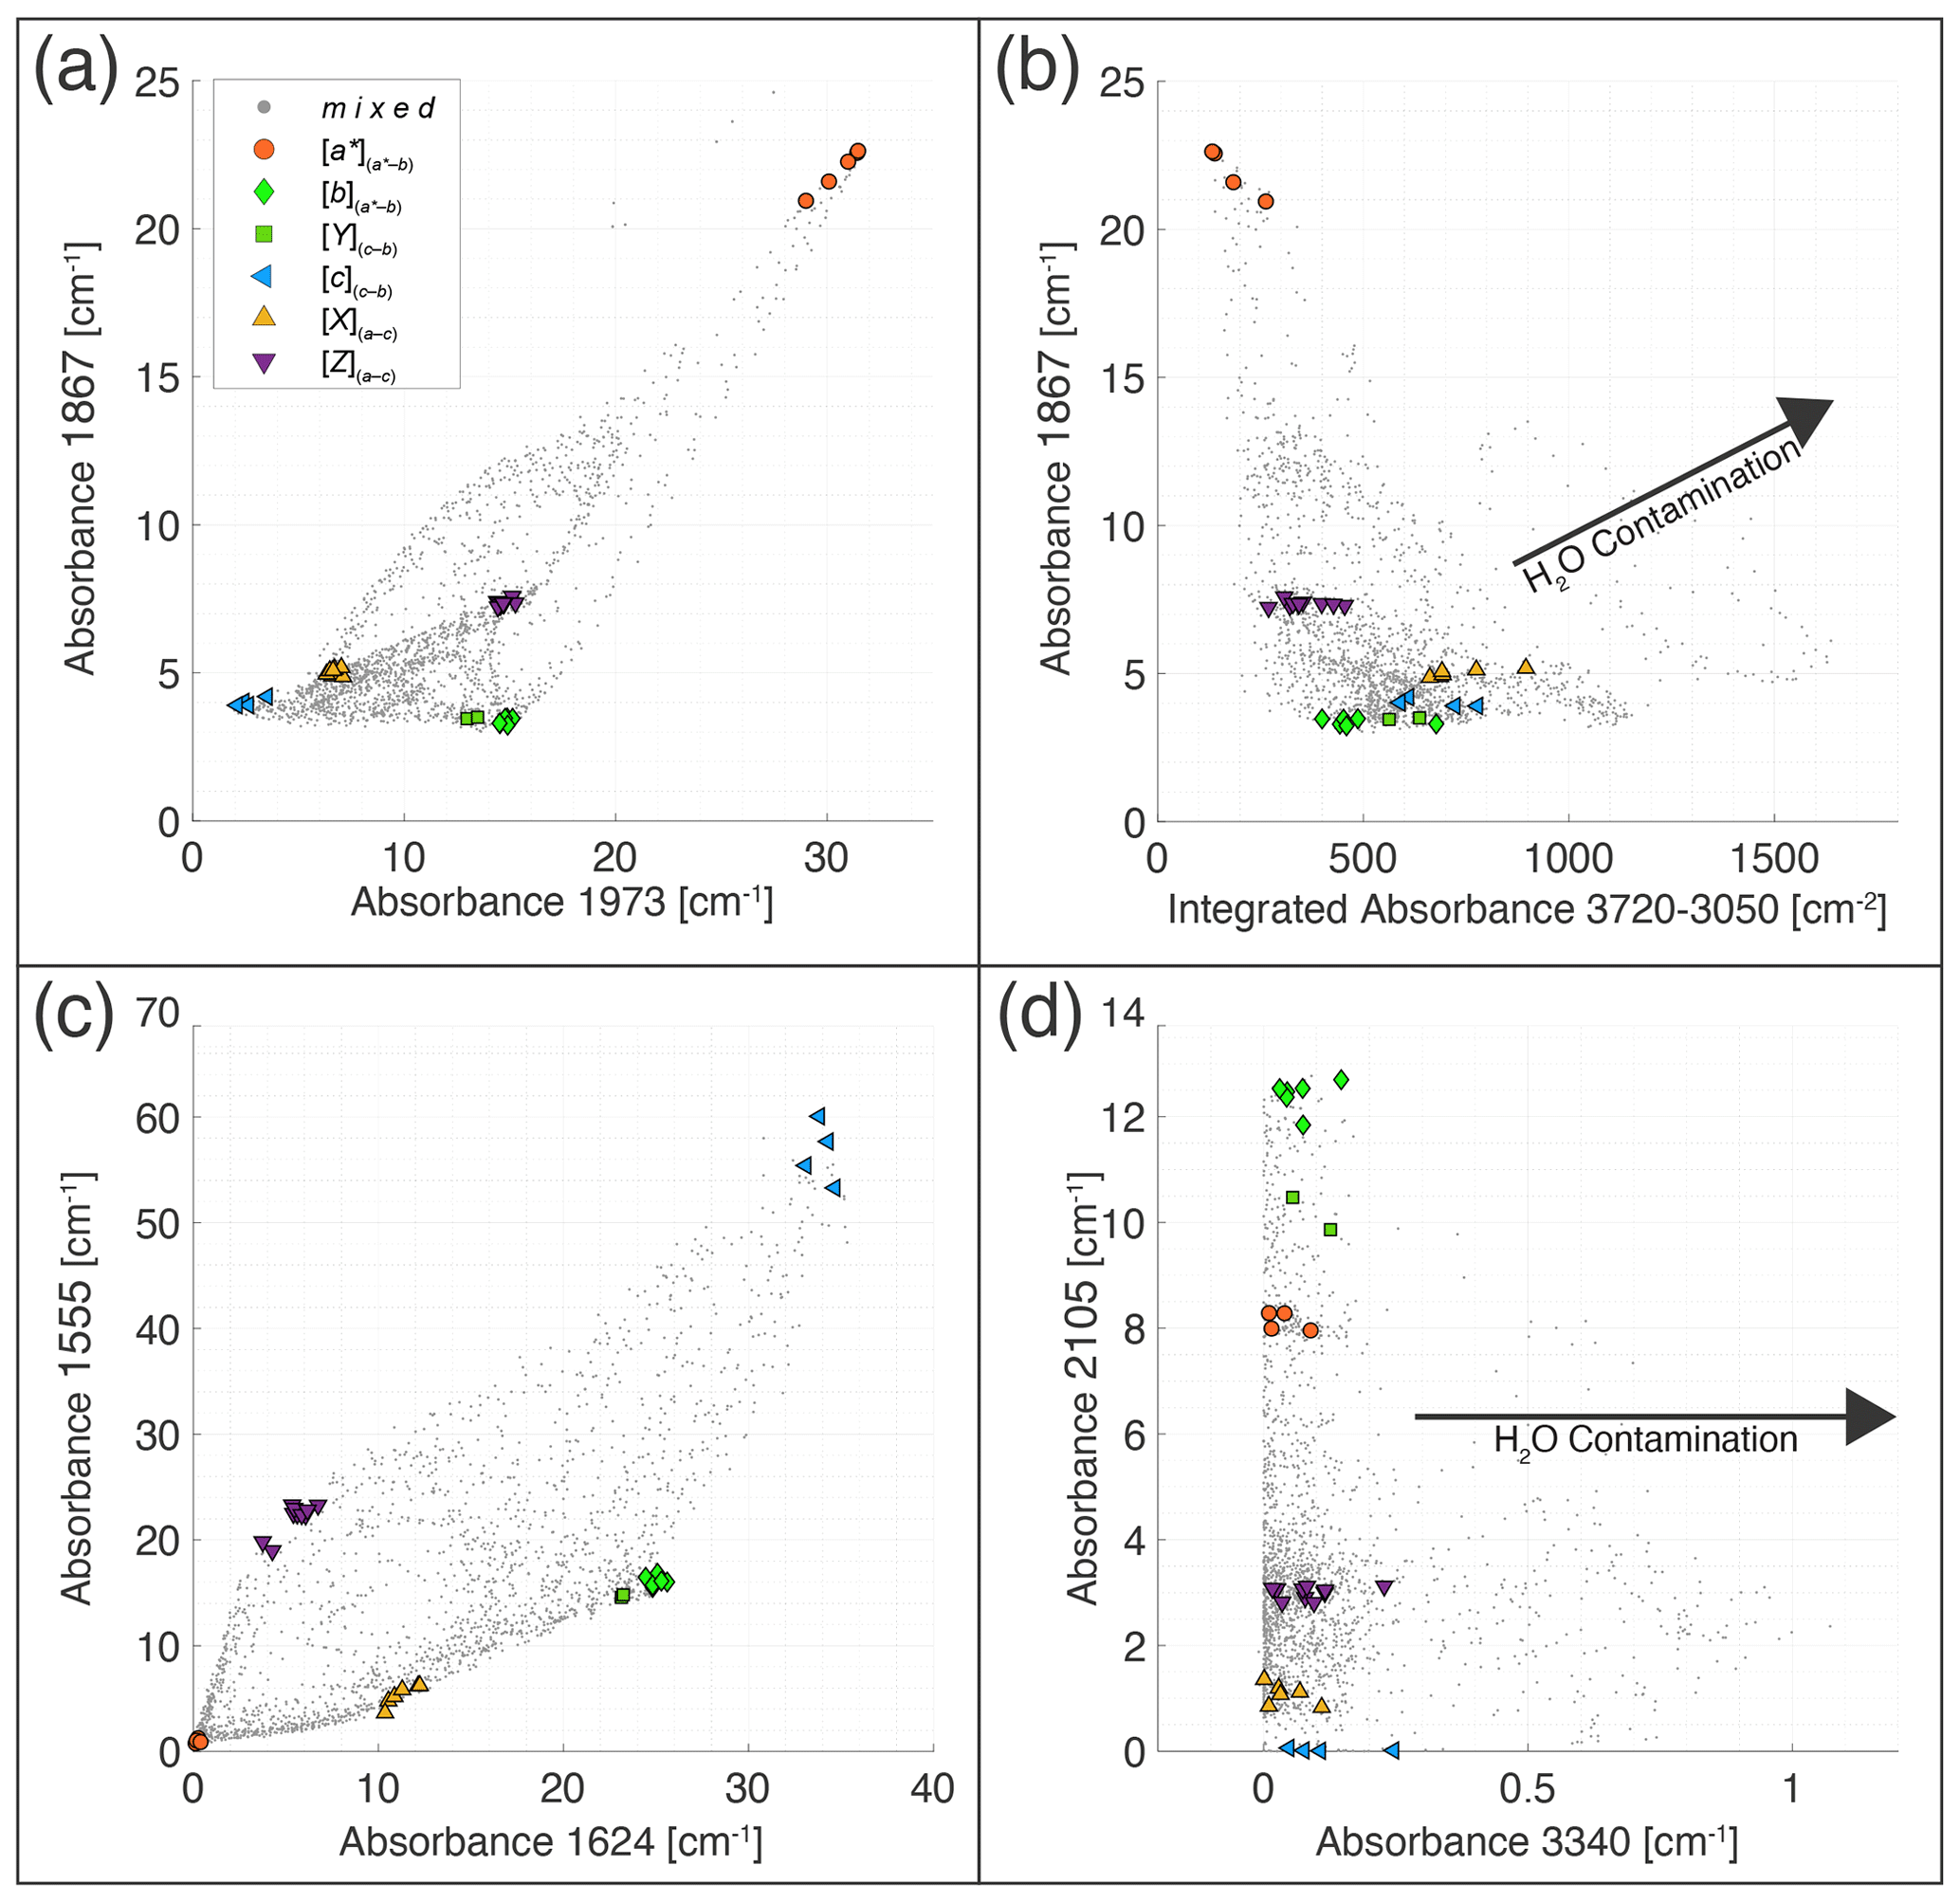
Figure 13Scatterplot matrix showing extracted values for the integrated O–H absorbance and selected characteristic Si–O bands 1555, 1624, and 3340 cm−1 of the full unfiltered data set containing 2024 polarised spectra of 46 randomly oriented crystals of omphacite in sample K5-14. Identified spectral endmembers shown in large symbols. Band 1867 cm−1 vs. 1973 cm−1 reveals the triangular pattern covered by the endmember combinations of [a*], , and [c](c–b) and [Y](c–b), [X](a–c). [Z](a–c), where the [Y](c–b), [X](a–c). [Z](a–c) triangle is located within the larger [a*], , [c](c–b) triangle. Band 1555 cm−1 vs. 1624 cm−1 spans a field where each endmember identified by spectral patterns is located in a corner. Band 3340 cm−1, as a measure for H2O contamination, reveals the contamination by a broadband caused by epoxy or alteration.
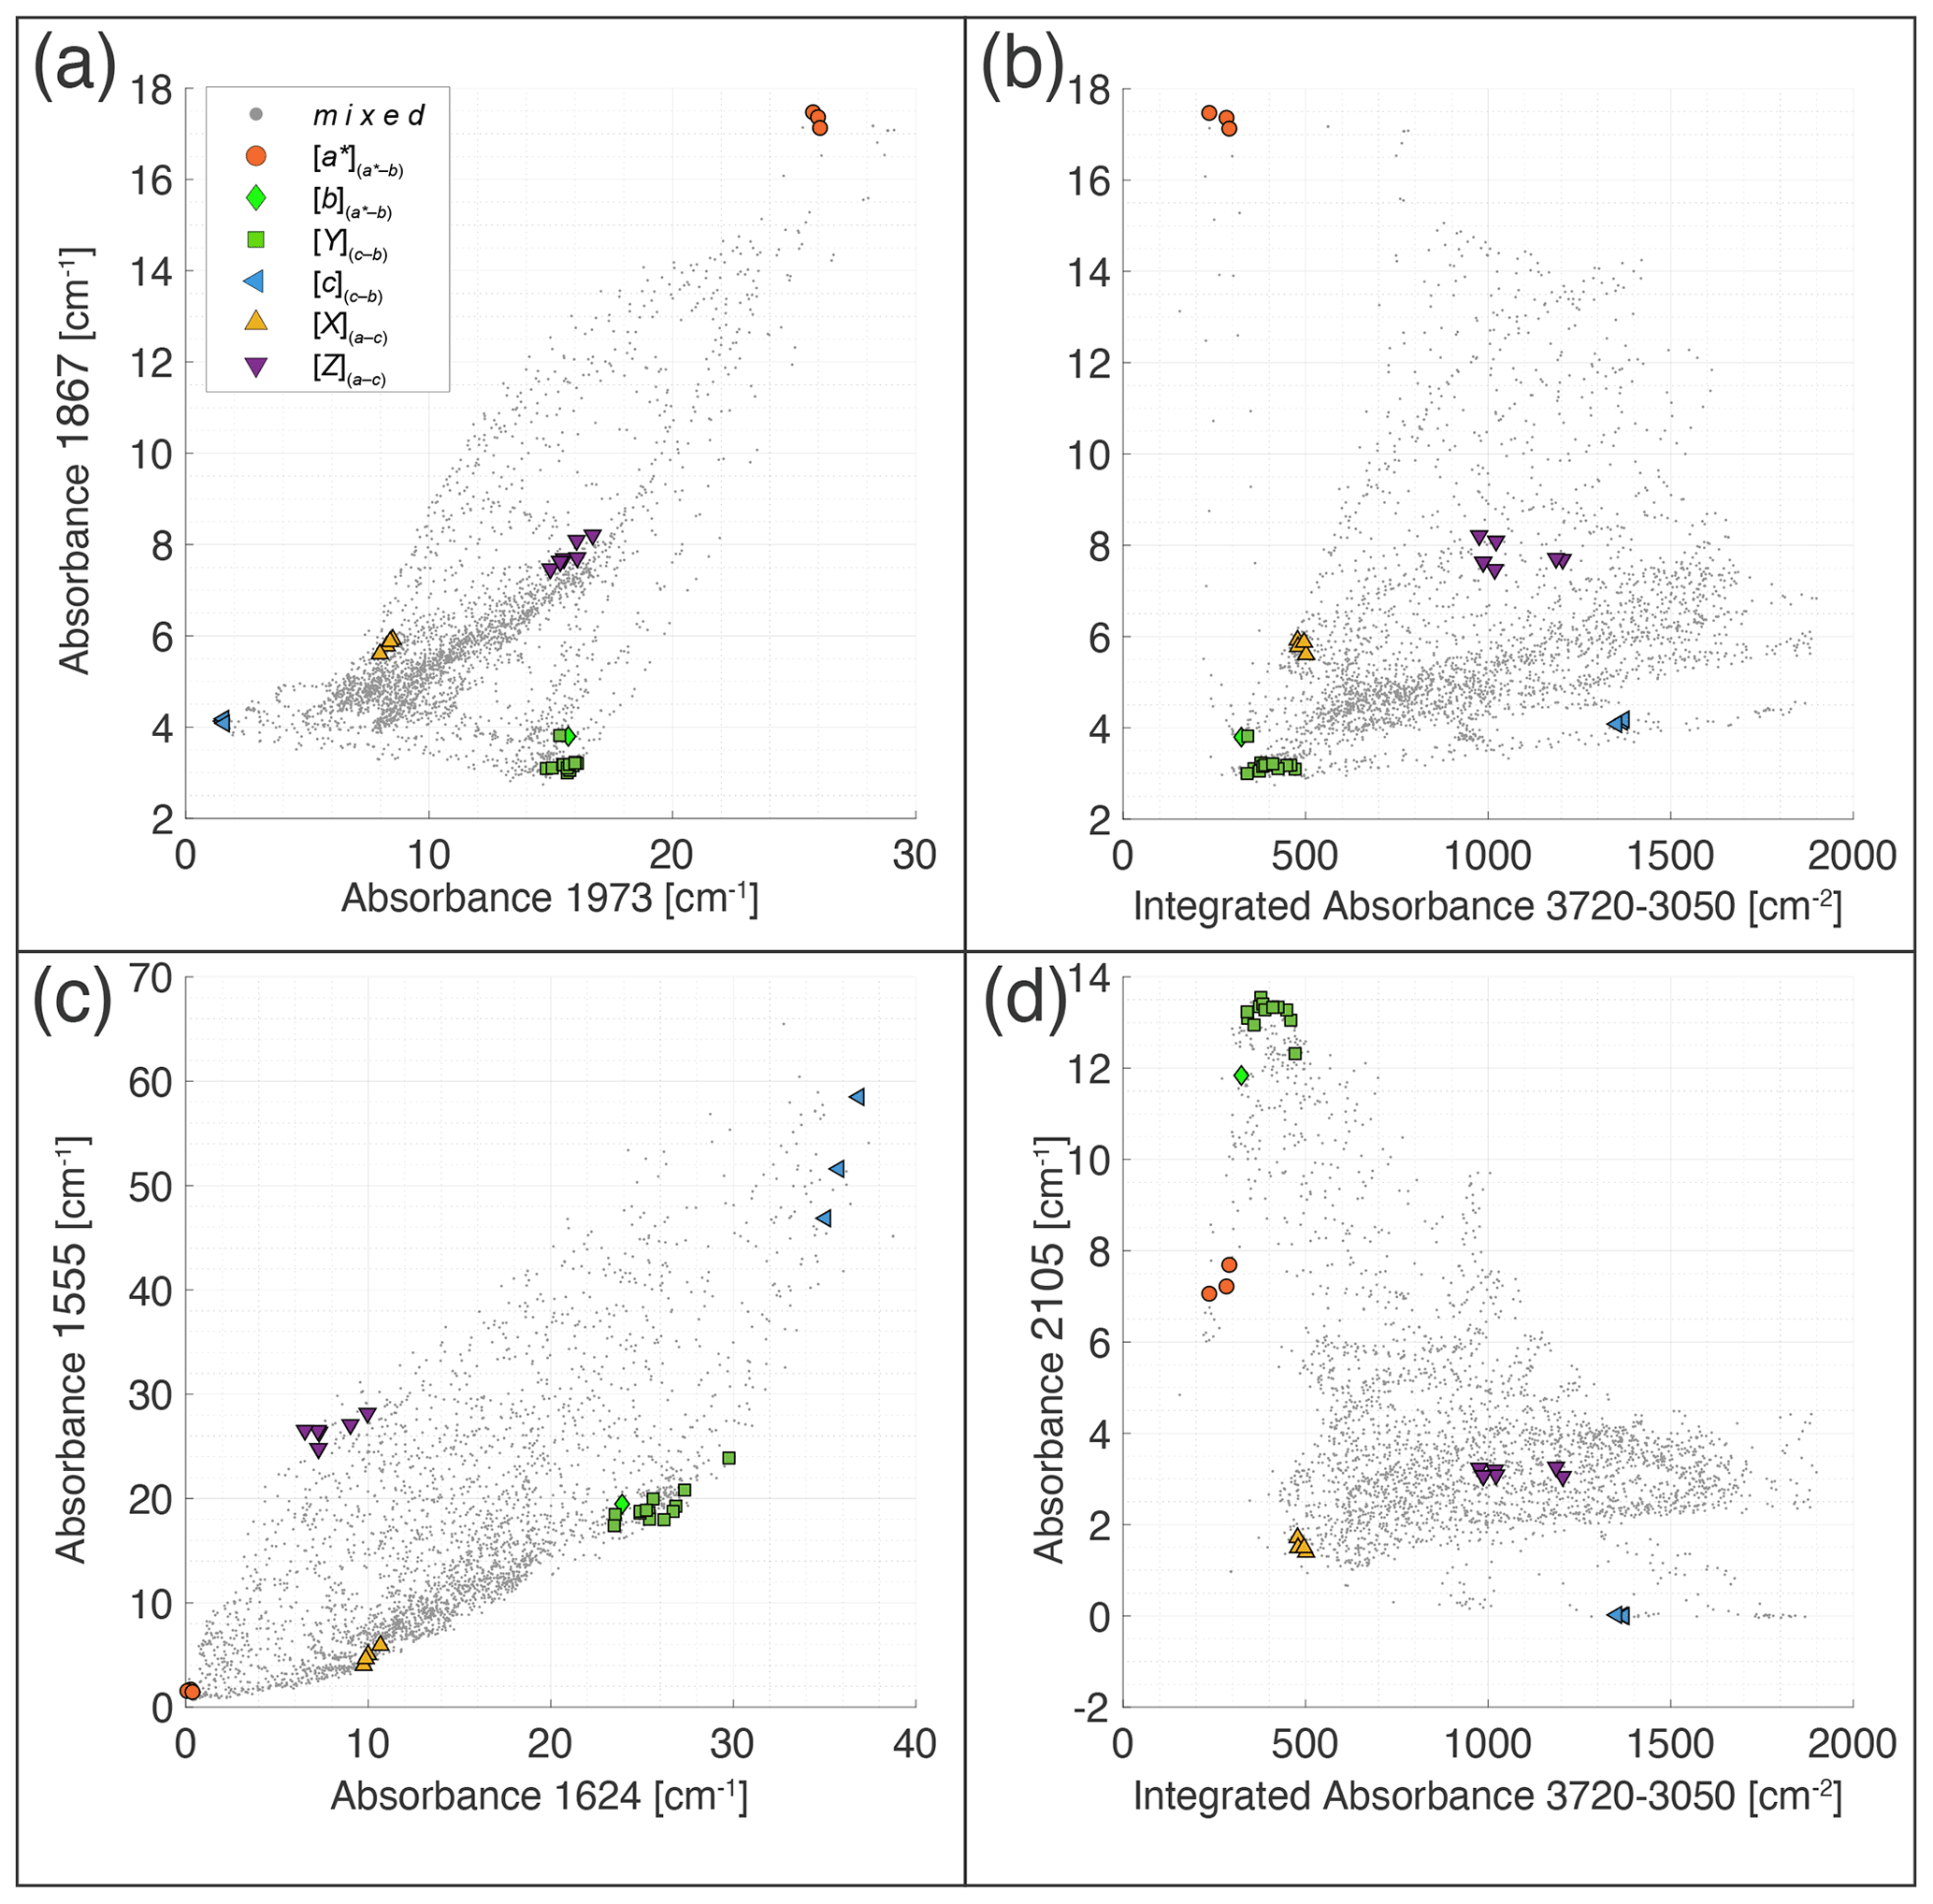
Figure 14Scatterplot matrix showing extracted values for the integrated O–H absorbance and selected characteristic Si–O bands 1867, 1624, and 1555 cm−1 of the filtered data set, containing 2860 polarised spectra of 65 spots acquired in 52 randomly oriented crystals of omphacite in sample K5-5. Spots showing spectral features of contamination were excluded before plotting. Identified spectral endmembers are shown in large symbols. Band 1867 cm−1 vs. 1973 cm−1 reveals the triangular patterns covered by the endmember combinations of [a*], , [c](c–b) and [Y](c–b), [X](a–c). [Z](a–c), where the [Y](c–b), [X](a–c). [Z](a–c) triangle is located within the larger [a*], , [c](c–b) triangle. Band 1555 cm−1 vs. 1624 cm−1 spans a field where each endmember identified by spectral patterns is located in a corner. Interestingly, the highest integrated absorbance does not correlate with any spectral endmember, indicating a complex mixing between different OH-related defect groups with different polarisation behaviour, showing the maximum integrated absorbance in between the spectral endmembers in the Si–O overtone region.
4.5 Inhomogeneous omphacites from orogenic eclogites
A double-sided polished thick section of an orogenic eclogite from the western Gneiss region in Norway (MKS_A83) was prepared, with a thickness of 365±10 µm. It is frequently observed that natural samples exhibit inhomogeneous H2O contents of different origins (e.g. chemical zonation, diffusion gain or loss of H, alteration to and/or exsolution of hydrous phases). This example demonstrates the potential of using spectral endmembers to investigate H2O variations within a sample. The inhomogeneity of this sample can also be seen in the multi-grain high-resolution FPA mapping (Fig. C9).
For sample MKS_A83, we selected 49 optically clear spots in the core and rim domains of different, randomly selected grains and made angular polarised measurements as described previously. The endmembers [a*], [Y](b–c), [c](b–c), [X](a–c), and [Z](a–c) were classified using the endmember finding approach of SpecXY. The results were verified by comparing the characteristic bands of the Si–O overtones from the previously presented examples (K5-5 and K5-14), and spectra with less than 10 % deviation of the characteristic bands were selected to represent the endmembers (Fig. 15a). The endmembers [X](a–c) and [Z](a–c) are more difficult to identify because the characteristic maxima in the absorption patterns of the lower-wavenumber Si–O overtones between 1400–1800 cm−1 were not present in the sample MKS_A83 (Fig. C10). By comparing spectra with nearly identical measurement and polarisation direction for [a*], [Y](b–c), and [c](b–c), the integrated absorbance of the OH-related bands reveals inhomogeneities in H2O content across the sample (Fig. 15). Furthermore, it is now also possible to identify and distinguish overlapping minor absorption bands, such as the one only visible in [a*] and [Y](b–c) at 3432 cm−1, which would be invisible using unpolarised spectra. A comparison of characteristic bands and the integrated absorbance of the O–H region for all PolGroups of 49 measurement positions, with a total number of 2205 polarised spectra of sample MKS_A83, reveals a distribution of nearly random orientations, as can be seen by the ratio of the absorbance at the bands 2105 and 1973 cm−1 (Fig. 15b). The variable absorbance observed within the same endmember group in the O–H region further confirms the presence of inhomogeneities in the H2O content of the measured clinopyroxene grains, which can also be observed in the endmember spectra (Figs. 15 and C10).
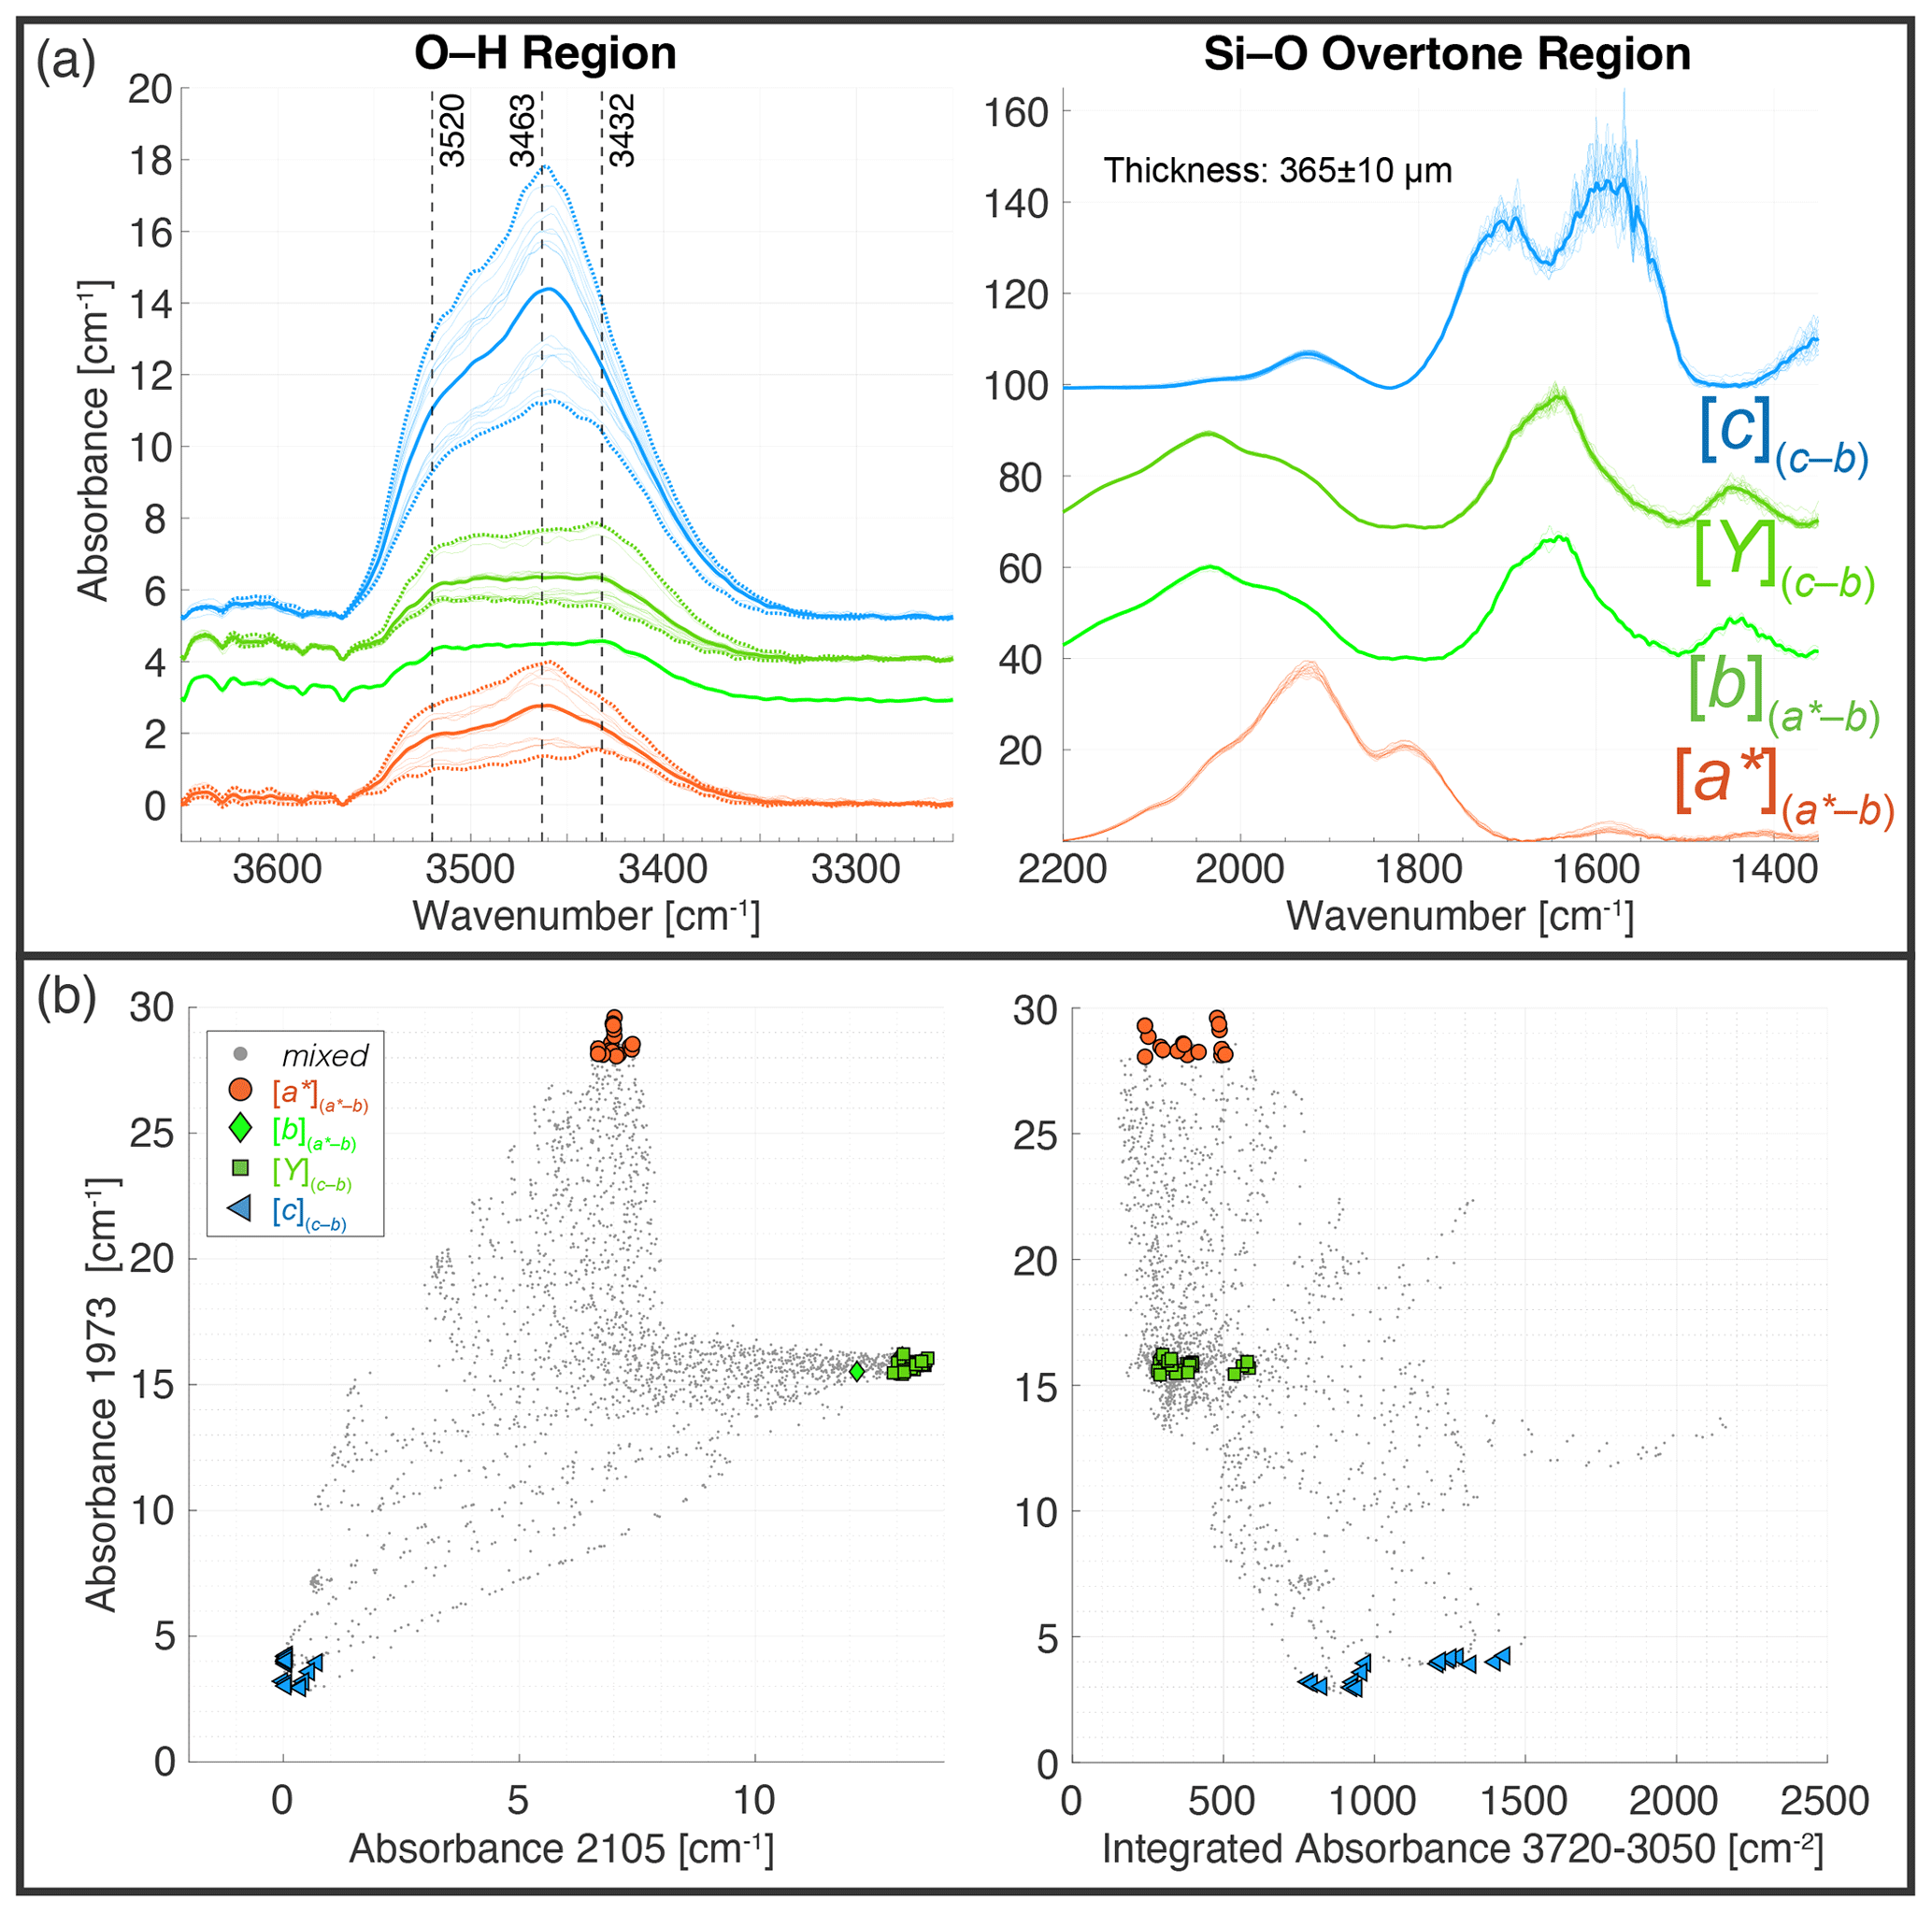
Figure 15(a) Comparison of classified endmembers [a*], [Y](b–c), and [c](b–c) (grouped by colour) of sample MKS_A83, collected from angle-resolved polarised measurements of 49 spots in randomly oriented grains. The integrated absorbance in the O–H region (3720–3050 cm−1) for spectra of similar Si–O overtones of sample MKS_A83 reveals inhomogeneities in the sample by showing a wide variation in absorbance values. (b) Scatterplots comparing selected characteristic Si–O bands 1973 and 2105 cm−1 to identify the spectral endmembers of the Si–O region. Spectra of the same endmember show different integrated O–H absorbance and reveal inhomogeneities in the H2O content of the sample. Identified endmembers from spectral features [a*], [Y](b–c), and [c](b–c) are shown in coloured symbols.
This example illustrates how the selection of spectra for comparison based on the endmembers of the Si–O overtones can be used to analyse variations across different grains with different orientations. It allows quantification of core and rim H2O contents, a feature that cannot be obtained when using the mean of unpolarised spectra, where it is not clear if variation in absorbance is related to orientation or difference in H2O contents. Furthermore, this approach can be combined with textural and compositional information (e.g. different grain sizes, chemical zonation) to statistically investigate the within-sample or within-zone differences of H2O content.
A large number of polarised FTIR spectra of OH absorption bands and overtones of a wide range of pyroxenes have been measured in this study with a newly developed automated polariser and a custom-designed software solution to efficiently process the large number of data. In the following, these technical developments are discussed with respect to their aid in the identification of endmember spectra in the overtone and O–H absorption region of clinopyroxene. This provides a basis to define different defect types based on polarisation behaviour. The information regarding the orientation of maximum and minimum absorption in the O–H region with respect to the optical and crystallographic orientations of clinopyroxene is then used to establish different protocols to determine total absorbance and thus quantify H2O contents in clinopyroxene.
5.1 Technical developments
Technical developments of the automatic polariser enable the acquisition of all polarisation angles in programmable spots, thus allowing the acquisition of a large number of polarised spectra of anisotropic samples. The open-source hardware design is easy to adapt to work with various instruments and can be further customised to improve data quality. There are two critical benefits of the new workflow.
First, for the quantification of H2O in anisotropic nominally anhydrous minerals, it is important to recognise families of bands with a systematic polarisation behaviour. This can be verified by investigation of the spectral endmembers, which will also lead to the identification of the appropriate endmembers to be used for the quantification approximation.
Second, because measurements can be automated, a larger number of spots can be acquired with significantly less manual effort. Human bias is eliminated when setting the polarisation angle. The larger number of spots can be investigated in greater detail, allowing for improved statistics and data verification. To improve the quantification results and avoid overestimations caused by contamination, altered and contaminated domains, as well as hydrous phases, should also be included when performing automatic angular polarised measurements. Consequently, their polarisation behaviour and contribution to the spectrum of the phase of interest can be constrained even if, in some polarisation angles, the O–H absorbance is saturated. This makes it easier to identify obvious contamination of samples by rapidly plotting endmember spectra together, for example, to identify antigorite in olivine, chlorite in garnet, epidote in feldspar, amphibole and sheet silicates in pyroxenes, and melt or fluid inclusions in all nominally anhydrous minerals. Additionally, in low-symmetry minerals like clinopyroxene, it is possible to determine the directions of maximum and minimum absorption with respect to the axes of the optical indicatrix and the crystallographic axes for each family of defects, which is a prerequisite for the accurate determination of H2O contents.
5.2 Identification of Si–O overtone endmembers
For orthopyroxenes and clinopyroxenes from various geological settings and with different chemical compositions, it is possible to observe similar patterns in Si–O overtones for the specific orthogonal endmembers [a*], [Y](b–c), and [c](b–c), equivalent to the previously described Si–O endmember spectra in olivine (see Lemaire et al., 2004; Asimow et al., 2006; Giuliani et al., 2025). The characteristic spectral patterns are best defined by the sharp Si–O overtone bands in diopsides, whereas the magmatic/augitic and omphacitic samples show less well-defined, smoothed, overlapping peaks. For all investigated samples, [a*] can be identified by a clear maximum between 2100–1800 cm−1 and a minimum between 1750–1300 cm−1. [Y](b–c) shows the highest absorbance in the Si–O overtone bands with wavenumbers > 2100 cm−1. [c](b–c) can be identified by the lowest absorbance in the higher-wavenumber Si–O overtones between 2300–1800 cm−1, and the highest absorbance in the lower-wavenumber Si–O overtones is between 1800–1400 cm−1 (e.g. Figs. 8 and 12).
[X](a–c) and [Z](a–c) are not identifiable purely by the FTIR spectra in some investigated samples; however, since [X](a–c) and [Z](a–c) are aligned with axes of the optical indicatrix, it is possible to orient crystals optically or to identify suitable grains, for example, in a thick section, using optical microscopy before FTIR analysis. Additionally, for large crystals, morphological features such as the habitus in idiomorphic crystals or the cleavage allow orientation of the crystals parallel to the (100), (010), and (a*–b) plane and the acquisition of spectra of [Y](b–c) and [c](b–c), [X](a–c) and [Z](a–c), and [a*] and , respectively. The endmember spectra in the Si–O overtones, which show maximum and minimum absorption in different wavenumbers, coincide with a*, b, and c. In orthorhombic crystals, X, Y, and Z are aligned with a, b, and c, and, therefore, each endmember can be acquired in two different directions (Fig. 1 and Table 1). In monoclinic crystals only Y and b are aligned, and most observed indicatrices show either a maximum or a minimum in or [Y](c–b) spectra. Consequently, any measurements with the b axes in the plane and the polariser parallel have very similar absorbance. Therefore is equivalent to [Y](c–b) and can be acquired in all sections with the polarisation parallel to b. Once endmember spectra in the overtone region are known, synthetic spectra in any direction can be obtained using linear combination following Eq. (9). However, the inverse approach to estimate endmember spectra from a small number of randomly oriented, intermediate spectra as proposed by Asimow et al. (2006) and Jackson et al. (2018) is complicated because the angular relationship of absorption for the relatively strong absorption of the overtone bands is a function of (the unknown) maximum and minimum absorption (Figs. 2 and C2).
5.3 Attribution of bands to defects using polarised FTIR
The presented examples clearly show the complexity of the numerous different overlapping OH-related defects in clinopyroxenes. These compilations, controversies, and limitations in the understanding of H incorporation mechanisms in clinopyroxenes have been presented in several publications (e.g. Skogby and Rossman, 1989; Skogby et al., 1990; Ingrin et al., 1995; Bromiley and Keppler, 2004; Skogby, 2006; Stalder and Ludwig, 2007; Koch-Müller et al., 2007; Ferriss et al., 2016; Balan et al., 2020; Gose and Schmädicke 2022, Aulbach et al., 2024).
A detailed investigation and discussion of all samples and their complex, anisotropic OH absorption behaviour, as well as the published calibration coefficients, would go beyond the scope of this paper. The focus here lies in using selected samples to highlight the potential of the newly presented workflows for a much more detailed investigation of anisotropic defects. This also provides an opportunity to account for the fact that measuring only three directions is insufficient for a full description of monoclinic samples (Dowty, 1978). Furthermore, it is possible to identify families of bands with similar polarisation behaviour or to find bands that overlap with different polarisation behaviour. This provides additional information for meaningful deconvolution of spectra such as peak positions and peak width (Gies et al., 2024). Even though the two samples K5-5 and K5-14 show nearly the same Si–O overtone signatures, they differ significantly in terms of OH absorption (see Aulbach et al., 2024). Whilst K5-14 shows both, absorption between 3700–3600 cm−1 associated with T-site exchanges and absorption between 3600–3400 cm−1 associated with exchanges on the M sites, sample K5-5 shows dominant absorption between 3600–3400 cm−1, and only a minor peak is present between 3600–3700 cm−1. Nevertheless, both spectra also show similarities in the polarisation behaviour of different bands, for example, a local maximum at wavenumber 3540 cm−1, which can best be seen in [c](b–c) and [Z](a–c). Another interesting observation is the different position of the maximum in the range 3700–3600 cm−1, where the maximum in [Y](b–c) is located at 3630 cm−1, and the maximum in [c](b–c) is located at 3610 cm−1. It is still questionable whether, in these two samples, the band at 3610–3613 cm−1 is an intrinsic OH band or reflects exsolution of amesite and clinochlore, and both cases have been discussed previously (Bromiley and Keppler, 2004; Koch-Müller et al., 2004; Koch-Müller et al., 2007; Andrut et al., 2007; Jiang et al., 2022; Gose and Schmädicke, 2022; Skogby et al., 2016; Aulbach et al., 2023; Aulbach et al., 2024; Schmädicke et al., 2025). However, the strong polarisation effect documented here points towards an intrinsic OH band in this specific case as it is not observed in an eclogite xenolith showing optically visible cloudy exsolution features or in sample O-175 reported in Koch-Müller et al. (2004).
An advantage of using polarised measurements is that it allows comparison with calculated polarisation of different substitutions from the Density Functional Theory (DFT) modelling results of Balan et al. (2020). The coupled substitutions on the M sites between 3600–3400 cm−1 involving trivalent cations and H show a polarisation behaviour in both calculations and natural samples, which further indicates an orientation of the OH indicatrix close to the crystallographic b and c axes and the vector a*. The observed bands in diopside and augite around wavenumbers 3650–3620 cm−1 (exchange of Si for a trivalent cation and H+ on the T site) show a polarisation behaviour , in agreement with the DFT modelling. This is also the reason for the clear correlation in the scatterplot matrices, between the maximum of the M-site-related defects and endmember spectra [c](b–c), as well as for the observation that the maximum of the T-site defects is strongest in [Y](b–c) and [a*] endmember spectra (e.g. Figs. 9, 13, and 15). In sample MKS_A83, a minor absorption band at 3432 cm−1 can be revealed by the endmember spectra. This peak and the polarisation behaviour are in good agreement with the synthetic Fe- and Na-doped samples of Purwin et al. (2009) and the Density Functional Theory (DFT) modelling results of Balan et al. (2020) for an Na-related defect in diopside.
OH-related absorption defects in clinopyroxenes are associated not with one trivalent cation but rather with a distribution of all available trivalent cations that can be incorporated. The relative partitioning of which M3+ cations fit into these defects depends on many parameters such as crystal chemistry, temperature, pressure, and H2O activity. In general, the relationship of certain defects with respect to major and trace element contents often shows a clear correlation with Al, which simply reflects that Al is the dominant element involved in coupled substitutions in clinopyroxenes, and not necessarily that Al is directly involved in the defect; therefore, it is difficult to attribute defects in natural samples (Gies et al., 2024). Additionally, The DFT results in Table 1 of Balan et al. (2020) for diopside show that similar defects involving different M3+ cations (e.g. Al3+, Fe3+, Cr3+, Ti3+, Sc3+) have a different pleochroism because the infrared absorption indicatrices are oriented differently depending on the cation involved. The position of the OH-stretching mode for each M3+ also shifts slightly as a function of the local atomic environment (e.g. changes in O–H bond length and nearby cations), causing small but systematic differences in wavenumber positions between different trivalent cations (Table 1, Balan et al., 2020). The measured absorption is therefore the sum of all of these infrared indicatrices, each contributing with different intensities and orientations. Since the wavenumber position of all these defects are still very close together, the resulting observed absorption bands are often broad Gaussian-like peaks or are asymmetric, as can be seen in clinopyroxenes with T-site OH defects involving Al3+, Fe3+, and potentially Cr3+ (Figs. 8 and 11). The symmetry and distribution of all the present defects produce a single absorption figure, which can be recognised in the angular polarised measurements. As a result, the correlation of quantified H2O contents with major and trace elements contents, such as the frequently observed clear correlation with Al, is not diagnostic and simply reflects that Al is the dominant element involved in coupled substitutions in clinopyroxenes (Gies et al., 2024).
5.4 Measurement protocols to obtain total integrated absorption in clinopyroxene
The quantification of H2O content of homogeneous, anisotropic samples can, principally, be done in bulk with unpolarised spectra (see Fig. C3, Sambridge et al., 2008; Kovács et al., 2008) if certain criteria are satisfied. However, with zoned samples showing crystal-preferred orientation (CPO) and contaminated samples resulting in H2O broadband contribution to the spectra, this approach should not be applied. A key point is also the choice of the baseline correction and the used range of integration, which need to be consistent across a set of investigated samples to ensure comparability (Ferriss et al., 2016). The use of unoriented and unpolarised measurements and the uncertainty of the calibration coefficients furthermore lead to a dispersion of the calculated H2O content, potentially masking a clear correlation between H2O content and other compositional data.
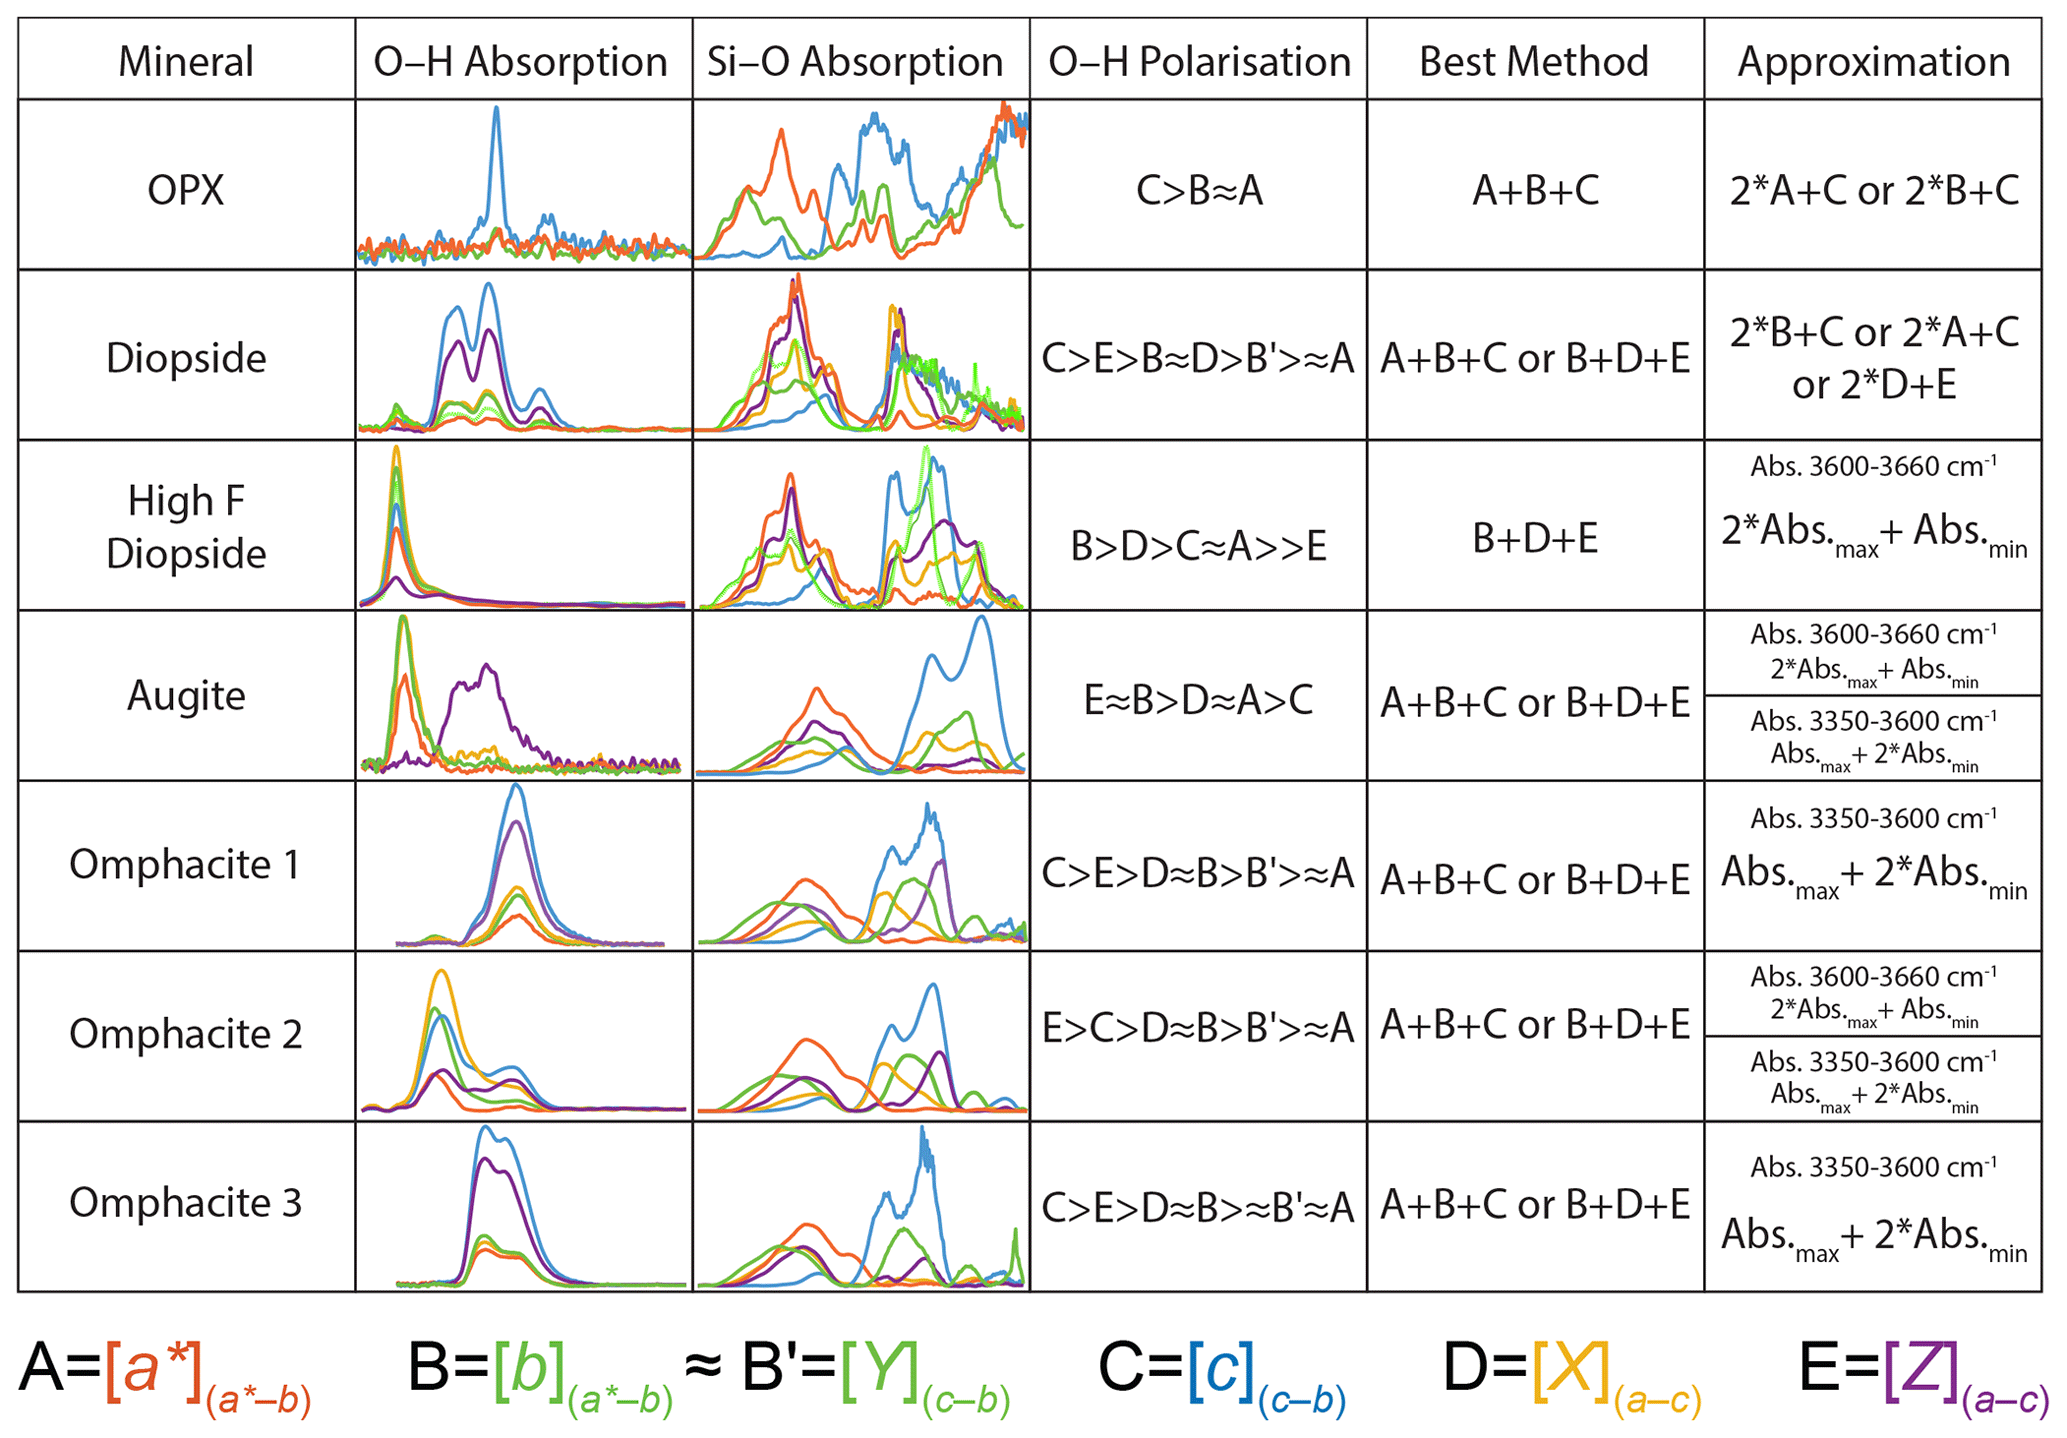
Figure 16Summary of representative commonly observed spectral endmember patterns in the O–H and Si–O region for different minerals, showing their polarisation behaviour, as well as the proposed best set of three perpendicular sections to calculate the total integrated absorbance. Alternative approximations are proposed in case information for only two endmembers is obtainable.
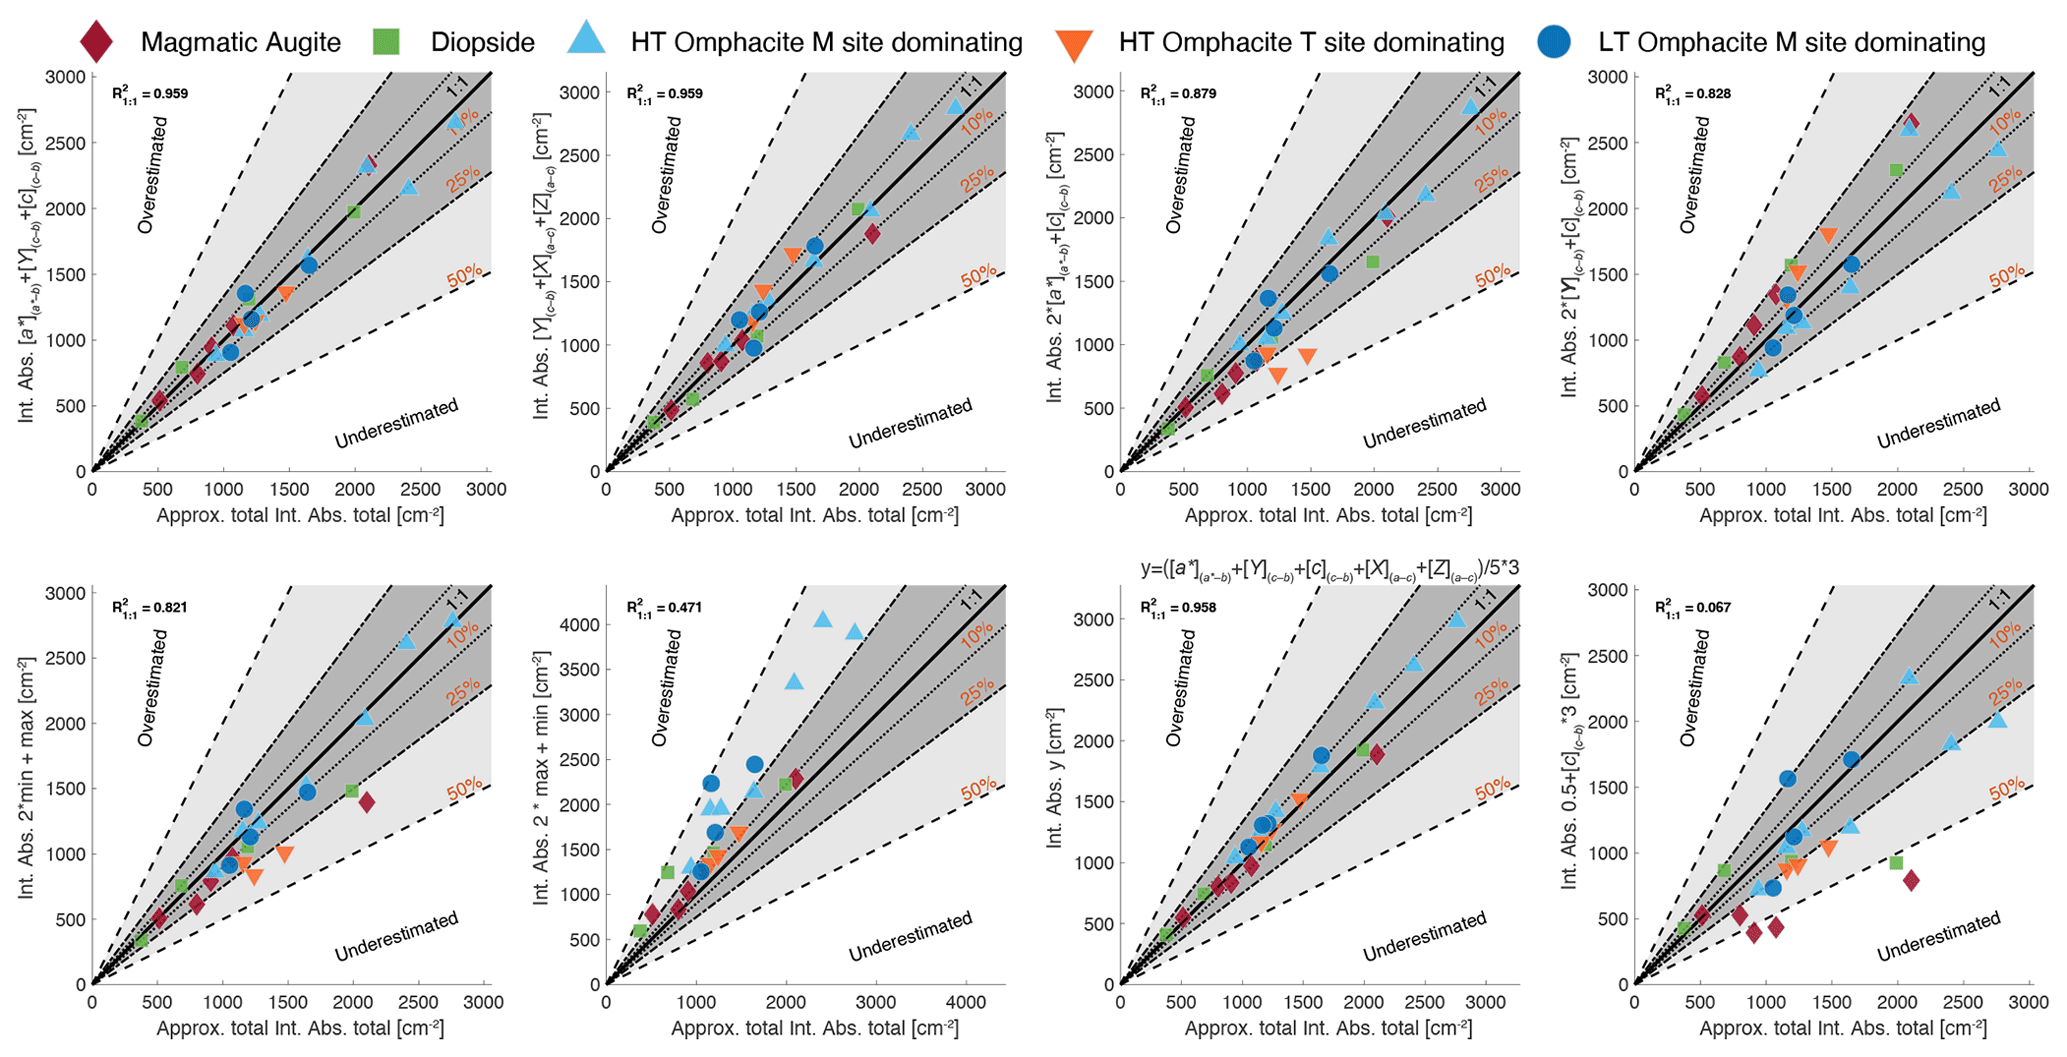
Figure 17Comparison of different methods to estimate the total integrated absorbance (y axes) with the approximated integrated absorbance (approx. total int. abs. total = on the x axes). Different clinopyroxene types are displayed with different symbols. The total integrated absorbance calculated using all spectral endmembers is in good agreement with the results obtained by the combination of (top left) or (top row second from left). Additionally, for some samples with known polarisation behaviour, additional approximations can be employed, resulting in a deviation of less than 10 % (e.g. or [Y](b–c))+[c](b–c), min + 2 × max, or 2 × min + max; see text for details).
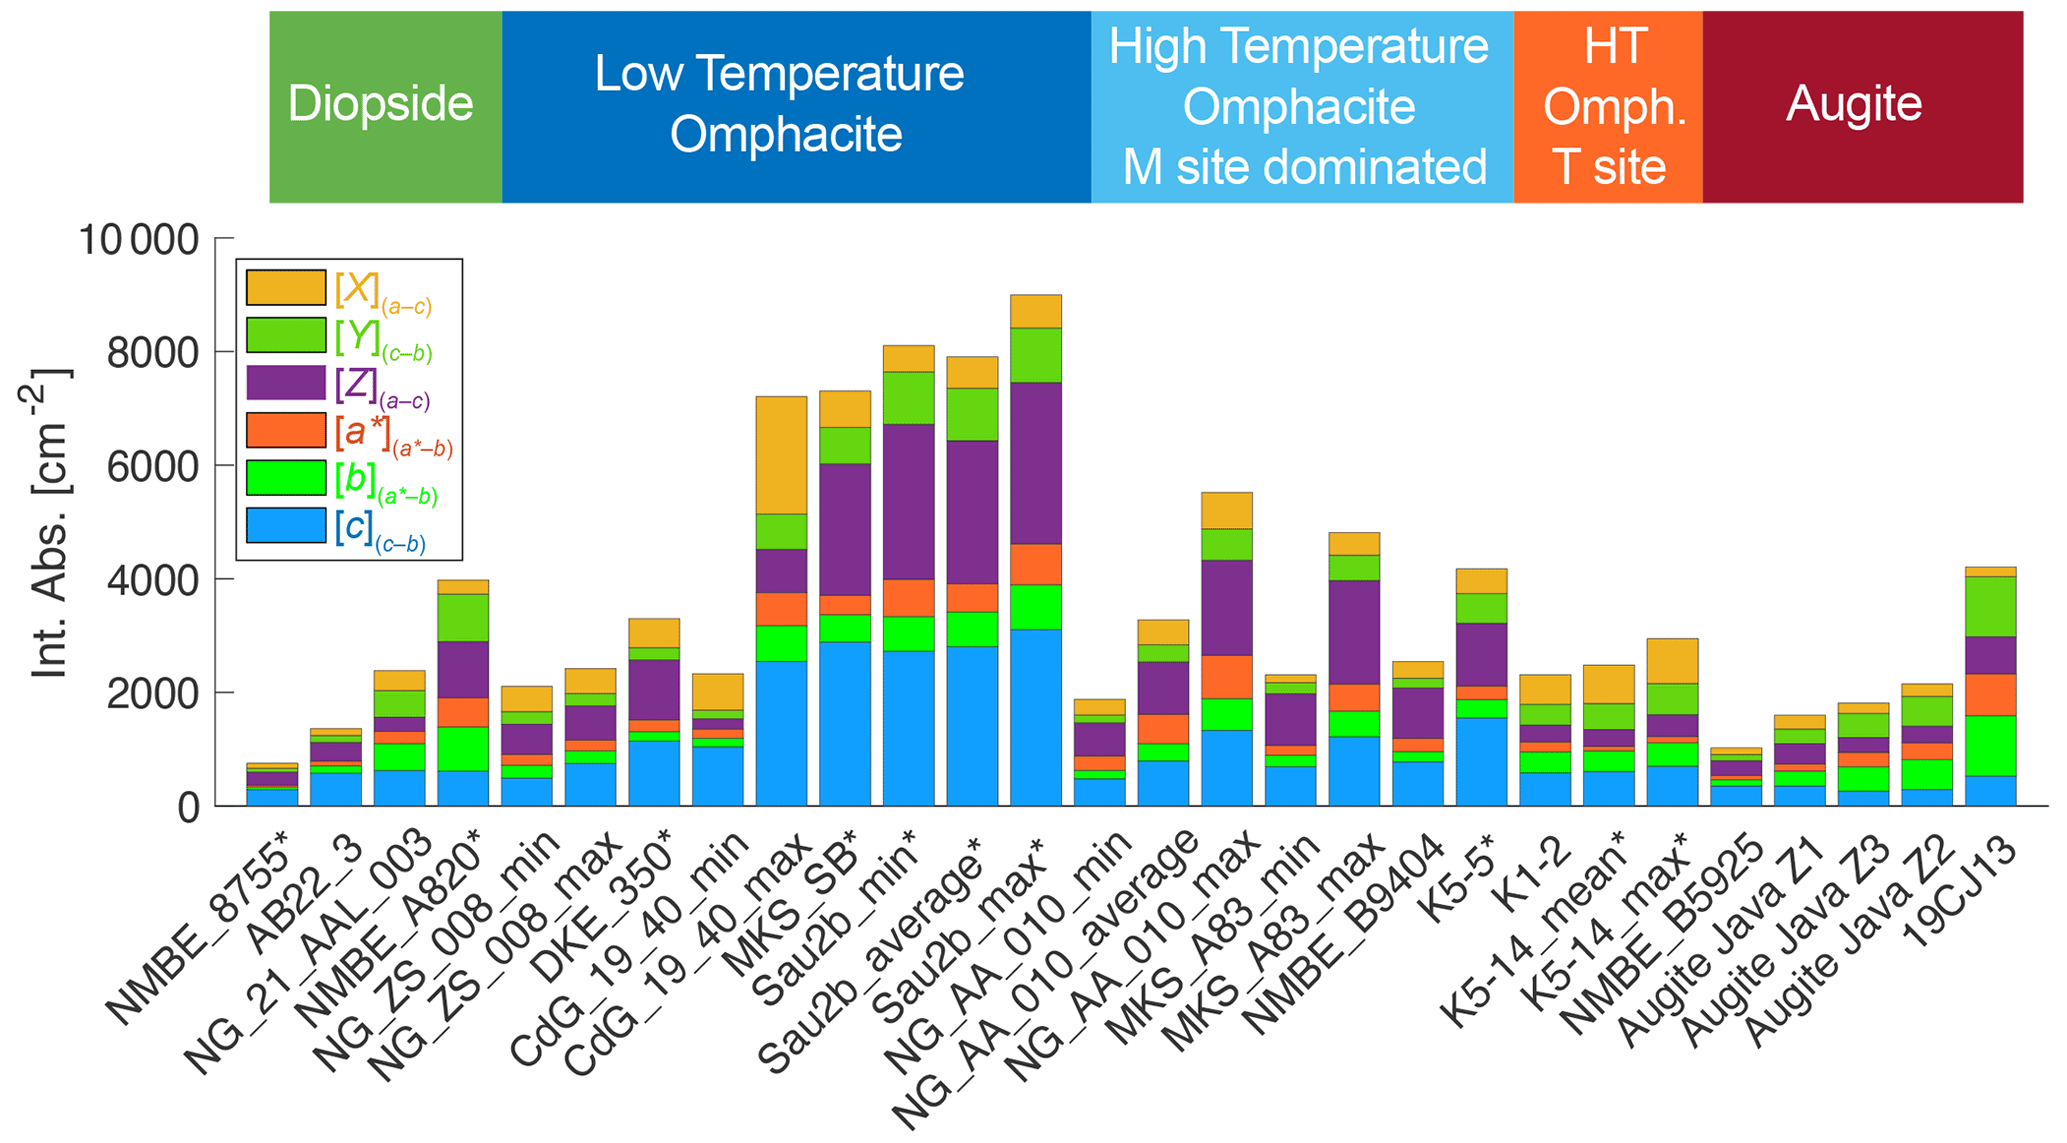
Figure 18Comparison of the integrated absorbance in the O–H region for the different samples investigated in this work. * indicates samples where could not be identified, and [Y](b–c) was used instead of .
The ideal sections to measure the spectra containing maximum and minimum absorbance, required to obtain the total absorbance cannot, in principle, be determined before the measurement of a specific sample. If the goal is to obtain the best possible measurement for the total absorbance, two cuboids containing [a*], , [c](c–b) and [Y](c–b), [X](a–c). [Z](a–c) need to be prepared. More practical is the approach presented here, where maximum and minimum absorption directions are determined using morphological, optical, and overtone characteristics of clinopyroxene. With maximum polarised measurements and the identified spectral endmembers, it is possible to statistically test for homogeneity and obtain information about the polarisation behaviour of different defects or defect families. This approach also accounts for effects in monoclinic and triclinic crystals where the direction of the principal direction of absorption of specific defects and their corresponding absorption bands does not always coincide with either the crystallographic or the principal refractive index directions (see Dowty, 1978; Strens et al., 1982; Libowitzky and Rossman, 1996).
Theoretically, polarised measurements along any three mutually perpendicular sections can be used to obtain the total absorbance. Thus, the sums of polarised absorption along [a*], [c](c–b) (A + B + C) and along [Y](c–b), [X](a–c). [Z](a–c) (B + D + E) are theoretically equivalent. Practically, it is advantageous to choose the orientation where maximum and minimum absorption occurs. The reason for this is that, when the measurement orientation deviates significantly from the maximum O–H absorption, small misorientations will result in a larger uncertainty of the absorption (Fig. 2) and, hence, total absorbance. Additionally, maximum and minimum absorption are helpful in the determination of the defect type, information that is lost when intermediate sections are studied.
To help identify suitable grains and endmember spectra during the measurements of different types of pyroxenes, the spectral endmembers in the O–H and Si–O overtone region and their OH polarisation behaviour were compiled in Fig. 16. Furthermore, the use of available textural (e.g. core vs. rim) and other information (e.g. colour, chemical data) in combination with the presented endmember approach allows us to subdivide the data set and to find the spectral endmembers for each group. This enables us to quantify the H2O content of inhomogeneous samples (with distinguishable zones) for all groups individually and generates much more detailed information on the variation in the H2O content of a given sample. For samples with a CPO, spectra can be measured in multiple thick sections of different orientations to obtain all needed spectral endmembers. The combination of all the spectra can then be used to classify the endmembers (also in different zones), which are then used for H2O quantification. In addition, it is possible to compare the differences not only in H2O content but also in the absorption spectra of the different OH-related defects (Fig. 15). Thus, it is possible to study incorporation mechanisms in the context of their spatial distribution and absorption anisotropy, which provides significantly more information than previous measurement methods.
For pyroxenes, the combination of [a*], or [Y](c–b), [c](c–b) is feasible with samples that allow the use of morphologic information for orientation (e.g. cleavage or habitus) or where it is possible to use a big-data-polarised FTIR approach to identify the orthogonal Si–O spectral endmembers [a*], , [c](c–b). Large inclusion-free grains; thick sections containing randomly oriented grains; or multiple prepared sections of a sample with CPO, containing all endmembers, are ideal for the combination of [Y](c–b), [X](a–c). [Z](a–c) if either [X](a–c) or [Z](a–c) is distinguishable in the spectral Si–O endmember or if the axes of the optical indicatrix are identifiable with optical microscopy.
It is not always possible to discriminate between and [Y](b–c) spectra with an Si–O overtone region endmember-finding approach because there is very little difference between spectra in any orientation taken to be polarised with the electric vector parallel Y. However, it is possible to distinguish and [Y](b–c) when the +90° polarised spectrum is a pure endmember spectrum of either [a*] or [c](b–c). Fortunately, for all clinopyroxenes, the deviation between the total integrated absorbance is very similar for [Y](b–c) and , and, therefore, any mixture of [Y](b–c) and can be used as [Y](b–c) + with little effect on the estimate of the calculated O–H absorbance. Therefore, for clinopyroxenes, the discrimination between [Y](b–c) and can be neglected for H2O quantification but is important when investigating OH incorporation mechanisms.
To illustrate the effect of using different sets of three perpendicular sections, the total integrated absorbance was calculated employing Eq. (6) using the baseline-corrected endmember spectra to account for pyroxenes with M- and T-site defects (see previous section). Where could not be identified, [Y](b–c) was used instead of . The average deviation for all investigated samples between the total integrated absorbance from the combinations of the orthogonal endmembers or is smaller than 7 %. The maximum observed deviation of the total integrated absorbance and the combination of the orthogonal endmembers or of all investigated samples is <16 % (Fig. 17). Ideally, all identified endmembers should be used to determine the total integrated absorbance because the OH absorption indicatrix is not always aligned with the axis of the optical indicatrix, and, hence, this method gives the smallest measurement errors.
If the endmembers can be identified from a large data set of polarised spectra, 3 times the average of all identified endmembers can be used to determine the total absorbance and further reduce the influence of a misidentified endmember or of the variation across different endmember combinations with regard to the total integrated absorbance. In the investigated samples, and the total integrated absorbance agree within < 12 % (Figs. 17, C11, and C12). This works remarkably well for clinopyroxenes because the dominating absorbance proportions of the endmembers follow the behaviour of either (or ) in samples with dominating M-site defects in the lower wavenumber peaks between 3600–3400 cm−1 or in samples with dominating absorbance in the tetrahedral site in the higher-wavenumber range between 3660–3550 cm−1 (Fig. 18). This is especially important when orienting a clinopyroxene crystal for the estimation of the total integrated absorbance or when investigating defects (Dowty, 1978; Strens et al., 1982). While the orientation [a*], , [c](c–b) or [Y](c–b), [X](a–c). [Z](a–c) does not make a big difference for samples with the highest absorbance parallel to the b axis (as, for example, in mantle pyroxenes), it will have a larger effect for samples with the highest absorbance in [c](b–c), [X](a–c), or [Z](a–c) (Figs. C13 and C14). Therefore, in studies investigating the hydrogen incorporation mechanism or comparing FTIR absorption with other methods of quantifying the water content of a sample to obtain calibration coefficients, it is crucial to follow the recommendations of Dowty (1978) in order to obtain a full description of the sample's absorption anisotropy and thus the determination of total integrated absorbance with the smallest measurement error.
In addition to the use of the previously presented combinations of spectral endmembers, it is possible for some samples to obtain single-spot H2O contents if the section is in a special orientation. For that, the polarisation behaviour of the OH-related defects and the grain orientation must be known. Once the polarisation behaviour of a sample is well understood and the maximum and minimum absorbances are known, additional combinations of endmembers can be used together with an orientation factor to approximate the total integrated absorbance (e.g. Hu et al., 2026).
If the integrated absorbance is significantly higher in one direction and nearly equal in the corresponding two orthogonal directions, as shown in Giuliani et al. (2025) for olivine ( or ) or presented here for magmatic and metamorphic pyroxenes, two polarised measurements can be combined to estimate the total integrated absorbance (e.g. ). This can, however, only be applied for mineral grains in an orientation with the spectral endmember needed for the quantification in the section or orientations with known orientation factors. Interestingly, in the data set investigated here, using the endmember with the lowest integrated absorbance twice plus the endmember with the highest integrated absorbance works well for omphacitic and diopside-rich clinopyroxene samples (Fig. 16). Conversely, using the endmember with the lowest integrated absorbance twice plus the endmember with the lowest integrated absorbance works best for augitic/magmatic clinopyroxenes.
-
Automatic acquisition and processing of all polarisation angles in multiple spots allow for detailed investigation of the anisotropy of OH bands in minerals, H incorporation mechanisms, and their corresponding H2O contents.
-
Si–O overtones allow quick identification of suitable grains for quantification of O–H absorption bands of clinopyroxene and orthopyroxene or other anisotropic minerals.
-
Spectra of grains with the same Si–O overtones allow a quantitative comparison of O–H absorbance and thus can help to investigate inhomogeneities within a sample.
-
Using the spectral endmembers of multiple grains allows quantification of H2O contents in distinguishable zones, gives a precise estimation of H2O content, and can help to reveal the polarisation behaviour of different absorbance bands caused by O–H-related defects. In combination with theoretical DFT modelling, this provides a powerful tool to determine different families of OH defects in low-symmetry minerals.
-
In clinopyroxenes, the combination of different orthogonal Si–O endmember spectra, either recognised by an endmember-finding approach or oriented (optically or morphologically), can be used to determine the total integrated absorbance and, thus, H2O quantification.
-
This work provides a framework to investigate the H incorporation mechanism in clinopyroxene (or other monoclinic or triclinic crystals); to acquire more than three independent polarised measurements, which are essential to fully understand and describe the absorption anisotropy; and to understand OH-related defects in low-symmetry crystals.
A1 New Sample Holder
For quartz, the refractive indices are referred to as nϵ and nω with ° and γ=120°. The crystallographic a axis and the refractive indices nϵ lie in the plane perpendicular to c, corresponding to nω. In crystal sections parallel to (010) and (100), both nω and nϵ are present. In a section parallel to (001), nω is present in both directions, and the section appears to be isotropic.
A2 Gem-quality quartz
From the centre of a macroscopically oriented gemstone quartz crystal with unknown origin, a 640±10 µm cuboid was prepared and attached to a needle inserted into the 3D-printed cuboid holder with an inclination of 54.7° in the direction [111] (Fig. A2a). With a threefold rotation of the needle, each of the three orthogonal faces were positioned horizontally, and orthogonal measurements of all polarisation angles were performed in a single set-up. In the section perpendicular to the c axis, only the refractive index nω is present in the plane. In the two sections parallel to the c axis, the refractive indices nϵ and nω are present but oriented in perpendicular directions (Fig. A2b).
With only two crystallographic axes, quartz was chosen to demonstrate the simple concepts of oriented polarised FTIR measurements and how they can be used to validate orientation of the sample. Angular polarised spectra were plotted, and the representative bands for Li–OH defects at 3481 cm−1 and Al–OH defects at 3434, 3379, and 3319 cm−1 (Jollands et al., 2020; Stalder, 2021; Stalder et al., 2017) were extracted and plotted into polar figures using the PolPlotModule (Fig. A3). For visualisation purposes, a rubber-band baseline was applied, which removes H2O broadband contribution. Note that, for an accurate quantification, this method might be too conservative and will result in underestimation of the total integrated absorbance (for details on H2O quantification in quartz see Stalder and Konzett, 2012, and Stalder, 2021). The section O1, which has only the refractive index nϵ in the plane, shows only a slight polarisation effect, which is caused by a very small sample misalignment (∼ 10°) that was visible optically, induced by a small deviation during mounting on the needle. The misalignment was caused by the surface tension of the glue while attaching the needle to the [111] corner of the small cuboid. Sections O2 and O3 have nϵ and nω in the plane and show excellent inverse polarisation with a maximum parallel to nω (Fig. A3). The slight remnant of peaks parallel to the refractive index nϵ is also caused by the slight misorientation of the cuboid.
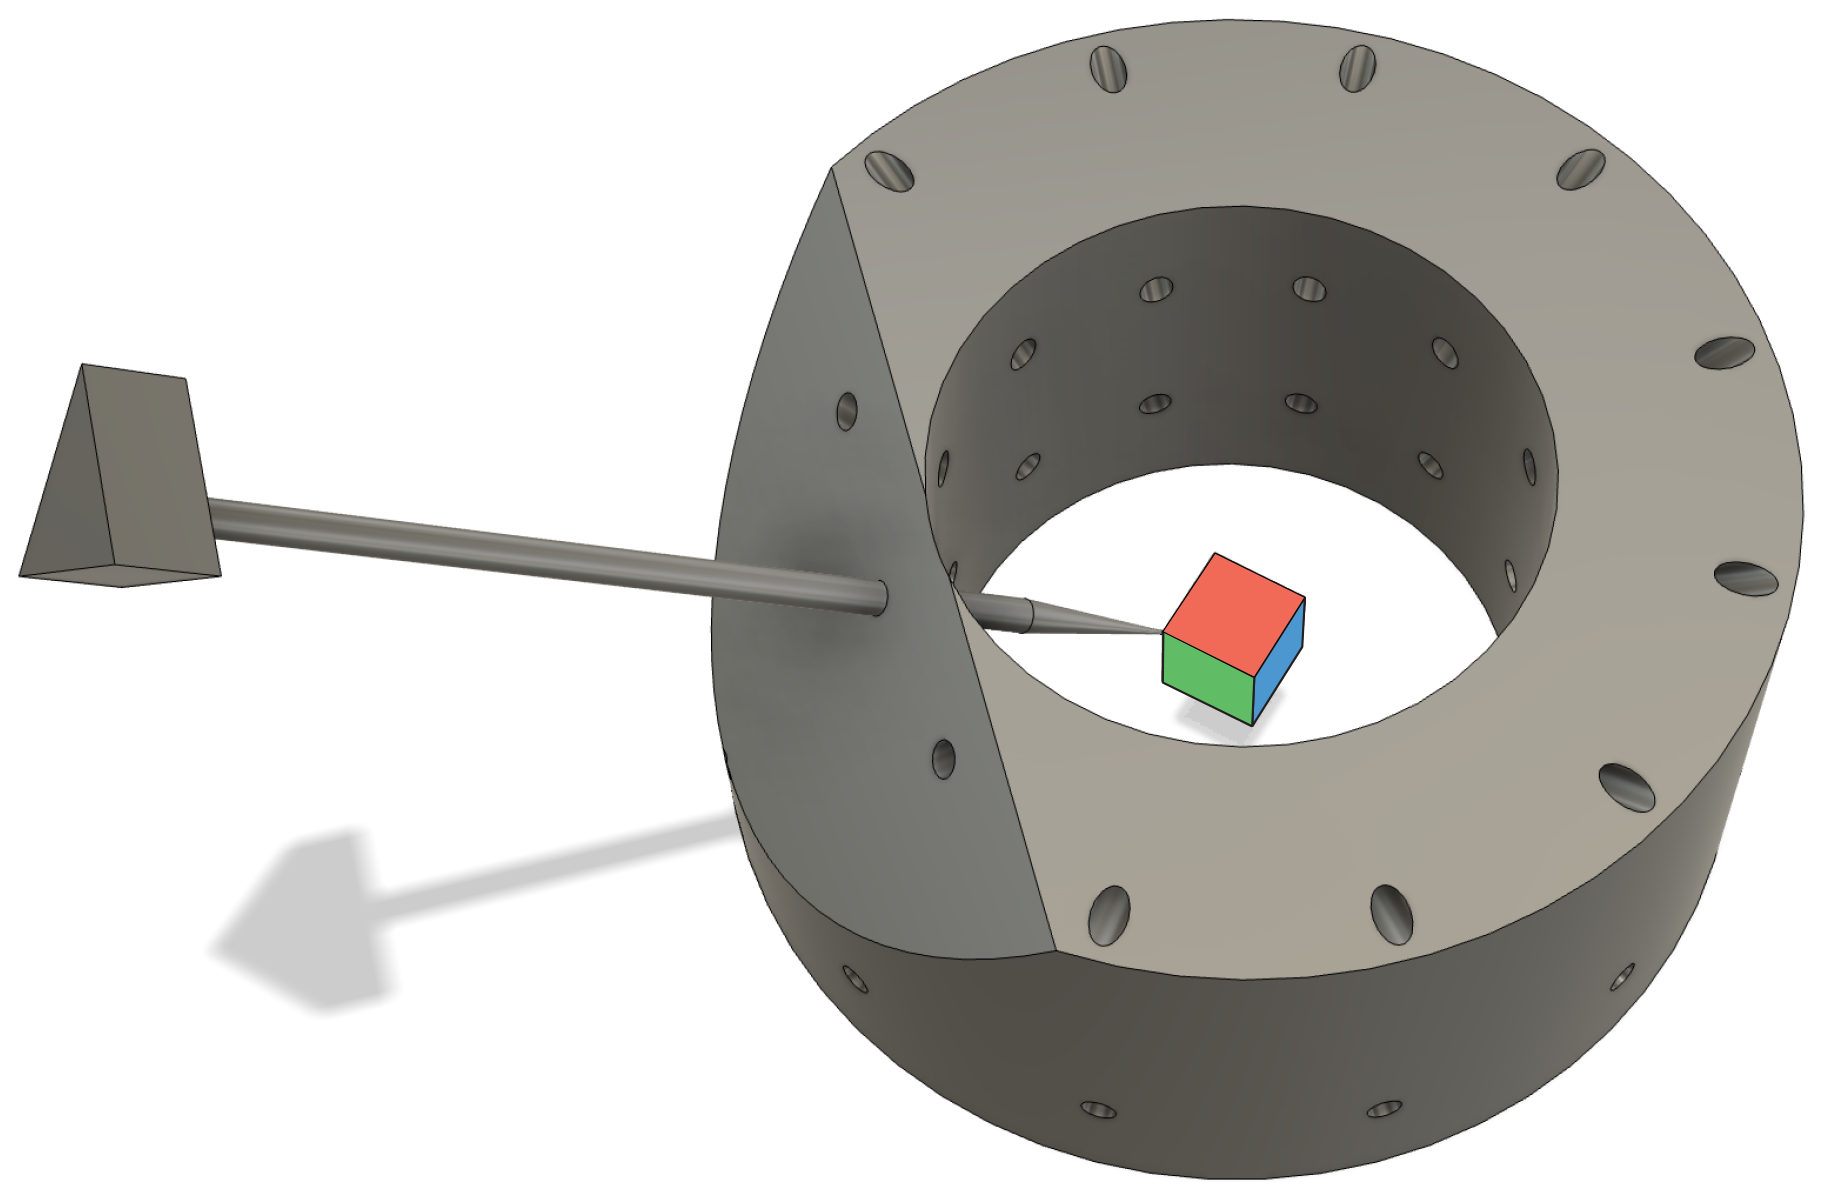
Figure A1New sample holder allowing measurements of a sample in three orthogonal planes for cuboids attached to a needle by a threefold rotation.
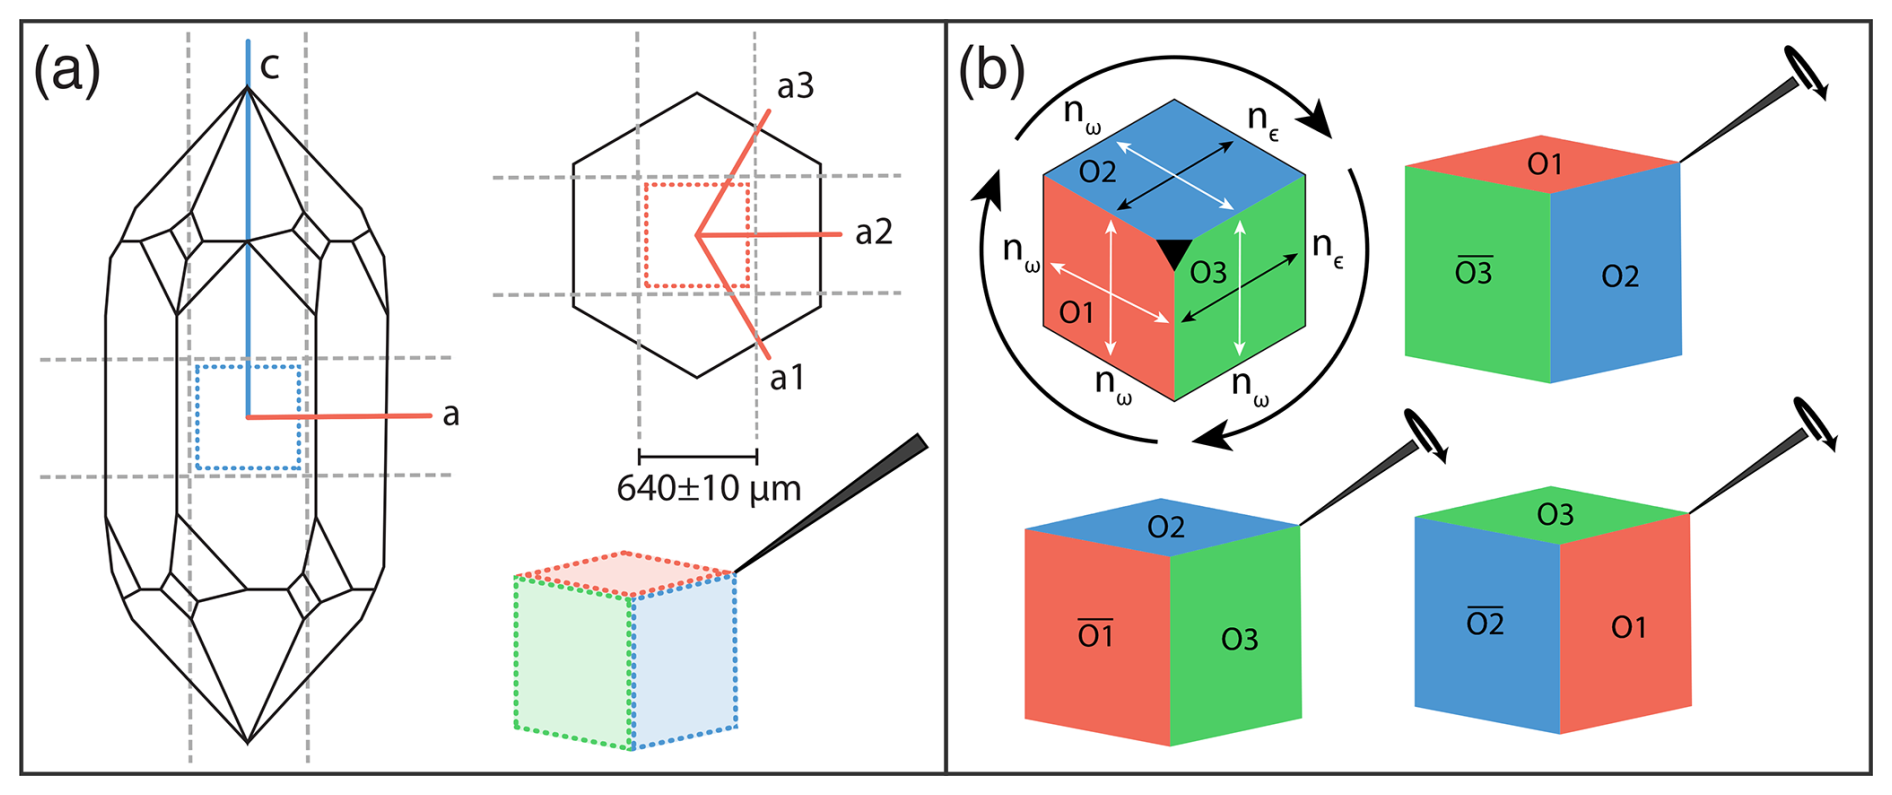
Figure A2(a) Preparation of oriented micro-quartz cuboid, with a size of 640 µm; stippled grey lines mark the cutting planes in the two sections, parallel and perpendicular to the c axis. (b) Orientation sketch of cuboid, with the orthogonal sides O1, O2, and O3 and the refractive indices nϵ and nω attached to a needle inclined at 54.7° [111].
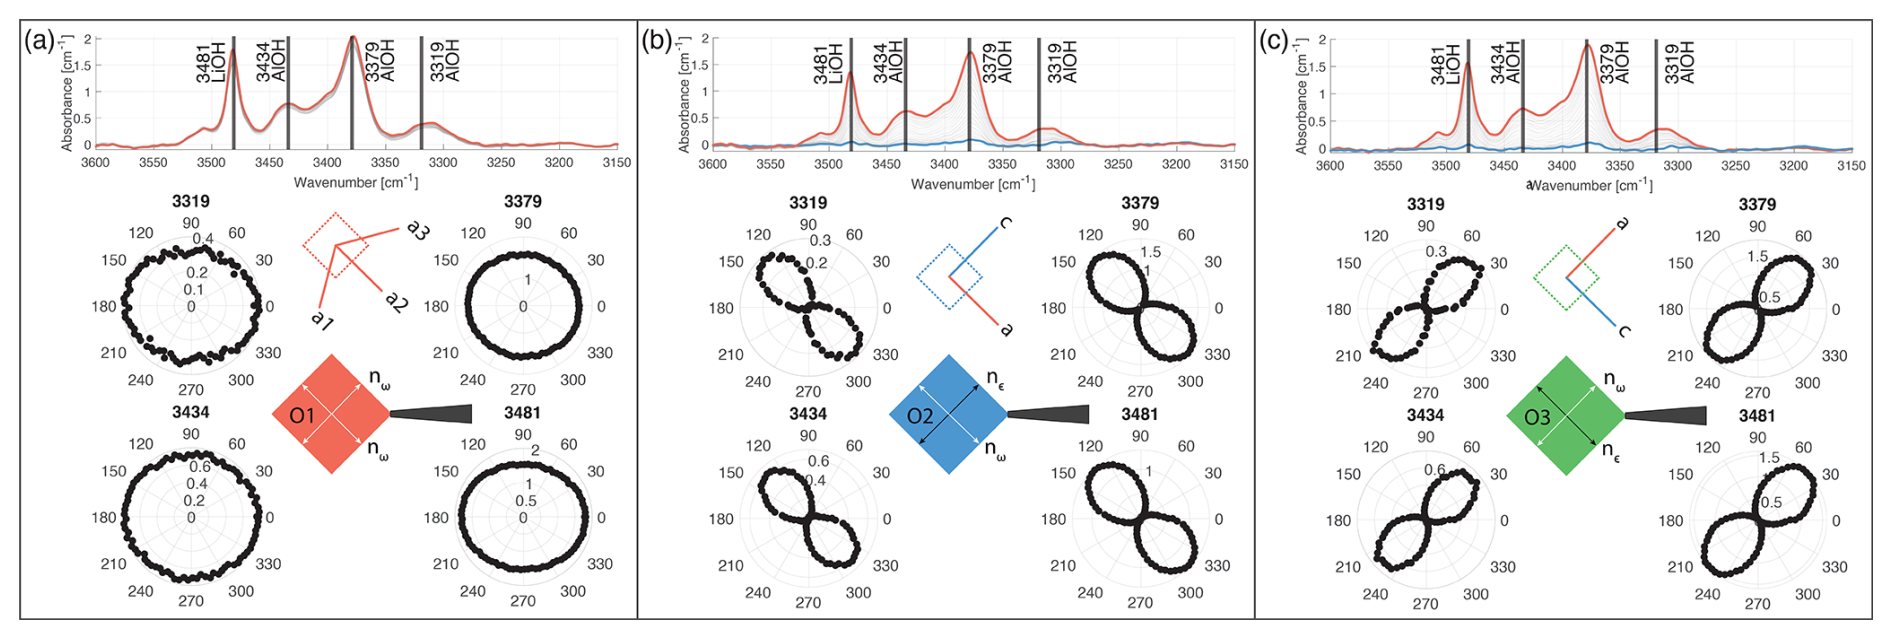
Figure A3Polarised spectra of oriented quartz cuboid acquired with an incremental polarisation change of 4°. The orientation O1 has twice the nω in the plane, whereas O2 and O3 have nϵ and nω in the plane with nϵ oriented parallel to the c axis. Extracted band height of selected bands in a polar plot from 0 to 360° polarisation angle.
B1 EPMA methods
Quantitative mineral chemistry analyses were performed using a JEOL JXA-iSP100 electron microprobe at the University of Bern. Spots were measured with an acceleration voltage of 15 kV and a probe current of 20 nA. The spot size was 2 µm. The measurement time on peak was 20 and 10 s on each background position. The ϕ(ρz) correction was employed on obtained signals, which corrects for the effects of atomic number, absorption, and fluorescence excitation. Synthetic and natural standards (in brackets) were used to calibrate the mass fractions of the following element oxides: SiO2 (orthoclase), Al2O3 (anorthite), CaO (anorthite), K2O (orthoclase), TiO2 (rutile), MnO (pyrolusite), NiO (nickel metal), Cr2O3 (spinel), FeO (almandine), MgO (forsterite), and Na2O (albite).
B2 EPMA results
Table B1Average major element composition of selected representative investigated orthopyroxene and clinopyroxene samples used in this study. Elements below the detection limit are indicated by bdl. Data extracted from EPMA mapping is indicated by *.
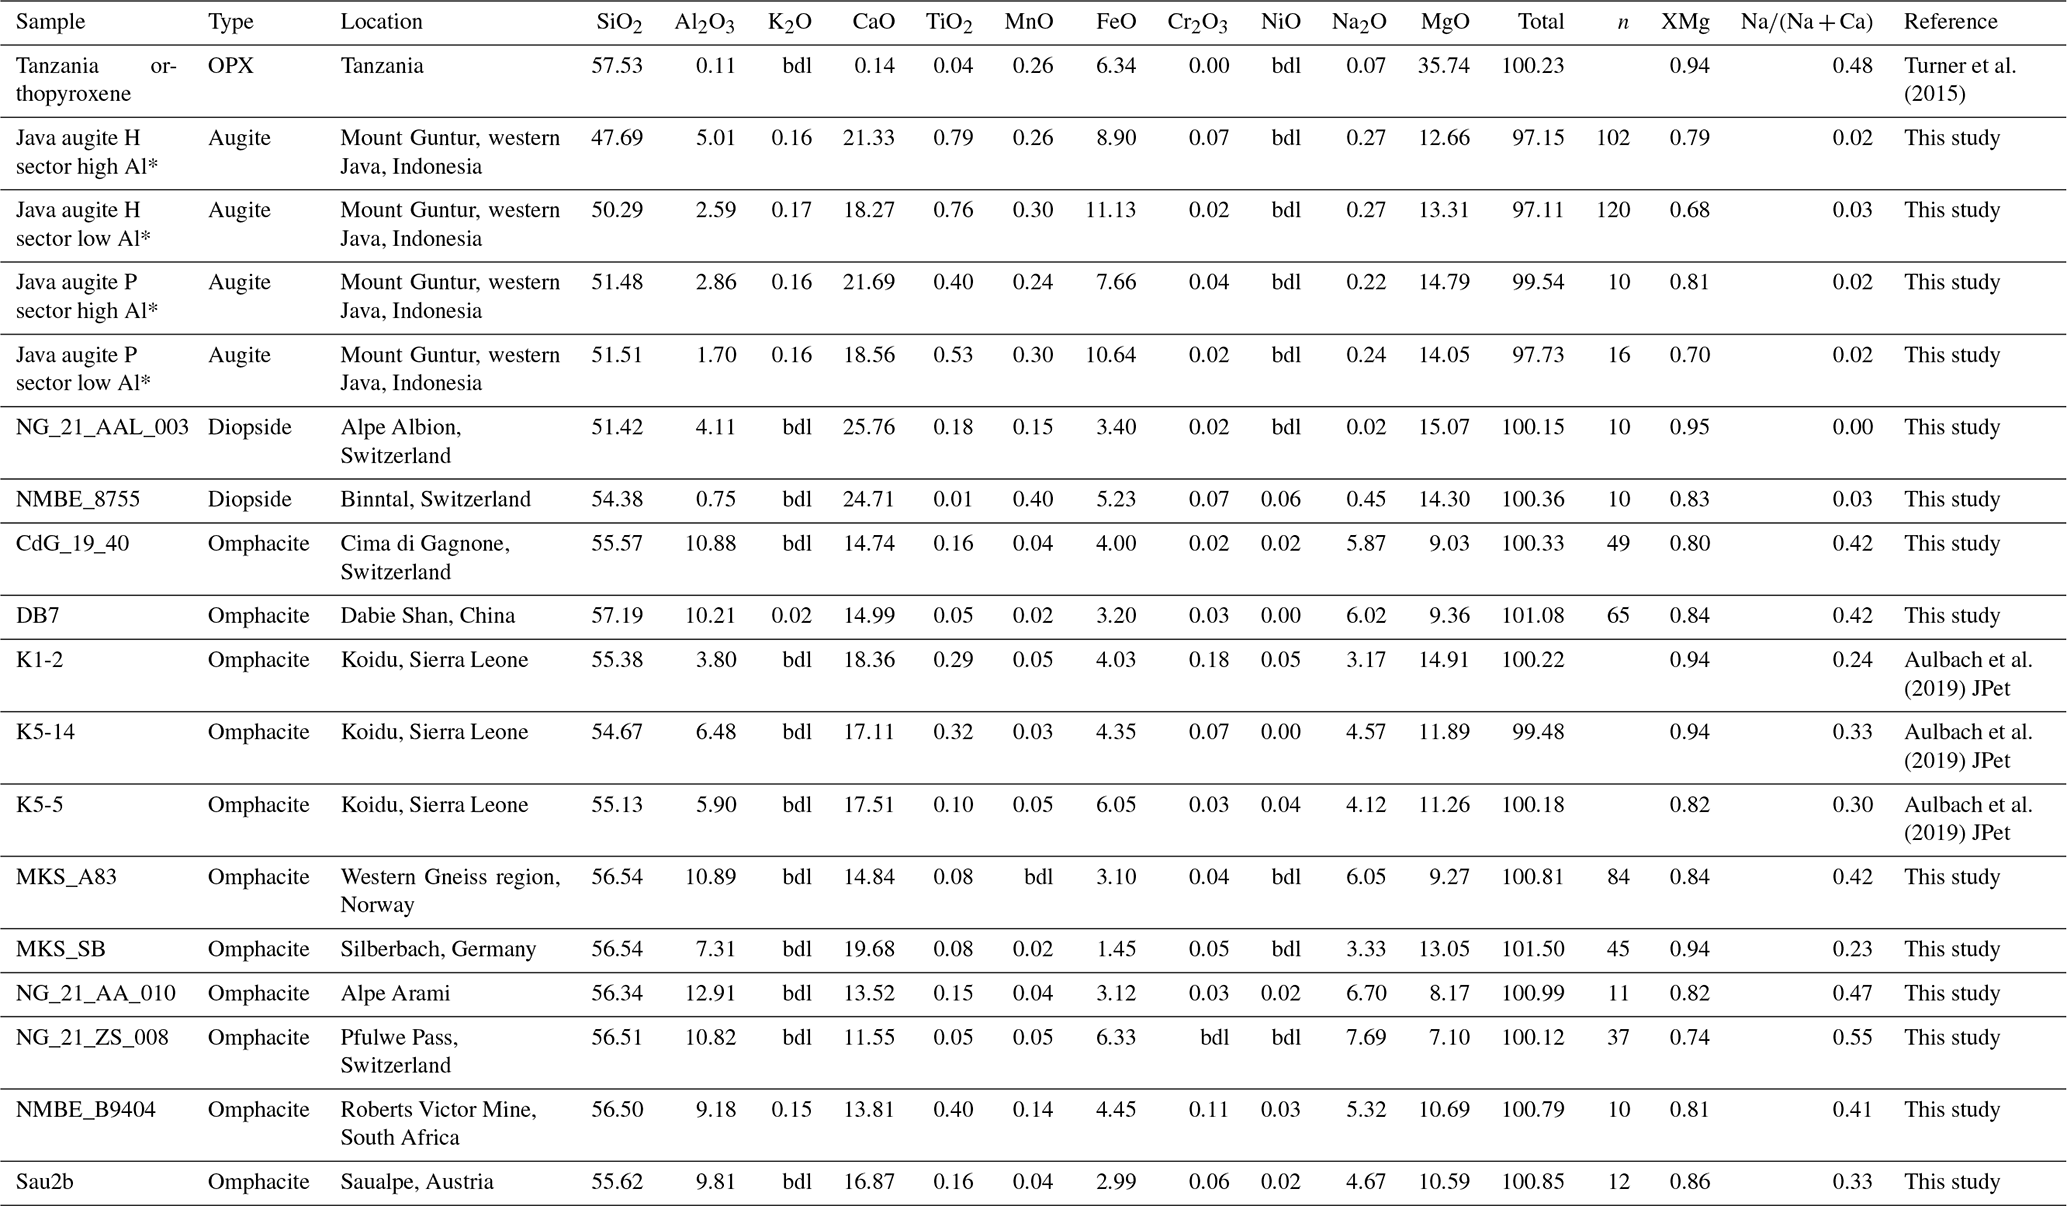
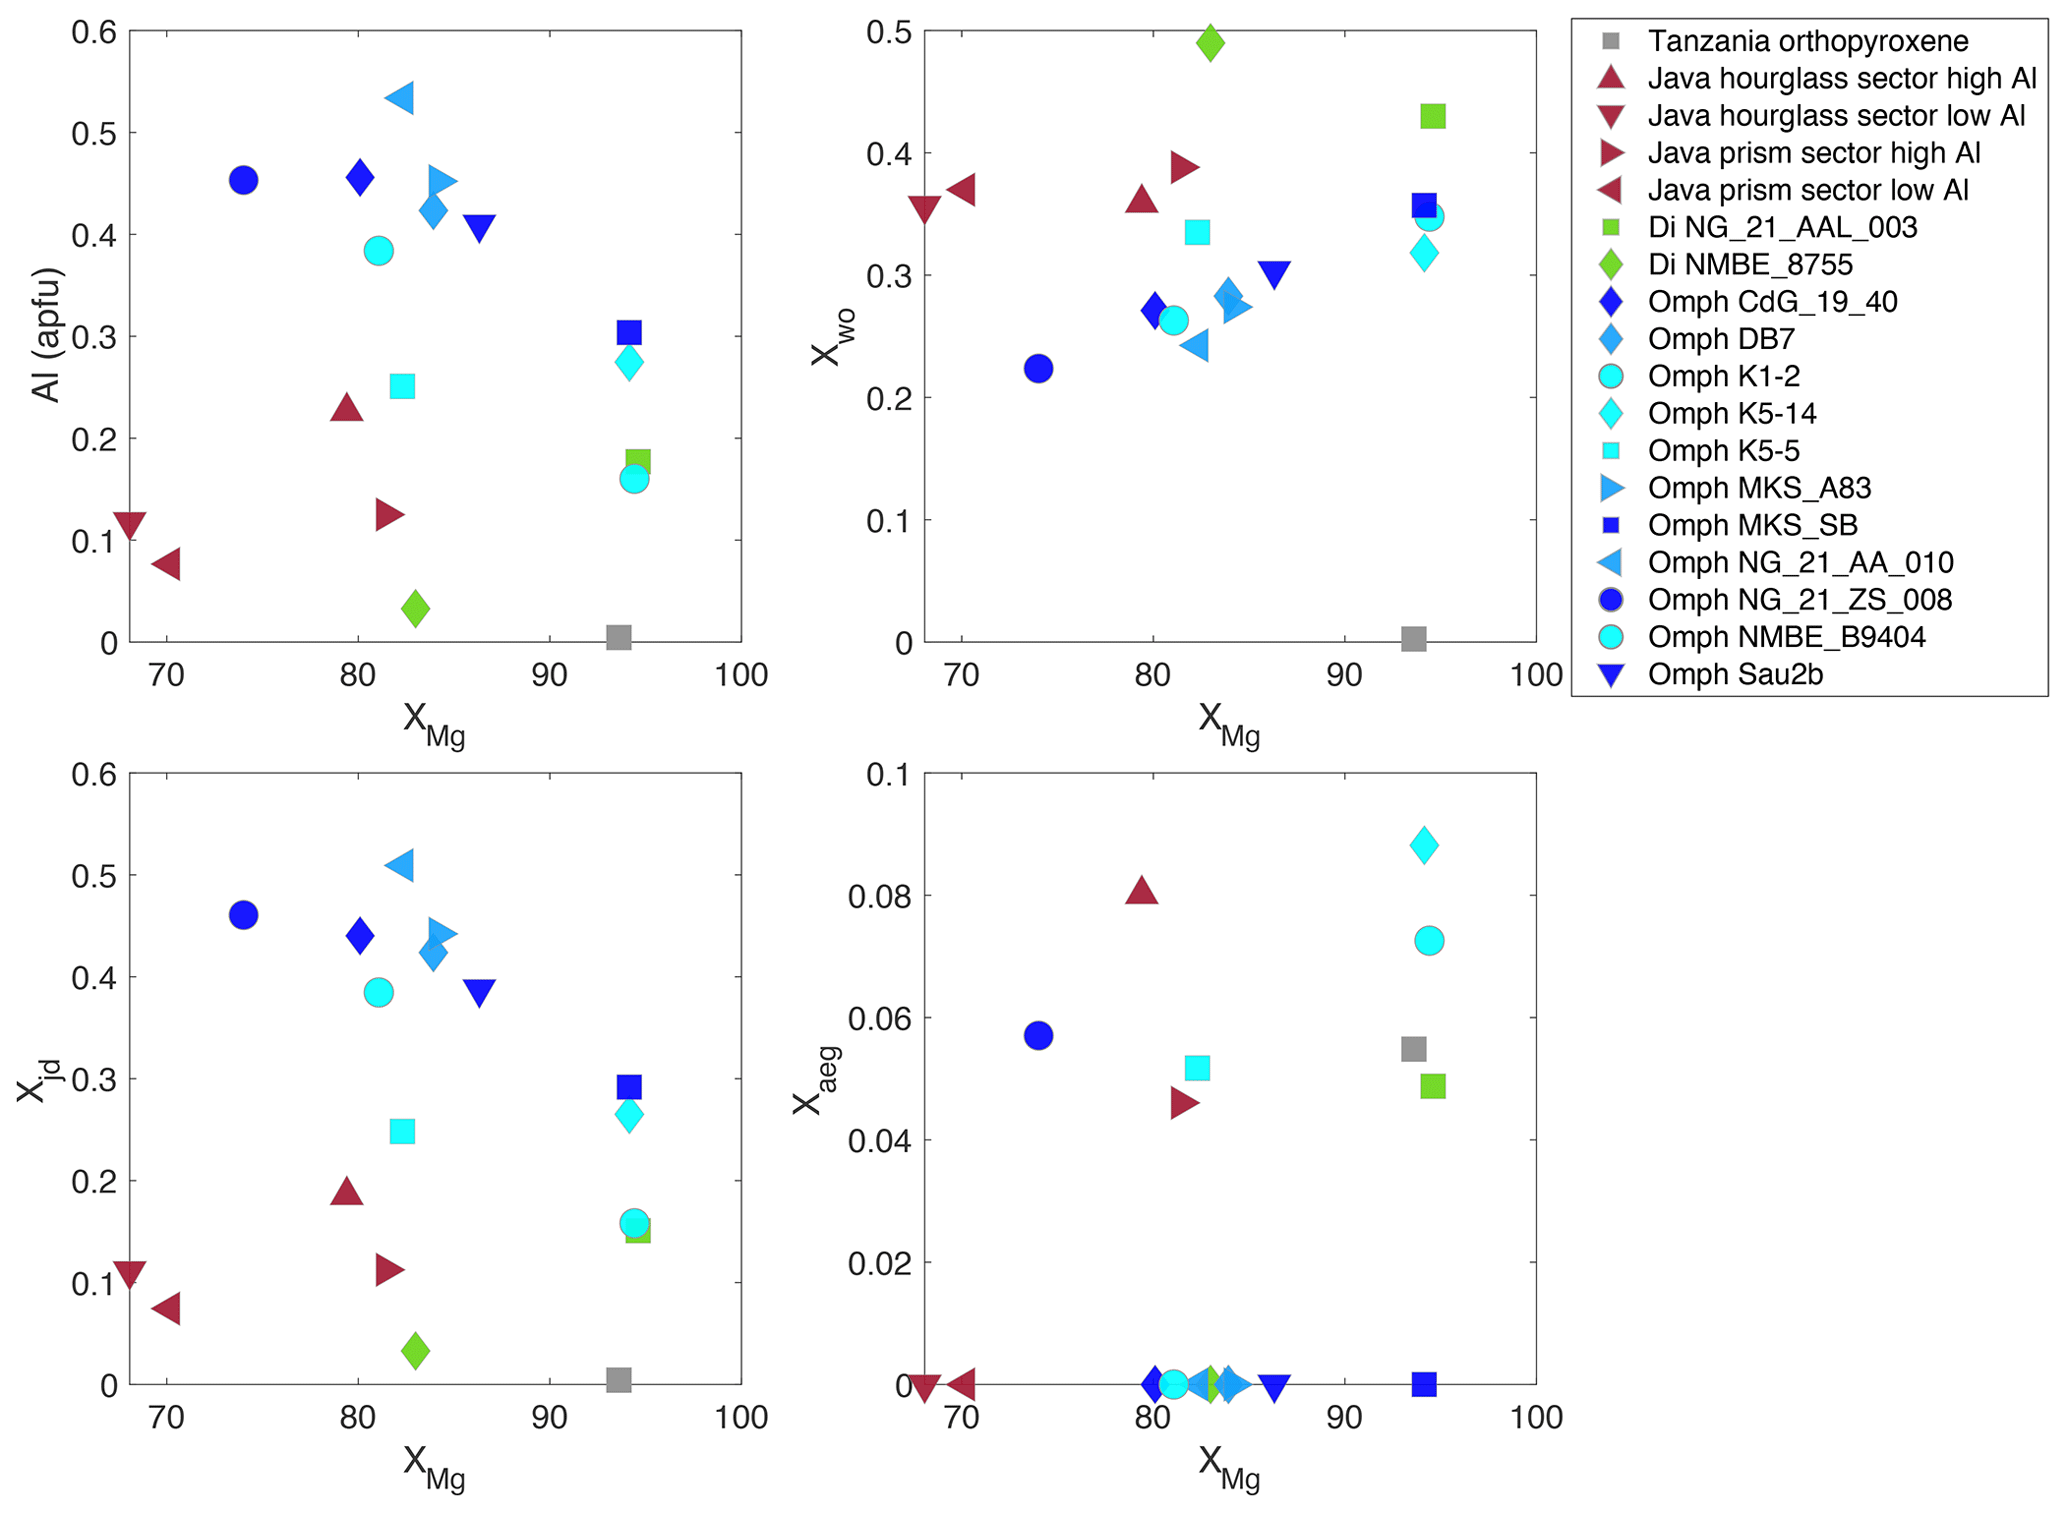
Figure B1Average endmember components of selected representative investigated orthopyroxene and clinopyroxene samples calculated with MinPlotX (Walters and Gies, 2025).
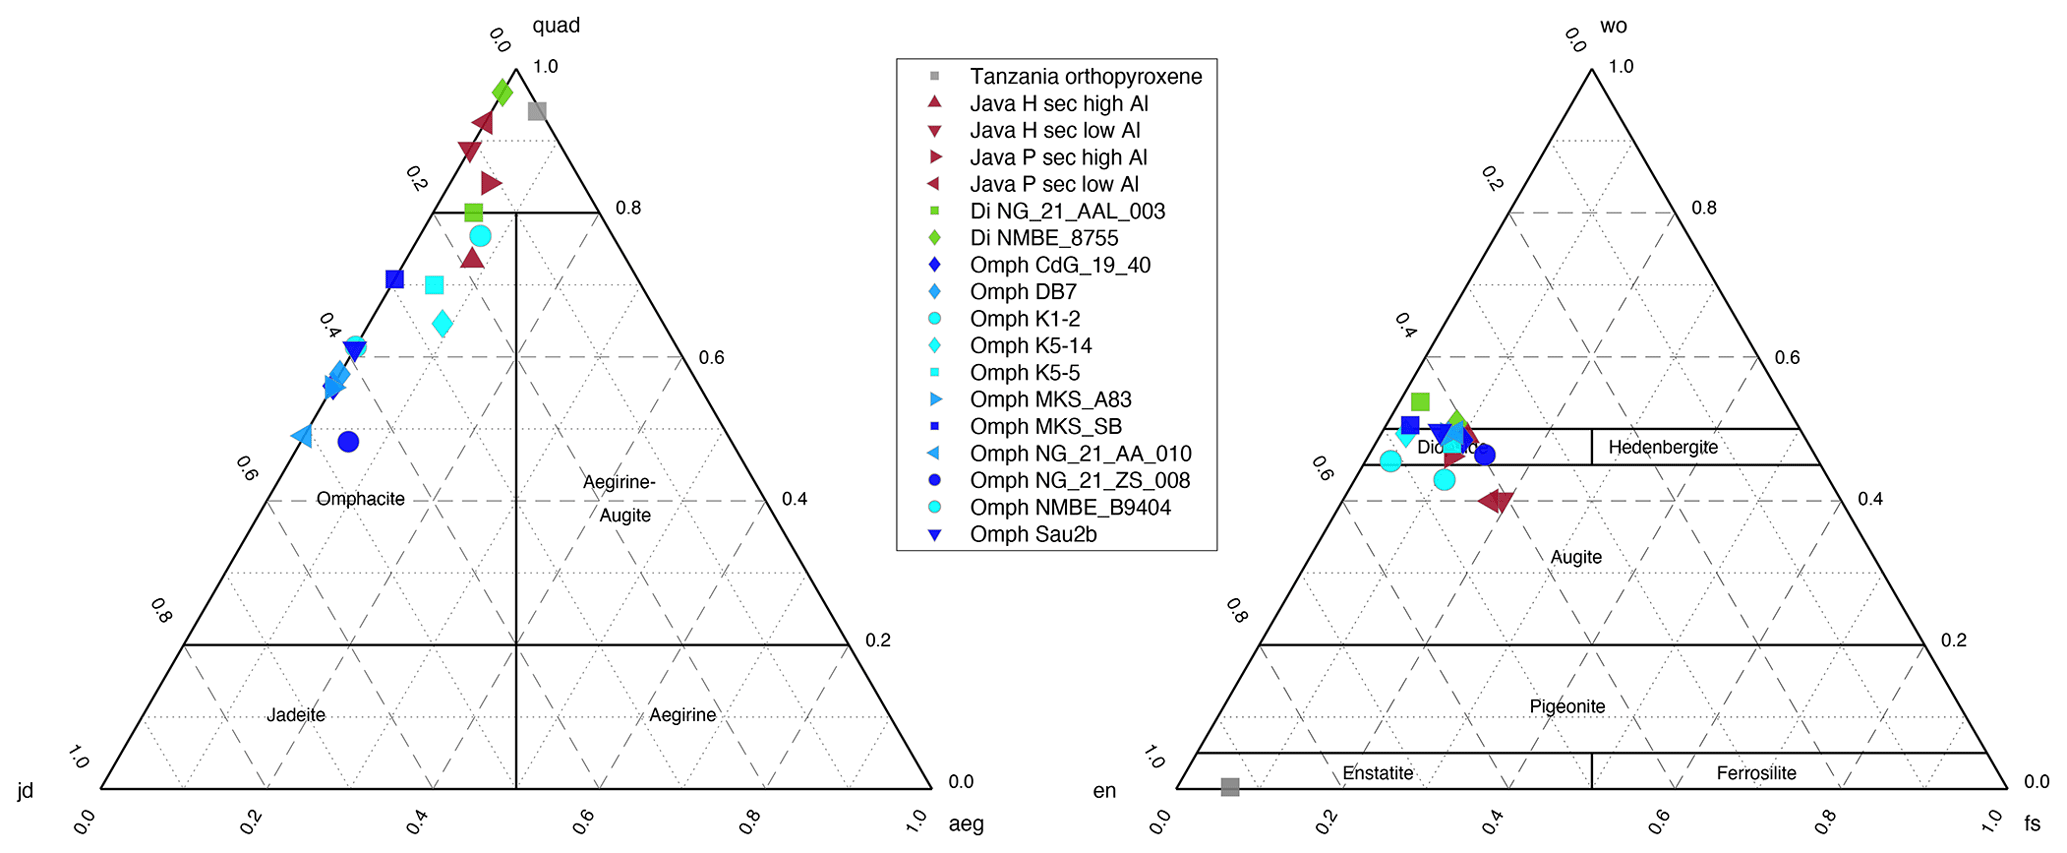
Figure B2Mineral-specific pyroxene discrimination diagrams showing average endmember components of selected representative investigated orthopyroxene and clinopyroxene samples calculated with MinPlotX (Walters and Gies, 2025).
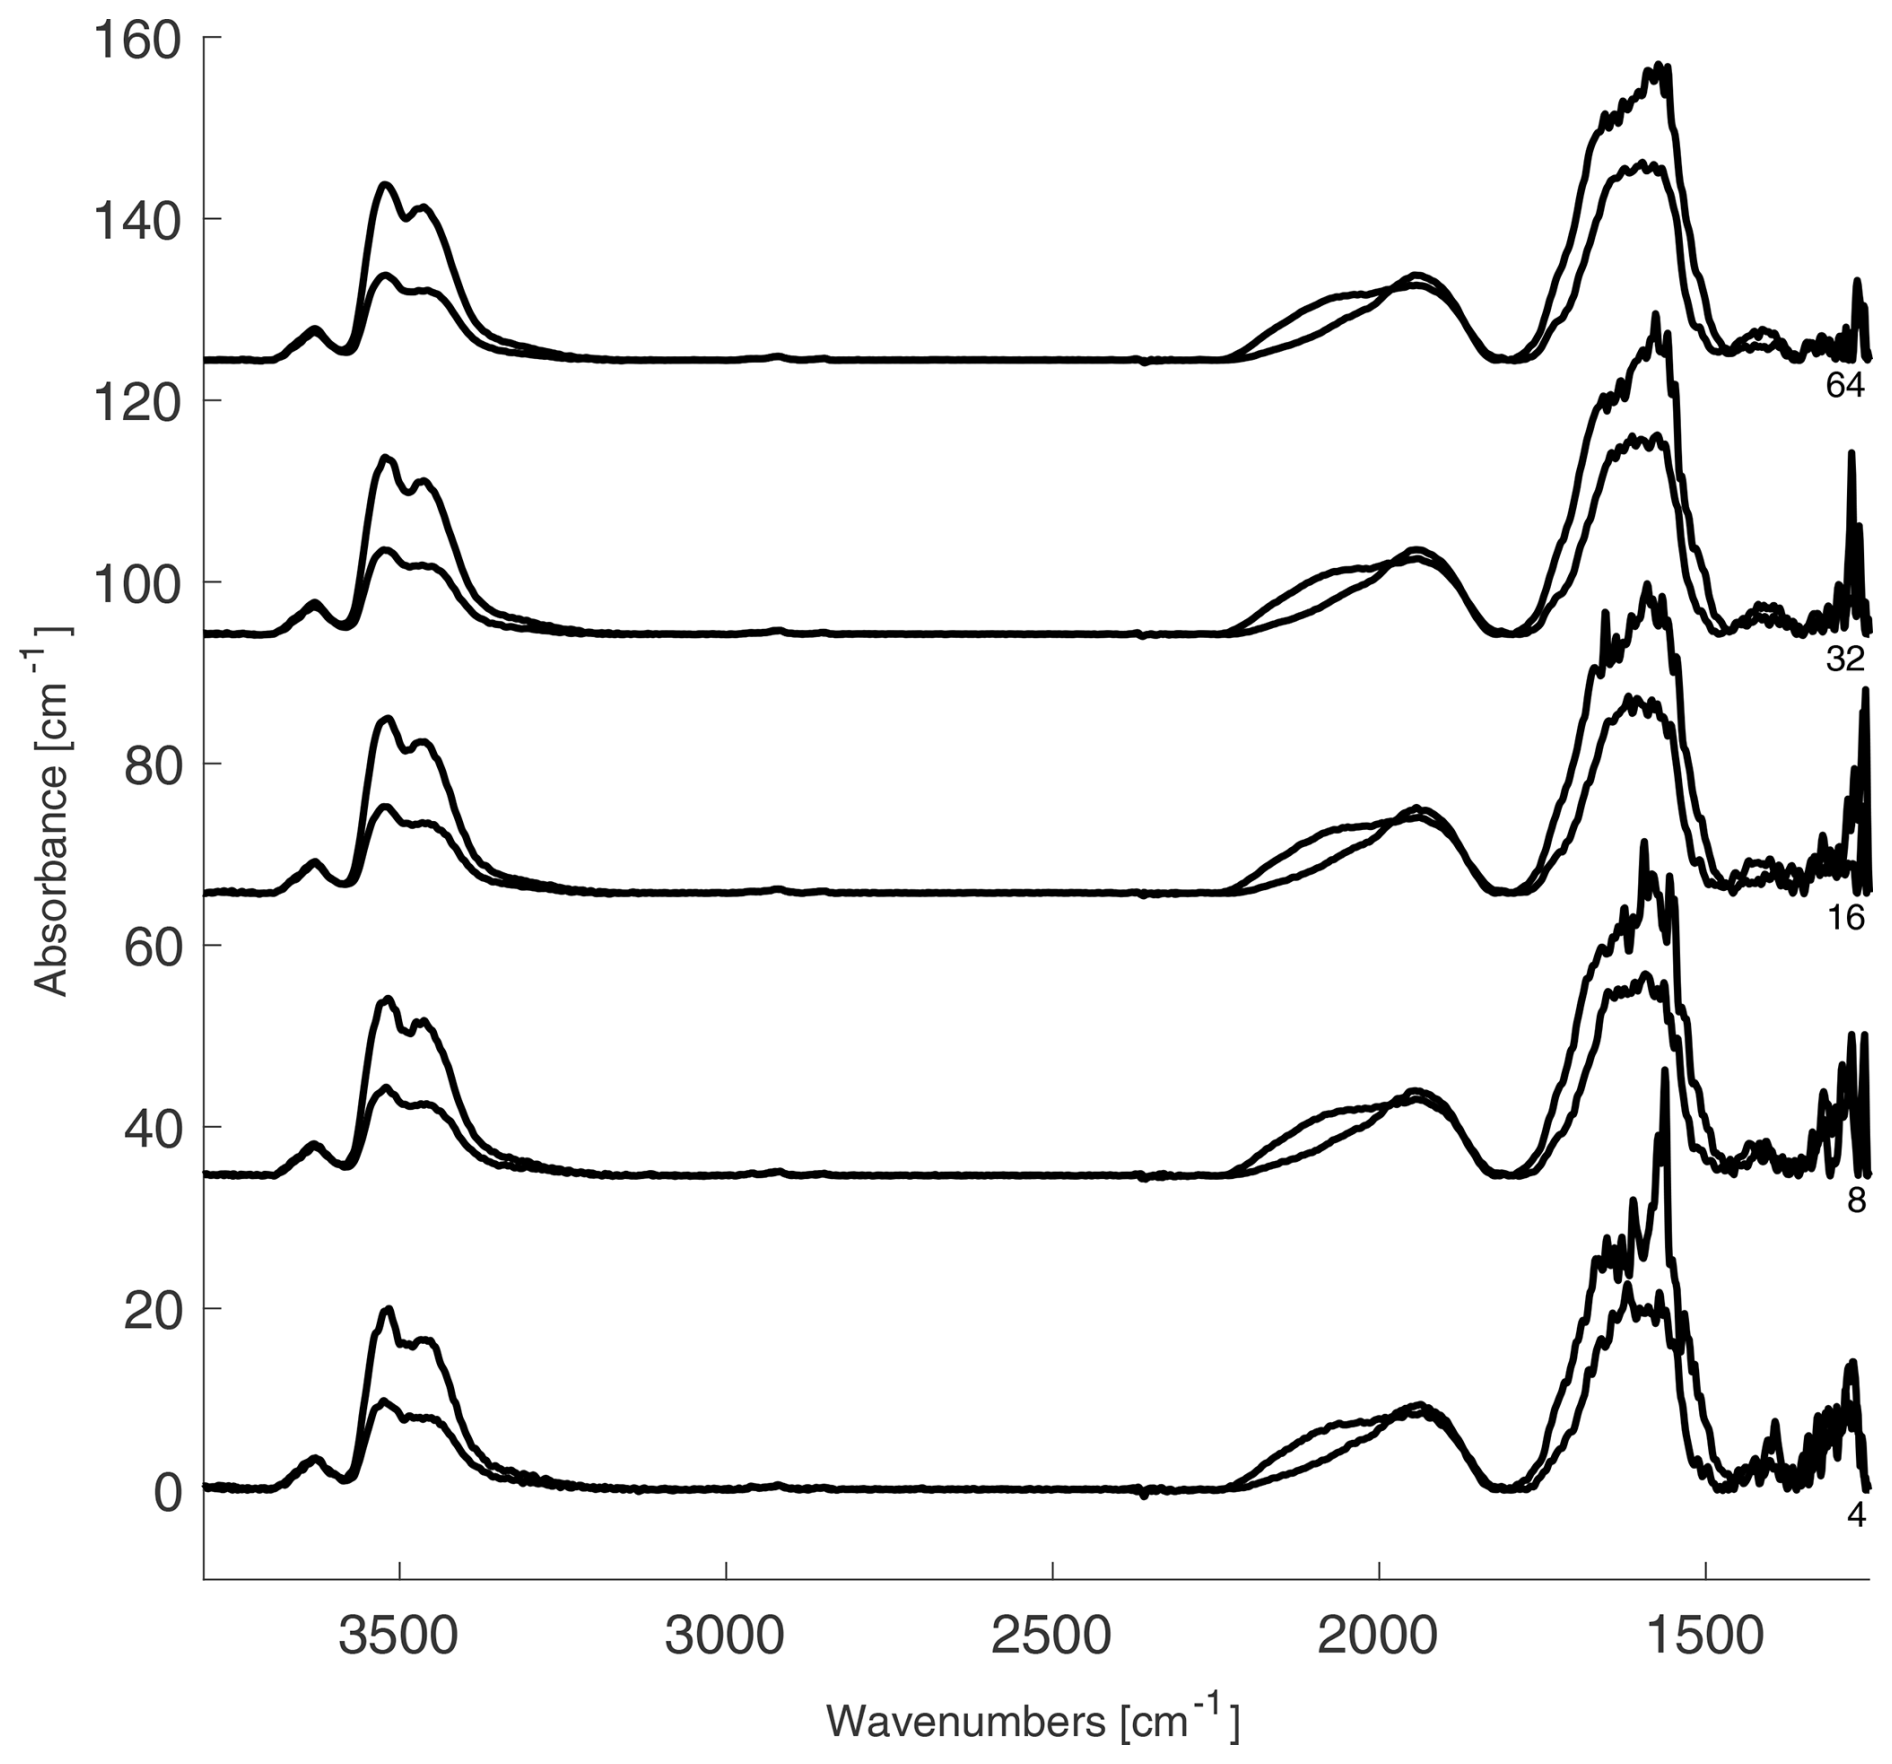
Figure C1Maximum-polarised spectra representing different numbers of scans for the same measurement position. Only Si–O overtones below 1700 cm−1 show a clear difference in signal noise, whereas the range between 4000–1700 cm−1 hardly shows any difference. Spectra are normalised to 1 cm and offset for clarity. Note that after thickness correction the absorbance values can no longer be used to estimate the proximity to saturation and if the linearity of the Beer–Lambert law is still applicable.
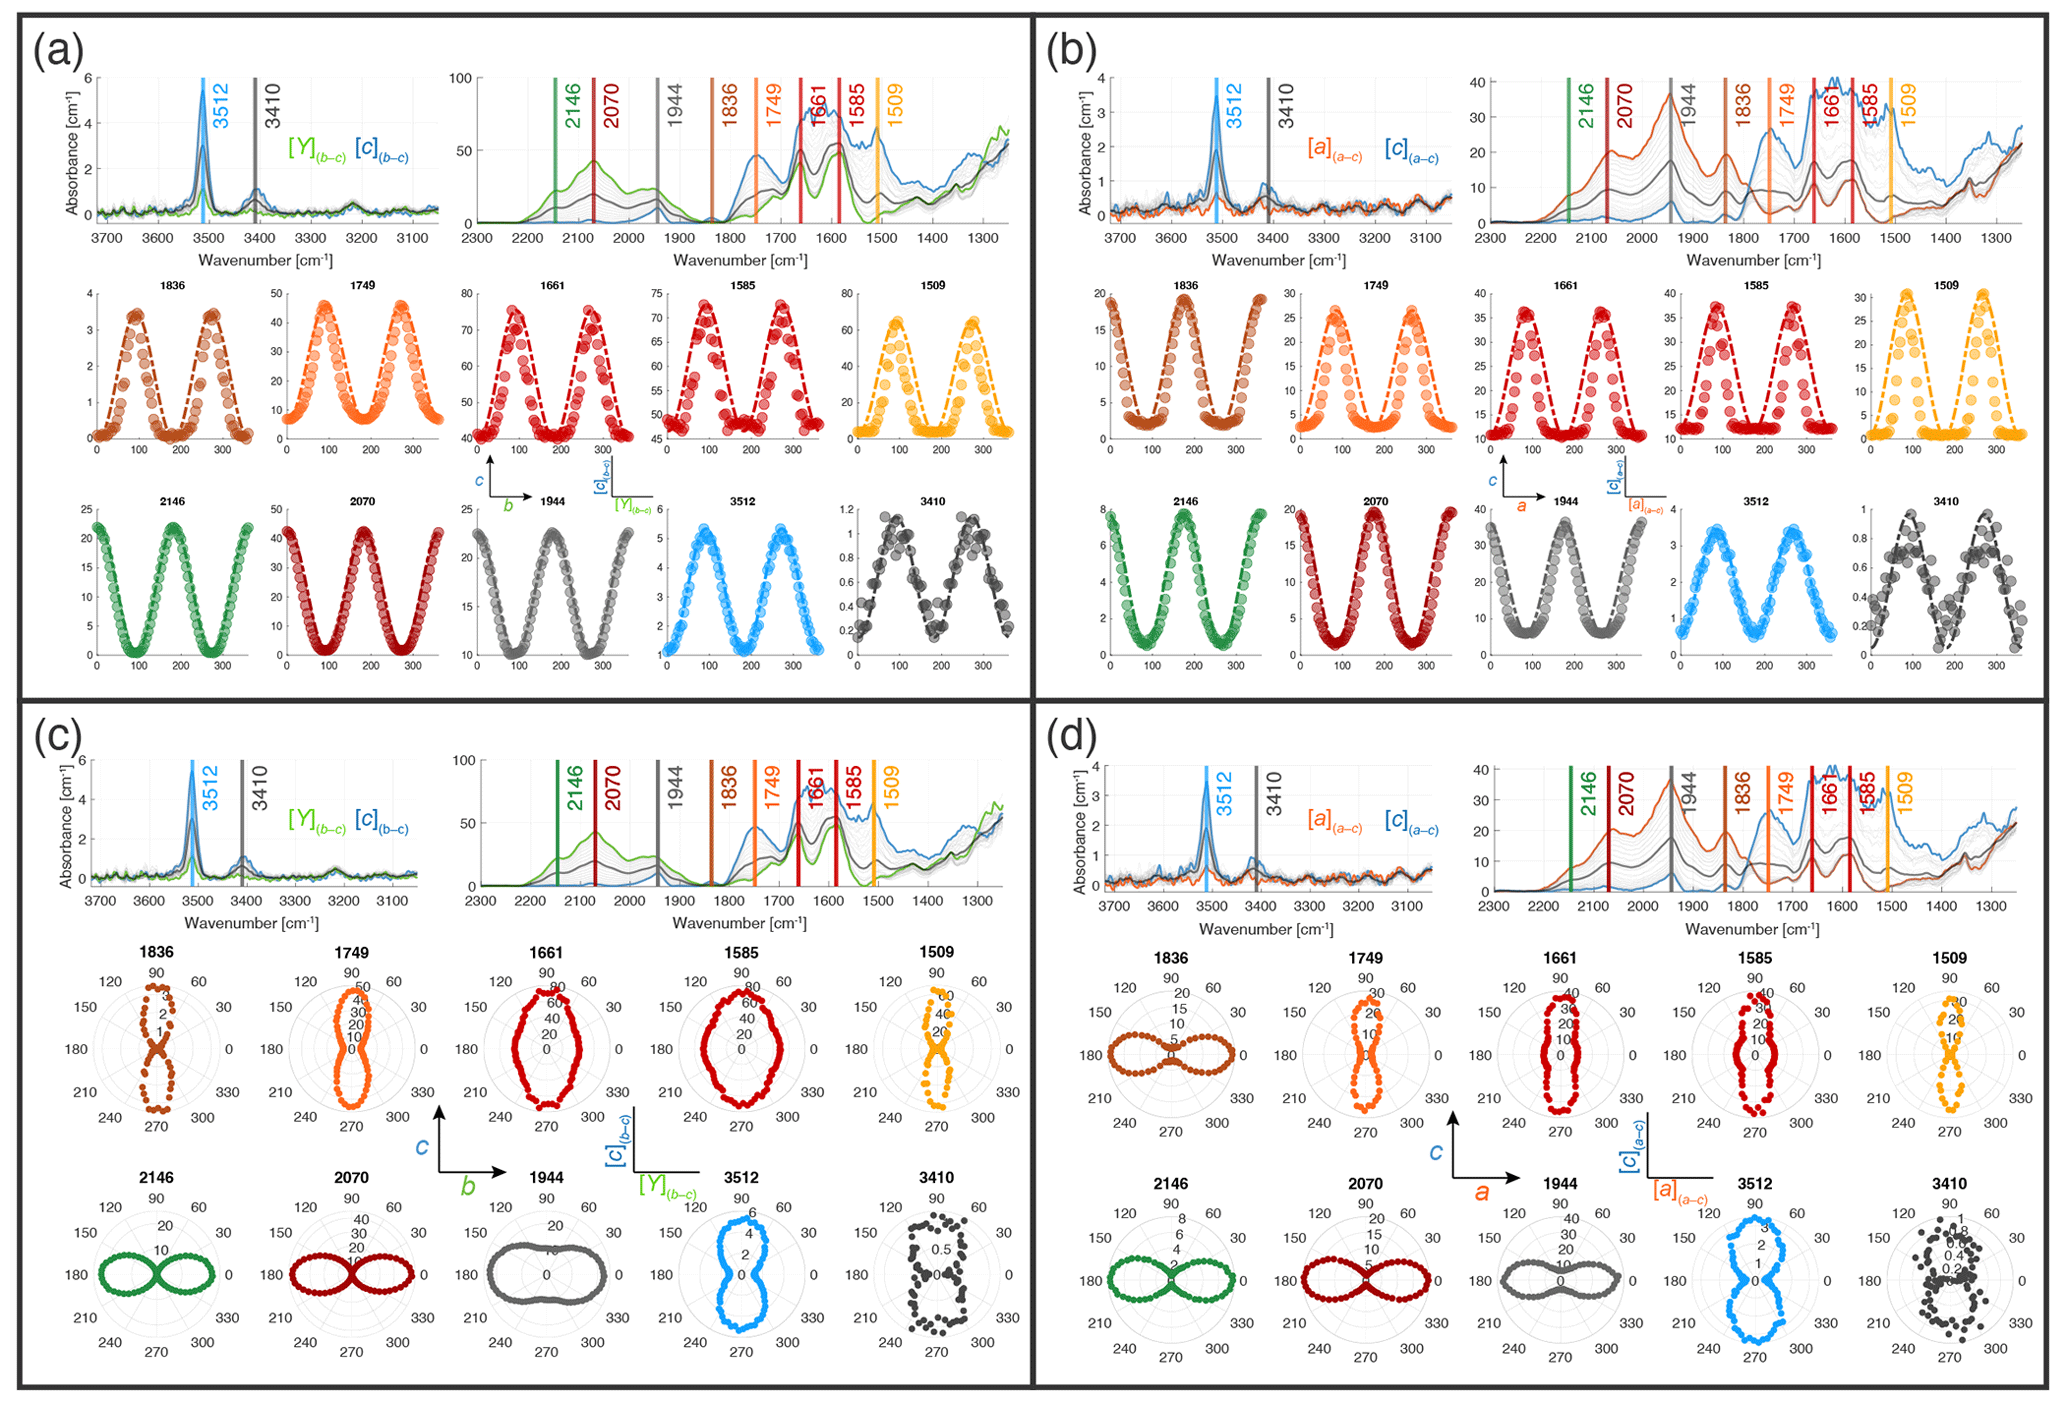
Figure C2Polarisation change visualised using selected bands with an incremental polarisation change of 4.5° of OPX wafer parallel to (100) and (010). OH-related defects at wavenumbers 3512 and 3410 cm−1 show correlations with polarisation behaviour of the lower-wavenumber bands. In XY plots, with the x axis showing polarisation angle intensity and the y axis showing intensity, the dashed line marks the theoretical polarisation behaviour calculated by minimum and maximum absorbance. Mismatch in the lower-wavenumber bands shows where Eq. (8) can no longer be used and where Eq. (9) needs to be used. Overlap of absorbance bands with different polarisation behaviour can be seen in bands 1585 and 1661 cm−1.
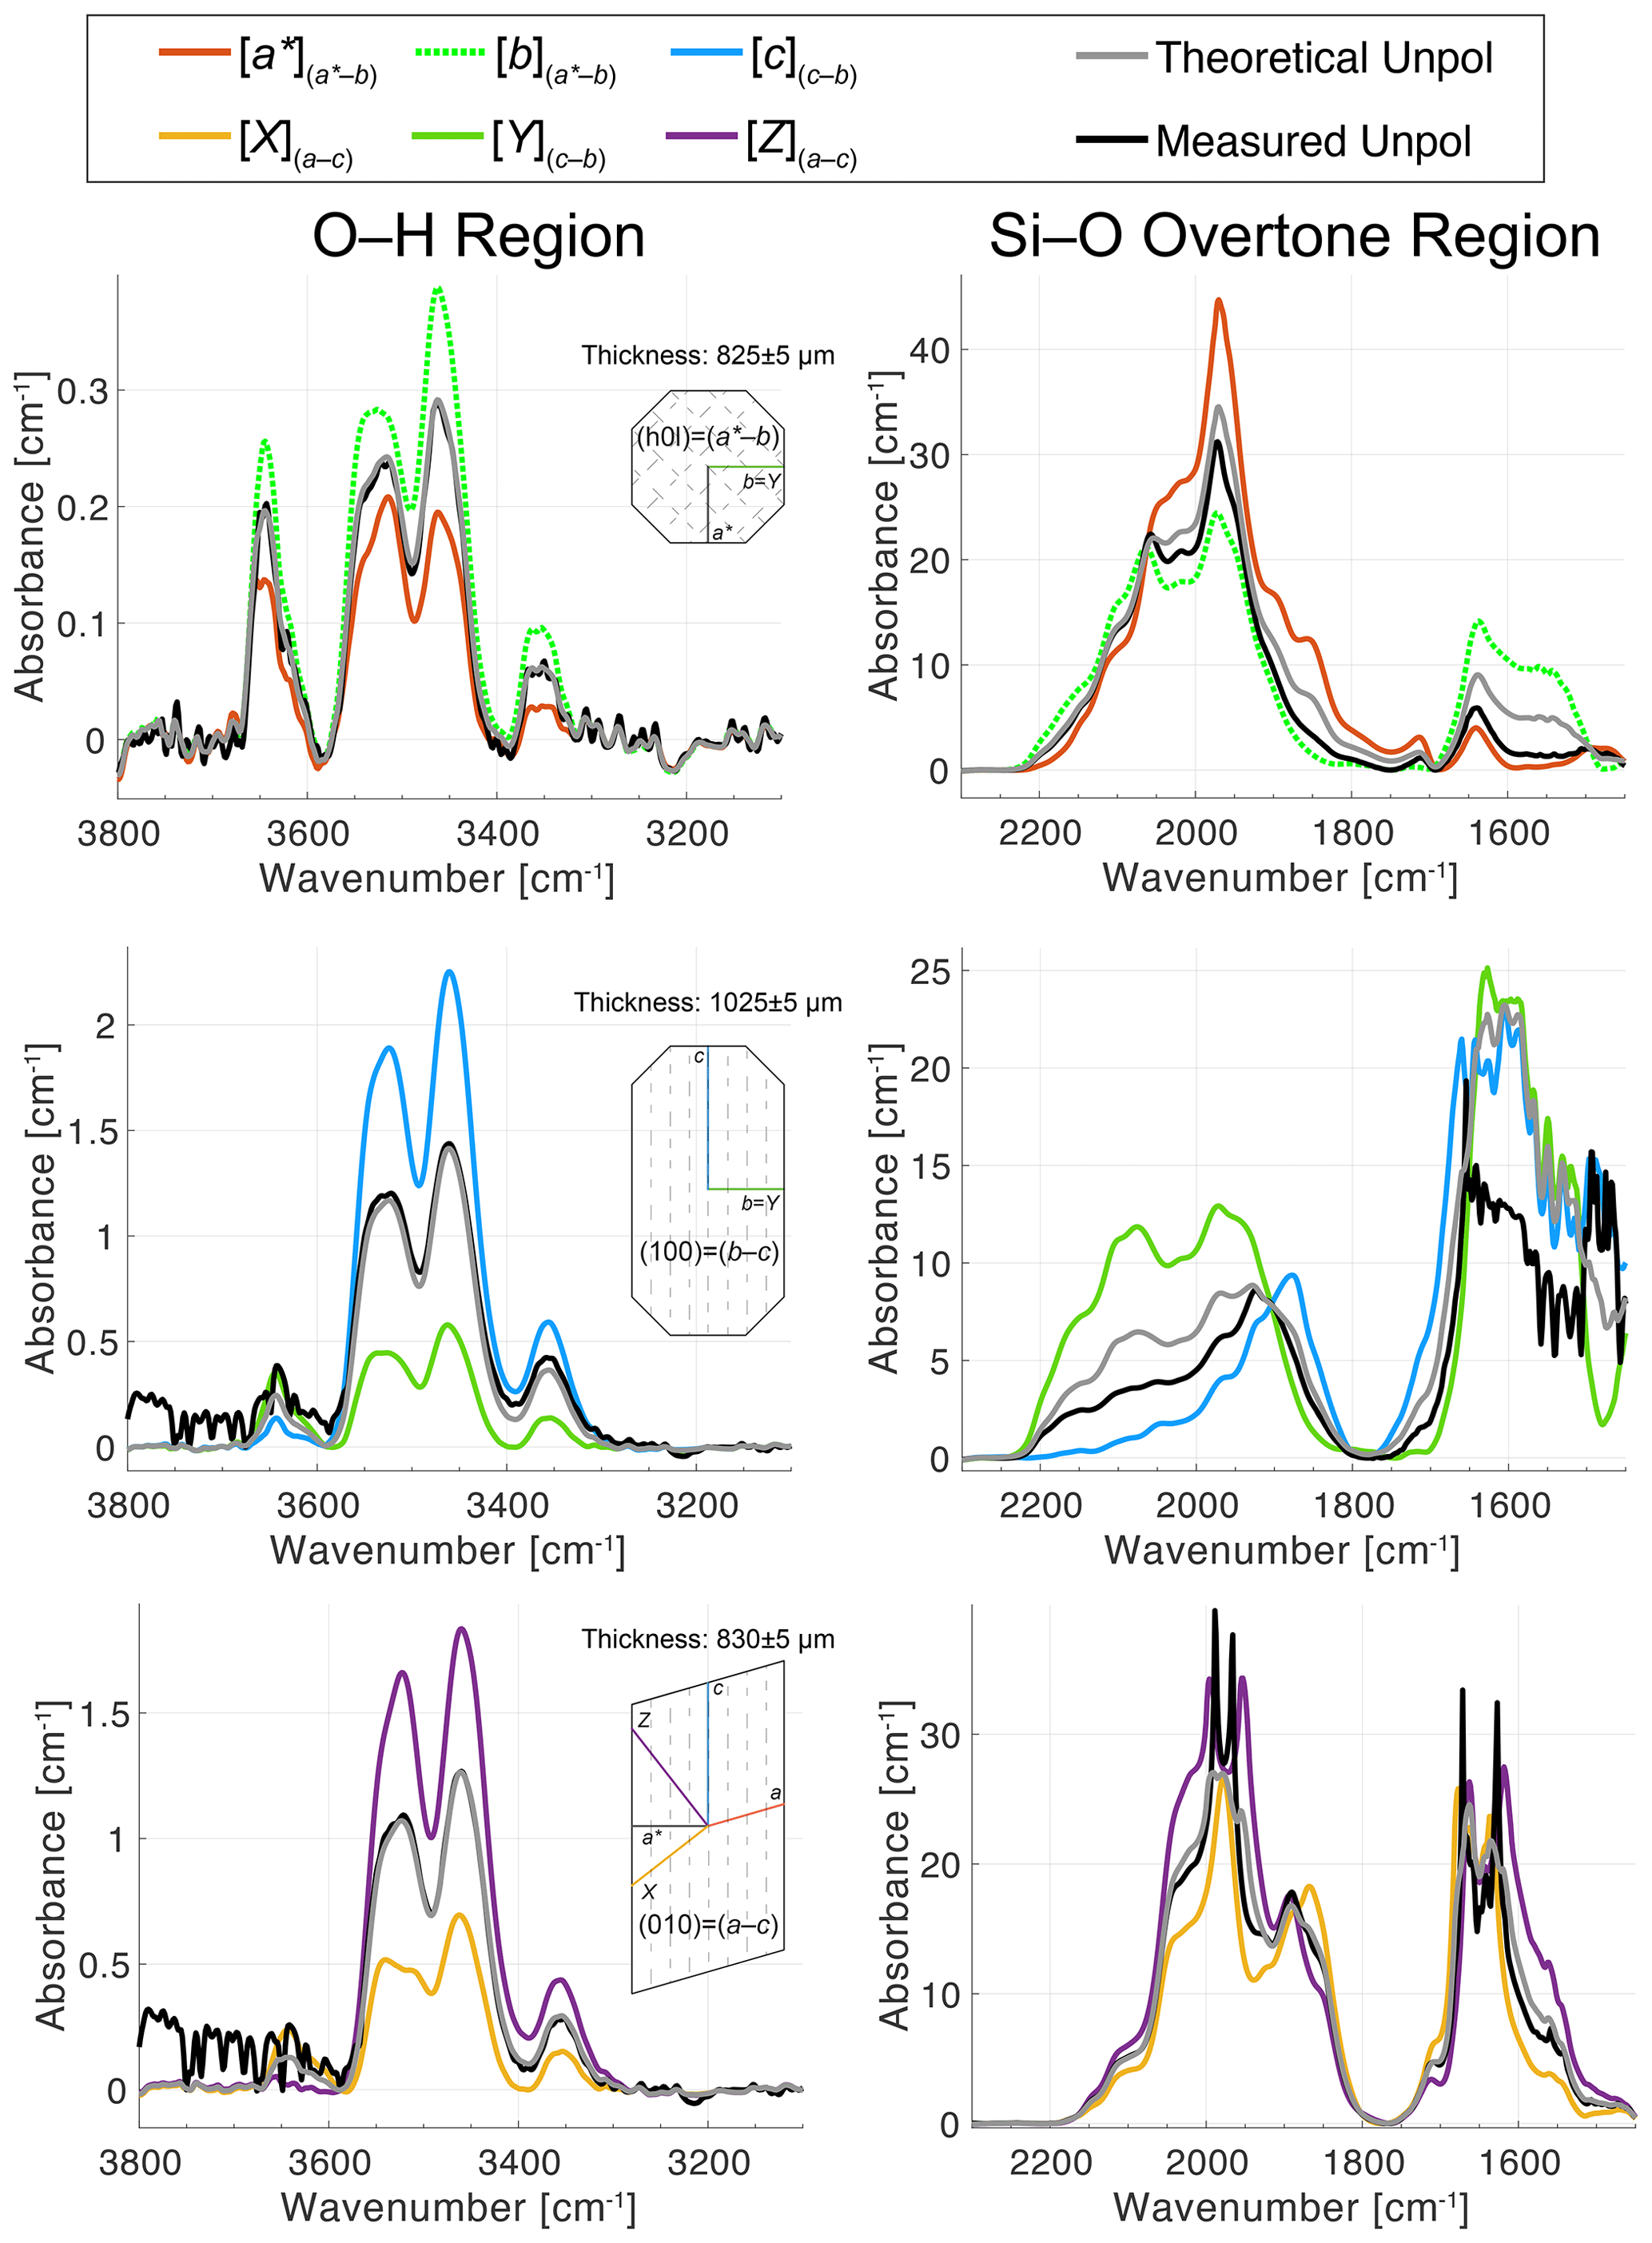
Figure C3Comparison of the maximum-polarised spectra in colour, the theoretically approximated unpolarised spectra in grey (using the mean of the two polarised spectra), and the measured unpolarised spectra in black of the Binntal diopside cuboid acquired in three orthogonal directions. The H2O region (top panels) shows excellent agreement between the theoretical approximation and the measured spectra, but the absorption is too high for the Si–O region, and the mean of the maximum and minimum polarised spectra are no longer equal to the unpolarised spectrum, and Eq. (9) needs to be applied instead.
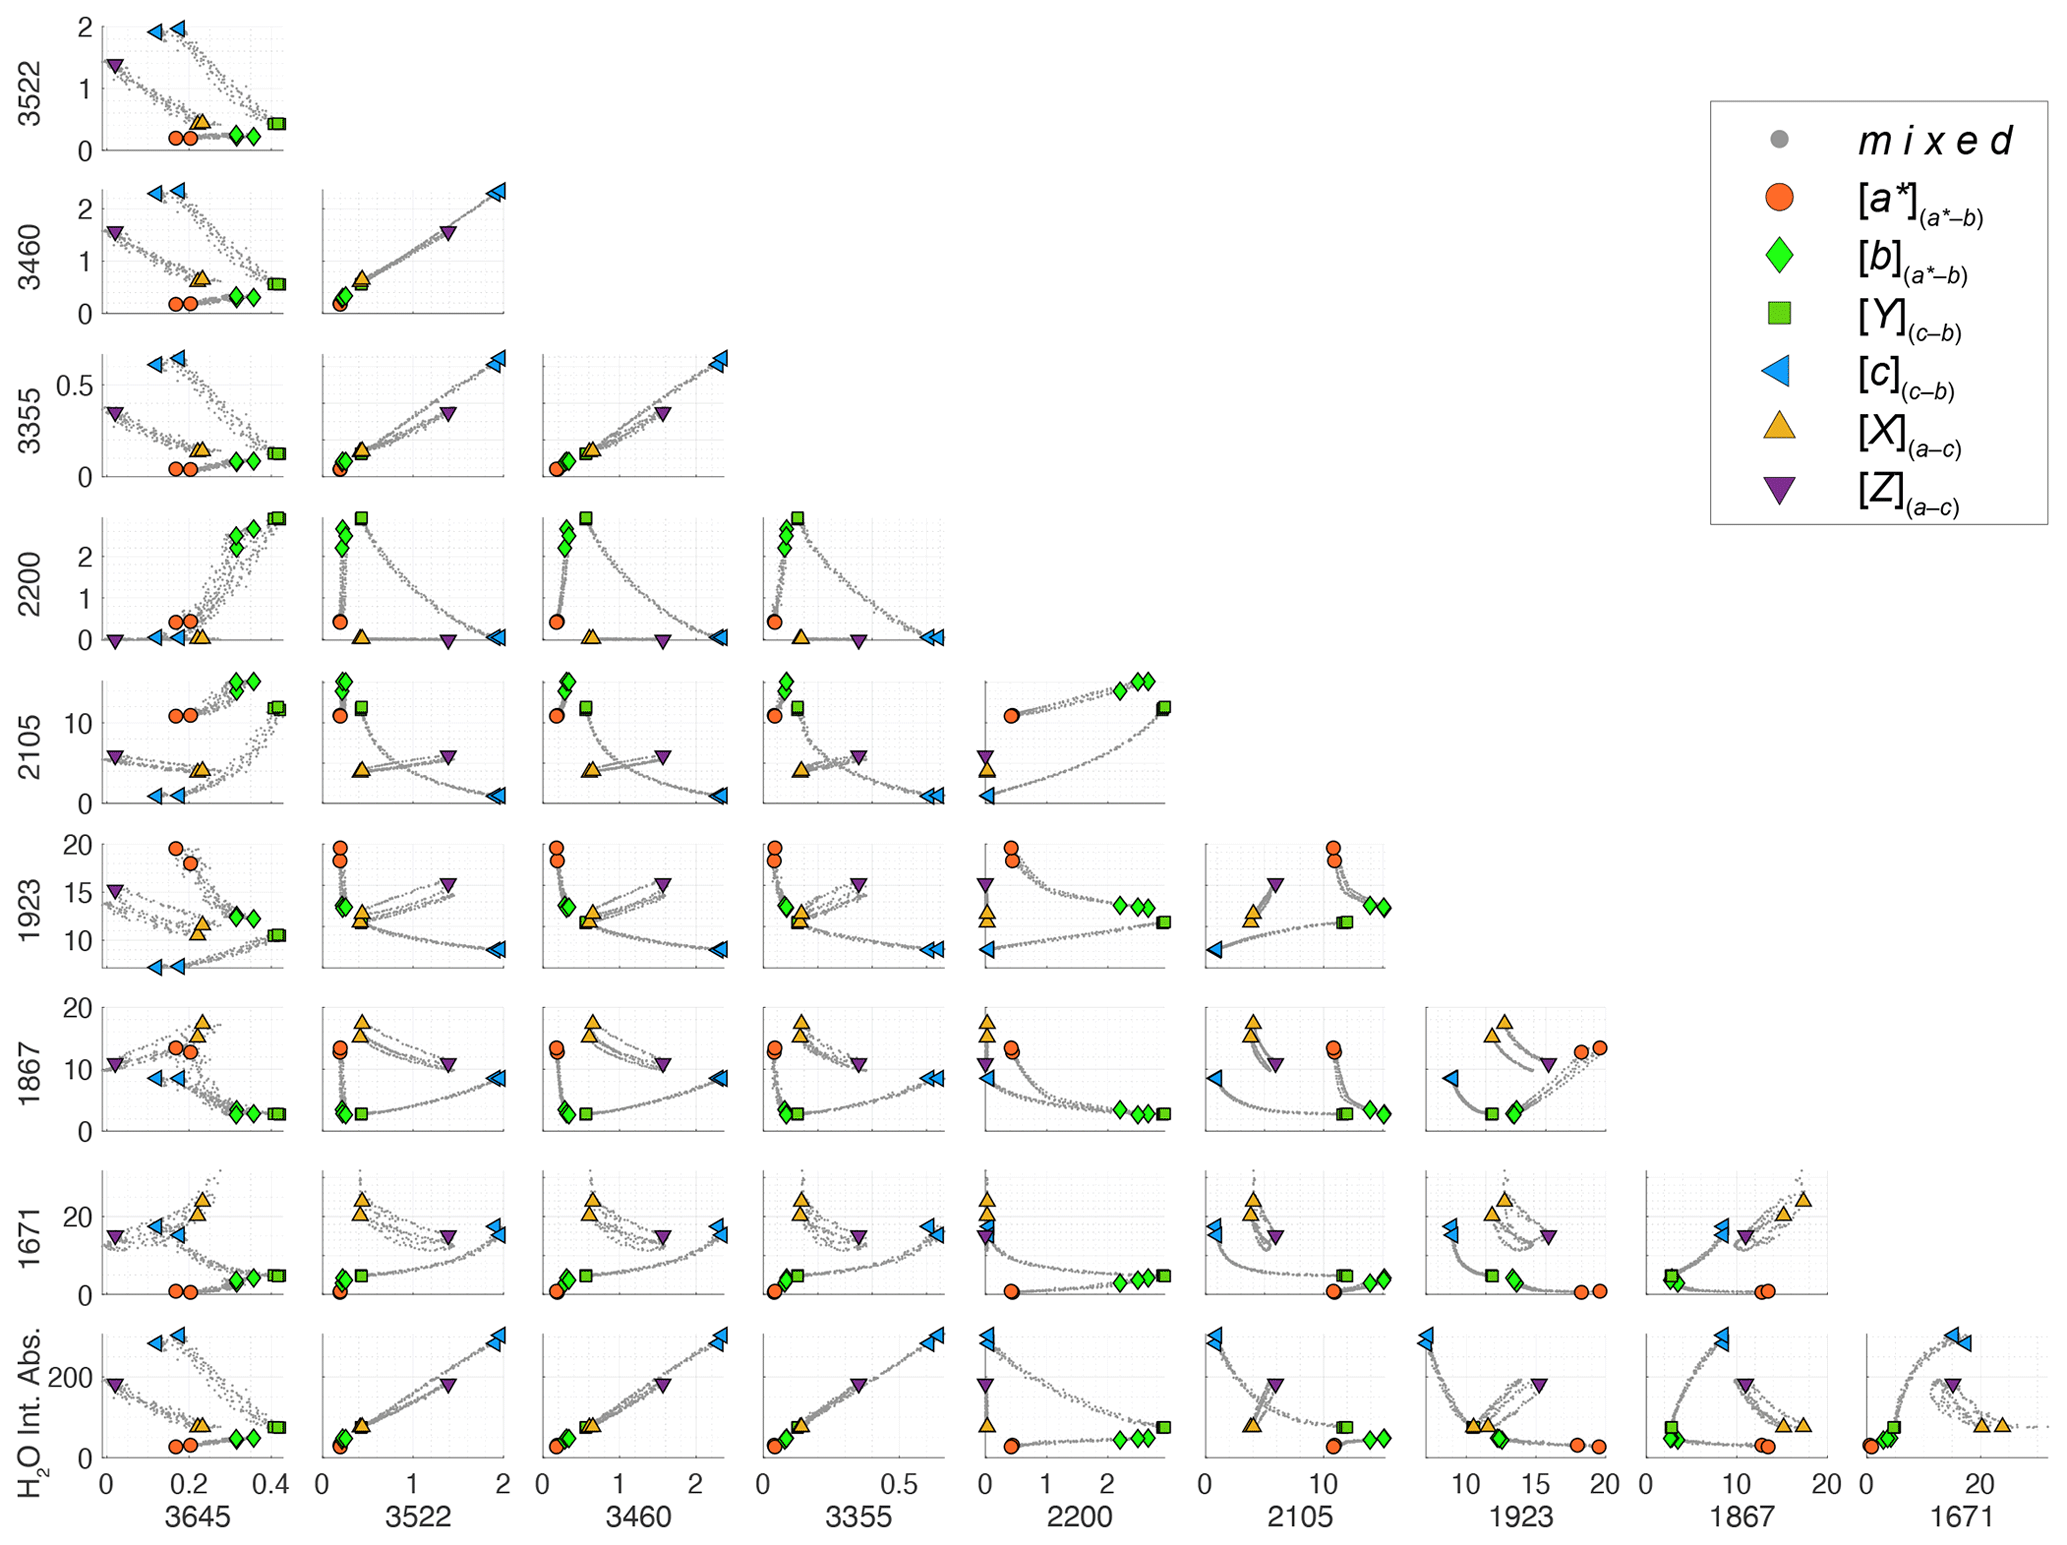
Figure C4The scatterplot matrix visualises the relationships between selected band heights extracted from each spectrum in the data set of the round polarised spectra and different measurement spots of three orthogonal directions of the cuboid. Each panel displays a two-dimensional scatterplot that compares the stated spectral bands with another. This extended scatterplot matrix of the Binntal diopside sample NMBE_8775 demonstrates that, first, the absorbance of selected characteristic Si–O bands for [a*], and [c](c–b) spans a triangular pattern (e.g. band 2200 vs. 1923), and the second bands of selected OH-related defects show a clear correlation between Si–O overtones and OH-related defects (band 2200 vs. 3645). Offsets are caused by the thickness of the sample, demonstrating the nonlinearity of bands exhibiting high absorbance.
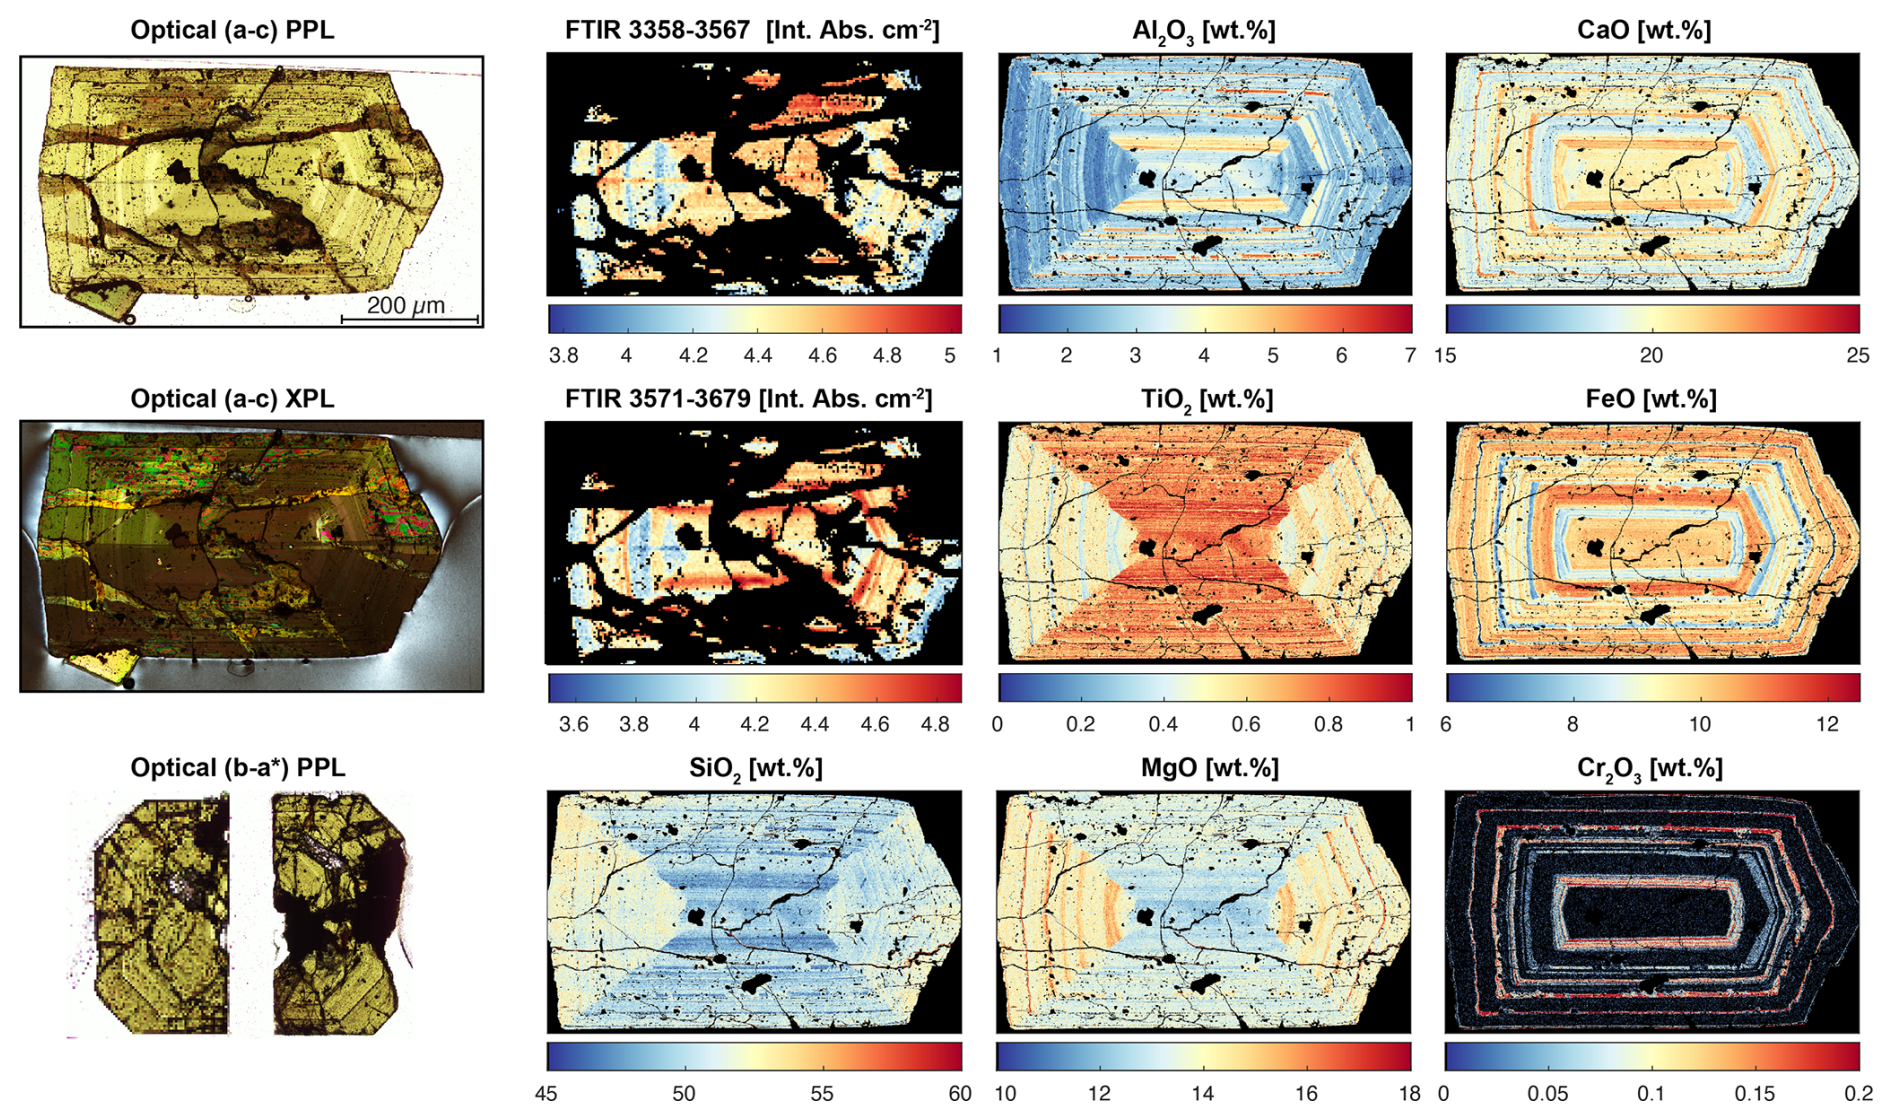
Figure C5Compilation of optical microphotographs of two orthogonal sections (a–c) and (a*–b), with PPL indicating plain-polarised light and XPL indicating cross-polarised light, of the same crystal, FTIR mappings, and compositional maps of the same (a–c) section of the magmatic augite sample from Java. Integrated absorbance map of two different O–H-related defect groups reveals differences in H2O absorbance, correlating with major element maps acquired by EPMA. The mappings reveal complex zoning of the crystal. Growth and sector zoning is visible in the lower-wavenumber FTIR bands 3358–3567 cm−1, Al2O3, TiO2, SiO2, and MgO, whereas higher-wavenumber FTIR bands 3571–3679 cm−1, CaO, FeO, and Cr2O3 show only growth zonation.
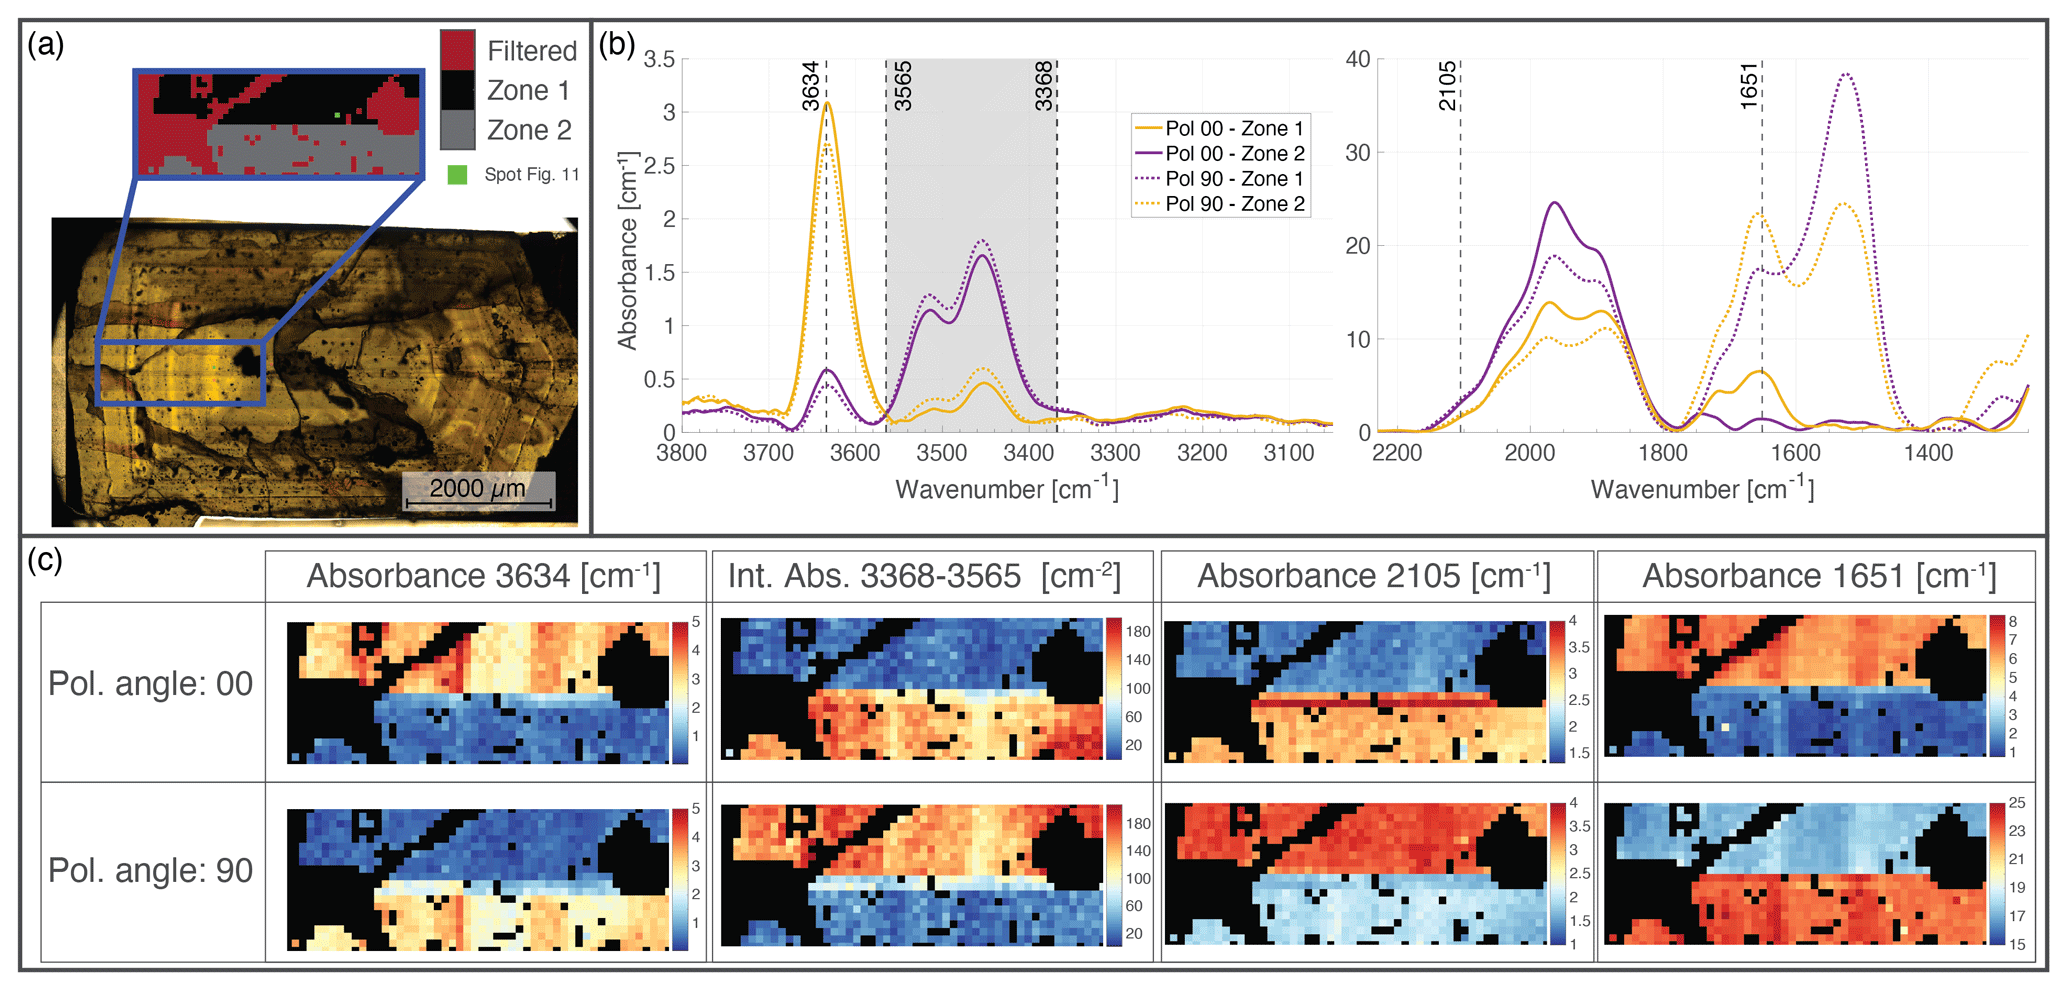
Figure C6(a) Optical photomicrograph of Java augite, with mapped area using two different polarisation angles (0 and 90°) and classification results for zone 1 and zone 2 and with excluded pixels showing typical spectral features of melt inclusions or epoxy bands. (b) Average spectra of zone 1 and zone 2 for measurements with a polarisation angle of 0 and 90°. (c) Absorbance of band 3634 cm−1 and integrated absorbance map between 3368–3565 cm−1 representative of the two OH-related defect groups and Si–O overtone band 2105 and 1651 cm−1 spectra showing the twinning and growth zoning of the crystal.
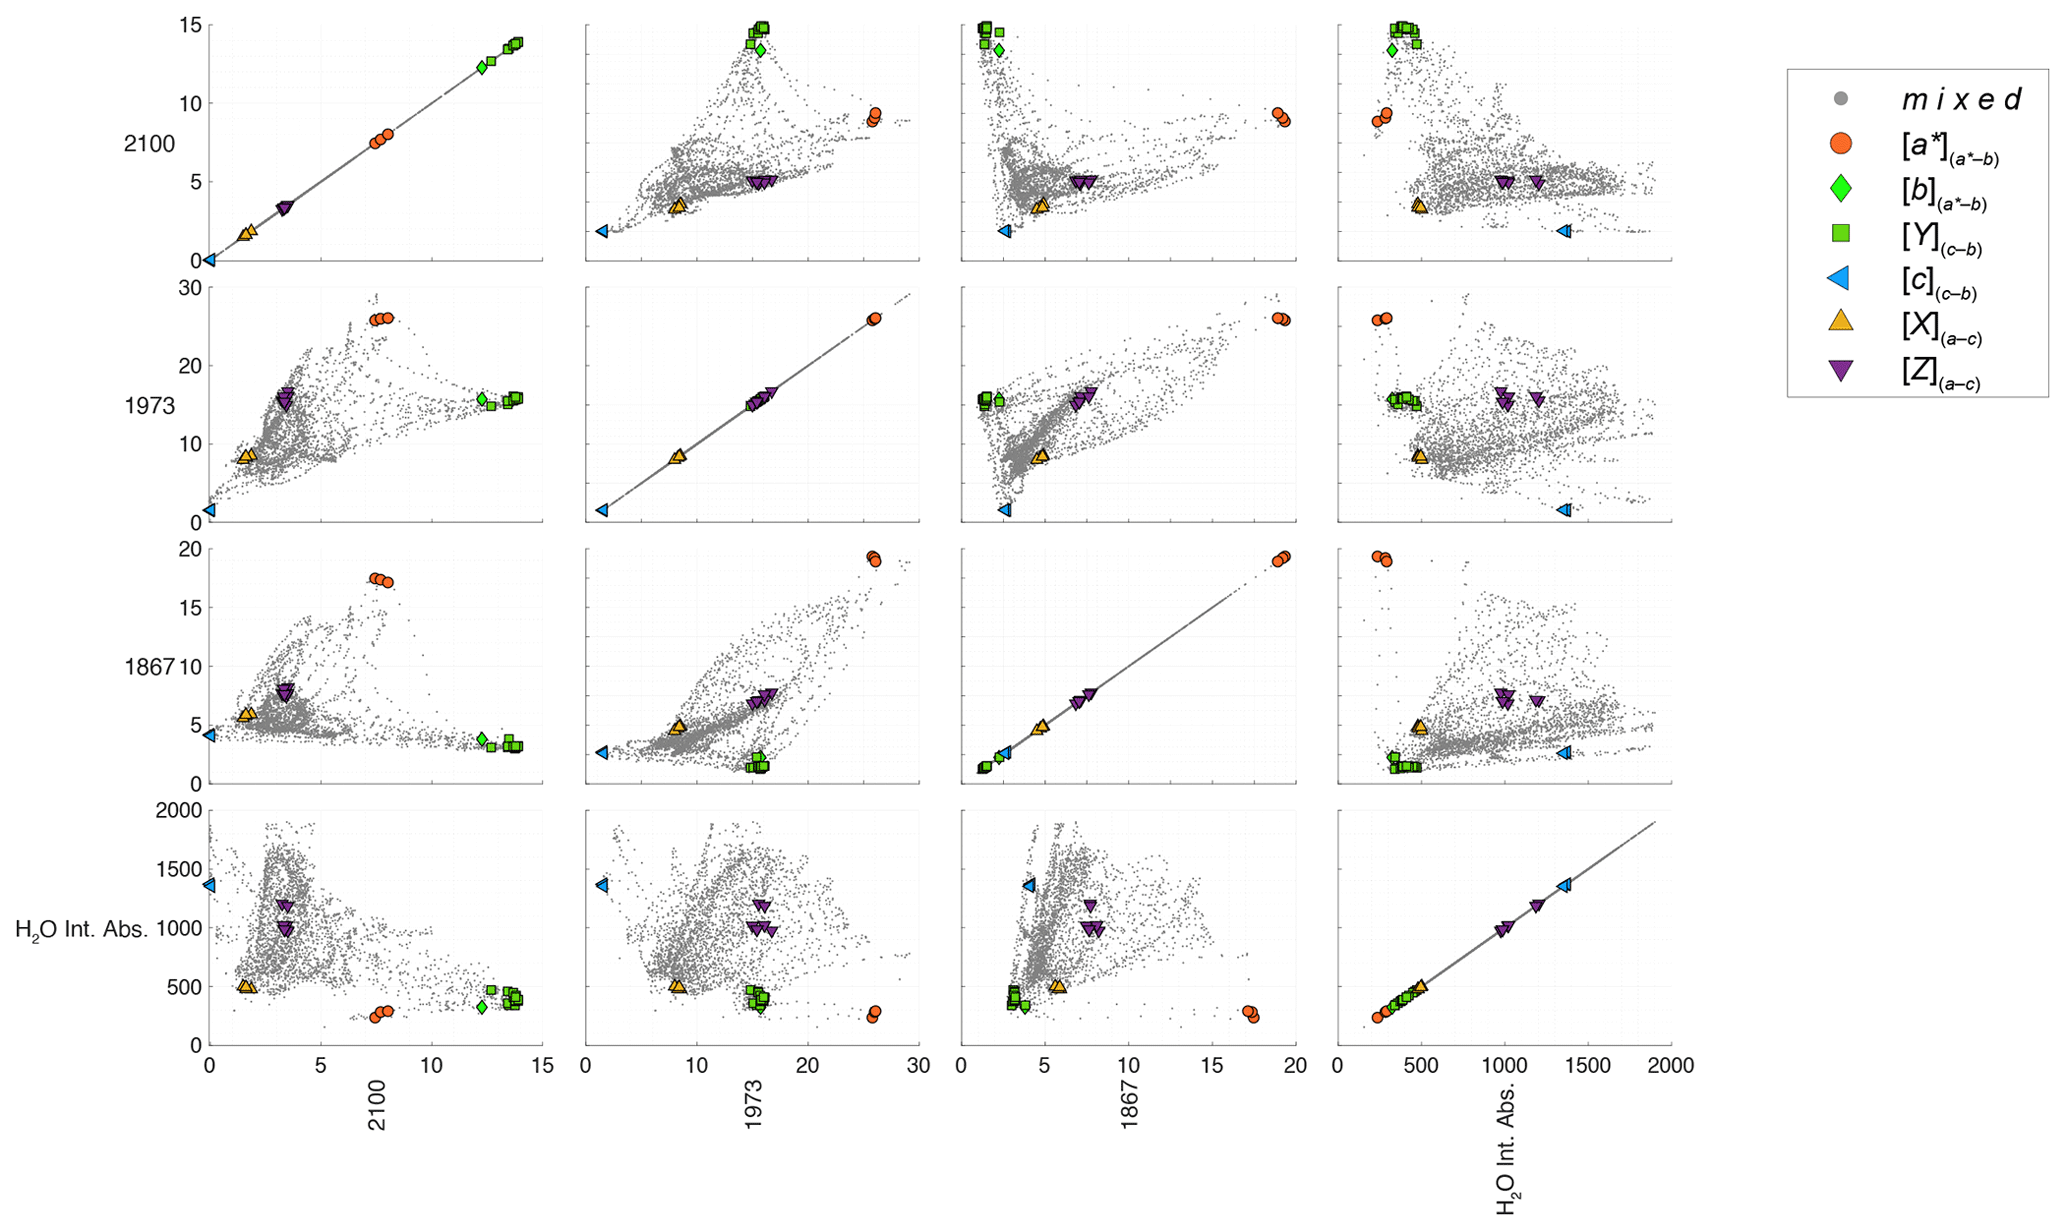
Figure C7Extended scatterplot matrix showing extracted values for the integrated H2O absorbance and selected characteristic Si–O bands 2100, 1973, and 1867 cm−1 of the filtered data set, containing 2860 polarised spectra of 65 spots acquired in 52 randomly oriented crystals of omphacite in sample K5-5. Spots showing spectral features of contamination were excluded before plotting. Identified spectral endmembers are shown with large symbols. Band 1867 cm−1 vs. 1973 cm−1 reveals the triangular patterns spanned by the endmember combinations of and , where the triangle is located within the larger triangle. Interestingly, the highest integrated absorbance does not correlate with any spectral endmember, indicating a complex mixing between different OH-related defect groups, with different polarisation behaviour showing the maximum integrated absorbance in between the spectral endmembers in the Si–O overtone region.
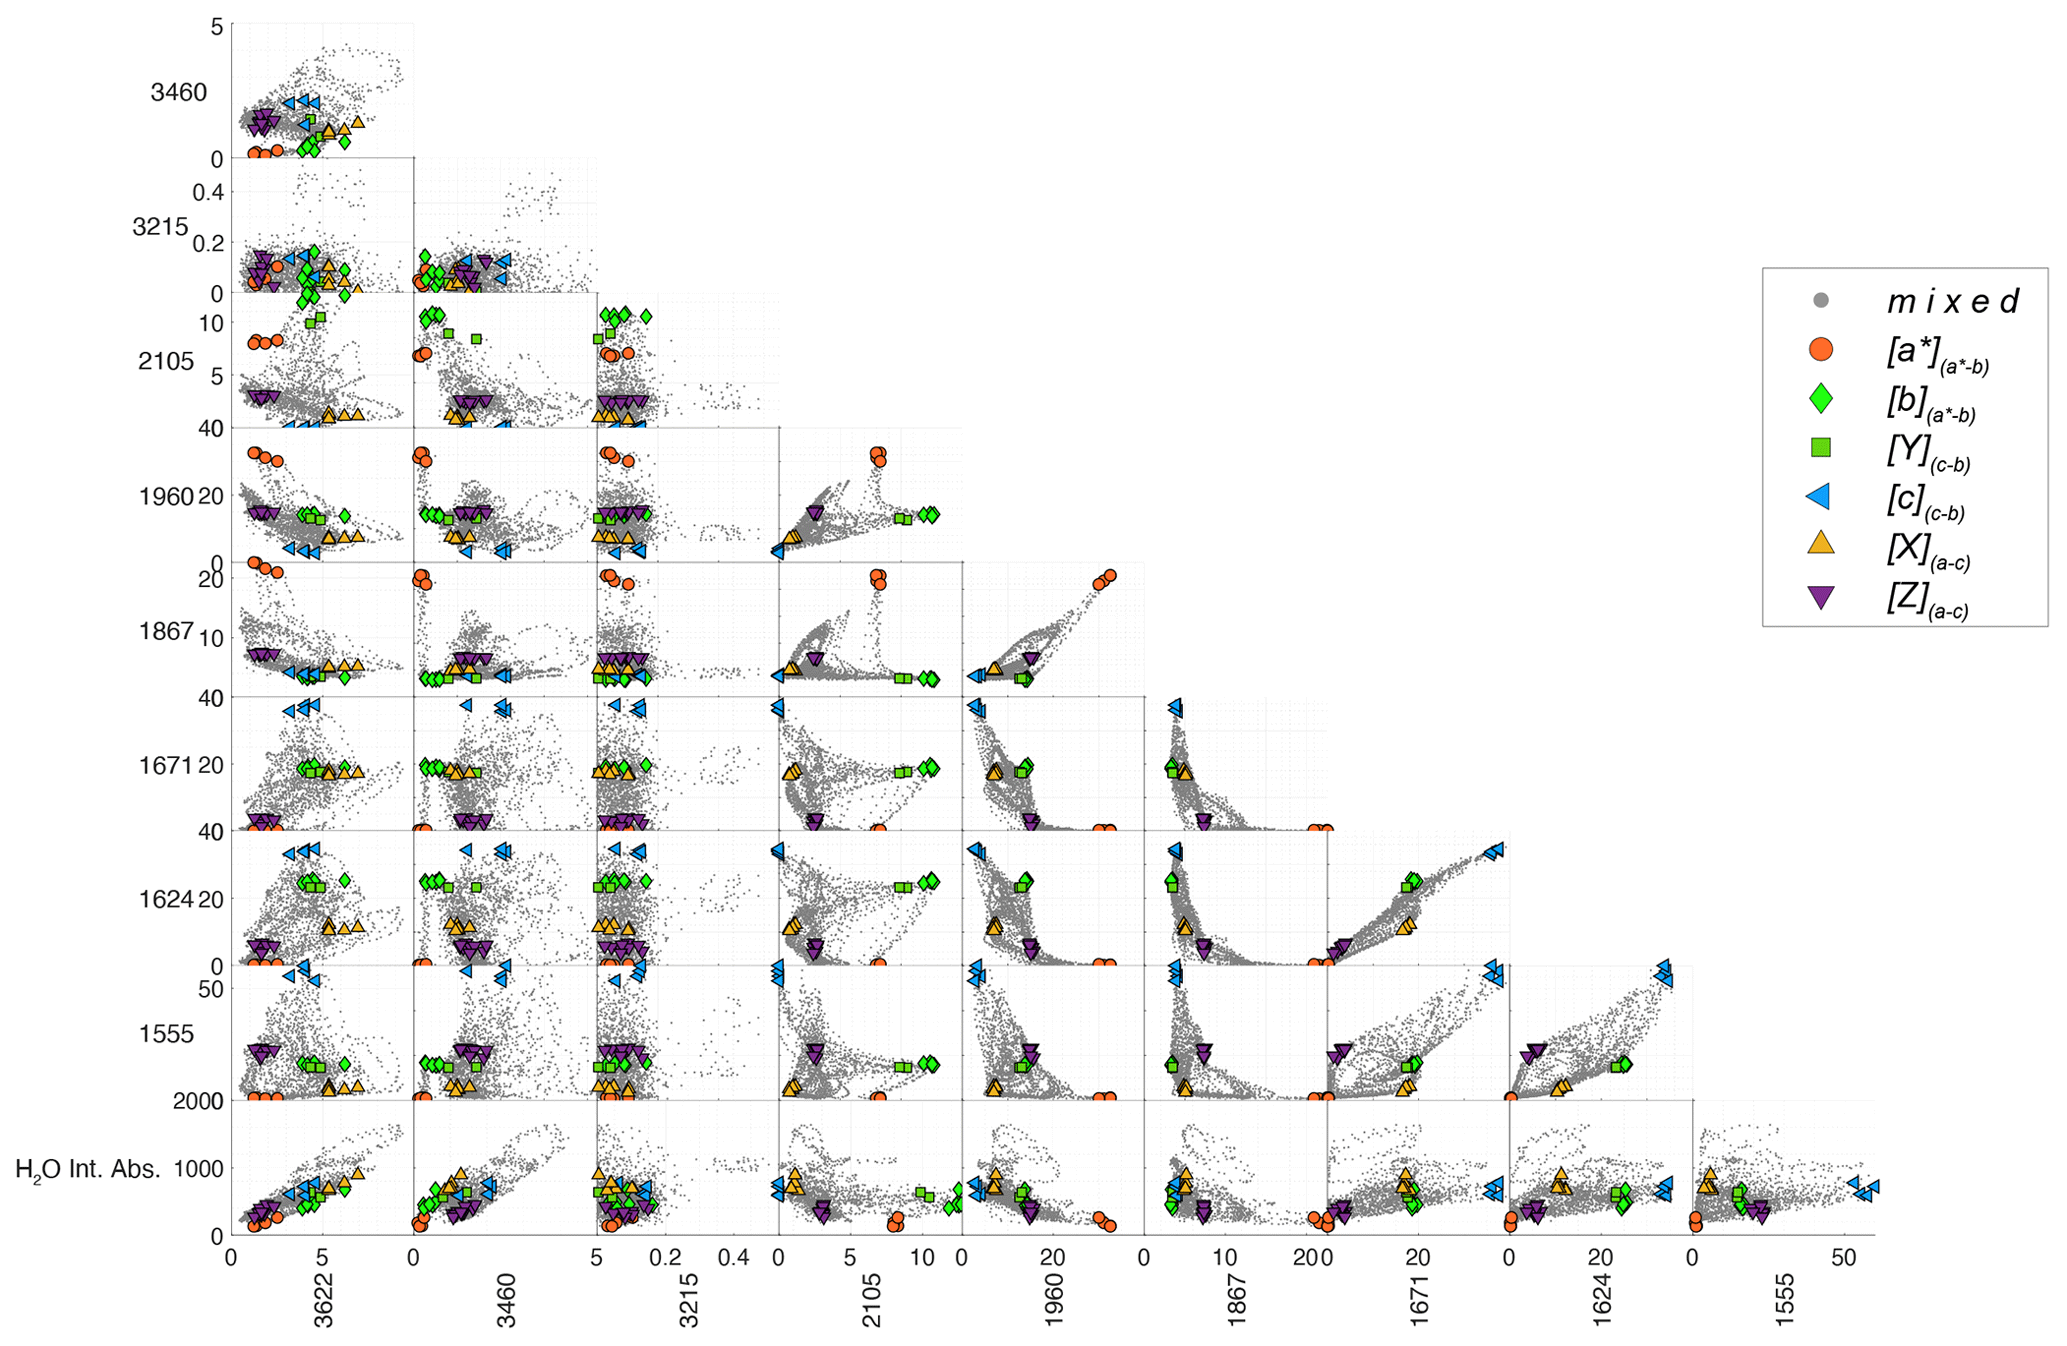
Figure C8Extended matrix showing extracted values for the integrated H2O absorbance and values of selected characteristic Si–O- and OH-related bands of the full unfiltered data set containing 2024 polarised spectra of 46 randomly oriented crystals of omphacite in sample K5-14. Identified spectral endmembers shown by large symbols.
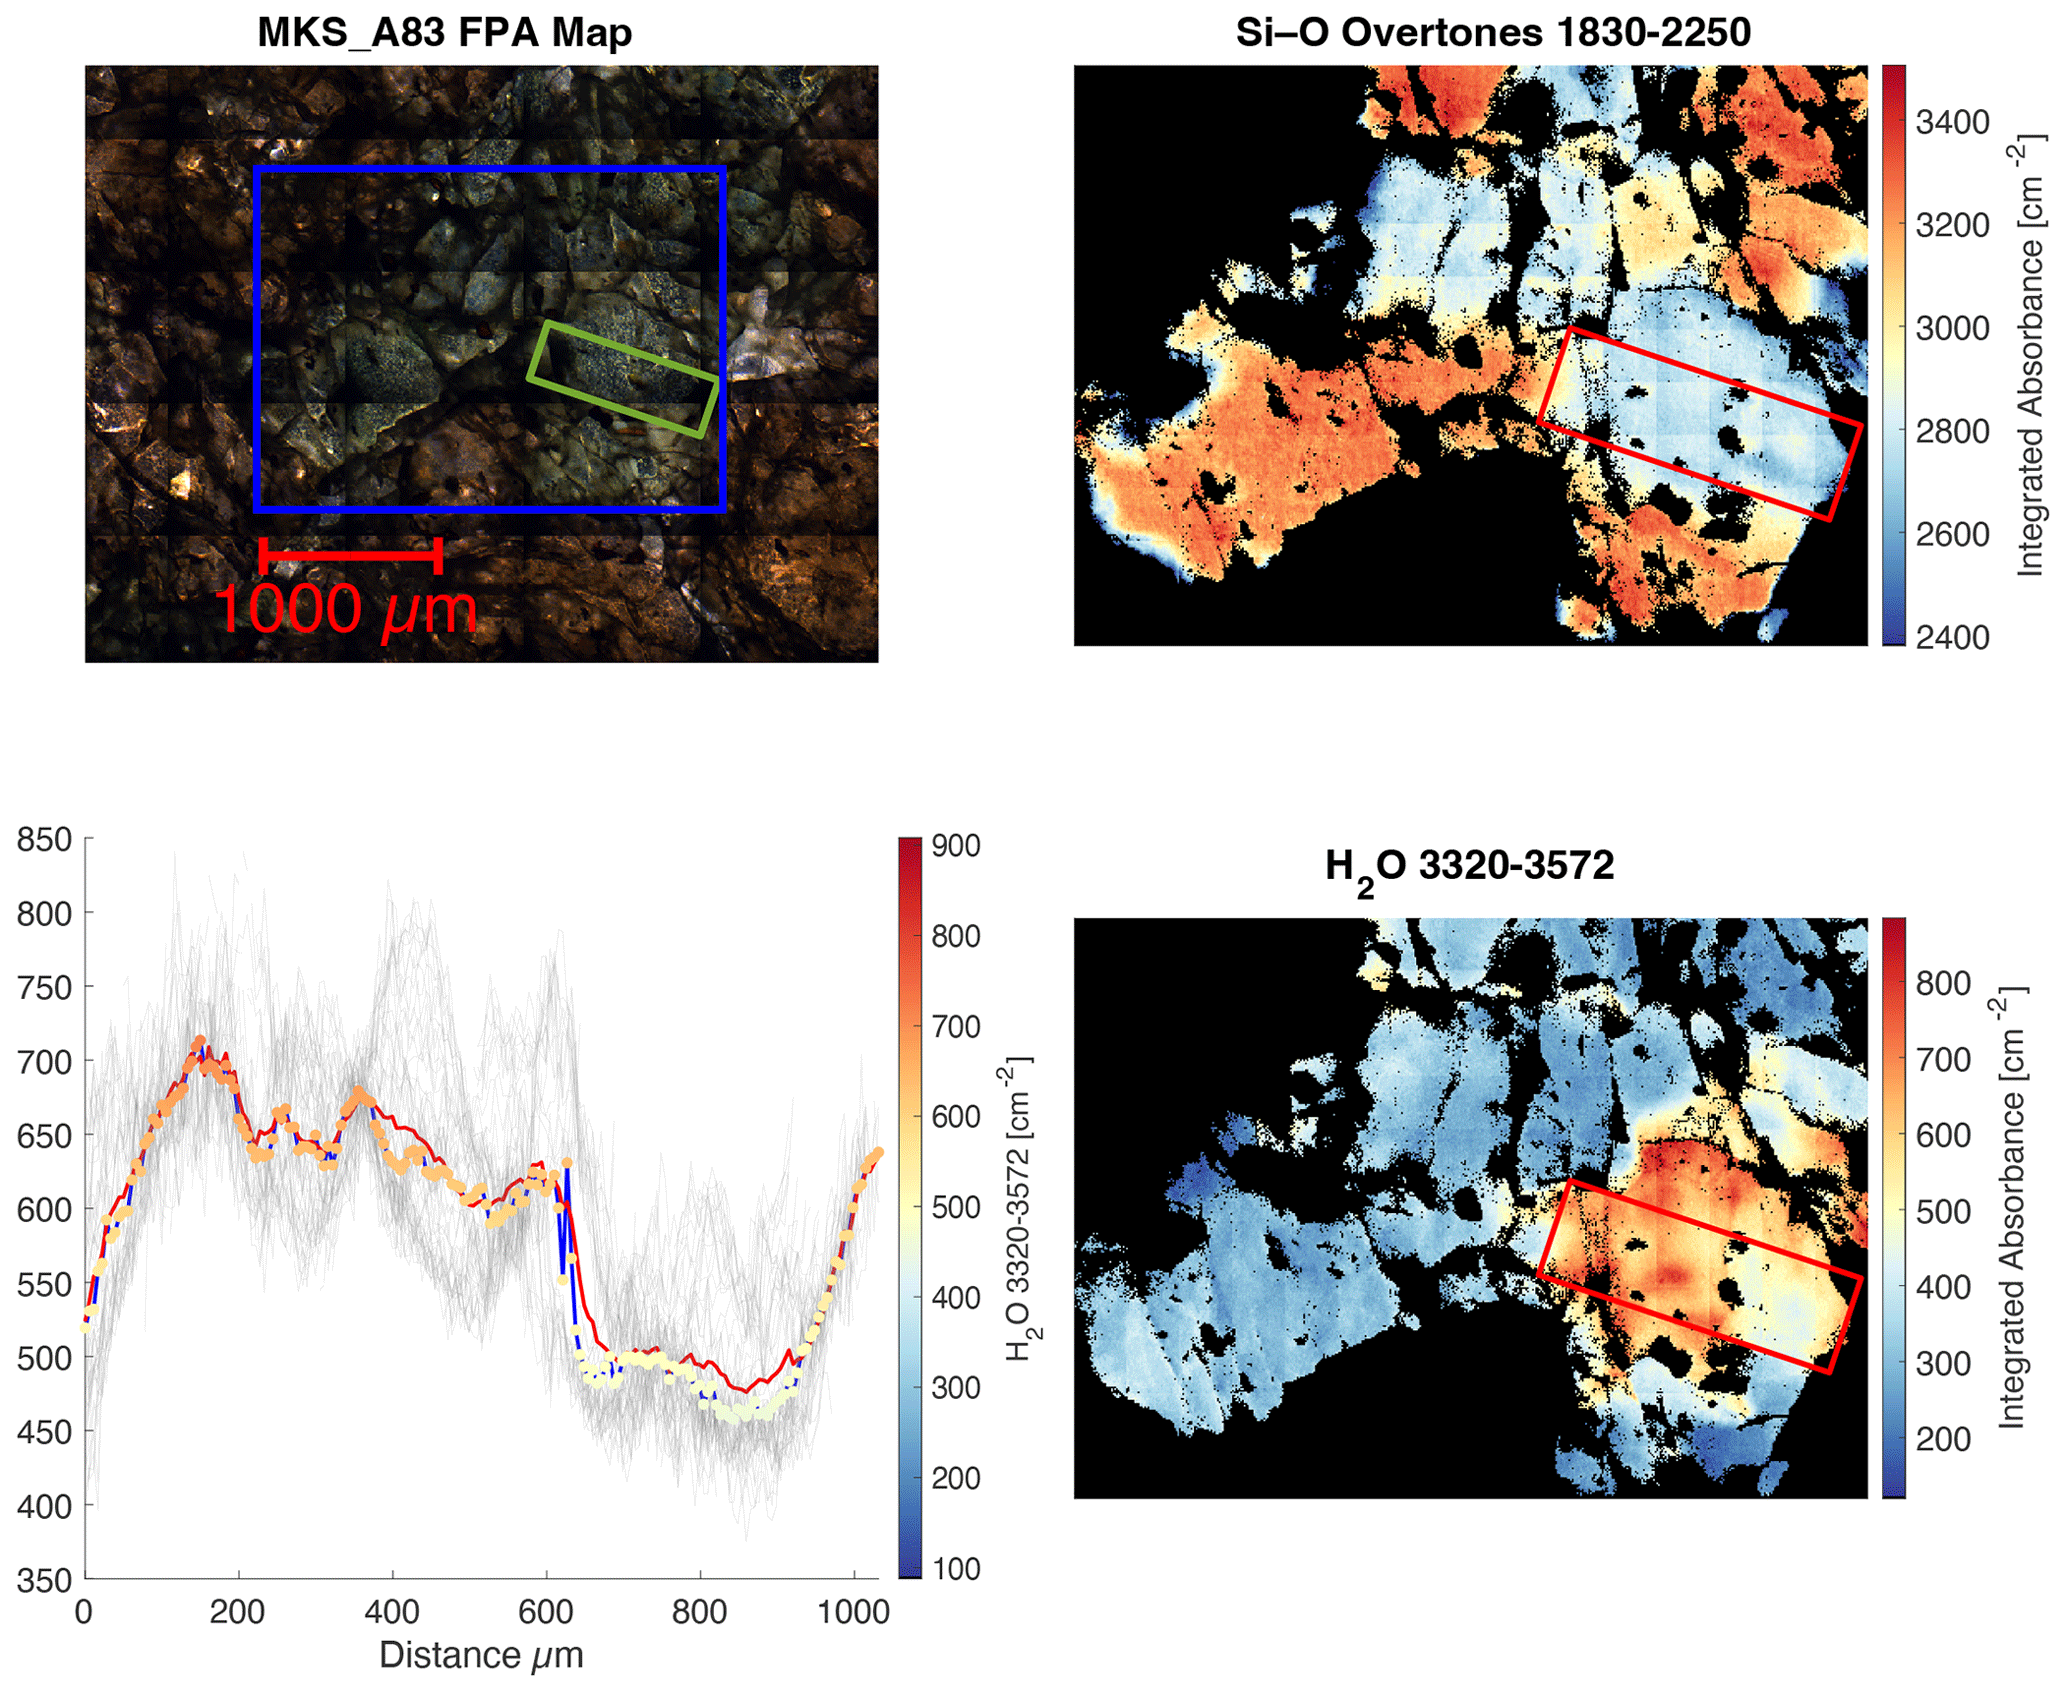
Figure C9High-resolution FTIR-FPA mapping of the orogenic eclogite sample MKS_A83, revealing different crystal orientations, detectable in the integrated absorbance maps of the Si–O overtones. Within the same crystal, inhomogeneities in the integrated absorption of the H2O region can be detected, indicating variable H2O contents within individual grains.
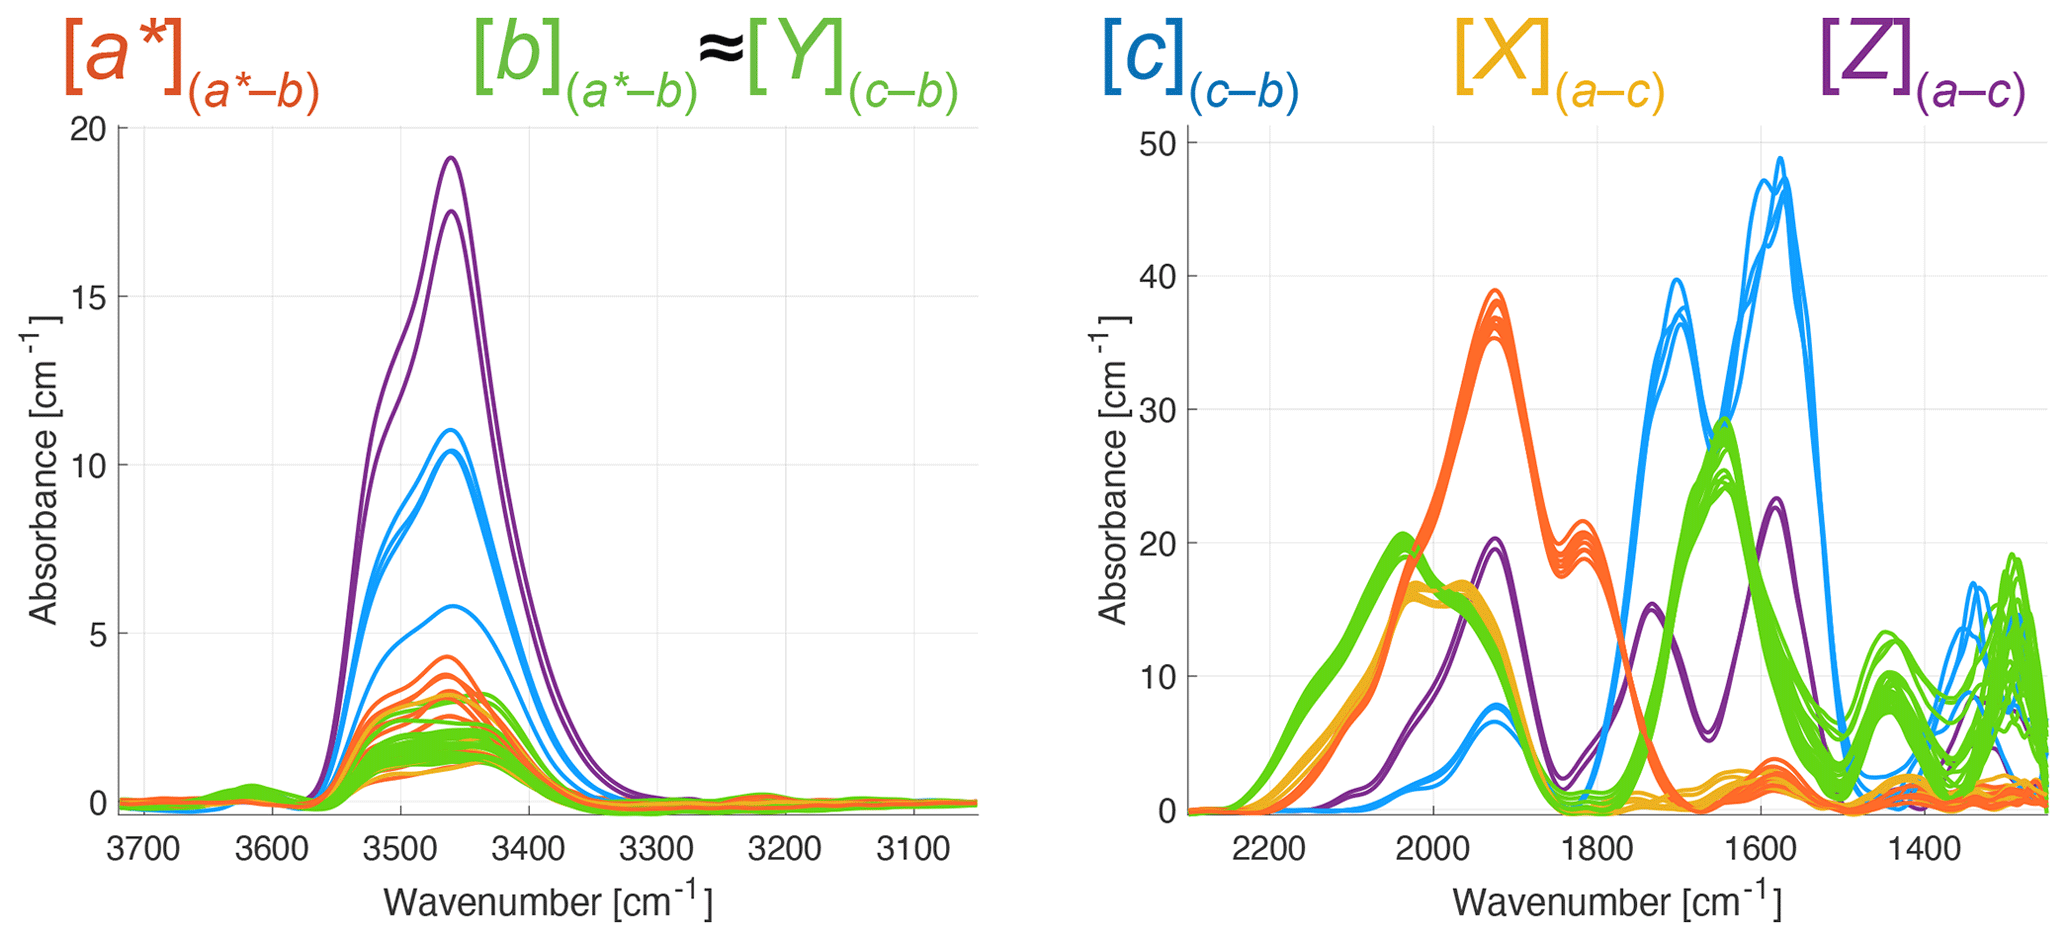
Figure C10Classified endmember spectra of sample MKS_A83 show variable H2O absorbance with nearly identical Si–O overtone spectra. In the H2O region, [X](a–c) and [Z](a–c) are the spectral endmembers in the spectral range between 3300–3570 cm−1, whereas and form the endmembers in the range between 3570–3650 cm−1. Spectral endmembers , [Y](b–c), and [c](c–b) define the highest and lowest domains of all spectra, whereas [X](a–c) and [Z](a–c) are located in between , [Y](b–c), and [c](c–b).
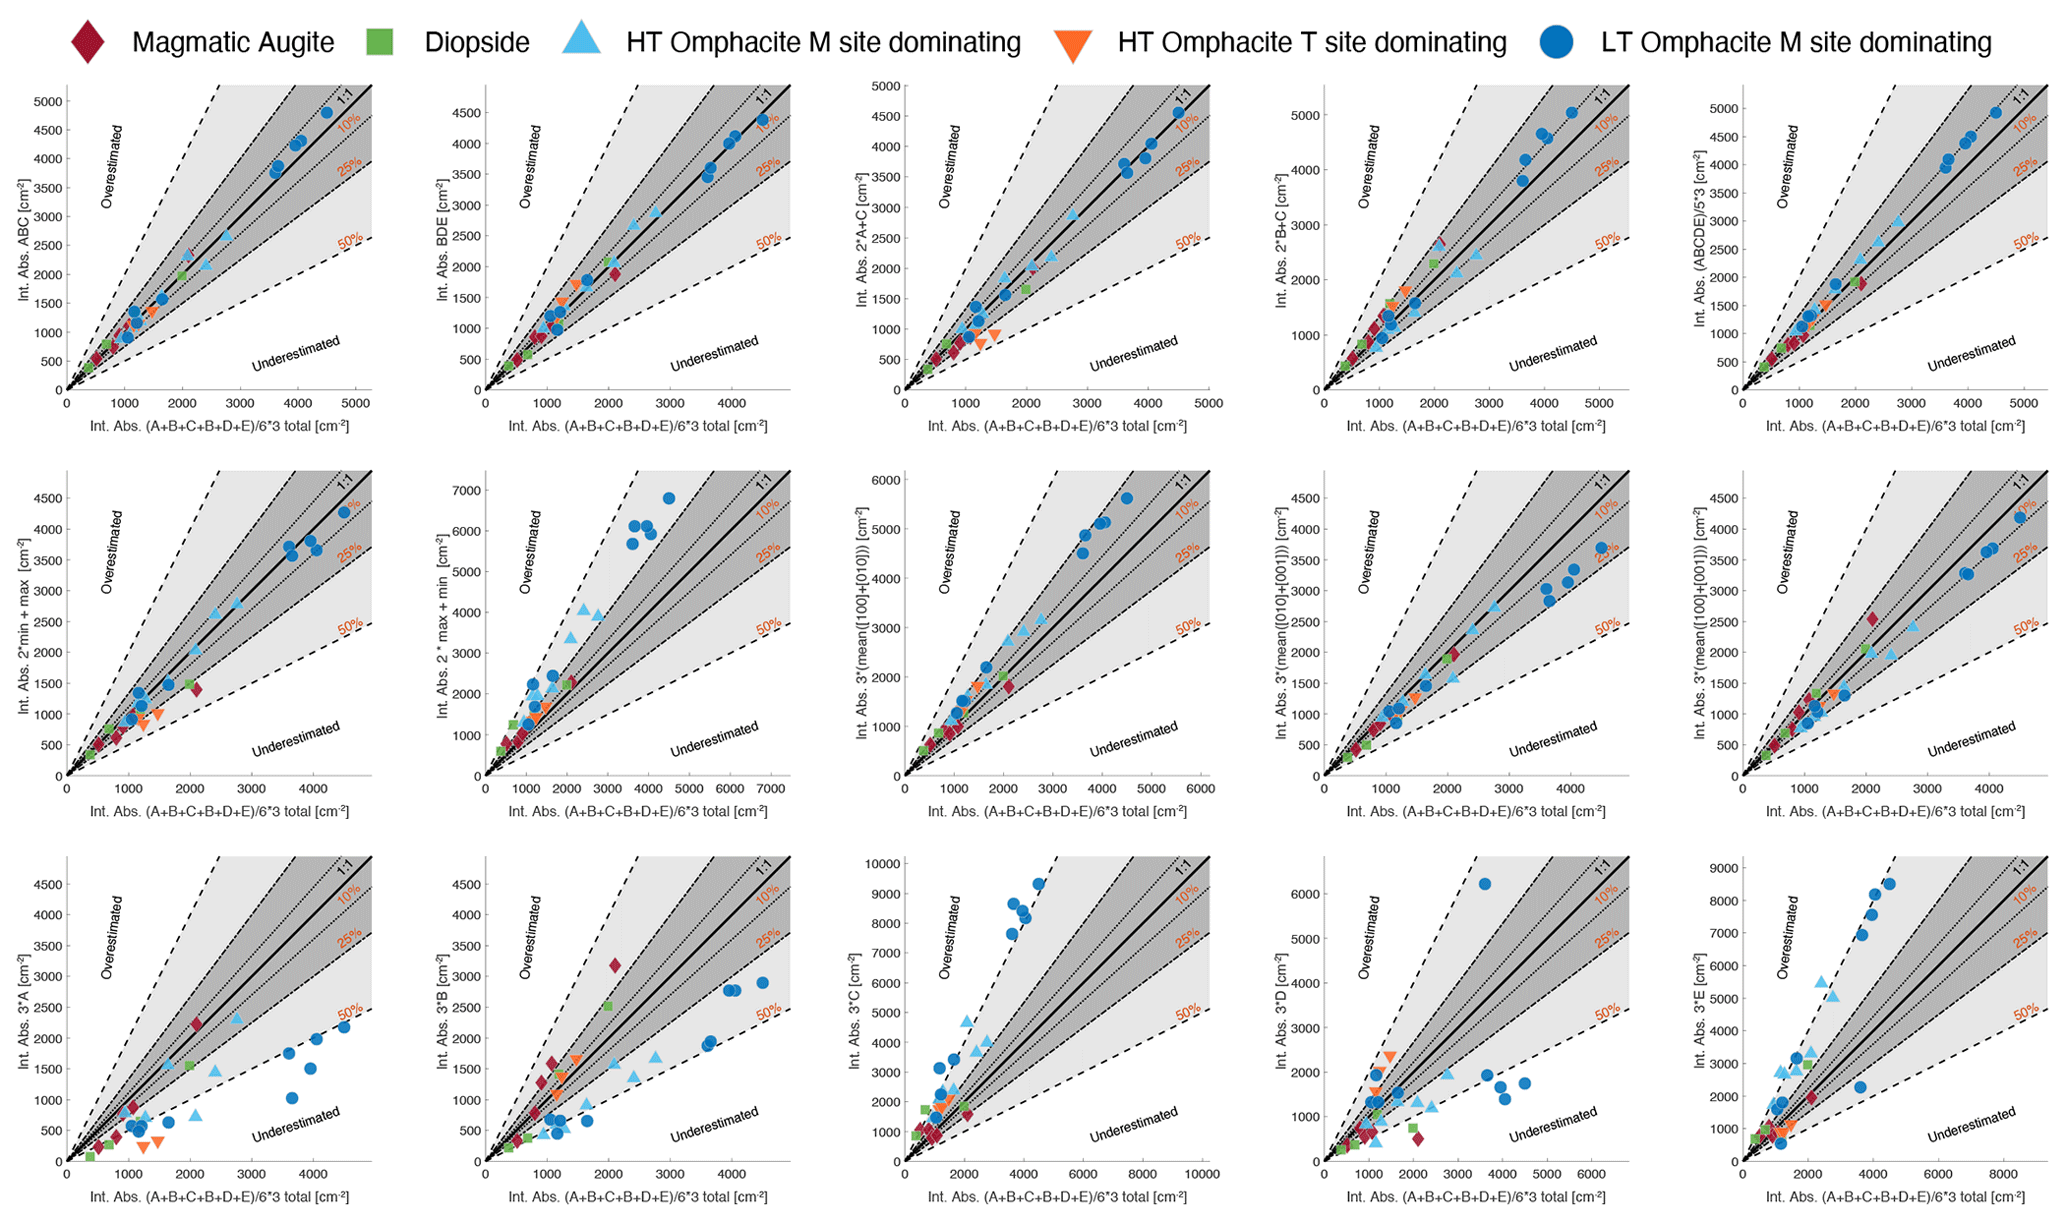
Figure C11Comparison of different methods to estimate the total integrated absorbance (y axes) with the approximated integrated absorbance (approx. total int. abs. total = on the x axes). Different clinopyroxene types are displayed with different symbols. The total integrated absorbance calculated using all spectral endmembers is in good agreement with the results obtained by the combination of (top left) or (top row, second from left). Additionally, for some samples with known polarisation behaviour, additional recipes can be employed, resulting in a deviation of less than 10 % (e.g. or [Y](b–c))+[c](b–c), , or ; see text for details).
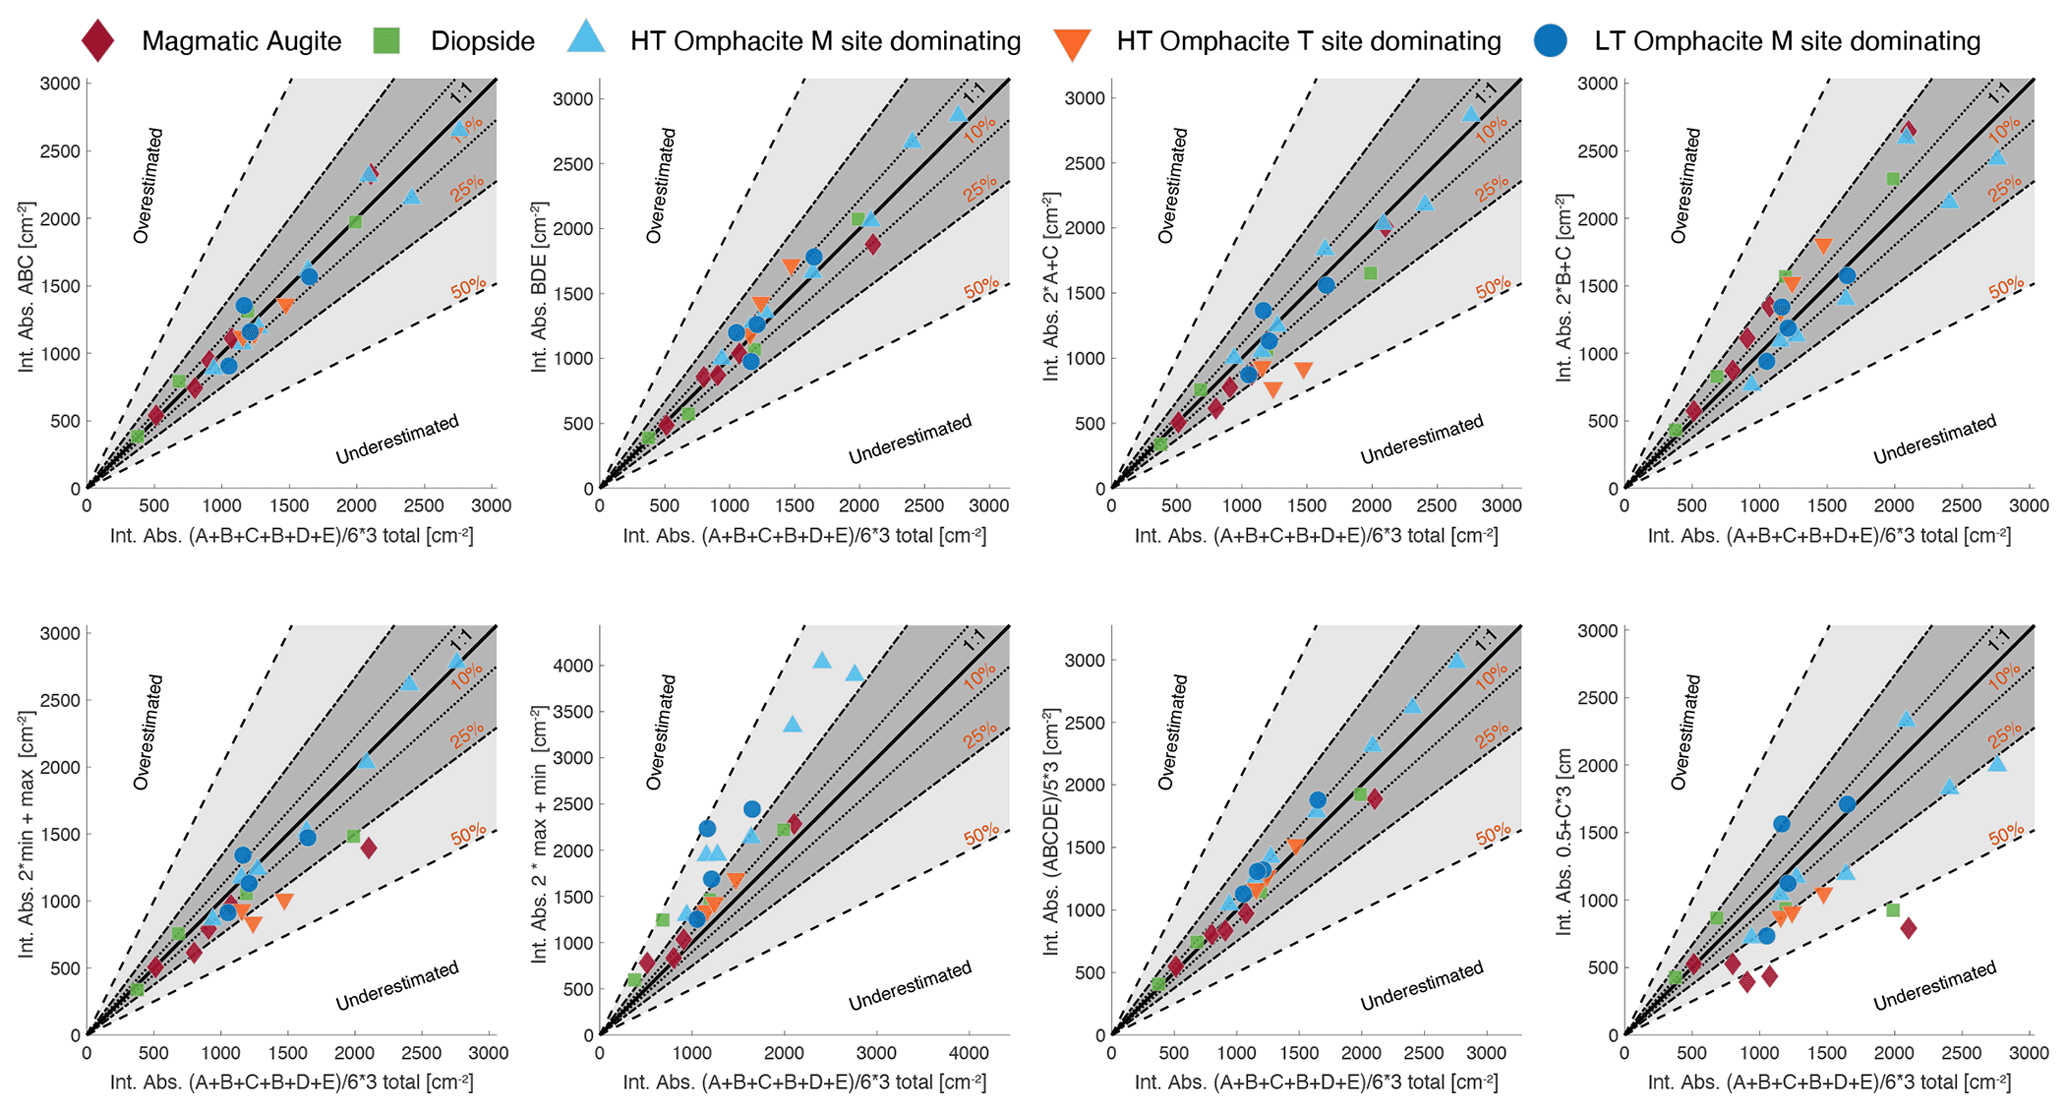
Figure C12Same as Fig. C11, with y axes limited from 0 to 3000 cm2 to visualise samples with lower absorbance. Comparison of different methods to estimate the total integrated absorbance (y axes) with the approximated integrated absorbance (approx. total int. abs. total = on the x axes). Different clinopyroxene types are displayed with different symbols. The total integrated absorbance calculated using all spectral endmembers is in good agreement with the results obtained by the combination of (top left) or (top row, second from left). Additionally, for some samples with known polarisation behaviour, additional recipes can be employed, resulting in a deviation of less than 10 % (e.g. or [Y](b–c))+[c](b–c), , or ; see text for details).
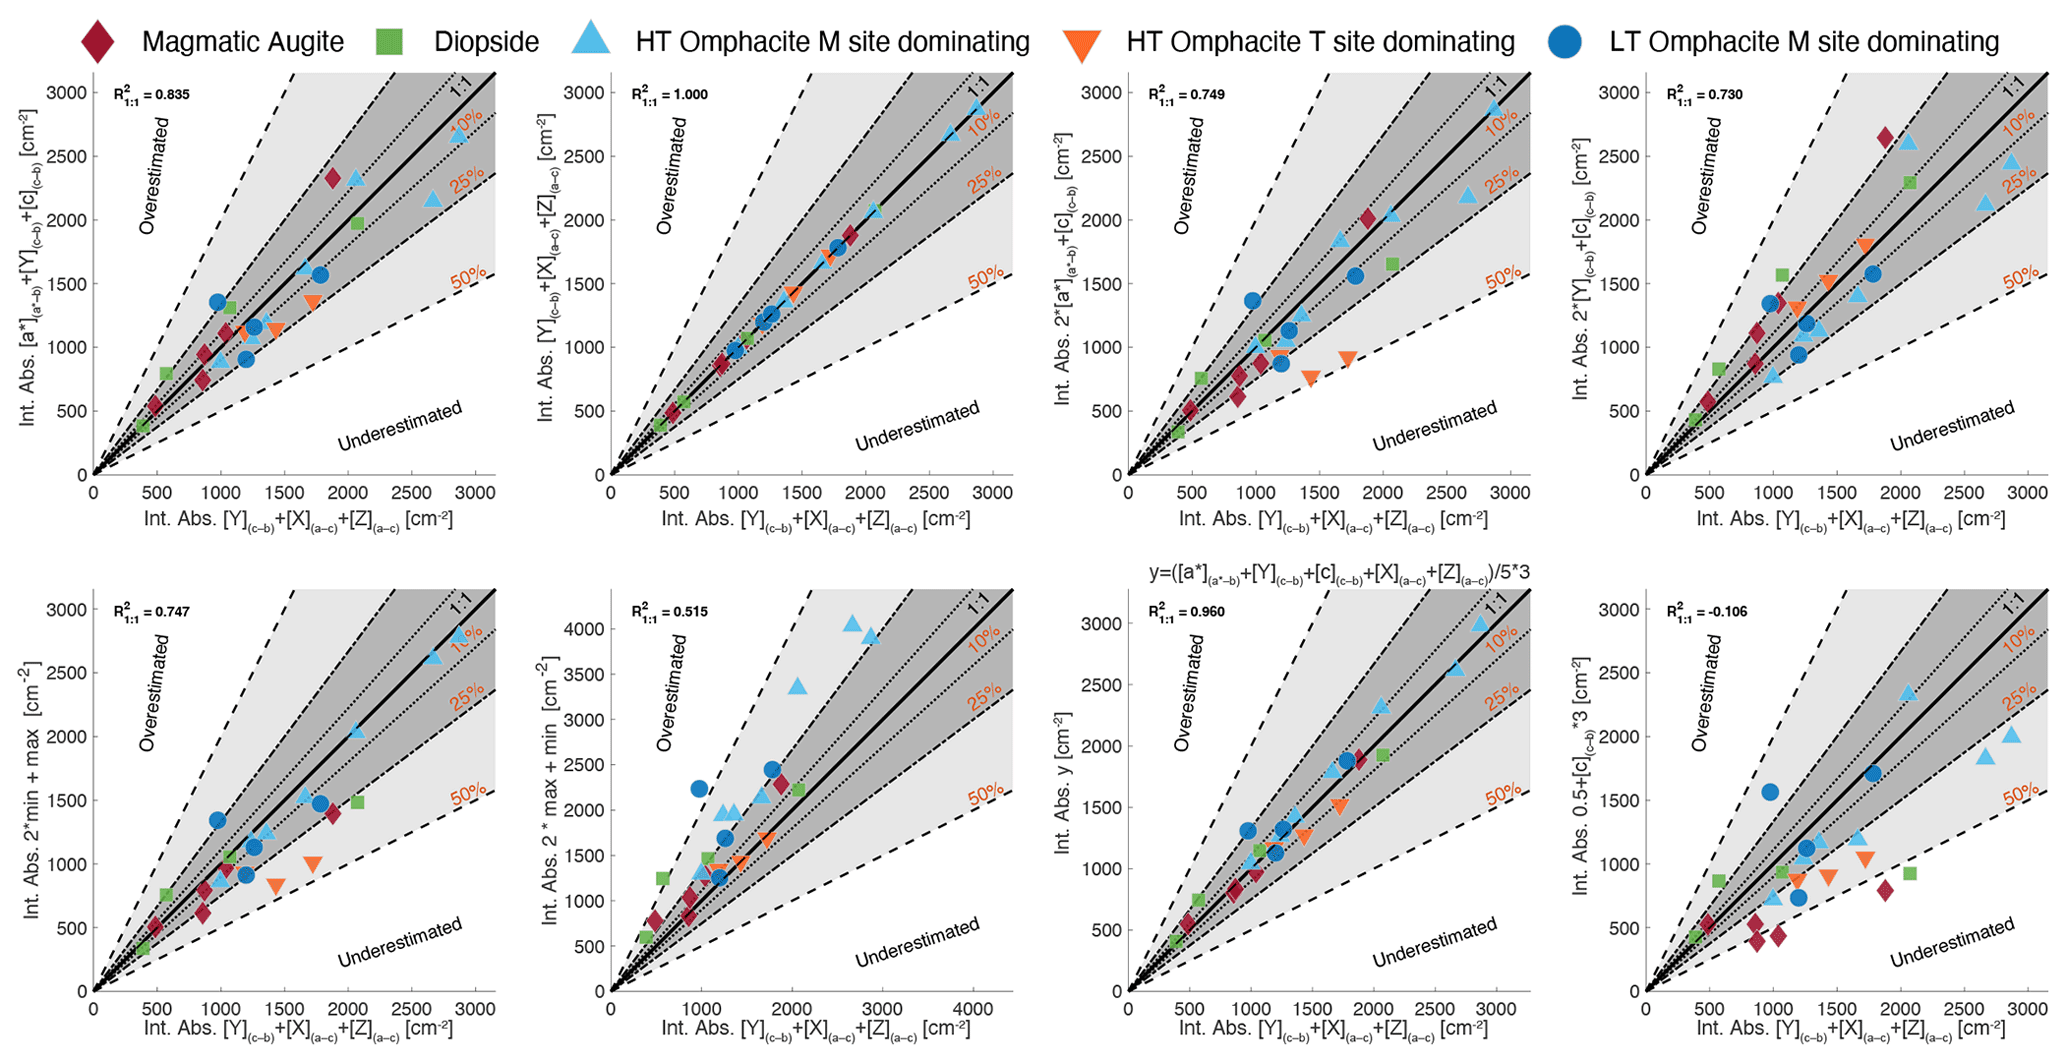
Figure C13Comparison of different methods to estimate the total integrated absorbance (y axes) with the approximated integrated absorbance (approx. total int. abs. total = on the x axes). Different clinopyroxene types are displayed with different symbols.
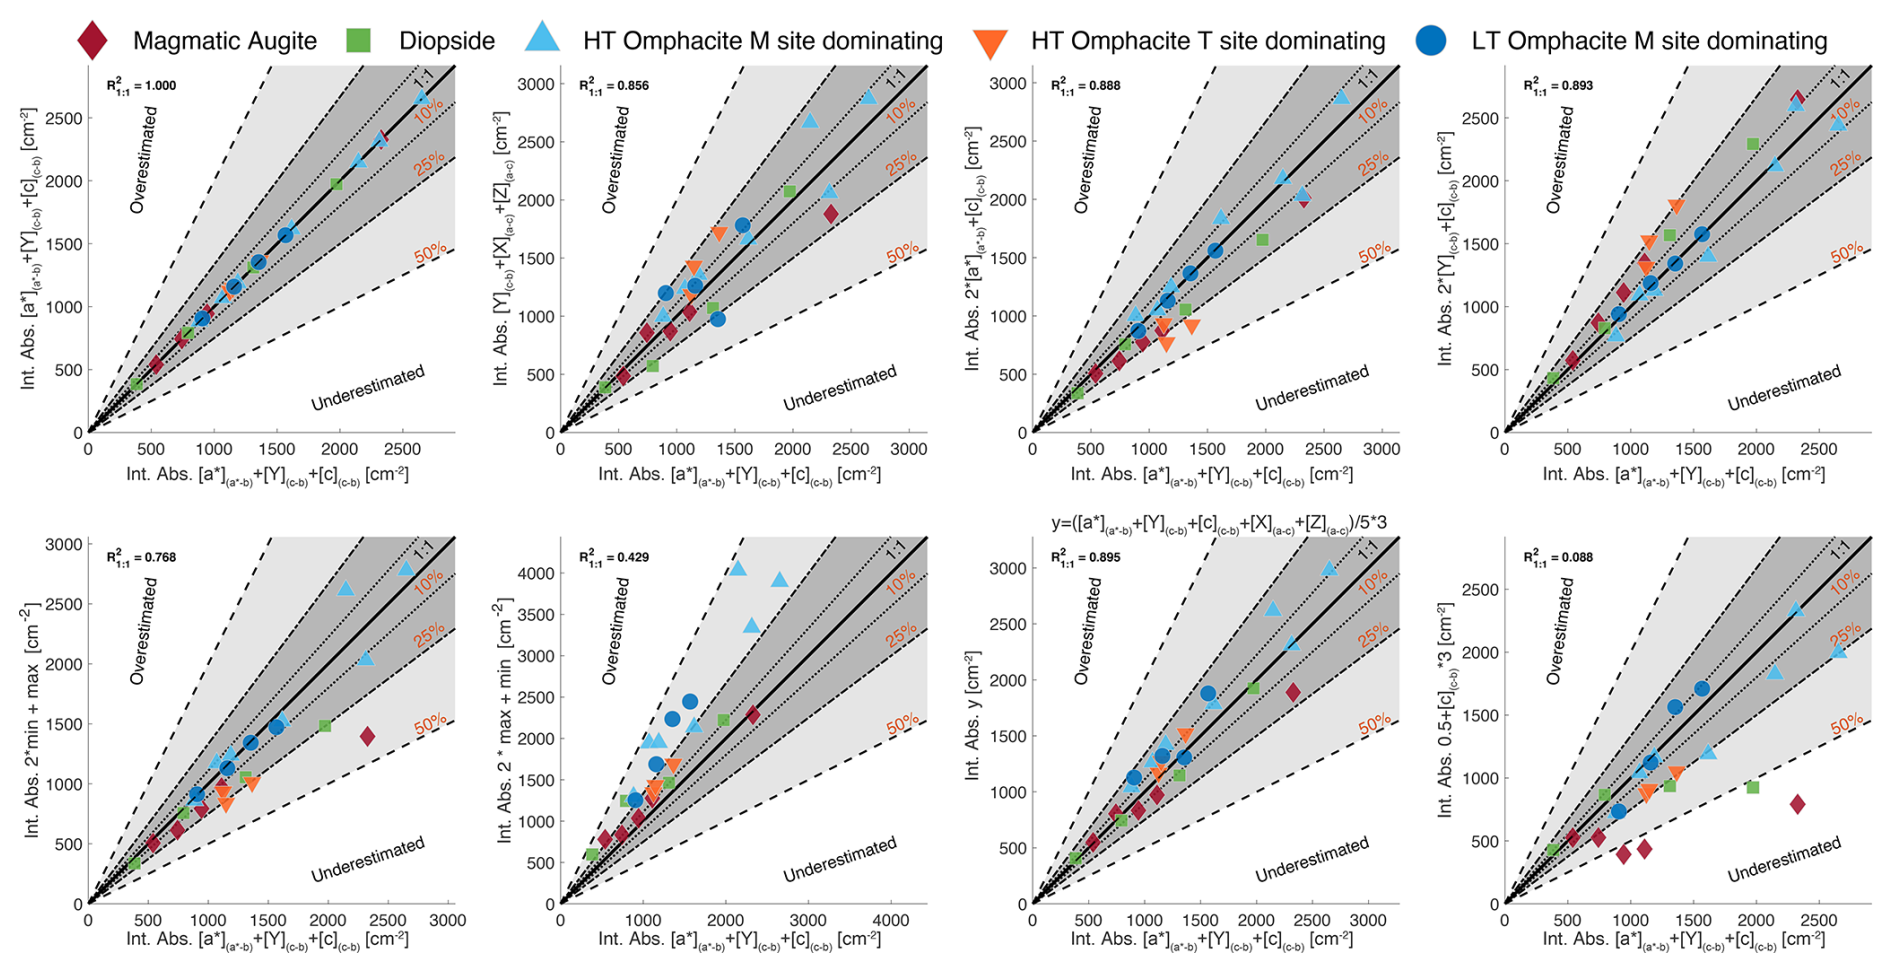
Figure C14Comparison of different methods to estimate the total integrated absorbance (y axes) with the approximated integrated absorbance (approx. total int. abs. total = on the x axes). Different clinopyroxene types are displayed with different symbols.
The software SpecXY can be downloaded from GitHub: https://github.com/NilsGies/SpecXY_Public (9 September 2026, Gies et al., 2024).
Hardware developments are available in the Supplement and from GitHub: https://github.com/NilsGies/OpenPolariser (9 September 2026).
Raw data will be made available on request.
The supplement related to this article is available online at https://doi.org/10.5194/ejm-38-583-2026-supplement.
NBG: conceptualisation, data curation, formal analysis, investigation, methodology, software, validation, visualisation, writing (original draft preparation). JH: funding acquisition, project administration, resources, investigation, supervision, writing (review and editing). GC: investigation, methodology, writing (review and editing). SA: resources, writing (review and editing).
The contact author has declared that none of the authors has any competing interests.
Publisher's note: Copernicus Publications remains neutral with regard to jurisdictional claims made in the text, published maps, institutional affiliations, or any other geographical representation in this paper. The authors bear the ultimate responsibility for providing appropriate place names. Views expressed in the text are those of the authors and do not necessarily reflect the views of the publisher.
Stephan Brechbühl is thanked for the precise and excellent preparation of the smallest cubes and thick sections of single crystals; without those this work would not have been possible. Thomas Pettke is thanked for providing the quartz sample. Beda Hofmann and the Naturhistorisches Museum Bern are thanked for providing samples NMBE_8755 and NMBE_B9404. Benjamin Klein is thanked for providing sample AB_22_3. Matthias Konrad-Schmolke is thanked for providing samples MKS_A83 and MKS_SB. Francesca Piccoli and Julia Dietrich are thanked for the assistance with the EPMA measurements. Pierre Lanari and Sarah Degen are thanked for the many fruitful discussions and suggestions regarding software development. Corin Jorgenson is thanked for the insightful comments and feedback on an earlier draft of this paper. We also thank Roland Stalder and Etienne Balan for the editorial handling and two reviewers, Sylvie Demouchy and Tony Withers, for their thorough and helpful reviews that greatly improved this work.
This research has been supported by the Schweizerischer Nationalfonds zur Förderung der Wissenschaftlichen Forschung (grant no. 200020–196927) and the Deutsche Forschungsgemeinschaft (grant no. 467591567).
This paper was edited by Roland Stalder and reviewed by Sylvie Demouchy and Tony Withers.
Andrut, M., Wildner, M., Ingrin, J., and Beran, A.: Mechanisms of OH defect incorporation in naturally occurring, hydrothermally formed diopside and jadeite, Phys. Chem. Miner., 34, 543–549, https://doi.org/10.1007/s00269-007-0169-3, 2007.
Asimow, P. D., Stein, L. C., Mosenfelder, J. L., and Rossman, G. R.: Quantitative polarized infrared analysis of trace OH in populations of randomly oriented mineral grains, Am. Mineral., 91, https://doi.org/10.2138/am.2006.1937, 2006.
Aulbach, S., Höfer, H. E., and Gerdes, A.: High-Mg and Low-Mg Mantle eclogites from Koidu (West African Craton) linked by neoproterozoic ultramafic melt metasomatism of subducted archaean plateau-like oceanic crust, J. Petrol., 60, https://doi.org/10.1093/petrology/egz011, 2019.
Aulbach, S., Stalder, R., Massuyeau, M., Stern, R. A., Ionov, D. A., and Korsakov, A. v.: Water in Omphacite and Garnet From Pristine Xenolithic Eclogite: T-X-fO2 Controls, Retentivity, and Implications for Electrical Conductivity and Deep H2O Recycling, Geochem. Geophy. Geosy., 24, https://doi.org/10.1029/2023GC011170, 2023.
Aulbach, S., Gies, N. B., Linckens, J., Stalder, R., and Viljoen, F.: Inhibited hydrogen uptake in metasomatised cratonic eclogite, Contrib. Mineral. Petr., 179, 77, https://doi.org/10.1007/s00410-024-02157-6, 2024.
Balan, E., Paulatto, L., Liu, J., and Ingrin, J.: Low-temperature infrared spectrum and atomic-scale structure of hydrous defects in diopside, Eur. J. Mineral., 32, 505–520, https://doi.org/10.5194/ejm-32-505-2020, 2020.
Bell, D. R., Rossman, G. R., Maldener, J., Endisch, D., and Rauch, F.: Hydroxide in olivine: A quantitative determination of the absolute amount and calibration of the IR spectrum, J. Geophys. Res.-Sol. Ea., 108, https://doi.org/10.1029/2001jb000679, 2003.
Bell, D. R., Rossman, G. R., and Moore, R. O.: Abundance and partitioning of OH in a high-pressure magmatic system: megacrysts from the Monastery kimberlite, South Africa, J. Petrol., 45, 1539–1564, 2004.
Beran, A. and Zemann, J.: Messung des Ultrarot-Pleochroismus von Mineralen VIII. Der Pleochroismus der OH-Streckfrequenz in Andalusit, in: Tschermaks Miner. u. Petrogr. Mitt (Vol. 18), https://doi.org/10.1007/BF01081565, 1969.
Bromiley, G. D. and Keppler, H.: An experimental investigation of hydroxyl solubility in jadeite and Na-rich clinopyroxenes, Contrib. Mineral. Petr., 147, 189–200, https://doi.org/10.1007/s00410-003-0551-1, 2004.
Demouchy, S. and Bolfan-Casanova, N.: Distribution and transport of hydrogen in the lithospheric mantle: A review, Lithos, 240–243, https://doi.org/10.1016/j.lithos.2015.11.012, 2016.
Dowty, E.: Absorption optics of low-symmetry crystals – Application to titanian clinopyroxene spectra, Phys. Chem. Miner., 3, 173–181, https://doi.org/10.1007/BF00308120, 1978.
Ferriss, E., Plank, T., and Walker, D.: Site-specific hydrogen diffusion rates during clinopyroxene dehydration, Contrib. Mineral. Petr., 171, https://doi.org/10.1007/s00410-016-1262-8, 2016.
Férot, A. and Bolfan-Casanova, N.: Water storage capacity in olivine and pyroxene to 14 GPa: Implications for the water content of the Earth's upper mantle and nature of seismic discontinuities, Earth Planet. Sc. Lett., 349, 218–230, 2012.
Gies, N. B., Lanari, P., and Hermann, J.: A workflow and software solution for spatially resolved spectroscopic and numerical data (SpecXY), Comput. Geosci., 189, https://doi.org/10.1016/j.cageo.2024.105626, 2024.
Gose, J. and Schmädicke, E.: H2O in omphacite of quartz and coesite eclogite from Erzgebirge and Fichtelgebirge, Germany, J. Metamorph. Geol., 40, 665–686, https://doi.org/10.1111/jmg.12642, 2022.
Giuliani, A., Gies, N. B., Faccanoni, A., Hermann, J., De Hoog, J. C., Padrón-Navarta, J. A., Cayzer, N., and Schmidt, M. W.: Hydrogen zoning in olivine from kimberlites based on coupled FTIR and SIMS analyses: significance for H2O distribution in the lithospheric mantle and H2O concentrations in kimberlite melts, J. Petrol., 66, egaf018, https://doi.org/10.1093/petrology/egaf018, 2025.
Hu, Y., Guo, S., Hermann, J., Gies, N. B., Zhang, D., and Li, X.: Coupled fluorine and hydroxyl incorporation into forsterite, Am. Mineral., 111, 805–814, https://doi.org/10.2138/am-2025-9762, 2026.
Ingrin, J. and Skogby, H.: Hydrogen in nominally anhydrous upper-mantle minerals: concentration levels and implications, Eur. J. Mineral, 12, https://doi.org/10.1127/ejm/12/3/0543, 2000.
Ingrin, J., Hercule, S., and Charton, T.: Diffusion of hydrogen in diopside: results of dehydration experiments, J. Geophys. Res., 100, https://doi.org/10.1029/95jb00754, 1995.
Jackson, A., Parker, R. L., Sambridge, M., Constable, C., and Wolf, A. S.: The inverse problem of unpolarized infrared spectroscopy of geological materials: Estimation from noisy random sampling of a quadratic form, Am. Mineral., 103, 1176–1184, 2018.
Jamtveit, B., Brooker, R., Brooks, K., Larsen, L. M., and Pedersen, T.: The water content of olivines from the North Atlantic Volcanic Province, Earth Planet. Sc. Lett., 186, 401–415, 2001.
Jiang, P., Liu, H., Skogby, H., Chen, R. X., and Yang, X.: Water in omphacite fingerprints the thermal history of eclogites, Geology, 50, 316–320, https://doi.org/10.1130/G49566.1, 2022.
Johnson, E. A., Rossman, G. R., Dyar, M. D., and Valley, J. W.: Correlation between OH concentration and oxygen isotope diffusion rate in diopsides from the Adirondack Mountains, New York, Am. Mineral., 87, https://doi.org/10.2138/am-2002-0713, 2002.
Jollands, M. C., Blanchard, M., and Balan, E.: Structure and theoretical infrared spectra of OH defects in quartz, Eur. J. Mineral., 32, 311–323, https://doi.org/10.5194/ejm-32-311-2020, 2020.
Karimova, A. and Stalder, R.: OH in diopside and enstatite at 6 GPa in the system CaO–MgO–SiO2–H2O, Eur. J. Mineral., 25, https://doi.org/10.1127/0935-1221/2013/0025-2253, 2013.
Koch-Müller, M., Matsyuk, S. S., and Wirth, R.: Hydroxyl in omphacites and omphacitic clinopyroxenes of upper mantle to lower crustal origin beneath the Siberian platform, Am. Mineral., 89, https://doi.org/10.2138/am-2004-0701, 2004.
Koch-Müller, M., Abs-Wurmbach, I., Rhede, D., Kahlenberg, V., and Matsyuk, S.: Dehydration experiments on natural omphacites: Qualitative and quantitative characterization by various spectroscopic methods, Phys. Chem. Miner., 34, 663–678, https://doi.org/10.1007/s00269-007-0181-7, 2007.
Kovács, I., Hermann, J., O'Neill, H. S. C., Gerald, J. F., Sambridge, M., and Horváth, G.: Quantitative absorbance spectroscopy with unpolarized light: Part II. Experimental evaluation and development of a protocol for quantitative analysis of mineral IR spectra, Am. Mineral., 93, https://doi.org/10.2138/am.2008.2656, 2008.
Lemaire, C., Kohn, S. C., and Brooker, R. A.: The effect of silica activity on the incorporation mechanisms of water in synthetic forsterite: A polarised infrared spectroscopic study, Contrib. Mineral. Petr., 147, https://doi.org/10.1007/s00410-003-0539-x, 2004.
Libowitzky, E. and Rossman, G. R.: Principles of quantitative absorbance measurements in anisotropic crystals, Phys. Chem. Miner., 23, https://doi.org/10.1007/BF00199497, 1996.
Mosenfelder, J. L. and Rossman, G. R.: Analysis of hydrogen and fluorine in pyroxenes: II. Clinopyroxene, Am. Mineral., 98, https://doi.org/10.2138/am.2013.4413, 2013.
Peslier, A. H., Luhr, J. F., and Post, J.: Low water contents in pyroxenes from spinel-peridotites of the oxidized, sub-arc mantle wedge, Earth Planet. Sc. Lett., 201, 69–86, 2002.
Purwin, H., Stalder, R., and Skogby, H.: Hydrogen incorporation in Fe-and Na-doped diopsides, Eur. J. Mineral., 21, 691–704, https://doi.org/10.1127/0935-1221/2009/0021-1938, 2009.
Sambridge, M., Gerald, J. F., Kovács, I., O'Neill, H. S. C., and Hermann, J.: Quantitative absorbance spectroscopy with unpolarized light: Part I. Physical and mathematical development, Am. Mineral., 93, https://doi.org/10.2138/am.2008.2657, 2008.
Schmädicke, E., Gose, J., and Stachel, T.: Water in eclogite and pyroxenite xenoliths from the bottom 100 km of the slave craton (Canada) mantle root, Geochem. Geophys. Geosy., 26, e2024GC011922, https://doi.org/10.1029/2024GC011922, 2025.
Shuai, K. and Yang, X.: Quantitative analysis of H-species in anisotropic minerals by polarized infrared spectroscopy along three orthogonal directions, Contrib. Mineral. Petr., 172, https://doi.org/10.1007/s00410-017-1336-2, 2017.
Skogby, H.: Water in natural mantle minerals I: Pyroxenes, Rev. Mineral. Geochem., 62, 155–167, 2006.
Skogby, H. and Rossman, G. R.: OH- in pyroxene; an experimental study of incorporation mechanisms and stability, Am. Mineral., 74, 1059–1069, 1989.
Skogby, H., Bell, D. R., and Rossman, G. R.: Hydroxide in pyroxene: variations in the natural environment, Am. Mineral., 75, https://pubs.geoscienceworld.org/msa/ammin/article-abstract/75/7-8/764/42400/Hydroxide-in-pyroxene-variations-in-the-natural (last access: 9 September 2026), 1990.
Skogby, H., Janák, M., and Broska, I.: Water incorporation in omphacite: concentrations and compositional relations in ultrahigh-pressure eclogites from Pohorje, Eastern Alps, Eur. J. Mineral., 28, 631–639, https://doi.org/10.1127/ejm/2016/0028-2533, 2016.
Stalder, R.: OH point defects in quartz – a review, Eur. J. Mineral., 33, 145–163, https://doi.org/10.5194/ejm-33-145-2021, 2021.
Stalder, R. and Konzett, J.: OH defects in quartz in the system quartz-albite-water and granite-water between 5 and 25 kbar, Phys. Chem. Miner., 39, https://doi.org/10.1007/s00269-012-0537-5, 2012.
Stalder, R. and Ludwig, T.: OH incorporation in synthetic diopside, Eur. J. Mineral., 19, https://doi.org/10.1127/0935-1221/2007/0019-1721, 2007.
Stalder, R., Potrafke, A., Billström, K., Skogby, H., Meinhold, G., Gögele, C., and Berberich, T.: OH defects in quartz as monitor for igneous, metamorphic, and sedimentary processes, Ame. Mineral., 102, 1832–1842, https://doi.org/10.2138/am-2017-6107, 2017.
Strens, R. G. J., Mao, H. K., and Bell, P. M.: Quantitative Spectra and Optics of Some Meteoritic and Terrestrial Titanian Clinopyroxenes, in: Advances in Physical Geochemistry, edited by: Saxena, S. L., Springer New York, 327–346, https://doi.org/10.1007/978-1-4612-5683-0_11, 1982.
Sundvall, R. and Stalder, R.: Water in upper mantle pyroxene megacrysts and xenocrysts: A survey study, Am. Mineral., 96, https://doi.org/10.2138/am.2011.3641, 2011.
Tröger, W. E.: Optische Bestimmung der gesteinsbildenden Minerale: Teil 1: Bestimmungstabellen, E. Schweizerbart’sche Verlagsbuchhandlung, ISBN 978-3-510-65106-1, 1956.
Turner, M., Ireland, T., Hermann, J., Holden, P., Padrón-Navarta, J. A., Hauri, E. H., and Turner, S.: Sensitive high resolution ion microprobe–stable isotope (SHRIMP-SI) analysis of water in silicate glasses and nominally anhydrous reference minerals, J. Anal. Atom. Spectrom., 30, 1706–1722, https://doi.org/10.1039/c5ja00047e, 2015.
Walters, J. B. and Gies, N. B.: MinPlotX: A powerful tool for formula recalculation, visualization, and comparison of large mineral compositional datasets, Mineralogia, 56, 13–22, https://doi.org/10.2478/mipo-2025-0003, 2025.
Winter, M. E.: N-FINDR: An algorithm for fast autonomous spectral end-member determination in hyperspectral data, P. Soc. Photo.-Opt. Ins., 3753, https://doi.org/10.1117/12.366289, 1999.
Withers, A. C.: On the use of unpolarized infrared spectroscopy for quantitative analysis of absorbing species in birefringent crystals, Am. Mineral., 98, https://doi.org/10.2138/am.2013.4316, 2013.