the Creative Commons Attribution 4.0 License.
the Creative Commons Attribution 4.0 License.
 | 13 Aug 2026
Fengruiite, [Ag6Sb2S7][Ag9CuS2Te2], a new Ag–Sb–Te sulfosalt mineral from the Haopinggou Ag–Pb–Zn–Au deposit, eastern Qinling, China
Yongfei Tian
Guowu Li
Ningyue Sun
Min Liu
Jingwen Mao
Yunpeng Dong
Peng Liu
Wei Jian
Wei Yao
Xiuquan Wang
Huishou Ye
Fengruiite, ideally [Ag6Sb2S7][Ag9CuS2Te2], is a new mineral species of the pearceite–polybasite group discovered in the Haopinggou Ag–Pb–Zn–Au deposit, eastern Qinling, China, and approved by the IMA Commission on New Minerals, Nomenclature and Classification as IMA 2024-045. The mineral occurs as irregular grains (< 20 × 80 µm) intergrown with galena, cervelleite, and chalcopyrite in intermediate-sulfidation epithermal veins. Fengruiite is opaque, gray with a metallic luster, and brittle and has an estimated Mohs hardness of 3–4. EPMA analyses yield Ag (65.9 wt %–68.6 wt %), S (12.6 wt %–13.1 wt %), Sb (9.1 wt %–10.1 wt %), Te (6.3 wt %–7.6 wt %), and Cu (3.3 wt %–3.8 wt %), corresponding to the empirical formula [(Ag5.87Cu0.29)Σ6.16(Sb1.89As0.03)Σ1.92S7] [Ag9CuS2(Te1.28S0.63)S1.91]. Fengruiite is trigonal, space group (#164), with a=7.6087(9) Å, c=11.970(2) Å, and V=600.13(17) Å3 (Z=1). Its structure consists of alternating negatively charged [Ag6Sb2S7] (A) and positively charged [Ag9CuS2Te2] (B) layers, characteristic of the polybasite-Tac polytype. The combination of a Te-dominant site in the B-layer module and S-dominant anion sites throughout the A-layer module distinguishes fengruiite from Te-rich polybasite-Tac and benleonardite. As the first structurally characterized Te-rich member of the pearceite–polybasite group reported from the East Qinling metallogenic belt, fengruiite expands the known structural and chemical diversity of Ag sulfosalts and documents Te incorporation into an Ag-rich sulfosalt structure in an epithermal system.
- Article
(4845 KB) - Full-text XML
-
Supplement
(643 KB) - BibTeX
- EndNote


Epithermal deposits represent one of the world's most significant sources of silver (Simmons et al., 2005; Wang et al., 2019). In these systems, Ag may be partially incorporated into galena, chalcopyrite, and pyrite as minor solid solution components or microscopic inclusions (Sharp and Buseck, 1993; Liu et al., 2024), but it is predominantly hosted by discrete silver-bearing minerals such as native silver, electrum, acanthite, and simple Sb–As–Bi sulfosalts like pyrargyrite, proustite, and matildite (Yuningsih and Matsueda, 2018; Palyanova, 2020; Hui et al., 2021). In the Xiayu intermediate-sulfidation epithermal Ag–Pb–Zn–Au orefield (Tian et al., 2023), our petrographic and mineralogical investigation identified a previously unrecognized Ag–Sb–Te sulfosalt phase, fengruiite, with the ideal formula [Ag6Sb2S7][Ag9CuS2Te2], in the Haopinggou deposit. Fengruiite was approved as a new mineral species by the International Mineralogical Association Commission on New Minerals, Nomenclature and Classification (IMA2024-045). It is named in honor of Rui Feng (born in 1963), a renowned geologist specializing in mineral exploration. Under his guidance, more than 5000 t of silver metal has been added to the Xiayu orefield. The naming of this new mineral recognizes Rui Feng's contributions and aims to inspire technological innovation within the mineral exploration community. The type material is deposited at the Geological Museum of China, No. 15, Yangrou Hutong, Xisi, Beijing 100031, P.R. China, catalog number GMCTM2024004.
Fengruiite was found in a galena–quartz vein sample collected underground (380 m elevation) from the H5 polymetallic sulfide orebody at the Haopinggou Ag–Pb–Zn–Au deposit (34°10′54′′ N, 111°16′55′′ E) (Fig. 1), located about 60 km southwest of Luoning County, Henan Province, China. The Haopinggou Ag–Pb–Zn–Au deposit represents the first documented case of an intermediate-sulfidation epithermal deposit within the world-class East Qinling porphyry Mo ore belt (Tian et al., 2023). The H5 is 0.3 to 2.8 m wide, extends more than 1.5 km roughly NE (50–60°), and dips 75–85° NW, with a maximum vertical extent of 640 m. The host rocks of the H5 polymetallic sulfide orebody are the amphibolite-facies metamorphic rocks of the Taihua Group, which mainly consist of biotite plagiogneiss, amphibolite gneiss, and amphibolite (Cai and Su, 1985). These rocks likely formed in the Neoarchean and have been subjected to amphibolite-facies metamorphism during the Paleoproterozoic (Ni et al., 2003; Li et al., 2007). Ag–Pb–Zn–Au mineralization occurs as open-space fillings, veins, and local hydrothermal breccias and stockworks, infilled mainly with carbonates (including siderite, ankerite, and calcite), quartz, pyrite, sphalerite, galena, chalcopyrite, and tetrahedrite (Fig. 2). Silver-bearing minerals are widespread and abundant in the galena–sphalerite–tetrahedrite assemblage, mainly including argentiferous tetrahedrite, stromeyerite, pyrargyrite, polybasite, jalpaite, cervelleite, argentite, and native silver (Li et al., 2013, 2016; Tian et al., 2023).
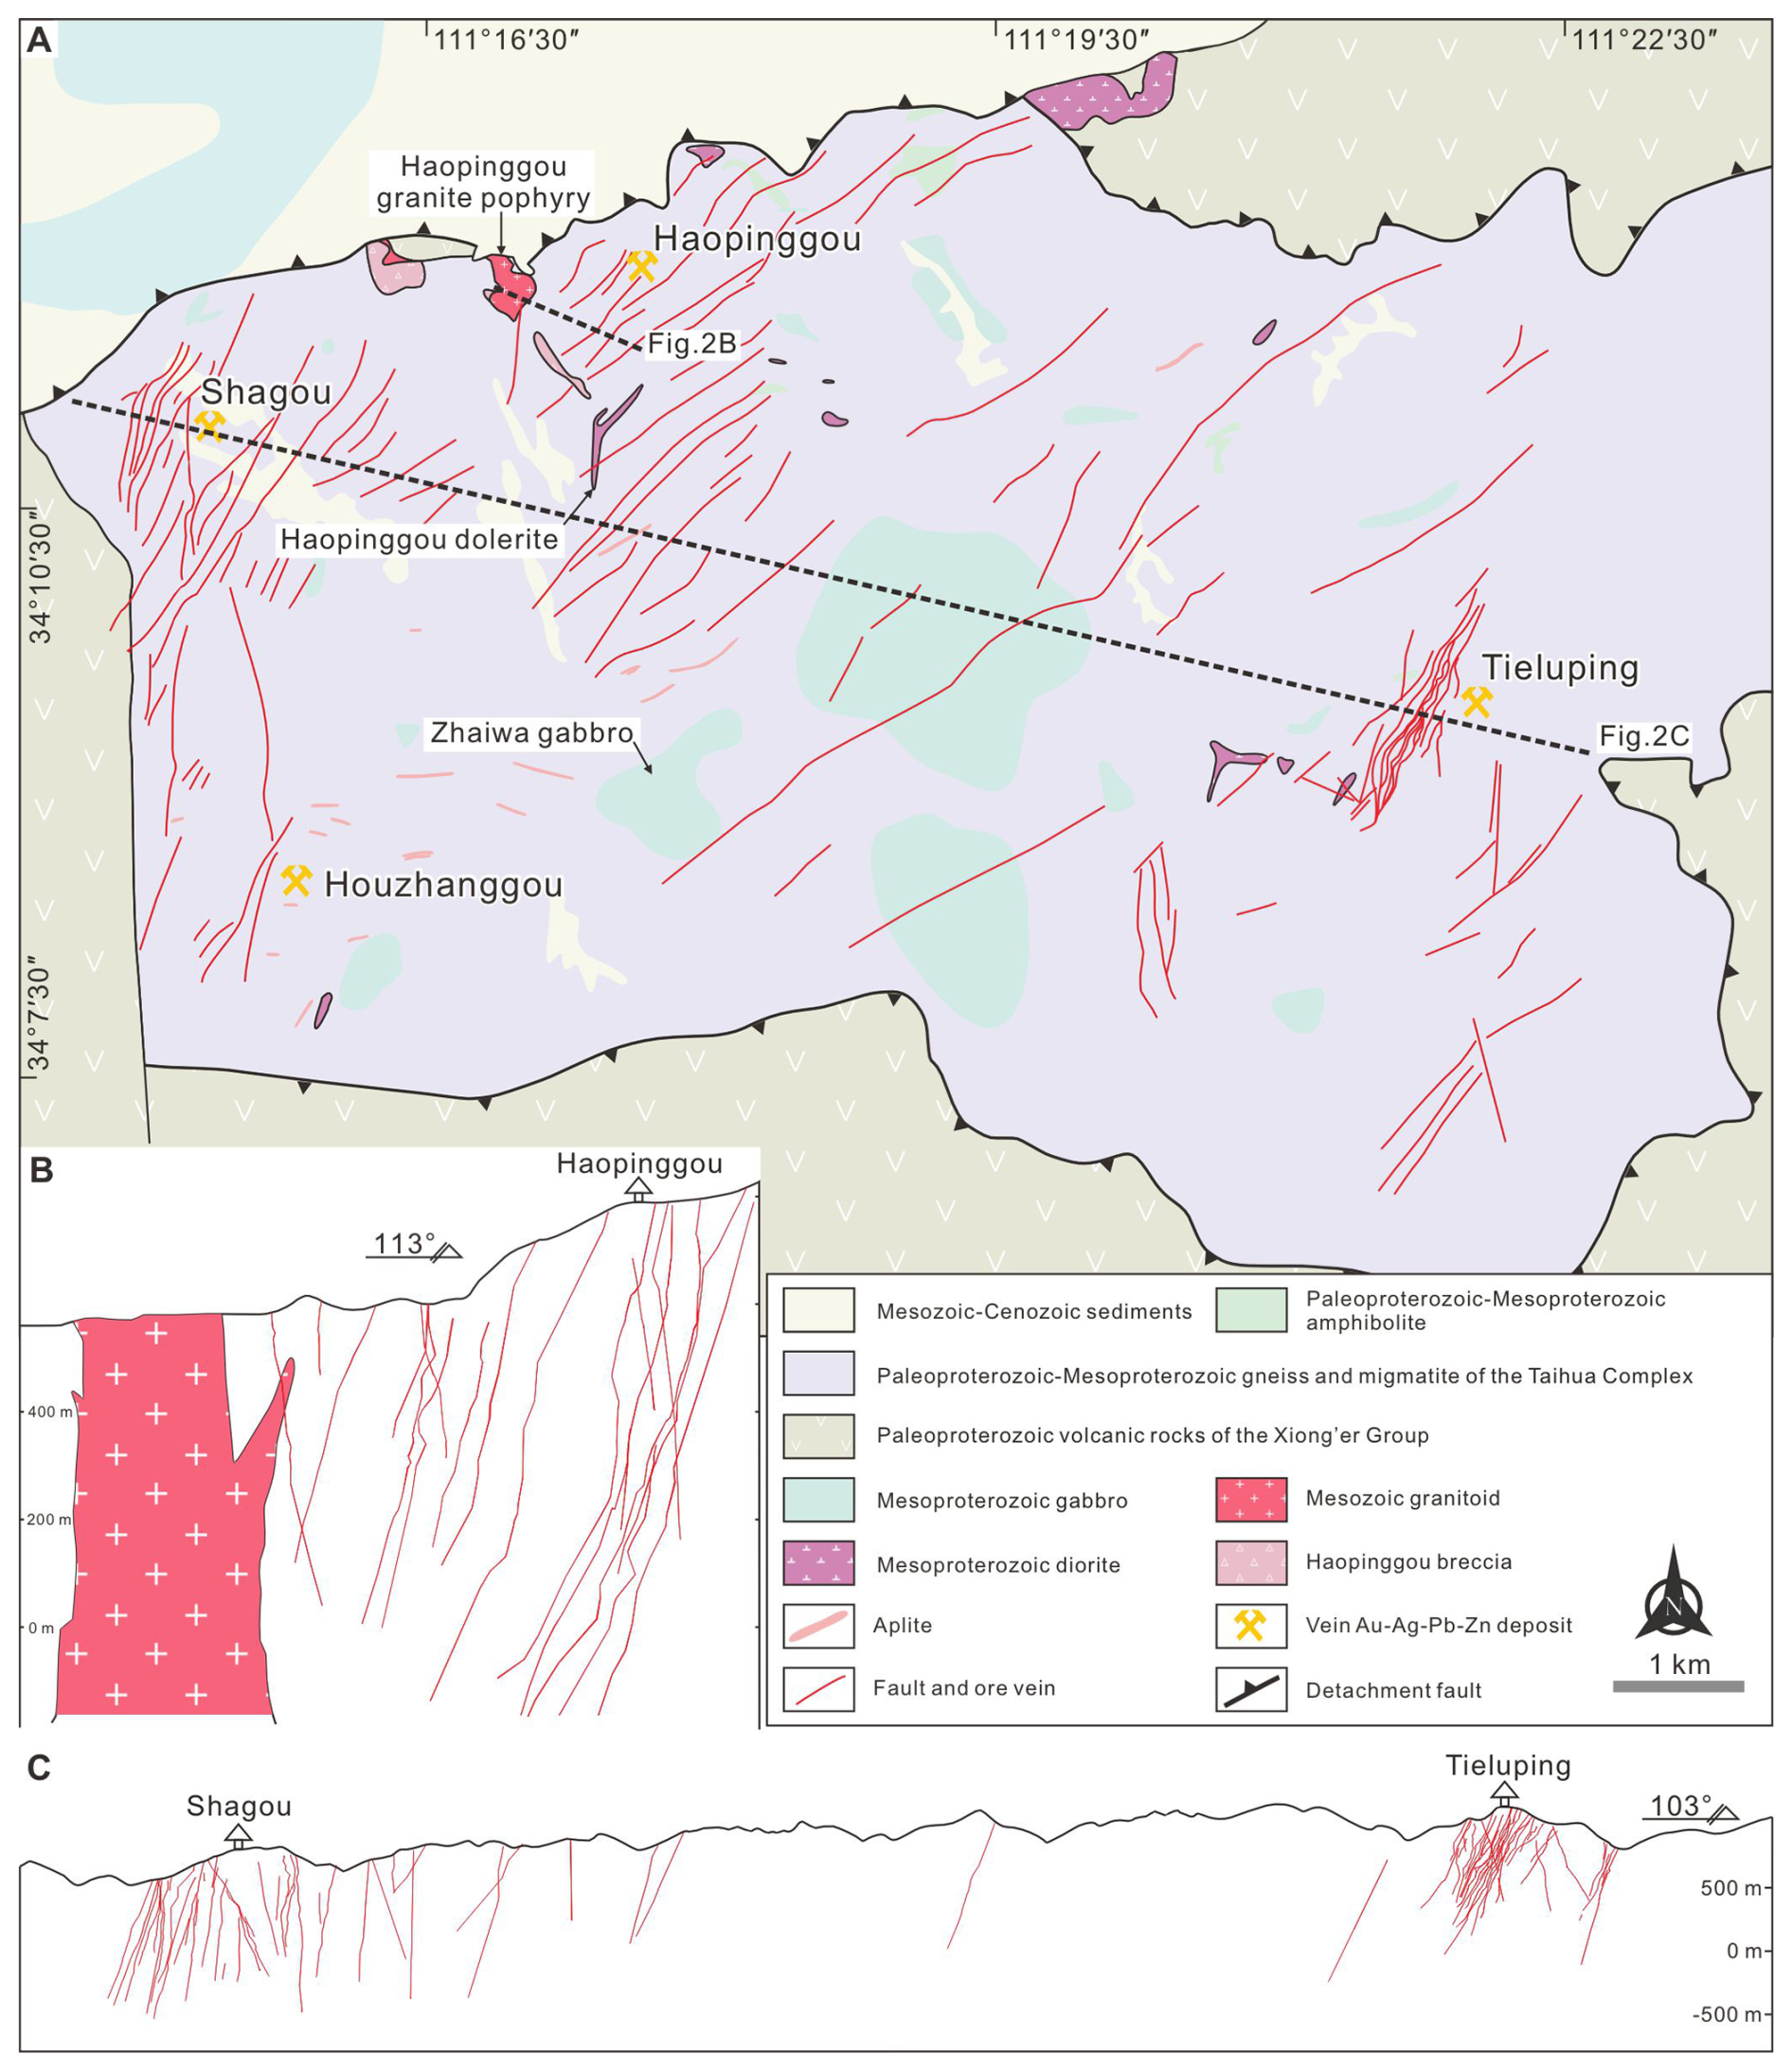
Figure 1Simplified geological map (A) and representative cross-section (B, C) of the Xiayu orefield, showing the distribution. Modified from Tian et al. (2023).
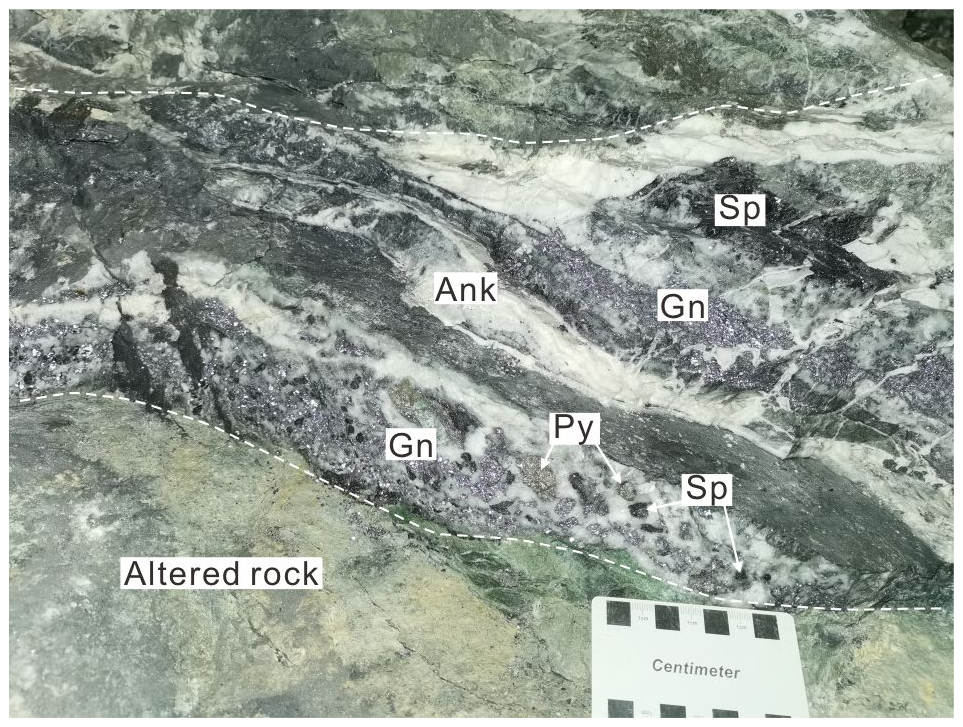
Figure 2Representative field photograph of the H5 polymetallic sulfide orebody at the Haopinggou Ag–Pb–Zn–Au deposit. Abbreviations: Ank, ankerite; Gn, galena; Py, pyrite; Sp, sphalerite.
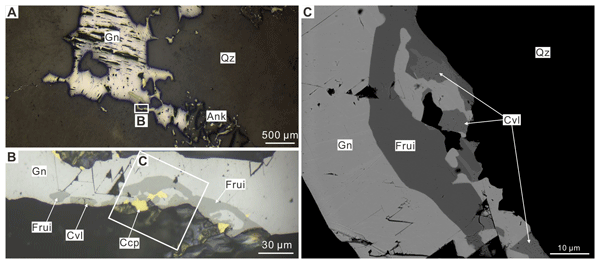
Fengruiite is intergrown with galena, cervelleite, and chalcopyrite (Fig. 3). Other minerals observed in the galena–quartz vein include quartz, ankerite, electrum, and tetrahedrite-group minerals. Fengruiite is deposited at intermediate temperatures (163–213 °C) from aqueous fluids with moderate salinities (7.2 wt %–14.0 wt % NaCl equivalent) (Li et al., 2013). The Haopinggou Ag–Pb–Zn–Au mineralization formed during Late Cretaceous magmatic–hydrothermal events (Tian et al., 2023).
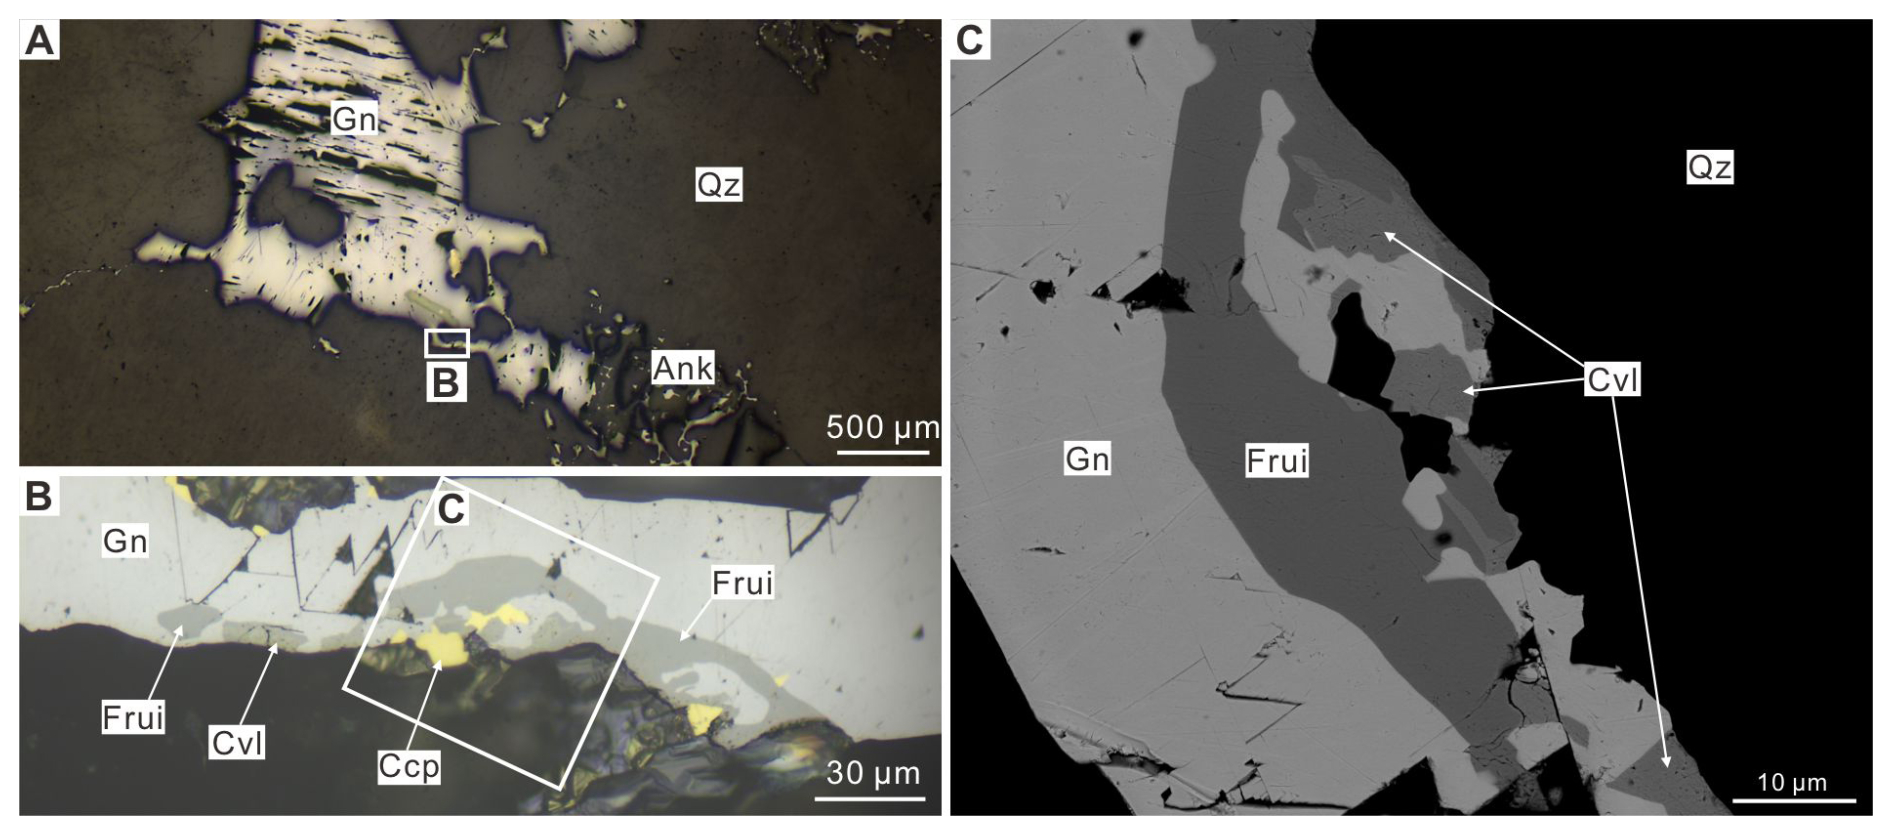
Figure 3Occurrence and mineral association of fengruiite. (A) Fengruiite (Frui) in a galena–quartz vein under reflected light; the box marks the area enlarged in (B). (B) Fengruiite intergrown with galena (Gn), chalcopyrite (Ccp), and cervelleite (Cvl) under reflected light; the box marks the area shown in (C). (C) Backscattered-electron image of the area outlined in (B). Additional abbreviations: Ank, ankerite; Qz, quartz.
3.1 Chemical composition analysis
Electron probe microanalysis (JEOL JXA-8230) was carried out at Wuhan Sample Solution Analytical Technology Co., Ltd. (Hubei, China). Quantitative chemical analyses were obtained by wavelength-dispersive X-ray spectrometry (WDS) (acceleration voltage, 20 kV; beam current, 10 nA; beam diameter, 3–5 µm; number of point analyses, 11). Crystals used were PETJ (Sb and Te), TAP (As), LIFH (Fe, Cu, and Zn), and PETH (Ag, S, and Au). The reference materials were FeAsS for S and As, Ag for Ag, CuFeS2 for Cu, and Sb2Te3 for Te and Sb. Because Ag-rich sulfosalts may be susceptible to electron-beam-induced Ag migration, the analytical stability of fengruiite was additionally evaluated using four analyses obtained with an 8 µm defocused beam at the same accelerating voltage and beam current. Each analysis was performed at a separate position on the grain to avoid repeated irradiation of the same area.
3.2 Crystal structural analysis
Because fengruiite occurs as very small intergrowths, a single domain of sufficient size and apparent homogeneity was selected from the polished section by reflected-light examination. The selected area showed no visible inclusions or fractures and was extracted as a crystal measuring 0.02 × 0.02 × 0.01 mm using a dual-beam focused ion beam platform (TESCAN GAIA 3) at the Analytical Laboratory of the Beijing Research Institute of Uranium Geology. X-ray powder and single-crystal diffraction analyses were conducted at the Science Research Institute, China University of Geosciences, Beijing. A Rigaku Oxford XtaLAB PRO-007HF single-crystal diffractometer, equipped with a rotating anode microfocus X-ray source (50 kV, 24 mA; MoKα, λ=0.71073 Å) and a hybrid pixel array detector, was used.
3.3 Raman spectroscopy analysis
Raman spectroscopy of fengruiite was conducted on the same grain used for mineral structure analysis, using a Horiba LabRAM HR Evolution micro-Raman system equipped with a 50× objective at the Experiment Center of the School of Gemmology, China University of Geosciences (Beijing), China. The measurements were performed with an excitation wavelength of 523 nm and a laser output power of 25 mW. A grating with 600 grooves mm−1 (centered at 500 nm) was employed, achieving a spectral resolution of 2 cm−1 and a spot size of 5 µm. Spectra were collected over a range of 100–4000 cm−1, with each spectrum acquired for 10 s and averaged over three accumulations.
3.4 Reflectance measurements
The reflectance value of fengruiite and the coexisting cervelleite were carried out in air on the same polished section using an ultraviolet–visible–near-infrared (UV–VIS–NIR) microspectrophotometer of CRAIC Technologies Inc., at the Instrumentation and Service Center for Molecular Sciences, Westlake University, Hangzhou. The two minerals were measured during the same analytical session under identical instrumental conditions. Before measurement, the microspectrophotometer was calibrated using aluminum metal with an MgF2 coating (λ=700 nm, R=90 %). Its calibration is traceable to NIST/NRC. Spectra were collected over the wavelength range of 400–700 nm with a spectral resolution of ≤ 2 nm. The mineral identities of the analyzed areas were independently confirmed by electron-probe microanalysis.
4.1 General appearance and physical and optical properties
Fengruiite occurs as irregular strips less than 20 × 80 µm in size. The mineral is black gray with a steel-gray to iron-black streak and a metallic luster. It is brittle, shows an uneven fracture, and displays no cleavage or parting. The Mohs hardness is estimated to be 3–4 based on scratches produced by fine calcite and fluorite particles under reflected light. Micro-indentation hardness could not be determined due to the limited grain size. The calculated density is 6.62 g cm−3, derived from the empirical formula and unit-cell volume refined from single-crystal X-ray diffraction data. Fengruiite is nonfluorescent and nonmagnetic, with the latter property confirmed using a magnetic needle. In reflected light, the mineral appears gray with a bluish tint; is opaque; and exhibits no observable pleochroism, anisotropy, bireflectance, or internal reflections. The reflectance values of fengruiite and the coexisting cervelleite are compared in Supplement Table S1. Fengruiite shows Rmax values of 32.358 %–44.680 % and Rmin values of 30.657 %–36.184 % over the wavelength range of 400–700 nm, whereas cervelleite shows Rmax values of approximately 32.5 %–35.6 % and Rmin values of approximately 30.8 %–34.8 %. The reflectance ranges of the two minerals overlap substantially over most of the measured wavelength interval, although fengruiite exhibits a distinctly higher Rmax value at 400 nm. Therefore, reflectance data alone do not provide an unequivocal means of distinguishing fengruiite from cervelleite, and their identification in the studied assemblage is primarily based on chemical composition.
4.2 Chemical composition
The Ag contents and analytical totals obtained with the 8 µm beam were comparable to those obtained with the 3–5 µm beam, and no systematic depletion of Ag was apparent between the two analytical conditions (Supplement Table S2). Time-resolved Ag count-rate profiles were not recorded during the original analyses; therefore, subtle short-term beam-induced Ag migration cannot be completely excluded. The compositional agreement between the two beam sizes, nevertheless, indicates that any such effect did not significantly influence the reported mean composition.
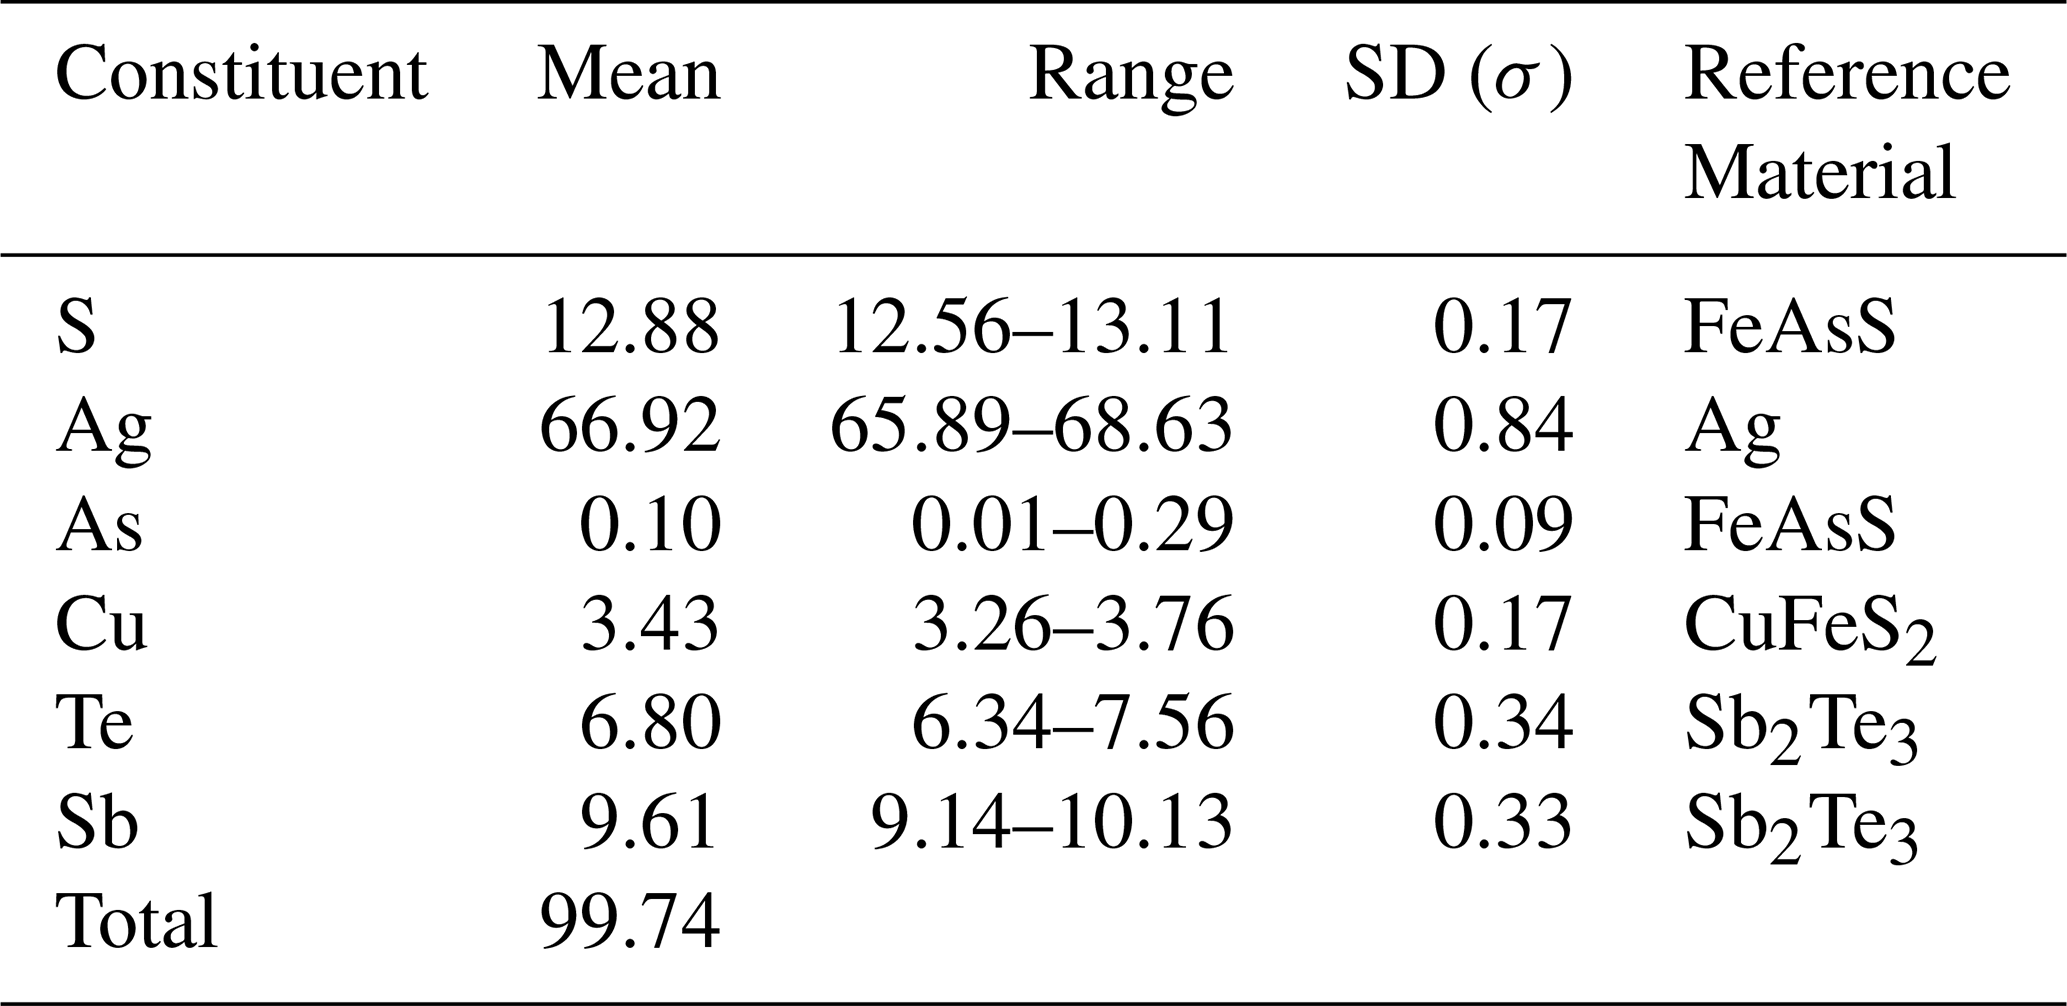
Electron probe microanalysis data show that fengruiite contains Ag (65.89 wt %–68.63 wt %), S (12.56 wt %–13.11 wt %), Sb (9.14 wt %–10.13 wt %), Te (6.34 wt %–7.56 wt %), Cu (3.26 wt %–3.76 wt %), and a minor amount of As (0.01 wt %–0.29 wt %) (Table 1). The empirical formula, normalized to 29 atoms per formula unit and partitioned between the A- and B-layer modules using the refined structural model, is [(Ag5.87Cu0.29)Σ6.16(Sb1.89As0.03)Σ1.92S7] [Ag9CuS2(Te1.28S0.63)S1.91], and the simplified formula is [(Ag,Cu)6Sb2S7][Ag9CuS2(Te,S)2]. The ideal formula is [Ag6Sb2S7][Ag9CuS2Te2], corresponding to a calculated composition S 12.84 wt %, Ag 67.20 wt %, Cu 2.64 wt %, Te 7.21 wt %, and Sb 10.11 wt %, summing to 100 wt %.
4.3 Crystal structure
The selected crystal was used to collect a hemisphere of diffraction data over the ranges , , and . The intensity data were corrected for Lorentz and polarization effects, and a multi-scan absorption correction was applied. The structure was solved by direct methods using SHELXT and refined against F2 by the full-matrix least squares method using SHELXL within OLEX2-1.3 (Dolomanov et al., 2009; Sheldrick, 2015a, b).
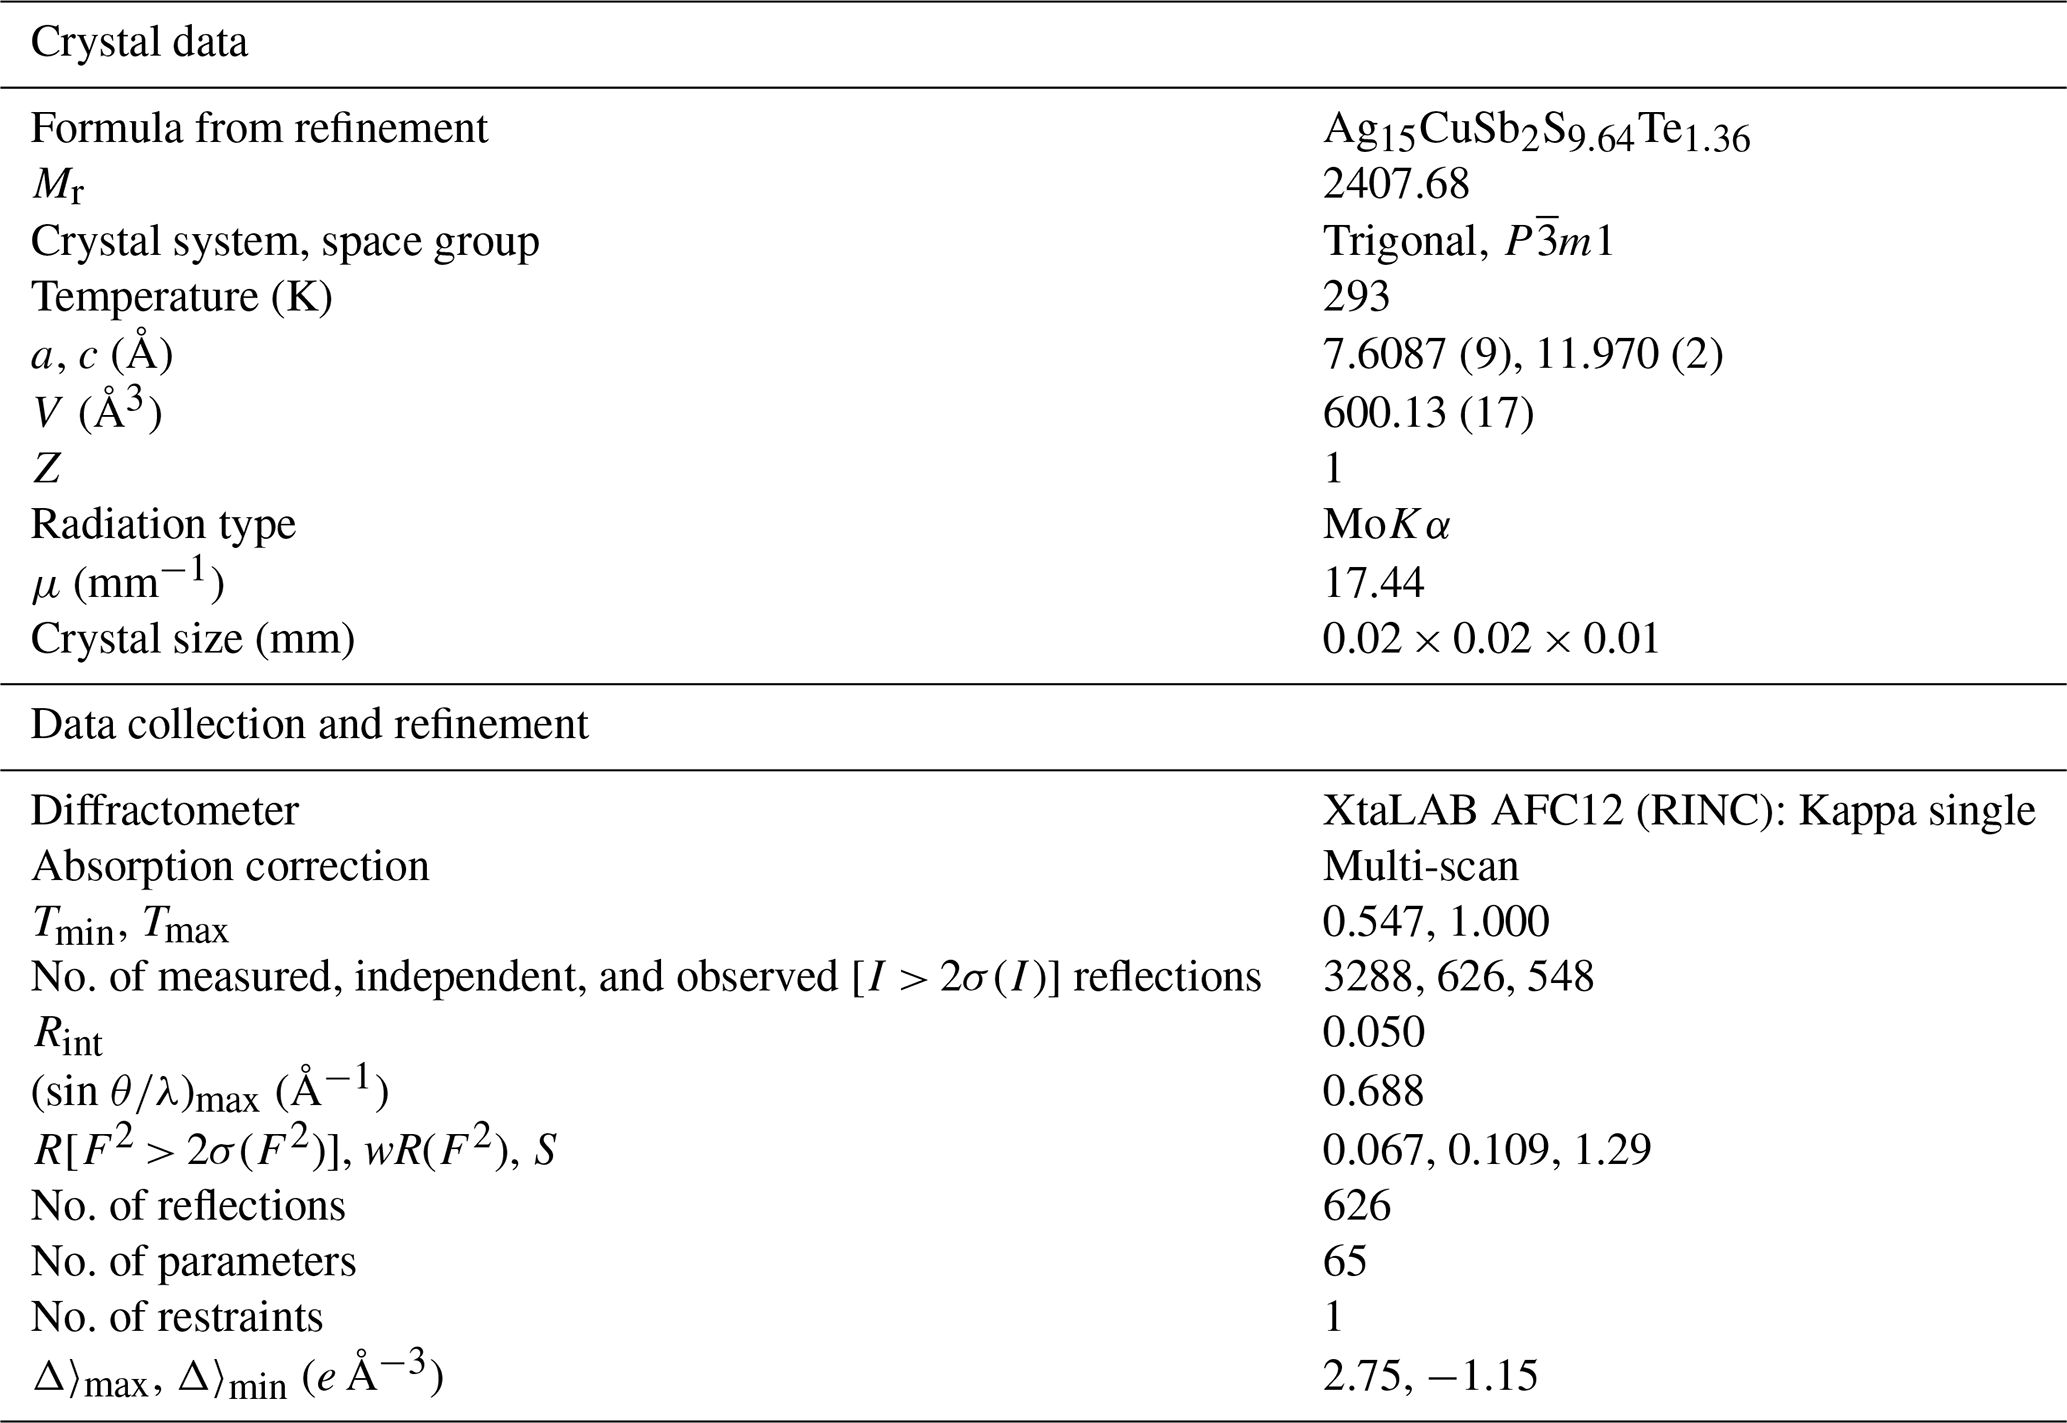
A total of 3288 reflections were measured, yielding 626 independent reflections (Rint=0.050), of which 548 had I>2σ(I). The refinement included 65 parameters and 1 restraint and converged to R1 = 0.0667 for observed reflections, wR2 = 0.109 for all data, and a goodness of fit of 1.29. Complete crystallographic and refinement details are provided in Table 2. The crystallographic information file is available as a supplement. The X-ray powder diffraction data of fengruiite (MoKα, λ=0.71073 Å) are presented in supplementary Table S3, with the seven strongest lines highlighted in bold. Unit-cell parameters obtained from the single crystal are a=7.6087(9) Å, c=11.970(2) Å, V=600.13(17) Å3, and Z=1, while those obtained from powder data are a=7.6087(11) Å, c=11.9700(7) Å, and V=600.13(21) Å3, with Z=1.
Table 2Crystal data, data-collection parameters, and structure-refinement details for fengruiite.
Fengruiite is trigonal and crystallizes in space group 1 (no. 164). Its unit-cell dimensions, symmetry, and stacking sequence identify the structure as the Tac polytype of the pearceite–polybasite group (Bindi et al., 2007). The structure consists of alternating A- and B-layer modules stacked along the c axis, consistent with the modular structural description established for this mineral group (Bindi et al., 2007; Bindi et al., 2013) (Fig. 4). The refined atomic coordinates, site occupancies, and equivalent isotropic displacement parameters are given in Table 3, and the anisotropic displacement parameters are reported in Table 4. The locally droplet-like electron density associated with Ag in the A-layer module was represented in the final refinement by two mutually exclusive split positions, Ag1 and Ag2, with refined occupancies of 0.78(4) and 0.21(4), respectively. Their occupancies sum to approximately 1; therefore, Ag1 and Ag2 do not represent two independent, simultaneously occupied crystallographic sites but alternative statistical positions of the same disordered Ag population. The extended Ag electron density in the B-layer module was approximated in the main refinement by the partially occupied Ag3, Ag4, and Ag5 positions using conventional harmonic displacement parameters. To further evaluate this diffuse electron density, a trial anharmonic refinement was performed in Jana2006 using third-order Gram–Charlier coefficients for the Ag sites. This refinement converged stably and improved the agreement factors (R1 = 0.0623 for 482 reflections with I>3σ(I); wR = 0.0576 for observed reflections; wR(all) = 0.0640 for all reflections). The anharmonic model confirms the strongly non-harmonic character of the Ag electron density, but it does not affect the species-defining S–Te distribution. Therefore, the conventional split-site model is retained here as the principal structural model, whereas the anharmonic refinement is provided as an auxiliary model in the Supplement, with the third-order Gram–Charlier coefficients listed in Supplement Table S5 and the corresponding auxiliary CIF provided as Supplement CIF 2.
Table 3Fractional atomic coordinates, equivalent isotropic displacement parameters (Å2), and site occupancies (s.o.) for fengruiite.
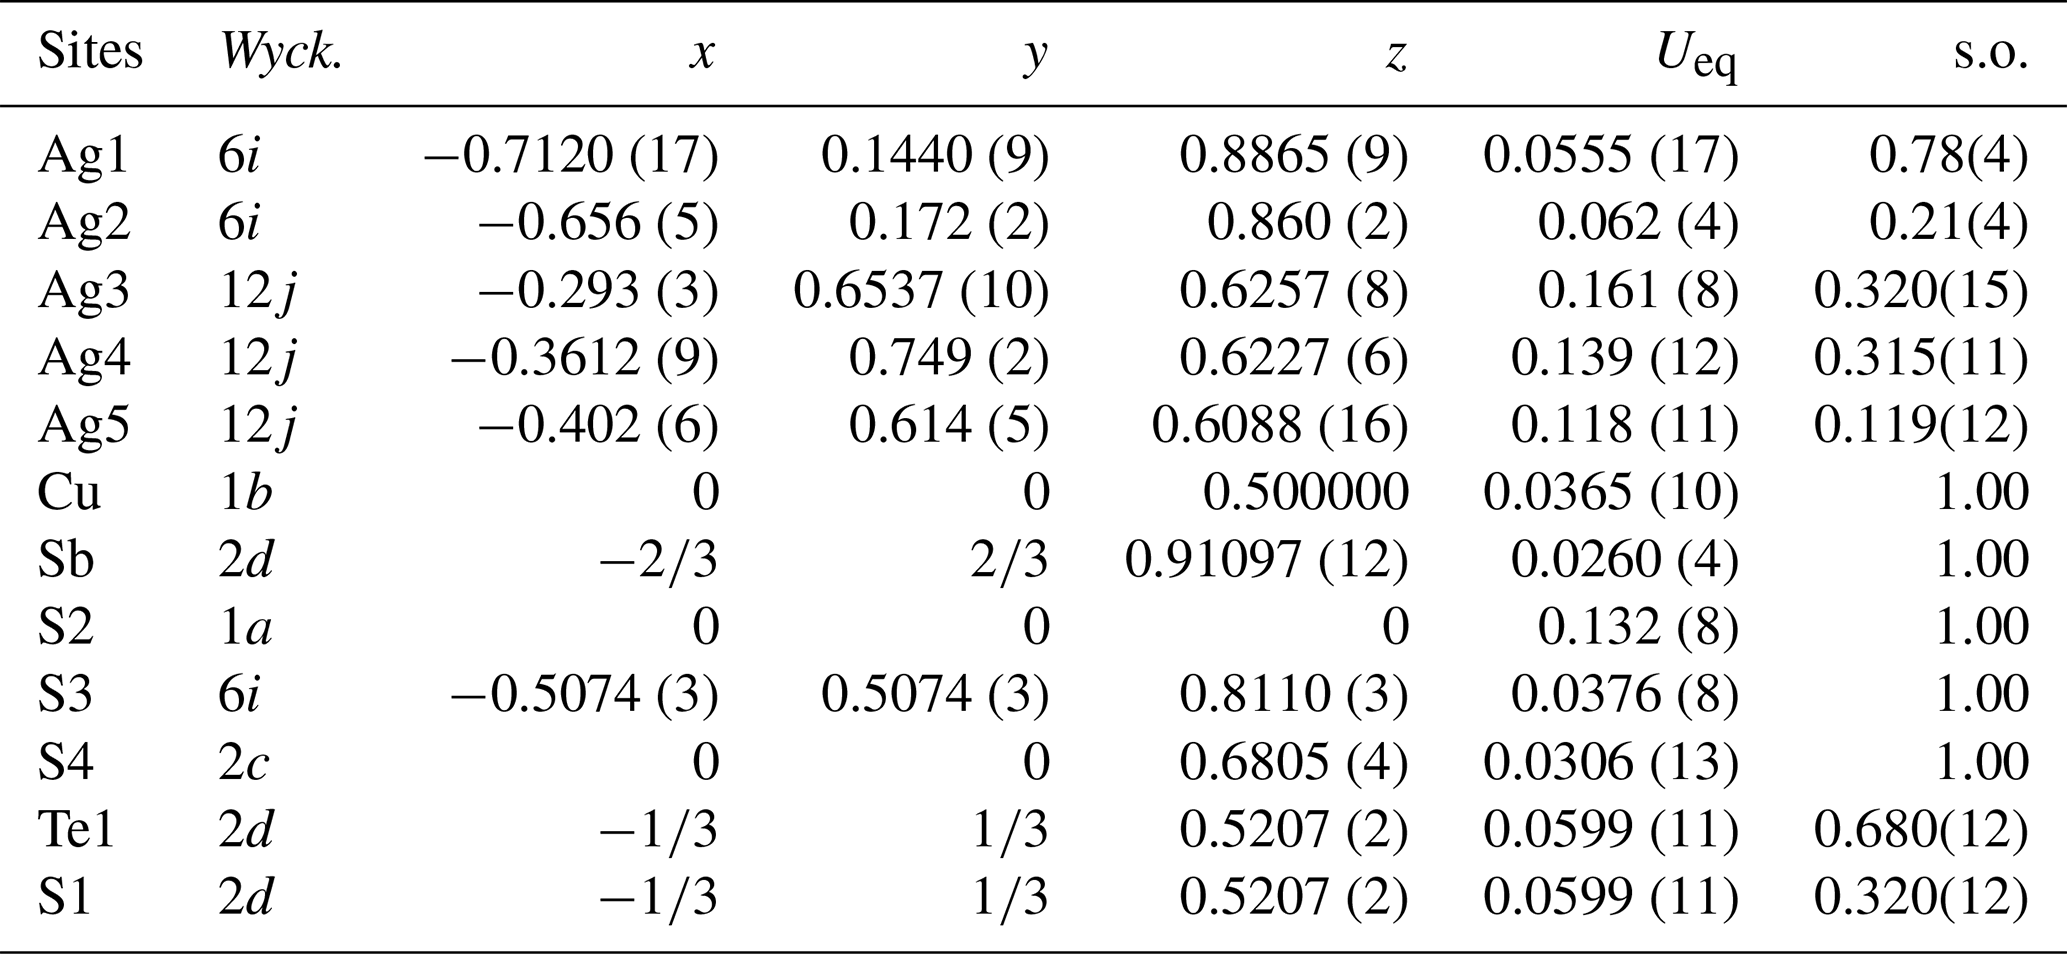
Note: Ag1 and Ag2 are mutually exclusive split positions used to represent the locally droplet-like Ag electron density in the A-layer module. Their refined occupancies sum to approximately 1, and they should not be interpreted as two independent, simultaneously occupied Ag sites. Te1 and S1 are the Te and S components of the same crystallographic 2d site. Their positional and displacement parameters were constrained to be identical, and their occupancies were constrained to sum to unity. Trial S–Te refinement at the A-layer S2 site yielded S0.95(2)Te0.05(2); this minor component was not retained in the final model. The occupancies of the remaining S sites, S3 and S4, were also tested by free refinement, yielding 0.996(15) and 1.01(2), respectively. Because both values are statistically consistent with full occupancy by S, S3 and S4 were fixed at 1.0 in the final refinement.
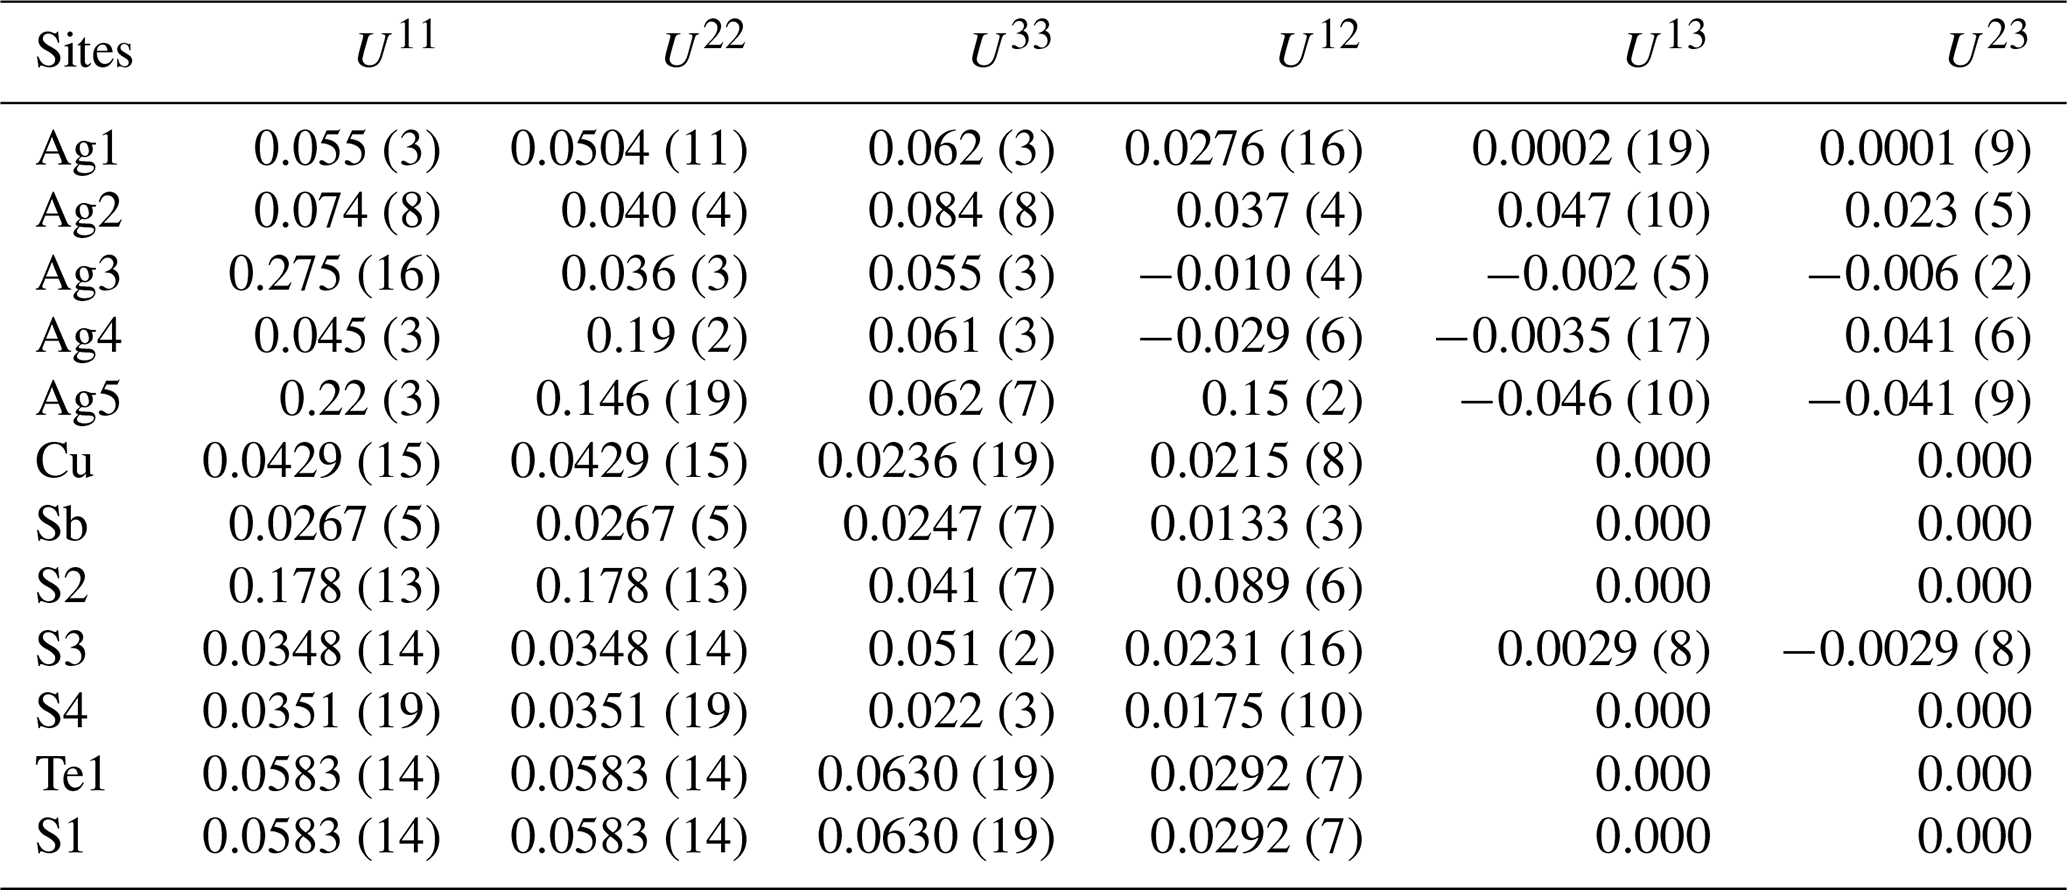
The S–Te distribution was evaluated during the structure refinement for all crystallographically distinct anion sites. At the mixed site in the B-layer module, Te and S were refined at the same position, with their occupancies constrained to sum to unity, yielding Te0.680(12)S0.320(12). Mixed S–Te occupancy was also tested at the S2 site in the A-layer module, but only a minor Te component was obtained, [S0.95(2)Te0.05(2)]; this contribution was not retained in the final model. The occupancies of the remaining S sites, S3 and S4, were also tested by free refinement. The refined occupancies were 0.996(15) for S3 and 1.01(2) for S4, both of which are statistically consistent with full occupancy by S. Therefore, the occupancies of the S3 and S4 sites were fixed at 1.0 in the final refinement. Thus, the site in the B-layer module is Te dominant, whereas the anion sites in the A-layer module remain S dominant. This distribution provides the principal structural basis for distinguishing fengruiite from Te-rich polybasite-Tac, which lacks a Te-dominant crystallographic site, and from benleonardite, in which Te is distributed among anion sites of both structural modules. Accordingly, the identification of fengruiite is based primarily on the refined distribution of Te among crystallographic sites rather than on bulk Te content alone. Selected model-dependent interatomic distances are provided in Supplement Table S4.
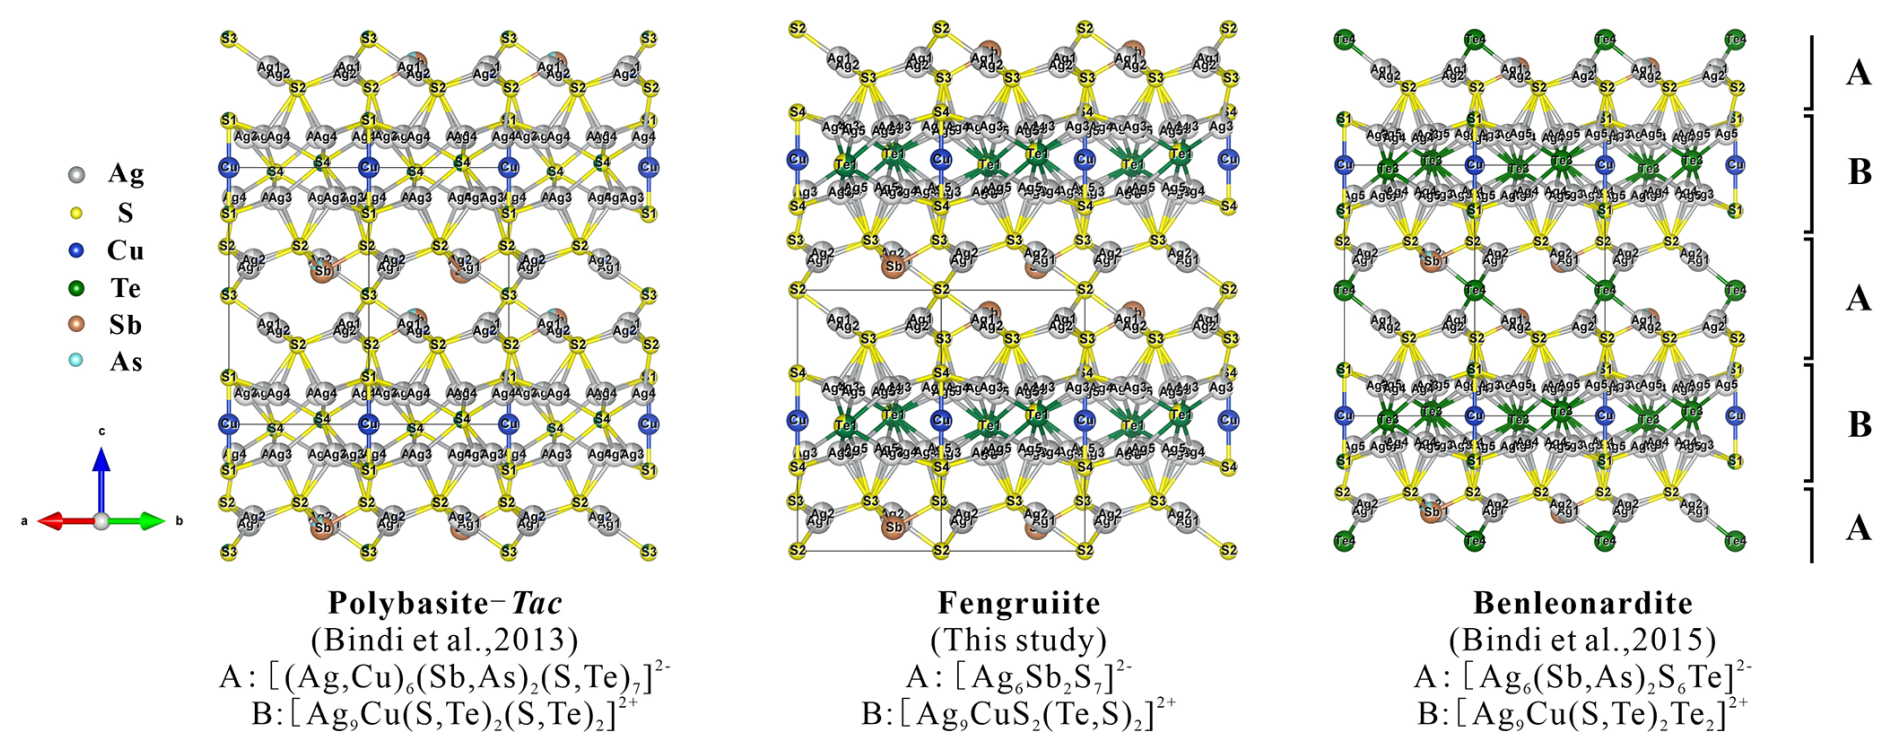
Figure 4Comparison of the crystal structure of fengruiite with the structures of Te-rich polybasite-Tac and benleonardite. The structures are shown as alternating A- and B-layer modules stacked along the c axis; comparison models are based on Bindi et al. (2013, 2015).
4.4 Raman spectrum
The Raman spectrum of fengruiite displays bands at 144, 764, 937, 1474, and 1564 cm−1 (Fig. S1). Because no lattice-dynamical calculations were performed and the available reference spectra were acquired under different analytical conditions, definitive assignments of these bands are not made here. The Raman spectrum is presented as supplementary characterization, whereas the species definition of fengruiite is based primarily on its chemical composition and single-crystal structure.
5.1 Description of the structure
The crystal structure of fengruiite consists of two compositionally distinct modules stacked along the c axis. These are conventionally designated as an A module with composition [Ag6Sb2S7] and a B module corresponding to [Ag9CuS2Te2]. Each module forms a continuous layer parallel to (001), and their alternating repetition accounts for the trigonal metric and the one-layer stacking sequence.
In the A layer, Sb forms well-defined [SbS3] pyramids. In contrast, the electron density assigned to Ag is locally droplet-like and was approximated in the refinement by the mutually exclusive Ag1 and Ag2 split positions, whose refined occupancies sum to approximately 1. Ag1 and Ag2 should therefore not be regarded as two independent, simultaneously occupied crystallographic sites. Rather, they represent a discrete model of an extended electron-density distribution. Consequently, the individual Ag–S distances and coordination geometries derived from these positions are model dependent and should be interpreted cautiously.
In the B layer, Cu is linearly coordinated by two S atoms, and the mixed site, with an occupancy of Te0.680(12)S0.320(12), occurs near the center of the layer. The Ag electron density extends along pseudohexagonal two-dimensional pathways parallel to the ab plane and is represented by the partially occupied Ag3, Ag4, and Ag5 positions (Fig. 5). These positions correspond to statistical maxima along the extended electron-density distribution rather than fixed atomic sites with rigid coordination polyhedra. The observed density is consistent with pronounced positional disorder and possible Ag mobility, although the present room-temperature diffraction data do not distinguish unequivocally between static and dynamic disorder.
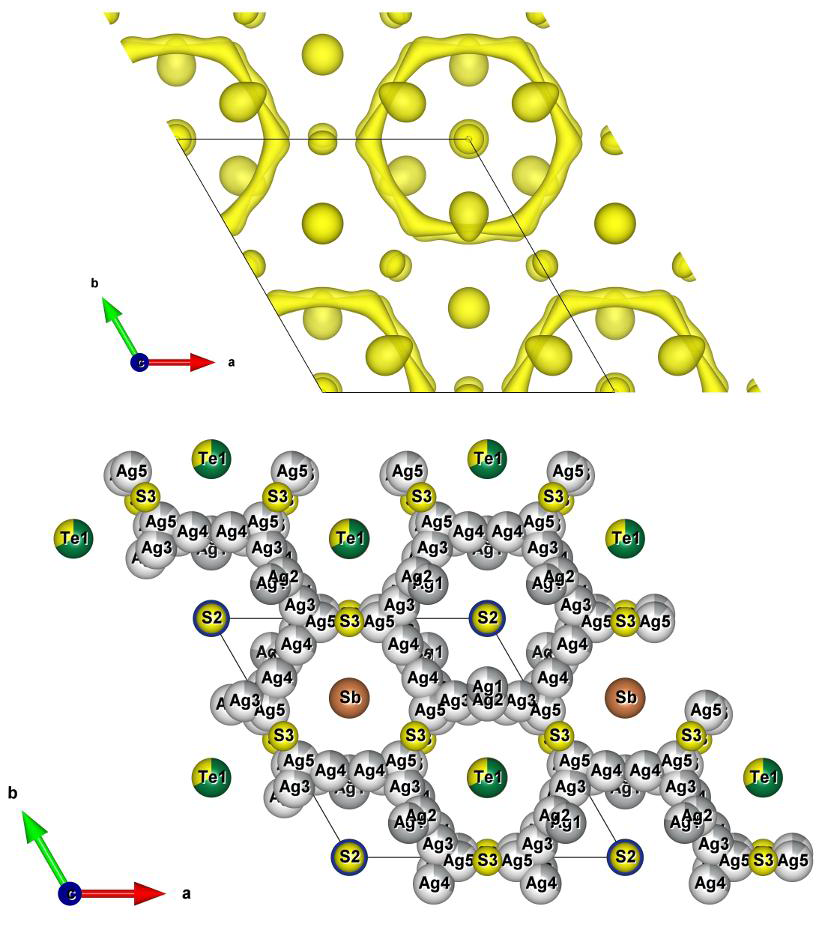
Figure 5Observed electron-density distribution and the corresponding statistical Ag-site model in the ab plane of fengruiite. Ag1 and Ag2 represent mutually exclusive split positions associated with locally droplet-like electron density, whereas Ag3–Ag5 sample the extended pseudohexagonal electron-density pathway in the B layer. These positions should not be interpreted as fixed, fully occupied Ag sites. An auxiliary Gram–Charlier refinement of the diffuse Ag electron density is provided in the Supplement.
Comparable continuous or pseudohexagonal Ag electron-density distributions have been reported in other members of the pearceite–polybasite group and have been interpreted as potential pathways for Ag–ion migration, consistent with the ionic-conducting behavior documented for this mineral group (Withers et al., 2008; Bindi et al., 2013, 2015). Accordingly, the extended electron density shown in Fig. 5 may represent potential two-dimensional Ag-migration pathways within the B layer of fengruiite. However, no electrical-conductivity measurements or temperature-dependent diffraction experiments were performed in the present study. The electron-density distribution therefore provides structural evidence of possible Ag mobility but does not by itself demonstrate dynamic Ag diffusion or ionic conductivity in fengruiite. The auxiliary Gram–Charlier refinement is consistent with this interpretation but is not used as the principal model for the formal species description.
The overall architecture results from the ordered alternation of the negatively charged [Ag6Sb2S7] layer and the positively charged [Ag9CuS2Te2] layer. The interlayer compatibility of these modules stabilizes the trigonal symmetry and defines the structural identity of fengruiite.
Table 5Comparison of Te-rich polybasite-Tac, fengruiite, and benleonardite.
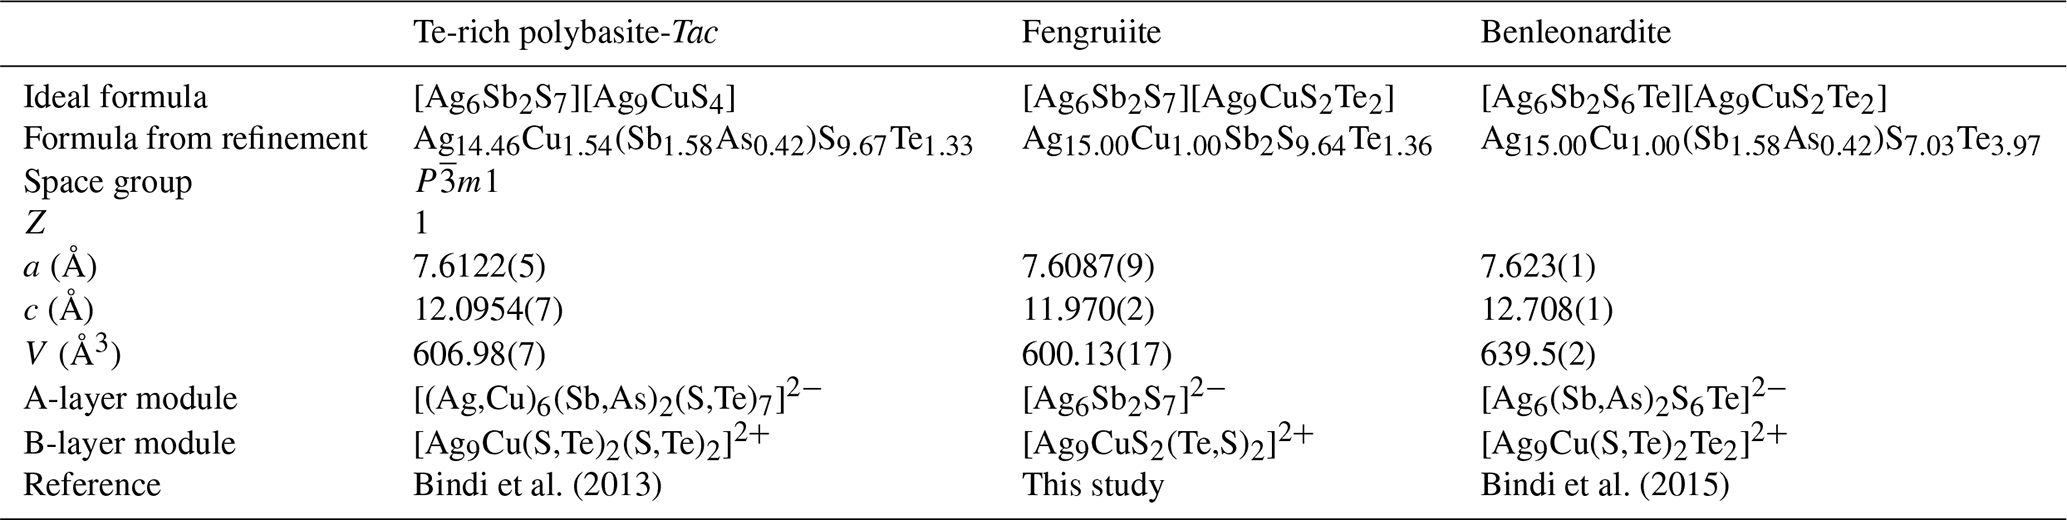
Note: Total Te contents are not independently diagnostic of mineral species because EPMA does not resolve the distribution of Te among the anion sites of the A- and B-layer modules. The proposed total-Te ranges are provisional compositional guidelines only; structural site-occupancy data are required for definitive identification of borderline or compositionally overlapping material.
5.2 Relation to other species
Because members of the pearceite–polybasite group may show overlapping bulk chemical compositions, the following species-level comparison is based primarily on the refined occupancies and distributions of Te among crystallographically distinct anion sites. The crystal structure of fengruiite is topologically equivalent to the structures observed in all members of the pearceite–polybasite group, specifically the 111 pearceite-type structure (Tac polytype) (Bindi et al., 2007). A subsequent study, Bindi et al. (2013), identified a Te-rich variant of polybasite-Tac, characterized by significant concentrations of Te (occupancy of 0.49) at the S4 site within the B-layer module. Despite this Te-rich composition, the absence of Te-dominant sites in the polybasite crystal led to the conclusion that it did not qualify for classification as a new mineral.
In fengruiite, the Te1 site in the B-layer module is dominantly occupied by Te, with a refined occupancy of Te0.680(12)S0.320(12). This site occupancy distinguishes fengruiite from the Te-rich polybasite-Tac described by Bindi et al. (2013), in which Te is distributed among S sites but does not become the dominant constituent at any individual crystallographic site. Fengruiite also differs from benleonardite, in which Te is incorporated into anion sites of both the A- and the B-layer modules (Bindi et al., 2015). Accordingly, the distinction among these species is fundamentally based on the distribution and dominance of Te at crystallographically distinct anion sites, rather than on the total Te content alone.
The preferential incorporation of Te at the site in fengruiite can be qualitatively related to the different local coordination environments of the anion sites. The site is surrounded exclusively by the disordered Ag substructure in the B-layer module, providing a relatively weakly constrained and polarizable environment that can accommodate the larger Te anion. In contrast, S4 participates in the linear S–Cu–S coordination, S3 forms part of the [SbS3] pyramids, and the anion sites in the A-layer module are incorporated into a more constrained Ag–Sb–S framework; these environments appear to favor S over Te. The broader distribution of Te in benleonardite may also reflect its substantially higher bulk Te content, which requires Te incorporation into several crystallographic environments. This interpretation remains qualitative because no energetic calculations were performed to quantify the relative stability of Te at the different anion sites.
Electron-probe microanalysis provides the bulk Te content but cannot determine its distribution between the A- and B-layer modules. Consequently, EPMA data alone may not permit an unambiguous distinction among Te-rich polybasite-Tac, fengruiite, and benleonardite. Total-Te ranges of Te_tot < 1 apfu, 1 ≤ Te_tot < 2.5 apfu, and Te_tot ≥ 2.5 apfu may be used only as provisional compositional guidelines for polybasite-Tac, fengruiite, and benleonardite, respectively, under the assumption that Te preferentially enters the B-layer module. These values should not be regarded as universal or formal species boundaries because Te may be distributed among several anion sites without becoming dominant at any one site, as demonstrated by Te-rich polybasite-Tac.
For compositions that overlap these proposed boundaries within analytical uncertainty or that fall within the compositional overlap among the three species, a definitive species assignment should not be made solely from EPMA data. In the absence of reliable site-occupancy information, such material is best reported as a Te-bearing member of the pearceite–polybasite group, together with its complete chemical composition, until suitable structural data become available. This limitation does not affect the type material of fengruiite, for which single-crystal X-ray diffraction directly demonstrates a Te-dominant site in the B-layer module together with S-dominant anion sites in the A-layer module. These structural data establish fengruiite as a distinct mineral species of the pearceite–polybasite group. The principal chemical and structural differences among the related species are summarized in Table 5.
Low‐melting chalcophile elements (LMCEs; e.g., As, Sb, Bi, Se, Te) are widely recognized as key agents in the transport and enrichment of gold, primarily through the formation of LMCE-bearing melts, complex sulfosalts, or LMCE–Au intermetallic compounds in hydrothermal gold systems (Tooth et al., 2011; Jian et al., 2021; Fan et al., 2025). However, although Ag-bearing Sb–As–Bi sulfosalts are commonly found in epithermal environments (Yuningsih and Matsueda, 2018; Palyanova, 2020; Hui et al., 2021), the potential role of LMCE in silver enrichment remains significantly underexplored.
Fengruiite represents the first structurally characterized Ag–Sb–Te sulfosalt identified in the East Qinling metallogenic belt (Li et al., 2013, 2016) and documents a distinct mode for Ag fixation in epithermal systems. It contains 65.89 wt %–68.63 wt % Ag, with a mean value of 66.92 wt %, and Ag is accommodated within alternating [Ag6Sb2S7] and [Ag9CuS2Te2] modules (Fig. 4). This structure indicates that the high Ag content is hosted by an Ag-rich sulfosalt framework rather than by minor substitution in simple sulfides. The Te-dominant site in the B module indicates that tellurization, coupled with Sb-rich sulfidation, established a favorable thermodynamic pathway for Ag stabilization in hydrothermal fluids (Czamanske and Hall, 1975; Cook and Ciobanu, 2004; Simon et al., 2008; Tombros et al., 2010). This structural architecture demonstrates that Sb and Te acted as LMCE “anchors”, facilitating the selective partitioning of Ag into complex sulfosalt structures during fluid cooling (Jian et al., 2021; Dincă et al., 2025). More broadly, the findings indicate that LMCE may also play a governing role in Ag mobility, complexation, and sequestration within Ag-rich hydrothermal fluids. The identification of similar LMCE–Ag associations in other epithermal systems could provide new constraints on silver ore formation.
The crystallographic information file (CIF) and the corresponding checkCIF report are provided as a Supplement.
The supplement related to this article is available online at https://doi.org/10.5194/ejm-38-519-2026-supplement.
YT: sample collection, investigation, formal analysis, visualization, writing – original draft. GL: crystal structure analysis, formal analysis, data curation, and editing. NS: single-crystal and powder X-ray diffraction analysis, formal analysis, writing – review, and editing. ML: conceptualization and writing – review. JM: supervision, resources, and project administration. YD: supervision, writing – review and editing. PL: investigation, writing – review and editing. WJ: interpretation of results and editing. WY: EPMA analysis and editing. XW: field investigation and resources. HY: supervision, writing – review and editing.
The contact author has declared that none of the authors has any competing interests.
Publisher's note: Copernicus Publications remains neutral with regard to jurisdictional claims made in the text, published maps, institutional affiliations, or any other geographical representation in this paper. The authors bear the ultimate responsibility for providing appropriate place names. Views expressed in the text are those of the authors and do not necessarily reflect the views of the publisher.
We are grateful to Bin Shi from the Institute of Geology, Chinese Academy of Geological Sciences (CAGS), for assistance with the SEM analysis of the fengruiite.
This research has been supported by the National Natural Science Foundation of China (grant no. 42202067).
This paper was edited by Sergey Krivovichev and reviewed by Dan Topa and František Laufek.
Bindi, L., Evain, M., Spry, P. G., and Menchetti, S.: The pearceite-polybasite group of minerals: Crystal chemistry and new nomenclature rules, Am. Mineral., 92, 918–925, https://doi.org/10.2138/am.2007.2440, 2007.
Bindi, L., Voudouris, P., and Spry, P. G.: Structural role of tellurium in the minerals of the pearceite-polybasite group, Mineral. Mag., 77, 419–428, https://doi.org/10.1180/minmag.2013.077.4.02, 2013.
Bindi, L., Stanley, C. J., and Spry, P. G.: New structural data reveal benleonardite to be a member of the pearceite-polybasite group, Mineral. Mag., 79, 1213–1221, https://doi.org/10.1180/minmag.2015.079.5.15, 2015.
Cai, N. Z. and Su, Z. B.: Stratigraphic subdivision and distinction of primary rock-types of the Taihua Group in the Xiaoqinling Mountain, Reg. Geol. China, 13, 35–44, 1985 (in Chinese with English abstract).
Cook, N. J. and Ciobanu, C. L.: Bismuth tellurides and sulphosalts from the Larga hydrothermal system, Metaliferi Mts., Romania: Paragenesis and genetic significance, Mineral. Mag., 68, 301–321, https://doi.org/10.1180/0026461046820188, 2004.
Czamanske, G. K. and Hall, W. E.: The Ag-Bi-Pb-Sb-S-Se-Te mineralogy of the Darwin lead-silver-zinc deposit, southern California, Econ. Geol., 70, 1092–1110, https://doi.org/10.2113/gsecongeo.70.6.1092, 1975.
Dincă, G., Popescu, G. C., and Topa, D.: Decoding the mineralogy and geochemistry of sulfosalts in the Săcărâmb Au-Ag-Te ore deposit (Romania): Unveiling a fresh insight into the evolution of a complex hydrothermal system, Ore Geol. Rev., 176, 106424, https://doi.org/10.1016/j.oregeorev.2024.106424, 2025.
Dolomanov, O. V., Bourhis, L. J., Gildea, R. J., Howard, J. A. K., and Puschmann, H.: OLEX2: a complete structure solution, refinement and analysis program, J. Appl. Crystallogr., 42, 339–341, https://doi.org/10.1107/S0021889808042726, 2009.
Fan, G. H., Li, J. W., Zhong, R. C., Gleeson, S. A., Yao, Z. S., Harlov, D. E., Deng, X. D., Cui, H., Yu, C., and Gao, W. S.: Polymetallic Te-rich melts contribute to efficient enrichment and precipitation of Au in hydrothermal ore deposits, Geochim. Cosmochim. Ac., 397, 176–187, https://doi.org/10.1016/j.gca.2025.03.027, 2025.
Hui, K. X., Qin, K. Z., Han, R., Zhao, J. X., Wang, L., Gao, S., and Zhang, X. N.: Magmatic-hydrothermal silver deposits, argentiferous provinces and the main controlling factors of formation, Acta Petrol. Sin., 37, 2502–2520, 2021 (in Chinese with English abstract).
Jian, W., Mao, J. W., Lehmann, B., Cook, N. J., Xie, G. Q., Liu, P., Duan, C., Alles, J., and Niu, Z. J.: Au-Ag-Te–rich melt inclusions in hydrothermal gold-quartz veins, Xiaoqinling lode gold district, central China, Econ. Geol., 116, 1239–1248, https://doi.org/10.5382/econgeo.4811, 2021.
Li, H. M., Chen, Y. C., Wang, D. H., Ye, H. S., Wang, Y. B., Zhang, C. Q., and Dai, J. Z.: SHRIMP U-Pb ages of metamorphic rocks and veins in the Xiaoqinling area, and their geological significance, Acta Petrol. Sin., 23, 2504–2512, 2007 (in Chinese with English abstract).
Li, Z. K., Li, J. W., Zhao, X. F., Zhou, M. F., Selby, D., Bi, S. J., Sui, J. X., and Zhao, Z. J.: Crustal-Extension Ag-Pb-Zn Veins in the Xiong'ershan District, Southern North China Craton: Constraints from the Shagou Deposit, Econ. Geol., 108, 1703–1729, https://doi.org/10.2113/econgeo.108.7.1703, 2013.
Li, Z. K., Li, J. W., Cooke, D. R., Danyushevsky, L., Zhang, L., O'Brien, H., Lahaye, Y., Zhang, W., and Xu, H. J.: Textures, trace elements, and Pb isotopes of sulfides from the Haopinggou vein deposit, southern North China Craton: implications for discrete Au and Ag–Pb–Zn mineralization, Contrib. Mineral. Petrol., 171, 1–26, https://doi.org/10.1007/s00410-016-1309-x, 2016.
Liu, J. J., Wang, D. Z., Zhai, D. G., Gao, S., Zhang, B., Wang, J. X., Zhang, B., Wang, G. Z., Wang, Z. L., Wang, L. W., and Weng, G. M.: Study on role of low-melting point chalcophile elements (LMCE) in gold mineralization and its promotion mechanisms in gold enrichment, Mineral. Deposits, 43, 712–734, 2024 (in Chinese with English abstract).
Ni, Z. Y., Wang, R. M., Tong, Y., Yang, C., and Dai, T. M.: 207Pb 206Pb age of zircon and 40Ar/39Ar of amphibole from plagioclase amphibolite in the Taihua Group, Luoning, Henan, China, Geol. Rev., 49, 361–366, 2003 (in Chinese with English abstract).
Palyanova, G. A.: Gold and Silver Minerals in Sulfide Ore, Geol. Ore Depos., 62, 383–406, https://doi.org/10.1134/s1075701520050050, 2020.
Sharp, T. G. and Buseck, P. R.: The distribution of Ag and Sb in galena: Inclusions versus solid solution, Am. Mineral., 78, 85–95, 1993.
Sheldrick, G. M.: SHELXT – integrated space-group and crystal-structure determination, Acta Crystallogr. A, 71, 3–8, https://doi.org/10.1107/S2053273314026370, 2015a.
Sheldrick, G. M.: Crystal structure refinement with SHELXL, Acta Crystallogr. C, 71, 3–8, https://doi.org/10.1107/S2053229614024218, 2015b.
Simmons, S. F., White, N. C., and John, D. A.: Geological Characteristics of Epithermal Precious and Base Metal Deposits, Society of Economic Geologists, Inc., One Hundredth Anniversary, 485–522, https://doi.org/10.5382/av100.16, 2005.
Simon, A. C., Candela, P. A., Piccoli, P. M., Mengason, M., and Englander, L.: The effect of crystal-melt partitioning on the budgets of Cu, Au, and Ag, Am. Mineral., 93, 1437–1448, https://doi.org/10.2138/am.2008.2812, 2008.
Tian, Y. F., Mao, J. W., Jian, W., Wang, Y. T., Feng, R., Ye, H. S., Liu, J. C., Wu, S. T., Zhu, L., Xu, H. S., Guan, H. L., and Wang, P.: Recognition of the Xiayu intermediate-sulfidation epithermal Ag-Pb-Zn-Au(-Cu) mineralization in the East Qinling polymetallic ore belt, China: Constraints from geology and geochronology, Ore Geol. Rev., 156, 105398, https://doi.org/10.1016/j.oregeorev.2023.105398, 2023.
Tombros, S., Seymour, K. S., and Williams-Jones, A. E.: Controls on Tellurium in Base, Precious, and Telluride Minerals in the Panormos Bay Ag-Au-Te Deposits, Tinos Island, Cyclades, Greece, Econ. Geol., 105, 1097–1111, https://doi.org/10.2113/econgeo.105.6.1097, 2010.
Tooth, B., Ciobanu, C. L., Green, L., O'Neill, B., and Brugger, J.: Bi-melt formation and gold scavenging from hydrothermal fluids: An experimental study, Geochim. Cosmochim. Ac., 75, 5423–5443, https://doi.org/10.1016/j.gca.2011.07.020, 2011.
Wang, L., Qin, K. Z., Song, G. X., and Li, G. M.: A review of intermediate sulfidation epithermal deposits and subclassification, Ore Geol. Rev., 107, 434–456, https://doi.org/10.1016/j.oregeorev.2019.02.023, 2019.
Withers, R. L., Norén, L., Welberry, T. R., Bindi, L., Evain, M., and Menchetti, S.: A composite modulated structure mechanism for Ag+ fast ion conduction in pearceite and polybasite mineral solid electrolytes, Solid State Ionics, 179, 2080–2089, 2008.
Yuningsih, E. T. and Matsueda, H.: Study on the Cu–As–Sb–Ag–Bi–Pb–Te Sulfosalt Minerals from the Hydrothermal System of Southwestern Hokkaido, Japan, Resour. Geol., 68, 209–226, https://doi.org/10.1111/rge.12157, 2018.