the Creative Commons Attribution 4.0 License.
the Creative Commons Attribution 4.0 License.
 | 06 Aug 2026
A novel experimental approach to investigate element transport and isotope fractionation of Li and B in pegmatitic systems during fluid–melt interaction
Christian Ronny Singer

Harald Behrens
Ingo Horn
Martin Oeser
Stefan Weyer
François Holtz
A novel experimental setup was developed to simulate the transport processes of Li and B and their isotopes via a fluid phase in a flux-rich pegmatitic system (1.7 % Li2O, 2.5 % B2O3). The transport capacity of the fluid was estimated by the determination of Li and B in two melt reservoirs, an Li- and B-rich source melt, and an initially Li- and B-free sink melt. These melts were physically separated by a coarse-grained (250–180 µm fraction) porous filling material containing the fluid phase that acted as the transport medium. The effectivity of Li and B transport was investigated at 100 MPa by changing various parameters in the experimental setup. The impact of the chemical composition of the filling material was tested using either quartz or zircon. Different fluid compositions containing either NaCl or CsCl were investigated with a constant Cl concentration of 0.17 mol kg−1 in the fluid. Two different temperature distribution scenarios were investigated: (1) isothermal conditions of 850 °C along the sample and (2) a temperature gradient from the source to the sink melt varying from ca. 830 to 770 °C. The duration of the experiments was varied between 1 and 96 h.
The results of the experiments indicate that the effectivity of Li and B transport between the two melts via a fluid phase is influenced by a complex interplay of experimental duration, temperature distribution, and reactive surface area (between melt and fluid). The amount of Li and B in the sink melt generally correlates positively with experimental duration, which can be explained by a gradual mobilization of these elements from the source melt. For experiments with a temperature gradient between source and sink, higher Li and B concentrations in the sink melt were observed compared to experiments conducted under isothermal conditions. The sink melt was enriched in the heavier 7Li, which can be best explained by equilibrium isotope fractionation between silicate melt and fluid. These findings demonstrate experimentally, for the first time, the preferential partitioning of 7Li into a fluid phase compared to silicate melt. For B, possible isotope effects are smaller than our analytical uncertainty (±4.7 ‰), which is likely related to the high experimental temperature and similar bonding environments of B in melts and fluids. There is no evidence for kinetic isotope fractionation during transport of Li and B in the fluid which, expectedly, would result in an enrichment of light isotopes in the sink. Our experimental results indicate that equilibrium for Li isotopes can be established rapidly between a melt and a fluid phase. This may be important for the interpretation of isotope data in pegmatite minerals and the role of a fluid phase during their formation by disequilibrium crystallization caused by strong undercooling.
- Article
(5280 KB) - Full-text XML
-
Supplement
(2873 KB) - BibTeX
- EndNote


Lithium and B are among the lightest metals in the periodic table. Both elements are commonly enriched in magmatic fluids but have very different geochemical properties. In aluminosilicate melts, Li acts as a network modifier and contributes to the formation of non-bridging oxygens, while B is considered to be a network former and occurs in either trigonal or tetrahedral coordination (Geisinger et al., 1988). Owing to their vastly different structural roles in aluminosilicate melt networks, their diffusion rates differ by several orders of magnitude in silicate melts (review by Zhang et al., 2010; Singer et al., 2023, 2025). Both Li and B are incompatible during mantle melting and are significantly enriched in the continental crust (on average 24 ppm Li and 17 ppm B compared to 1.6–1.8 ppm Li and 0.07–0.10 ppm B in the upper mantle; Ottolini et al., 2004; Rudnick and Gao, 2014). High concentrations of Li and B are observed in highly fractionated peraluminous igneous glasses, such as the Macusani obsidian (0.74 wt % Li2O, 0.62 wt % B2O3; Pichavant et al., 1988). Among magmatic rocks, rare-metal granites and rare-metal pegmatites of the Li–Cs–Ta (LCT) type exhibit the most outstanding enrichment of Li and B (Černý, 1991; Černý and Ercit, 2005; Černý et al., 2005). In pegmatite-hosted fluid inclusions, which are likely related to exsolution of a fluid phase from a pegmatite melt, Li concentrations of up to 12 000–16 000 ppm (2.6–3.4 wt % Li2O; Maloney et al., 2008; Hulsbosch and Muchez, 2020) and B concentrations up to 10.4 wt % B2O3 (32 000 ppm B; Thomas, 2002) were reported. Pegmatites are therefore an important potential reservoir for rare elements like Li, Cs, and Ta, which have been characterized by a soaring demand in recent years, partly due to their role in the green-energy transition.
It is generally accepted that granitic pegmatites form by disequilibrium crystallization of an undercooled granitic melt (London, 2005; Sirbescu et al., 2017; Devineau et al., 2020). After emplacement of the melt, crystallization of quartz and feldspar starts along the contacts with surrounding rocks, where the undercooling is greatest. During crystallization, incompatible elements and fluxes (such as H2O, B, P and F) remain in the melt and are successively enriched. The final portions of the pegmatite-forming melt can form miarolitic cavities or pockets in the central zone of a dyke (London, 2008). The role of H2O and fluids has been one of the most debated aspects of pegmatite formation during the last decades (Nabelek et al., 2010). One model attributes the formation of pegmatites to the mechanism of constitutional zone refining (London, 2005, 2008), building upon the model proposed by Jahns (1953). According to this mechanism, incompatible elements and fluxes accumulate ahead of the crystallization front and form a boundary layer. The accumulation of incompatible elements and fluxes leads to a decrease in viscosity, which enables the fast diffusion of elements to growing crystals. In this model, the melt remains water-undersaturated, and fluid exsolution is not required to generate typical pegmatitic textures (London et al., 1989). In contrast, Jahns and Burnham (1969) proposed a model in which the residual melt reaches saturation with respect to H2O in an early phase due to the progressing crystallization of anhydrous phases. This separate fluid phase then enables the rapid transport of elements from the melt to the growing crystals (Maneta and Anderson, 2018). Independently of the proposed models, a fluid phase must be present at some stage of pegmatite crystallization. The phase separation and subsequent element exchange between melt and fluid are expected to have a crucial influence on the mobilization and enrichment of incompatible and fluid-mobile elements like Li and B (e.g. van Lichtervelde et al., 2007). As a consequence, many studies have investigated the element partitioning between fluid and melt at equilibrium (e.g. London et al., 1988; Zajacz et al., 2008; Iveson et al., 2019). However, the kinetics of this chemical exchange at the interface between fluid and melt remain unexplored.
In this study, we present a novel experimental setup designed to explore the interaction between a pegmatite-forming melt and an exsolved fluid and the fate of Li and B during this interaction. Our study focusses on the transfer kinetics of these elements from a melt to a fluid phase during exsolution. To simulate this process at the laboratory scale, we used a pegmatitic source melt (for Li and B) that interacts with a fluid phase. Since the fluid phase is not quenchable and difficult to analyse, the transport of Li and B in a molten system via a fluid phase was emulated by using two melt batches (one Li- and B-bearing and one essentially free of Li and B) physically separated from each other by an inert porous filling material containing the fluid phase. Therefore, all transport between the two melts must occur via the fluid phase. We investigated the effect of different parameters such as fluid composition, experimental time, and temperature distribution. The transport efficiency was qualitatively assessed by measuring the concentrations of Li and B in the sink melt. With both of these elements having two stable isotopes (6Li, 7Li, 10B, and 11B), we also investigated stable isotope fractionation during transport. With this approach, we aim to shed light on physical and chemical parameters controlling the kinetics of elemental transport of Li and B between coexisting melts and fluid in late-stage pegmatitic systems, as well as the potential isotope fractionation for both elements.
2.1 Starting materials
The melt composition selected for our experiments is representative of a pegmatite-forming melt that has already undergone some crystallization, as well as a significant enrichment in incompatible elements, such as Li, B, P, and F. This composition PEG2 (Table 1) was already used by Bartels et al. (2011), who studied the influence of fluxes, such as Li2O, B2O3, P2O5, F, and H2O, on the viscosity of a pegmatite-forming melt. The same composition was also used in two preliminary studies investigating the chemical diffusion coefficients of Li and B under dry and hydrous conditions (Singer et al., 2023, 2025). For this study, the synthetic glasses PEG2-blue and PEG2-base from Singer et al. (2025) were used and will hereafter be referred to as PEG2-src and PEG2-snk, respectively. PEG2-src acts as a source for Li and B, while PEG2-snk is essentially free of these elements. The glasses were synthesized from mixtures of SiO2, Al2O3, Na2CO3, K2CO3, and (NH4)H2PO4 and AlF3 (both glasses), as well as Co3O4 (0.2 wt %), LiAlSi2O6, and H3BO3 (only PEG2-src). The weighed components were mixed mechanically and melted at 1400 °C for 2 h in a Pt crucible inside a chamber furnace. After being quenched in air, the glasses were crushed in a steel mortar. The resulting glass powders were then remelted at 1400 °C, and this melting–crushing procedure was repeated three times to obtain homogeneous glasses.
The major element compositions were analysed by an electron probe micro-analyser (EPMA). Li and B concentrations, as well as the Li and B isotope ratios, were measured in situ utilizing a femtosecond laser ablation (fs-LA) system coupled to sector field inductively coupled plasma mass spectrometry (SF-ICP-MS) and multicollector (MC-)ICP-MS, respectively. All starting glasses are homogeneous (Table 1). From these results, the aluminium saturation index (ASI) can be calculated as the molar ratio of Al (Na + K) or, including Li as a highly abundant alkali, as Al (Na + K + Li) (ASILi, Bartels et al., 2011). According to this, the starting glasses have an ASI in the range of 1.05 to 1.31 and an ASILi of 0.94 to 1.05.
Table 1Major element and isotopic composition and densities of PEG2-snk and PEG2-src starting compositions compared to the composition used by Bartels et al. (2011).
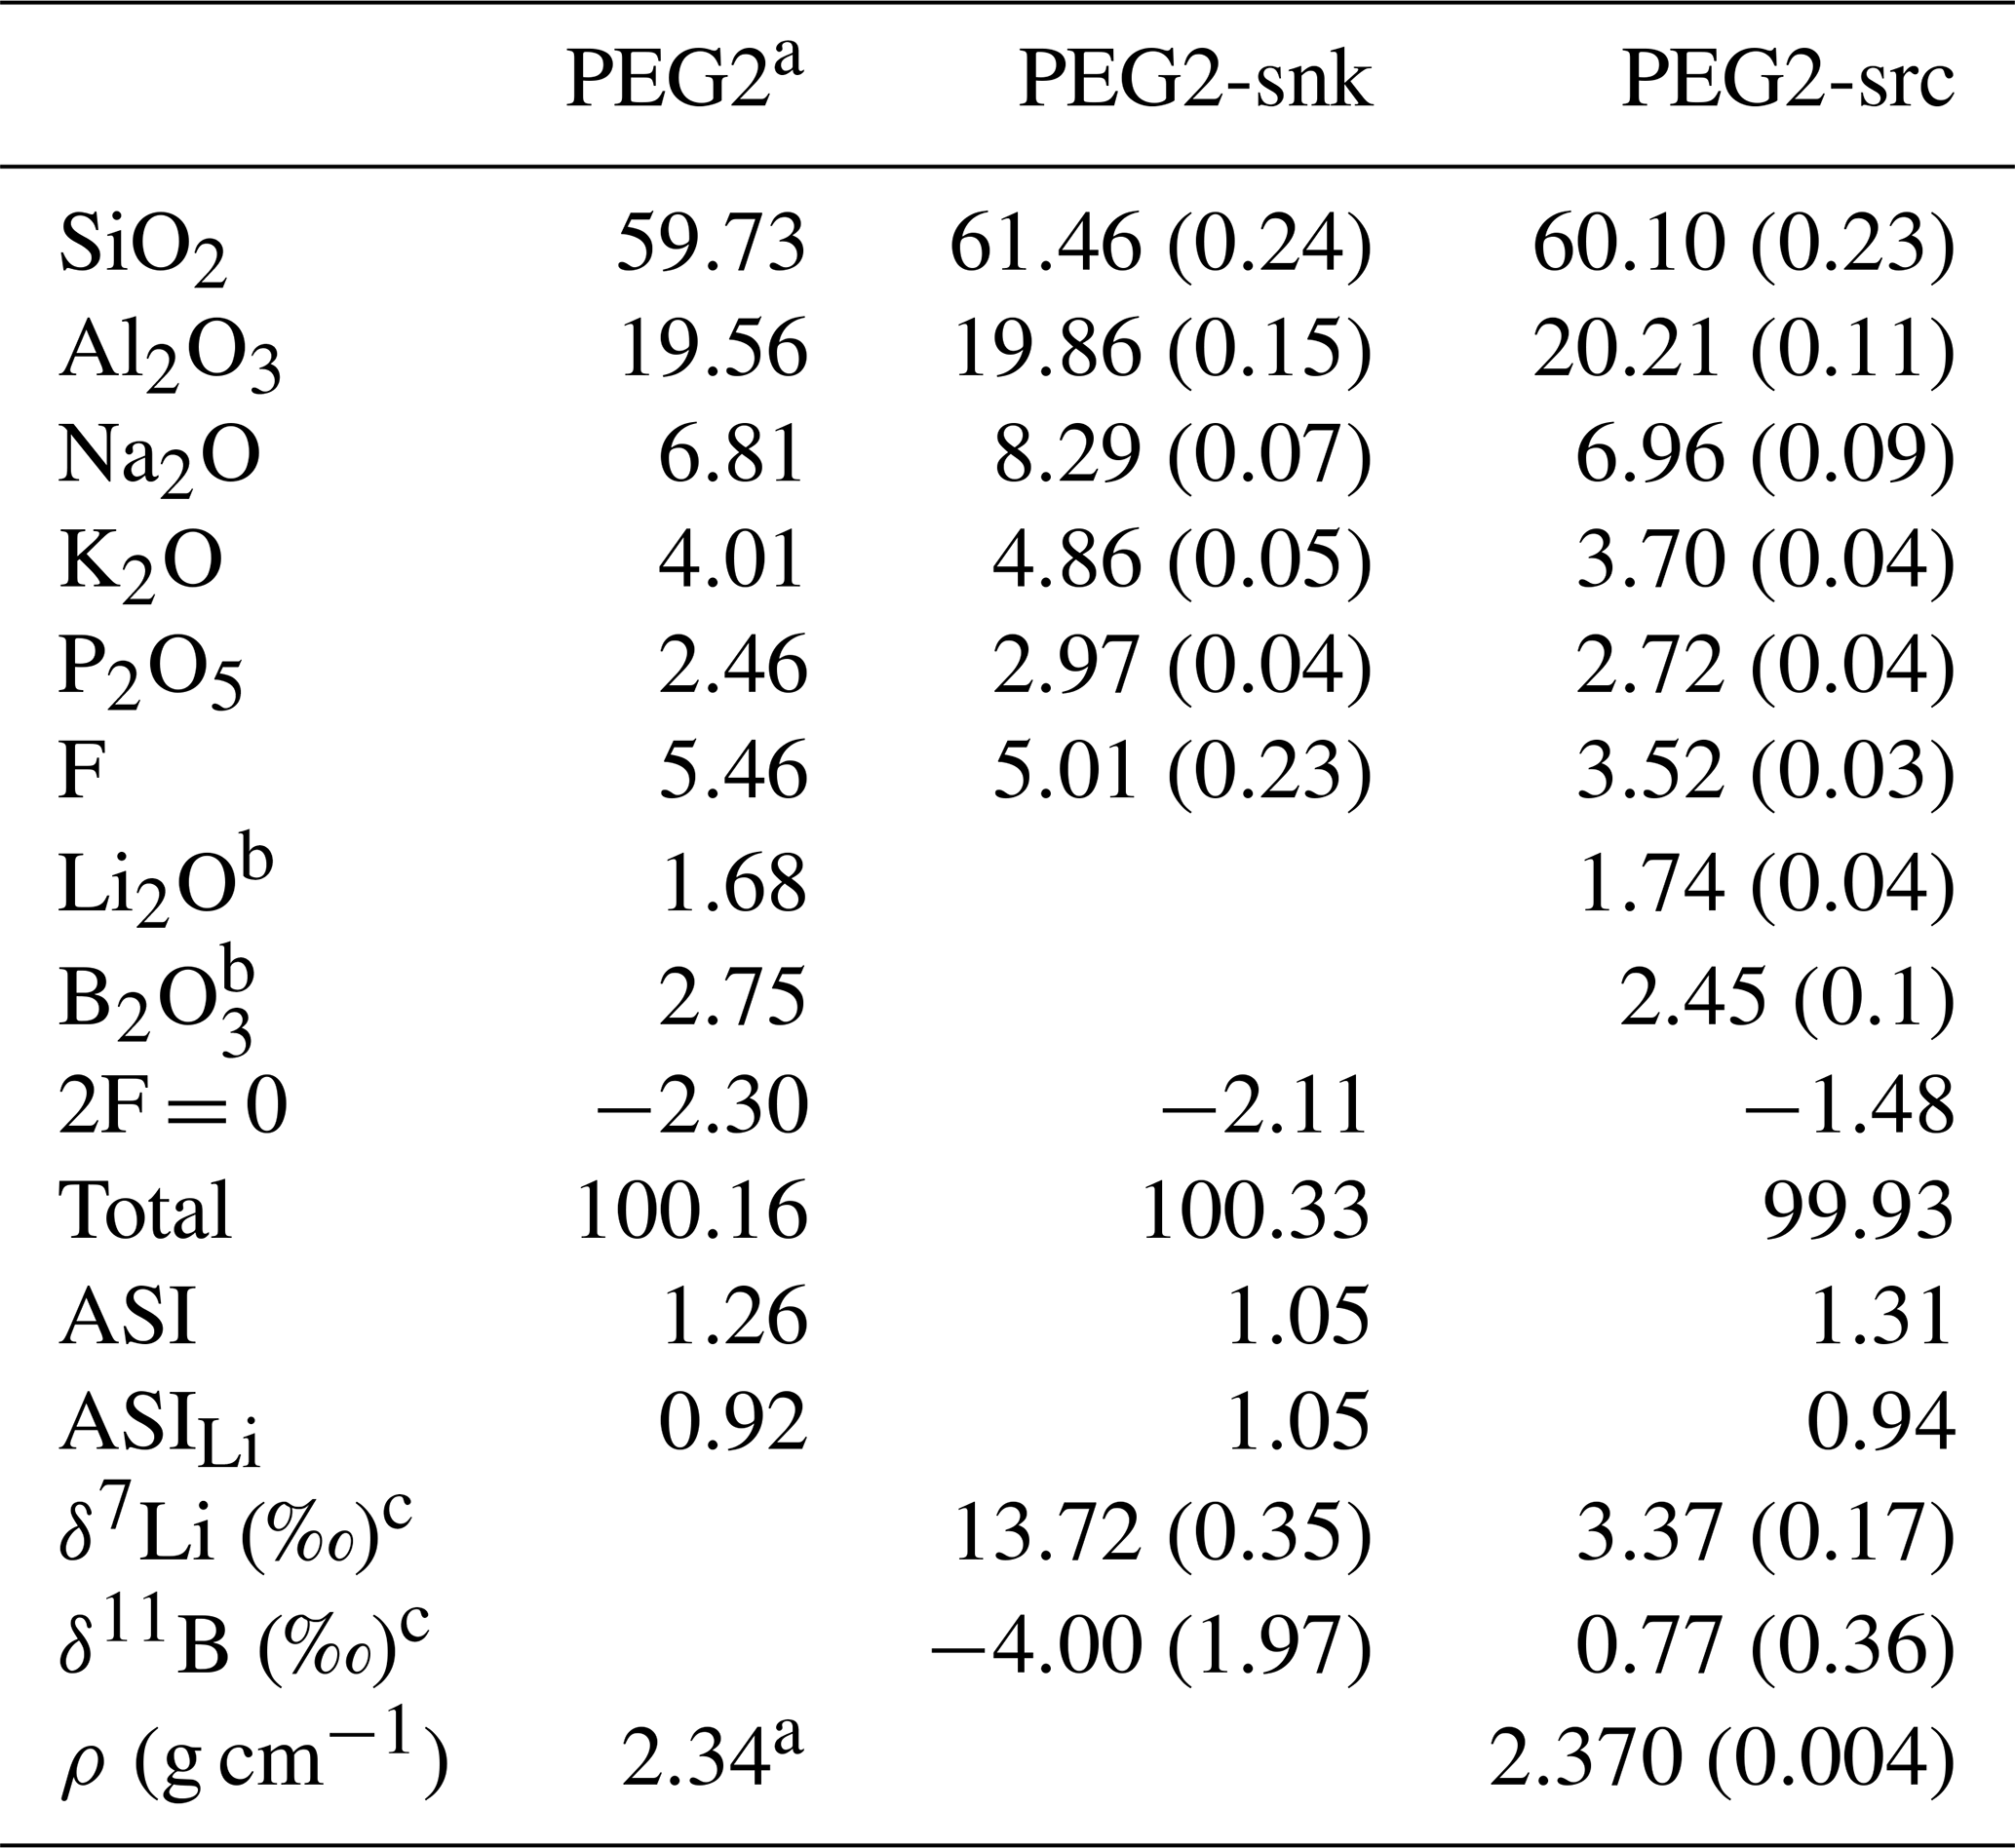
a From Bartels et al. (2011); ρ refers to their PEG2 with 0.07 wt % H2O. If not mentioned otherwise, values refer to the mean of ≥ 12 electron microprobe measurements, given as a weight percent (wt %). ASI signifies molar ratio of Al (Na + K) and ASILi= Al (Li + Na + K). b Measured by fs-LA-SF-ICP-MS. c Measured by fs-LA-MC-ICP-MS. The 1σ standard deviation is given in parentheses.
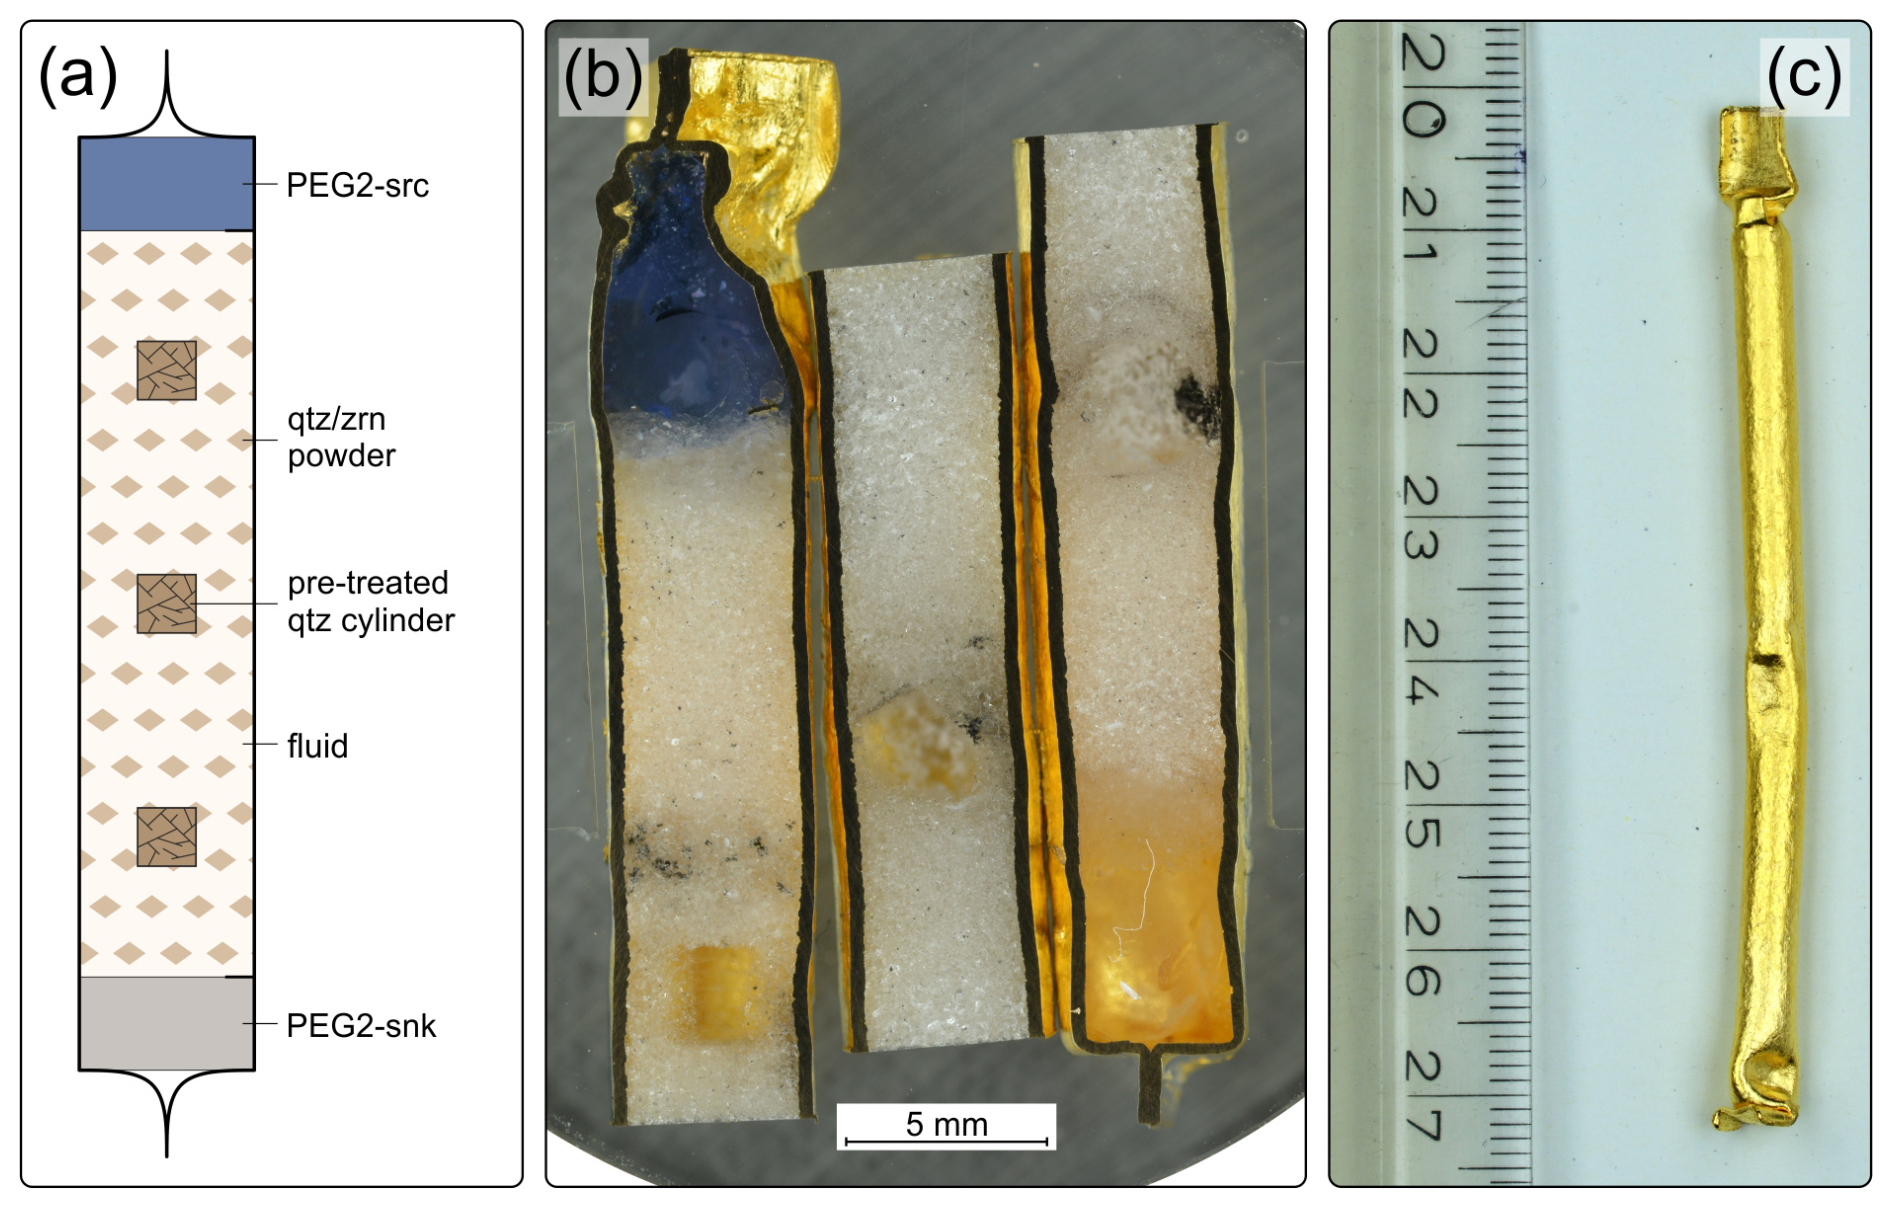
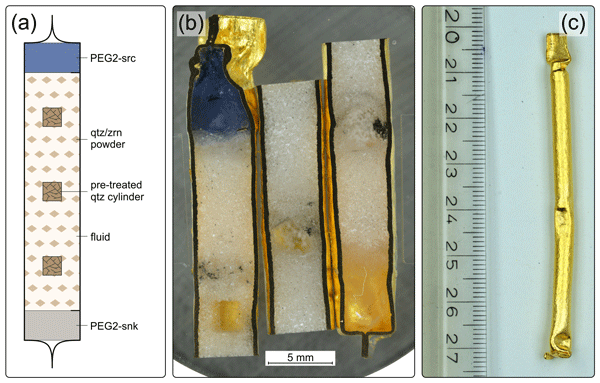
Figure 1Experimental assemblage used in this study. (a) Sketch of the capsule setup with source and sink melts at the top and bottom, respectively. The sketch is not to scale. (b) Photograph of the interior of experiment L1 after experimental run. The capsule was cut into three parts: the top, middle, and bottom parts are embedded in the left, middle, and right positions, respectively. (c) Photograph of the entire experimental assemblage after annealing the capsule. The entire assemblage has a length of ca. 70 mm and an outer diameter of 4.4 mm. See the text for details on the assemblage. PEG2-src is blue due to the addition of ca. 0.2 wt % Co to allow for easier differentiation between the top and bottom of the capsule.
2.2 Experimental procedure
With our experimental setup, Li and B are expected to be transported by a fluid phase from the source melt to the sink melt. In the following section, this experimental setup is explained in detail. Au capsules were used for transport experiments with inner and outer diameters of 4.0 and 4.4 mm, respectively, and an initial length of ca. 9 cm. Cylinders of hydrous PEG2-snk and PEG2-src were loaded in the bottom and the top ends of the capsule, respectively (Fig. 1). Pre-hydrated glasses were used to prevent the flow of free fluid into the glass cylinders under experimental conditions (details on the synthesis of hydrous glasses are given in Supplement S1). The space in between the glass cylinders was tightly loaded with a filling material in order to create a stable porous transport medium for the fluid. Initially, quartz was used as a filling material, but it exhibited very high reactivity with the melts during the experiments (see Sect. 3.2 and Fig. 2). Therefore, zircon was used as a substitute in subsequent experiments. These powders were produced from a synthetic quartz and natural zircon crystals by crushing the crystals in a steel mortar and sieving them to different grain size fractions. The 180–250 µm fraction was used for experiments to avoid clogging of the pore space due to finer grain sizes. The distance between PEG2-snk and PEG2-src was adjusted to ca. 6 cm in order to maintain reproducible experimental conditions throughout our study. A tiny piece of Au foil (ca. 1 mm × 3 mm) was added as a marker directly between the glass cylinders and the quartz/zircon powder to mark the initial position of this contact. To determine the amount of fluid added to the capsules, the porosity of the filling material was estimated to be ∼ 26 vol % (assuming close-packing of equally sized spheres), and the fluid density at experimental conditions (850 °C, 100 MPa) was assumed to be 0.213 g cm−3 (Pitzer and Sterner, 1994). The solution was injected into the pore space of the quartz/zircon powder. The amount of added solution was calculated to be 45 mg so that the entire pore space is filled under experimental conditions. Cl was added to the system via the fluid as a complexing agent in the forms of CsCl or NaCl, with concentrations of 3.1 wt % CsCl and 1.0 wt % NaCl, respectively. These concentrations were selected so that the molar Cl concentration was the same in all experiments (0.17 mol kg−1).
In order to probe the fluid composition during the experimental runs, three pre-treated quartz cylinders were placed within the quartz/zircon powder filling at equidistant positions in one experiment (labelled L1) to produce synthetic fluid inclusions. In the remaining experiments, only one quartz cylinder was added. The quartz cylinders were drilled to a diameter of 2.5 mm and a length of ca. 2 mm from a synthetic quartz crystal. They were pre-treated in order to increase the size and the amount of fluid inclusions following the procedure described by Derrey et al. (2017). For this purpose, the cylinders were heated to 350 °C in a muffle furnace, quenched in distilled water, and dried. Subsequently, they were immersed in concentrated (40 %) hydrofluoric acid for 10 min and thoroughly cleaned in deionized water.
All experiments in this study were performed at the Institute of Earth System Sciences (IESW), Leibniz University Hannover (LUH). Sealed capsules were compacted at ∼ 30 MPa in a cold-seal pressure vessel (CSPV) at room temperature prior to the experimental runs. This was done to ensure that capsules were gas-tight and to consolidate the assemblage inside the capsule. A rapid-heat and rapid-quench (RH/RQ) CSPV (with a design similar to that described by Matthews et al., 2003; our setup is described in detail in Singer et al., 2023) was used to perform the transport experiments. The RH/RQ CSPV was heated using a Carbolite TZF 12/38/400 three-zone furnace equipped with three Eurotherm 2132 temperature controllers to individually control the top, centre, and bottom heating zones. The autoclave extends ca. 30 cm into the 45 cm long ceramic tube of the furnace; therefore, the top of the autoclave is located at the transition between the top and central heating zones. Experiments were performed either under isothermal conditions (850 °C, all three zones set at the same temperature) or by applying a temperature gradient to the capsule (ca. 832 and 778 °C at the top and bottom of the capsule, respectively). The temperature differences between the top and bottom of experimental charges were ca. 4 and 54 °C in isothermal and gradient experiments. Details on the temperature distribution and calibration are given in Supplement S2. The pressure in the autoclave was adjusted to 100 MPa using Ar as the pressure medium. The pressure was monitored using a strain gauge manometer. Temperatures were monitored during experiments using a K-type thermocouple placed in an external drill hole on the top side of the autoclave. The maximum uncertainties of temperature and pressure are ±5 °C and ±5 MPa, respectively. The experimental duration was 1, 24, and 96 h (Table 2). The oxygen fugacity was not controlled during our experiments since there were no redox-sensitive elements present in the samples. However, the oxygen fugacity is estimated to be close to NNO + 1.7 (Matthews et al., 2003).
Table 2Experimental conditions for isothermal and gradient experiments.
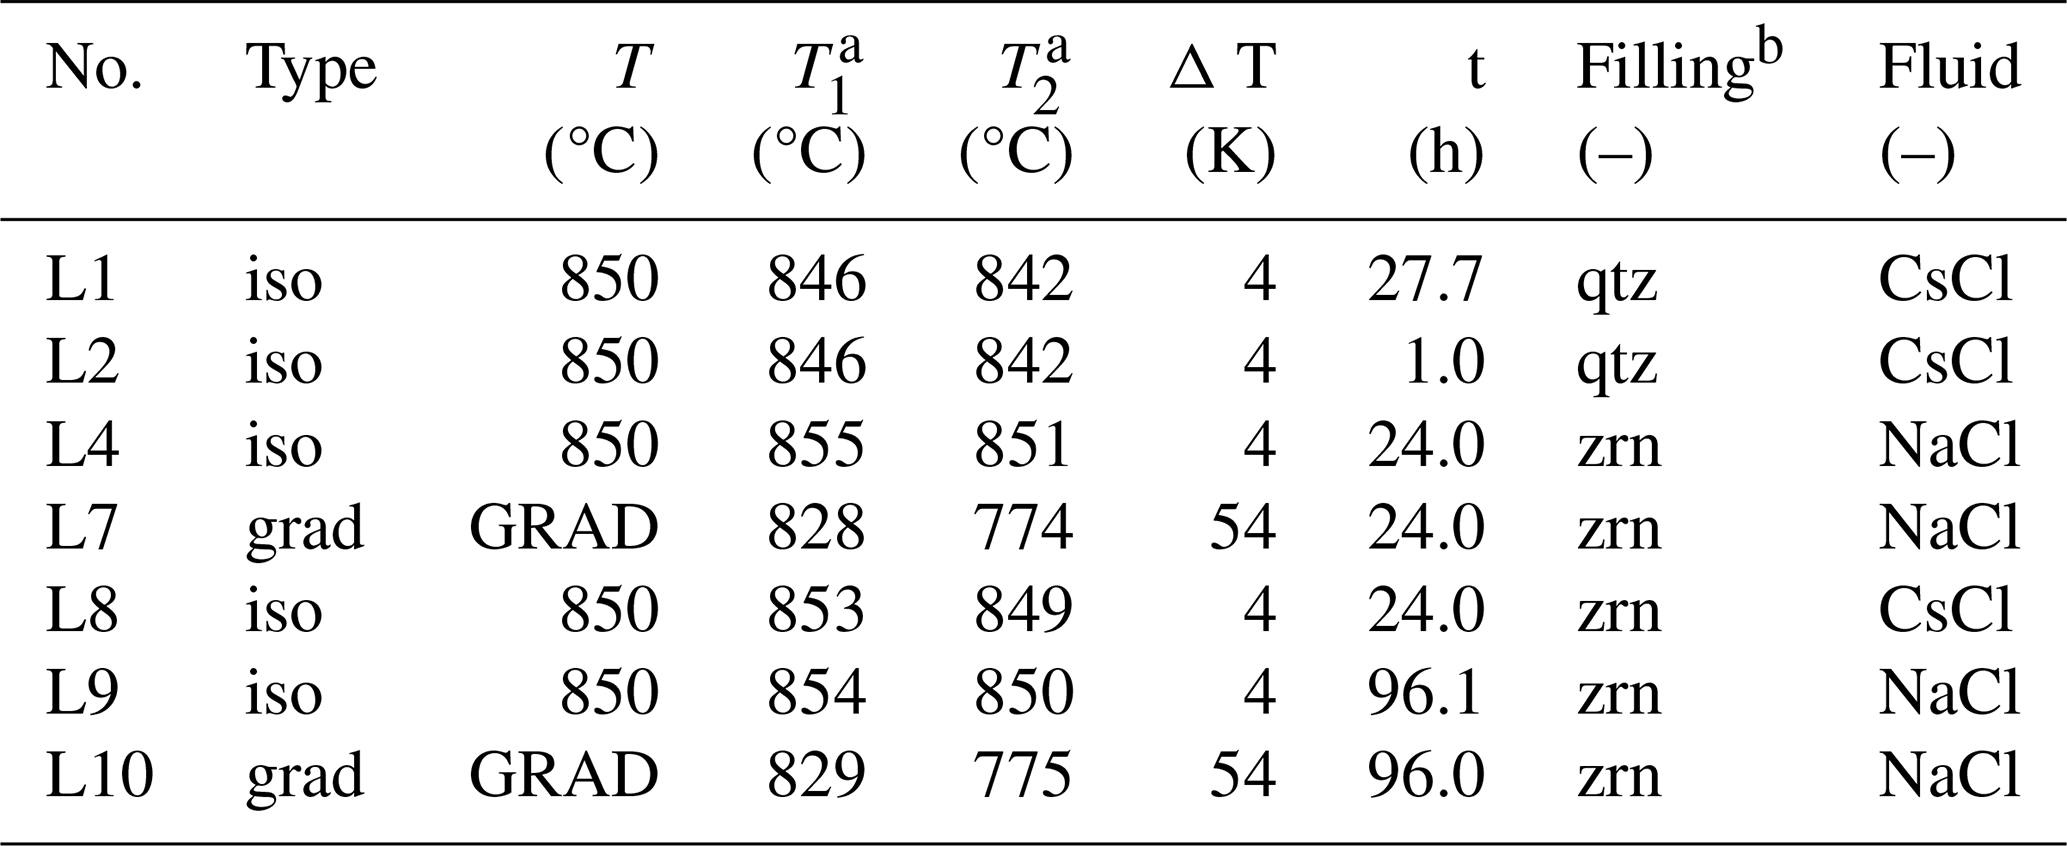
a T1 and T2 refer to the temperatures on the top and bottom of each capsule, calculated based on the calibrations done prior to experiments. b qtz and zrn denote quartz and zircon, respectively.
After experimental runs, capsules were weighed to check for potential water loss during experiments. The capsules were then pierced and dried at 110 °C for at least 1 h to remove the remaining fluid and calculate the amount of free fluid in the capsules after experiments. The weight of water released after experiments was always ca. 9 %–10 % lower than what was initially added to the capsule. For the first experimental run (L1), the entire pore space was filled up with epoxy resin to preserve the assemblage after the experiment as a whole (Fig. 1b). Subsequently, the capsule was cut in half along the cylindrical axis and polished to a roughness of 1 µm. For the remaining run products, ca. 1 cm was cut from the top and bottom of all experimental charges in order to examine the glasses and the contact regions between the glasses and quartz/zircon powders. These pieces were then filled with epoxy resin, cut in half along the cylindrical axis, and polished to 1 µm. Reflected light images of all experimental samples are given in the Supplement S3. From the other halves, doubly polished 300 µm sections were prepared to determine the water contents in the glasses using Fourier transform infrared spectroscopy (FTIR). The glasses were crystal-free, indicating that the experimental temperatures were above the liquidus. The quartz/zircon filling material was collected for subsequent analysis. The recovered quartz cylinders were cleaned, dried, cut, and polished to wafers of ca. 300 µm thickness, which were used for fluid inclusion analysis.
2.3 Analytical methods
2.3.1 Compositional analysis
Starting glass compositions and the run product glasses were analysed using a Jeol JXA 8200 EPMA at the Institute of Geosciences, Johannes Gutenberg University, Mainz, and a Jeol JXA-iHP200F HyperProbe at the IESW (LUH) with respect to SiO2, Al2O3, Na2O, K2O, P2O5, and F. Major elements were measured with an acceleration voltage of 15 keV, a beam current of 10 nA and a beam size of 20 µm. With this setting, no beam damage was detected for sensitive elements like Na and F within the acquisition time on the same analysis spot on our experimental glasses. Element concentrations were measured as line scans perpendicular to the interface with step sizes between 30–60 µm. Further analyses were conducted on sufficiently large glassy areas, where the melt migrated into the filling material (Fig. 2). To ensure the quality of the measurements, the following reference materials were repeatedly analysed during sample investigation: albite, apatite, glasses VG-2 and VG-A99 (Mainz) and K0411, several in-house basalt standards, glass mm3, and CaF2 (LUH).
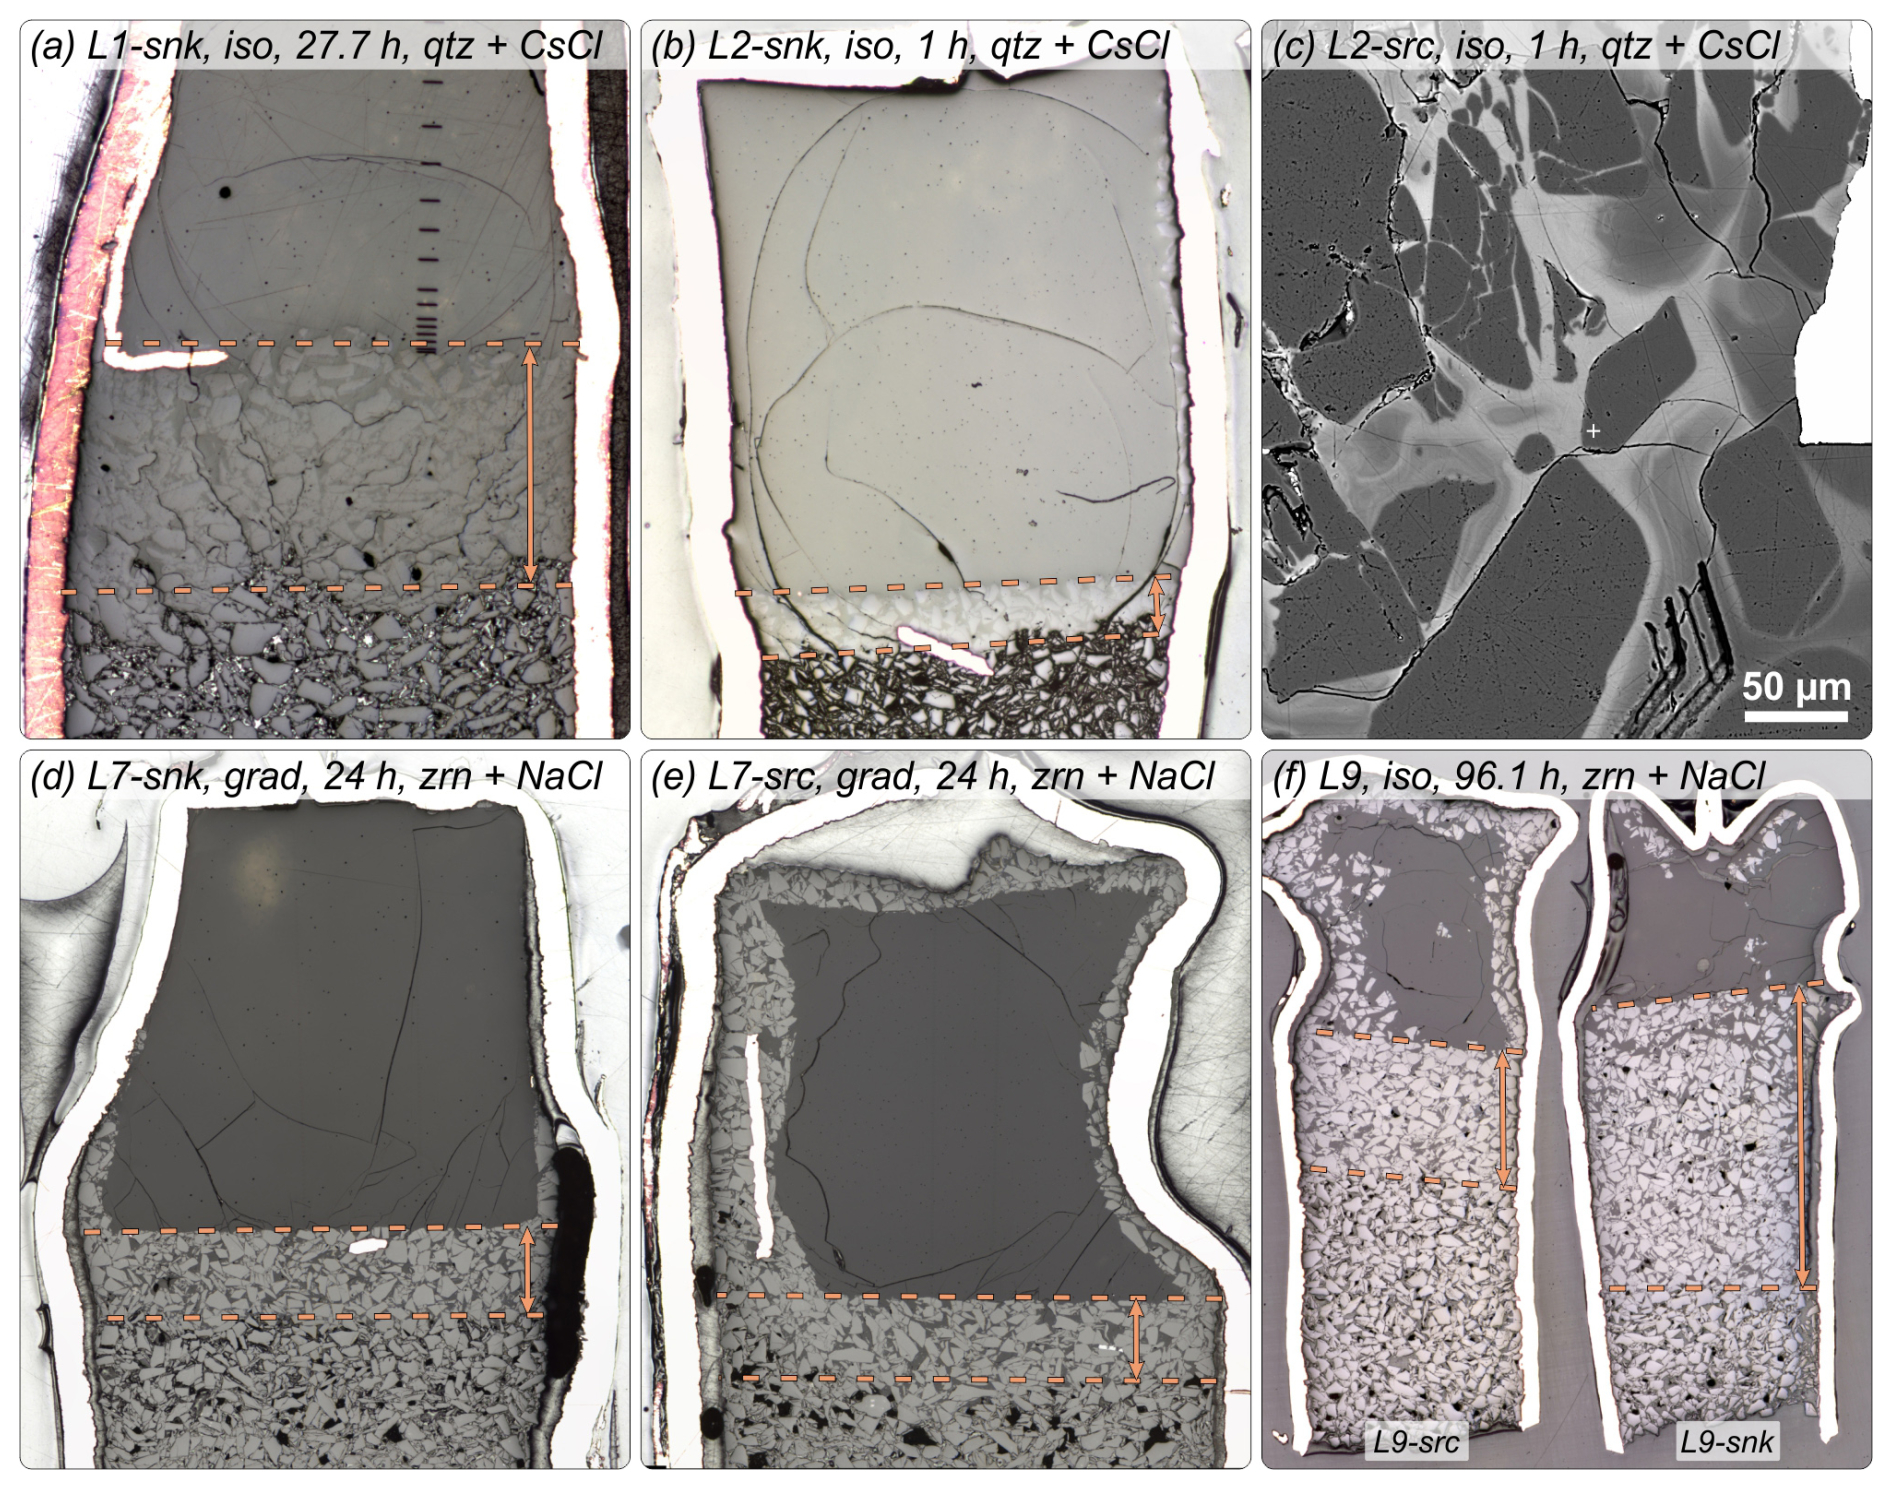
Figure 2Reflected-light images and backscattered electron image (c) of selected experimental run products using quartz (qtz) + CsCl (a)–(c) and zircon (zrn) + NaCl (d)–(f). Experimental conditions are given in the top of each image. The abbreviations iso and grad denote isothermal and gradient conditions; see the text for details. The extent of the reaction rim is marked by the dashed orange lines and the arrow in each image. Panel (c) shows the highly heterogeneous structures within the transition region. For scale, the capsule is ca. 4 mm wide in (a), (b), and (d)–(f).
Lithium and B concentration profiles were determined using an in-house-built fs-LA system (Spectra-Physics Solstice) operated in deep UV at 194 nm (Horn et al., 2006; Zhang et al., 2017) coupled with an SF-ICP-MS (Thermo Scientific Element XR) at the LUH. Furthermore, the elements Si, Al, Na, K, P, Cs, and Zr were analysed simultaneously with Li and B. Analyses were conducted with a constant repetition rate of 20 Hz. The laser spot size during ablation was ∼ 20 µm. To improve the analytical precision, ∼ 100 µm long line scans were measured perpendicular to the expected direction of element transport (i.e. parallel to the interface). These analyses were conducted with a total integration time of 120 s, consisting of ∼ 45 s of background (laser off) and ∼ 75 s of sample analysis (laser on). The scan speed was set to 5 µm s−1, and each line scan was ablated up to four times. The acquired signal was then integrated and represents the elemental concentration at the respective distance to the interface. Continuous line scans perpendicular to the interface were also acquired on some samples. The integration times and scan speeds were adjusted to accommodate the expected lengths of the diffusion profiles. The exact positions of the line scans were determined afterwards using an optical microscope. The ablated material was transported from the ablation cell by He gas that was subsequently mixed with Ar. SiO2 and Na2O concentrations determined by EPMA were used for internal standardization (29Si and 23Na) for parallel lines and continuous line scans, with both giving identical results. Na was favoured for continuous line scans because Na2O concentrations were usually constant throughout the glasses. The NIST SRM 610 reference glass (350 ppm B, 468 ppm Li; Jochum et al., 2011) was used for external standardization and quantification of Li and B concentrations. Data reduction was accomplished using the Iolite software package (Woodhead et al., 2007; Paton et al., 2011).
2.3.2 Isotope analysis
Lithium and B isotopic compositions were measured in situ utilizing the fs-LA system combined with a Thermo Scientific Neptune Plus MC-ICP-MS. Two different detector setups were employed for both Li and B isotope compositions (see also Steinmann et al., 2019; Singer et al., 2023; Singer et al., 2025). For high Li concentrations (> 80 ppm), two Faraday cups, equipped with 1011Ω and 1013Ω amplifiers, were used for 7Li and 6Li, respectively. For low Li concentrations (< 80 ppm), the 1013Ω Faraday cup was used in conjunction with a secondary electron multiplier for 7Li and 6Li. Similarly to Li, high B concentrations (> 150 ppm) were measured using two Faraday cups equipped with 1011 Ω amplifiers for both 11B and 10B. Low B concentrations (< 150 ppm) were analysed using two Faraday cups equipped with 1011Ω and 1013Ω amplifiers for 11B and 10B.
Lithium and B isotope profiles were obtained by measuring ca. 300 µm long line scans parallel to the interface with a scan speed of 5 µm s−1. Repetition rates were adapted during measurements in order to keep the intensities at the detectors as constant as possible. The laser spot size during ablation was ∼ 20 µm. Data were acquired using a standard–sample bracketing protocol. Signals were collected for a total time of 180 s, including 40 s of background prior to the ablation. The setups described for low concentrations of Li and B were usually applicable in PEG2-snk glasses, while PEG2-src was measured using the high concentration setups for Li and B. Since higher-resistance amplifiers have a slower signal response, a τ correction was applied as described by Steinmann et al. (2019) for all analyses involving the 1013Ω amplifier. δ7Li and δ11B values are reported in ‰ relative to IRMM-016 and NIST951, respectively, according to
Since PEG2-src and PEG2-snk span a large range of Li and B concentrations from > 8000 ppm down to ∼ 3 ppm, different bracketing and secondary reference glasses were selected. The following materials were used: ARM-1 and ARM-2 (511 and 1230 ppm Li and 463 and 10500 ppm B, respectively; Wu et al., 2019), NIST610 (468 ppm Li, 350 ppm B; Jochum et al., 2011), and GOR132-G and T1-G (9.4 and 20.0 ppm Li, respectively; Jochum et al., 2006; De Hoog, 2018), where the latter two were only used for Li. For high Li concentrations, ARM-2 was employed as the bracketing reference glass, which was the material with the highest Li concentration, and ARM-1 and NIST610 were employed as secondary reference glasses. In the low-concentration glasses, GOR132-G and T1-G were used as bracketing and secondary reference glasses, respectively. For high and low B concentrations, ARM-2 and ARM-1 were used as bracketing standards, respectively. NIST610 was employed as a secondary reference material in all B analyses. Replicate analysis of these secondary reference materials was taken as a measure for the accuracy and reproducibility of fs-LA-MC-ICP-MS measurements. Values of δ7Li and δ11B were initially calculated relative to their corresponding bracketing standards. Subsequently, they were recalculated and reported relative to IRMM-016 and NIST951, assuming a δ7Li value of 8.9 ‰ for GOR132-G and 2.59 ‰ for ARM-2 relative to IRMM-016 (Wu et al., 2021; Singer et al., 2023). For δ11B, we used values of −12.63 ‰ and −11.82 ‰ for ARM-2 and ARM-1, respectively, relative to NIST 951 (Wu et al., 2021). The measurements were mainly performed during two sessions within 5 months. Each session consisted of 2 consecutive days for Li and B isotopes, respectively. For the secondary reference materials, the following values were obtained during repeated measurements for Li: 0.91 ± 0.47 ‰ for ARM-1 (N=10) and 4.01 ± 0.62 ‰ for T1-G (N=11). For B, the following values were obtained for the secondary reference glasses: 0.20 ± 0.41 ‰ for NIST610 (N=12) using the high-concentration setup and −0.33 ± 0.57 ‰ for NIST610 (N=11) in the low-concentration configuration. These values are consistent with values published elsewhere (Li: Jochum et al., 2006; Wu et al., 2021; B: Kasemann et al., 2001; Kimura et al., 2016). There is no detectable difference between the values obtained during both analytical sessions.
2.3.3 Fluid measurements
Synthetic fluid inclusions were examined by microthermometry using a Linkam FTIR600 heating and freezing stage. The final ice-melting temperatures (Tm) were determined after cooling the wafers to −60 °C until the inclusions were frozen. Subsequently, they were heated at a low heating rate until the ice disappeared. At least four inclusions were investigated on each wafer. All three wafers gave similar Tm values of −(0.8–0.9) °C. Using the model of Bodnar (1993), the NaCl-equivalent salinity was calculated as 1.40 wt %–1.57 wt % NaCleq. The Li concentrations of synthetic fluid inclusions were analysed using the same instrumentation as described in Sect. 2.3.1. along with a modified INSTEC heating and freezing stage with a cell volume of 3 cm3. Prior to laser ablation, fluid inclusions were frozen at −60 °C, following the analytical protocol proposed by Albrecht et al. (2014). The fluid inclusions were opened and ablated with repetition rates in the range of 167–250 Hz. Data were collected for a total of 5 min, ideally including the signals of quartz, frozen fluid inclusion, and quartz again. The acquired data were evaluated using the SILLS data reduction software (Guillong et al., 2008). The NaCleq values determined by microthermometry were used for internal standardization. This approach was not pursued further after experiment L1 because it is unclear at what time the fluid inclusions close, and, during the experiments, the concentration of the fluid might continuously change. A more detailed fluid inclusion investigation was beyond the scope of this study. The fluid inclusion analyses performed in experiment L1 yielded similar results for Li and B on the three different wafers within the respective errors. Average Li concentrations were determined as 419 ppm (±219 ppm; nine measurements), while the average B concentrations of 532 ppm (±241 ppm; nine measurements) were slightly higher.
2.3.4 Water content analysis in glasses
The water content in our experimental glasses was determined at two stages: (1) after producing the water-bearing glasses for transport experiments to ensure that the synthesis was successful and (2) after performing the transport experiments. This was done to ensure that the glasses were water-saturated during the experiments and have consistent water contents throughout our experimental series. In order to determine water contents by FTIR, knowledge of glass density and linear molar absorption coefficients is necessary. For PEG2-src, the density was determined to be 2.370 g cm−3 for the nominally dry glass, and the linear molar absorption coefficients were determined to be (1.35 ± 0.08) and εOH= (1.06 ± 0.14) L mol−1 cm−1 (Singer et al., 2025). For PEG2-snk, the density and the absorption coefficients were not determined; however, the data of PEG-src were used as a close approximation. This is further supported by the fact that only the relative water contents of our experimental glasses need to be evaluated, for which a comparative approximation is sufficient.
A Bruker IFS88 with an attached IRscope II was employed for the determination of water contents in experimental glasses. The slit aperture was set to an area of ca. 100×100 µm2 in the focus plane. The analytical setup included a tungsten light source, a CdF2 beam splitter, and an MCT detector. On each sample, ca. 4–10 points were measured in the contact region and the interior of the glass to check for homogeneous water distribution within in the glasses. A total of 100 scans were accumulated for each spectrum, with a spectral resolution of 4 cm−1. The two bands at 4500 and 5200 cm−1 correspond to the number of OH groups bound to tetrahedral cations and molecular H2O, respectively (e.g. Behrens et al., 1996). A linear tangential baseline was subtracted from the acquired spectra. The peak heights of these bands were used to quantify the speciation of water and the total water concentration. The thickness of doubly polished sections was measured with a digital micrometre (Mitutoyo), with a precision of ±2 µm. The concentrations of OH and H2O can be determined by applying the Lambert–Beer law:
where cOH and denote the content of water dissolved as OH groups and molecular H2O in wt %, respectively. A is the absorbance at the peak height of the corresponding peaks, d is the thickness in cm, ρ is the density in g L−1, and ε denotes the linear molar absorption coefficients of the corresponding species in L mol−1 cm−1. The total water content can be calculated as follows:
The general appearance of our assemblage did not change significantly before and after the experiments. However, a transition zone formed at the interface between the glasses and the quartz/zircon filling, in which the pore space between quartz or zircon was filled by glass (Fig. 2). In the short-term experiment L2 with quartz (1 h duration), the melt trapped between the quartz grains is strongly heterogeneous (Fig. 2c). The thickness of the transition zone depends on the experimental duration, the temperature, and the filling material. It became larger with increasing run duration and with quartz (compared to zircon) as filling material. The quartz grains are characterized by rounded shapes, while the zircon grains retained their initial sharp edges. In experiments where Au markers are exposed, they are located at the immediate contact between the main glass body and the filling material (Fig. 2a, b), indicating that the melt phase percolated through the mineral assemblage. However, in some experiments, the quartz/zircon powder moved along the sides of the glass cylinders and also into the interior of the glasses (e.g. experiments L4, L8, L9; Fig. 2). The glass cylinders were deformed in some experiments (e.g. L7, L9, L10, Fig. 2e).
3.1 Major element concentrations in the source and sink melts
Depending on the filling material, the major element composition of the glasses can be divided into two groups. In experiments with quartz as filling material, a strong enrichment of SiO2 (up to ≥ 70 wt %) is observed in the first ca. 250 µm of the main glass body adjacent to the transition zone (Fig. 3a, b) and within the transition zone itself. This SiO2 enrichment is coupled to a decrease in concentration of all other major elements (i.e. dilution effect; Fig. 3a–c) and is interpreted to be the result of the dissolution of quartz in the initially SiO2-undersaturated melt. In experiments with zircon as filling material, the major element concentrations are generally constant over the entire length of the glass bodies (Fig. 3d, e). The glasses within the transition zone show a moderate enrichment in SiO2 (≤ 63 wt % (Fig. 3f), also coupled to a decrease in all other major elements. This enrichment in SiO2 is interpreted to be the result of a transport of silica from the quartz cylinder to the melt via the fluid phase.
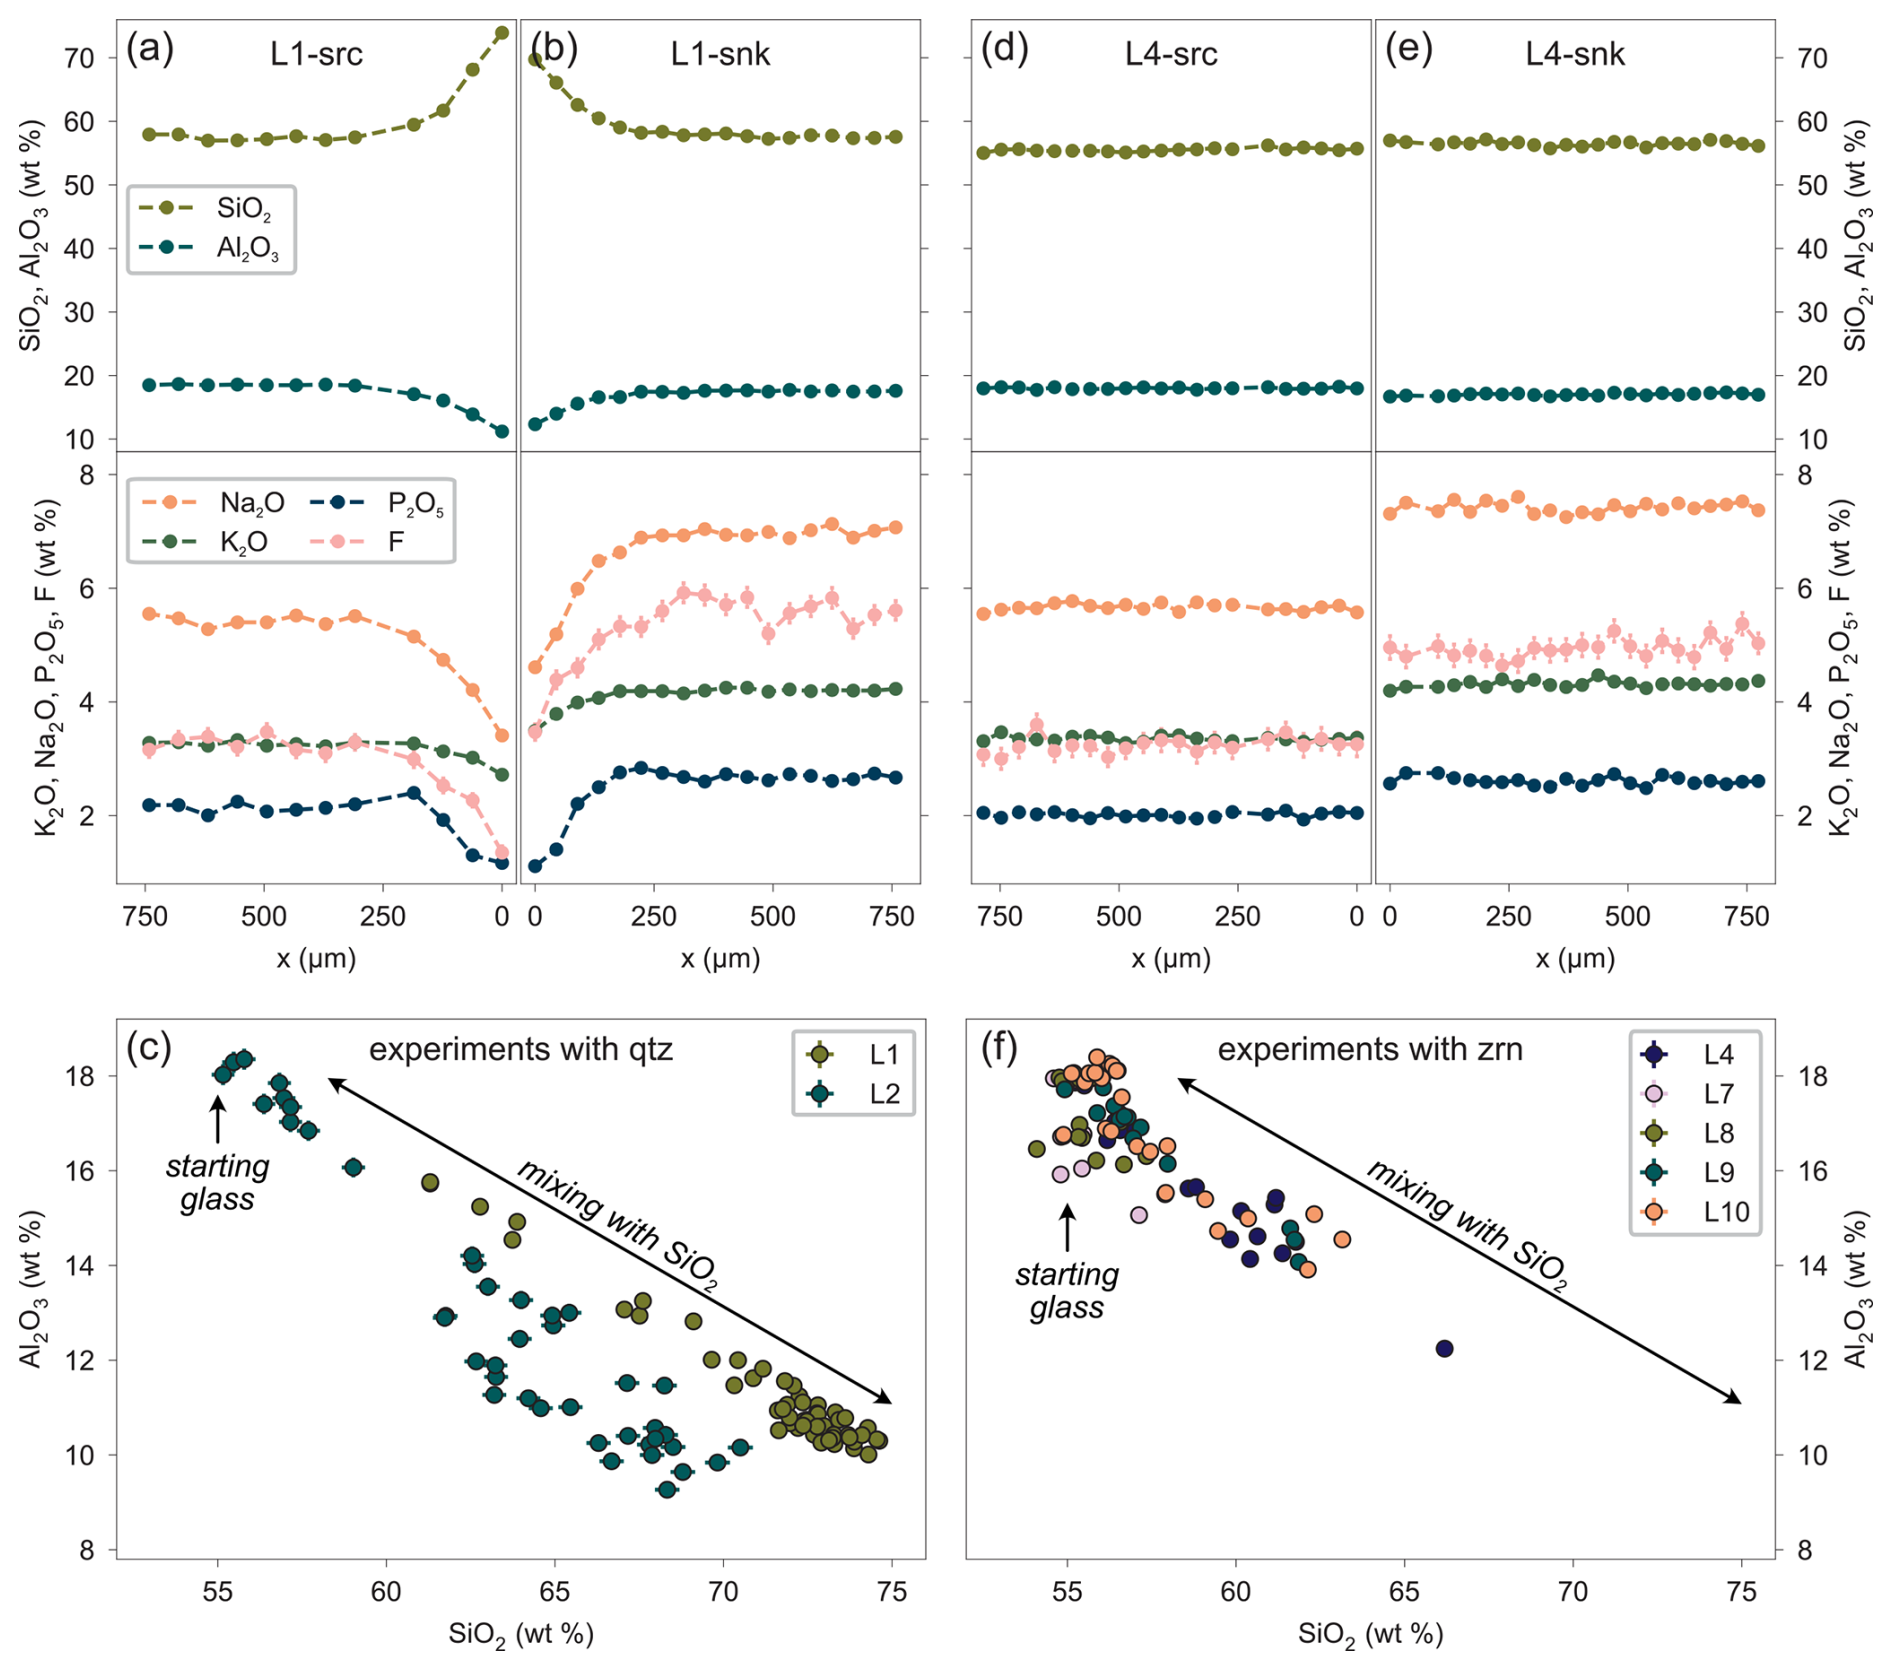
Figure 3Major element concentrations in glasses representative for experiments using quartz (a)–(c) or zircon (d)–(f) as filling material. The upper panels show concentration profiles of SiO2, Al2O3, Na2O, K2O, P2O5, and F in the main glass bodies. The profiles start at the contact between glass and filling material (x=0 µm), and the value of x increases towards the interior of the glass bodies. The corresponding source and sink glasses belonging to one experimental run are shown opposite each other, e.g. PEG2-src (a) and PEG2-snk (b) of experiment L1. The lower panel shows the concentrations of Al2O3 vs. SiO2 in wt % obtained within the transitional zone from experiments using quartz (c) or zircon (f). This demonstrates that the compositional variability in the transitional zone can be reproduced by a direct mixing between the starting glasses (top-left corner) and SiO2 from quartz dissolution. The scientific colour map “batlow” by Crameri (2023) is used for visualization of most data.
The water contents of glasses are reported for each experiment in Table 3. The water contents determined in the PEG2-src glasses were in the range of 5.7 ± 0.3 wt % to 6.3 ± 0.1 wt % H2O, averaging at 6.1 ± 0.5 wt %. The water contents determined for PEG2-snk were significantly higher, ranging from 7.0 ± 0.3 to 8.4 ± 1.1, with an average value of 7.8 ± 1.0 wt % H2O. This difference can be explained by the very high alkali content of ca. 8.3 wt % Na2O and 4.9 wt % K2O of PEG2-snk. This observation also implies that the water solubility models of classical granitic melts cannot be applied for alkali-rich compositions, even if the ASI is close to 1. The higher water solubility observed in gradient experiments L7 and L10, where PEG2-snk has a lower temperature than PEG2-src, can be explained by the negative correlation of solubility with temperature at 100 MPa (Holtz et al., 1995).
Table 3Measured water concentrations of experimental glasses.
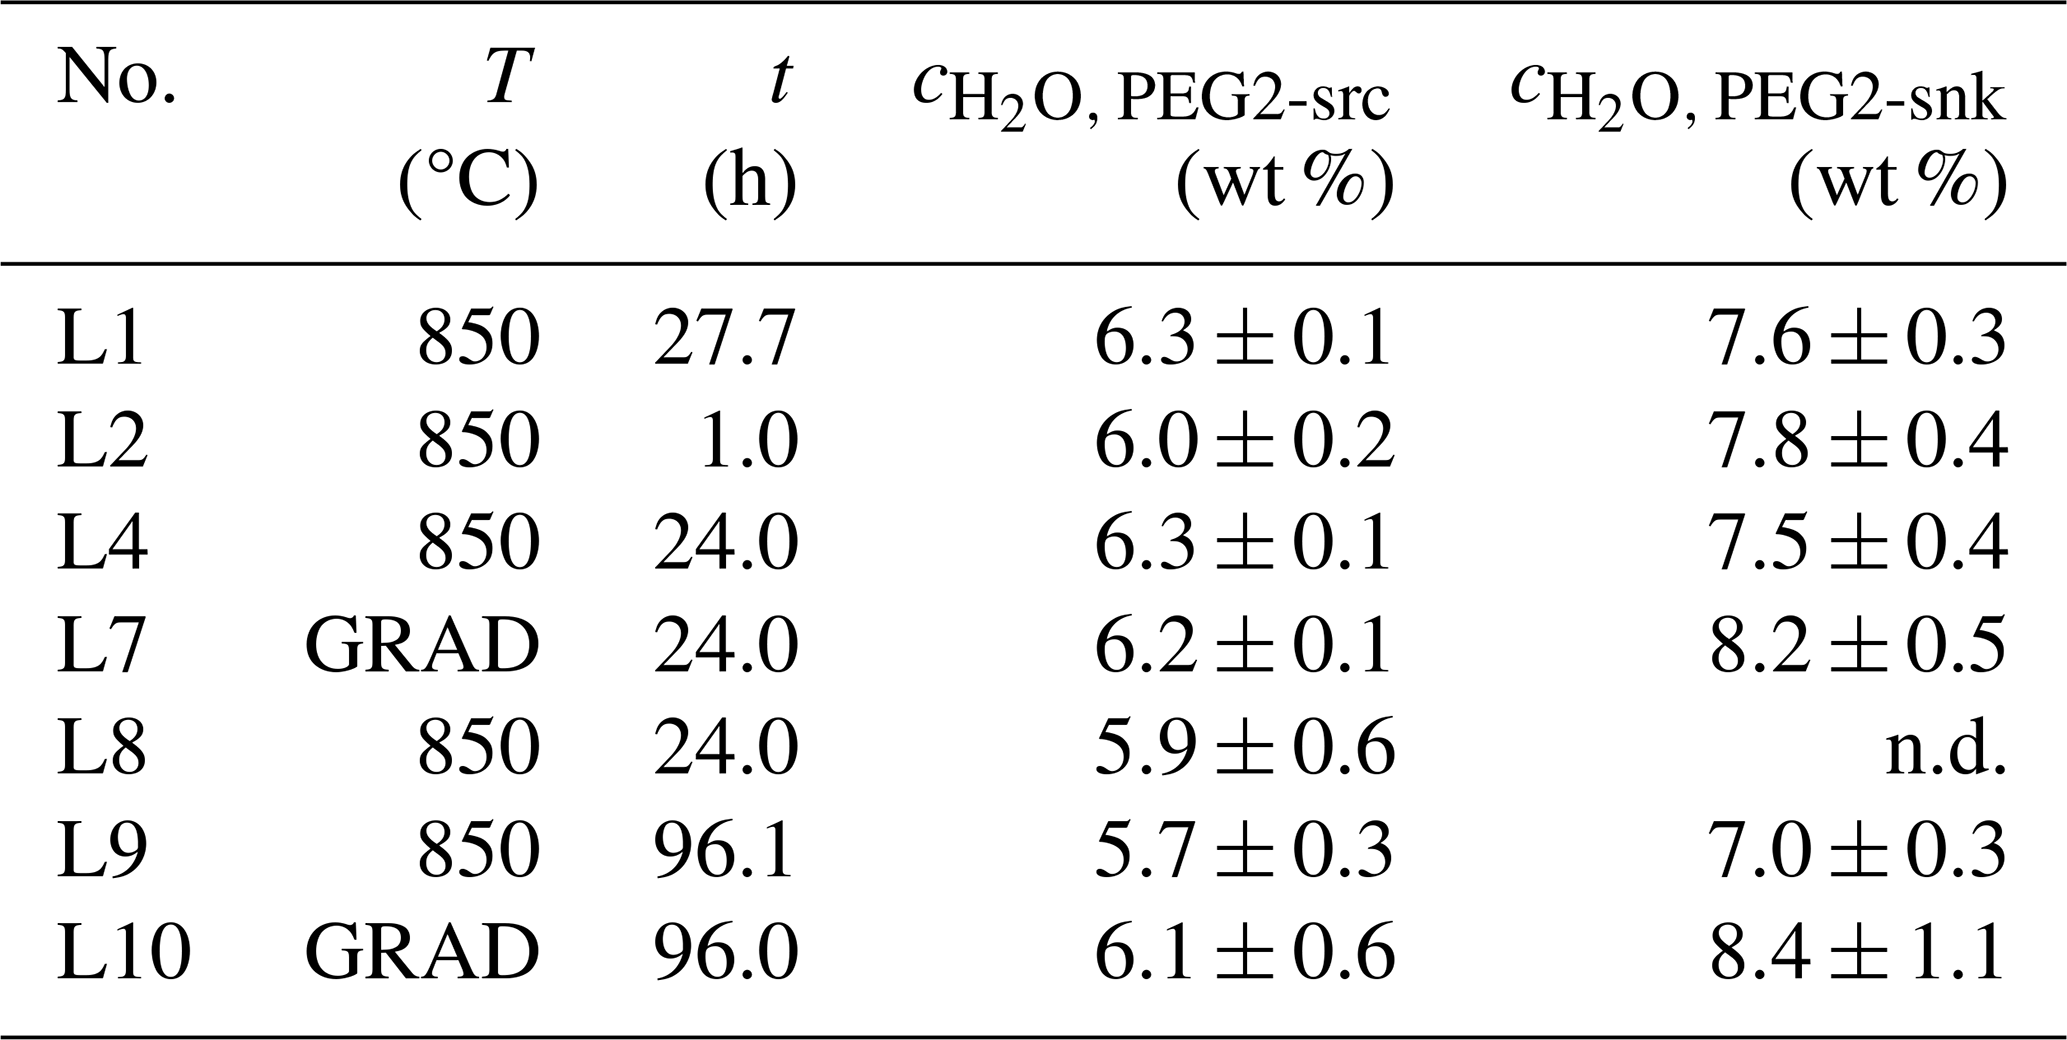
Note that n.d. denotes not determined because no glass volume was large enough for FTIR determination.
3.2 Element distribution in the source and sink melts separated by zircon filling material
The concentrations of Li and B in glasses, as well as those of additional trace elements (Zr and Cs), are first described for experiments with zircon filling material as no changes in the major element compositions of PEG2-src to PEG2-snk occurred. The PEG2-src glasses of the five corresponding experiments (L4 to L10, Table 2) exhibited either minor depletions in Li or B towards the interface in the first few µm of the main glass body (Fig. 4c, d, f) or no change at all (Fig. 4e). In the transition zone glasses adjacent to PEG2-src that could be analysed (L4 and L7), the Li and B concentrations were not significantly different from the inner part of the glass body (Fig. 4c and d). These concentrations are in the same range as the starting materials. For one sample, the B concentration is lower (L8), which may be due to heterogeneities of the starting material.
In PEG2-snk, the Li concentrations are very low compared to the source and <130 ppm in the main glass body (Table 4). The Li concentrations are homogeneous throughout the entire length of the sink glass body. The Li concentrations in 24 h glasses from experiments without a gradient (L4 and L8) are very low, with Li concentrations below 5 ppm. The Li concentrations in the glass obtained after 96 h (L9) are higher, reaching ∼ 20 ppm. In contrast, Li concentrations are higher in experiments with a thermal gradient and reach ∼ 30 and ∼ 100 ppm for run durations of 24 and 96 h, respectively. The B concentrations in PEG2-snk are generally higher than those of Li and can reach ∼ 600 ppm close the fluid–melt interface (Table 4). The concentrations are higher close to the fluid–melt interface (Fig. 4), which indicates that the diffusivity of B is lower than that of Li. Boron concentrations far away from the fluid–melt interface (∼ 800 µm) are in the range of 0 to 20 ppm. The concentration gradients are more pronounced in the two glass bodies obtained from experiments with thermal gradients (higher concentrations close to the interface and lower concentrations far from the interface when compared to isothermal experiments). It can also be noted that B concentrations are strongly heterogeneous within the transition zone.
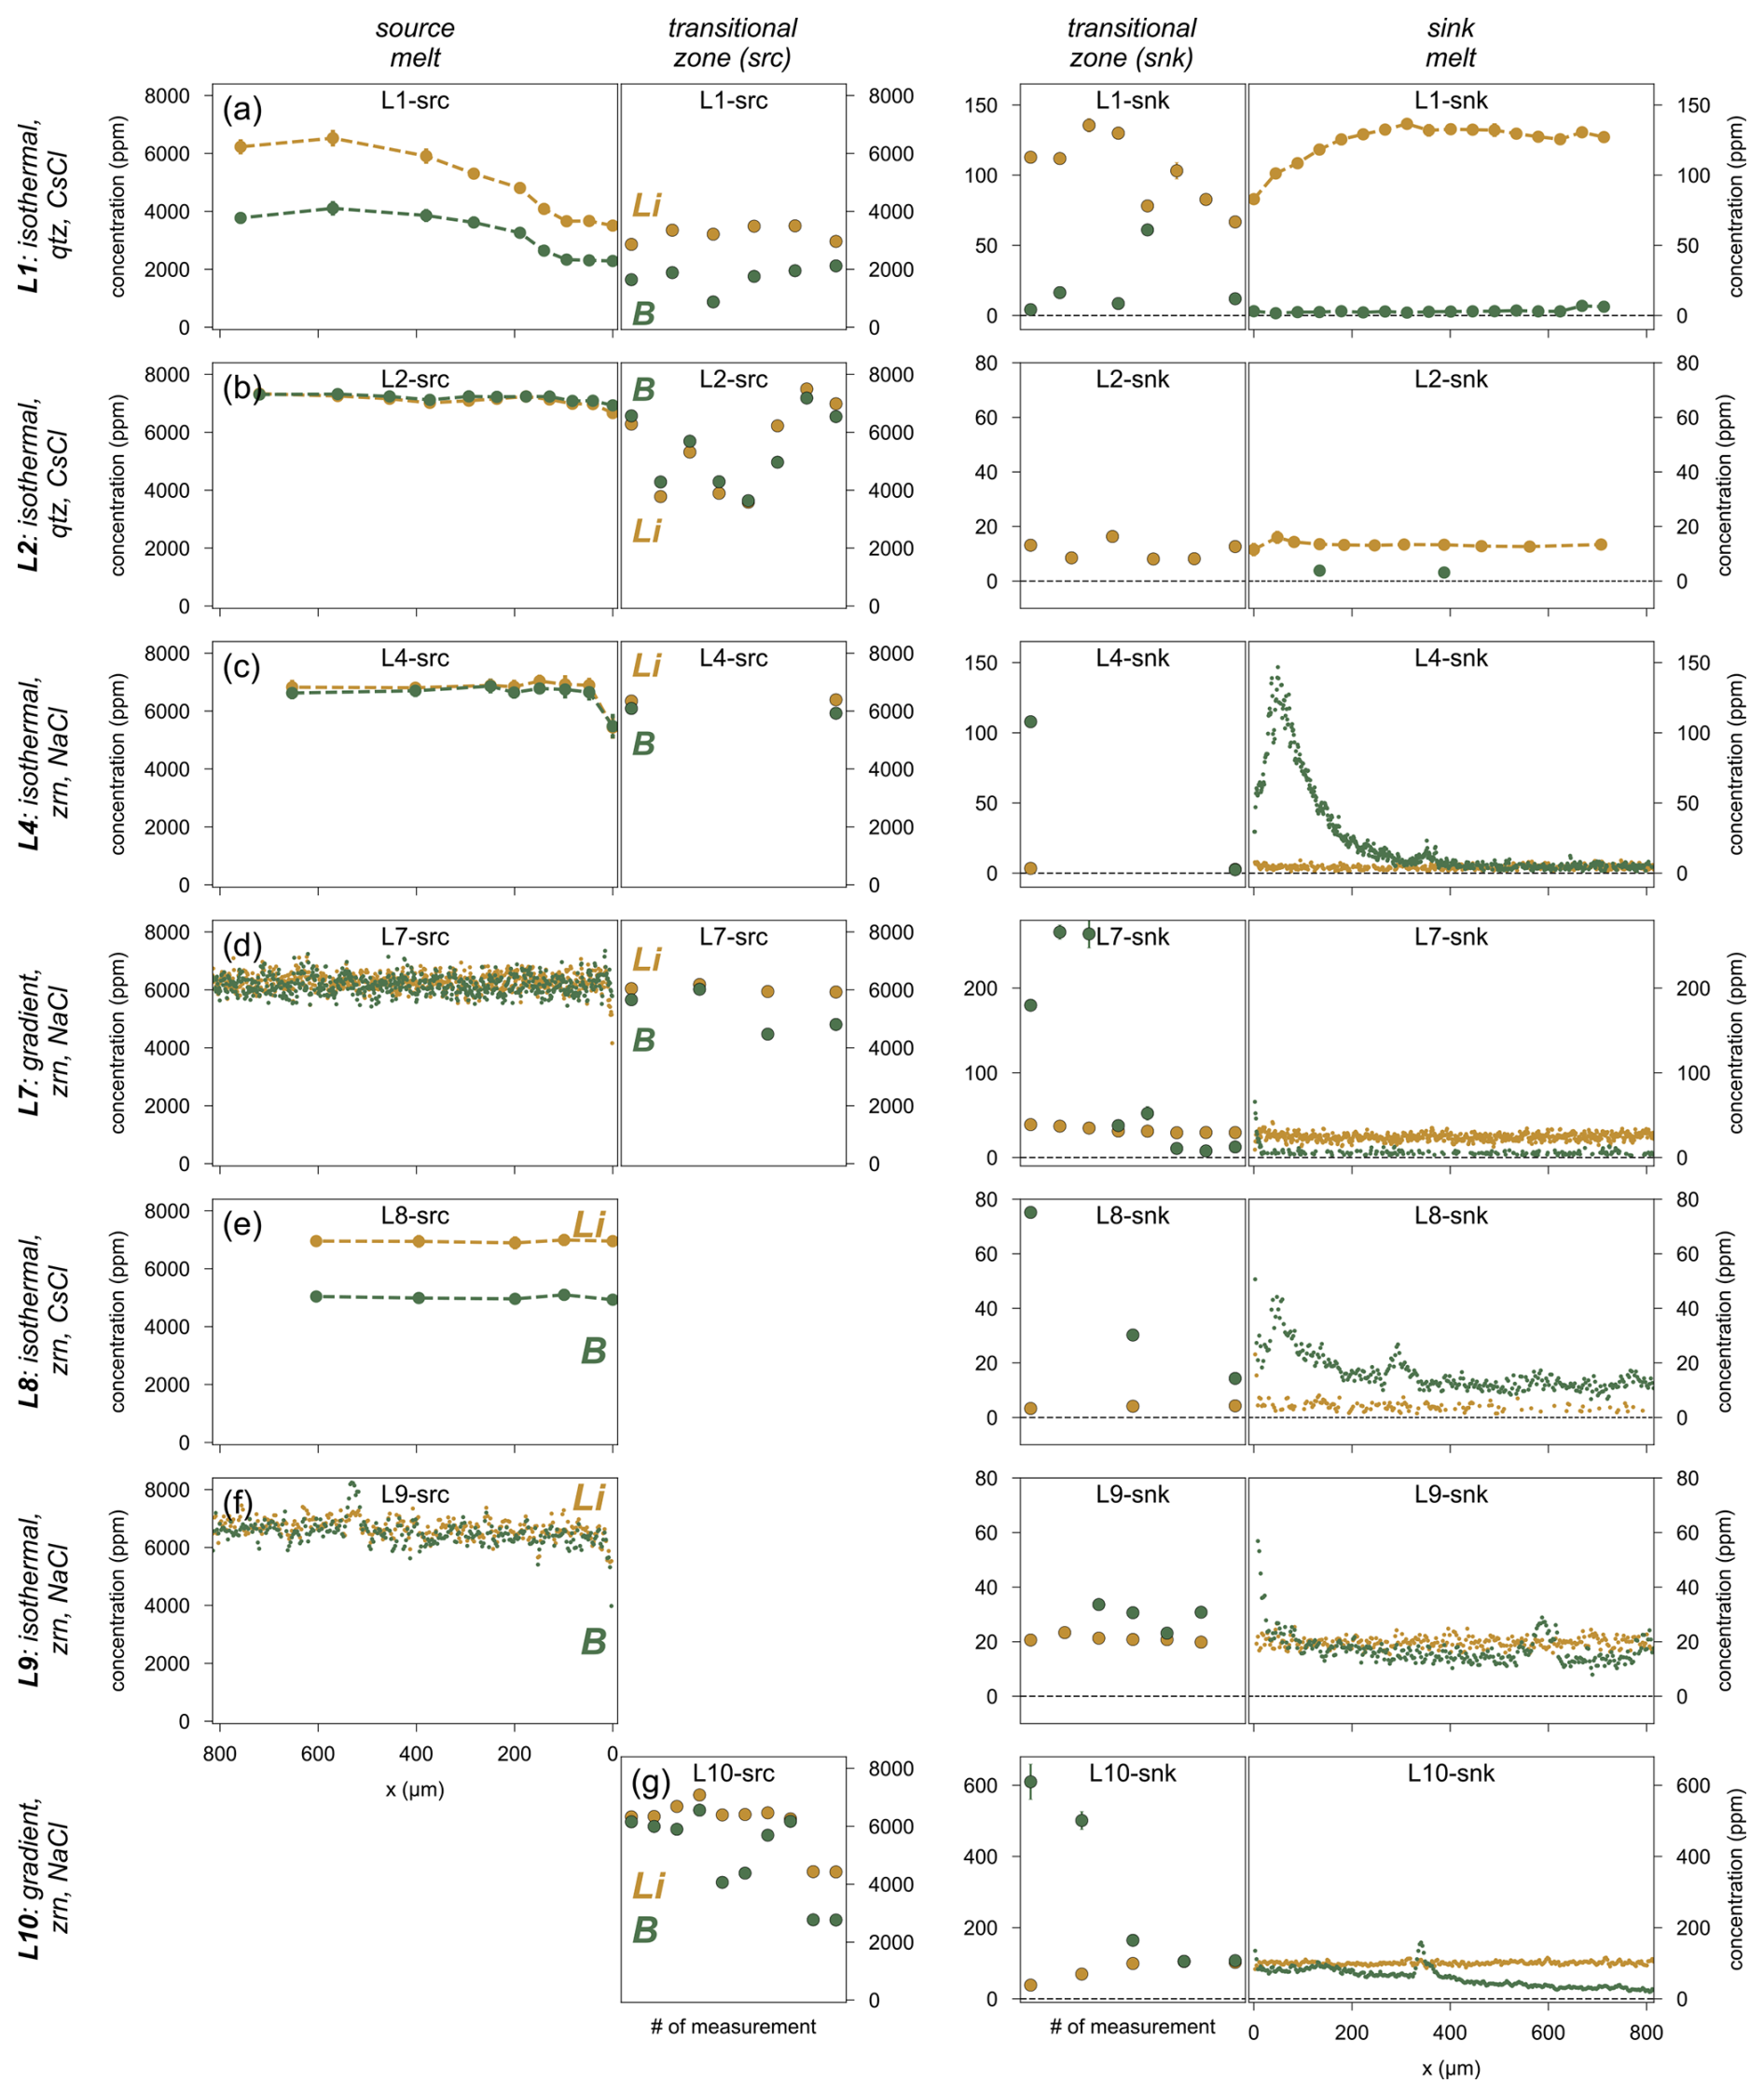
Figure 4Trace element profiles of Li and B in all experimental run products. Each horizontal array corresponds to one experimental run. For (a)–(g), the panels on the left and right show the concentrations in PEG2-src and PEG2-snk, respectively, and their corresponding transitional regions. Mind the different y scales between the left and right halves, as well as between the different PEG2-snk glasses in the right half of the figure. The profiles start at the interface between the main glass body and the quartz or zircon filling (x= 0 µm). For the PEG2-snk glasses in experiments L4 and L8, the maximum B concentration was measured at a short distance from x=0; this is likely an analytical artefact caused by the initial ablation of filling material and glass and enhanced by the long wash-out times of the ablation cell and the fast scan speeds of the line scans. For the transitional regions, the measurement points are in the order of distance from the fluid–melt interface. For empty panels, no data were acquired.
Table 4Maximum Li and B concentrations in the sink glass and at various distances from the interface.
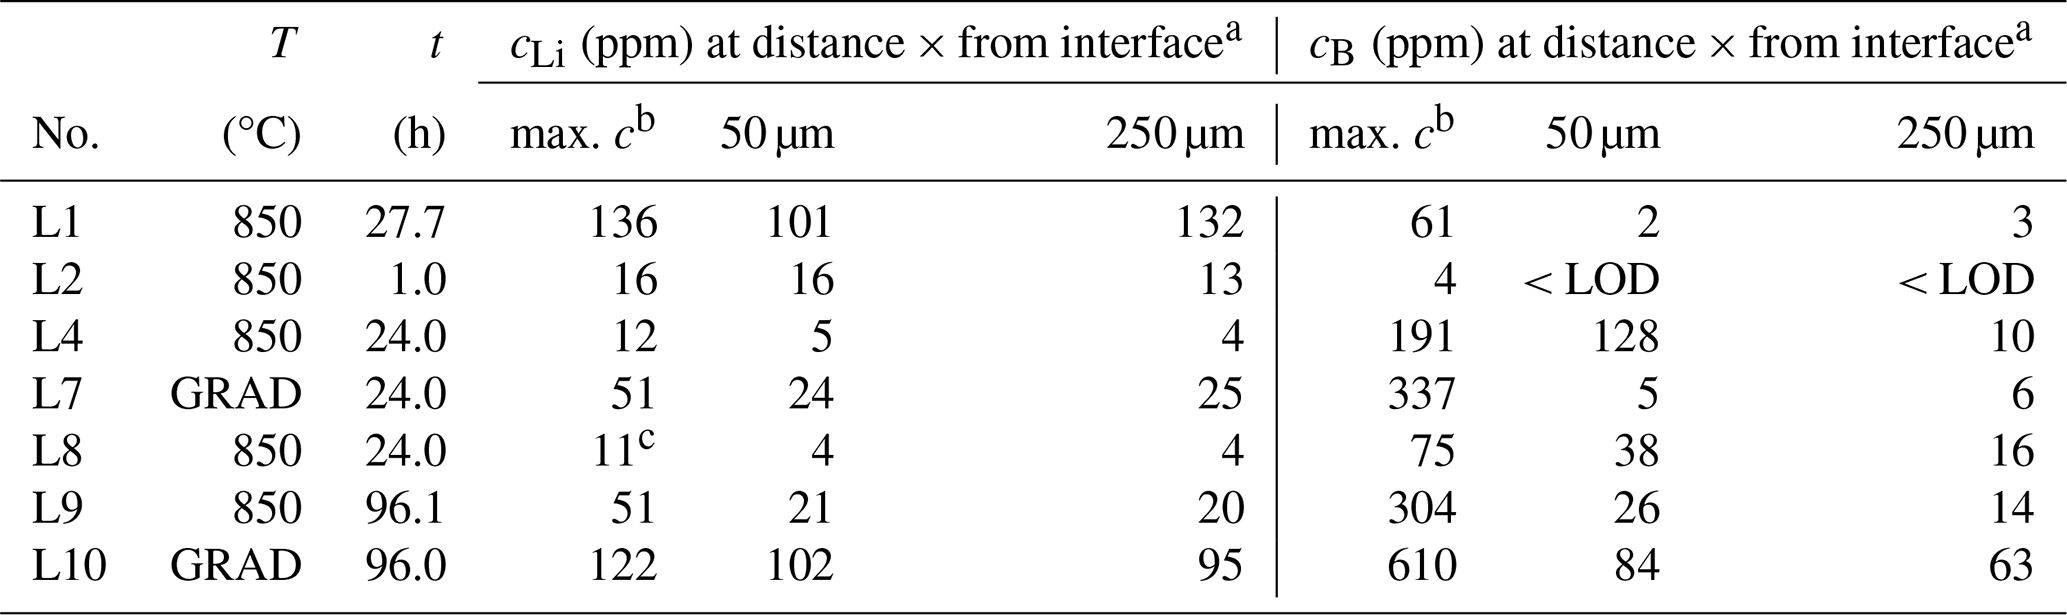
a Distance from the interface refers to the contact between the main glass body and the filling material. b Maximum concentration obtained from the transition zone or from the main glass body. c A single point during the line scan was at 27 ppm. LOD denotes limit of detection.
The dissolution of zircon from the filling material also leads to an enrichment of Zr in the source and sink melts (and likely the fluid phase). The Zr concentration profiles extended deep into the interior of the main glass bodies (Fig. 5). The profiles exhibited localized high-concentration spikes and a wavy overall shape and rarely approached a clear plateau value (Fig. 5b). The average Zr concentrations are in the range of 300–500 ppm in PEG2-src and PEG2-snk. The only exceptions are experiments L4 and L8, where lower average Zr concentrations in the range of 30–50 ppm have been observed. The Zr concentrations in the transition zones were exceptionally high, which was probably caused by a combined ablation of melt and zircon in the melt pools during fs-LA-SF-ICP-MS analyses (ablation through the glass into the underlying zircon).
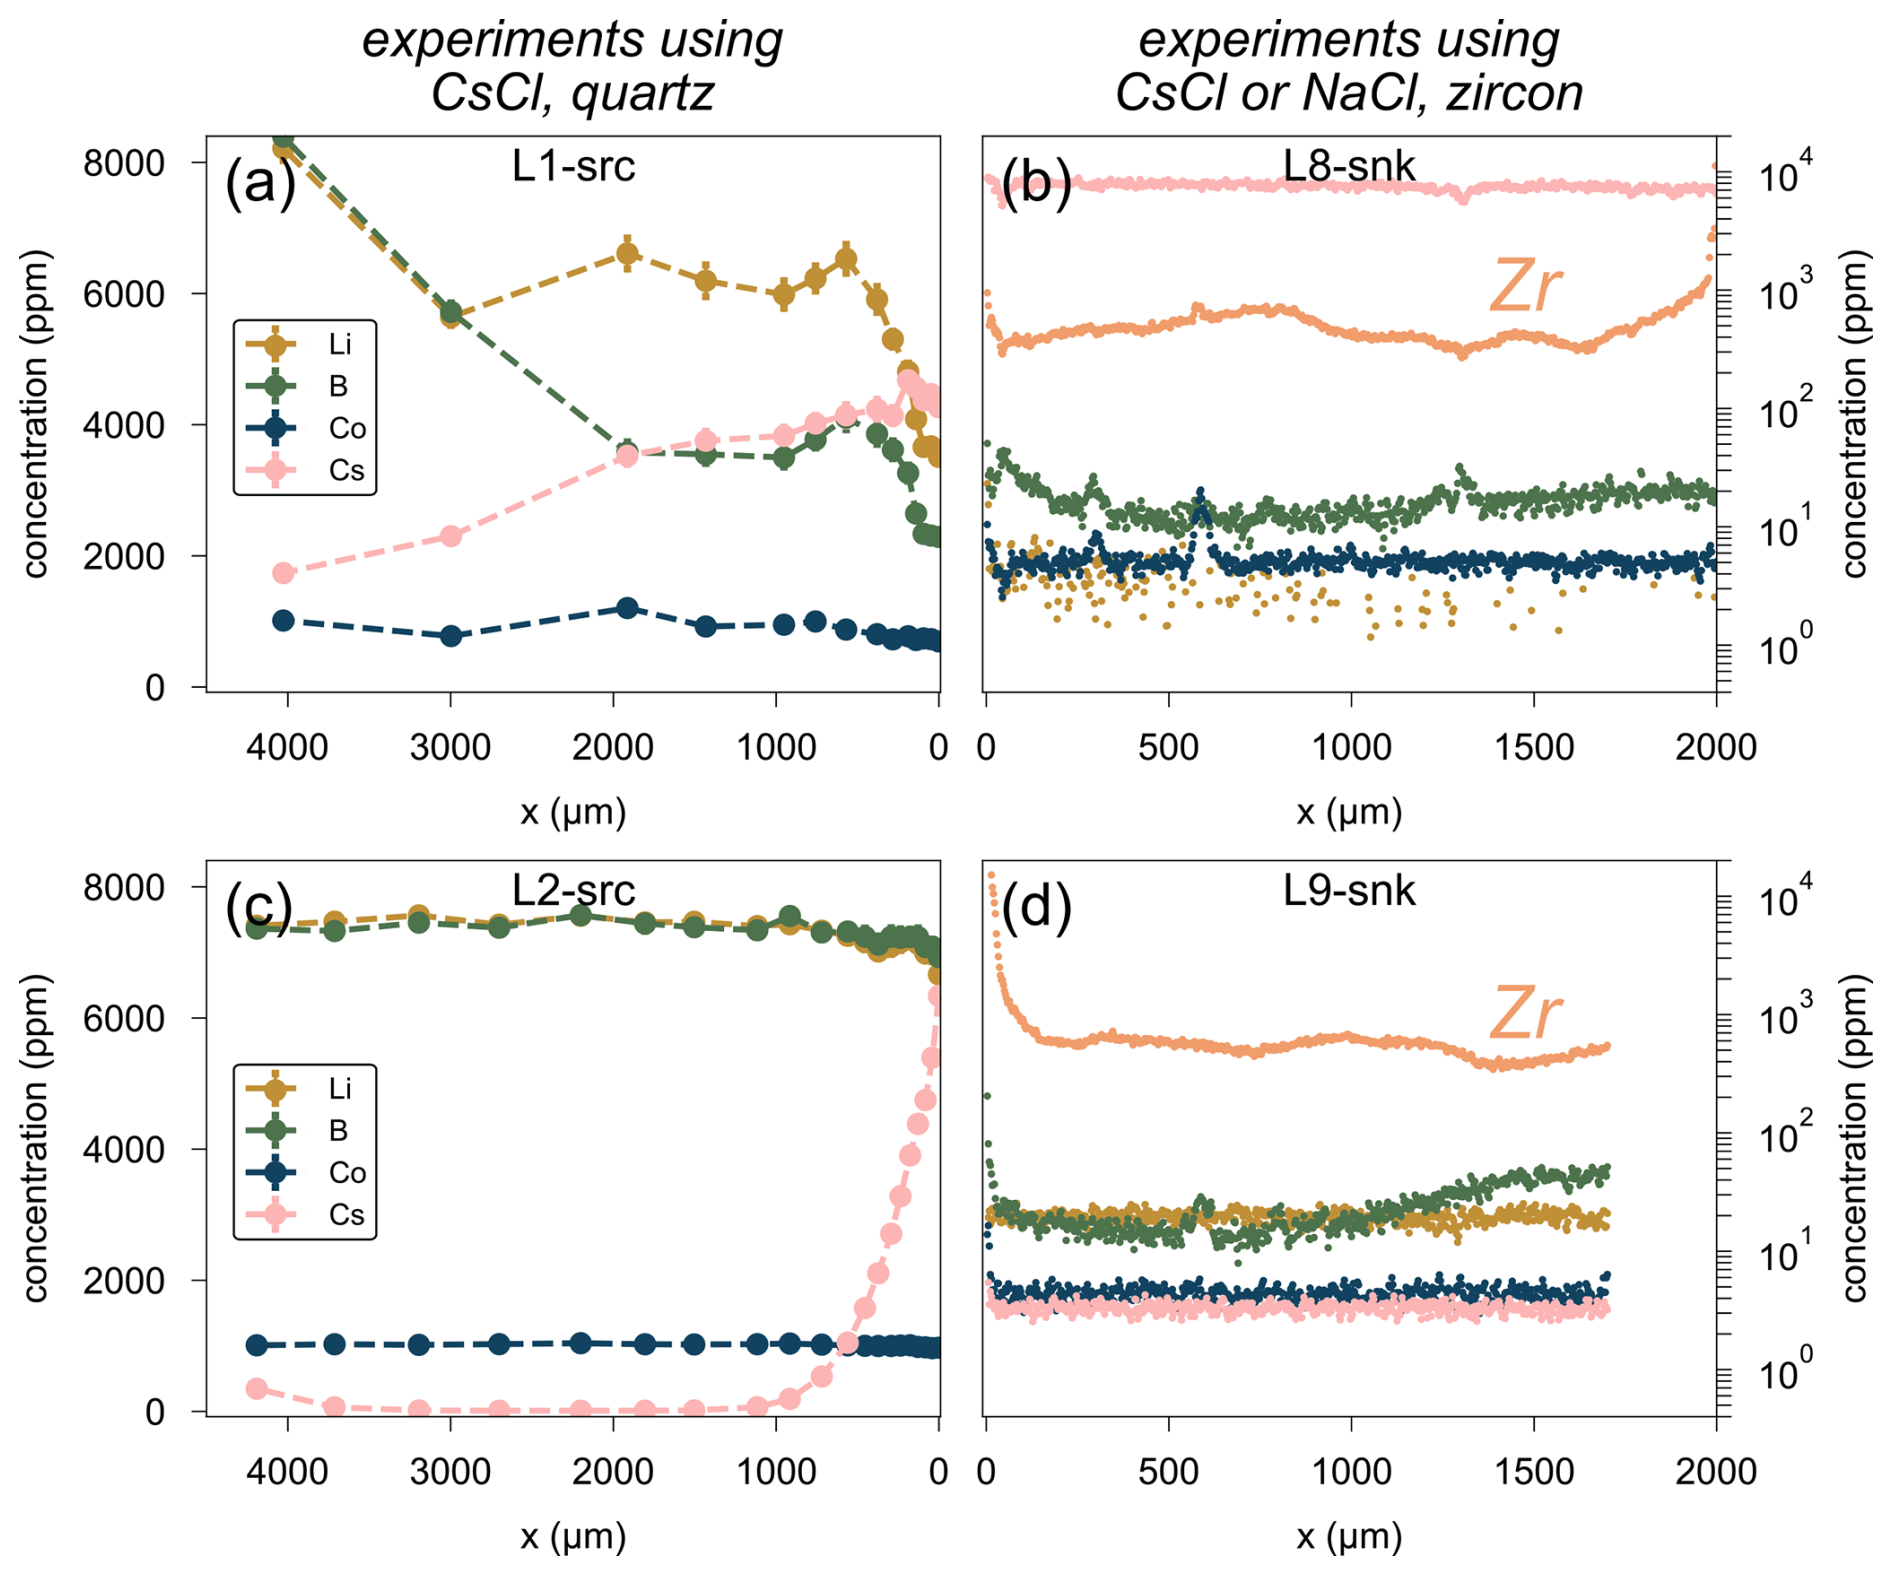
Figure 5Selected trace element concentration profiles highlighting the enrichment of the initially Cs- and Zr-free glasses in the respective elements. Panels on the left side show Cs profiles in PEG2-src in experiments using quartz filling material (a, c). Panels on the right side show Zr profiles in PEG2-snk in experiments using zircon filling material (b, d). The position x=0 marks the contact between the glass and the filling material.
3.3 Element distribution in the source and sink melts separated by quartz filling material
The Li and B concentrations in the glasses of the 24 h experiment conducted with quartz filling material (L1) differ from the experiments with zircon filling material. In the sink glass body, Li is higher (up to 130 ppm), and B is lower (compare Fig. 4a, e). Concentration profiles for Li in the sink and for Li and B in the source can be observed. These gradients could be an experimental artefact resulting, in part, from the dissolution of quartz (see above) and the coupled dilution of all other elements. However, an additional process may have to be considered because the concentrations gradients of the Li and B are longer than those of the major elements (∼ 500 µm for Li and B; ∼ 250 µm for major elements). The Li and B concentrations in the sink glasses of the 1 h experiment are lower compared to the 24 h experiment (Li: 12–16 ppm; B is below detection limit; Fig. 4b). In the source, the Li and B concentrations are similar to the starting glass, except very close to the interface (a few µm), with slightly lower values. The source glasses within the quartz filling material are heterogeneous, but Li and B are coupled, which can be explained by different dilution effects resulting from quartz dissolution.
Another parameter that separates these experiments from most experiments using zircon is the CsCl-bearing fluid. The presence of a CsCl-bearing fluid leads to an enrichment of the source and sink melts in Cs. The Cs concentration was always > 4000 ppm close to the interfaces. High Cs concentrations extended deep into the main glass bodies, with a significant enrichment still detectable at > 4000 µm distance from the interface in PEG2-src and PEG2-snk. This was also observed for the experiment conducted with zircon filling material and a CsCl fluid (experiment L8). The Cs concentration is higher in PEG2-snk compared to PEG2-src at the same distance from the interface. The Cs concentrations in the transition zones of PEG2-snk are more than 2 times higher than in the glass bodies, whereas, in PEG2-src, they are only slightly increased compared to the main glass body.
3.4 Li and B isotope composition
Lithium and B isotope analyses were conducted in both the source and sink main glass bodies and the adjacent transition zones in all experiments. For B isotope measurements in the sink, analyses were performed only very close to the filling material contact or within the adjacent transition zone in order to obtain a sufficiently strong signal. Nevertheless, the uncertainties of B isotope analyses are relatively high (on the order of ±5 ‰). In general, PEG2-src exhibited no change in δ7Li or δ11B in the main glass body or in the adjacent transition zone throughout our experimental series (Fig. 6a, c). In PEG2-snk, however, δ7Li was generally higher compared to PEG2-src, with values ranging between ca. 4 ‰ and 23 ‰ (Fig. 6b). While δ7Li in the sink glass differed between different experimental runs, it was usually homogeneously distributed throughout the main glass body and the adjacent transition zone in the individual samples. In the sink melt, a crude negative correlation between the Li concentrations and the δ7Li values can be observed (Fig. 7); i.e. increasing Li concentrations are associated with decreasing δ7Li values (e.g. experiments L4 and L8) and vice versa (e.g. experiment L1). A δ7Li gradient was only observed in the 1 h experiment L2, with δ7Li decreasing from ∼ 15 ‰ at the interface towards ∼ 5 ‰ in the interior of the glass (Fig. 6b). In contrast, δ11B values in PEG2-snk overlap, with a few exceptions with the values obtained in PEG2-src and also with the δ11B values in the starting glasses, within analytical uncertainties (Fig. 6c, d).
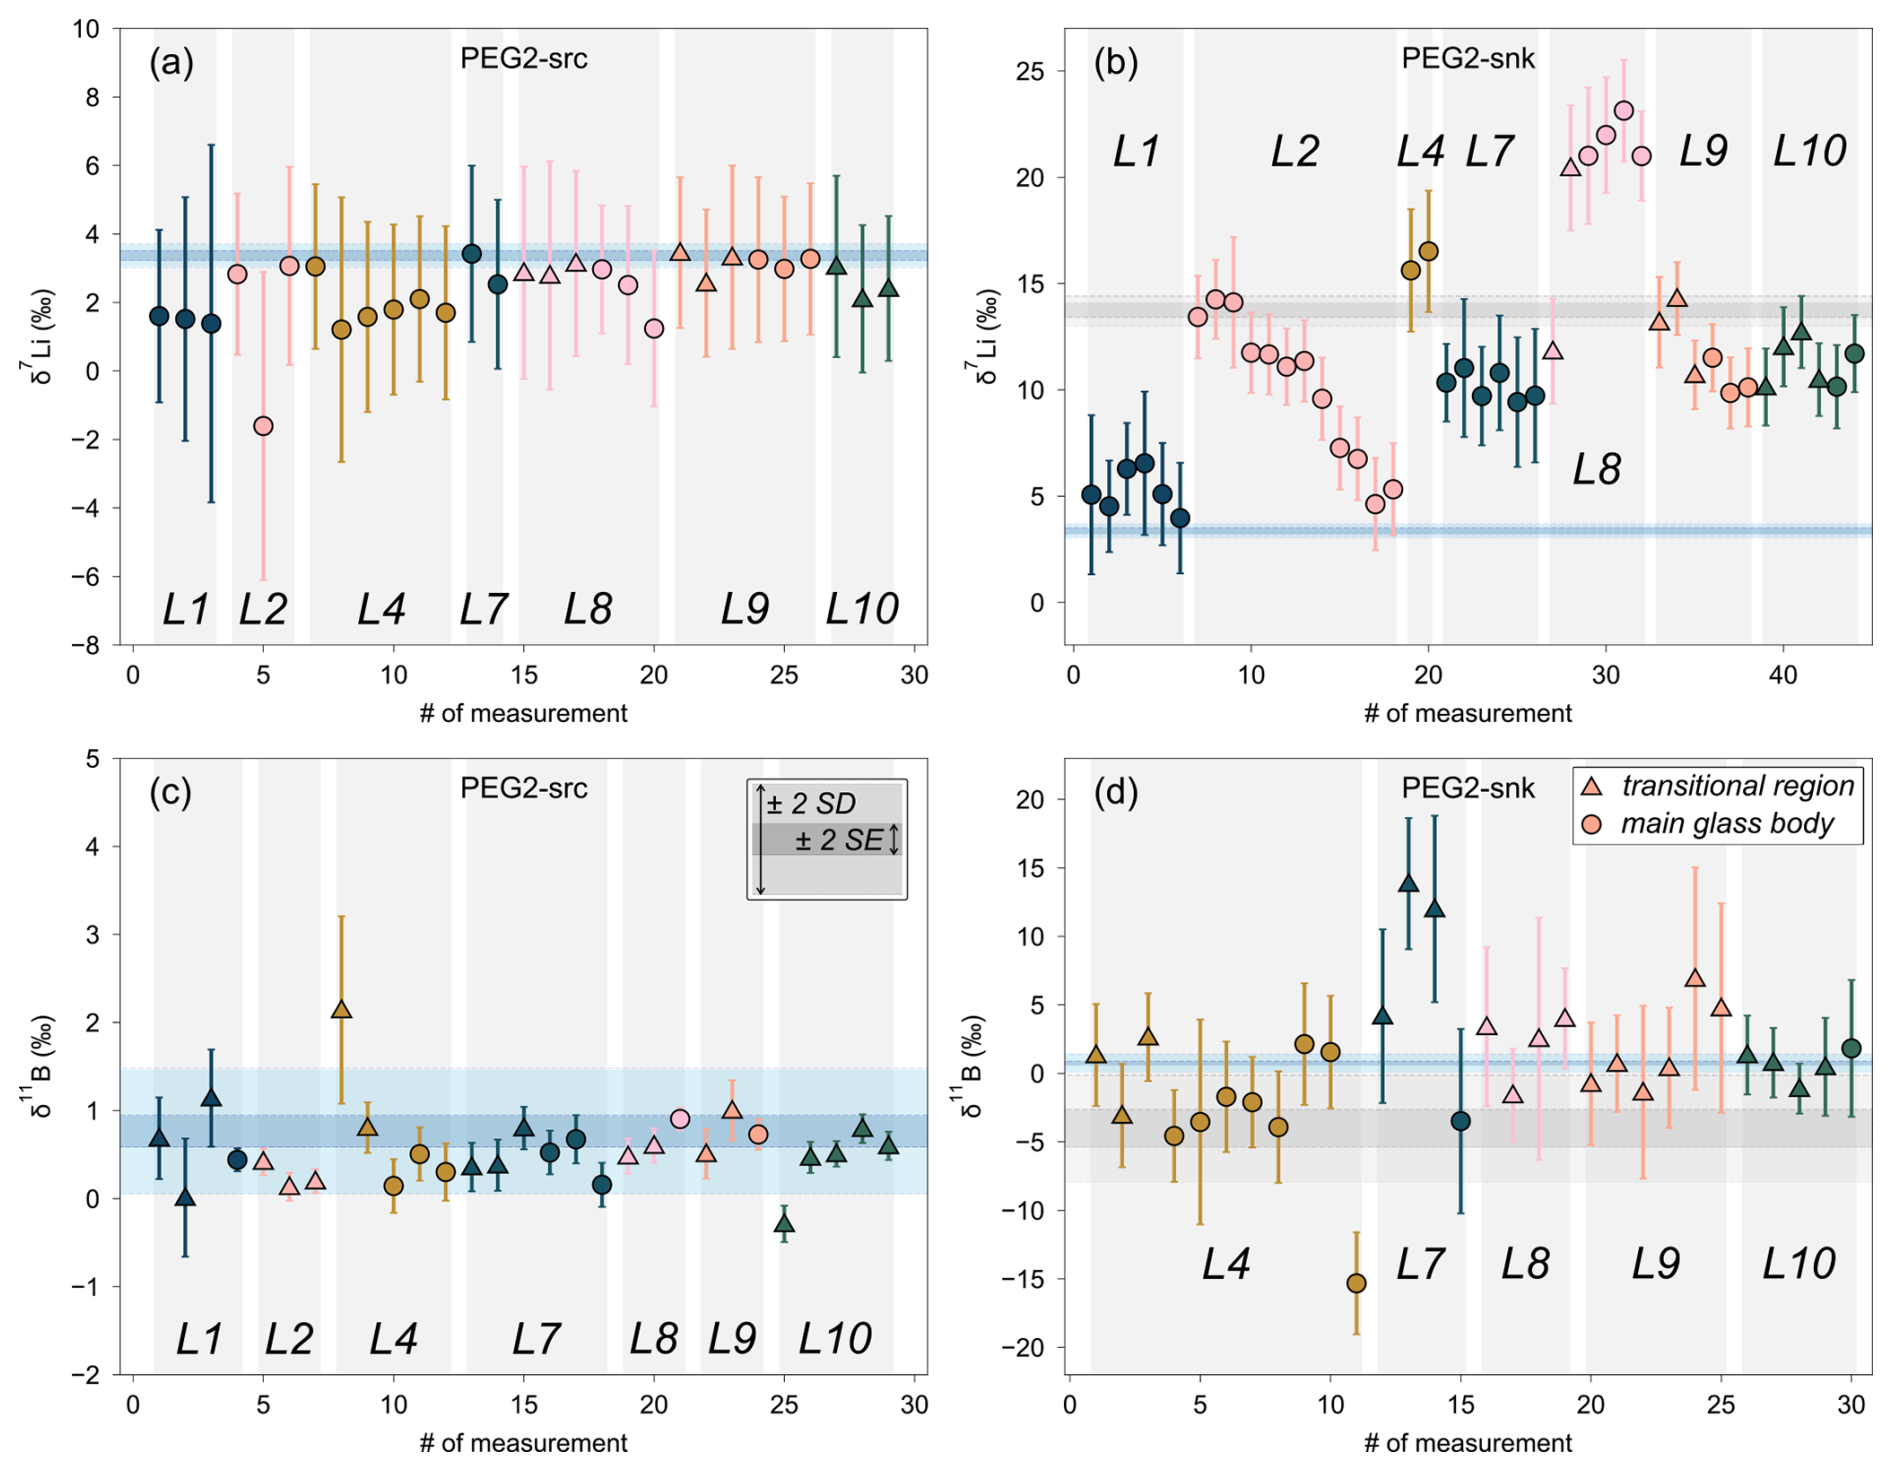
Figure 6Isotope compositions of the PEG2-src and PEG2-snk with respect to δ7Li (a, b) and δ11B (c, d). The differently coloured symbols indicate the individual experimental runs L1–L10. Filled circles and triangles are measurements in the main glass bodies and the transitional regions, respectively. The horizontal blue and grey boxes indicate the isotopic compositions of the starting glasses PEG2-src and PEG2-snk (before experiments), respectively, with the 2σ standard deviation (2 SD) and the corresponding standard errors (2 SE). The blue boxes in (a)–(b) and (c)–(d) are the same. The order of measurements (from left to right) for individual experimental runs corresponds to an increasing distance from the fluid–melt interface (e.g. the first and last points are closest to and farthest from the fluid–melt interface, respectively).
The transport of Li and B in our experiments involved several successive steps, including (1) transport within the source melt to the melt–fluid interface via diffusion, (2) transfer from source melt to fluid at the interface, (3) transport through the fluid, (4) transfer from fluid to the sink melt at the interface, and (5) transport within the sink melt via diffusion. Isotope fractionation can occur during all of these transport steps. Several parameters influencing the element transport were systematically investigated, such as the fluid composition (CsCl vs. NaCl with c (Cl−) = constant), the temperature distribution (isothermal vs. gradient), and the experimental duration. Our results further indicate that the filling material (quartz vs. zircon) also influenced Li and B transport. The presented results clearly show that, while certain combinations of parameters appear to have favoured the transport of Li and B via the fluid phase, no substantial transfer occurred under other conditions. The individual effect of parameters on the efficiency of Li and B transport is discussed in detail in the following sections.
4.1 Kinetic processes occurring at the interface between melt, fluid, and filling material
In all our experiments, a transitional zone has formed, in which melt migrated into the pore space of the filling material. The formation of this transitional zone is caused by a complex combination of different mechanisms involving the low softening point of the glasses (estimated to be between 380 and 250 °C for water contents between 4 wt % and 9 wt %, respectively), density changes, and differences in the expansion of glass and fluid during the heating phase. The presence of interstitial melt after only 1 h (experiment L2) indicates that a short-lived turbulent mingling stage between melt and filling-material phase may have occurred during the heating phase. This is evidenced by the high Zr and Cs concentrations in the main glass bodies that extend up to several 1000 µm from the fluid–melt interface (Fig. 5b, d). Due to the low diffusivities of Zr and Cs in silicate melts (review by Zhang et al., 2010, and references therein), these elements cannot show such high penetration depths by diffusion alone. Thus, convection or chaotic mixing processes in the melt phase (with possible mingling between mineral and melt) have to be assumed to explain the fast transfer of Cs and Zr from the fluid and filling material, respectively, to the melts.
Based on the comparison of Zr and B concentrations in the glasses, this turbulent mingling stage occurred mainly in the early phases of the experiments. In the investigated melts, Zr and B diffusivities are similar (Behrens and Hahn, 2009; Singer et al., 2025). However, the B concentration profiles in the main glass bodies are significantly shorter (several 100 µm), indicating that Zr was already distributed throughout the whole melt phase (source and sink) before the beginning of the transfer process of B from the source to the sink melt. Another observation indicating that melt percolates faster within the filling material in the early stage of the experiment is related to the evaluation of the thickness of the transitional zone. The increase in the thickness of the transitional zone is not linear with run duration. The thickness reaches ∼ 0.8 mm after only 1 h (L2) and ∼ 2 mm after 24 h (L1). As the run duration increases further, the increase in the thickness of the transitional zone tends to become linear, suggesting that the melts creep continuously into the pore space. In one experiment (L10, 96 h), the main glass body seems to have migrated entirely into the pore space of the filling material as there is only a tiny patch of connected glass observable. This could be related to the very low viscosities at high temperatures (logη= 2.2–2.4 at 800 °C and 6 wt %–7 wt % H2O; Bartels et al., 2011), which are caused by the high number of fluxes and the high water contents in the melts. However, the interpretation of the evolution of the size of the transitional zone needs to be done with caution because it also depends on the initial distribution of minerals around the glass cylinder during the loading of the capsule.
Another kinetic process that was observed is related to the chemical interaction between the quartz filling material and the melt. The dissolution of quartz is recorded by the surrounding glass, which has a heterogeneous chemical composition (Figs. 2c, 3). In experiments L1 and L2, the source and sink melts are strongly enriched in SiO2 (> 70 wt % SiO2 close to the contact) at the expense of all other major elements. In these two experiments, the significant impact of quartz on the chemical composition of the melts (leading to an increase in the melt polymerization) could lead to a change in the partitioning behaviour of Li and B between melt and fluid. This adds an additional degree of complexity to the kinetic processes.
In experiments with zircon filling material, the zircon is also dissolved in the melts and the fluid. However, the total amount of dissolved zircon remains significantly lower. According to zircon solubility models, which were calibrated for a range of compositions (mostly andesitic to rhyolitic), our melts are saturated with respect to zircon at the experimental temperature of 850 °C (at 850 °C, Zr concentration is in the range of 300 to 430 ppm; e.g. Watson and Harrison, 1983; Borisov and Aranovich, 2019; Crisp and Berry, 2022). However, due to its low solubility, the zircon dissolution has a negligible effect on the melt composition compared to the quartz dissolution. In experiments with zircon filling material, the SiO2 concentrations in glasses from the transitional zone are higher than those of the starting glasses (Fig. 3f). These higher SiO2 concentrations can only be explained by the dissolution and transport of SiO2 from the quartz cylinders (placed within the zircon powder) to both ends of the capsule via the fluid phase (Fig. 1).
The melts were affected by the chemical composition of the added fluids. The CsCl-bearing fluid led to an enrichment of Cs in the melts of > 4000 ppm Cs after the experiments. Using a mass balance calculation (based on the amount of Cs-free glass and Cs-bearing fluid added to the capsule) and assuming a Cs concentration of 4000 pm in the melts, the fluid–melt partitioning coefficient DCs is 0.3, where
and cCs is the concentration of Cs in the fluid and the melt. This fluid–melt partitioning is in agreement with previous studies, which suggest that Cs is moderately compatible in the melt with DCs ranging from ca. 0.1 to 0.5 (London et al., 1988; Webster et al., 1989; Schäfer et al., 1999; Zajacz et al., 2008). The NaCl-bearing fluids had no detectable impact on the melts; there was no indication of either mobilization of Na from the melts into the fluid or vice versa (uptake of Na from the fluid into the melt).
4.2 Transport of elements via the fluid phase
The transport through the fluid likely occurs via two processes: diffusion through the fluid phase and convection of the fluid. Diffusion in fluids is generally high and likely in the range of 10−7–10−8 m2 s−1 for neutral Li complexes in supercritical water (Chakraborty and Chandra, 2011). The effective diffusion is probably reduced because the tortuosity of the filling material impedes the diffusion in porous media. Generally, convection is expected to make a considerable contribution to the element transport in a low-density and low-viscosity supercritical fluid. However, a significant influence of fluid convection on the element transport is expected in neither the isothermal- nor the thermal-gradient experiments. There is no driving force for convection under isothermal conditions because of the low-temperature gradients. In the gradient experiments, the less dense fluid (higher temperature) overlies the denser fluid (lower temperature) as the capsules are vertically oriented within the autoclave. Therefore, no significant thermal convection is to be expected in the gradient experiments either.
4.2.1 Mobilization of Li and B from the source melt
The mobilization of an element from the main source melt body requires previous diffusion through the transitional zone. However, the concentrations of Li and B in the main (crystal-free) glass bodies of the source are similar to those in the starting glasses (Table 1). Thus, these melt portions display very few signs of Li and B mobilization. Most Li and B present in the sink glass or in the quenched fluid must, therefore, originate from the melt portions located in the transitional zone adjacent to the source glass. Since, in the transitional zone, the source melt occurs only as interstitial melt in between a high proportion of mineral phases, the mobilization of elements from the melt to the fluid is reduced. The low Li and B concentrations in the sink melt are, therefore, most probably due to the very small reactive melt–fluid surface, which reduces the element mobilization from the source melt. The heterogeneous distribution of Li and B in the transitional zone shows that the mobilization from the transitional zone was not uniform. This effect is even more significant for slow-diffusing elements like B. Considerable amounts of Li and B could have been mobilized during the initial stage of chaotic mixing between melt, filling material, and fluid (as discussed above) due to a high interaction between melt and fluid.
The major factor controlling the Li and B transfer from the melt into the fluid is the fluid–melt partitioning of the respective elements, and . The fluid–melt partitioning (hereafter denoted as DLi and DB for simplicity) cannot be determined accurately from our experiments as they were not designed for this purpose. The attempts to analyse the fluid composition from fluid inclusions resulted in concentrations of 419 ppm Li and 532 ppm B in experiment L1. The reported Li and B values indicate partitioning coefficients for both Li and B that are significantly below 1 if equilibrium between PEG2-src and fluid was attained.
In order to interpret our observed Li and B concentrations in the fluid, the expected fluid concentrations can be calculated using previously published partitioning coefficients for these elements and assuming equilibrium between melt and fluid. Experimental studies reported B to be moderately compatible in the fluid with DB values in the range of 1 to 6 (Pichavant, 1981; London et al., 1988; Hervig et al., 2002), which is in accordance with studies on natural coexisting fluid and melt inclusions (Thomas, 2002; Zajacz et al., 2008). Using the results of Schatz et al. (2004), who used similar experimental conditions as in this study, a DB in the range of 4 to 6 seems likely for our experimental conditions. The partitioning of Li, on the other hand, has been found to be highly sensitive to the salinity of the fluid (e.g. Zajacz et al., 2008; Iveson et al., 2019). In experimental low-salinity fluids, Li tends to be more compatible in the melt with DLi<1 (London et al., 1988; Webster et al., 1989; Iveson et al., 2019; Gion et al., 2022) and becomes fluid mobile at higher salinities (> 11 wt % Cl, mCl− ≈ 3.5; Iveson et al., 2019). Studies on natural fluid inclusion appear to contradict these findings to some extent as reports indicate that Li is fluid compatible even in moderate-salinity fluids (mCl; Zajacz et al., 2008). This points to the complex dependency of DLi on melt and fluid composition, temperature, and pressure (Iveson et al., 2019). Based on experimental studies with comparable conditions, DLi is likely in the range of 0.1–0.5 (London et al., 1988; Webster et al., 1989; Iveson et al., 2019).
Assuming Li and B concentrations of 6000 ppm in PEG2-src, as well as DLiand DB values of 0.1–0.5 and 4–6, respectively, a fluid concentration of 600–3000 ppm Li and 24 000–36 000 ppm B would be expected. Using the lower limit of DLi, the calculated Li concentration in the fluid is of a similar magnitude as that obtained from the fluid inclusion measurements. The calculated B concentrations, on the other hand, are overestimated by about 2 orders of magnitude. This is likely due to the inhibited release of B from the source melt and indicates that an equilibrium was not established between the source melt and the fluid phase. Although the present literature data point unanimously to a preferential enrichment of B in the fluid (see previous paragraph), the partitioning coefficients have to be considered with caution. Small differences in bulk composition may result in major changes in the distribution coefficients and the behaviour of volatile or trace components (London et al., 1988; Hervig et al., 2002).
4.2.2 Transport and uptake of elements into the sink
The effects of experimental duration, filling material, fluid composition, and temperature distribution on the effectivity of Li and B transport are discussed in the following. One surprising observation is that the amount of Li and B transported along the fluid column separating the source and sink melt was extremely low, particularly in view of the high concentrations in the source melt. In all experiments, the experimental duration correlates positively with the Li and B concentration in the sink melts. This is most probably related to the progressive mobilization of Li and B from the source melt, or, in other words, the kinetics of Li and B mobilization from PEG2-src into the fluid are sluggish. This is particularly clear for B since the filling material has no obvious effect on its transport. There was no B enrichment in the sink glass for the 1 h experiment, but intermediate and strong enrichments were observed in the 24 and 96 h experiments, respectively. In experimental pairs, where only the duration was changed (e.g. the pairs L1–L2, L4–L9, L7–L10), both the Li and B concentrations were always higher in the sink melt from the longest experiment. However, for Li, which is a fast-diffusing element in melts compared to B (e.g. Singer et al., 2023), the behaviour is more complex since the shortest 1 h experiment L2 displays a higher Li enrichment in the sink glass than what is observed in the significantly longer 24 h experiments (L4, L8). This implies that other experimental parameters, such as fluid composition or filling material, also influence Li transport. In experiment L2, quartz was used as filling material, whereas zircon was the filling material in experiments L4 and L8. The higher concentrations in the 1 h sink glass (L2) indicate an increased mobilization of Li from the source. This may be related to the dissolution of quartz from the filling material and the subsequent enrichment of SiO2 in the source melt, leading to an increase in melt polymerization. Taking into account that Li is preferentially incorporated into more depolymerized melts (Singer et al., 2023), the increase in SiO2 content may promote the release of Li from the melt. A possible effect of the fluid composition can be constrained from the experiments L4 and L8, indicating that an NaCl-bearing fluid seems to enhance the transport of B compared to CsCl-bearing fluids. No conclusion can be drawn for Li since no significant amount of Li was enriched in the sink melt in both experiments.
The application of temperature gradients to our experimental charges enhances the Li and B concentrations in the sink. This trend is observed in two sets of experimental pairs using zircon- and NaCl-bearing fluids and with durations of 24 and 96 h (L4–L7 and L9–L10), respectively. A potential mechanism increasing the transport of Li and B to the sink under a thermal gradient could be the so-called Soret effect or thermodiffusion. The Soret effect leads to the separation of mobile species in a solution and is large, especially in liquids close to their critical points (e.g. Saghir et al., 2005). The Soret effect could, therefore, result in an increased flux of Li and B from the hot end of the capsule (PEG2-src) to the colder region (PEG2-snk). While global thermal convection has been ruled out (see Sect. 4.2), there might be localized convection at the fluid–melt interface, enhancing the incorporation of Li and B in the sink melt. Another explanation could be that the fluid–melt partitioning of Li and B is shifted towards the melt at lower temperatures. This was indeed observed by Webster et al. (1989) at 200 MPa (however, the opposite was observed at 50 MPa). London et al. (1988) reported little to no temperature dependence for fluid–melt partitioning of the alkalis, while DB showed a decrease with decreasing temperature. However, our temperature gradient of ca. 54 °C is relatively small, and it seems to be unlikely that it could induce such a significant shift of the fluid–melt partitioning of Li and B. Overall, the Li partitioning between fluid and melt seems to be affected by a complex interplay between pressure, temperature, fluid salinity, and melt composition (e.g. Iveson et al., 2019).
4.3 Isotope effects during transport
4.3.1 Li and B isotopic ratios in the source
During mobilization, the Li and B isotopes can potentially fractionate either kinetically (e.g. during diffusion) or as a result of equilibrium fractionation between melt and fluid. There is no detectable change in δ7Li or δ11B in the source melt after experiments (Fig. 6), which is in accordance with the very small amounts of Li and B that were mobilized from PEG2-src. Diffusive transport of Li and B from the interior of the melt towards the fluid–melt interface could result in kinetic isotope fractionation due to the faster diffusivity of the respective lighter isotopes. However, the isotopic data (identical values within the uncertainty of the measurements) do not indicate diffusion-driven isotope fractionation, not even in experiment L1 (with quartz filling material), for which compositional zoning of B and Li was observed in the source glass body. The absence of detectable isotopic fractionation may be related to the proposed initial stage of turbulent mingling between melt, filling material, and fluid (see Sect. 4.1). A simple mass balance calculation also shows that, with the small amounts of Li and B mobilized from PEG2-src, the isotopic changes would be extremely low. Lastly, because of the high experimental temperatures, potential equilibrium isotope fractionation between the source melt, and the fluid would become very small.
4.3.2 Li and B isotopic ratios in the sink
The isotopic signature of the sink melt is influenced by the following contributions: (1) the isotopic composition of the fluid, (2) the potential isotope fractionation between the sink melt and the fluid, and (3) the initial isotope composition of the sink glass (δ7Li = 13.7 ‰, δ11B = −4.0 ‰; Table 1) that exhibited trace amounts of Li and B (∼ 3–5 ppm) prior to the transport experiments. The first contribution (composition of the fluid) is the result of isotope fractionation during mobilization of Li and B from the source melt and of potential kinetic effects during transport through the fluid. The contribution of initial Li and B in the sink glass is expected to be significant only for experiments that showed very little Li and B enrichment (e.g. experiments L4 and L8, Table 4).
The B isotope composition of the sink after the experiments is, on average, very similar to the isotopic signature of the source melt and to the inherent signature of the sink melt within errors (Fig. 6c, d). This implies that both kinetic and equilibrium isotope fractionation are smaller than the analytical uncertainty for B isotope analyses, which is ±1.8–8.8 ‰ for individual measurements (2σ) and an average of 2 σ over all measurements of ±4.7 ‰ for low B concentrations. The apparent absence of equilibrium isotope fractionation is likely related to the high experimental temperatures and the similar speciation of B in the melt and the fluid. Generally, heavy isotopes are enriched in the phase with the lower coordination and stronger bonding (Schauble, 2004). Boron is in trigonal coordination in our melts (Singer et al., 2025) and mostly trigonally coordinated as [B(OH)3]0 species in hydrothermal fluids at crustal pressures and high temperatures ≥ 500 °C (Schmidt et al., 2005). Thus, strong B isotope fractionation is not expected. In basaltic melts, a preferential enrichment of 11B in the fluid was observed, resulting in an isotope fractionation Δ11Bmelt-fluid of up to −1.7 ‰ in the temperature range of 1000–1250 °C (Kommescher et al., 2024). An even more pronounced B isotope fractionation of −7.1 ‰ (at 750 °C, 500 MPa) and −4.4 ‰ (at 850 °C, 500 MPa) was reported for rhyolitic melt and fluid (Hervig et al., 2002). However, the absolute values derived in the study by Hervig et al. (2002) have to be interpreted with caution because their results would imply that all B is tetrahedrally incorporated in the melt, which is not the case (Singer et al., 2025). Due to the low and heterogeneous B concentrations in PEG2-snk, the resulting uncertainties in δ11B are high and do not allow for any conclusive statement regarding B isotope fractionation in our experiments.
In contrast to B, the Li isotope values are highly variable and span a broad range from ca. 5 ‰ to 20 ‰ in the sink glass (Fig. 6b). The observed δ7Li values are heavier compared to the source melt but lighter than the inherent signature of the sink (13.7 ‰; Table 1). Experiments L4 and L8 (in which very little Li was transferred to the sink melt) are an exception in that the observed δ7Li is even higher than the initial value of the sink glass (Fig. 6b), which cannot be explained by mixing of the source and sink composition but rather indicates equilibrium isotope fractionation between melt and fluid. The driving force for Li equilibrium isotope fractionation is likely the different bonding environment resulting in a different bonding strength of Li in the melt and fluid phase. In silicate melts, Li is tetrahedrally coordinated with oxygen (Soltay and Henderson, 2005; Wu et al., 2021), whereas, in aqueous solution, Li is considered to occur as clusters of Li(H2O) under ambient conditions (Yamaji et al., 2001; Wachter et al., 2007; Yamaguchi et al., 2010). Molecular dynamics simulations have shown that Li can form neutral Li–F complexes in hydrothermal fluids at high temperatures, with an increasing abundance at low fluid densities (ρ<0.8 g cm−3; Jahn and Wunder, 2009). Therefore, the low fluid density in our experimental series (0.213 g cm−3; Pitzer and Sterner, 1994) favoured the formation of predominantly Li–F and minor Li–Cl (Jahn and Wunder, 2009; Wang et al., 2021). With an increasing abundance of Li–F and/or Li–Cl, the average coordination number of Li complexes is likely lower than four, resulting in an enrichment of the heavier 7Li in the fluid phase. Similar behaviour was observed in experimental studies for Li, where the driving force was assumed to be the difference in coordination between clinopyroxene or mica (both octahedrally coordinated Li) and fluid (Wunder et al., 2006, 2007).
To verify that the recorded values for δ7Li in the sink melt are the result of isotope fractionation, a conservative mixing model between the source and sink melts was applied using their respective isotopic signatures (Fig. 7). Assuming there were no kinetic or equilibrium isotope fractionation during the successive transport steps, the recorded isotopic values in the sink melt should be reproduced by the mixing model. This model, however, clearly shows that the observed δ7Li values for most of the sink melts are significantly higher than those calculated for conservative mixing, demonstrating that the Li isotopes must have been fractionated during transport from the source through the fluid into the sink. The fact that δ7Li values are consistently higher in the sink compared to the source melt (Figs. 6, 7) likely indicates a dominance of equilibrium isotope fractionation. This leads to a fluid enriched in the heavier 7Li, which in turn controls the Li isotope composition of the sink melt. The exceptionally high δ7Li in the L4 and L8 sink melts (16 ‰–23 ‰) may be related to the very low amounts of Li transported to the sink. Kinetic isotope fractionation (e.g. due to diffusion) would produce lower δ7Li values in the sink melt because of the faster diffusivity of the lighter 6Li compared to the heavier 7Li. Such an effect was shown to occur in country rocks surrounding a pegmatite (Teng et al., 2006). In our experiments, the transport distance of ∼ 6 cm in the fluid phase might be too short to generate significant kinetic effects. In addition, Li and B are not transported as ions in the fluid but as complexes. For such complexes, the relative mass differences between the respective isotopes are negligible, and kinetic isotope fractionation effects are expected to be small. Therefore, if kinetic isotope fractionation did occur, its effect was negligible and was overwhelmed by the effect of equilibrium isotope fractionation.
Except for one experiment (L2), the δ7Li values in the sink do not show variations from rim to the end of the sink glass (i.e. observed values are identical within uncertainty). Thus, diffusion-driven isotope fractionation in the melt, which would lead to an enrichment of the lighter isotopes at a greater distance from the fluid–melt interface, could not be detected within the resolution of our analytical method. If convection does not occur in the sink melt, diffusion-driven isotope fractionation must have occurred; however, it was likely not detected because the transfer of Li by the fluid was low and because Li isotopes equilibrated fast enough to reach a nearly homogeneous distribution in the sink melt. The only exception was experiment L2, for which the highest δ7Li was measured close to the contact with the fluid phase and for which the decrease in δ7Li is likely related to the faster diffusion of 6Li within the melt. The observation of this kinetic effect in experiment L2 only (and the absence in all other experiments) is probably related to its short run duration of 1 h, which was likely insufficient to establish an equilibrium within the sink melt.
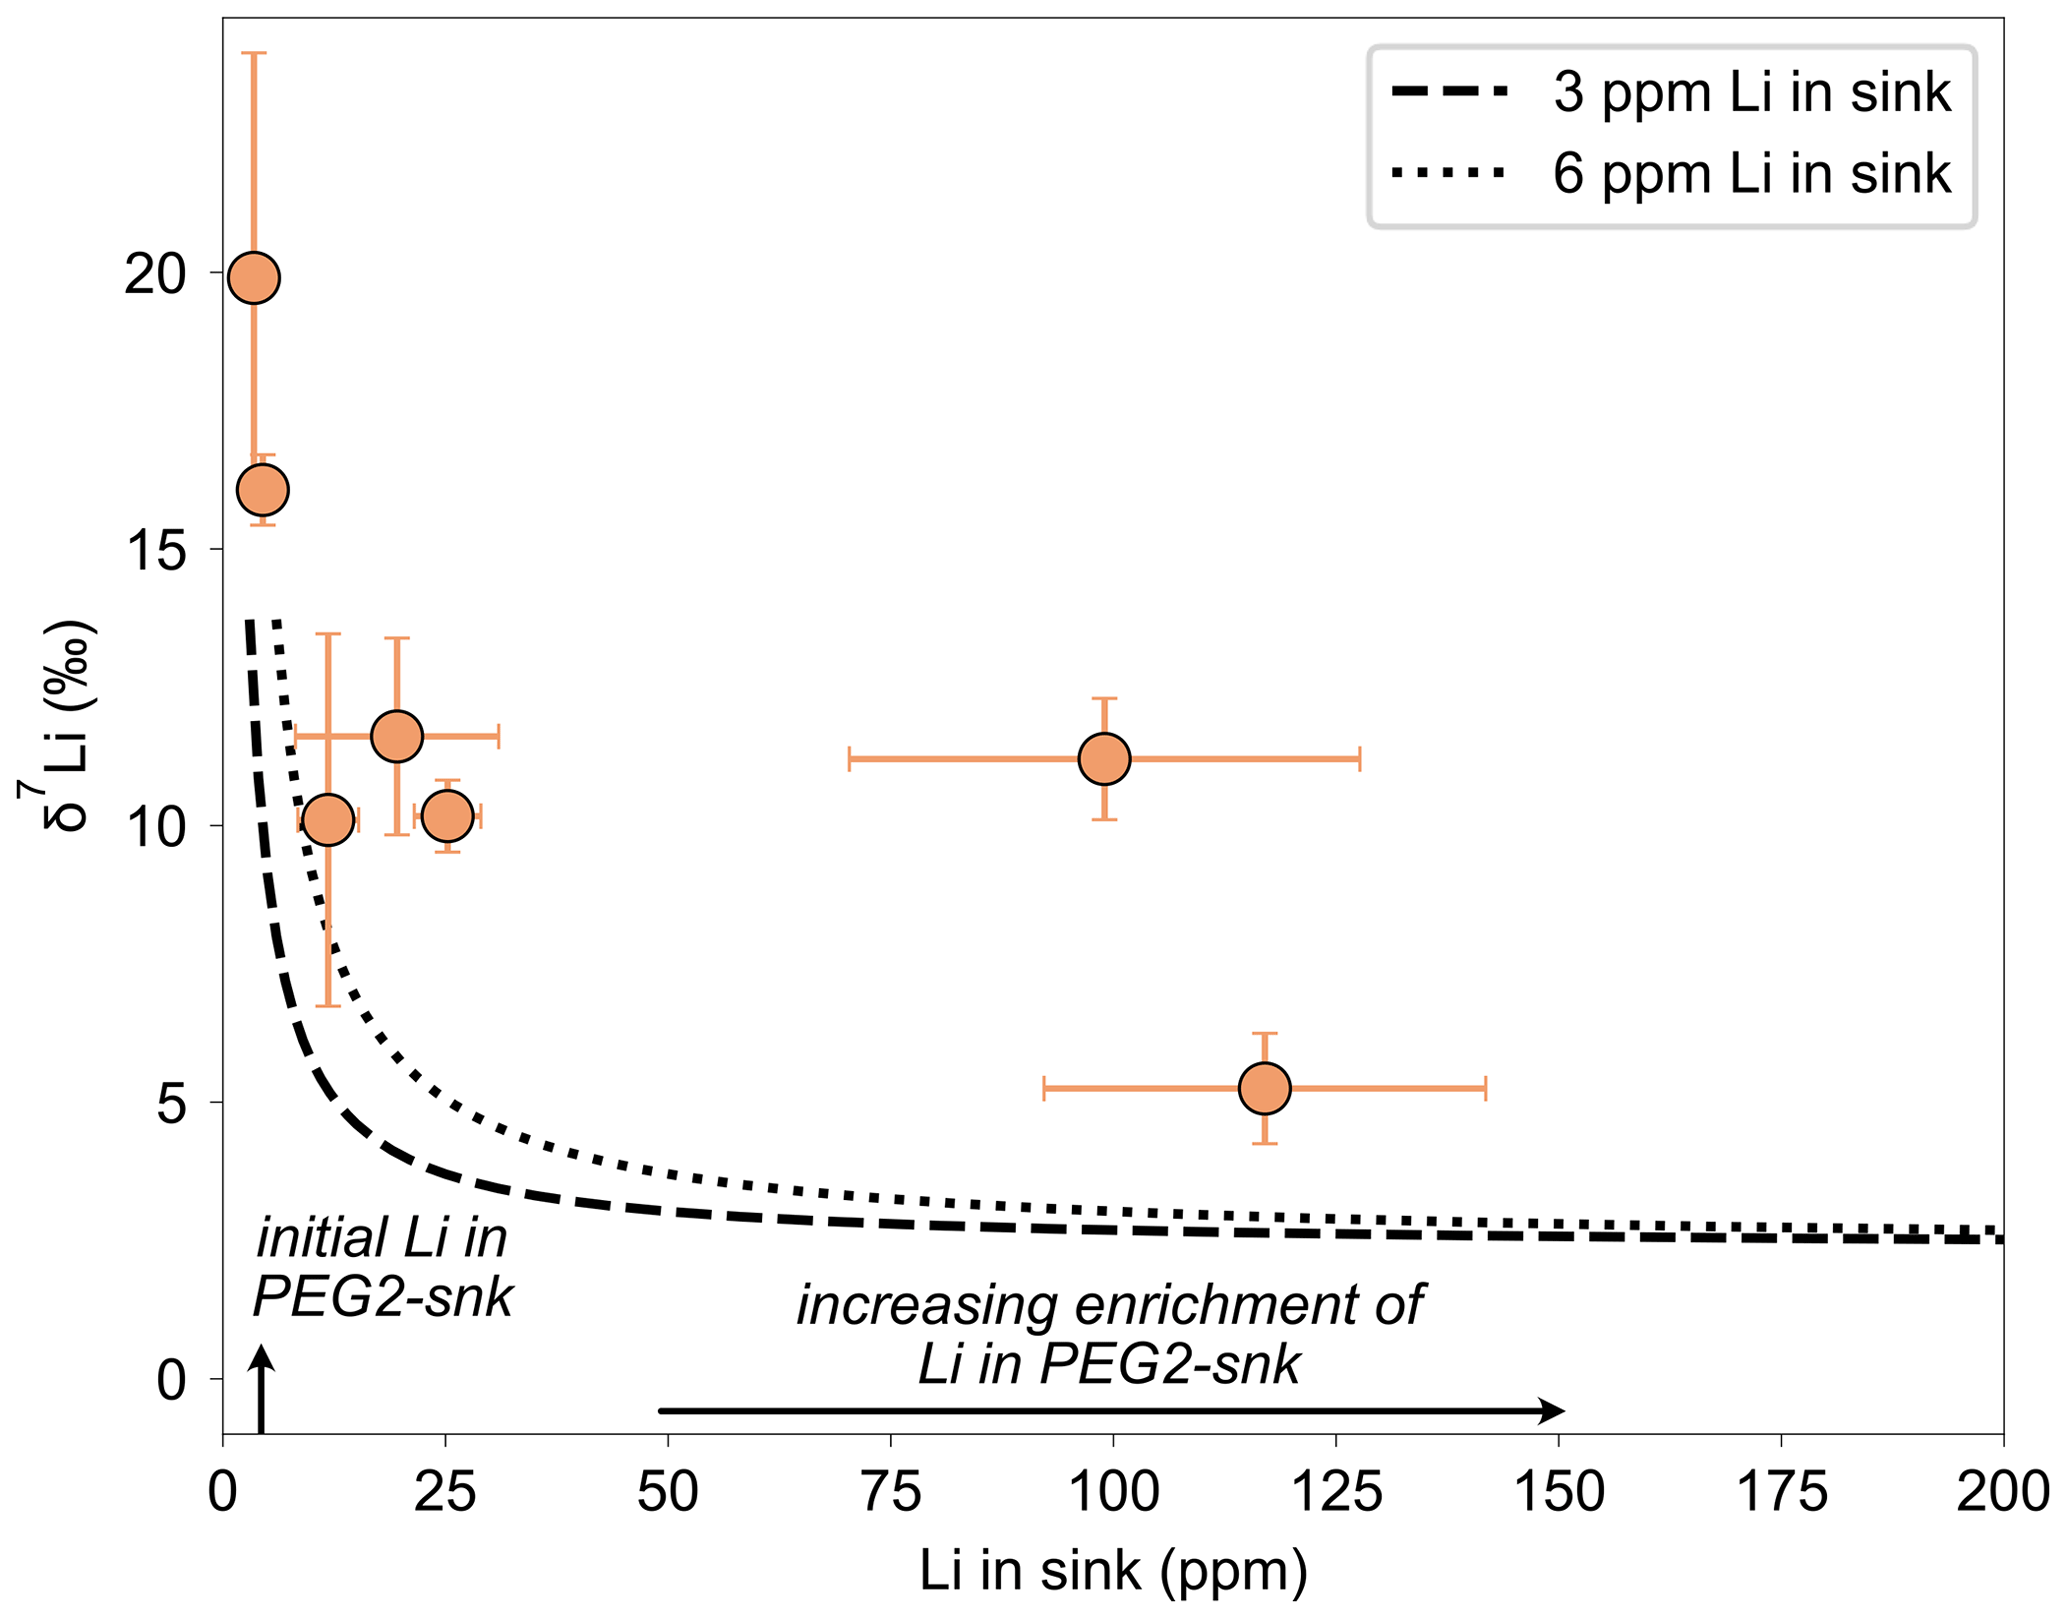
Figure 7δ7Li values in PEG2-snk plotted against the averaged Li concentrations. For both δ7Li and the Li concentration, the average of the main glass bodies and the transitional regions was calculated. The dashed and dotted lines refer to a calculated mass balance assuming a direct mixing between the δ7Li of the source and the sink and using starting concentrations of 3 and 6 ppm Li in the sink, respectively. See text for more details.
4.4 Implications for natural pegmatites
The results of our experiments have implications for understanding kinetic processes related to Li transport during crystallization and exsolution in pegmatitic systems. We have shown that for Li partitioning between fluid and melt DLi<1 in Cl-poor systems, confirming previous experimental data. Thus, if Li is not sequestered in micas during melt evolution, pegmatite residual melts have the potential to be enriched in Li, even during the late stages when significant fluid exsolution and fluid loss occur. This enrichment may not occur in F-rich systems, in which lepidolites or zinnwaldites are expected to crystallize at magmatic stages (London et al., 1989; Pichavant, 2022; Gao et al., 2024). In contrast, the crystallization of these F- and Li-rich micas may not occur in F-poor systems. In such systems, the low DLi can lead to a significant increase in Li concentrations in the residual melts due to fluid loss, leading to a supersaturation of the melt in Li (Maneta et al., 2015). This effect can contribute to the crystallization of Li-rich phases (e.g. spodumene and petalite), such as those found in the vicinity of the Harney Peak Granite (Nabelek et al., 1992).
The Li isotope values obtained in the sink melt show that significant Li isotope fractionation is expected as a result of fluid exsolution from pegmatitic melts (e.g. with ongoing crystallization), with the fluid being enriched in 7Li compared to the melt. This isotopic fractionation has been assumed in several studies (e.g. Zhou et al., 2021; Ye et al., 2023) but is now confirmed experimentally. Thus, fluids that escape from pegmatitic systems will lead to higher δ7Li in the wall rocks compared to the pegmatite melt. The importance of magmatic volatile phase exsolution and migration on the Li isotopic compositions of pegmatites was discussed by Ye et al. (2023) based on the analysis of bulk rocks. These authors proposed that pegmatites with low δ7Li were generated from fluid-rich systems because high amounts of isotopically heavy fluids could escape during crystallization (Ye et al., 2023). Zhou et al. (2021) also proposed that the lighter Li isotopic compositions of spodumene-bearing pegmatites are attributable to fluid exsolution.
On the other hand, kinetic Li isotope fractionation during fluid transport in the wall rocks is expected to have an opposite effect compared to the fluid–melt fractionation, leading to a decrease in δ7Li with increasing distance from the pegmatite body (Teng et al., 2006). This kinetic effect in the fluid phase has not been observed in our experimental setup because the fluid transport distance of ca. 6 cm is too short to generate a detectable effect. In addition, if Li diffuses as a complex (with F, Cl, or H2O), the mass difference between the 7Li and 6Li complexes becomes negligible. In the melt, however, a kinetic isotope fractionation effect has been observed in the experiment with the shortest duration of 1 h. At temperatures relevant to pegmatites, a similar effect would occur for timescales longer by a factor of 20 and 90 at temperatures of 600 and 500 °C, respectively, compared to our experiments (using Li diffusion data by Singer et al., 2023). In natural pegmatite systems, such an effect can occur if Li migrates from a melt to an exsolved fluid phase or if minerals crystallize from a pegmatite-forming melt. The latter case was indeed observed in quartz crystals from the Stewart pegmatite (Phelps and Lee, 2022) and was attributed to the synergistic effects of kinetic fractionation and Rayleigh fractionation.
One important observation from this study is the difference between the kinetics of isotopic equilibration and chemical equilibration. We show that the isotopic equilibrium at the interface between melt and fluid is established quickly (only the 1 h experiment (L2) shows a kinetic effect). In contrast, the exchange of Li and B at the interface between melt and fluid is sluggish in our experiments, as illustrated by the very low concentrations in the sink melt. This implies that chemical equilibrium was not reached because the reactive surface between fluid and melt was relatively low, impeding the mobilization of Li and B from PEG2-src. This suggests that Li isotopes in pegmatite-forming systems can be in equilibrium, even if pegmatite minerals are the products of disequilibrium crystallization with respect to major elements (e.g. because of their rapid growth due to strong undercooling).
The most notable difference between our experimental setup and natural systems is the mechanism of fluid exsolution and the associated reactive surface between fluid and melt. Since the melts are already nearly fluid-saturated at the beginning of the experiments, the fluid has not been exsolved in the strict sense. The reactive surface was further reduced by the formation of the transition zone, leading to an impeded mobilization of Li and B from the source melt. In natural systems, fluid bubbles likely form throughout the melt upon saturation and can eventually coalesce into an interconnected fluid phase. This mechanism clearly leads to a larger reactive surface area and, consequently, to a more efficient extraction of metals from the melt into the fluid. Our experiments therefore demonstrate, in a negative sense, the importance of the reactive interface between melt and fluid for the extraction of metals.
We developed a novel experimental setup to investigate the kinetics of element transport between two melt reservoirs via a fluid phase, simulating processes that may occur in fluid-rich late-stage pegmatites. The amount of Li and B transported remained low in our experiments, most probably due to the small reactive surface between melt and fluid. This highlights the importance of the reactive surface between melt and fluid for the kinetics of element mobilization during fluid exsolution. The isotope fractionation effects were significant for Li and are likely related to the difference in Li coordination between melt and fluid, resulting in equilibrium isotope fractionation. For the first time, we could demonstrate experimentally that there is a significant Li isotope fractionation between silicate melt and fluid at 850 °C, with the fluid being enriched in 7Li compared to the melt. Our experiments were not designed to quantify this isotopic fractionation, but it likely becomes even more pronounced at lower temperatures relevant for pegmatite formation. In contrast to Li, no isotopic fractionation between fluid and melt was detected for B (within the analytical uncertainties). However, given the similar B speciation in fluid and melt, B isotope effects are expected to be significantly smaller than for Li. Our experiments indicate that Li isotopes can rapidly reach equilibrium between a melt and a fluid phase and thus may record the effect of fluids during disequilibrium crystallization of minerals in pegmatites.
Data are available through Mendeley Data at https://doi.org/10.17632/8jw6dw272k.2 (Singer et al., 2026).
The supplement related to this article is available online at https://doi.org/10.5194/ejm-38-497-2026-supplement.
CRS: conceptualization, data curation, investigation, methodology, validation, visualization, writing (original draft preparation). HB: conceptualization, funding acquisition, project administration, resources, supervision, writing (review and editing). IH: investigation, writing (review and editing). MO: investigation, writing (review and editing). SW: conceptualization, funding acquisition, writing (review and editing). FH: writing (review and editing).
At least one of the (co-)authors is a member of the editorial board of European Journal of Mineralogy. The peer-review process was guided by an independent editor, and the authors also have no other competing interests to declare.
Publisher's note: Copernicus Publications remains neutral with regard to jurisdictional claims made in the text, published maps, institutional affiliations, or any other geographical representation in this paper. The authors bear the ultimate responsibility for providing appropriate place names. Views expressed in the text are those of the authors and do not necessarily reflect the views of the publisher.
Julian Feige is thanked for the thorough preparation of samples. Philip Wiegel is thanked for the support during the electron probe microanalyses. The authors are grateful for the financial support from DFG via SPP 2238 “DOME”.
This research has been supported by the Deutsche Forschungsgemeinschaft (grant nos. BE 1720/46-1, WE 2850/20-1, WE 2850/19-1, and DO 777/7-1).
The publication of this article was funded by the open-access fund of Leibniz Universität Hannover.
This paper was edited by Didier Laporte and reviewed by Michel Pichavant and Robert Trumbull.
Albrecht, M., Derrey, I. T., Horn, I., Schuth, S., and Weyer, S.: Quantification of trace element contents in frozen fluid inclusions by UV-fs-LA-ICP-MS analysis, J. Anal. At. Spectrom., 29, 1034–1041, https://doi.org/10.1039/C4JA00015C, 2014.
Bartels, A., Vetere, F., Holtz, F., Behrens, H., and Linnen, R. L.: Viscosity of flux-rich pegmatitic melts, Contrib. Mineral. Petrol., 162, 51–60, https://doi.org/10.1007/s00410-010-0582-3, 2011.
Behrens, H. and Hahn, M.: Trace element diffusion and viscous flow in potassium-rich trachytic and phonolitic melts, Chem. Geol., 259, 63–77, https://doi.org/10.1016/j.chemgeo.2008.10.014, 2009.
Behrens, H., Romano, C., Nowak, M., Holtz, F., and Dingwell, D. B.: Near-infrared spectroscopic determination of water species in glasses of the systems MAlSi3O8 (M = Li, Na, K): an interlaboratory study, Chem. Geol., 128, 41–63, 1996.
Bodnar, R. J.: Revised equation and table for determining the freezing point depression of H2O-Nacl solutions, Geochim. Cosmochim. Ac., 57, 683–684, https://doi.org/10.1016/0016-7037(93)90378-A, 1993.
Borisov, A. and Aranovich, L.: Zircon solubility in silicate melts: New experiments and probability of zircon crystallization in deeply evolved basic melts, Chem. Geol., 510, 103–112, https://doi.org/10.1016/j.chemgeo.2019.02.019, 2019.
Černý, P.: Rare-element Granitic Pegmatites, Part I: Anatomy and Internal Evolution of Pegmatitic Deposits, Geosci. Can., 18, 49–67, https://journals.lib.unb.ca/index.php/GC/article/view/3722 (last access: 6 October 2023), 1991.
Černý, P. and Ercit, T. S.: The classification of granitic pegmatites revisited, Can. Mineral., 43, 2005–2026, https://doi.org/10.2113/gscanmin.43.6.2005, 2005.
Černý, P., Blevin, P. L., Cuney, M., and London, D.: Granite-Related Ore Deposits, in: One Hundredth Anniversary Volume, edited by: Hedenquist, J. W., Thompson, J. F. H., Goldfarb, R. J., and Richards, J. P., Society of Economic Geologists, https://doi.org/10.5382/AV100.12, 2005.
Chakraborty, D. and Chandra, A.: Diffusion of ions in supercritical water: Dependence on ion size and solvent density and roles of voids and necks, J. Mol. Liq., 162, 12–19, https://doi.org/10.1016/j.molliq.2011.05.006, 2011.
Crameri, F.: Scientific colour maps, Zenodo, https://doi.org/10.5281/zenodo.1243862, 2023.
Crisp, L. J. and Berry, A. J.: A new model for zircon saturation in silicate melts, Contr. Mineral. and Petrol., 177, https://doi.org/10.1007/s00410-022-01925-6, 2022.
De Hoog, J. C. M.: Matrix Effects During SIMS Measurement of the Lithium Mass Fractions of Silicate Glasses: Correction Procedures and Updated Preferred Values of Reference Materials, Geostand. Geoanal. Res., 42, 513–522, https://doi.org/10.1111/ggr.12237, 2018.
Derrey, I. T., Albrecht, M., Dupliy, E., Botcharnikov, R. E., Horn, I., Junge, M., Weyer, S., and Holtz, F.: Experimental tests on achieving equilibrium in synthetic fluid inclusions: Results for scheelite, molybdenite, and gold solubility at 800 °C and 200 MPa, Am. Miner., 102, 275–283, https://doi.org/10.2138/am-2017-5869, 2017.
Devineau, K., Champallier, R., and Pichavant, M.: Dynamic Crystallization of a Haplogranitic Melt: Application to Pegmatites, J. Pet., 61, https://doi.org/10.1093/petrology/egaa054, 2020.
Gao, X., Anne-Sophie Michaud, J., Zhou, Z., Horn, I., Almeev, R. R., Weyer, S., and Holtz, F.: Trace element (Be, Zn, Ga, Rb, Nb, Cs, Ta, W) partitioning between mica and Li-rich granitic melt: Experimental approach and implications for W mineralization, Geochim. Cosmochim. Ac., 375, 1–18, https://doi.org/10.1016/j.gca.2024.05.004, 2024.
Geisinger, K., Oestrike, R., Navrotsky, A., Turner, G., and Kirkpatrick, R.: Thermochemistry and structure of glasses along the join NaAlSi3O8-NaBSi3O8, Geochim. Cosmochim. Ac., 52, 2405–2414, https://doi.org/10.1016/0016-7037(88)90297-9, 1988.
Gion, A. M., Gaillard, F., Freslon, N., Erdmann, S., and Di Carlo, I.: A method for the direct analysis of quenched, magmatic-hydrothermal fluids recovered from high-pressure, high-temperature experiments, Chem. Geol., 609, 121061, https://doi.org/10.1016/j.chemgeo.2022.121061, 2022.
Guillong, M., Meier, D. L., Allan, M. M., Heinrich, C. A., and Yardley, B. W.: Appendix A6: SILLS: A MATLAB-based program for the reduction of laser ablation ICP-MS data of homogenous materials and inclusions, Mineral. Assoc. Canada Short Course, 328–333, https://mineralsystems.ethz.ch/software/sills.html (last access: 13 July 2022), 2008.
Hervig, R. L., Moore, G. M., Williams, L. B., Peacock, S. M., Holloway, J. R., and Roggensack, K.: Isotopic and elemental partitioning of boron between hydrous fluid and silicate melt, Am. Miner., 87, 769–774, https://doi.org/10.2138/am-2002-5-620, 2002.
Holtz, F., Behrens, H., Dingwell, D. B., and Johannes, W.: H2O solubility in haplogranitic melts: Compositional, pressure and temperature dependence, Am. Miner., 80, 94–108, 1995.
Horn, I., Blanckenburg, F. von, Schoenberg, R., Steinhoefel, G., and Markl, G.: In situ iron isotope ratio determination using UV-femtosecond laser ablation with application to hydrothermal ore formation processes, Geochim. Cosmochim. Ac., 70, 3677–3688, https://doi.org/10.1016/j.gca.2006.05.002, 2006.
Hulsbosch, N. and Muchez, P.: Tracing fluid saturation during pegmatite differentiation by studying the fluid inclusion evolution and multiphase cassiterite mineralisation of the Gatumba pegmatite dyke system (NW Rwanda), Lithos, 354–355, 105285, https://doi.org/10.1016/j.lithos.2019.105285, 2020.
Iveson, A. A., Webster, J. D., Rowe, M. C., and Neill, O. K.: Fluid-melt trace-element partitioning behaviour between evolved melts and aqueous fluids: Experimental constraints on the magmatic-hydrothermal transport of metals, Chem. Geol., 516, 18–41, https://doi.org/10.1016/j.chemgeo.2019.03.029, 2019.
Jahn, S. and Wunder, B.: Lithium speciation in aqueous fluids at high P and T studied by ab initio molecular dynamics and consequences for Li-isotope fractionation between minerals and fluids, Geochim. Cosmochim. Ac., 73, 5428–5434, https://doi.org/10.1016/j.gca.2009.06.017, 2009.
Jahns, R. H.: The genesis of pegmatites: I. Occurrence and origin of giant crystals, Am. Miner., 38, 563–598, 1953.
Jahns, R. H. and Burnham, C. W.: Experimental studies of pegmatite genesis: l. A model for the derivation and crystallization of granitic pegmatites, Econ. Geol., 64, 843–864, https://doi.org/10.2113/gsecongeo.64.8.843, 1969.
Jochum, K. P., Stoll, B., Herwig, K., Willbold, M., Hofmann, A. W., Amini, M., Aarburg, S., Abouchami, W., Hellebrand, E., Mocek, B., Raczek, I., Stracke, A., Alard, O., Bouman, C., Becker, S., Dücking, M., Brätz, H., Klemd, R., Bruin, D. de, Canil, D., Cornell, D., Hoog, C.-J. de, Dalpé, C., Danyushevsky, L., Eisenhauer, A., Gao, Y., Snow, J. E., Groschopf, N., Günther, D., Latkoczy, C., Guillong, M., Hauri, E. H., Höfer, H. E., Lahaye, Y., Horz, K., Jacob, D. E., Kasemann, S. A., Kent, A. J. R., Ludwig, T., Zack, T., Mason, P. R. D., Meixner, A., Rosner, M., Misawa, K., Nash, B. P., Pfänder, J., Premo, W. R., Sun, W. D., Tiepolo, M., Vannucci, R., Vennemann, T., Wayne, D., and Woodhead, J. D.: MPI-DING reference glasses for in situ microanalysis: New reference values for element concentrations and isotope ratios, Geochem. Geophys. Geosyst., 7, 1-44, https://doi.org/10.1029/2005GC001060, 2006.
Jochum, K. P., Weis, U., Stoll, B., Kuzmin, D., Yang, Q., Raczek, I., Jacob, D. E., Stracke, A., Birbaum, K., Frick, D. A., Günther, D., and Enzweiler, J.: Determination of Reference Values for NIST SRM 610-617 Glasses Following ISO Guidelines, Geostand. Geoanal. Res., 35, 397–429, https://doi.org/10.1111/j.1751-908X.2011.00120.x, 2011.
Kasemann, S., Meixner, A., Rocholl, A., Vennemann, T., Rosner, M., Schmitt, A. K., and Wiedenbeck, M.: Boron and Oxygen Isotope Composition of Certified Reference Materials NIST SRM 610/612 and Reference Materials JB-2 and JR-2, Geostand. Newslett., 25, 405–416, https://doi.org/10.1111/j.1751-908X.2001.tb00615.x, 2001.
Kimura, J.-I., Chang, Q., Ishikawa, T., and Tsujimori, T.: Influence of laser parameters on isotope fractionation and optimisation of lithium and boron isotope ratio measurements using laser ablation-multiple Faraday collector-inductively coupled plasma mass spectrometry, J. Anal. At. Spectrom., 31, 2305–2320, https://doi.org/10.1039/C6JA00283H, 2016.
Kommescher, S., Marxer, F., Pohl, F., Horn, I., Holtz, F., Almeev, R., Marschall, H., Weyer, S., and Fonseca, R. O. C.: High-temperature boron partitioning and isotope fractionation between basaltic melt and fluid, Contrib. Mineral. Petrol., 179, https://doi.org/10.1007/s00410-024-02159-4, 2024.
London, D.: Granitic pegmatites: an assessment of current concepts and directions for the future, Lithos, 80, 281–303, https://doi.org/10.1016/j.lithos.2004.02.009, 2005.
London, D.: Pegmatites, The Canadian Mineralogist Special Publication, 10, Mineralogical Association of Canada, Ottawa, 347 pp., ISBN 978-0-921294-47-4, 2008.
London, D., Hervig, R. L., and Morgan, G. B.: Melt-vapor solubilities and elemental partitioning in peraluminous granite-pegmatite systems: experimental results with Macusani glass at 200 MPa, Contrib. Mineral. Petrol., 99, 360–373, https://doi.org/10.1007/BF00375368, 1988.
London, D., Morgan VI, G. B., and Hervig, R. L.: Vapor-undersaturated experiments with Macusani glass + H2O at 200 MPa, and the internal differentiation of granitic pegmatites, Contrib. Mineral. Petrol., 102, 1–17, 1989.
Maloney, J. S., Nabelek, P. I., and Sirbescu, M.-L. C. H.: Lithium and its isotopes in tourmaline as indicators of the crystallization process in the San Diego County pegmatites, California, USA, Eur. J. Mineral., 20, 905–916, https://doi.org/10.1127/0935-1221/2008/0020-1823, 2008.
Maneta, V. and Anderson, A. J.: Monitoring the crystallization of water-saturated granitic melts in real time using the hydrothermal diamond anvil cell, Contr. Mineral. and Petrol., 173, https://doi.org/10.1007/s00410-018-1509-7, 2018.
Maneta, V., Baker, D. R., and Minarik, W.: Evidence for lithium-aluminosilicate supersaturation of pegmatite-forming melts, Contr. Mineral. Petrol., 170, https://doi.org/10.1007/s00410-015-1158-z, 2015.
Matthews, W., Linnen, R. L., and Guo, Q.: A filler-rod technique for controlling redox conditions in cold-seal pressure vessels, Am. Miner., 88, 701–707, https://doi.org/10.2138/am-2003-0424, 2003.
Nabelek, P. I., Russ-Nabelek, C., and Denison, J. R.: The generation and crystallization conditions of the Proterozoic Harney Peak Leucogranite, Black Hills, South Dakota, USA: Petrologic and geochemical constraints, Contr. Mineral. Petrol., 110, 173–191, https://doi.org/10.1007/BF00310737, 1992.
Nabelek, P. I., Whittington, A. G., and Sirbescu, M.-L. C.: The role of H2O in rapid emplacement and crystallization of granite pegmatites: resolving the paradox of large crystals in highly undercooled melts, Contrib. Mineral. Petrol., 160, 313–325, https://doi.org/10.1007/s00410-009-0479-1, 2010.
Ottolini, L., Le Fèvre, B., and Vannucci, R.: Direct assessment of mantle boron and lithium contents and distribution by SIMS analyses of peridotite minerals, Earth Planet. Sc. Lett., 228, 19–36, https://doi.org/10.1016/j.epsl.2004.09.027, 2004.
Paton, C., Hellstrom, J., Paul, B., Woodhead, J., and Hergt, J.: Iolite: Freeware for the visualisation and processing of mass spectrometric data, J. Anal. At. Spectrom., 26, 2508, https://doi.org/10.1039/C1JA10172B, 2011.
Phelps, P. R. and Lee, C.-T. A.: Extreme lithium isotope fractionation in quartz from the Stewart pegmatite, Geochim. Cosmochim. Ac., 336, 208–218, https://doi.org/10.1016/j.gca.2022.09.014, 2022.
Pichavant, M.: An experimental study of the effect of boron on a water saturated haplogranite at 1 Kbar vapour pressure, Contr. Mineral. Petrol., 76, 430–439, https://doi.org/10.1007/BF00371485, 1981.
Pichavant, M.: Experimental Crystallization of the Beauvoir Granite as a Model for the Evolution of Variscan Rare Metal Magmas, J. Pet., 63, https://doi.org/10.1093/petrology/egac120, 2022.
Pichavant, M., Kontak, D. J., Briqueu, L., Herrera, J. V., and Clark, A. H.: The Miocene-Pliocene Macusani Volcanics, SE Peru: II. Geochemistry and origin of a felsic peraluminous magma, Contrib. Mineral. Petrol., 100, 325–338, https://doi.org/10.1007/BF00379742, 1988.
Pitzer, K. S. and Sterner, S. M.: Equations of state valid continuously from zero to extreme pressures for H2O and CO2, J. Chem. Phys., 101, 3111–3116, https://doi.org/10.1063/1.467624, 1994.
Rudnick, R. L. and Gao, S.: Composition of the Continental Crust, in: Treatise on Geochemistry, 2nd edn., edited by: Holland, H. D. and Turekian, K. K., Elsevier, Oxford, 1–51, https://doi.org/10.1016/B978-0-08-095975-7.00301-6, 2014.
Saghir, M. Z., Jiang, C. G., Chacha, M., Yan, Y., Khawaya, M., and Pan, S.: Thermodiffusion in Porous Media, in: Transport Phenomena in Porous Media III, edited by: Ingham, D. B. and Pop, I., Elsevier, 227–260, https://doi.org/10.1016/B978-008044490-1/50013-2, 2005.
Schäfer, B., Frischknecht, R., Günther, D., and Dingwell, D. B.: Determination of trace-element partitioning between fluid and melt using LA-ICP-MS analysis of synthetic fluid inclusions in glass, Eur. J. Mineral., 11, 415–426, https://doi.org/10.1127/ejm/11/3/0415, 1999.
Schatz, O. J., Dolejš, D., Stix, J., Williams-Jones, A. E., and Layne, G. D.: Partitioning of boron among melt, brine and vapor in the system haplogranite–H2O–NaCl at 800 °C and 100 MPa, Chem. Geol., 210, 135–147, https://doi.org/10.1016/j.chemgeo.2004.06.007, 2004.
Schauble, E. A.: Applying Stable Isotope Fractionation Theory to New Systems, in: Geochemistry of Non-Traditional Stable Isotopes, edited by: Johnson, C. M., Beard, B. L., and Albarède, F., De Gruyter, Washington, D.C., 65–112, https://doi.org/10.1515/9781501509360-006, 2004.
Schmidt, C., Thomas, R., and Heinrich, W.: Boron speciation in aqueous fluids at 22 to 600 °C and 0.1 MPa to 2 GPa, Geochim. Cosmochim. Ac., 69, 275–281, https://doi.org/10.1016/j.gca.2004.06.018, 2005.
Singer, C. R., Behrens, H., Horn, I., Oeser, M., Dohmen, R., and Weyer, S.: Li–Na interdiffusion and diffusion-driven lithium isotope fractionation in pegmatitic melts, Eur. J. Mineral., 35, 1009–1026, https://doi.org/10.5194/ejm-35-1009-2023, 2023.
Singer, C. R., Behrens, H., Horn, I., Fechtelkord, M., and Weyer, S.: Boron diffusion, related isotope fractionation and the structural role of B in pegmatite forming melts, Geochim. Cosmochim. Ac., 392, 70–87, https://doi.org/10.1016/j.gca.2024.11.023, 2025.
Singer, C. R., Behrens, H., Horn, I., Oeser, M., Weyer, S., and Holtz, F.: Data for: A novel experimental approach to investigate element transport and isotope fractionation of Li and B in pegmatitic systems during fluid–melt interaction, Mendeley Data [data set], https://doi.org/10.17632/8jw6dw272k.2, 2026.
Sirbescu, M.-L. C., Schmidt, C., Veksler, I. V., Whittington, A. G., and Wilke, M.: Experimental Crystallization of Undercooled Felsic Liquids: Generation of Pegmatitic Texture, J. Pet., 58, 539–568, https://doi.org/10.1093/petrology/egx027, 2017.
Soltay, L. G. and Henderson, G. S.: Structural differences between lithium silicate and lithium germanate glasses by Raman spectroscopy, Phys. Chem. Glasses, 46, 381–384, 2005.
Steinmann, L. K., Oeser, M., Horn, I., Seitz, H.-M., and Weyer, S.: In situ high-precision lithium isotope analyses at low concentration levels with femtosecond-LA-MC-ICP-MS, J. Anal. At. Spectrom., 34, 1447–1458, https://doi.org/10.1039/C9JA00088G, 2019.
Teng, F.-Z., McDonough, W. F., Rudnick, R. L., and Walker, R. J.: Diffusion-driven extreme lithium isotopic fractionation in country rocks of the Tin Mountain pegmatite, Earth Planet. Sc. Lett., 243, 701–710, https://doi.org/10.1016/j.epsl.2006.01.036, 2006.
Thomas, R.: Determination of the H3BO3 concentration in fluid and melt inclusions in granite pegmatites by laser Raman microprobe spectroscopy, Am. Miner., 87, 56–68, https://doi.org/10.2138/am-2002-0107, 2002.
van Lichtervelde, M., Salvi, S., Beziat, D., and Linnen, R. L.: Textural Features and Chemical Evolution in Tantalum Oxides: Magmatic Versus Hydrothermal Origins for Ta Mineralization in the Tanco Lower Pegmatite, Manitoba, Canada, Econ. Geol., 102, 257–276, https://doi.org/10.2113/gsecongeo.102.2.257, 2007.
Wachter, W., Fernandez, S., Buchner, R., and Hefter, G.: Ion association and hydration in aqueous solutions of LiCl and Li2SO4 by dielectric spectroscopy, J. Phys. Chem. B, 111, 9010–9017, https://doi.org/10.1021/jp072425e, 2007.
Wang, T., Zhang, X., Liu, X., Lu, X., and Wang, R.: A molecular dynamics study of Li speciation in hydrothermal fluids and silicate melts, Che.m Geol., 584, 120528, https://doi.org/10.1016/j.chemgeo.2021.120528, 2021.
Watson, E. B. and Harrison, T. M.: Zircon saturation revisited: temperature and composition effects in a variety of crustal magma types, Earth Planet. Sc. Lett., 64, 295–304, https://doi.org/10.1016/0012-821X(83)90211-X, 1983.
Webster, J. D., Holloway, J. R., and Hervig, R. L.: Partitioning of lithophile trace elements between H2O and H2O + CO2 fluids and topaz rhyolite melt, Econ. Geol., 84, 116–134, https://doi.org/10.2113/gsecongeo.84.1.116, 1989.
Woodhead, J. D., Hellstrom, J., Hergt, J. M., Greig, A., and Maas, R.: Isotopic and Elemental Imaging of Geological Materials by Laser Ablation Inductively Coupled Plasma-Mass Spectrometry, Geostand. Geoanal. Res., 31, 331–343, https://doi.org/10.1111/j.1751-908X.2007.00104.x, 2007.
Wu, S., Wörner, G., Jochum, K. P., Stoll, B., Simon, K., and Kronz, A.: The Preparation and Preliminary Characterisation of Three Synthetic Andesite Reference Glass Materials (ARM-1, ARM-2, ARM-3) for In Situ Microanalysis, Geostand. Geoanal. Res., 43, 567–584, https://doi.org/10.1111/ggr.12301, 2019.
Wu, S., Yang, Y., Jochum, K. P., Romer, R. L., Glodny, J., Savov, I. P., Agostini, S., Hoog, J. C. de, Peters, S. T., Kronz, A., Zhang, C., Bao, Z., Wang, X., Li, Y., Tang, G., Feng, L., Yu, H., Li, Z., Le Zhang, Lin, J., Zeng, Y., Xu, C., Wang, Y., Cui, Z., Deng, L., Xiao, J., Liu, Y., Xue, D., Di Zhang, Jia, L., Wang, H., Xu, L., Huang, C., Xie, L., Pack, A., Wörner, G., He, M., Li, C., Yuan, H., Huang, F., Li, Q., Yang, J., Li, X., and Wu, F.: Isotopic Compositions (Li-B-Si-O-Mg-Sr-Nd-Hf-Pb) and FeFe Ratios of Three Synthetic Andesite Glass Reference Materials (ARM-1, ARM-2, ARM-3), Geostand. Geoanal. Res., 45, 719–745, https://doi.org/10.1111/ggr.12399, 2021.
Wunder, B., Meixner, A., Romer, R. L., and Heinrich, W.: Temperature-dependent isotopic fractionation of lithium between clinopyroxene and high-pressure hydrous fluids, Contrib. Mineral. Petrol., 151, 112–120, https://doi.org/10.1007/s00410-005-0049-0, 2006.
Wunder, B., Meixner, A., Romer, R. L., Feenstra, A., Schettler, G., and Heinrich, W.: Lithium isotope fractionation between Li-bearing staurolite, Li-mica and aqueous fluids: An experimental study, Chem. Geol., 238, 277–290, https://doi.org/10.1016/j.chemgeo.2006.12.001, 2007.
Yamaguchi, T., Ohzono, H., Yamagami, M., Yamanaka, K., Yoshida, K., and Wakita, H.: Ion hydration in aqueous solutions of lithium chloride, nickel chloride, and caesium chloride in ambient to supercritical water, J. Mol. Liq., 153, 2–8, https://doi.org/10.1016/j.molliq.2009.10.012, 2010.
Yamaji, K., Makita, Y., Watanabe, H., Sonoda, A., Kanoh, H., Hirotsu, T., and Ooi, K.: Theoretical Estimation of Lithium Isotopic Reduced Partition Function Ratio for Lithium Ions in Aqueous Solution, J. Phys. Chem. A, 105, 602–613, https://doi.org/10.1021/jp001303i, 2001.
Ye, X.-Y., Li, B., Chen, X.-D., Lei, J., Lu, A.-H., Zhao, L., Li, X., Tan, D.-B., and Xiao, Y.: Lithium isotopic systematics and numerical simulation for highly-fractionated granite-pegmatite system: Implications for the pegmatite-type rare-metal mineralization, Ore Geol. Rev., 163, 105722, https://doi.org/10.1016/j.oregeorev.2023.105722, 2023.
Zajacz, Z., Halter, W. E., Pettke, T., and Guillong, M.: Determination of fluid/melt partition coefficients by LA-ICPMS analysis of co-existing fluid and silicate melt inclusions: Controls on element partitioning, Geochim. Cosmochim. Ac., 72, 2169–2197, https://doi.org/10.1016/j.gca.2008.01.034, 2008.
Zhang, C., Koepke, J., Albrecht, M., Horn, I., and Holtz, F.: Apatite in the dike-gabbro transition zone of mid-ocean ridge: Evidence for brine assimilation by axial melt lens, Am. Miner., 102, 558–570, https://doi.org/10.2138/am-2017-5906, 2017.
Zhang, Y., Ni, H., and Chen, Y.: Diffusion Data in Silicate Melts, in: Diffusion in Minerals and Melts, edited by: Zhang, Y. and Cherniak, D. J., De Gruyter, Berlin, Boston, 311–408, https://doi.org/10.2138/rmg.2010.72.8, 2010.
Zhou, J.-S., Wang, Q., Xu, Y.-G., Cempírek, J., Wang, H., Ma, J.-L., Wei, G.-J., Huang, T.-Y., Zhu, G.-H., and Le Zhang: Geochronology, petrology, and lithium isotope geochemistry of the Bailongshan granite-pegmatite system, northern Tibet: Implications for the ore-forming potential of pegmatites, Chem. Geol., 584, 120484, https://doi.org/10.1016/j.chemgeo.2021.120484, 2021.