the Creative Commons Attribution 4.0 License.
the Creative Commons Attribution 4.0 License.
 | 22 May 2026
Formation of black opal in the pegmatites from Volyn (Ukraine) – an example for interaction of silica with organic matter
Gerhard Franz
Vladimir Khomenko
Vsevolod Chornousenko
Armin Zeh
Ferry Schiperski
Simon Gouzy
Ulrich Gernert
Jörg Nissen
Black opal, a variety of opal pigmented by organic matter, from Volyn, western Ukrainian Shield, was investigated by means of scanning electron microscopy (SEM), electron microprobe analyses (EMPAs), μ-X-ray fluorescence (μXRF) element mapping, X-ray diffraction (XRD), and Fourier transformed infrared (FTIR) spectroscopy, and was dated by U-Pb by laser ablation (LA-ICP-SF-MS). Opal occurs as several centimeter large blocks and as cement in a breccia within pegmatites, which intruded into granites of the ca. 1.7–1.8 Ga old Korosten pluton. Opal samples were collected underground in miarolitic cavities of the pegmatites, which also host kerite, fossilized organic material (called Volyn biota). Inclusions in opal are typical pegmatitic minerals such as alkali-feldspar, Li-mica, and quartz. Buddingtonite and ammonium-bearing muscovite, as well as shape relicts of the fossils in opal, indicate interactions of organic material with the pegmatite.
The XRD data indicate opal-CT with a complex pattern of the ∼ 4 Å peak. Its microstructure, as seen in SEM and back-scattered electron maps, consists of nanograins 15–35 nm in size, arranged in sphere-like structures, in some samples ∼ 5 µm-large and monodisperse, in others polydisperse with diameters of between 1 and 10 µm, and as lepispheres. Organic matter plus water makes up ∼ 10 wt %–15 wt %. The organic matter is situated within the core, in concentric zones in the sphere-like structures and in the matrix around them. Infrared (IR) spectra confirm the presence of silanol SiOH and CHn. At the contact with pegmatitic material, a pyrite-enriched zone was observed and interpreted as resulting from the infiltration of a late Fe- and Mn-bearing fluid along grain boundaries.
Results of U-Pb dating yield a minimum age for opal formation of ∼ 200 Ma, and provide evidence for fluid overprint during the Jurassic (170–155 Ma) and Quaternary. These ages are much older than reported so far in opal from deposits worldwide. Furthermore, the here-reported occurrence of opal in pegmatitic rocks is unique, as all other opal deposits are either sedimentary or volcanic hosted.
- Article
(22682 KB) - Full-text XML
- BibTeX
- EndNote


The pegmatites from Volyn, Khoroshiv (former Volodarsk-Volynsky, western Ukraine) are an excellent example for the interaction of igneous rocks with organic material. They are known for their occurrence of kerite (Ginzburg et al., 1987; Gorlenko et al., 2000; Zhmur, 2003), which are fossilized remnants of several organisms of the deep biosphere (Franz et al., 2022, 2023). In addition to kerite, the NH4-bearing feldspar buddingtonite and NH4-bearing muscovite (tobelite) prove the interaction of biological material with the igneous rocks (Proshko et al., 1987; Franz et al., 2017). Organic matter (OM) was also identified in fluid inclusions in quartz, topaz, and beryl (Kalyuzhny, 1971; Vozniak et al., 2012), pointing to the mobility of OM in fluids. Black opal pigmented by OM was described by Slivko and Pavlyshyn (1967), Gigashvilii and Kalyuzhny (1969), and Gouzy et al. (2025).
Opal (SiO2 ⋅ nH2O) is an amorphous mineral, primarily formed by the alteration of high-silica rocks. It shows a wide variety with different body colors, e.g., red fire opal, green prase opal, and black opal. Opal forms at low temperatures ≤ 200 °C, and the precipitation processes include the silicification of biological remnants such as wood, various types of skeletons, microfossils, and OM (Gouzy et al., 2025). There are three recognized varieties: opal-A (completely amorphous), opal-CT (cristobalite-tridymite), and opal-C (cristobalite) (Gaillou et al., 2008). The micro- to nano-structure of opal consists of on average ∼ 25 nm (10–40 nm) large particles of silica called nanograins, arranged in spheres with variable diameters for opal-A, from ∼ 80 nm to a few µm. Within a sample, the spheres can be either uniform in size (monodisperse), highly variable (polydisperse), and/or of imperfect shape (Gaillou et al., 2008). Spheres are often cemented by a silica gel and either ordered (giving rise to the play-of-color (opalescence) if the spheres have the right diameter for light diffraction) or disordered in common opal. Lepispheres in opal-C and opal-CT describe spheres composed of platelets of nanograins (Flörke et al., 1976), ranging in diameter from ∼ 250 nm to 1 µm (Gaillou et al., 2008).
In the Volyn pegmatites, there are several color varieties of opal: bluish-gray, tan or golden yellow, orange, white, reddish-brown, and brown to black. Of special interest are the rare OM-containing black and dark-brown varieties. A model of the interaction between OM and silica for this opal was presented by Gouzy et al. (2025). Here, we will give more information about its genesis by combining results of microstructural-chemical investigations, carried out by means of polarization and scanning electron microscopy (SEM), electron microprobe analysis (EMPA), powder X-ray diffraction (XRD), and Fourier transformed infrared (FTIR) spectroscopy. In addition, the results of U-Pb age dating by laser ablation ICP-MS are presented.
1.1 Geological background
The sample material comes from pegmatites of the Paleoproterozoic Korosten plutonic complex in the border facies of rapakivi-type granites. The Volyn pegmatite field at Khoroshiv in the north-western part of the Precambrian Ukrainian Shield contains several hundred individual pegmatite bodies, and many of these have been mined for piezo quartz and gem minerals (Lyckberg et al., 2009, 2019; and references therein). Intrusion ages of the anorthositic-granitic Korosten pluton ages range from 1.84 to 1.72 Ga (Amelin et al., 1994; Shumlyanskyy et al., 2017); those of the granite and pegmatite near to Volyn are 1766 ± 3 Ma and 1760 ± 3 Ma, respectively (Shumlyanskyy et al., 2021). The pegmatites contain miarolitic cavities (called pockets or chambers), which are exceptionally large and host gem-quality beryl, topaz, m-sized quartz crystals, and OM called kerite (Ginzburg et al. 1987; detailed description in Franz et al., 2023). Decay products of this OM were found as NH4 in ammonium-bearing feldspar and muscovite, in fluid inclusions in beryl, and in opal, cementing a breccia (Vozniak et al., 2012; Franz et al., 2017).
1.2 Samples
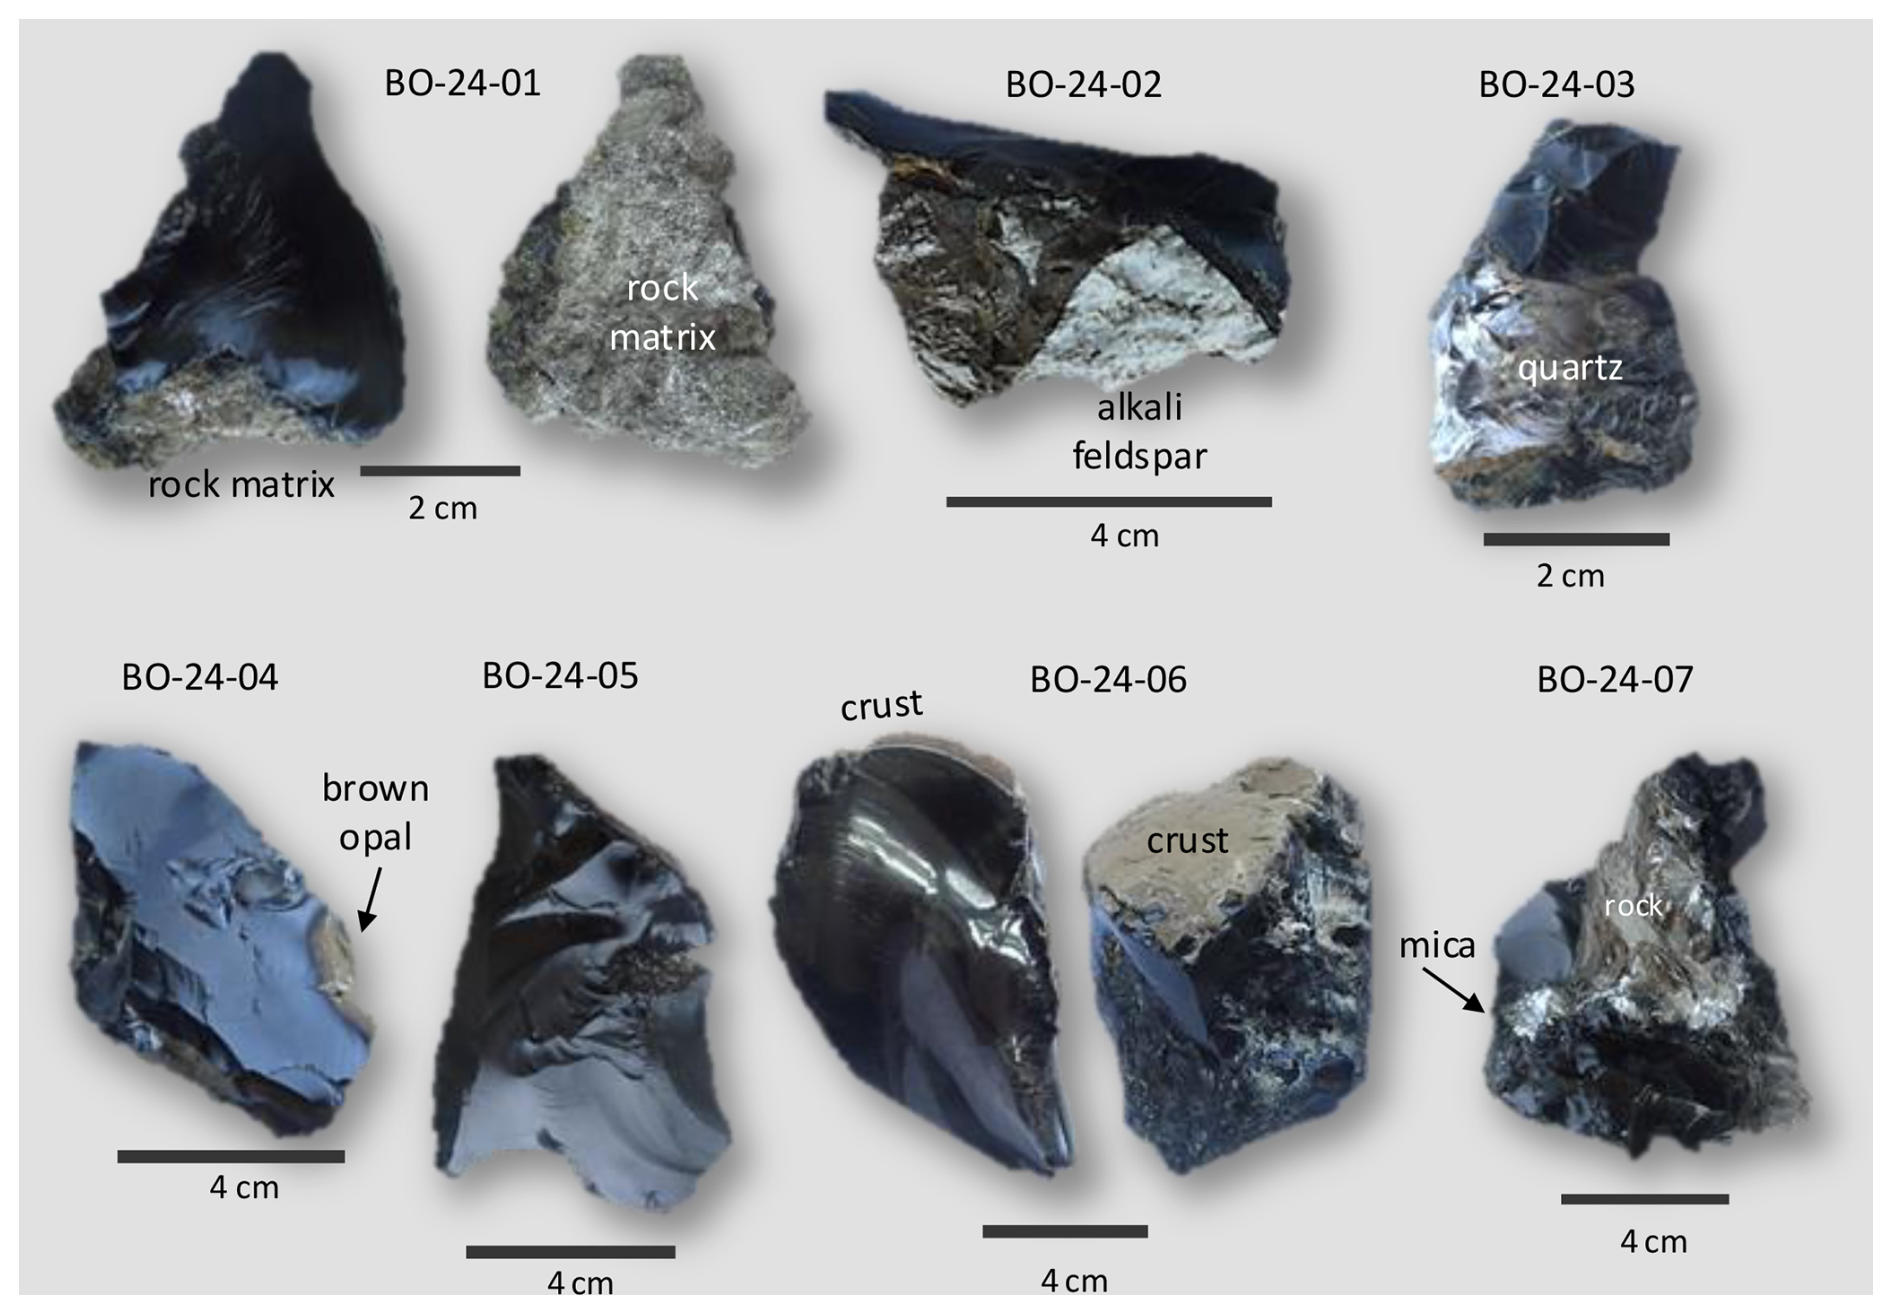
The material (Tables 1, S1 in Franz et al., 2026) was collected by Vsevolod Chornousenko (VC), former chief mine geologist, or was part of the collection of the M. P. Semenenko Institute of Geochemistry, Mineralogy and Ore Formation (IGMOF). The black opal occurs underground in significant quantities only in four of the more than 500 pegmatites inspected by VC. A sketch map of one chamber is shown in Fig. S1 (Franz et al., 2026). It is not clear if black opal was not present at all or only in small quantities in the remaining pegmatites. Additionally, it was also documented in a borehole core in cracks of a pegmatite quartz cap ∼ 2 m above the miarolitic chamber. The four pegmatites (numbered 325(D), 344, 345, and 441) are located in the central part of the pegmatite field in the Vishnyakovsky section of the deposit (Fig. S2). Based on the size of their pocket chambers, pegmatites 345 and 344 can be classified as large, whereas 325(D) and 441 are medium-sized. Black opal was found above the pocket, in gray quartz, and as cement of the pocket breccia; sample V2008 (Fig. S14) shows such a breccia, where black opal is closely associated with decayed organic matter and buddingtonite. Below the pocket, in the leaching zone, and in giant (> 500–1000 m3) chambers, black opal has not been found. Some of the extracted, visually homogeneous, and monomineralic fragments weighed more than 20 kg and reached a thickness of more than 30 cm. Similarly, as in the case of kerite, the largest bodies of black opal were found in a relatively small chamber.
The samples analyzed for the present study are homogeneous (BO-24-05) and contain fine-grained rock matrix (-01, -07), alkali-feldspar (-02), quartz (-03), or Li-mica together with rock fragments (-07). Sample -06 contains brown alteration crust (Fig. S3b) and sample -04 features brown interior parts (Fig. 1). Macroscopically, opal shows conchoidal fracturing, similar to quartz and glass but with a matt lackluster. Samples BO-24-01 and -04 come from the same chamber at different depths (Fig. S1). Other color varieties are shown in Fig. S3a. Additional, previously published data come from samples from the Museum of IGMOF, labeled BO-19-01 and -02 (Gouzy et al., 2025), along with a breccia sample labeled V2008 (Franz et al., 2017; Figs. S3c, S14). For thin section preparation for optical microscopy and for electron microprobe investigations, hand specimens were cut under water with a diamond saw. Sections used for laser ablation were approximately 100 µm thick.
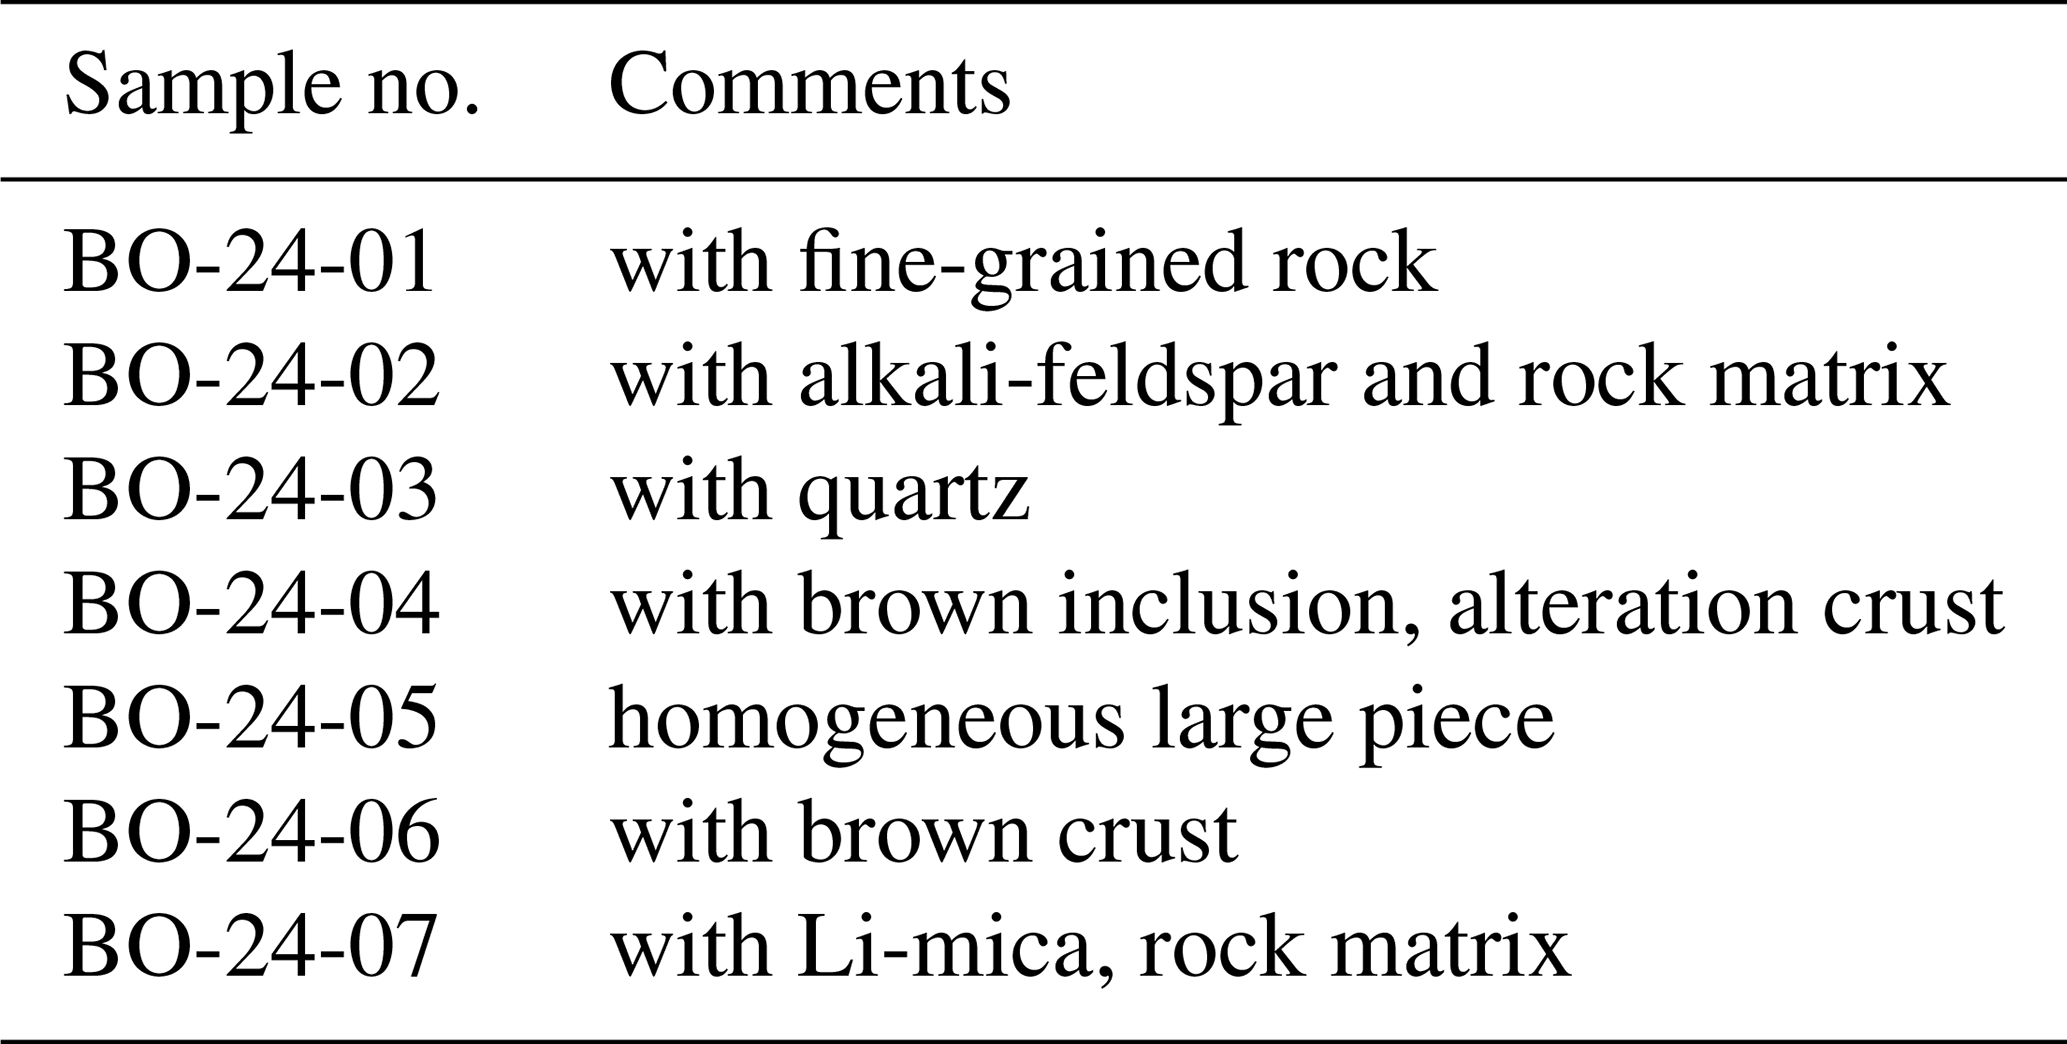
Table 1Sample list of black opal; all samples from the collection of Vsevolod Chornousenko.
1.3 Methods
1.3.1 Scanning electron microscopy (SEM)
For investigation of the microstructure in SEM, freshly broken samples were mounted on carbon tape and coated with a 16 nm thick carbon layer. Images were obtained using a Hitachi SU8030 cold field emitter instrument, equipped with a 30 mm2 silicon drift detector (SDD) Octane-A Plus from EDAX for energy-dispersive analysis (EDS) of mineral inclusions. Some images were obtained in combination with a back-scattered electron (BSE) detector.
1.3.2 Electron microprobe analysis (EMPA)
The JEOL JXA-8530F field emission microprobe at TU Berlin was used to investigate carbon-coated thin sections of the samples for quantitative results and element mapping. Opal was analyzed in wavelength dispersive mode for Na, K, Ca, Mn, Fe, Al, S, N, Rb, Sr, F, and Si. Measuring conditions were 10/20 s measuring time on peak/background. Opal is not stable under a focused beam, therefore a beam diameter of 20 µm was used. Nitrogen, Rb, and Sr are below the detection limit, which is approximately 0.1 wt % for N, 160 ppm for Rb, and 260 ppm for Sr. BSE and secondary electron (SE) images were obtained to gather information on inclusions, which were characterized by energy-dispersive analysis (EDS), normalized to 100 wt % and atom %. Detection limits and counting errors are in Tables S2 and S3.
Data for element distribution maps in the wavelength dispersive mode of the microprobe were acquired using a 15 kV, 20 nA probe current, 100 nA for mapping, with a beam diameter of 10 µm. Mappings were performed in stage scan-modus with pixel resolution between 277 and 360 × 180–265 (depending on the total scan area, which was in the order of 500 µm × 1500 µm), with a pixel size of mostly 80 nm and a dwell time per pixel of 200 ms.
1.3.3 Powder X-ray diffraction (XRD)
Small amounts of opal from each sample were ground by hand in an agate mortar under ethanol and transferred to the sample holder. We analyzed samples BO-24-01, -02, -03, -04, -05, and -07; for comparison, samples of brown, yellowish-white, and white opal (Fig. S3) were also analyzed. Powder data were collected between 5 and 75°2θ with a Rigaku SmartLab X-ray diffraction system, equipped with a High Flux 9kW rotation Cu-anode and a 2D-detector; for detailed results, see Table S6. For peak fitting, we used two different models: a pseudo-Voigt function, accounting for asymmetric effects; and a symmetric model, which is similar to the model used by Curtis et al. (2019), who compiled a large data set of XRD data of opal-CT. Li-mica in one sample was separated from the hand specimen and mixed with NaCl to reduce texture effects.
1.3.4 Infrared spectroscopy (IR)
IR spectroscopy was used to assess the structural types of water and the presence of organic molecules in black opal. Spectra were measured in transmission mode in polished 0.22 mm thick slices prepared from samples BO-19-01 (dark brown), -02 (black), and BO-24-05; and in very thin, free conchoidal edges of opal chips, selected from different parts of samples BO-24-05 and BO-24-01. Due to the very high intensity of the main broad band of H2O centered at ∼ 3400 cm−1, good quality IR spectra were obtained after thinning the opal platelets (prepared from the thin section blocks by grinding) to < 0.08 mm. For comparison, all spectra shown in the figures were recalculated to 1 cm thickness. Band assignment was made according to Graetsch et al. (1985), Langer and Flörke (1974), Li et al. (2022), Newman et al. (1986), and King et al. (2002).
A Bruker FTIR spectrometer IFS 66 equipped with an IR-microscope was used to obtain spectra at room temperature in the spectral range 7000–700 cm−1. Spectra were scanned at room temperature with a measuring spot of 60 µm in diameter, at a spectral resolution of 4 cm−1; the time-averaged signal was collected over 150–200 scans. The reference spectra were recorded in air.
1.3.5 μ-X-ray fluorescence (μXRF)
We used the μ-X-ray fluorescence energy-dispersive spectrometer “M4 Tornado” (Bruker Nano GmbH) at the MAGMA Lab, TU Berlin, for generating element maps for elements heavier than Na. A step width of 20–50 µm (equivalent to pixel size of the map) and an exposure time for each step of 20–100 ms were applied. The instrument is equipped with an Rh anode and a microfocus X-ray tube with a Be window, and operated at 50 kV and 600 µA. Two 30 mm2 silicon-drift detectors allow for an energy resolution (for Mn Kα) of ≤ 145 eV.
1.3.6 U-Pb dating
Uranium-Pb dating was carried out on black opal from three samples (-02, -06, -07) by laser ablation inductively coupled sector field-mass spectrometry (LA-ICP-SF-MS) at the Karlsruhe Institute of Technology, using an ELEMENT XR (Thermo-Scientific) coupled to a 193 nm Excimer laser (Teledyne Photon Machines, Analyte Excite+). To achieve even laser ablation signals, and to minimize downhole fractionation, all opal domains and the reference material (NIST-SRM612 glass; Pearce et al., 1997) were ablated (after 3 s pre-ablation) for 15 s along lines with a speed rate of 30 µm s−1, using a round spot diameter of 135 µm, a laser repetition rate of 10 Hz, and a laser energy of 2.0 J cm−2. Additional instrument parameters and the dating results are listed in Tables S4 and S5.
2.1 Microstructure
Black opal shows in its interior opaque filamentous and irregular objects (Figs. 2a, b, S5), opaque crystals (Fig. S5o), fluorite (Fig. S5f, j), and a globular matrix (Fig. S5l, m, n). In thin section, filaments are more intensely colored than the matrix (Fig. 2c). Some areas appear with a lighter color and an irregular outline (Fig. 2c, e). The sample with a brown crust (most intensely colored in thin section) also has crack-like, almost colorless features, crosscutting the sample. Brown areas in thin section show a lower (darker) contrast in BSE images (Fig. 2e), indicating a larger amount of light carbon atoms (indicative for OM and/or water).
In an enlarged BSE image of these brown and less colored areas (Figs. 3a, S12g–j), bright areas show a polydisperse, sphere-like structure (variable diameter ∼ 2 to 10 µm), some with a concentric structure with a dark core of OM (Fig. 3b). Brown areas also show spheres, less variable in diameter, arranged in a polygonal pattern and interstitial OM (Fig. 3c). The sharp (Fig. 2d, e) and stepped contact (Fig. 3a) between the zones and the contrasting microstructure indicate a primary phenomenon, not caused by alteration. Other samples show lepispheres (Fig. 3d–f) with a polygonal pattern, interstitial OM, and some small pyrite crystals. The slightly lower contrast in the core of the lepispheres indicates some OM. At the grain boundary to quartz, the lepispheres show a core, then a zone rich in OM, surrounded by solid opal (Fig. 3c).
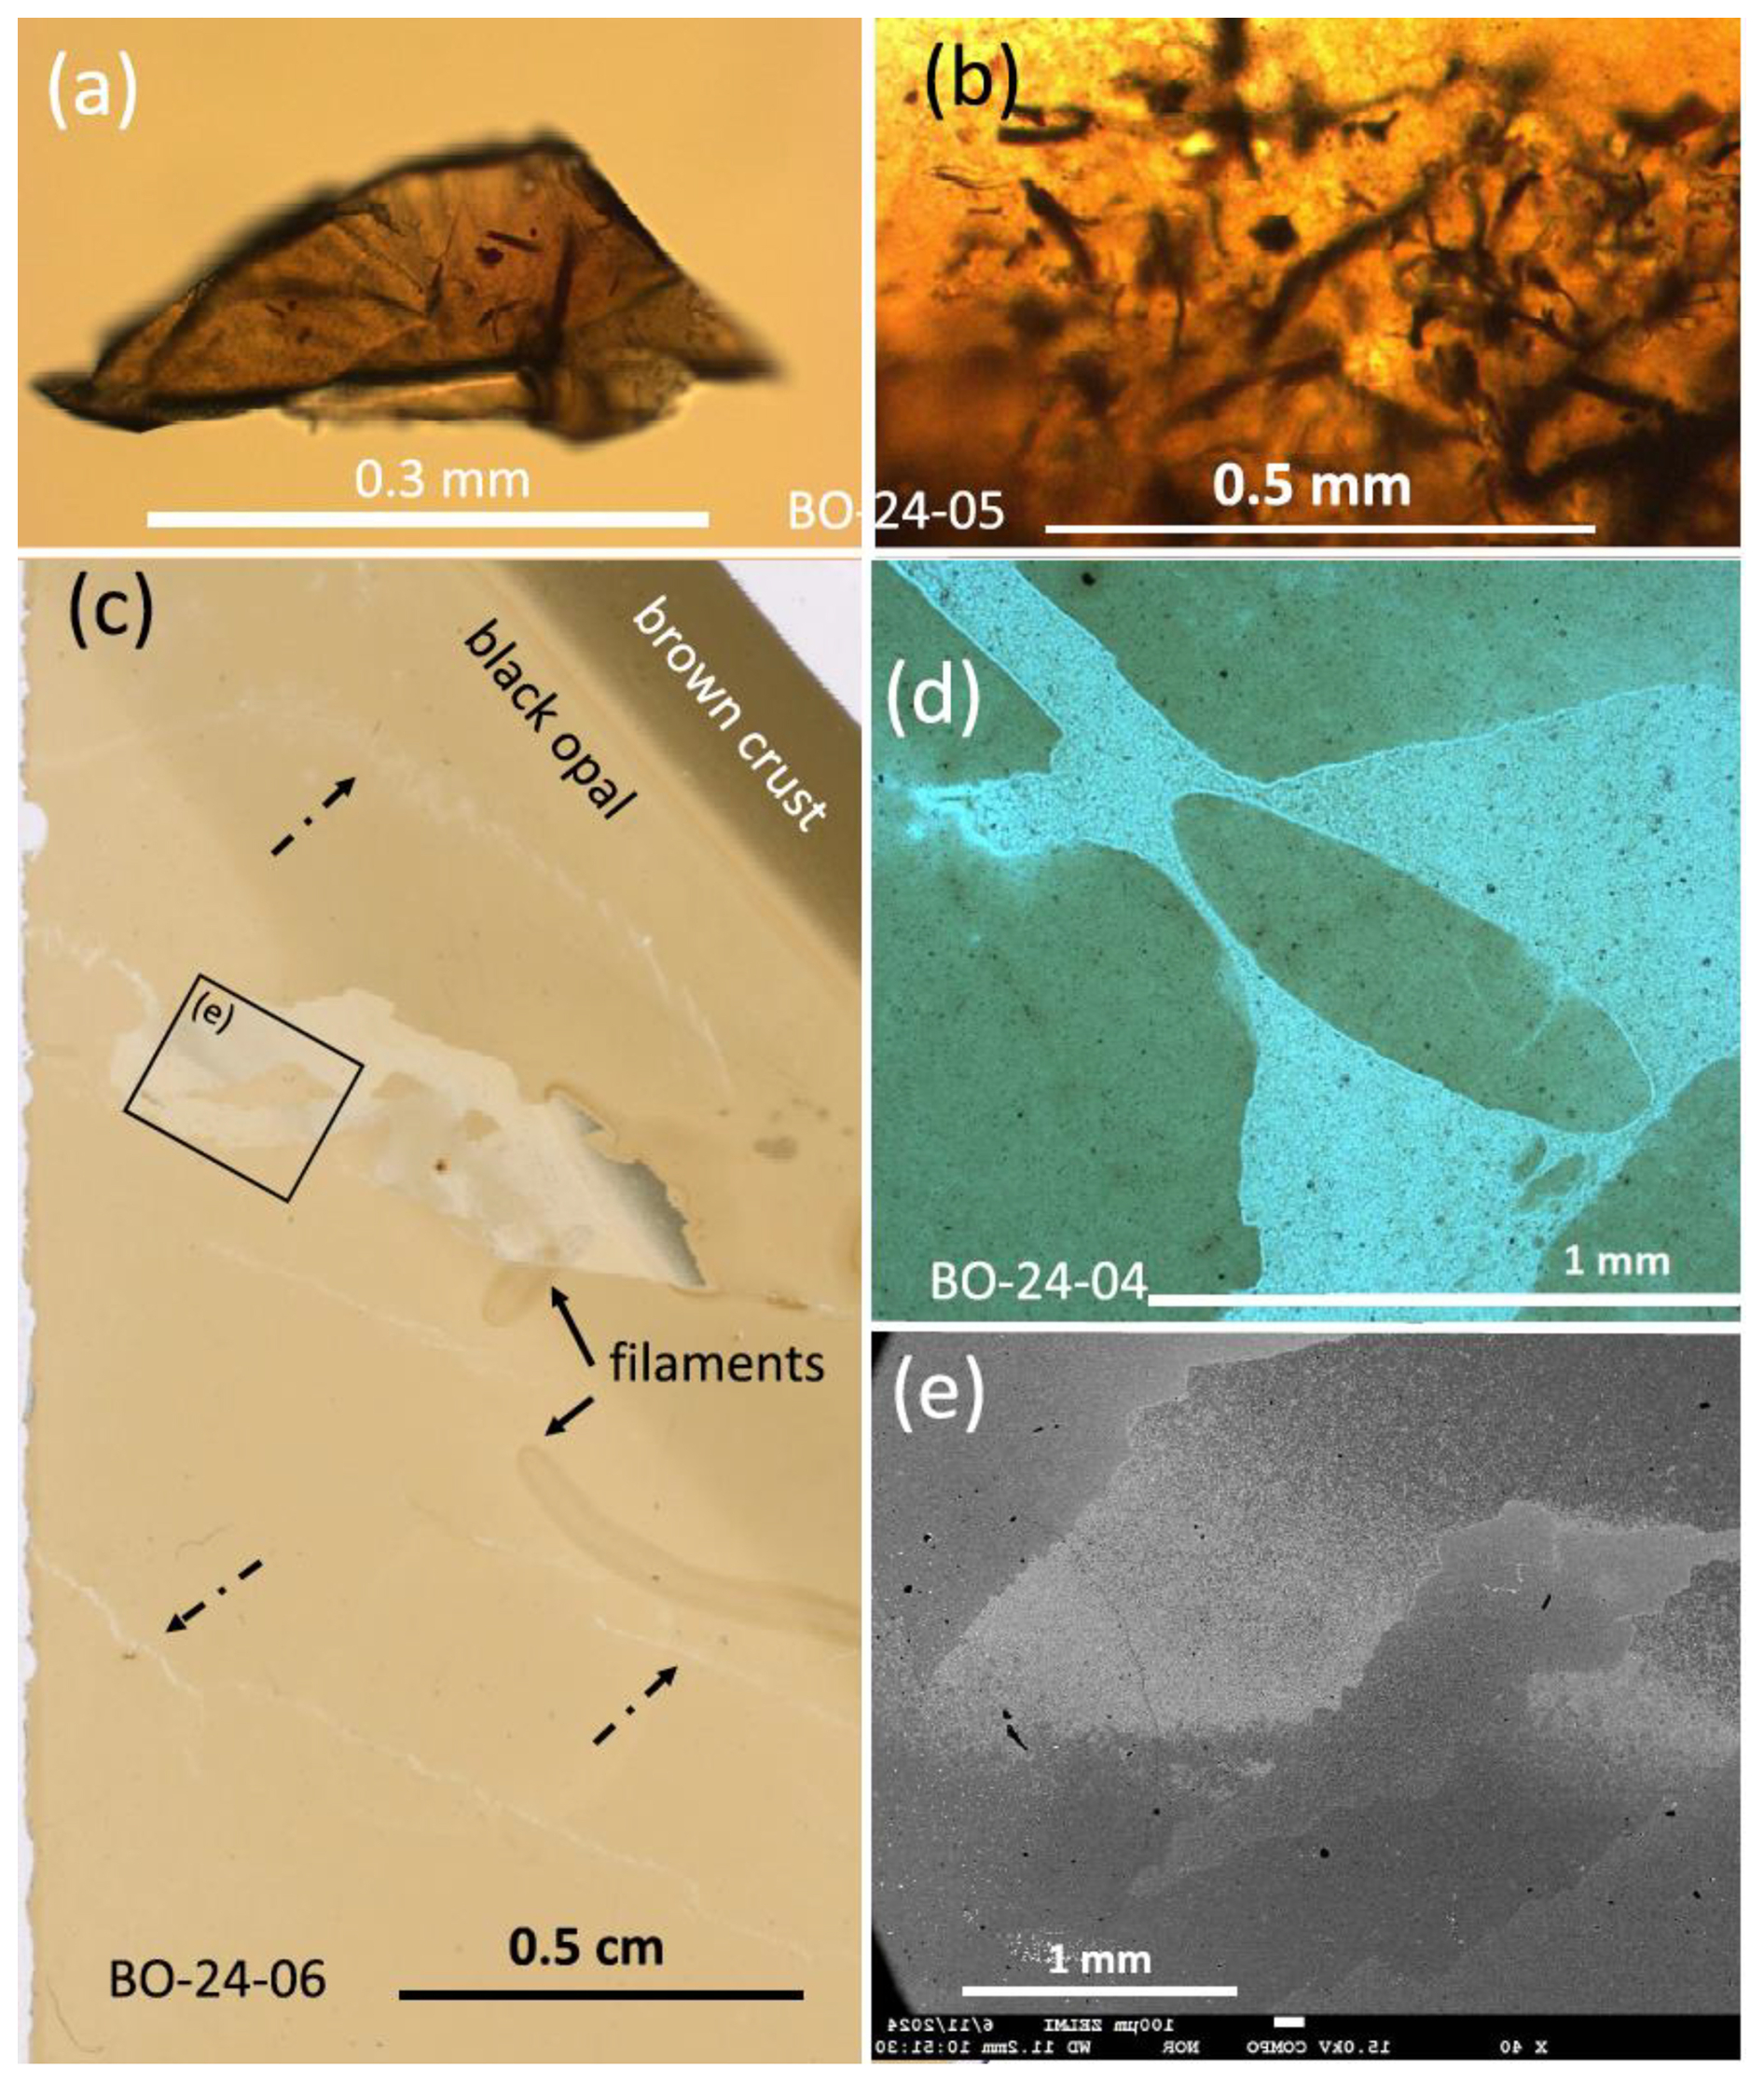
Figure 2Inclusions and microstructure of black opal (a, b). Microscope image of chips of black opal (sample 24-05), showing dark filamentous objects and irregularly shaped areas. (c) Scanned thin section of sample BO-24-06 with brown crust, filamentous objects (arrows), irregular light-brown areas, or crack-like features (dashed arrows). (d) Thin section photograph, showing dark- and light-brown areas, with small opaque-appearing pyrite crystals. (e) BSE image of area outlined in black frame in (c); brown areas appear with a darker contrast than white areas in BSE images.
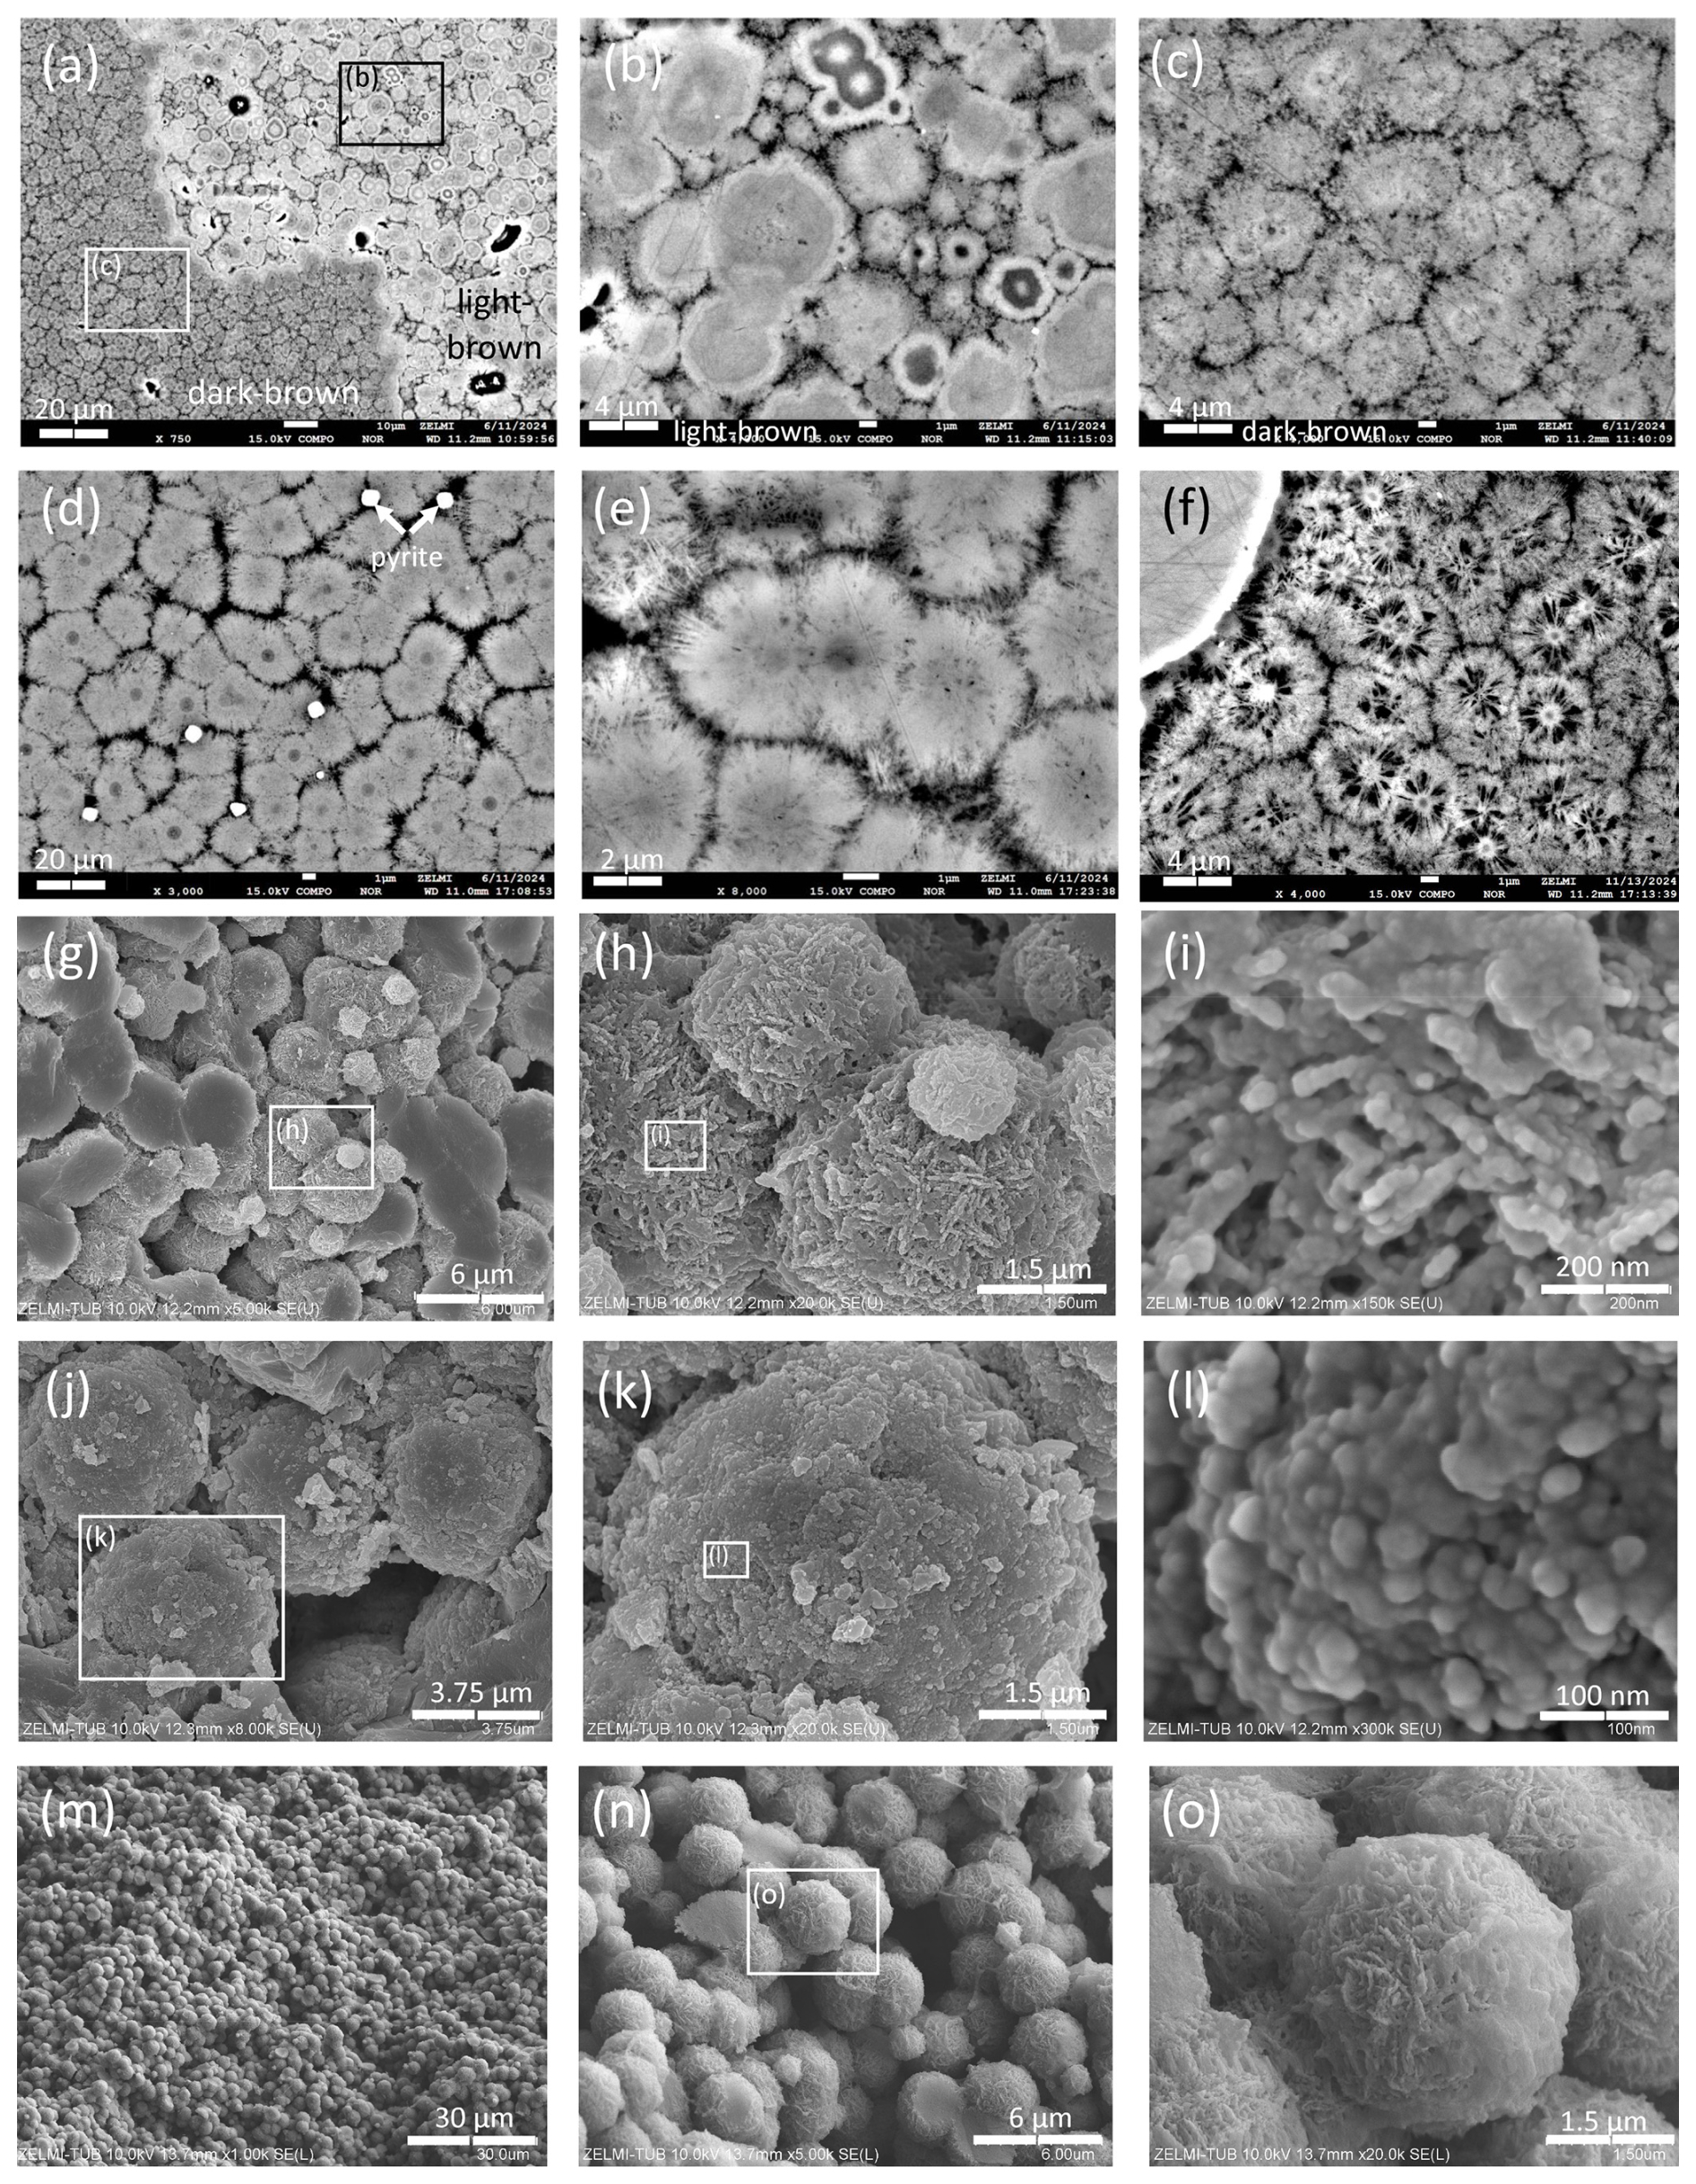
Figure 3Microstructure of black opal. BSE images (a–f) and SEM images (g–o) of black opal. (a) Areas with bright and dark contrast of light- and dark-brown colored areas; sample BO-24-06 (see Fig. 2c, e). Frames indicate the position of (b), showing the Si-rich area (see Fig. 4) with spheres of variable diameter and concentric structure, and (c) the brown area with OM between the partly irregularly formed spheres. (d, e) Lepispheres, surrounded by OM, with approximately 1-2 µm large pyrite crystals (sample BO-24-02). (f) Lepispheres at the contact to quartz (sample BO-24-03). (g) Broken surface, with approximately 4 µm and 1 µm large spheres (sample BO-24-06). (h) Detail of (g), with lepispheres (i) which consist of linearly arranged silica nanograins. (j) Spheres of similar size, approximately 4 µm large (sample BO-24-02), which (k, l) consist of irregularly arranged silica nanograins. (m–o) Brown crust (sample BO-24-06), showing the arrangement of lepispheres.
Under the SEM, freshly broken surfaces show that the lepispheres of variable diameter consist of linearly arranged silica nanograins (Fig. 3g–i). Spheres without clearly visible lepisphere structure also consist of nanograins (Fig. 3j–l). Both types of sphere show a rather high porosity. The brown alteration crust shows the irregular arrangement of the mostly monodisperse spheres (Fig. 3m), with a few smaller lepispheres (Fig. 3n). The EMPA mapping of element distribution (Fig. 4; additional mapping in Fig. S12w) shows that bright-appearing areas in BSE are enriched in Si and Ca. Carbon and S are concentrated around the opal spheres and in small dots. Iron is concentrated in pyrite crystals and very weakly enriched in the matrix.
The SEM images of the brown crust (sample BO-24-06; Figs. 3m, n, S7) show spheres of mostly equal diameter near 4–5 µm but also with some smaller spheres. There is no indication for a matrix of OM between the spheres, which is seen in BSE images of interior parts and in the element mapping (Fig. 4). The surface of a sphere (Fig. 3o) shows the arrangement of platelets.
Relict structures observed in several samples are filaments, appearing opaque under a microscope (Figs. 2a, b, S5d). In thin section (Fig. 2c), they are slightly darker than the opal matrix. In BSE images (Fig. 5), the contours between matrix and filament are not seen, indicating that the difference in composition between matrix and filament is low. What is evident in BSE, however, is an open channel (Fig. 5), which is very characteristic for the filamentous kerite fossils (Franz et al., 2023).
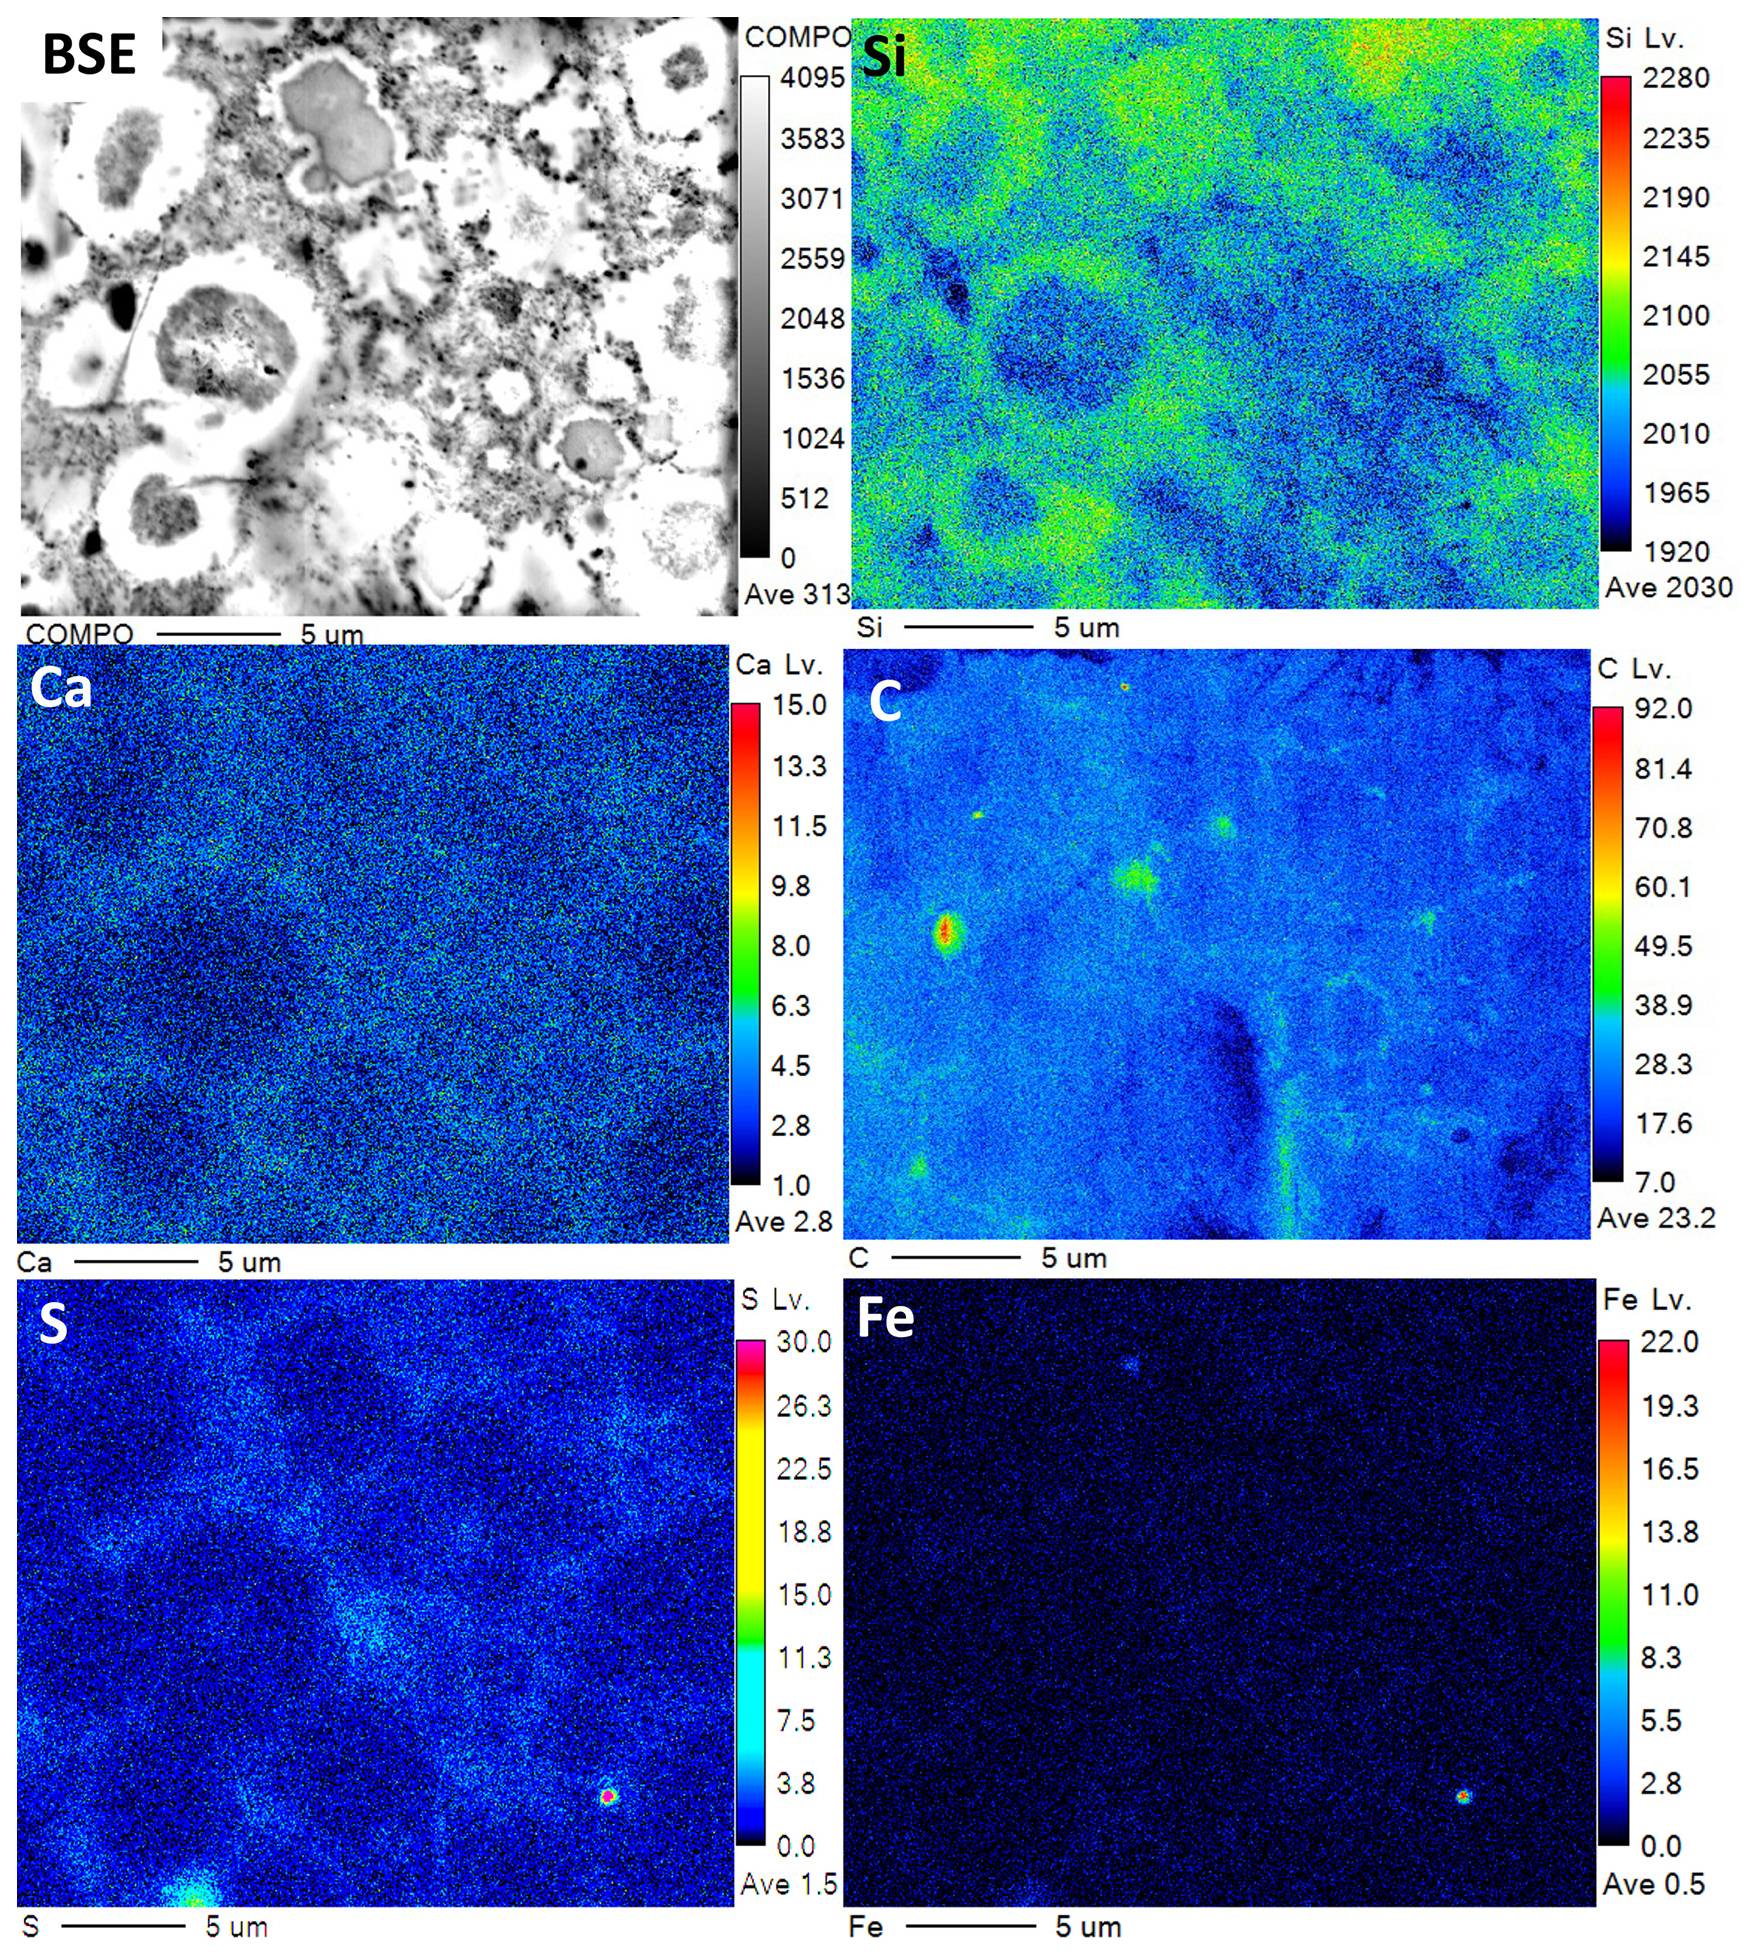
Figure 4Maps of EMPA element distribution, sample BO-24-06, and position of mapping in the BSE image. Bright areas in BSE are enriched in Si and Ca; C and S are concentrated in the matrix around the opal spheres and in small dots; and Fe is concentrated in pyrite crystals and very weakly enriched in the matrix.
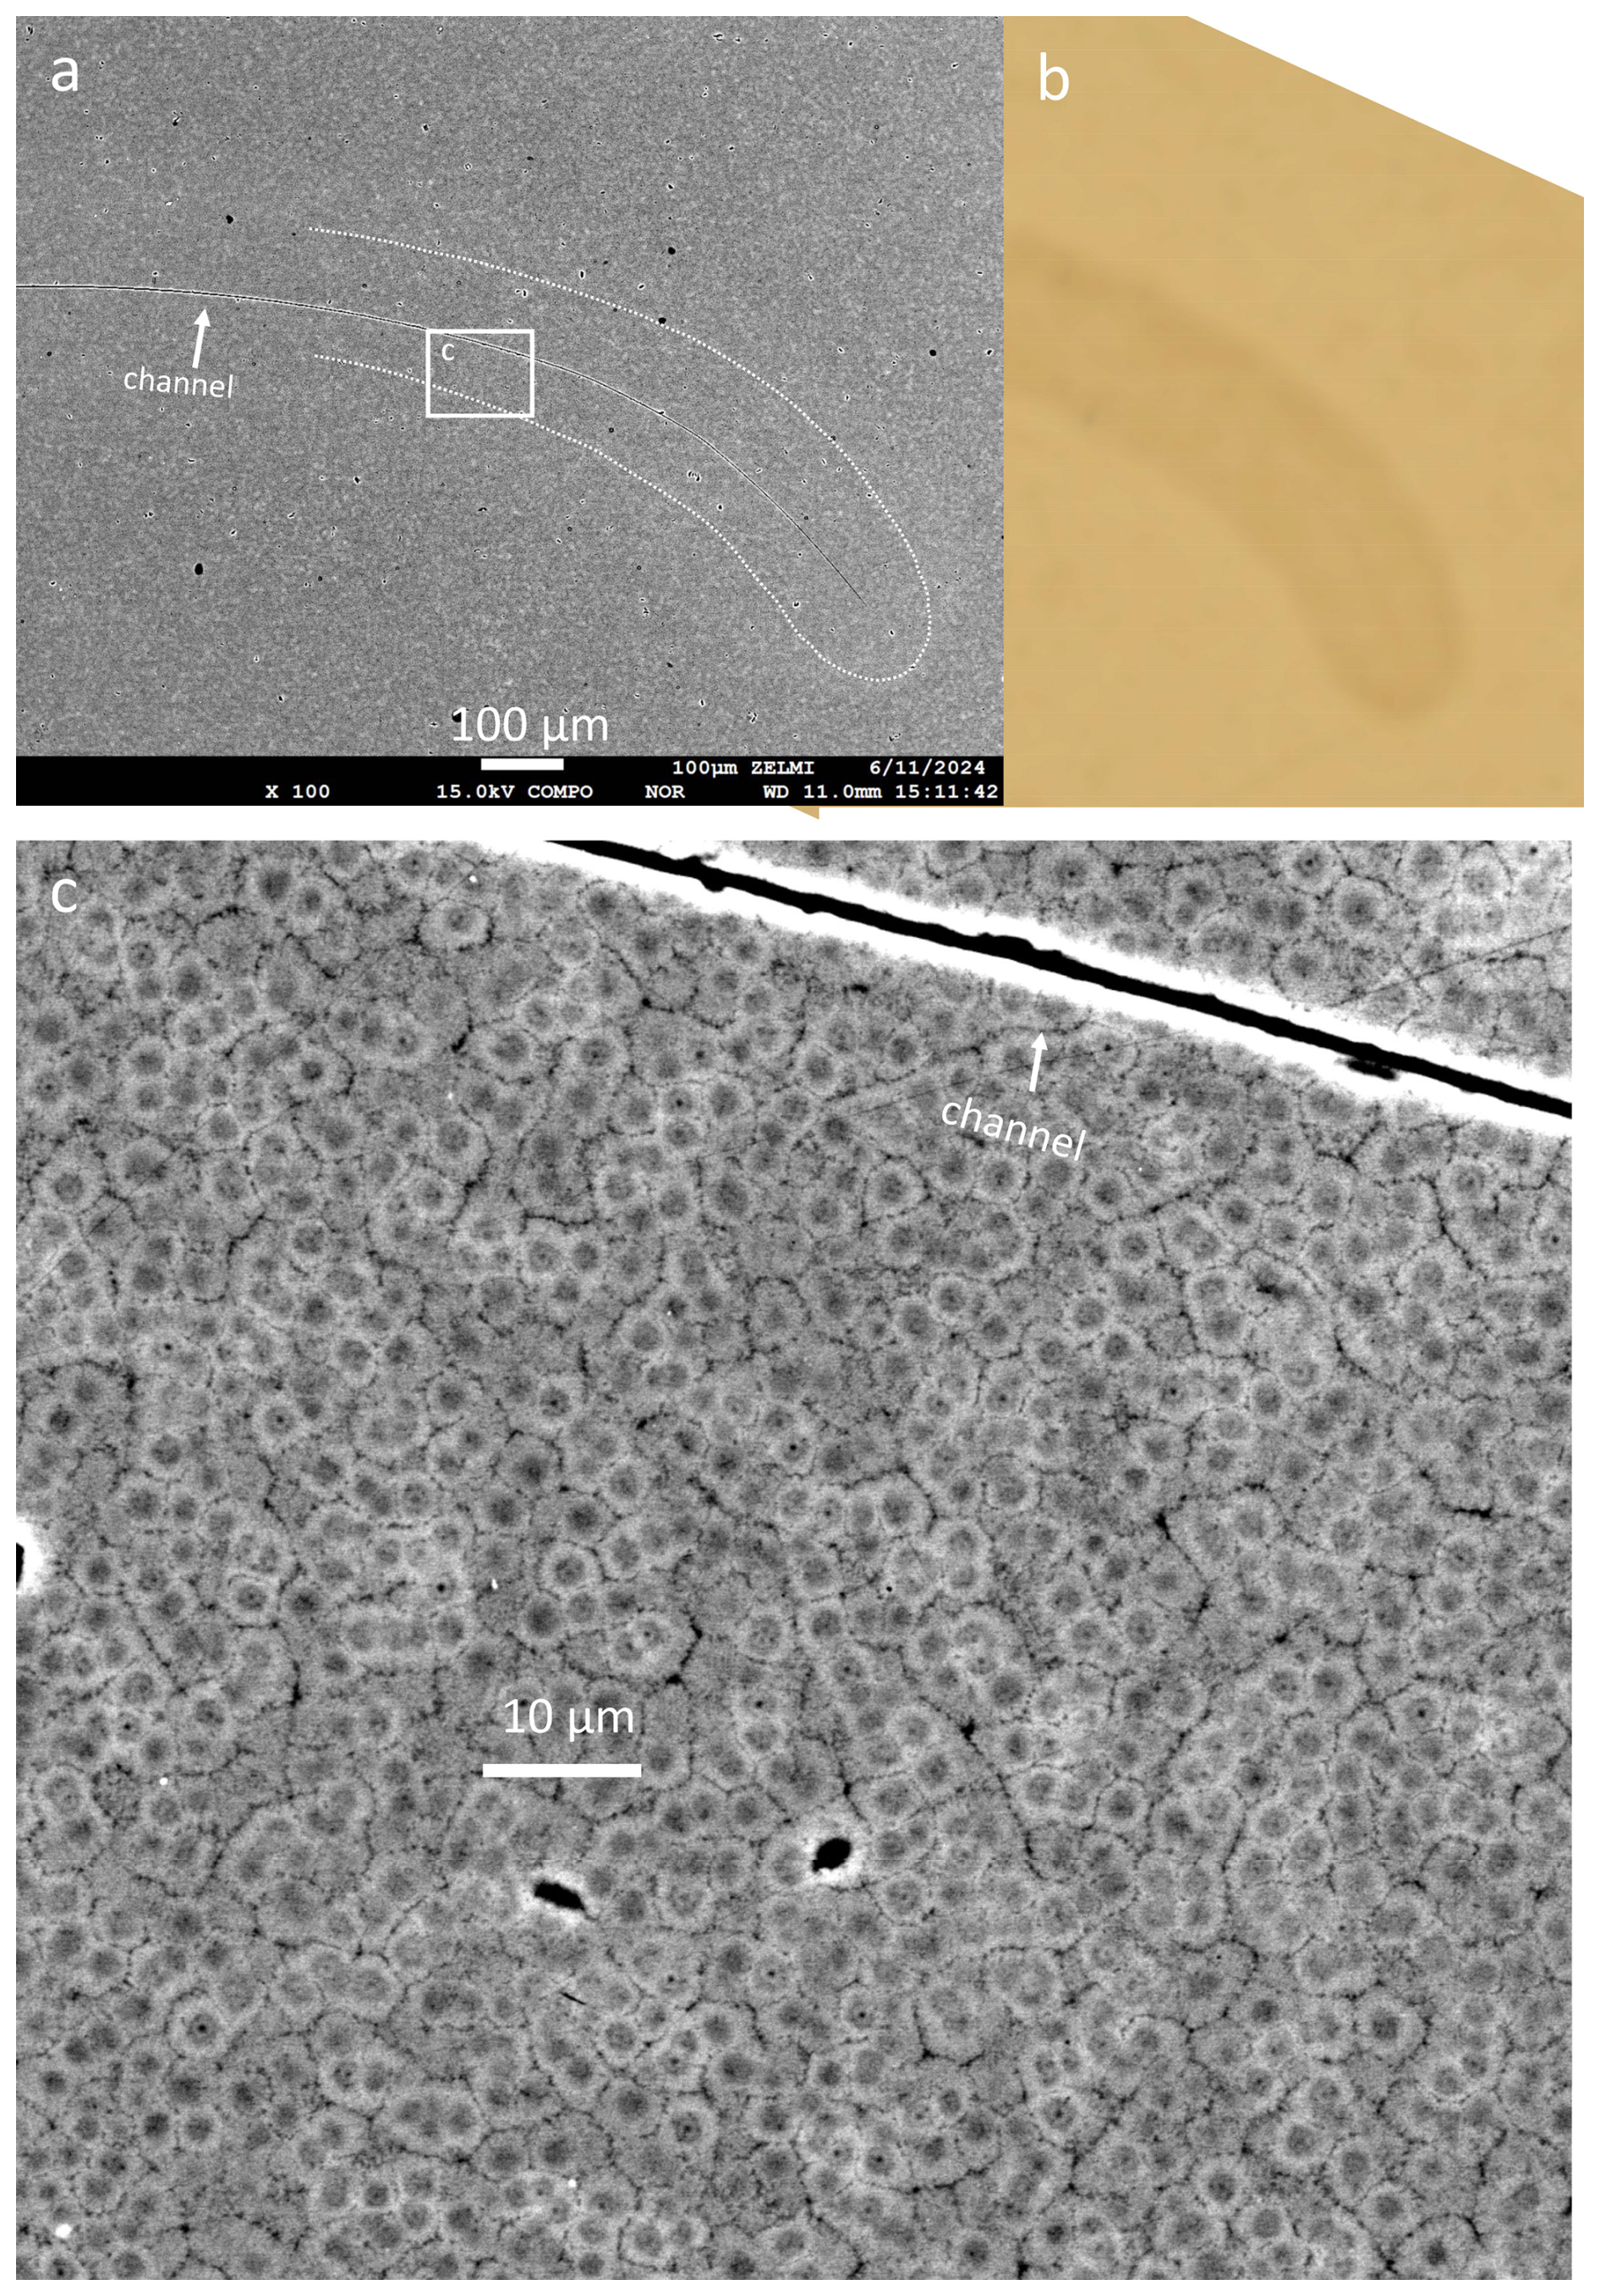
Figure 5(a) BSE image of the filament (partly outlined) with open channel (indicated by the white contrast due to the edge effect), compared to (b) the scanned thin section. (c) BSE image of the polygonal, monodisperse framework of opal and the open channel, characteristic of kerite fossils (sample BO-24-04).
Another relict object, observed in two samples (BO-24-04, -06), is a round structure of approximately 100 µm diameter (Fig. 6). In thin section, it appears with a dark-brown halo with a less colored rim (Fig. 6f); in reflected light (Fig. 6g), this rim has a lower reflectivity than the matrix. The central part of the object is filled with pyrite crystals, and the rim consists of platy SiO2 (Fig. 6a, c). The matrix near to this object does not show the typical spherical structure of opal but irregular worm-like structures (Fig. 6c). The pyrite crystals inside the object are xenomorphic (in contrast to pyrite in the matrix, and at the contact to rock matrix and relict minerals; see below) and contain inclusions of BaSO4 (Figs. 6d, e, S11a, g).
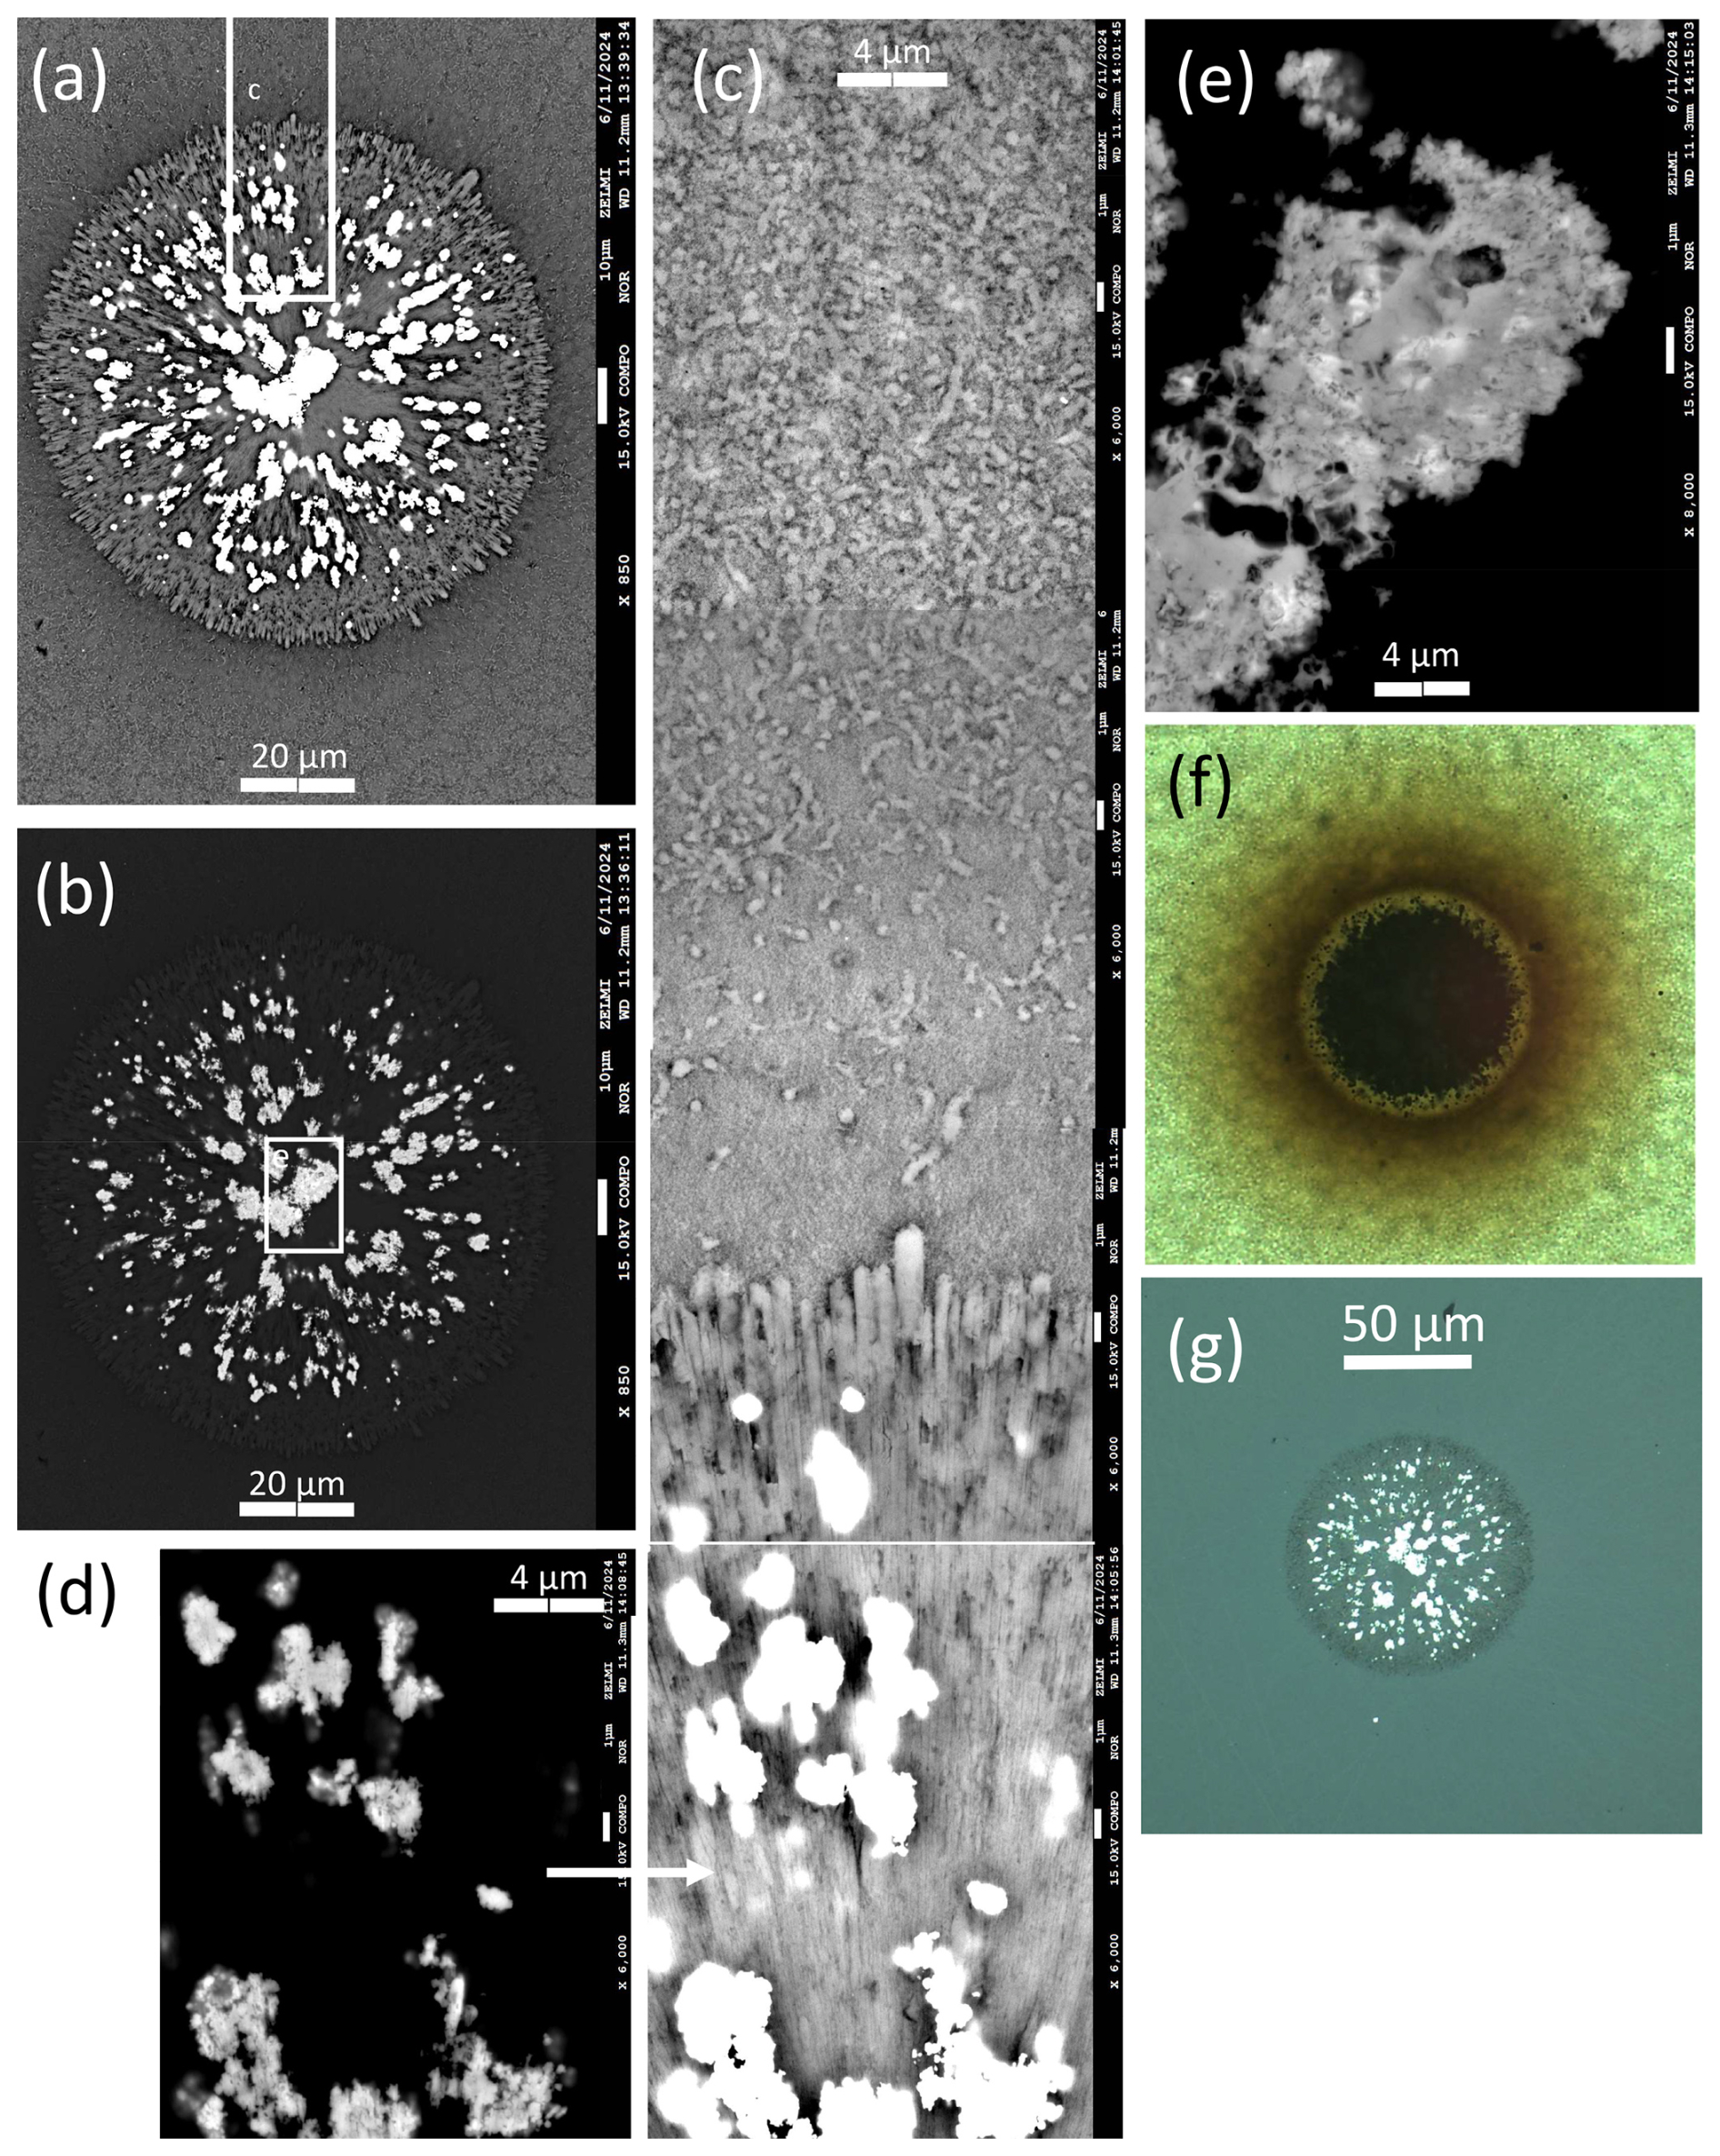
Figure 6BSE images of round relict object, sample BO-24-04. (a) Contrast adjusted to highlight the platy silica crystals and (b) to highlight the pyrite crystals. (c) Composite image of transverse from the black opal matrix (top) into the round object (bottom). (d) Contrast adjusted to highlight xenomorphic pyrite crystals near the center of the object (arrow). (e) Detail of xenomorphic pyrite; see frame in (b). In EDS spectra (Fig. S11p–r), bright-appearing areas show Ba peaks in addition to the S and Fe peaks of pyrite, indicating baryte. (f) Transmitted light, showing a dark-brown halo and comparison (g) in reflected light. Reflectivity is lowest in the rim.
The border zone between opal and rock, alkali-feldspar, and quartz exhibits characteristic phenomena. Pyrite crystals are enriched in this zone; these pyrite crystals are much larger (in the order of tens of µm; Fig. 7a–d) than those in the opal matrix (in the order of approximately 1 µm; Fig. 3d, e, l). The large pyrite crystals are zoned, with a core of pure pyrite and an oxidized rim (Figs. 7f, g, o, S8e, g, m–p, S10c, h, i). In one sample, there are also xenomorphic crystals of Fe oxide (Figs. 7g, i, S9g–j). Such a zone of pyrite enrichment was also found in the border to pure quartz (Fig. 7m), which makes the interpretation as a reaction zone between opal and rock unlikely. More likely, the boundary between opal and rock or quartz acted as a pathway for fluid infiltration and the alteration of opal. Quartz shows characteristic embayments (Fig. 7n), indicating some dissolution.
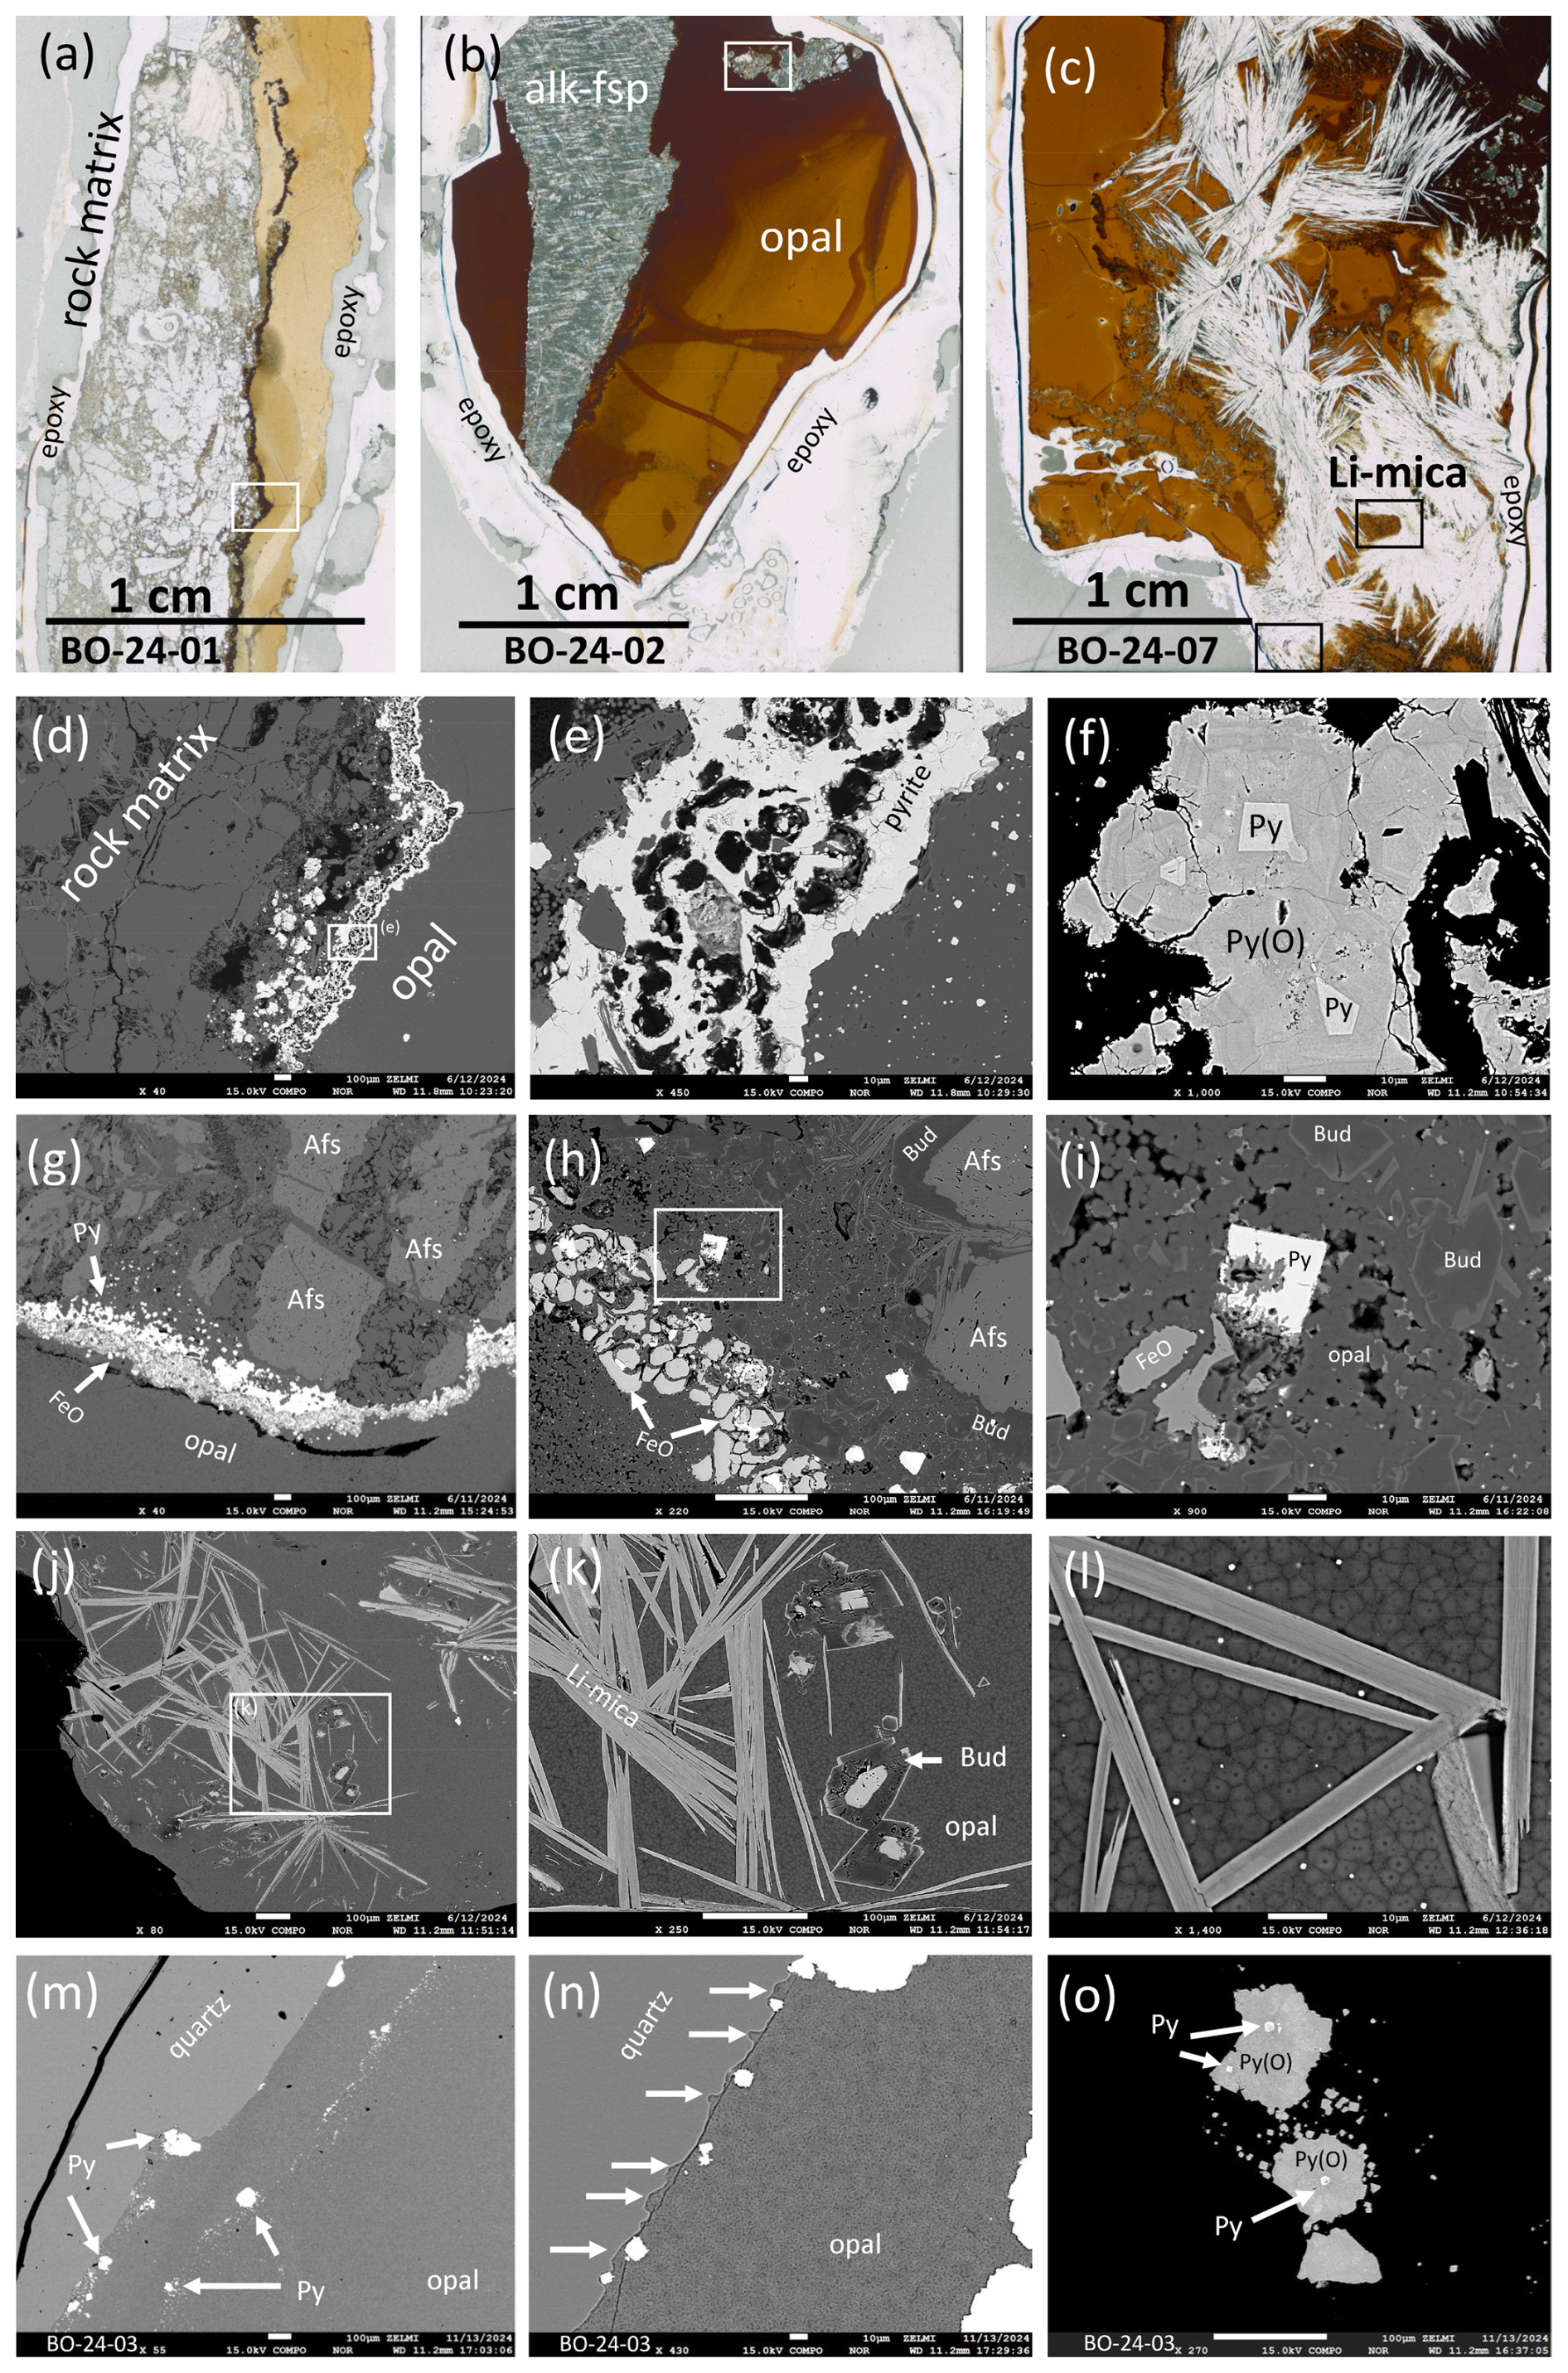
Figure 7(a, b, c) Scanned thin sections showing the border of brown opal to the rock matrix (a), alkali-feldspar (Afs) (b), and Li-mica (c). Frames indicate approximate positions of BSE images (d–l). (d) Rim of pyrite (Py), inset shows position of (e), pyrite in large crystals in the rim, and small pyrite in the opal near to the rim. (f) Large pyrite crystals consist of a rim of zoned, oxygen-bearing pyrite Py(O) with relict pure, euhedral pyrite (Py). (g) Rim of pyrite and Fe oxide (FeO) between alkali-feldspar and opal. (h) Detail of the rim in (g), buddingtonite (Bud) around alkali-feldspar, inset shows the position of (i). (i) Pyrite and Fe oxide with buddingtonite and opal in the matrix. (j) Opal with abundant Li-mica. (k) Buddingtonite with relict alkali-feldspar (white contrast) and Li-mica. (l) Li-mica, without signs of alteration next to opal. (m) Border area of opal to quartz, consisting of enrichment of large (arrows) and small pyrite crystals. (n) Quartz shows characteristic embayments (arrows) indicating dissolution. (o) Pyrite is oxygen bearing with relicts of pure pyrite.
In the sample with rock (Fig. 7h) and in the sample with Li-mica (Fig. 7j, k), alkali-feldspar shows a reaction rim of NH4-feldspar buddingtonite. The mica is the trioctahedral Li-mica F-polylithionite, as determined by XRD, and combined EMPA and laser ablation analysis (Table S7). The lattice constants are a0=5.210(6), b0=8.993(1), c0=10.073(4), and β = 100.39(8); impurities in the sample were pyrite, alkali-feldspar, and gypsum. The average simplified formula is (K1.862Rb0.068Na0.007Ca0.004)1.921(Al2.157Li3.645Fe0.235 Mn0.004)5.861[Si7.724Al0.271O22 F3.460OH0.540].
2.2 Chemical composition (EMPA) and μXRF element distribution
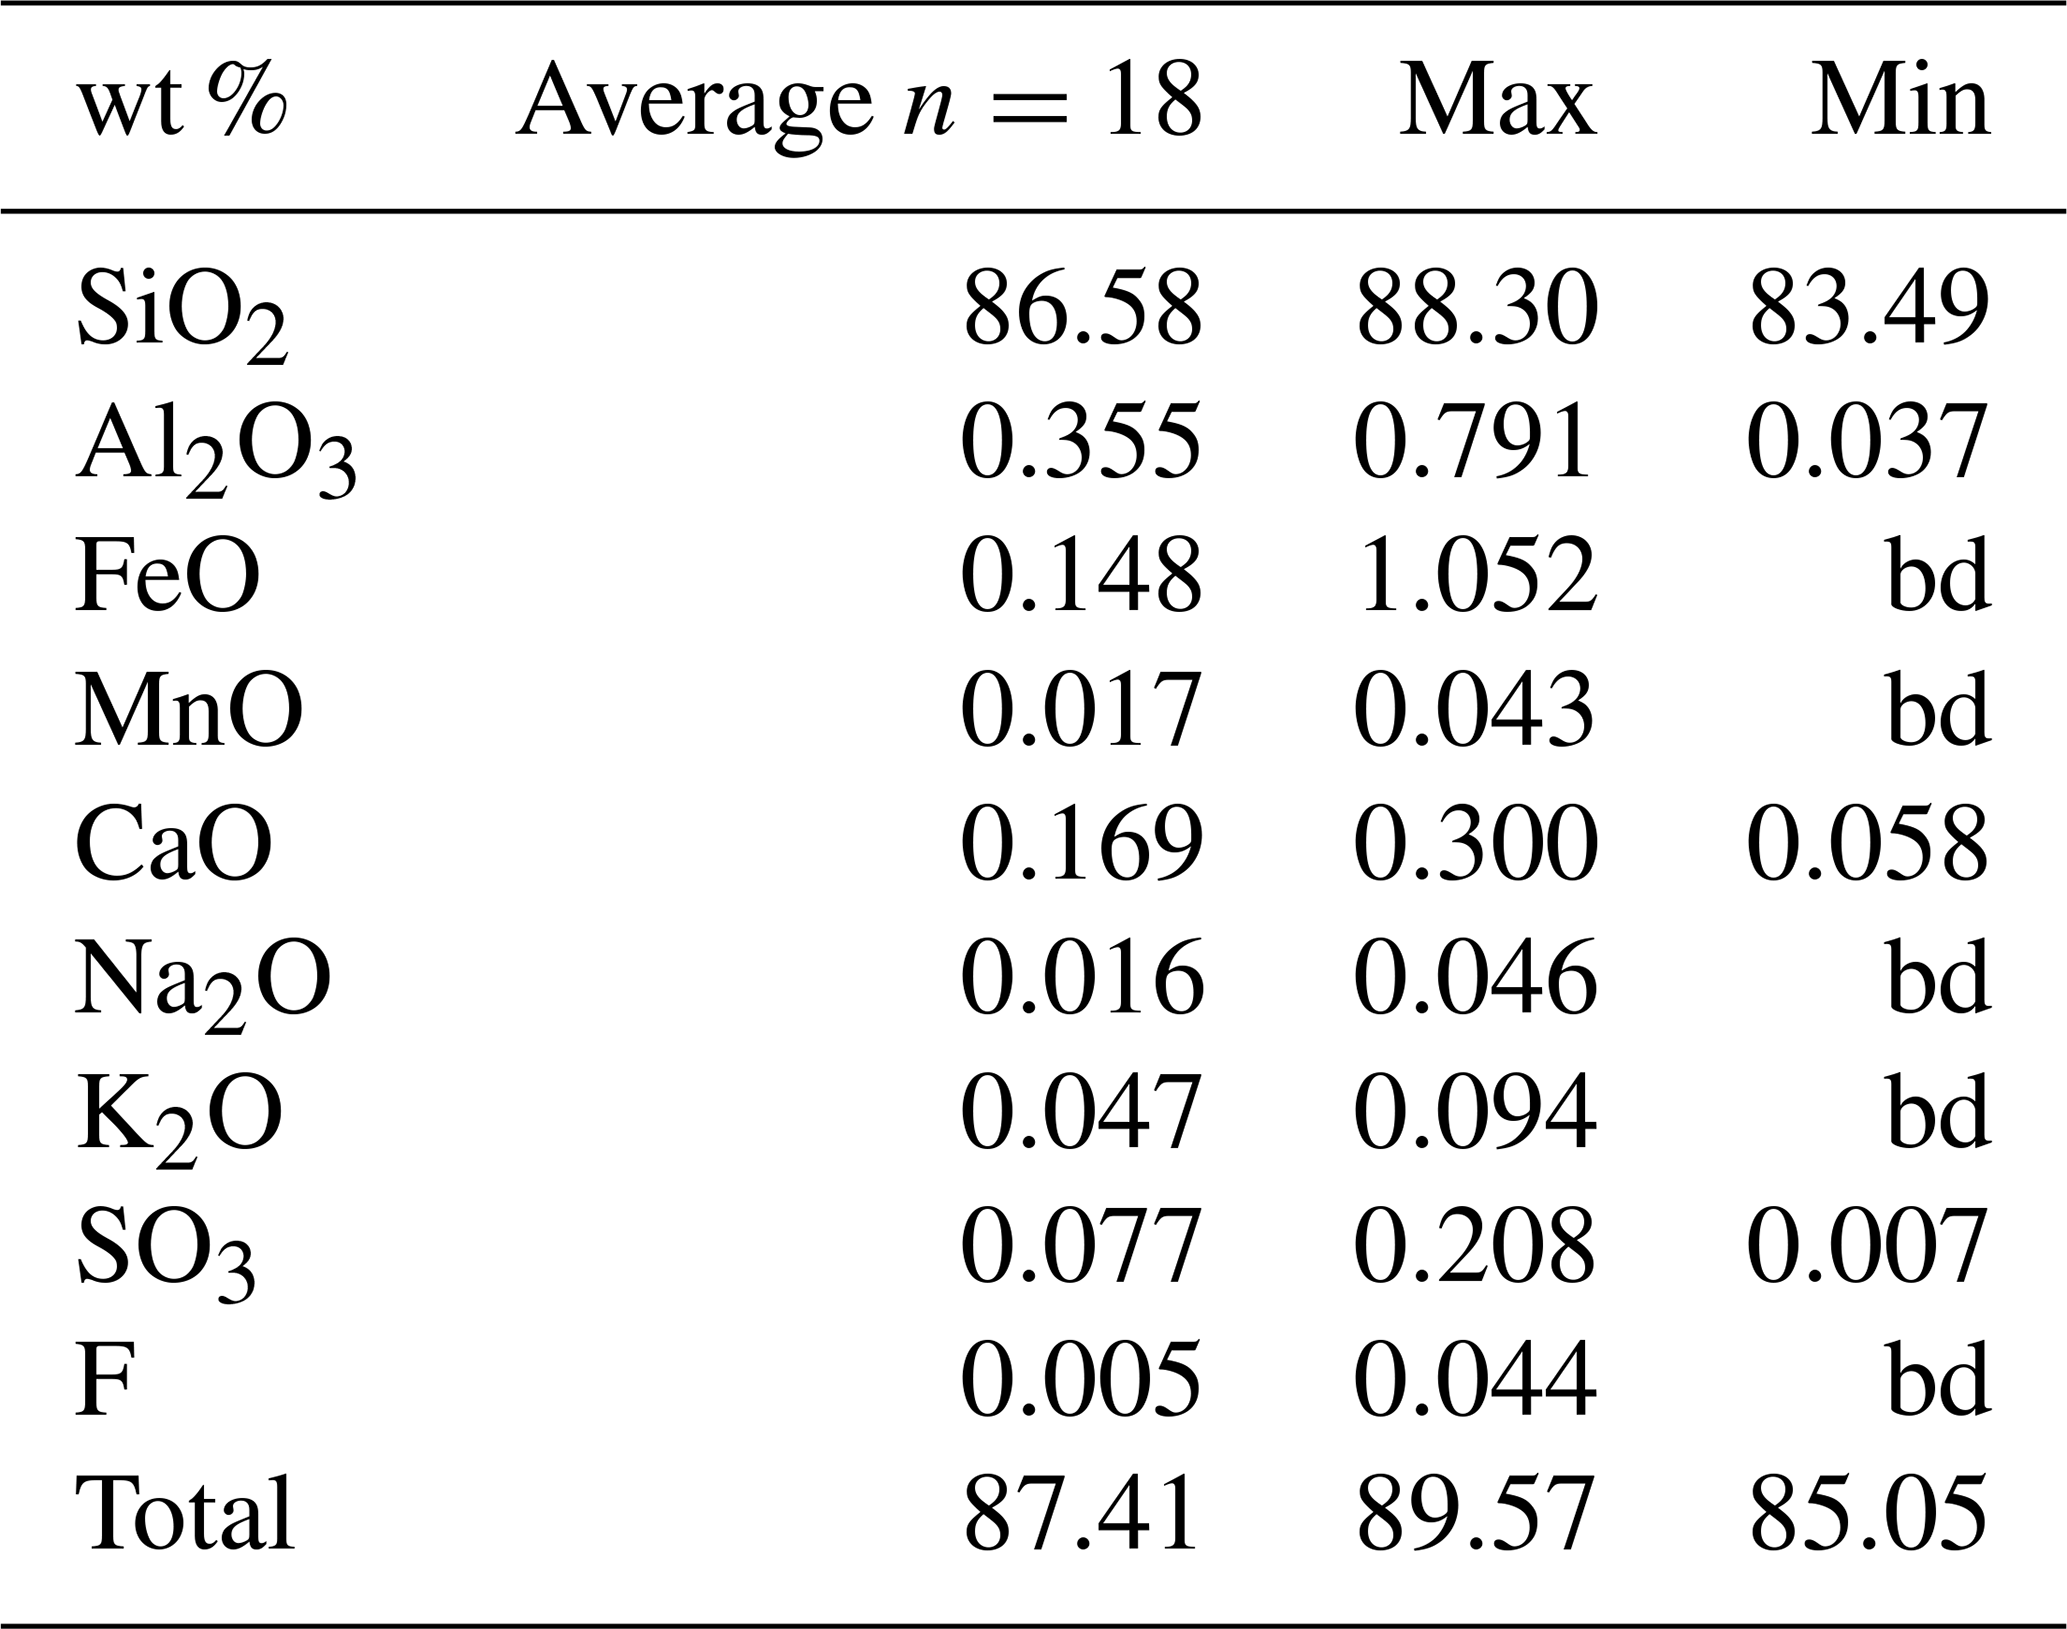
The chemical composition of black opal was measured in the sample with brown alteration crust (BO-24-06). The measured total of 85 wt % to 89 wt % indicates a rather high amount of H2O and OM; analyses at the crust show much lower totals, due to a high porosity, and these analyses are not included in the average (Tables 2, S7). Typical trace elements are Al, Fe, Mn, S, Na, K, and Ca. The sum of Na + K is well correlated with increasing amounts of Ca (Fig. 8).
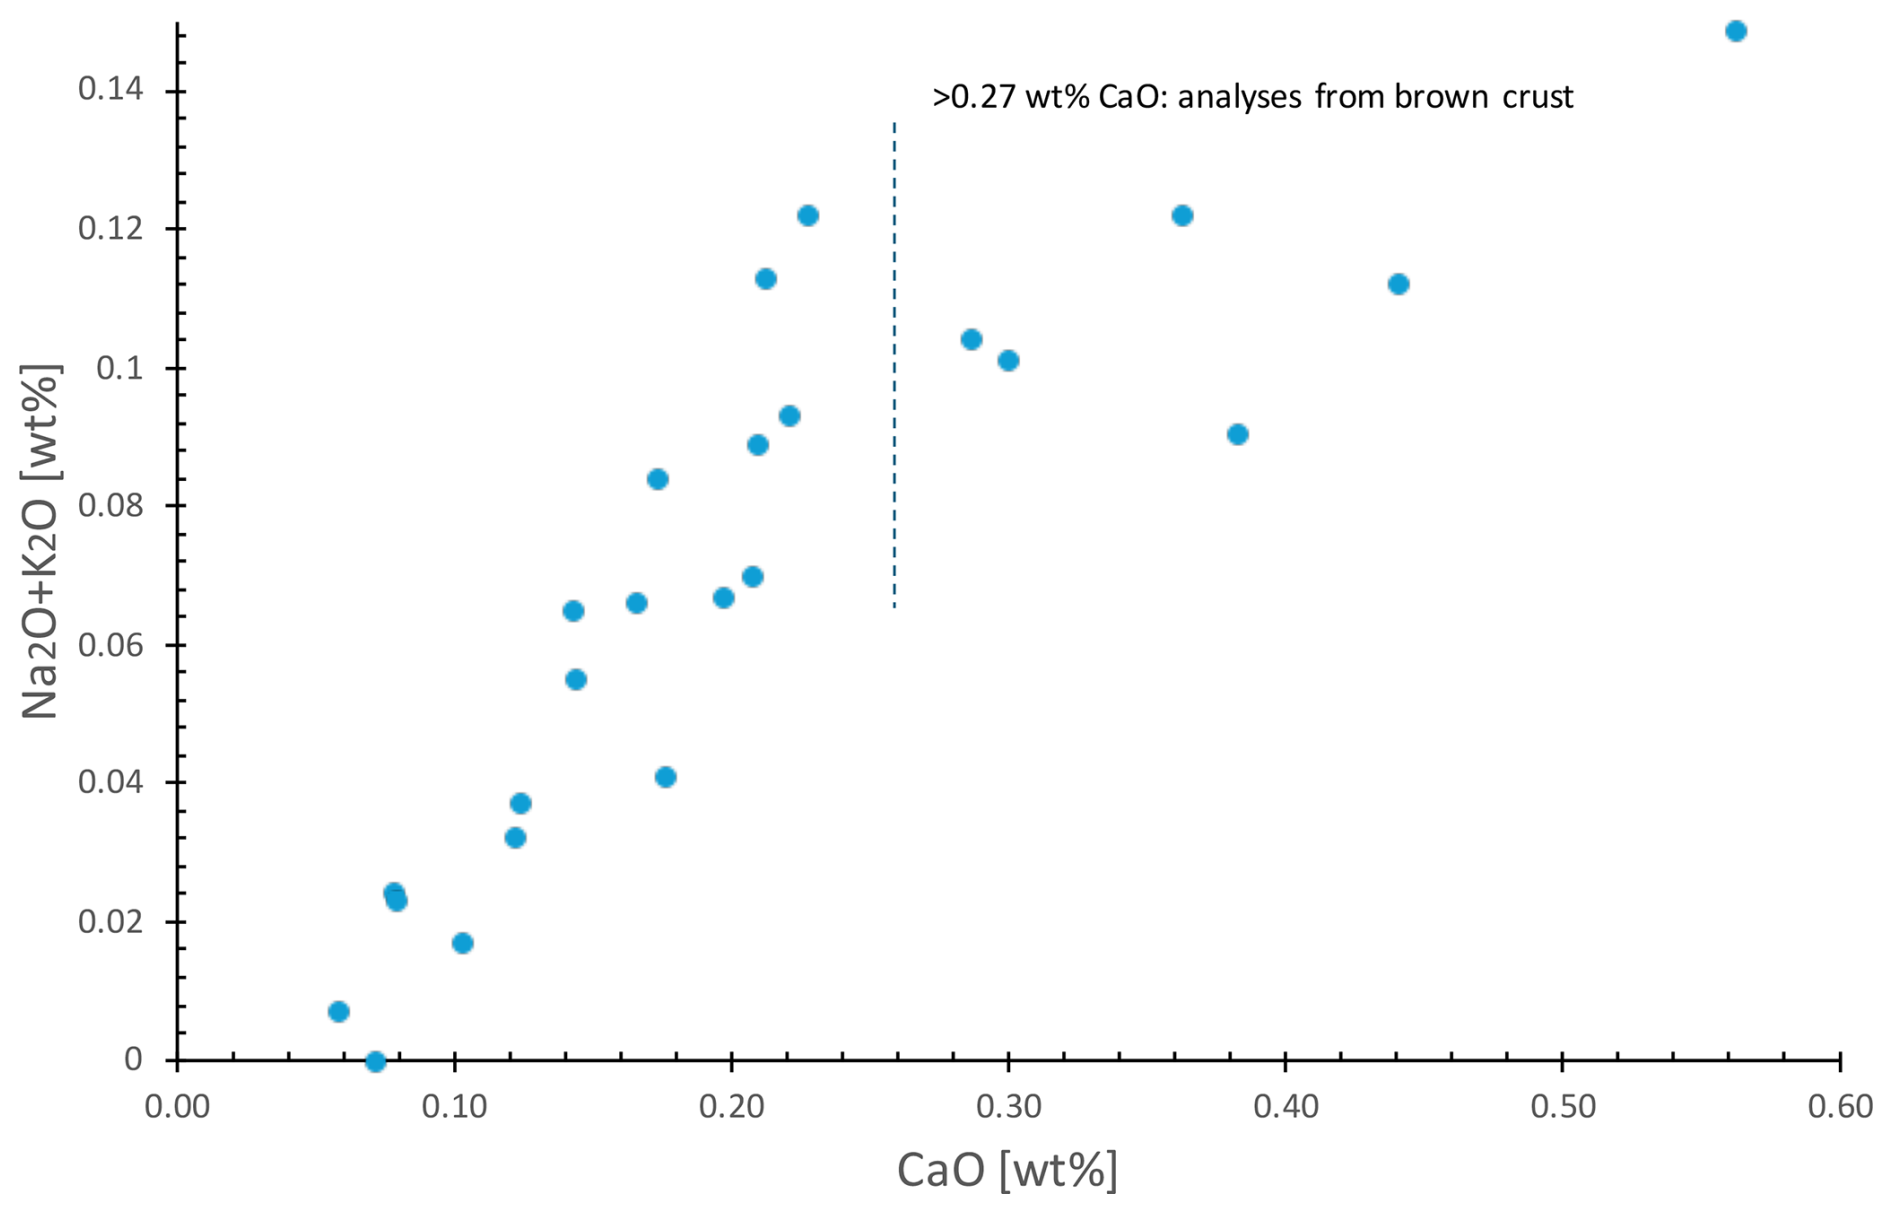
Figure 8Positive correlation of Na2O + K2O with CaO, up to a value of 0.27 wt % CaO; EMPA of black opal, sample BO-24-06, with brown alteration crust. The dashed line indicates position of the transition zone between the brown alteration crust.
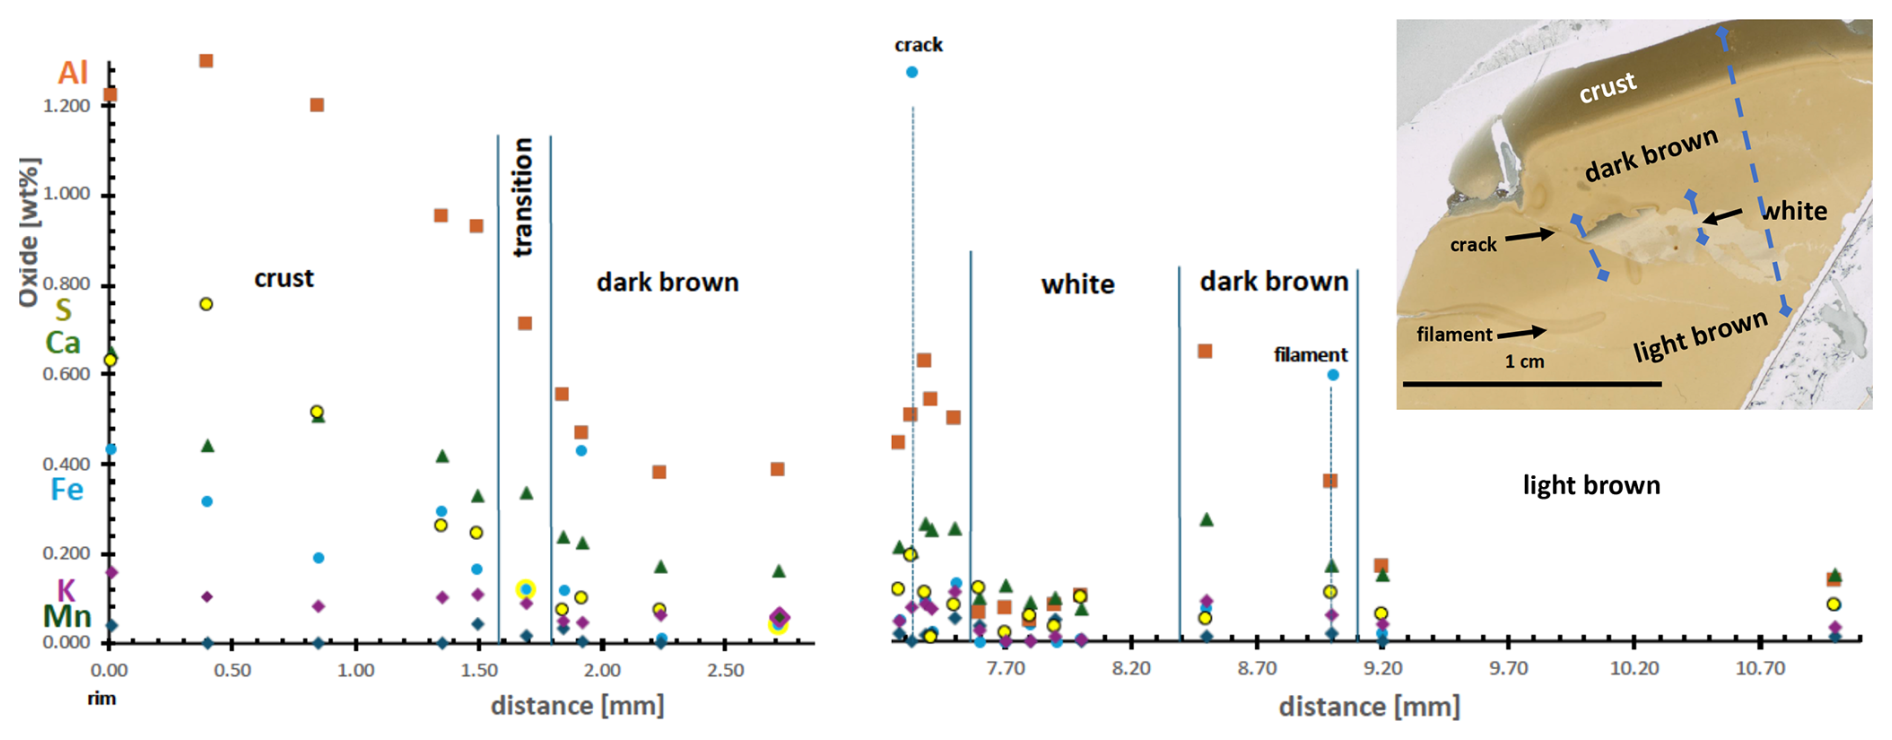
Figure 9EMPA data for sample BO-24-06, with brown crust (left) and areas with different color intensity (inset, scanned thin section, blue lines indicate approximate position of analyses). The crust is significantly enriched in all measured elements; white and light-brown areas are poor in Al and Ca. Fe is significantly enriched in a crack and also in a relict filament structure. All analyses corrected for total of 100 wt % analyzed oxides.
The differently colored zones were analyzed along an approximate profile from the crust into the sample (Fig. 9). The crust is enriched in all measured trace and minor elements; the least colored (“white”) areas have the lowest concentrations of these elements, similar to the light-brown area in the interior of the sample. In contrast, Fe concentrations are high near to a crack and the relict filament structure. These observations are in line with the element distribution as shown in the μXRF maps of sample BO-24-05 (Fig. 10c, d).
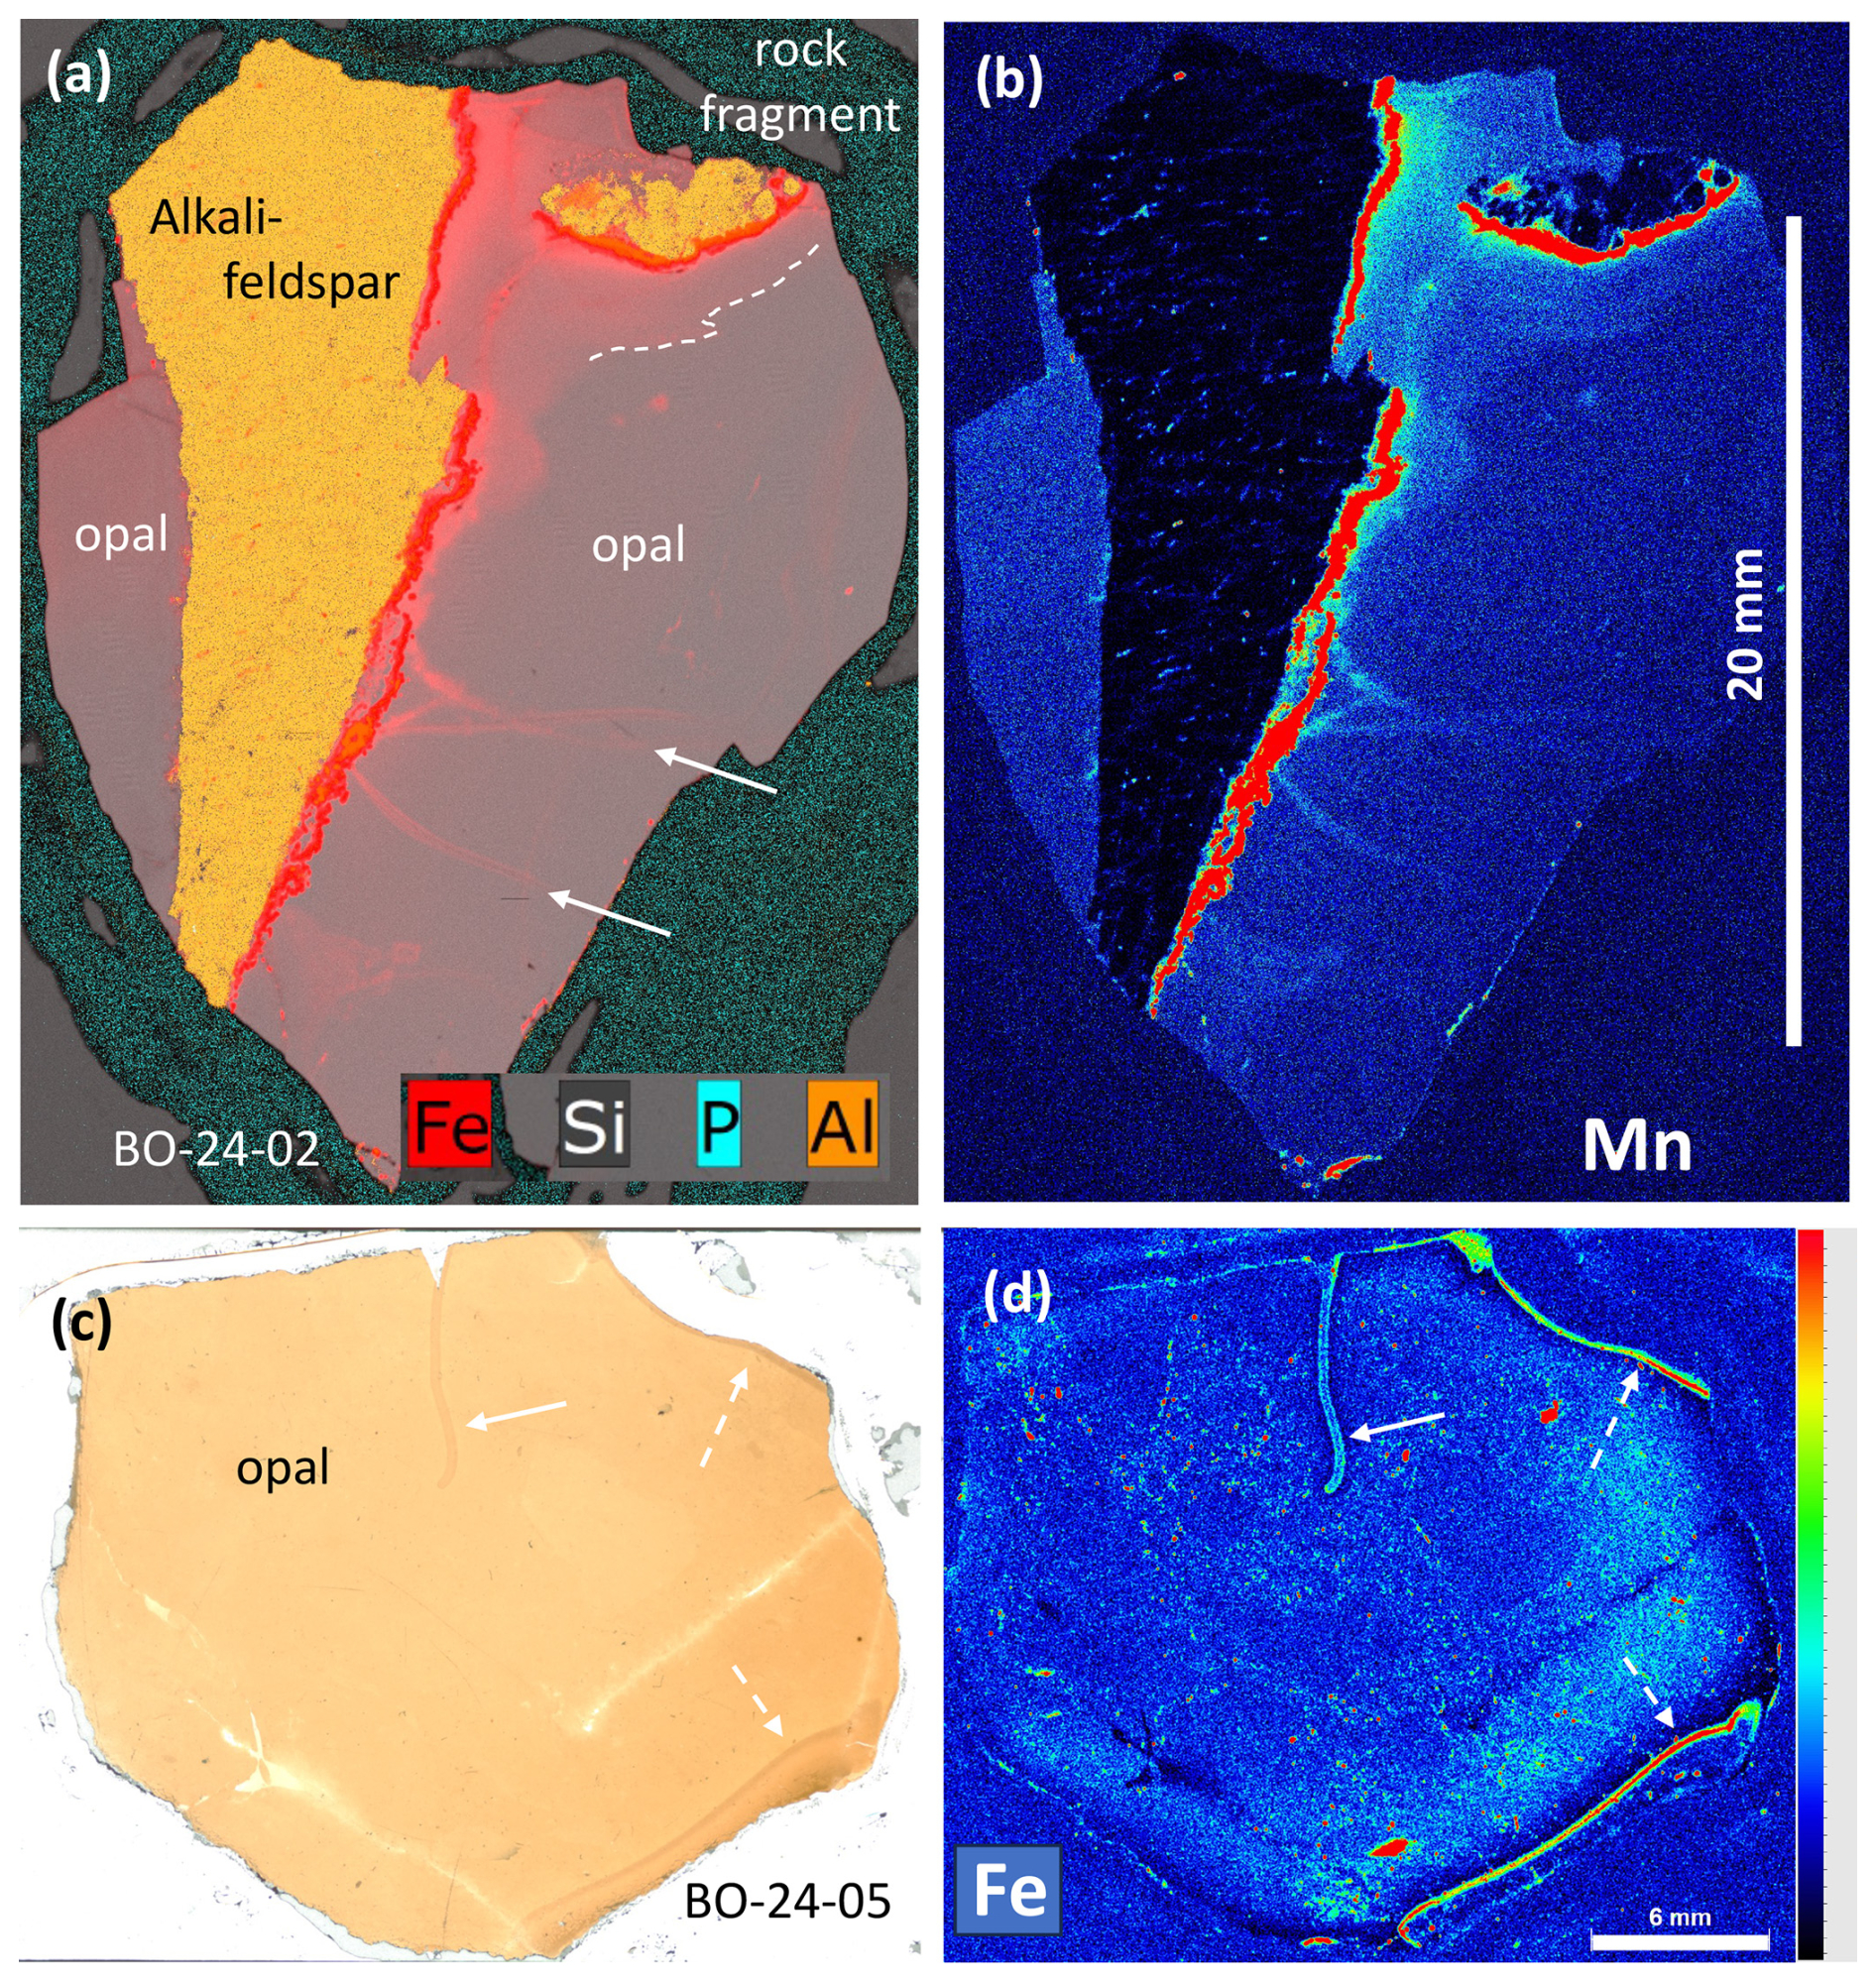
Figure 10Element distribution, measured with μXRF. (a, b) Combined Fe-Si-P-Al distribution of sample BO-24-02 with alkali-feldspar and rock fragment (see Fig. 7b for thin section image; color code in b as in d); P-distribution outlines epoxy around the sample. Dark-brown areas in thin section show a diffusion profile (partly outlined by the dashed line) of Fe (a) and Mn (b) from only one side of the grain. Arrows point to relict filamentous structures, which acted as pathways for the diffusion. (c) Thin section image of sample BO-24-04 and (d) Fe distribution. Solid arrow point to filamentous structure with a channel, enriched in Fe; dashed arrows point to Fe-enriched dark-brown rims, possibly an alteration phenomenon at the opal surface. Note that the colorless areas in thin section are almost free of Fe.
Dark-brown areas in thin section (Fig. 7b), extending from the boundary between alkali-feldspar and opal into opal (Fig. 10a, b), are enriched in Fe and Mn. The relict filament structure (Fig. 10c, d) is also enriched parallel to the open channel (Fig. 5). Pyrite in the rim has also high Mn contents. A thin, dark-brown crust is enriched in Fe (Fig. 10d), similar to the sample investigated by EMPA. Almost colorless (“white”) areas in thin section have a very low Fe content (in Fig. 10c, d; lower left). In the brown crust of the sample (complete set of μXRF maps in Fig. S15), Zn and S are enriched (Fig. S15b).
2.3 XRD
X-ray powder investigations were carried out to characterize black opal and to identify inclusions. Near 4 Å, the XRD pattern shows the three typical peaks for “complex CT-opal” (Curtis et al., 2019); P1 at 4.32 Å, P2 with maximum intensity at 4.13 Å, and the weakest peak at 4.01 Å (Fig. 11a, Table S6). Peak 4 is observed at 2.509 Å. The inclusions are dominantly pyrite, rare NH4-bearing muscovite (tobelite component), alkali-feldspar, and gypsum.
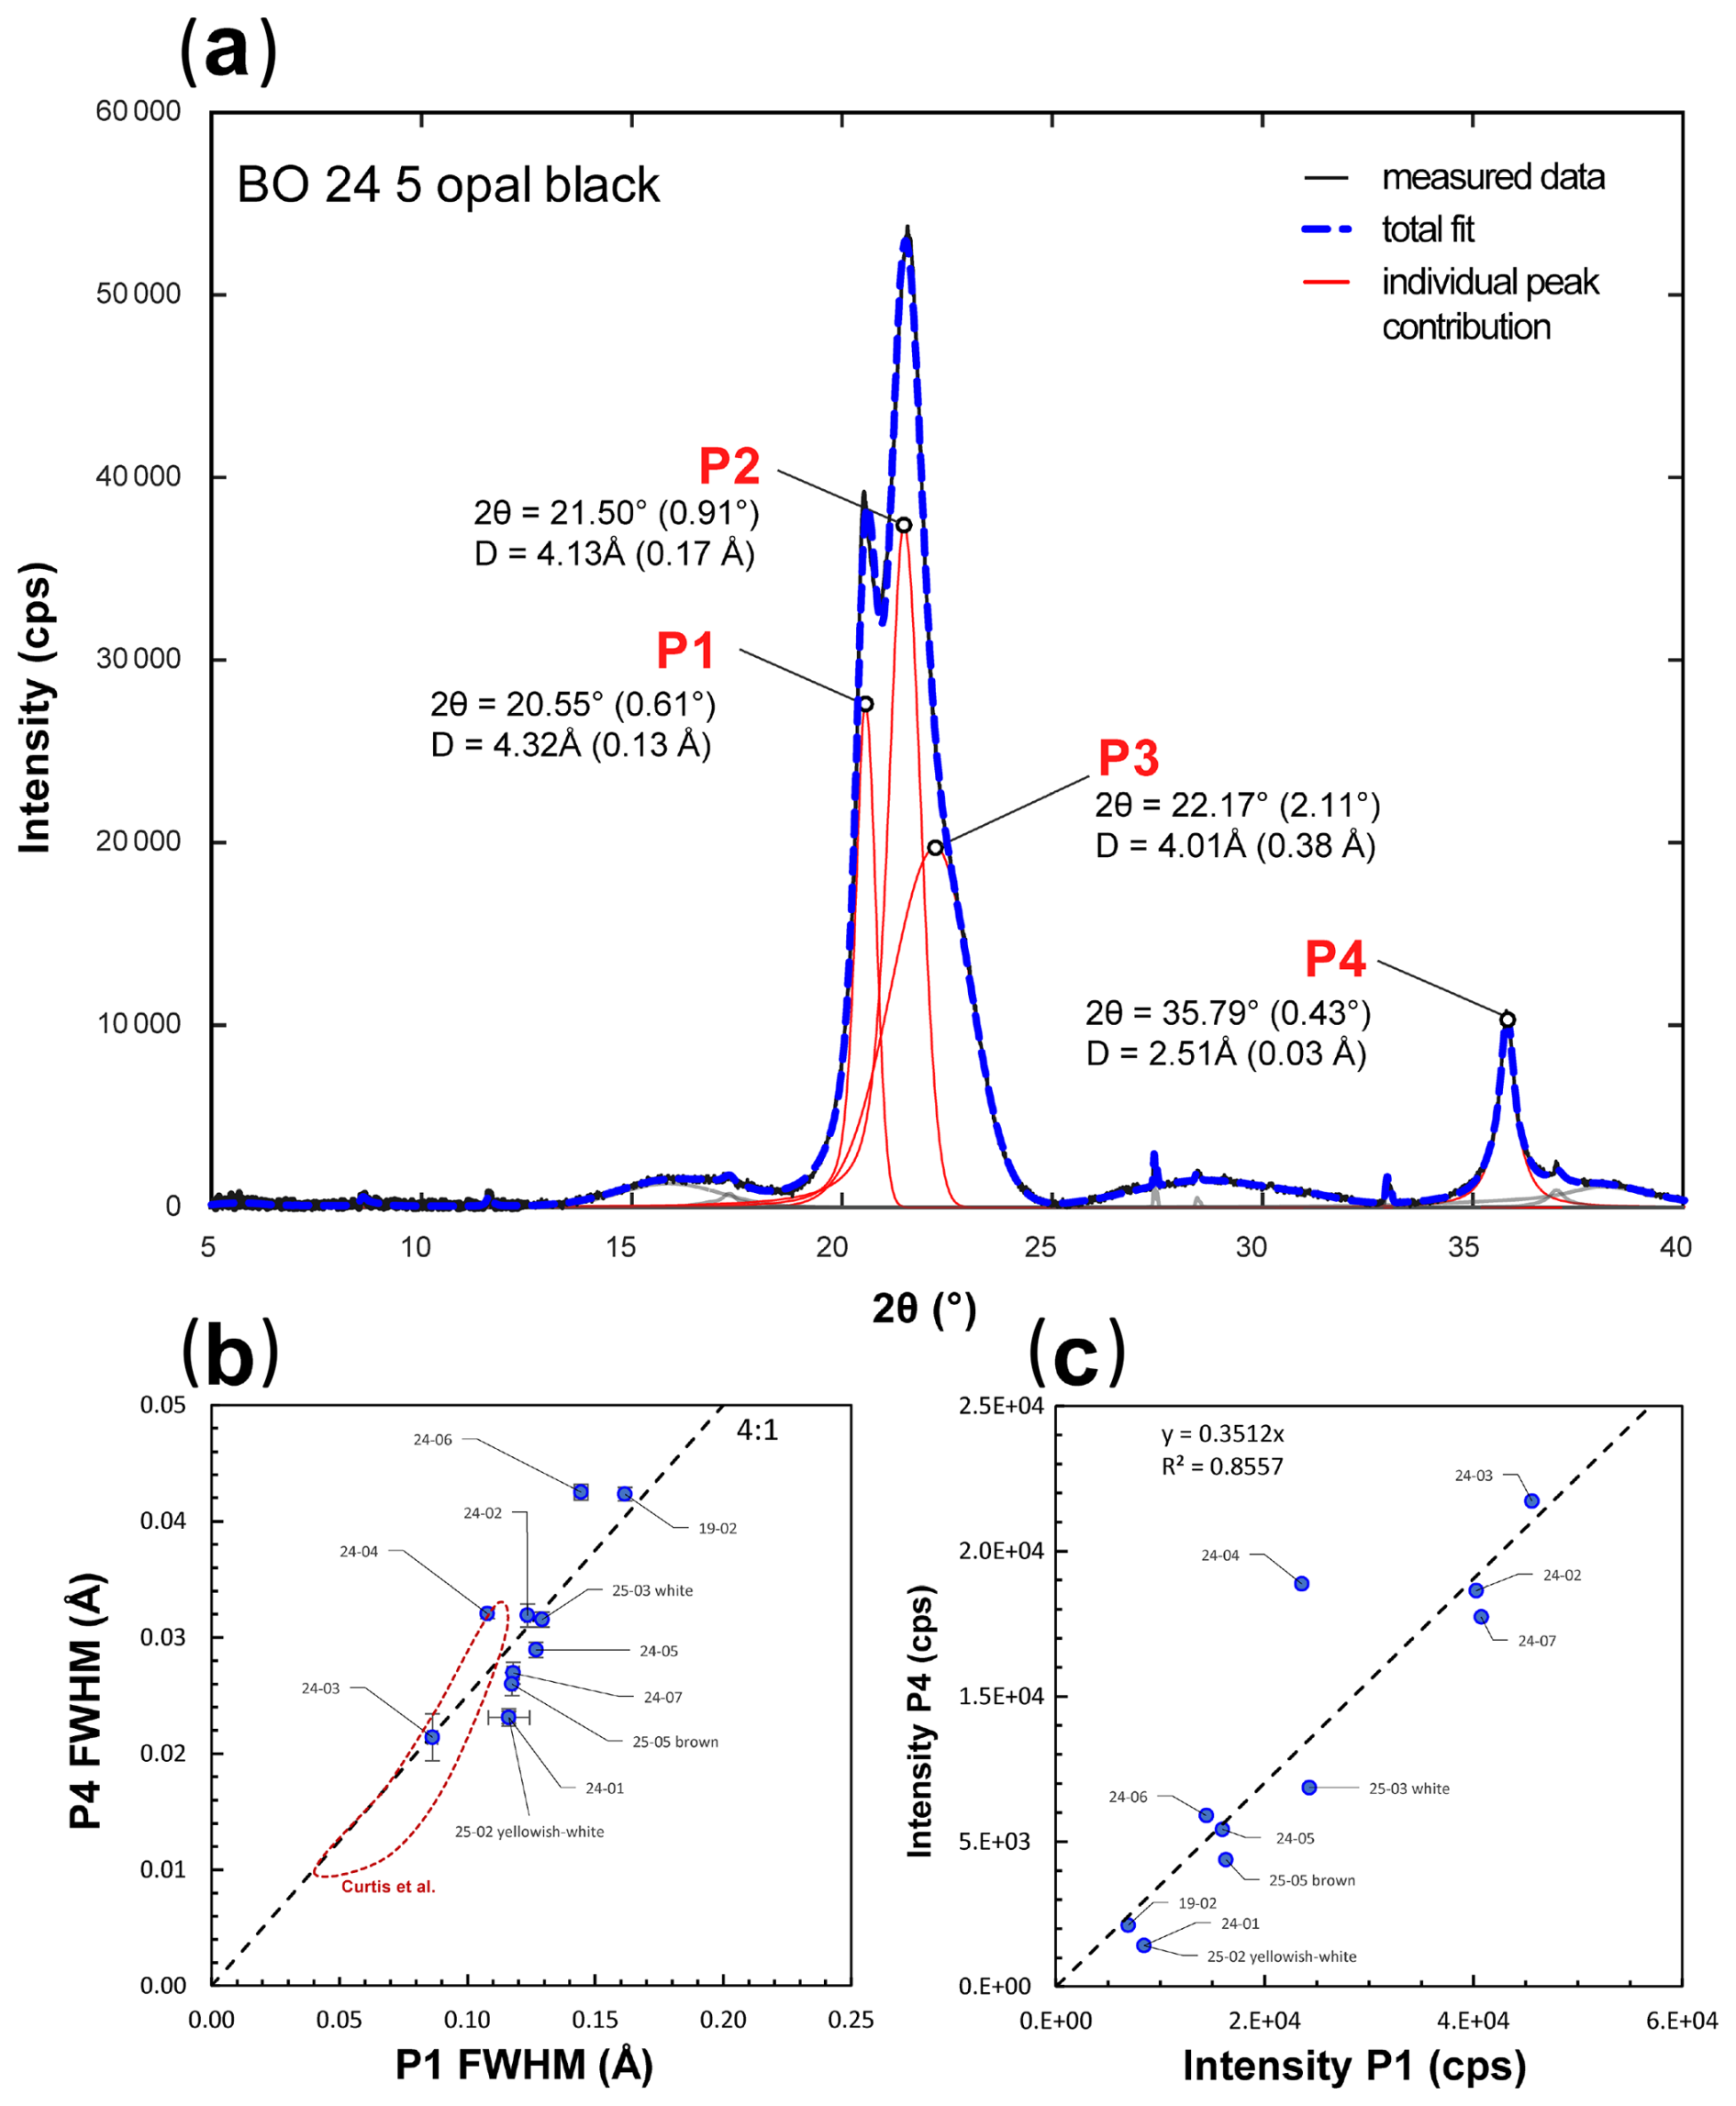
Figure 11(a) Representative XRD powder pattern of sample BO-24-05 with typical peaks for “complex CT-opal” (peak numbering according to Curtis et al. (2019), peak fitting based on a Lorentzian peak shape; we used the split pseudo-Voigt function, accounting for asymmetric effects). Peak positions and full at half maximum (FWHD; in parenthesis) are given in Å and °2θ. (b) FWHM of P1 and P4, Volyn samples of black opal (peak fitting with the symmetric model) following the trend of Curtis et al. (2019), with the 4:1 line for reference. Error bars are two times the estimated error of the model. For comparison, data for white opal from Volyn (see Fig. S1) were added. (c) Intensity of peaks P1 and P4, following a linear trend.
No distinct visual pattern was observed for the d-values of P1, P2, and P4, which all fall within a narrow range, with D(P1) = 4.324(4) Å, D(P2) = 4.130(3) Å, and D(P4) = 2.509(1) Å. In contrast, P3 with D = 3.94(5) Å exhibits significant variation, which is, however, believed to be primarily related to uncertainties in peak fitting rather than to structural differences. Following Curtis et al. (2019), the data for full width at half maximum (FWHM) of P1 and P4 were plotted and revealed a clear trend with a slope of approximately P1 : P4 = 4:1 (Fig. 11b), which is also evident in the intensity (Fig. 11c). This finding is consistent with the global dataset reported by Curtis et al. (2019). Because both peaks correlate in intensity and FWHM, the results support the interpretation that two structural subdomains exist within a globally coherent framework, rather than representing independent phases. The FWHM of P4 corresponds to crystallite sizes of approximately 15–35 nm (Guthrie et al., 1995).
The peak fitting also demonstrates that the pseudo-Voigt function has limitations, as it cannot adequately accommodate peak asymmetry, particularly in the complex region around 4.0–4.3 Å. Visual inspection and systematic fitting trials further support two possible explanations: (1) the peaks are significantly asymmetric or (2) additional sub-patterns exist that are not yet resolved. This also implies that the observed FWHM values can readily change when alternative fitting models are applied, for example, by including additional sub-peaks around P1.
2.4 IR
In all spectra, bands of three chemically different groups of atoms are present, which correspond to Si-O vibrations in the opal silica matrix, “water” (O-H in molecular H2O and in silanol SiOH groups), and C-H of OM (Fig. 12a). The most intense bands, which cause the typical opal spectra and can be measured in very thin samples only, are due to Si-O vibrations in the SiO2 opal matrix and aggregated H2O, which fills the voids between SiO2 spheres. The stretching vibrations of SiO4 tetrahedra form a complex envelope between 1250 and 1000 cm−1, whereas the Si-O bending band at 800 cm−1 is relatively narrow. The O-H stretching (ν1+ν3) forms a very broad, asymmetric band typically centered near 3400 cm−1 (Fig. 12a).
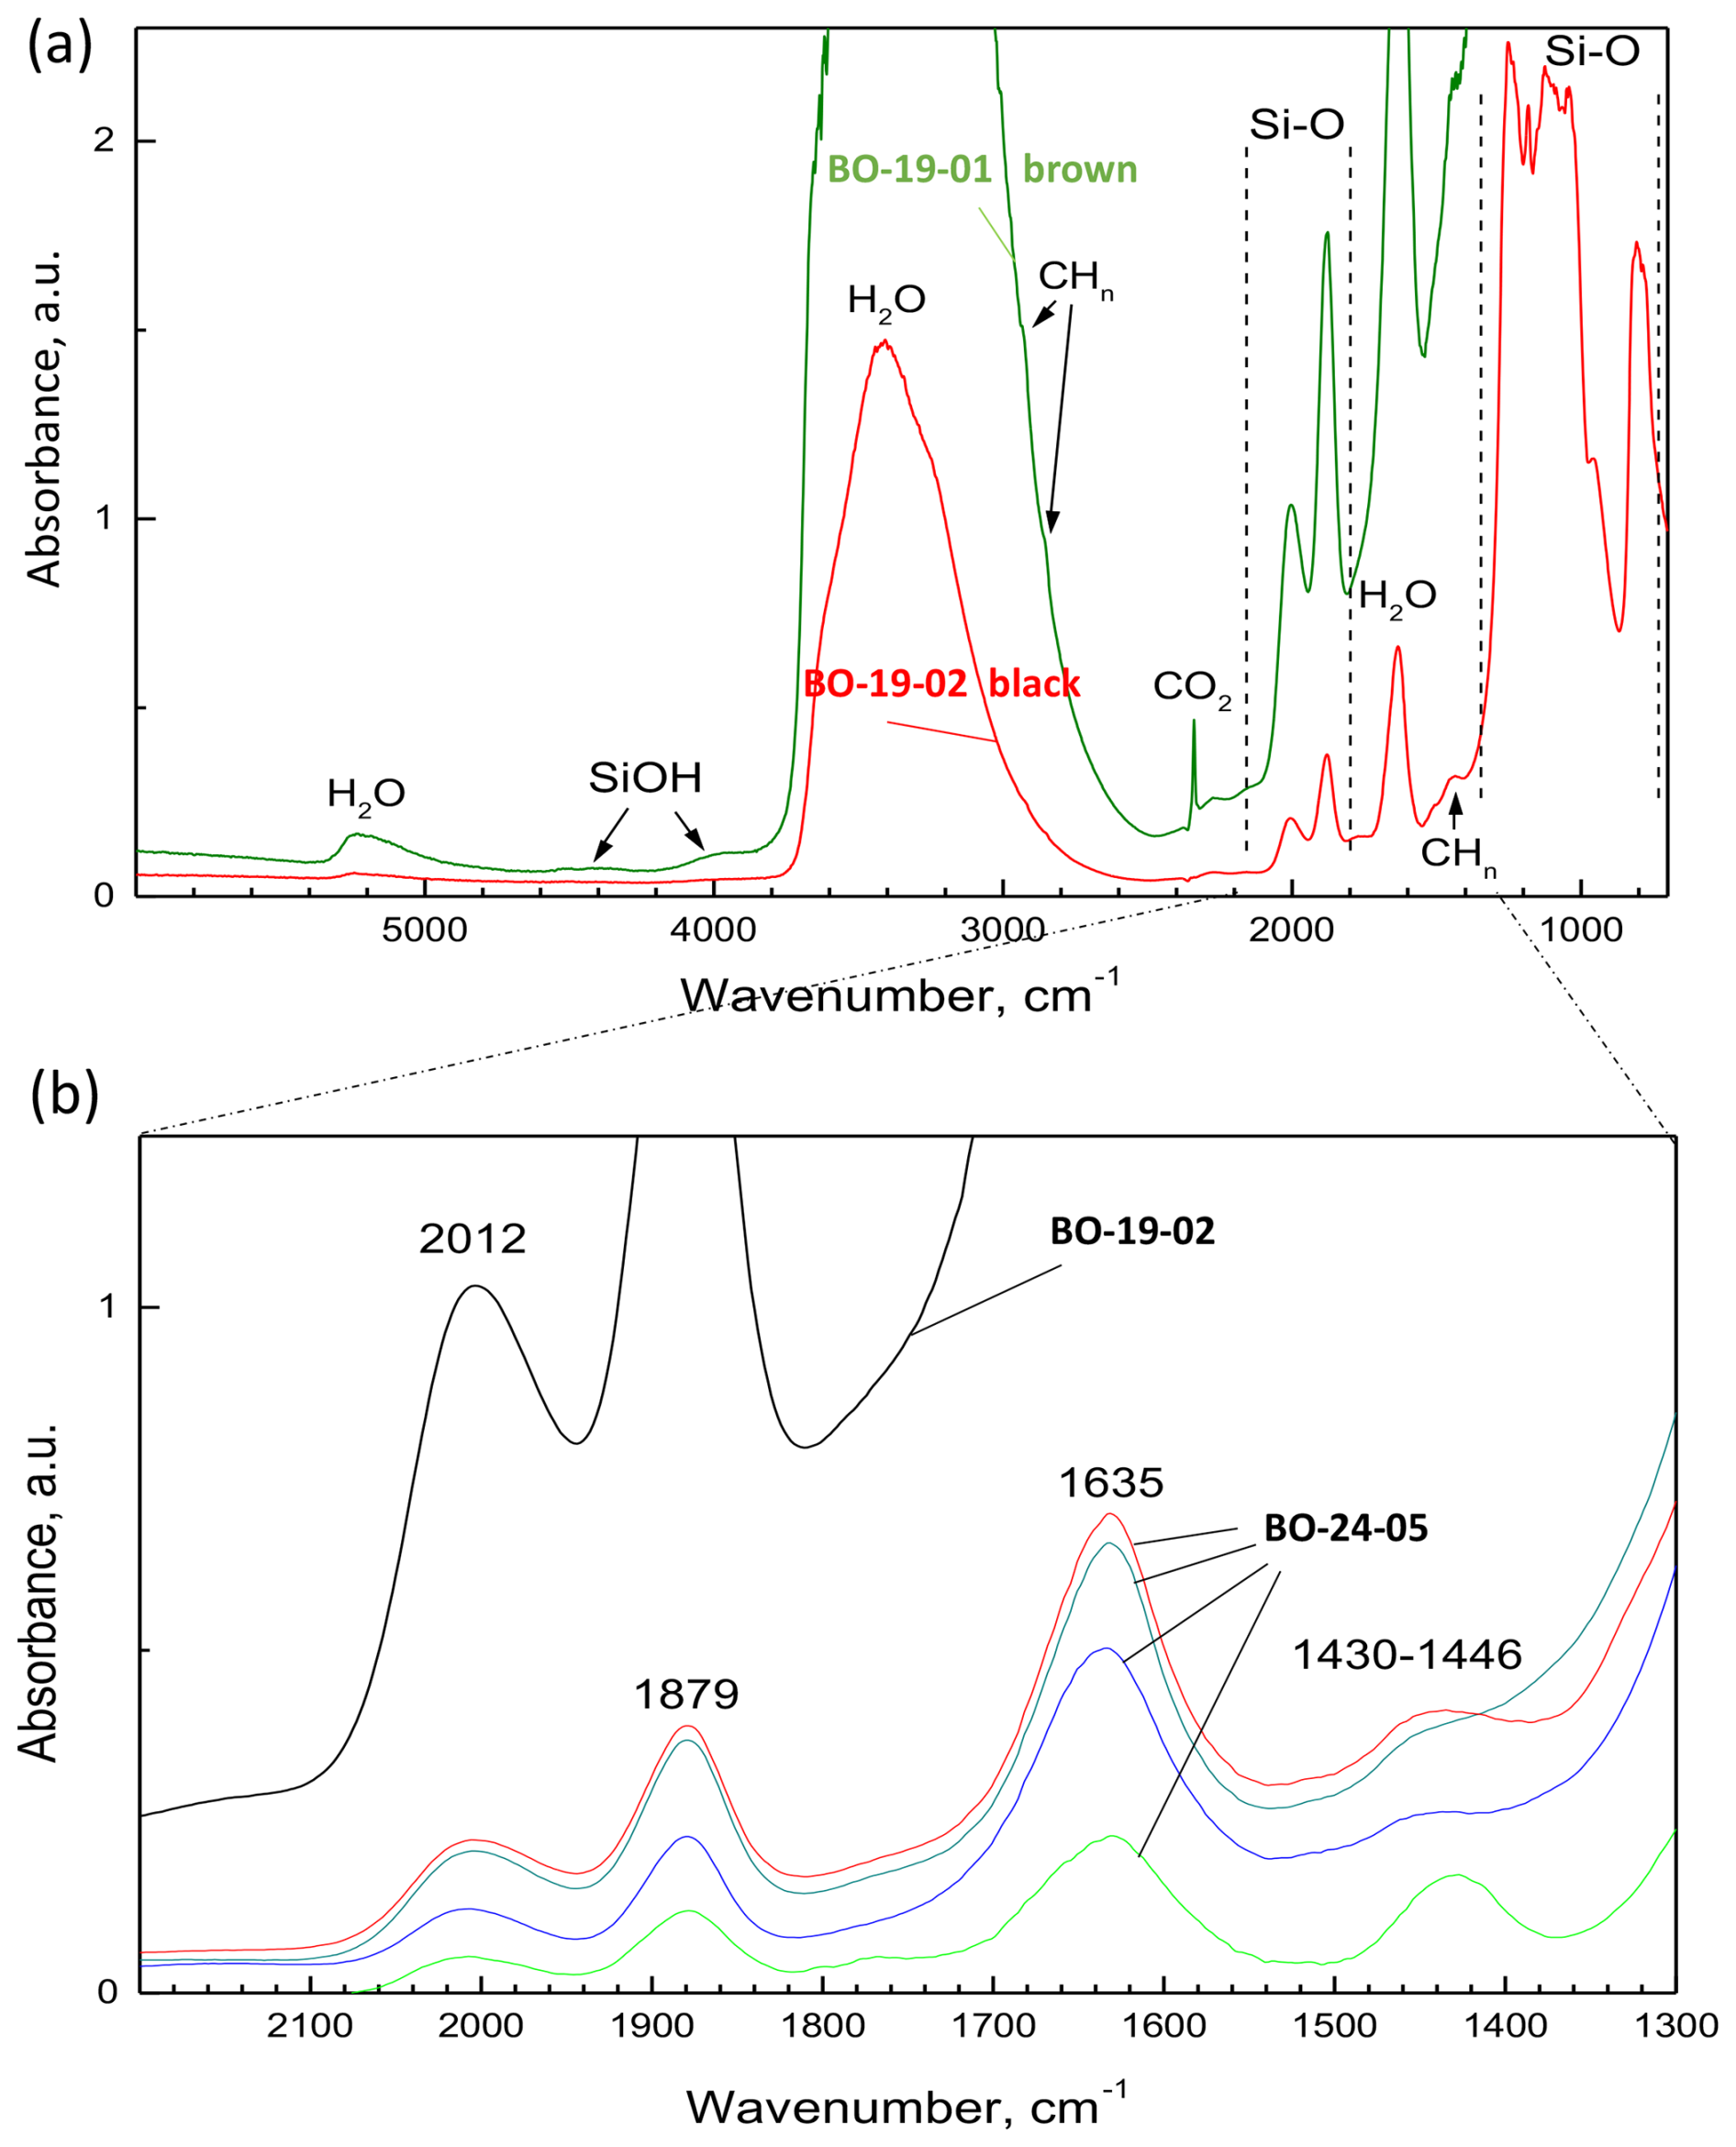
Figure 12FTIR spectra; (a) dark-brown opal BO-19-01 showing intense fundamental Si-O and O-H vibrations in the regions 1100–750 cm−1 and 3600–2800 cm−1, respectively; and black opal BO-19-02 showing weak bands of silanol (4500–4000 cm−1), weak shoulders between ∼ 2800 and 3000 cm−1, and a band near 1400 cm−1, all caused by C-H vibrations (see Fig. 13), H2O overtones at 5200 cm−1, and CO2 peak at 2339 cm−1. (b) Enlarged part from 2200–1300 cm−1; black opal BO-19-02 and different points of sample BO-24-05, showing different intensities of different points of SiO4 overtone and combination bands, C-H bending, characteristic for OM, overlapping with ammonia, and the H2O bending.
Three well-resolved but less intense bands between 2100 and 1500 cm−1 on the high wavenumber slope of Si-O stretching maximum are an H2O bending peak (ν2) at 1630–1635 cm−1, a combination band at 1880 cm−1, and the first overtone of Si-O vibrations at 2010 cm−1 (Fig. 12b). Intensities of different Si-O bands change strongly in proportion to the samples' thicknesses. Our data show that the water content is slightly variable in the two samples and in different areas of the same large sample BO-24-05 (Fig. 12b). In most spectra, a weaker band at 1430–1445 cm−1 is also present. The intensity of this band is also very variable in the two samples and also in different areas of the same sample, and does not correlate with intensities of Si-O or O-H vibrations. We assign this peak to C-Hn bending, which overlaps with the peak of N-H bending (ν4) in the ammonia molecule/ammonium ion.
Low-intensity bands can be detected in spectra of samples with a thickness > 0.1–0.15 mm. They are present in three spectral regions: at 5400 to 4000 cm−1, at 2800 to 3000 cm−1 (Fig. 13a, b), and as a separate asymmetric stretch peak of CO2 at 2339 cm−1 (Fig. 13c). The broad asymmetric band (Fig. 13a) between 5400 and 4000 cm−1 with the spectral position at 5230 cm−1 and with a long wing toward higher wavelength is typical of the combination (bending + stretching) vibration band of H2O.
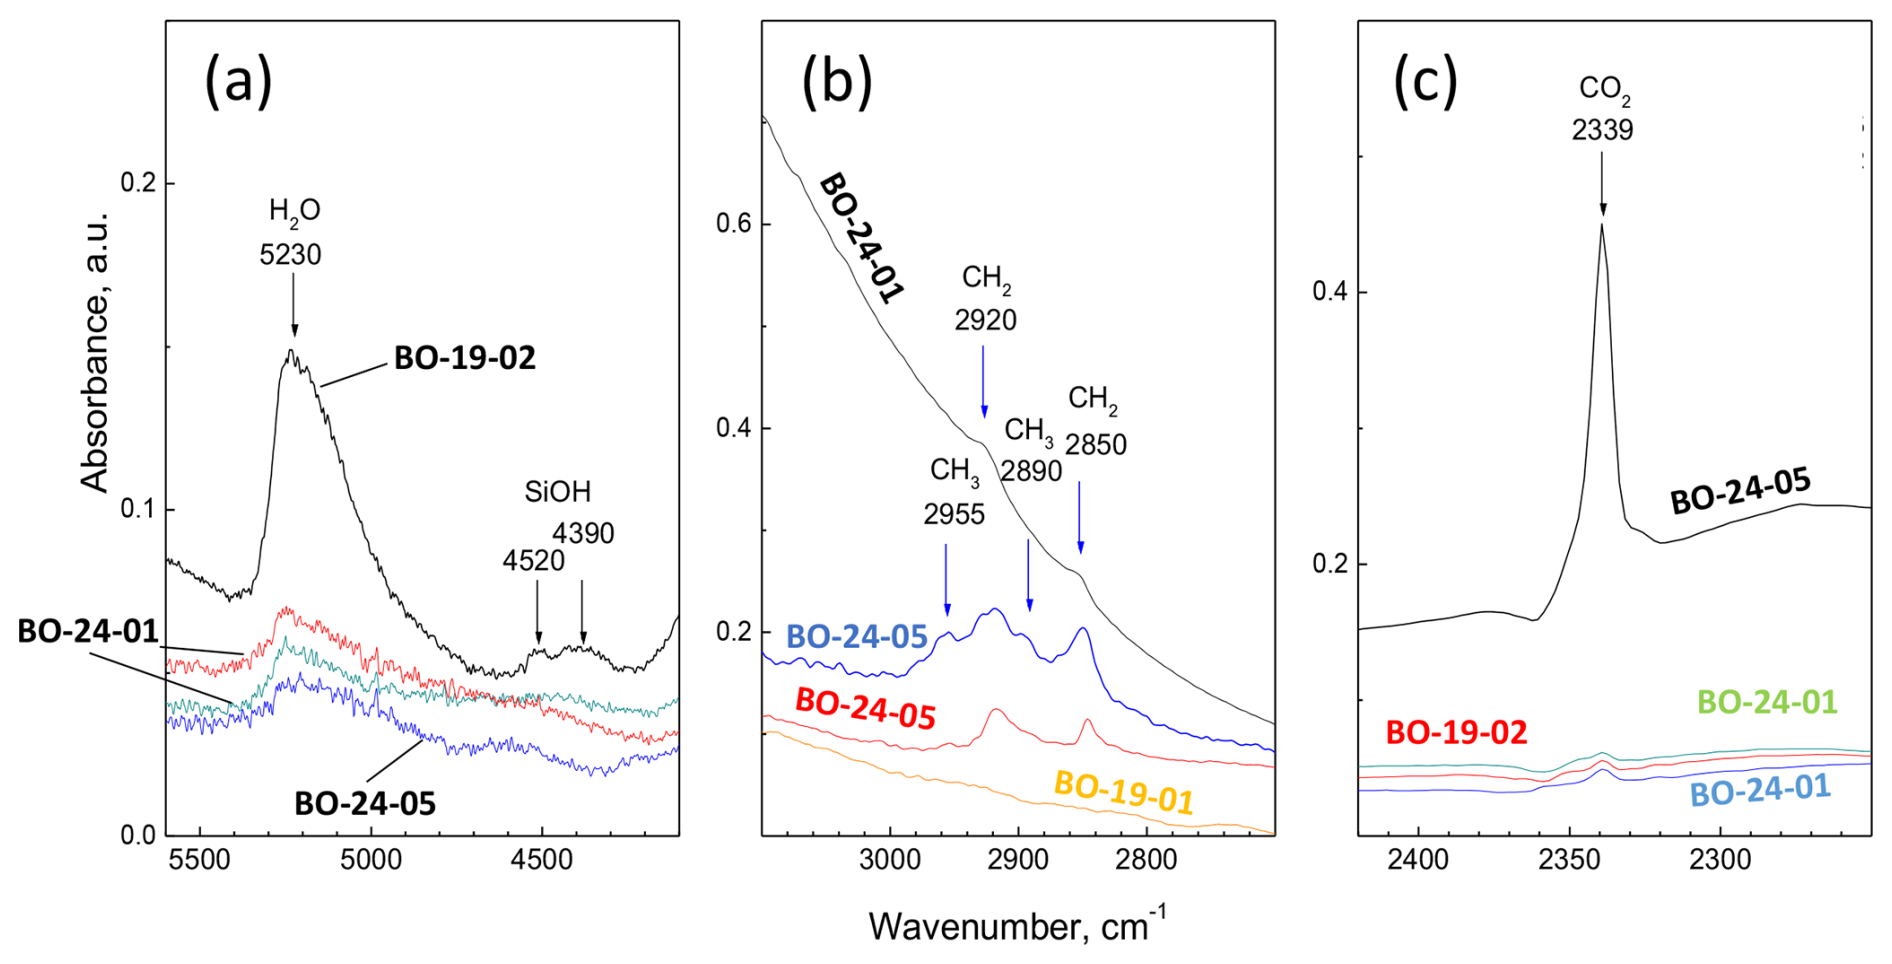
Figure 13IR spectra of black opal, showing (a) weak combination bands of water () at 5230 cm−1 and silanol SiOH (4520, 4390 cm−1), (b) stretching bands of CH2, CH3 groups of alkanes; and (c) asymmetric CO2 vibrational peak at 2339 cm−1.
In the region 2800 to 3000 cm−1, four weak peaks near 2850, 2890, 2920, and 2955 cm−1 are present on the high-wavelength wing of the dominant water band (Fig. 13b). Their positions are characteristic of the symmetric and asymmetric stretching vibrations in alkanes, namely for νs(CH2), νs(CH3), νas(CH2), and νas(CH3). Intensities of these bands are rather variable in different samples; in some thin platelets, only CH2 vibrations are visible or all bands are not detectable (Fig. 13b). This observation indicates that OM in black opal is represented by different molecules, the ratio and distribution of which are not homogeneous even in the same hand specimen.
A weak and narrow single band at 2339 cm−1 (Figs. 12c and 13c) is well resolved in spectra of relatively thick (> 0.15 mm) samples, but it is also present as a minor absorption maximum in spectra of most studied thin platelets. The spectral position and shape of this band unambiguously identify it as the asymmetric vibration of CO2. Its long-wavelength shift compared to the corresponding band of the free CO2 molecule (2348–2349 cm−1), as well as absence of rotational side bands, evidences its tightly fixed position in the opal structure.
2.5 U-Pb dating
For U-Pb dating, three samples were selected: BO-24-02 with feldspar, BO-24-07 with mica, and BO-24-06 with brown crust. Analyses were performed in several domains on each sample; and in each domain, several lines were ablated in blocks of five lines. The selected domains and line positions are presented in Fig. 14, the results are shown in Fig. 15, and details can be found in Table S5.
The oldest age was obtained from domain 1 of sample BO-24-07, consisting of transparent, brownish opal surrounded by Li-mica (Fig. 14a). Most analyses (31 out of 35) plot slightly above the concordia line and define a cord with a 207Pb 206Pb upper intercept age of 201.0 + 8.4 −14 Ma (Fig. 15a). This age is significantly older than a lower intercept age of 168 ± 6 Ma, obtained from domain 3 (31 out of 40 analyses), comprising a large area of transparent opal close to the margin of the same sample. We note that the nine excluded analyses show a wide scatter in 238U 206Pb and 207Pb 206Pb ratios, which is also observed in five analyses of domain 2, occurring close to the edge of domain 1 (Fig. 14a). Domain 3 appears dark in transmitted light and is characterized by intergrowths between opal and tiny feldspar and mica crystals (Fig. 14). A Late Jurassic lower intercept age of 156 ± 5 Ma is obtained on the domains 4 and 5 of the feldspar-bearing sample BO-24-02 (44 out of 66 analyses). We note that the analyses of domain 4 show significantly higher 207Pb 206Pb ratios compared to those of domain 5 (Fig. 15c). The high mean standard weighted deviation (MSWD) of 5.5 of the regression line further points to disturbance of the U-Pb system, which is also indicated by the large number of analyses plotting far away from the regression line. From the brown crust in sample BO-24-06 (domain 6 in Fig. 14c), most analyses (28 out of 35) plot on a regression line, which yields a lower intercept age of 0.99 ± 6.15 Ma (Fig. 15d), suggesting that the rim was affected by a very recent, nearly complete Pb-loss (Fig. 15c).
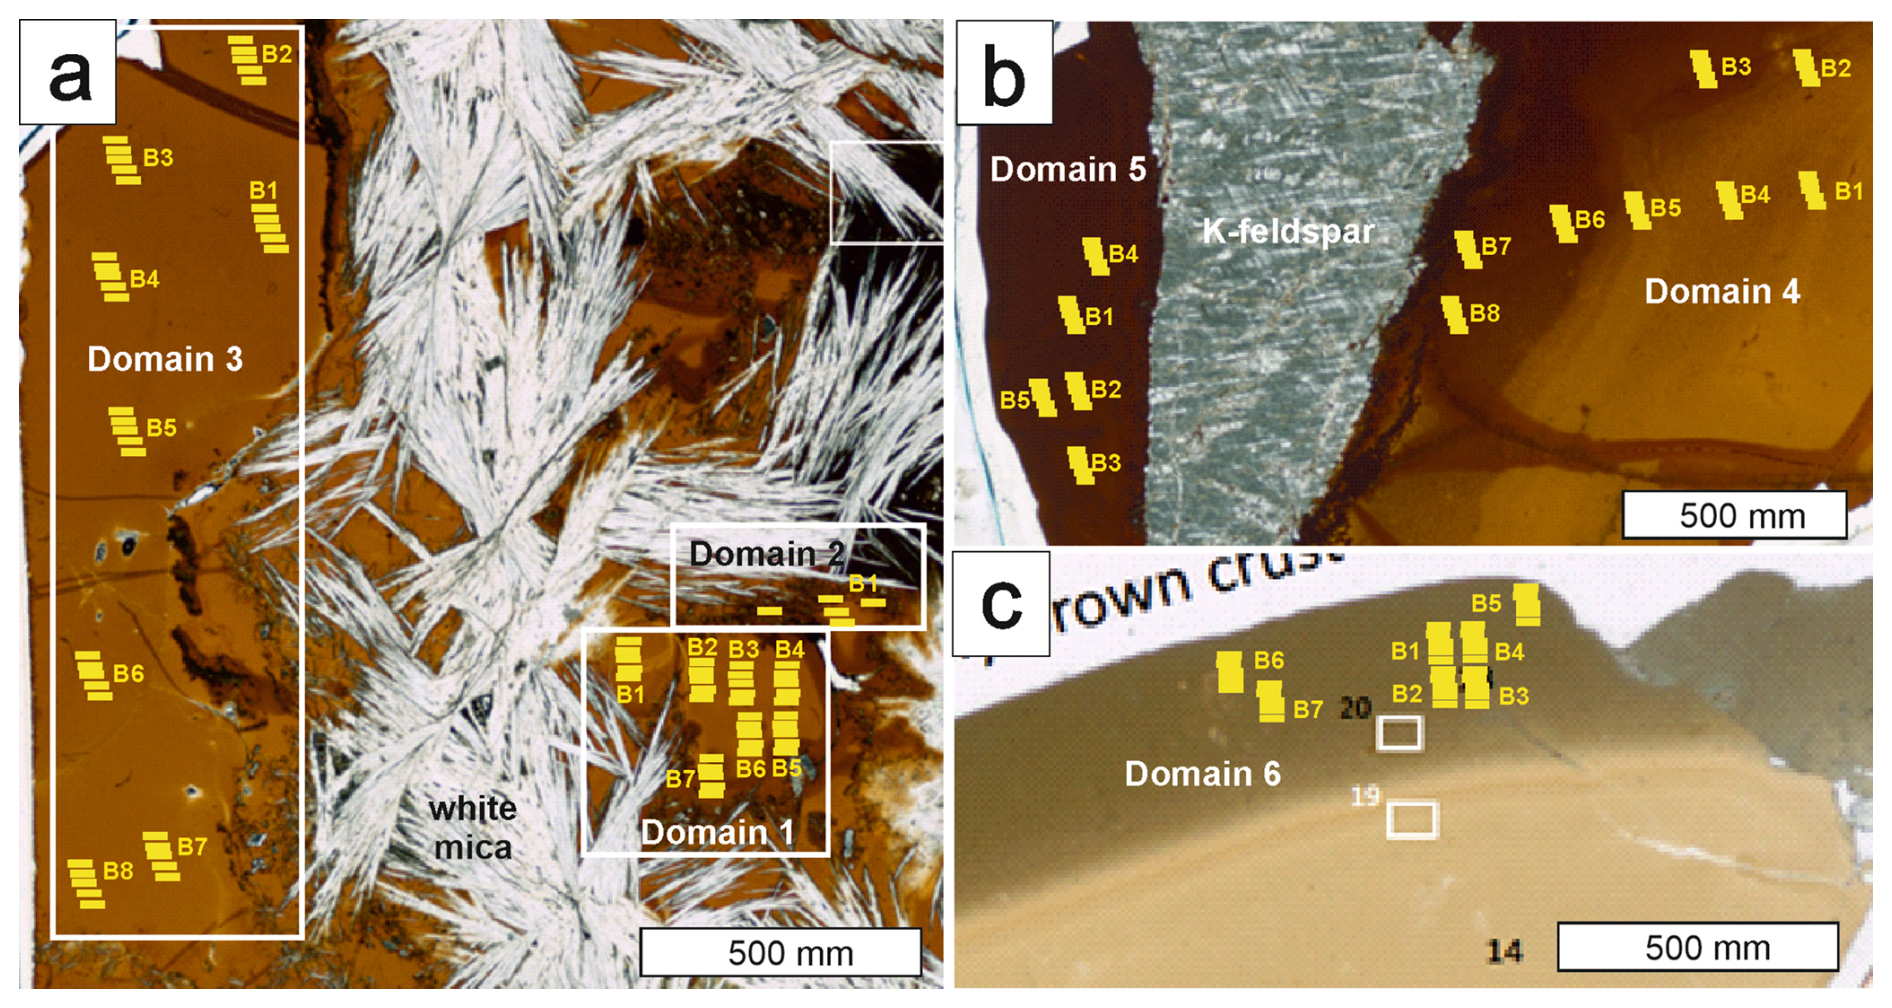
Figure 14Domains analyzed for U-Pb dating by LA-ICP-SF-MS in (a) mica-bearing sample BO-24-07, (b) alkali-feldspar-bearing sample BO-24-02, and (c) the brown crust of sample BO-24-06. The yellow lines mark the positions of the laser analyses, carried out in blocks of five analyses. B1–B8 refers to the respective block name.
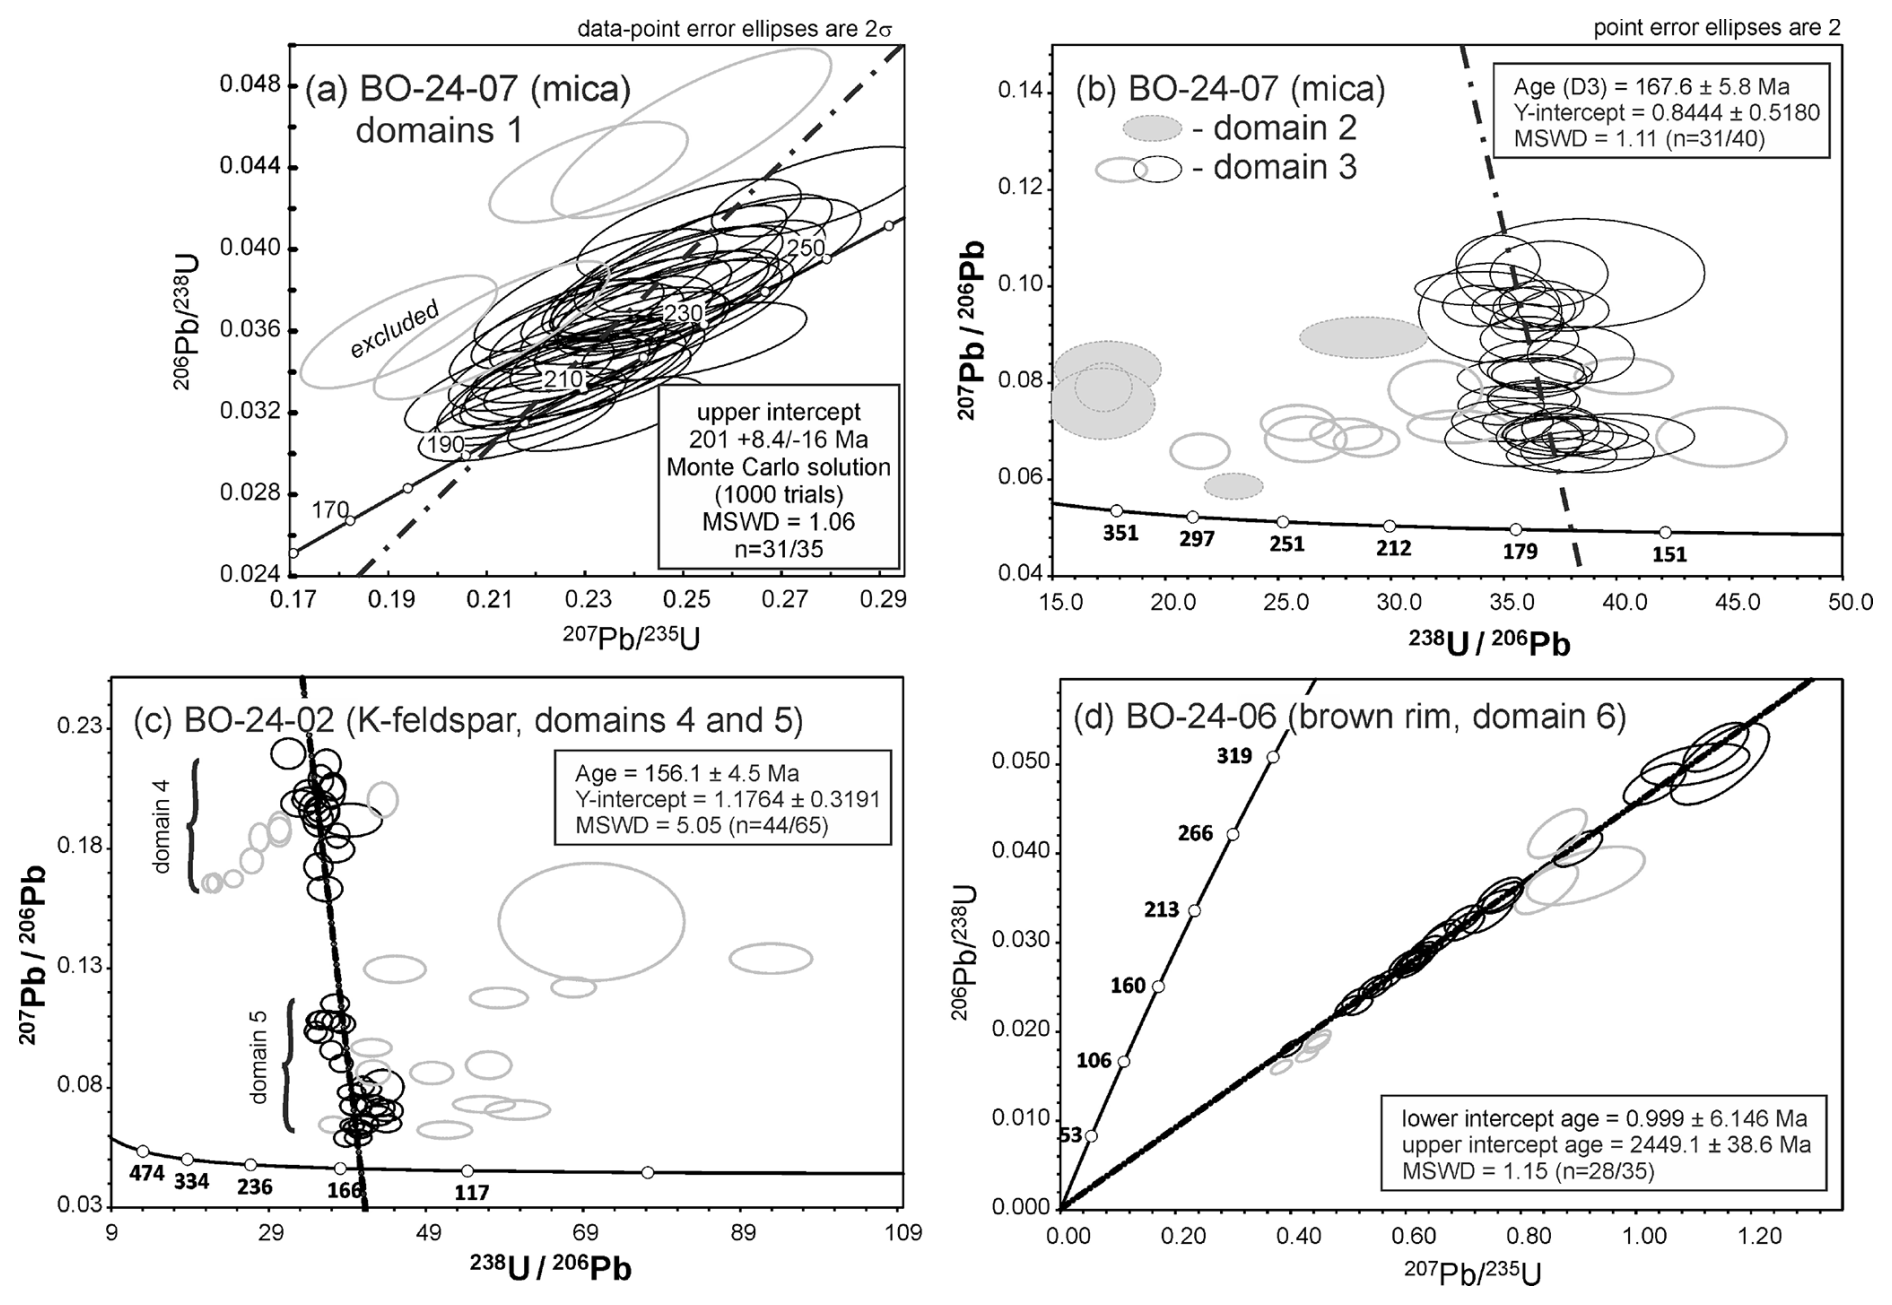
Figure 15Results of U-Pb dating of the samples BO-24-02, BO-24-06, and BO-24-07, presented in (a, d) Wetherill and (b, c) Tera–Wasserburg diagrams.
3.1 Structure
The XRD data confirm that it is opal-CT (Fig. 11), which commonly forms abiotically directly from silica-rich solution, not via the transformation of opal-A (Gaillou et al., 2008). Curtis et al. (2019) compiled a large database of opal-CT from different localities worldwide and use the details of the XRD powder pattern as a signature for maturity. A single peak at 2.5066 Å is attributed to domains of cristobalite, whereas the shape of the peak at 4.3 Å, expressed as FWHM and detailing the shape (i.e., number of peaks for peak fitting), are attributed to domains of tridymite. They therefore classify opal-CT as “simple”, with only one peak or “complex” with three peaks.
The Volyn black opal has a complex powder pattern, and according to the FWHM of the peak at 2.5066 Å, the samples are in the upper half (less mature) part and extend the field for opal-CT, designated by Curtis et al. (2019). The maturity of the samples appears to fall within a relatively large range, similarly to that shown by Liesegang and Tomaschek (2020). The FWHM of both peaks at approximately 4.3 Å varies strongly in our samples. Because all our samples come from the same locality, it is unlikely that they had experienced different pressure-temperature conditions during formation, and the FWHM must vary due to other factors, such as porosity, particle size, content, and distribution of OM and water. The measured total of the EMPA (Table 2) varies from 85.1 wt % to 89.6 wt %, indicating an in-sample variation of undetermined elements of 10.4 wt % to 14.9 wt %, of which water and OM seem to be the dominant part. It is likely that the variation seen in Fig. 11b is due to different water and OM contents of pieces of the different samples, selected for XRD.
Table 2EMPA of sample BO-24-06; Rb, Sr, and N below detection limit (bd).
The microstructure of the Volyn samples is not very different from other common types of opal: nanograins have a diameter of 20–30 nm (as estimated from Fig. 3i, l) and 15–35 nm (as estimated from the FWHM of the peak P4, which is in the same range as in the data by Gaillou et al.,. 2008). The 16 nm thick carbon coating does not allow a more precise measurement in our samples. The nanograins are mainly aggregated in spherical structures, which show a wide variation depending on the samples; they are in some samples monodisperse (∼ 5 µm; BO-24-02, -07; Fig. S6k–m), in others polydisperse with diameters between 1 and several µm (BO-24-06; Fig. S7a, b). The nanograins occur in lepispheres (BO-24-01; Fig. S10q, r) as well as in spheres (BO-24-02; Figs. 3j–l, S6t, u), which are more characteristic of opal-A. Some of the spherical structures are arranged in a polygonal network, which is, however, not cemented by silica as is common in opal but with interstitial OM.
On a larger scale, areas appearing in thin section are almost colorless and are not essentially different from the rest of the sample; they differ only in the amount of OM (Fig. 3a–c). The shape of these colorless areas with a step-like border (Fig. 2c, e) or straight boundaries (Fig. 2d), and with filament structures (Figs. 5, 10c) indicates a primary feature not caused by the alteration of the samples. The chemical composition of the areas – which appear in thin section colorless, light- or dark brown (Fig. 9) – shows that color intensity is parallel to higher concentrations of Al and Ca. The correlation with other minor elements – Fe, S, and K – is less systematic.
In common opal, the cementation by silica occurs after the formation of the spheres (Iler, 1965; Gaillou et al., 2008; Gouzy et al., 2024). In black opal, OM is located in the spheres, in the cores, or in concentric zones, as well as around the spheres. This indicates the presence of OM before, during, and after formation of the spheres and correlates with the model proposed by Gouzy et al. (2025). It is an open question if and how the OM influences the formation of opal, and the stacking and twinning of the cristobalite-tridymite nanodomains (Sriaporn et al., 2024; Lee et al., 2025). The matrix around the spheres is also enriched in Ca and in S (Fig. 4). Wether Ca and S are present in nanometer-sized crystals or are situated within the OM is an open question. Sulfur is also bound to Fe in small pyrite crystals, randomly distributed in the matrix (Figs. 3d and 4). These small pyrite crystals likely formed early in the whole process of opal precipitation but after the aggregation of the nanograins in the structure.
Another interior phenomenon in black opal is the preservation of filamentous shape relicts, seen under the microscope (Figs. 2, S5b, d) as a dark-brown feature. In BSE images (Fig. 5), the dark-brown area is not different from the lighter colored area around it, and therefore the amount of OM is not very different, but an open channel is very characteristic. Such an open channel was found in filamentous kerite fossils (Franz et al., 2022, 2023), and the shape relicts indicate that the filaments were replaced by opal during the precipitation process, i.e., opalized. The round objects (Fig. 6) are in a similar way explained as relicts of former fossils. However, such round objects with a size of approximately 100 µm have not yet been identified in our sample suite of kerite fossils. The internal structure of these round objects with pyrite and BaSO4 confirm the presence of sulfate and sulfide in an early stage of opal formation. The pyrite is xenomorphic and thus very different from the pyrite crystals in the opal matrix.
3.2 Alteration phenomena
Euhedral pyrite crystals, much larger than the small euhedral pyrite crystals in the matrix of OM between the spherical nanograin aggregates, were found in the border areas (Fig. 7). The border to quartz is interesting, because the Si-supersaturated opal fluid is not expected to react with pure quartz. Nevertheless, there is a several 100 µ wide zone with enrichment of large pyrite crystals. This border zone was most likely produced by infiltration of a fluid along the grain boundary. The μXRF mapping of the border zone around alkali-feldspar and rock fragments (Fig. 10a, b) shows a diffusion profile of Fe and Mn into opal. Filaments with an open channel acted as pathways for the fluid, and the higher concentration of Fe (Fig. 10d) and Mn (Fig. S15c–e) in the filament compared to the matrix was also confirmed by EMPA (Fig. 9). That the border zone is not a reaction zone between alkali-feldspar or rock fragments and opal but was produced by fluid infiltration is also indicated by the asymmetric border zone: to the left of the large alkali-feldspar, the border zone is very narrow; and in the upper part of the rock fragment, the border zone is missing, which should not be the case in a reaction zone.
The alteration of alkali-feldspar into buddingtonite according to the exchange reaction (simplified for the K-NH4-endmembers)
is also obvious in the sample with Li-mica (Fig. 7j, k). However, the Li-mica, which is an igneous relict of the pegmatite, as shown by the laser ablation Rb-Sr age data near 1.7 Ga (Kutzschbach et al., 2025), does not show the K-NH4 exchange (Fig. 7k, f). In a previously investigated sample of a breccia cemented by black opal (Fig. S14; Franz et al., 2017), muscovite was partly transformed into tobelite according to the exchange reaction
and tobelite is also present in the black opal (identified in small amounts by XRD).
Embayments in quartz at the open grain boundary (Fig. 9) indicate a slight dissolution of quartz, possibly in an early stage during breccia formation, because the sphere-like opal structure is also present in the embayments (Fig. S10p, q). The formation of a brown crust around sample BO-24-06 (Figs. 1, 9) is clearly a late phenomenon, as it was attacked from the outside of a compact opal sample (Fig. S3b), and its U-Pb isotopic composition points to a complete loss of Pb and U, with a (sub)recent resetting of the age. This alteration crust was most likely caused by meteoric ground waters; the term “weathering” should be avoided in this context, because the sample was taken underground in the mine and has not seen atmospheric conditions before sampling. During this alteration, all minor elements as determined by EMPA were enriched (Figs. 8 and 9). A large porosity was formed (Fig. 3m–o), possibly by the oxidation of the OM in the matrix.
Large crystals of pyrite in the border zone between opal, alkali-feldspar, and rock fragments show a core of pure pyrite, surrounded by oxidized pyrite (Figs. 7f, o, S9). In addition, crystals of Fe oxide were identified in the border zone (Fig. S9), indicating that oxidation of the sample was not restricted to the alteration zone, which produced the brown crust, but also occurred in the border zone.
3.3 Age determination
Age determinations of opal are rare and not yet a routine procedure, and different methods on different types of opal were applied. Black opal from Australia was dated with the radiocarbon method (Dowell et al., 2002), TIMS U-Th-Pb; U-series isotopic dating was applied by Amelin and Back (2006) on common and precious opal; and Neymark and Paces (2000), Paces et al. (2004), and Neymark and Paces (2013) determined 230Th U ages and 206Pb 238U ages in opal in silicic tuffs from the Yucca Mountain, Nevada. Nemchin et al. (2006) provided the first SHRIMP U-Pb analyses of opal. Nuriel et al. (2019) presented U Pb SHRIMP dating of opal from fault zones near the San Andreas fault, California, USA. All these opals yield Late Tertiary to very recent Quaternary ages ranging between 16 Ma and 1 ka – much younger than the ages achieved during this study.
Before discussing our ages in a geological context, it is pertinent to note that these were achieved by assuming that the analyzed opal and reference glass NIST-SRM612 underwent exactly the same U-Pb fractionation during laser ablation. This of cause is not guaranteed, considering the fact that glass (∼ 2.65 g cm−3) and opal (1.9–2.2 g cm−3) have quite different densities and that opal contains 6 wt %–20 wt % H2O, causing much deeper ablation pits and lines at the same laser conditions (approximately ∼ 4 µm for glass vs. ∼ 15 µm for opal depth during 5 s ablation at 10 Hz and 2.0 J cm−2). As no matrix-matched opal standard for LA-ICP-MS dating is available to date, the exact degree of U-Pb fractionation between glass and opal cannot be corrected for. Thus, all ages obtained during this study must be considered as apparent ages, perhaps with deviation from the accurate values of more than 5 %. Nonetheless, even an age offset of 10 % would have only minor consequences for the geological interpretation presented below. This 10 % uncertainty is presented in angular brackets in the next section.
The results of this study indicate three age groups for black opal from Volyn: (i) a 207Pb 206Pb upper intercept age of 201.0 + 8.4 −16 Ma [±20 Ma] (Fig. 15a), straddling the Triassic–Jurassic boundary (domain 1 in the Li-mica-bearing sample Fig. 14a); (ii) two Jurassic lower intercept ages of 167.6 ± 5.8 Ma [±17 Ma] (domains 2 and 3 of the same sample; Figs. 14b and 16b), and 156.1 ± 4.5 Ma [±16 Ma] (domains 4 and 5 of the alkali-feldspar dominated sample BO-24-02; Figs. 15c and 16c); and (iii) a Quaternary age close to present-day in the brown alteration crust of sample BO-24-06 (domain 6 in Fig. 15c). We note that domain 1 is nearly free of common Pb (all data are close to concordia, slightly reverse; Fig. 14a), whereas all other domains (2 to 6) contain significant amounts of common Pb (all data plotting on or close to mixing lines).
The slightly reverse nature of most data points obtained from domain 1 at a nearly constant 207Pb 206Pb ratio of ∼ 0.05 (Fig. 14a) could be explained by two options: (i) U loss relative to Pb, perhaps due to interaction with late oxidized fluids, which is observed in oxidized pyrite and the formation of FeO (see Fig. 7g, o); and/or (ii) from excess 206Pb, caused by the decay of short-lived radioisotopes like 131Pa, 227Ac, 230Th, 226Ra, and 234U, which were incorporated in disequilibrium with 238U during opal formation from reduced fluids (for a more detailed discussion, see Neymark et al., 2002). The effect of disequilibrium on the estimated age is considered minor (< 1 Ma), even if high activities for all short-lived radioisotopes are assumed (Wendt and Carl, 1985).
Presently it remains unclear whether the common Pb is a primary component within the different opal domains (e.g., it was fixed in silica during opalization of K-feldspar) and/or was infiltrated during the alteration of existing opal domains. The finding of the oldest age of ca. 200 Ma in domain 1 – which is free of common Pb, highly porous, and water-rich (∼ 10 wt %) – suggests that this domain remained unaffected by post-Triassic fluid infiltration and that the estimated age might reflect the time of closure of the U-Pb system, i.e., a minimum age for BO formation.
Uranium in domain 1 may be hosted by nanoscale OM or within nano-porous opal structures, both of which likely inhibited the incorporation of common Pb. The younger ages at 170 and 155 Ma might be interpreted to result from subsequent infiltration of aqueous fluids in certain domains, causing periodic age reset. This age reset, which is reflected by the regression lines (see Fig. 15b, c), might have been achieved either by the infiltration of common Pb into primarily common Pb-free but U-bearing domains (e.g., domain 1) or alternatively by infiltration of hexavalent U into common Pb-dominated domains. Hexavalent U is preferentially transported in oxidized aqueous fluids, and the second option seems to be likely for areas with abundant oxidized pyrite and OM. Thus, we prefer the option that the Jurassic age reset at ca. 170 and 155 Ma was caused by periodic input of aqueous fluids, also responsible for the higher concentrations of Al and Ca in such dark-brown areas (see Fig. 9).
The fluid infiltration at ca. 170 obviously started along grain boundaries between opal and alkali-feldspar and/or quartz, also forming the zones with pyrite enrichment (Fig. 10). The significant deviation of some data points from the regression lines (Fig. 16b, c) suggest that equilibration of the U-Pb system during Jurassic infiltration remained incomplete or that some domains underwent multiple infiltration. Evidence for a late fluid infiltration event is well reflected by the brown alteration crust in sample BO-24-06, which obviously was affected by a nearly complete reset of the U-Pb system during the Quaternary. The brown crust contains much higher contents in U (9–13 µg g−1) and Th (2.7–3.7 µg g−1), and lower Th U (0.04-0.20) compared to the internal BO domains (U = 1.3–5.9 µg g−1; Th = 0.12–0.60 µg g−1; Th U = 0.3), suggesting fluid infiltration from a different source. In summary, the data show that in situ dating of individual opal domains by LA-ICP-SF-MS is possible and can provide detailed information about different stages of fluid–rock interaction.
With the exception of the alteration event, all ages of the black opal from Volyn are significantly older than previously reported ages of opal from other occurrences worldwide. The black opal from Australia is very young, with an age of 1000 to 7000 years BP (Dowell et al., 2002). Opal from the Yucca Mountain, Nevada, USA, yielded 230Th U ages of approximately 200 ka (Neymark and Paces, 2000; Paces et al., 2004). The oldest ages so far between 2 and 16 Ma were found by Amelin and Back (2006) for common opal. Similar old ages of 1.65 to 6.12 Ma are presented for authigenic and detrital opal in the Yucca Mountain (Neymark and Paces, 2013) and of approximately 1 to 11 Ma for opal from the San Andreas fault system, California, USA, by Nuriel et al. (2019).
3.4 OM in black opal
The OM is present in different amounts in the samples and also at different sites, within and between the spherical structures (Figs. 3 and 4). Different intensities of the IR spectra of CHn (Fig. 14b) indicate different molecules, with a distribution that is heterogeneous even in the same hand specimen. Our EMPA and IR data show that the water content is also slightly variable in different samples and in different grains of one sample of black opal (Table 2, Fig. 13). We assume that the different shape and FWHM of the X-ray peaks near 4 Å (Fig. 11) are therefore also influenced by different amounts of water and OM.
The position of an IR absorption peak at 5230 cm−1 (Fig. 12a) is dependent on the opal structure; in opal-CT it is < 5240 cm−1, while in opal-A its maximum is > 5245 cm−1 (Li et al., 2022, and references therein). This conclusion is in agreement with our XRD data, typical for opal-CT (Fig. 11a). The doublet in the IR-spectrum with maxima at 4520 and 4390 cm−1 is in the area of silanol SiOH vibration (Fig. 12a). The different position of the two peaks is probably caused by two predominant states of silanol groups, “free”, and hydrogen bonded (Li et al., 2022).
The presence of buddingtonite and tobelite-bearing mica in black opal was confirmed by EMPA and XRD; both are common in Volyn black opal (Fig. 7). It is therefore possible that N-H is also present in black opal. We assume that the complex IR band at 1430–1440 cm−1 (Fig. 13) is caused by superposition of bending C-H absorption in different organic molecules, and by N-H bending vibration in ammonia and/or ammonium ion. The inhomogeneous distribution of these different organic molecules in black opal leads to variability in OM-connected bands between 2800 and 3000 cm−1, and between 1430 and 1440 cm−1. In general, intensities of stretching C-H bands should correlate with the bending C-H vibrational band at around 1440 cm−1.
In addition to various C-H groups, carbon is also bound to oxygen (Fig. 13c). CO2 is tightly fixed in the opal structure, possibly by hydrogen bonding of CO2 molecules with silanol groups (Si-O-H–O-C-O–H-O-Si) on the surfaces of neighboring SiO2 spheres in the opal matrix. It was already interpreted in previous investigations (Ginzburg et al., 1987; Gorlenko et al., 2000; Franz et al., 2017) that kerite was oxidized during the fossilization process (Franz et al., 2022). During opal formation, such oxidized OM therefore contains CO2 bound to Si in black opal.
Different sources of C for the OM can be assumed. One possibility is the degassing of deep mantle-derived CO2. It was discussed for the Korosten pluton that mantle-derived anorthositic rocks were responsible and contributed to a prolonged history of cooling, thus promoting the formation of the exceptionally large chambers (Shumlyanskyy et al., 2021). The degassing of these magmas produced a high CO2 influx, as demonstrated by late CO2-rich fluid inclusions in minerals from the pegmatites (Vozniak and Pavlyshin, 2008; Vozniak et al., 2012), and this C might have been the source for the kerite fossils. However, kerite and black opal were only identified in a few small chambers, but CO2 flux happened at all pegmatites. An alternative C source could have been the graphite-bearing country rocks, which transported C species via fluids into the chambers. But it is also more likely that such a process should affect all pegmatites. The third possibility is C from the surface, transported down into the chambers. According to the model for the kerite fossils, they represent an ecosystem in the deep biosphere below geyser-type ponds (Gorlenko et al., 2000; Zhmur, 2003, Franz et al., 2022). This requires special conditions of a connection of the miarolitic cavities with the surface, which might have been fulfilled for only some of the pegmatites. A note of caution must be added concerning our detailed information about the occurrence in the different pegmatite bodies; due to the fact that mining for the strategic mineral quartz during Soviet times was top secret, and neither kerite nor opal were in the interests of the mining company, there is no systematic information about the occurrence of these materials.
Among all opals on Earth, and consequently among black body-color varieties, Volyn's black opal proves special.
-
It contains OM directly and shows evidence of an OM–silica interaction during its precipitation process (Gouzy et al., 2025).
-
It is formed in a unique pegmatitic environment in contrast to more common volcano-sedimentary types of dark-brown to black opal from localities such as Ethiopia, Australia, Honduras, and Mexico (Banerjee and Wenzel, 1999; Chauviré et al., 2019; Herrmann et al., 2019, and references therein). A slightly similar environment is the Zlatá Baňa andesitic-volcanic complex in Slovakia, which hosts the so-called “Hungarian” opals (containing only a few black specimens). However, the mineralization process differs, as it corresponds to the final stage of hydrothermal volcanic activity (Rondeau et al., 2004), unlike the Volyn one, which seems to be more closely linked to the percolation of subsurface fluids subsequent to the plutonic activity.
-
It contains rare and unique (i.e., not found in other black opal specimens) pegmatitic-derived mineral inclusions such as alkali-feldspar and Li-mica, and ammonium minerals buddingtonite and tobelite, formed by the interaction of OM with the pegmatitic material.
The approximately 1.7 Ga old Volyn pegmatites on the Precambrian Ukrainian Shield with their large miarolitic cavities, hosting a subsurface ecosystem with kerite fossils, are an excellent example for the interaction of OM with igneous rocks. The formation of black opal, pigmented by OM, is a result of this interaction. In this metastable mineral, it is possible to distinguish primary features associated with the precipitation of opal from later alterations.
Pegmatite chambers, which host kerite, have black opal in large amounts. The preservation of shape relicts of kerite fossils in the black opal is a primary feature. These mostly filamentous shape relicts – also in spherical form – indicate that a fluid rich in OM was present during precipitation. At the Volyn locality, opal (black opal but also other color varieties) cements a breccia, which formed in some of the chambers. This event was dated at ca. 1.5 Ga by the K-Ar age of a F-rich muscovite, which formed from alkali-feldspar. During this stage, F was an essential component in the fluid, also shown by the ubiquitous presence of fluorite in the chambers (Lyckberg et al., 2009, 2019) in opal and associated with the kerite fossils (Franz et al., 2022). It is therefore possible that opal precipitated from a solution enriched in SiF4, although considerably much later.
Two stages of opal alteration could be identified; one is associated with the infiltration of fluids along the grain boundaries between opal, rock fragments, quartz crystals, and large crystals of alkali-feldspar. This process comprised diffusion of Fe and Mn into opal, resulting in the formation of large pyrite crystals in the border zones that were subsequently oxidized to Fe oxide. The U-Pb data show that it occurred around 150–170 Ma. The other occurred much later, possibly a (sub)recent event that formed a macroscopically brown alteration crust but did not affect interior parts of the opal.
The data set used in this paper is available at https://doi.org/10.5880/fidgeo.2025.086 (Franz et al., 2026).
Samples are stored at the Mineralogisches Museum, Technische Universität Berlin.
GF: concept and first draft. VK: IR and samples. VC: samples. AZ: U-Pb dating. FS: XRD. UG: SEM. JN: EMPA. SG: writing.
At least one of the (co-)authors is a member of the editorial board of European Journal of Mineralogy. The peer-review process was guided by an independent editor, and the authors also have no other competing interests to declare.
Publisher's note: Copernicus Publications remains neutral with regard to jurisdictional claims made in the text, published maps, institutional affiliations, or any other geographical representation in this paper. The authors bear the ultimate responsibility for providing appropriate place names. Views expressed in the text are those of the authors and do not necessarily reflect the views of the publisher.
The critical, very detailed, and helpful reviews by Armelle Riboulleau, an anonymous reviewer, and the editorial handling by Martine Buatier are gratefully acknowledged.
This research has been supported by the Deutsche Forschungsgemeinschaft (project no. 550599456).
The publication of this article was funded by the Open Access Publication Fund of TU Berlin.
This paper was edited by Martine Buatier and reviewed by Armelle Riboulleau and one anonymous referee.
Amelin, Y. and Back, M.: Opal as a U-Pb geochronometer: Search for a standard, Chem. Geol., 232, 67–86, 2006.
Amelin, Y. V., Heaman, L. M., Verchogliad, V. M., and Skobelev, V. M.: Geochronological constraints on the emplacement history of an anorthosite-rapakivi granite suite: U–Pb zircon and baddeleyite study of the Korosten complex, Ukraine, Contrib. Mineral. Petrol., 116, 411–419, 1994.
Banerjee, A. and Wenzel, T.: Black opal from Honduras, Eur. J. Mineral., 11, 401–408, 1999.
Chauviré, B., Rondeau, B., Alexandre, A., Chamard-Bois, S., La, C., and Mazzero, F.: Pedogenic origin of precious opals from Wegel Tena (Ethiopia): Evidence from trace elements and oxygen isotopes, Applied. Geochem., 101, 127–139, https://doi.org/10.1016/j.apgeochem.2018.12.028, 2019.
Curtis, N. J., Gascooke, J. R., Johnston, M. R., and Pring, A.: A review of the classification of opal with reference to recent new localities, Minerals, 9, 299, https://doi.org/10.3390/min9050299, 2019.
Dowell, K., Mavrogenes, J., McPhail, D.C., and Watkins, J.: Origin and timing of formation of precious black opal nobbies at Lightning Ridge, in: Regolith and Landscapes in Eastern Australia, edited by: Roach, I. C., 18–20, CRC LEME, 2002.
Flörke, O. W., Hollmann, R., Von Rad, U., and Rösch, H.: Intergrowth and twinning in opal-CT lepispheres, Contrib. Mineral. Petrol., 58, 235–242, 1976.
Franz, G., Khomenko, V., Vishnyevskyy, A., Wirth, R., Nissen, J., and Rocholl, A.: Biologically mediated crystallization of buddingtonite in the Paleoproterozoic: Organic-igneous interactions from the Volyn pegmatite, Ukraine, Amer. Mineral., 102, 2119–2135, 2017.
Franz, G., Lyckberg, P., Khomenko, V., Chournousenko, V., Schulz, H.-M., Mahlstedt, N., Wirth, R., Glodny, J., Gernert, U., and Nissen, J.: Fossilization of Precambrian microfossils in the Volyn pegmatite, Ukraine, Biogeosciences, 19, 1795–1811, https://https://doi.org/10.5194/bg-19-1795-2022, 2022.
Franz, G., Khomenko, V., Lyckberg, P., Chournousenko, V., Struck, U., Gernert, U., and Nissen, J.: The Volyn biota (Ukraine) – indications of 1.5 Gyr old eukaryotes in 3D preservation, a spotlight on the “boring billion”, Biogeosciences, 20, 1901–1924, https://https://doi.org/10.5194/bg-20-1901-2023, 2023.
Franz, G., Schiperski, F., Khomenko, V., Gernert, U., Nissen, J., Chornousenko, V., and Zeh, A.: Geochemistry and petrology of black opal in the pegmatites from Volyn (Ukraine), GFZ Data Services [data set], https://doi.org/10.5880/fidgeo.2025.086, 2026.
Gaillou, E., Fritsch, B., Rondeau, B., Post, J., Barreau, A., and Ostromov, M.: Common gem opal: An investigation of micro- to nano-structure, Am. Mineral., 93, 1865–1873, https://doi.org/10.2138/am.2008.2518, 2008.
Gigashvilii, G. M. and Kalyuzhny V. A.: Black opal from pegmatite of Volyn, containing organic matter, Moscwa Academia NAUK SSSR, 186, 1154–1158, 1969 (in Russian).
Ginzburg, A. I., Bulgakov, V. S., Vasilishin, I. S., Luk’yanova, V. T., Solntseva, L. S., Urmenova, A. M., and Uspenskaya, V. A.: Kerite from pegmatites of Volyn, Dokl. Akad. Nauk SSSR, 292, 188–191, 1987 (in Russian).
Gorlenko, V. M., Zhmur, S. I., Duda, V. I., Osipov, G. A., Suzina, N. E., and Dmitriev, V. V.: Fine structure of fossilized bacteria in Volyn kerite, Orig. Life Evol. Biosph., 30, 567–577, 2000.
Gouzy, S., Phan, V. T. H., Bejach, L., Vinogradoff, V., Rondeau, B., Chauviré, B., Beck, P., Flandinet, L., Franz, G., Khomenko, V., and Carter J.: Preservation of biosignatures in opal probed by infrared nanospectroscopy, Geochem. Perspec. Lett., 35, 42–48, https://doi.org/10.7185/geochemlet.2522, 2025.
Graetsch, H., Flörke, O. W., and Miehe, G.: The nature of water in chalcedony and opal-C from Brazilian agate geodes, Phys. Chem. Mineral., 12, 300–306, 1985.
Guthrie Jr., G. D., Dish, D. L., and Reynolds Jr, R. C.: Modeling the X-ray diffraction pattern of opal-CT, Amer. Mineral., 80, 869–872, 1995.
Herrmann, J. R., Maas, R., Rey, P. F., and Best, S. P.: The nature and origin of pigments in black opal from Lightning Ridge, New South Wales, Australia, Austral. J. Earth Sci., 66, 1027–1039, https://doi.org/10.1080/08120099.2019.1587643, 2019.
Iler, R. K.: Formation of precious opal, Nature, 207, 472–473, 1965.
Kalyuzhny, V. A. (Ed.): Mineral-forming fluids and paragenesis of minerals of chamber type pegmatites of Ukraine (liquid inclusions, thermobarometry, geochemistry), Nauk. dumka, Kyiv, 1971 (in Russian).
King, P. L., Vennemann, T. W., Holloway, J. R., Hervig, R. L., Lowenstern, J. B., and Forneris, J. F.: Analytical techniques for volatiles: A case study using intermediate (andesitic) glasses, Amer. Mineral., 87, 1077–1089, 2002.
Kutzschbach, M., Franz, G., Khomenko, V., Chournousenko, V., Zeh, A., Müller, W., and Erhardt, T.: New age constraints for the Volyn biota, Göttingen, 2025.
Langer, K. and Flörke, O. W.: Near infrared absorption spectra (4000–9000 cm−1) of opals and the role of water in these SiO2 ⋅ nH2O minerals, Fortschr. Miner., 52, 17–51, 1974.
Lee, S., Xu, H., Xu, H., and Xu, W.: Reexamination of the structure of nanomineral opal-CT using synchrotron X-ray diffraction, transmission electron microscopy, X-ray scattering structure factor, and pair distribution function analyses, Am. Mineral., 110, 721–730, https://doi.org/10.2138/am-2024-9333, 2025.
Li, N., Guo, Q., Wang, Q., and Liao, L.: Water characterization and structural attribution of different colored opals, RSC Advances, 12, 30416–30425, https://doi.org/10.1039/d2ra04197a, 2022.
Liesegang, M. and Tomaschek, F.: Tracing the continental diagenetic loop of the opal-A to opal-CT transformation with X-ray diffraction, Sedim. Geol., 398, 105603, https://doi.org/10.1016/j.sedgeo.2020.105603, 2020.
Lyckberg, P., Chornousenko, V., and Wilson W. E.: Famous mineral localities: Volodarsk-Volynski, Zhitomir Oblast, Ukraine, The Mineral. Rec., 40, 473–506, 2009.
Lyckberg, P., Chournousenko, V., and Chournousenko, O.: Giant heliodor and topaz pockets of the Volodarsk chamber pegmatites, Korosten pluton, Ukraine, 36th Inter. Gemm. Conf., Nantes, France, 78–83, 2019.
Nemchin, A. A., Neymark, L. A., and Simons, S. L.: U–Pb SHRIMP dating of uraniferous opals, Chem. Geol., 227, 113–132, 2006.
Newman, S., Stolper, E. M., and Epstein, S.: Measurement of water in rhyolitic glasses; calibration of an infrared spectroscopic technique, Am. Mineral., 71, 1527–1541, 1986.
Neymark, L. A. and Paces, J. B.: Consequences of slow growth for 230Th U dating of Quaternary opals, Yucca Mountain, NV, USA, Chem. Geol., 164, 143–160, 2000.
Neymark, L. A. and Paces, J. B.: Ion-probe U–Pb dating of authigenic and detrital opal from Neogene-Quaternary alluvium, Earth Planet. Sc. Lett., 361, 98–109, 2013.
Neymark, L. A., Amelin, Y., Paces, J. B., and Peterman, Z. E.: U-Pb ages of secondary silica at Yucca Mountain, Nevada: implications for the paleohydrology of the unsaturated zone, Appl. Geochem., 17, 709–734, 2002.
Nuriel, P., Miller, D. M., Schmidt, K. M., Coble, M. A., and Maher, K.: Ten-million years of activity within the Eastern California Shear Zone from U–Pb dating of fault-zone opal, Earth Planet. Sci. Lett., 521, 37–45, 2019.
Paces, J. B., Neymark, L. A., Wooden, J. L., and Persing, H. M.: Improved spatial resolution for U-series dating of opal at Yucca Mountain, Nevada, USA, using ion-microprobe and microdigestion methods, Geochim. Cosmochim. Acta, 68, 1591–1606, 2004.
Pearce, N. J., Perkins, W. T., Westgate, J. A., Gorton, M. P., Jackson, S. E., Neal, C. R., and Chenery, S. P.: A compilation of new and published major and trace element data for NIST SRM 610 and NIST SRM 612 glass reference materials, Geostand. Newslett., 21, 115–144, 1997.
Proshko, V. Y., Bagmut, N. N., Vasilishin, I. S., and Panchenko, V. I.: Ammonium feldspars from Volyn pegmatites and their radiospectroscopic properties, Mineral. J. Ukraine, 9, 67–71, 1987 (in Russian).
Rondeau, B., Fritsch, E., Guiraud, M., and Renac, C.: Opals from Slovakia (“Hungarian” opals): a re-assessment of the conditions of formation, Eur. J. Mineral., 16, 789–799, https://doi.org/10.1127/0935-1221/2004/0016-0789, 2004.
Slivko, M. M. and Pavlyshyn, V. I.: The finding of opal with an organic substance in Volynian pegmatites, L'vov Geologicheskiy Obshchestvennyy Mineralogicheskiy Sbornik, 21, 246–257, 1967 (in Russian).
Shumlyanskyy, L., Hawkesworth, C., Billström, K., Bogdanova, S., Mytrokhyn, O., Romer, R., Dhuime, B., Claesson, S., Ernst, R., Whitehouse, M., and Bilan, O.: The origin of the Palaeoproterozoic AMCG complexes in the Ukrainian shield: New U-Pb ages and Hf isotopes in zircon, Precam. Res., 292, 216–239, 2017.
Shumlyanskyy, L., Franz, G., Glynn, S., Mytrokhyn, O., Voznyak, D., and Bilan O.: Geochronology of granites of the western part of the Korosten AMCG complex (Ukrainian Shield): implications for the emplacement history and origin of miarolitic pegmatites, Eur. J. Min., 33, 703–716, https://doi.org/10.5194/ejm-33-703-2021, 2021.
Sriaporn C., Komonjinda, S., Awiphan, S., Sanatitharangkun, S., Banjongprasert, C., Sathunankul, M., and Ramsiri, B.: Mineralogical and microbial characterization of alkali hot spring microbial mats and deposits in Pong Dueat Pa Pae hot spring, Northern Thailand, Extremophiles, 28, 29, https://doi.org/10.1007/s00792-024-01343-5, 2024.
Vozniak, D. K. and Pavlyshin, V. I.: Physico-chemical conditions of formation and peculiarities of localization of chamber pegmatites of Volyn (the Ukrainian Shield), Mineral. J. Ukraine, 30, 5–20, 2008 (in Ukrainian).
Vozniak, D. K., Khomenko, V. M., Franz, G., and Wiedenbeck, M.: Physico-chemical conditions of the final stage of formation of Volyn pegmatites according to thermobarometry and infrared spectroscopy of beryl, Mineral. J. Ukraine, 34, 26–38, 2012 (in Ukranian with English abstract).
Wendt, I. and Carl, C.: U-Pb dating of discordant 0.1 Ma old secondary U minerals, Earth Planet. Sci. Lett., 73, 278–284, 1985.
Zhmur, S. I.: Origin of Cambrian fibrous kerites of the Volyn region, Lithol. Mineral Resour., 38, 55–73, 2003.