the Creative Commons Attribution 4.0 License.
the Creative Commons Attribution 4.0 License.
 | 03 Dec 2025
Heat capacity and entropic mixing behaviour of the orthopyroxene solid solution (Mg,Fe)2Si2O6
Artur Benisek
Lado Cemič
The heat capacity (Cp) of synthetic members of the orthopyroxene solid solution enstatite (Mg2Si2O6: En)-ferrosilite (Fe2Si2O6: Fs) was measured at between 2 to 300 K using relaxation calorimetry and between 340 to 823 K using differential scanning calorimetry. The samples (nine solid-solution members plus En and Fs) were characterised by optical microscopy and by X-ray powder diffraction methods. The actual compositions of the solid-solution members were checked by comparing the cell volumes determined in this work with corresponding data in the literature which provide a correlation between cell volume and composition.
The Cp's of the endmembers above room temperature can be represented by the following polynomials (J K−1 mol−1): and Compared to literature and data set values, the polynomial for En yields 1.5 % to 3 % lower heat capacities at high temperatures and should be preferred for phase equilibrium calculations >1000 K.
The standard entropy of En was determined to be J K−1 mol−1 and that of Fs to be J K−1 mol−1 based on the Physical Properties Measurement System (PPMS) measurements.
All solid-solution members and Fs show heat capacity anomalies below ∼50 K. Discrete Cp peaks, related to magnetic ordering, occur at a Néel temperature of TN=38.4 K in pure Fs, and a double peak occurs at 38 K and at 29 K in the composition En10Fs90. With further dilution of the magnetic Fe2+ ion, heat capacity anomalies are present in the form of broad shoulders in the Cp data between approximately 10 and 25 K. At the lowest temperatures, around 2 K, Schottky-type Cp anomalies are visible.
By adopting a Kieffer model for the lattice part of Cp, the excess heat capacities of each compound were derived and decomposed into magnetic and electronic contributions. The calorimetric entropies at 298.15 K (Scal), when plotted against composition, indicate a linear relationship along the join; i.e. all Scal values fall on the line defining thermodynamic ideality within error. There are thus no excess entropies of mixing in the En–Fs orthopyroxene solid solution. The same holds true for the volumes.
- Article
(4264 KB) - Full-text XML
-
Supplement
(1648 KB) - BibTeX
- EndNote


Most orthopyroxenes are solid solutions between the endmembers En and Fs. Their thermodynamic and kinetic properties are therefore needed in order to model the P–T–X paths of igneous and metamorphic rocks. The knowledge of the heat capacity behaviour down to very low temperatures allows calculations of thermodynamic variables of state, such as the entropy of mixing. To our knowledge, these kinds of data exist only for the endmembers of the solid solution in the literature. Krupka et al. (1985a, b) measured the low-temperature heat capacities of synthetic En between 5 and 385 K by means of adiabatic calorimetry (AC) and the high-temperature heat capacities between 350 and 1000 K using differential scanning calorimetry. From their cryogenic measurements, the standard entropy So of En was determined to be 132.5±0.3 J K−1 mol−1. Also applying AC, Bohlen et al. (1983) measured the heat capacity of Fs at temperatures between 8 and 350 K and derived So=189.2 J K−1 mol−1. Cemič and Dachs (2006) used the Physical Properties Measurement System (PPMS) at Salzburg University and a Perkin Elmer DSC 7 at the University of Kiel to measure the heat capacity of Fs in the temperature range between 2 and 820 K. Several other studies dealt with the magnetic, electronic, and optical properties of this endmember (see Zherebetskyy et al., 2010, and references therein). Conducting temperature-dependent X-ray diffraction measurements, the thermal expansion of various natural orthopyroxenes and clinopyroxenes was determined by Hovis et al. (2021). The enthalpy of Mg–Fe ordering was determined calorimetrically by Cemič and Kähler (2000).
The aim of this work is to determine the heat capacities of the endmembers and the intermediate members of the solid solution and to calculate the entropic mixing properties of the system En–Fs.
2.1 Sample synthesis and characterisation
Nine members of the orthopyroxene solid solution (Mg,Fe)2Si2O6 were synthesised at 1.5 GPa and 800 °C using the synthetic endmembers enstatite (Mg2Si2O6 – En) and ferrosilite (Fe2Si2O6 – Fs). The nominal compositions ranged from En90Fs10 to En10Fs90 in steps of 0.1 in the mole fraction XFs. The synthesis procedure of Fs has been described in Cemič and Dachs (2006), and that of En has been described in Koch-Müller et al. (1992). Mixtures of the two endmember components were finely ground in an agate mortar and then sealed in a silver capsule together with a small amount (4 µL) of distilled water. The capsule was then inserted into a larger gold capsule containing a mechanical mixture of wüstite and iron. A small amount of water was added, and the capsule was mechanically sealed. The use of the wüstite-iron buffer is intended to keep the oxygen fugacity low in order to prevent a partial oxidation of Fe2+ to Fe3+ in the pyroxenes.
The synthesis was carried out in a piston cylinder apparatus at 1.5 GPa and 800 °C. The experimental time was varied between 24 and 48 h, depending on the composition. The En-rich samples required a longer duration of the experiment.
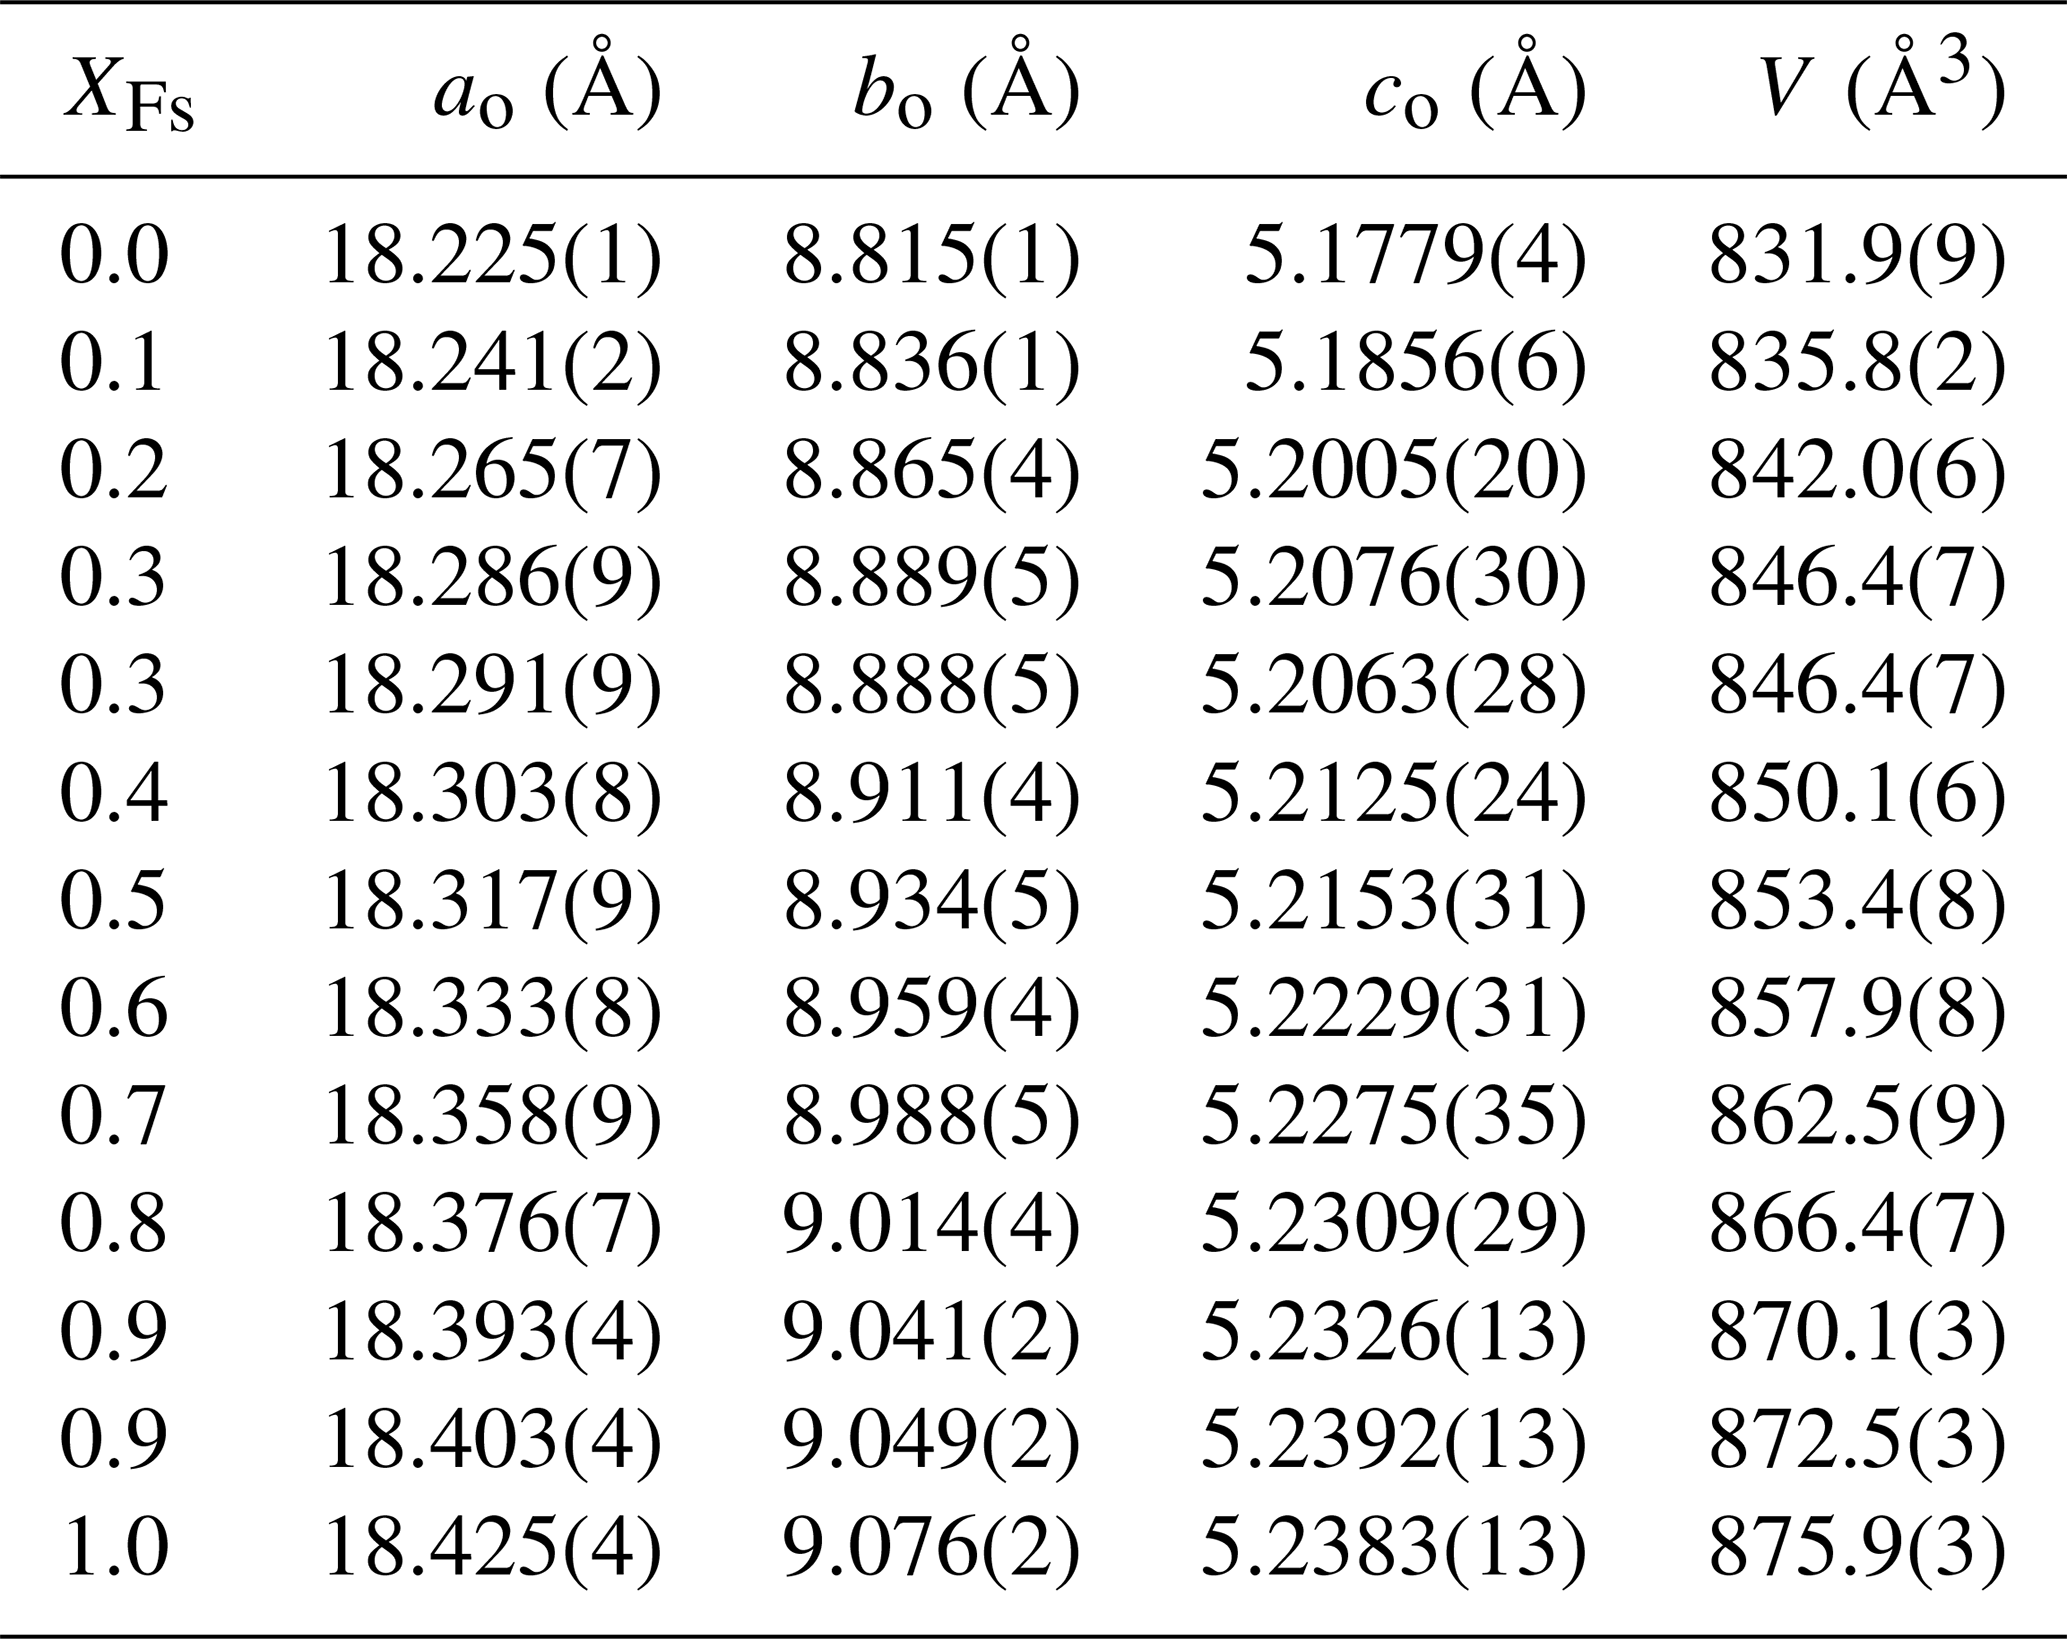
The synthesis products were examined with optical microscopy and powder X-ray diffraction using an automated diffractometer (Siemens D 5000) between 8 and 100 2Θ using Cu–Kα radiation. The step size was 0.016 2Θ, and the measuring time was 11 s per step. The lattice parameters were refined with the Rietveld program Fullprof (Rodriguez-Carvajal, 1990). Gramenopoulou (1981) determined cell volumes of synthetic En–Fs solid-solution members and measured their composition via microprobe analysis, establishing the composition–cell volume relationship V (Å3). Recalculating XFs using this relationship and the cell volumes determined in this study, it turns out that measured and nominal compositions agree to within 0.03 mole fractions. Mössbauer spectroscopy performed on the Fs endmember (Cemič and Dachs, 2006) showed that no Fe3+ was detected, and we assume that the same applies for the Fe-bearing solid-solution members studied calorimetrically in this work due to identical experimental conditions.
2.2 Calorimetric methods and data evaluation
Low-temperature heat capacities were measured using a commercially available relaxation calorimeter (heat capacity option of the Quantum Design® Physical Properties Measurement System – PPMS). The data were collected in triplicate at 60 different temperatures between 2 and 300 K, using a logarithmic spacing resulting in a higher data density at a lower temperature. The samples consisted of 18–22 mg of crystallites wrapped in thin Al foil and compressed into a ∼0.5 mm thick pellet; see Geiger and Dachs (2017) or Rosen and Woodfield (2020) for more details on the advantages and disadvantages of this sample preparation technique. The pressed pellet was then attached to the sample platform of the calorimeter with Apiezon N grease to facilitate the required thermal contact. The so-called sample coupling, a parameter provided by the PPMS software, is a measure of the quality of the thermal conductance between platform and sample. It should ideally be close to 100 %; otherwise, Cp's tend to be too low (Dachs and Bertoldi, 2005). Further details on the calorimetric technique and measuring procedures have already been published (Lashley et al., 2003; Dachs and Bertoldi, 2005; Kennedy et al., 2007; Dachs and Benisek, 2011; Rosen and Woodfield, 2020).
In the temperature region between 340 and 820 K, the measurements were made with a Perkin Elmer DSC 7. The experimental technique was similar to that described in Bosenick et al. (1996). The calorimetric molar entropy (Scal) of each compound at 298.15 K was calculated by numerically solving the integral
Scal corresponds to the standard-state (third-law) entropy, So, in the case of an ordered endmember (which assumes ). Errors in Scal were estimated according to Dachs and Benisek (2011). The entropy increment of 0–2 K, not covered by measured Cp data, was estimated as described in Sect. 3.2.5.
2.3 Density functional theory (DFT) calculations
Quantum-mechanical calculations were based on the density functional theory (DFT) plane wave pseudo-potential approach implemented in the CASTEP code (Clark et al., 2005; Refson et al., 2006) included in the Materials Studio software from Biovia®. They were employed to compute the heat capacity at constant volume, Cv, of pure En but not of intermediate compositions or of Fs, where the various magnetic and electronic spin states of Fe2+ complicate such calculations. The calculations used the local density approximation (LDA) for the exchange correlation functional (Ceperley and Alder, 1980) and norm-conserving pseudo-potentials to describe the core valence interactions. For the k-point sampling of the investigated unit cells, a Monkhorst–Pack grid (spacing of 0.05 Å−1) was used (Monkhorst and Pack, 1976). The structural relaxation was calculated by applying the BFGS algorithm (Pfrommer et al., 1997), where the convergence threshold for the force on an atom was 0.01 eV Å−1. The lattice dynamical calculations were performed for these relaxed structures within the linear response approximation implemented in CASTEP using the interpolation approach.
3.1 Overall heat capacity behaviour and entropy
Measured low- and high-temperature heat capacities of the endmembers En and Fs, as well as of all studied solid-solution members, are shown in Fig. 1 as a function of temperature (all calorimetric data are compiled in Table S1 in the Supplement). The sample coupling was >99 % in the majority of PPMS measurements; only in one case was it around 97 % at low T values.
3.1.1 Endmembers
Enstatite. Fitting the uppermost PPMS data around ambient T and the DSC data of En to a Berman–Brown-type Cp polynomial (Berman and Brown, 1985) yields the following in J K−1 mol−1:
Note that this type of polynomial allows extrapolation to temperatures higher than the experimental range. Compared to the low-temperature AC data of Krupka et al. (1985a), PPMS Cp data for En are ∼1 % larger at T<150 K and, at maximum, 1 % smaller above that temperature up to room temperature (Fig. S1a, b). The DSC data measured by Krupka et al. (1985b) are generally larger by 1 %–2 % than the DSC-measured Cp of this study for this phase.
Integrating PPMS-measured yields a standard entropy of J mol−1 K−1 for En compared to So=132.5 J K−1 mol−1 as derived by Krupka et al. (1985a) from their low-T AC data. Due to the small absolute value of Cp at T<2 K, the entropy increment between 0 and 2 K is very small (<0.00014 J K−1 mol−1) and can be neglected.
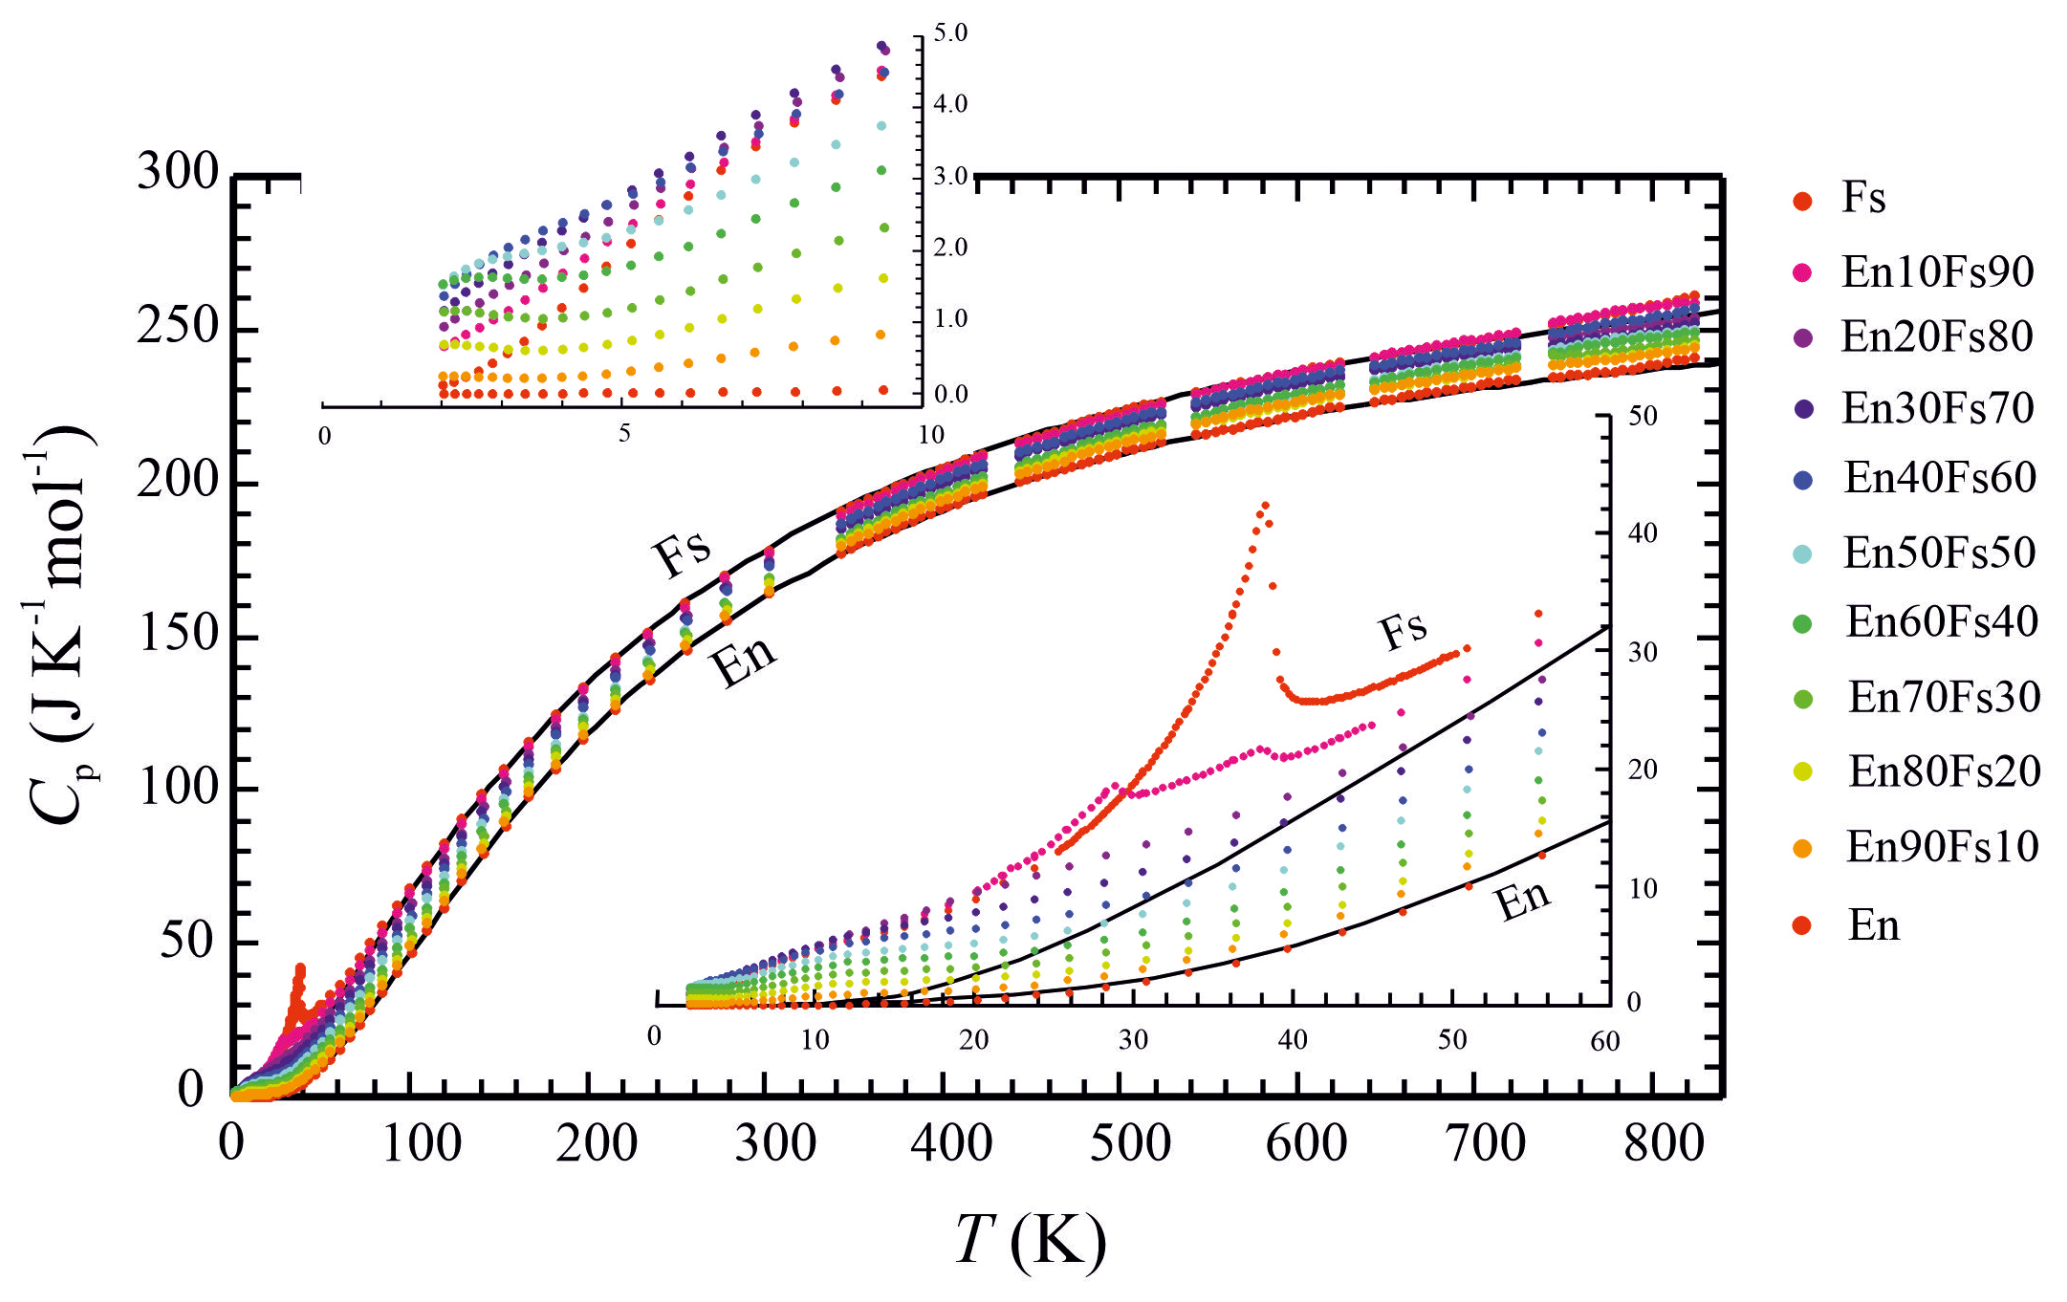
Figure 1Heat capacities of members of the enstatite (En)–ferrosilite (Fs) binary, as measured in this study. The lower-right inset shows the temperature region of 0 to 60 K, where magnetic heat capacity anomalies dominate, in more detail. The upper-left inset shows the temperature region of 0 to 10 K, where Schottky anomalies occur, in more detail. The two black lines are the lattice (vibrational) heat capacities of En and Fs, from the Kieffer model for Cv, using parameters given in Table 3 and performing the Cv to Cp conversion as described in the text.
Ferrosilite. The encapsulation method for powders as used in this study for the PPMS measurements, i.e. wrapping the synthesised material (around 20 mg) in thin Al foil (weighing ca. 5.5 mg) and then pressing this arrangement into a flat pellet, yields low-TCp's for Fs that connect smoothly to the DSC data (Fig. S2). Around ambient T, they agree with Cp as determined by Cemič and Dachs (2006), whereas, at lower temperatures, they are up to 2 % larger compared to the older data. The reason for this discrepancy is likely to be the better sample coupling prevailing in the PPMS measurements of this study (>98 %), whereas, in the older measurements, sample couplings were not optimal (88 %–95 %), likely resulting in somewhat too-low heat capacities. Furthermore, DSC Al pans with weights around 55 mg were the containers for the powder samples in these measurements. Due to this approximately 10-times-larger weight compared to the Al foil, as used in this study to encapsulate the powder, the contribution of the container heat capacity to total measured Cp was much larger in the arrangement used by Cemič and Dachs (2006) to measure the heat capacity of synthetic Fs. This constitutes a major shortcoming inherent in the former encapsulation method and was the motivation to develop the “Al foil technique”.
Cemič and Dachs (2006) described a prominent λ-shaped heat capacity anomaly of Fs occurring at 38.7 K and interpreted this transition to be caused by anti-ferromagnetic ordering of the Fe2+ spin moments. The remeasured data of this study show the peak of this anomaly at a slightly lower Néel temperature of TN=38.4 K and a Schottky-like shoulder around 10 K.
From the DSC data combined with the PPMS data around ambient T, we derive the following polynomial for computing Fs's heat capacity above room temperature (J K−1 mol−1):
Around ambient T, this polynomial gives a slightly larger Cp than that published in Cemič and Dachs (2006); above approximately 400 K, both polynomials agree with each other.
Fs's standard entropy is determined to be J K−1 mol−1, 1.5 J K−1 mol−1 larger than that determined by Bohlen et al. (1983) from AC but 4.2 J K−1 mol−1 larger than that given in Cemič and Dachs (2006). Their So for Fs constitutes a too-low value for the reasons mentioned above. A small entropy increment still has to be added to the above So (see below).
3.1.2 Solid-solution members
Cell volumes along the En–Fs binary, computed from the Rietfeld-derived lattice constants given in Table 1, are plotted in Fig. S3. All volumes fall onto the straight line defining ideal mixing within error, and so there are no excess volumes of mixing in this solid solution.
Table 1Lattice constants and cell volumes of the synthesised En–Fs solid-solution members, as determined from Rietfeld refinements. For the compositions XFs=0.3 and 0.9, two determinations have been made.
The heat capacities of the En–Fs solid-solution members above approximately 50 K show the expected behaviour to fall in a 15–20 Cp-units-wide band, with Cp of En forming the lower limit and Cp of Fs forming the upper limit (Fig. 1). For a constant temperature, it is consistently fulfilled in this band, such that ); i.e. the heat capacity of a specific solid-solution member is smaller by 1.5–2 J K−1 mol−1 than its next Fe-richer neighbour, with no overlaps or crossings in the data. At lower temperatures, down to the lowest T at which Cp data could be measured (∼2 K), the situation gets more complex. This is the region where magnetic and electronic effects contribute to lattice heat capacity. Noteworthy is the composition En10Fs90. This solid-solution member shows a double magnetic Cp anomaly with one distinctive shoulder at the same temperature as the prominent λ transition in pure Fs (∼38 K) and one, compared to Fs100, considerably smaller peak at ∼29 K (Fig. 1, right inset). In the heat capacity data of the other more Mg-rich compositions, the discrete magnetic Cp peaks observed for Fs and En10Fs90 are obviously flattened out. Magnetic contributions to heat capacity are present here in the form of broad shoulders in the Cp data between approximately 10 and 25 K, decreasing in size with decreasing XFs, rather similarly to that observed in olivine solid solutions (Dachs et al., 2007).
At the lowest temperatures, the Cp behaviour of the En–Fs solid-solution members is complicated even more by contributions from Schottky-type Cp anomalies (left inset of Fig. 1). These are seen as plateau-like features (En90Fs10), slight upturns (En80Fs20, En70Fs30, En60Fs40), or shoulders (En50Fs50, En40Fs60, En30Fs70) in Cp from the data portion around the low-temperature end. One would also expect that the heat capacity at 2 K of the Fe-rich compositions should be larger than those of the Mg-rich ones. This is, however, not the case. In fact, Cp of the intermediate compositions is largest at this temperature, around 1.5 J K−1 mol−1, whereas Fe-rich, as well as Mg-rich, solid-solution members show comparable smaller Cp values of <1.0 J K−1 mol−1 around 2 K (Fig. 1, left inset).
Figure 2 is a plot of endmember and solid-solution member calorimetric entropies at 298.15 K (Scal) as a function of composition (data are given in Table 2). As all the data points fall on the line defining ideal mixing within error, no excess entropies arise from Fe–Mg mixing in the En–Fs binary (note that this type of excess entropy is not to be confused with the excess entropies, Sex, of an individual solid-solution composition, as tabulated in Table 2, which describes extra contributions to the overall entropy due to magnetic and/or electronic effects (Schottky contribution)). When the entropy increment from 0 to 2 K, not covered by experimental data, is taken into account (see Sect. 3.2.5) and added to Scal, a small modification of these entropy data occurs, giving S298, the total entropy from 0 to 298.15 K.
Table 2Calorimetric entropies at 298.15 K (Scal) of members of the En–Fs solid solution, determined from the PPMS-measured low-T heat capacities of this study, compiled in Table S1 (numbers in parentheses are 1 standard deviation and refer to the last digit). Adding the entropy increment 0–2 K, not included in Scal, yields the total entropy at 298.15 K, S298. Additionally given are the vibrational and excess entropies Svib and Sex, derived by decomposition of Scal (errors in Sex are assumed to be of the same size as for Scal). Sex is further decomposed into Schottky-type and magnetic contributions, and the corresponding increments from 0 to 2 K are listed in parentheses (see the text for more details).
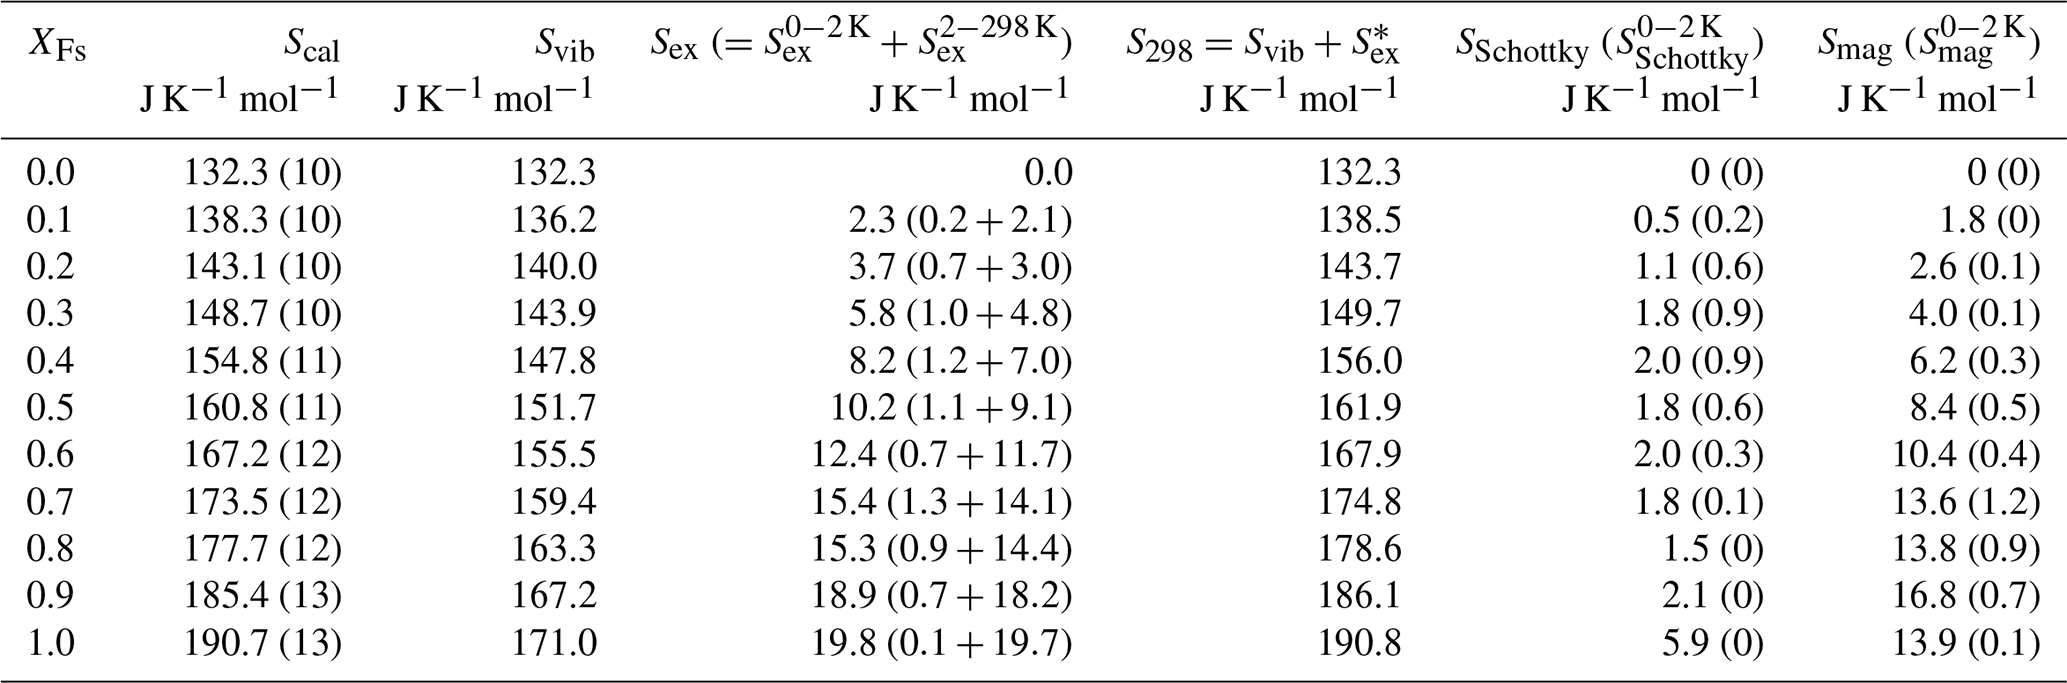
∗ Note that S298 is also equal to the sum because is negligibly small.
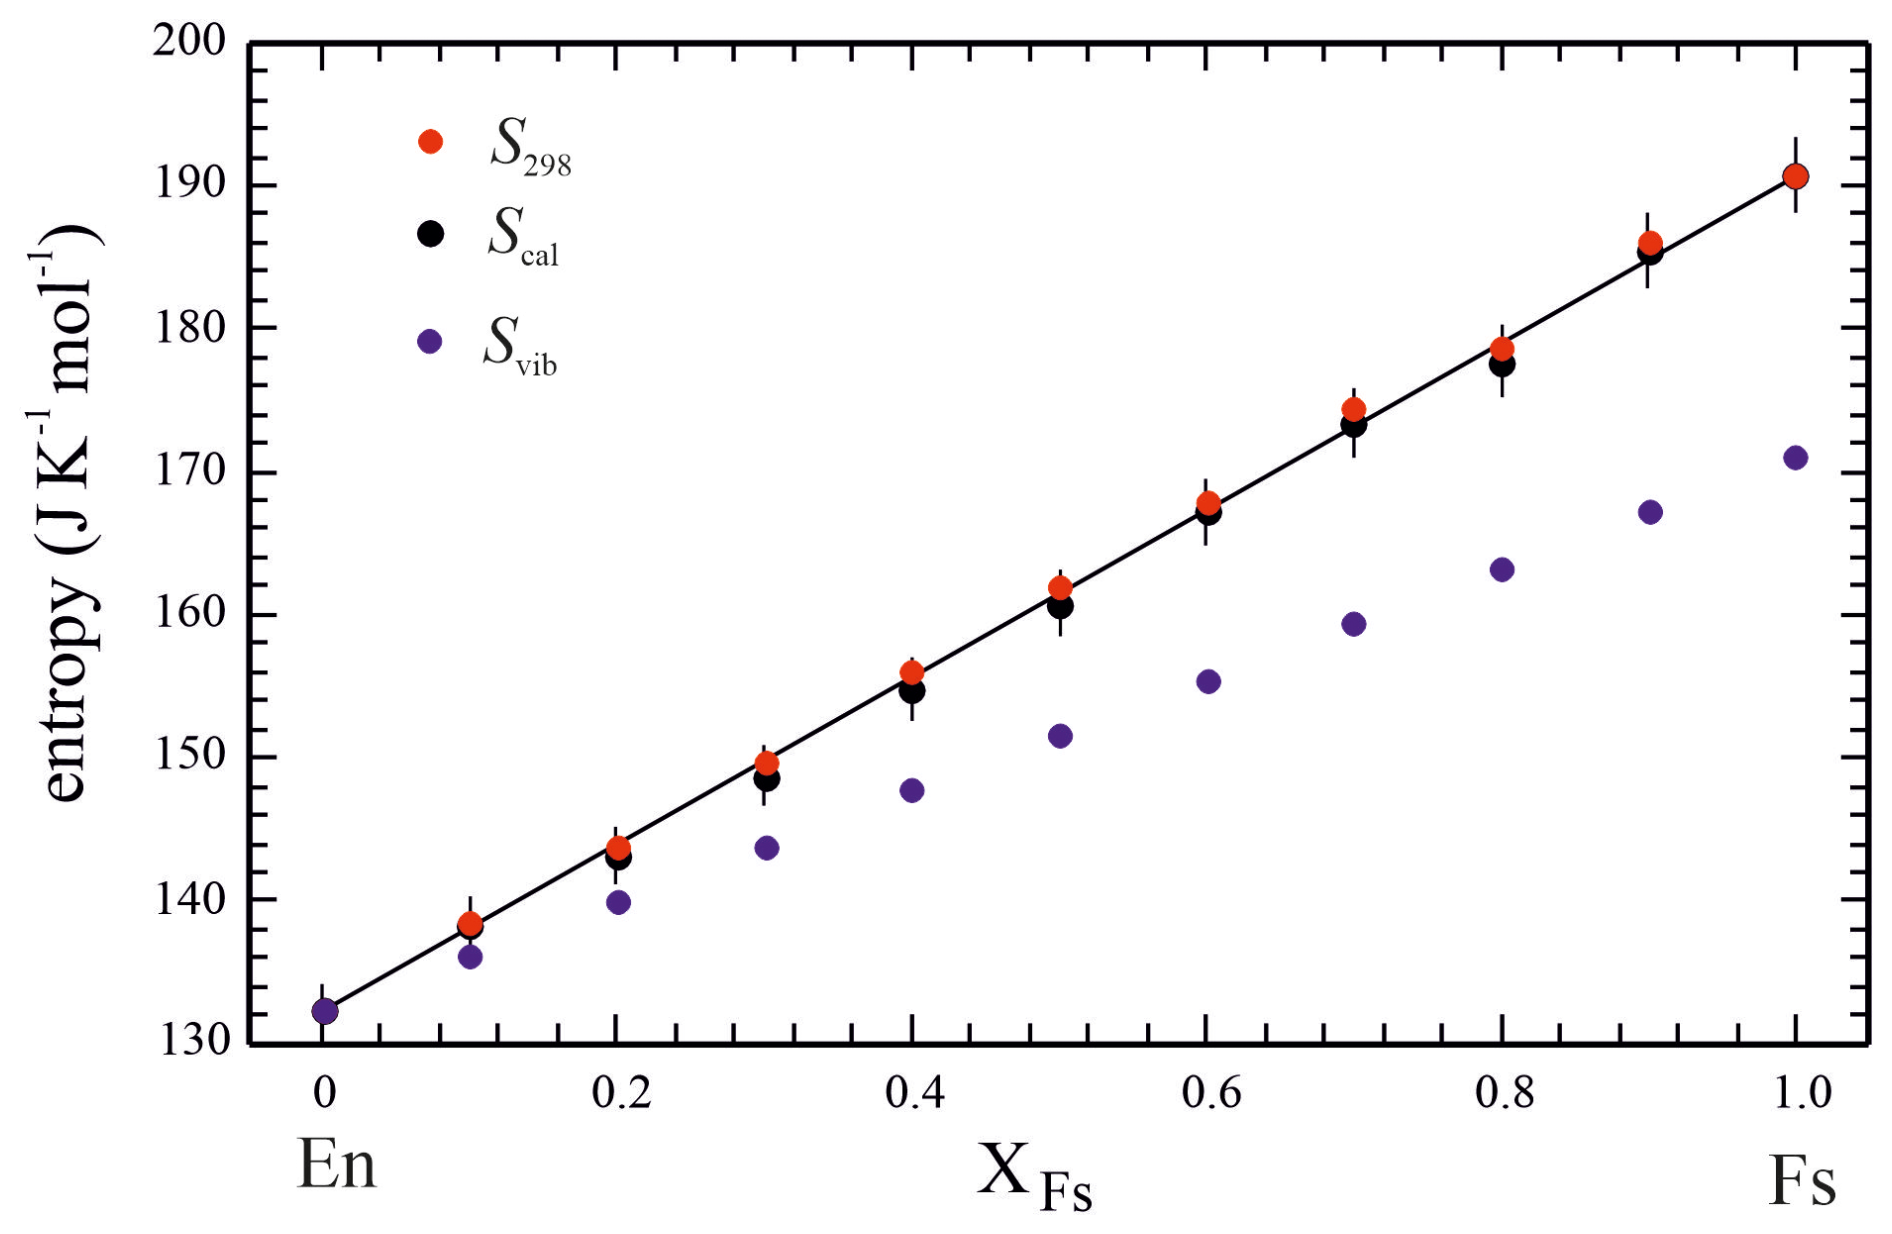
Figure 2Calorimetric entropies at 298.15 K (Scal) as a function of composition along the En–Fs solid solution (data from Table 2). Adding estimated entropy increments from 0 to 2 K to Scal, as described in the text, yields S298 for each compound. The vibrational entropies along the solid solution, Svib, are assumed to be linear combinations of corresponding endmember properties.
3.2 Lattice and excess heat capacity and entropy
The non-lattice or excess heat capacity, defined as Cex=Cv - Cvib, is obtained by subtracting a model lattice (or vibrational) heat capacity, Cvib, from the experimental heat capacity Cp of a specific composition after converting Cp into Cv, the heat capacity at constant volume. Cex is relevant for all Fe-bearing En–Fs compositions that have non-lattice contributions to heat capacity, like magnetic (Cmag) or electronic (Cel) ones (Schottky anomalies), in which case, . Designating the difference of Cp−Cv as ΔC, the excess heat capacity can be obtained from the experimental heat capacity using the following relationship:
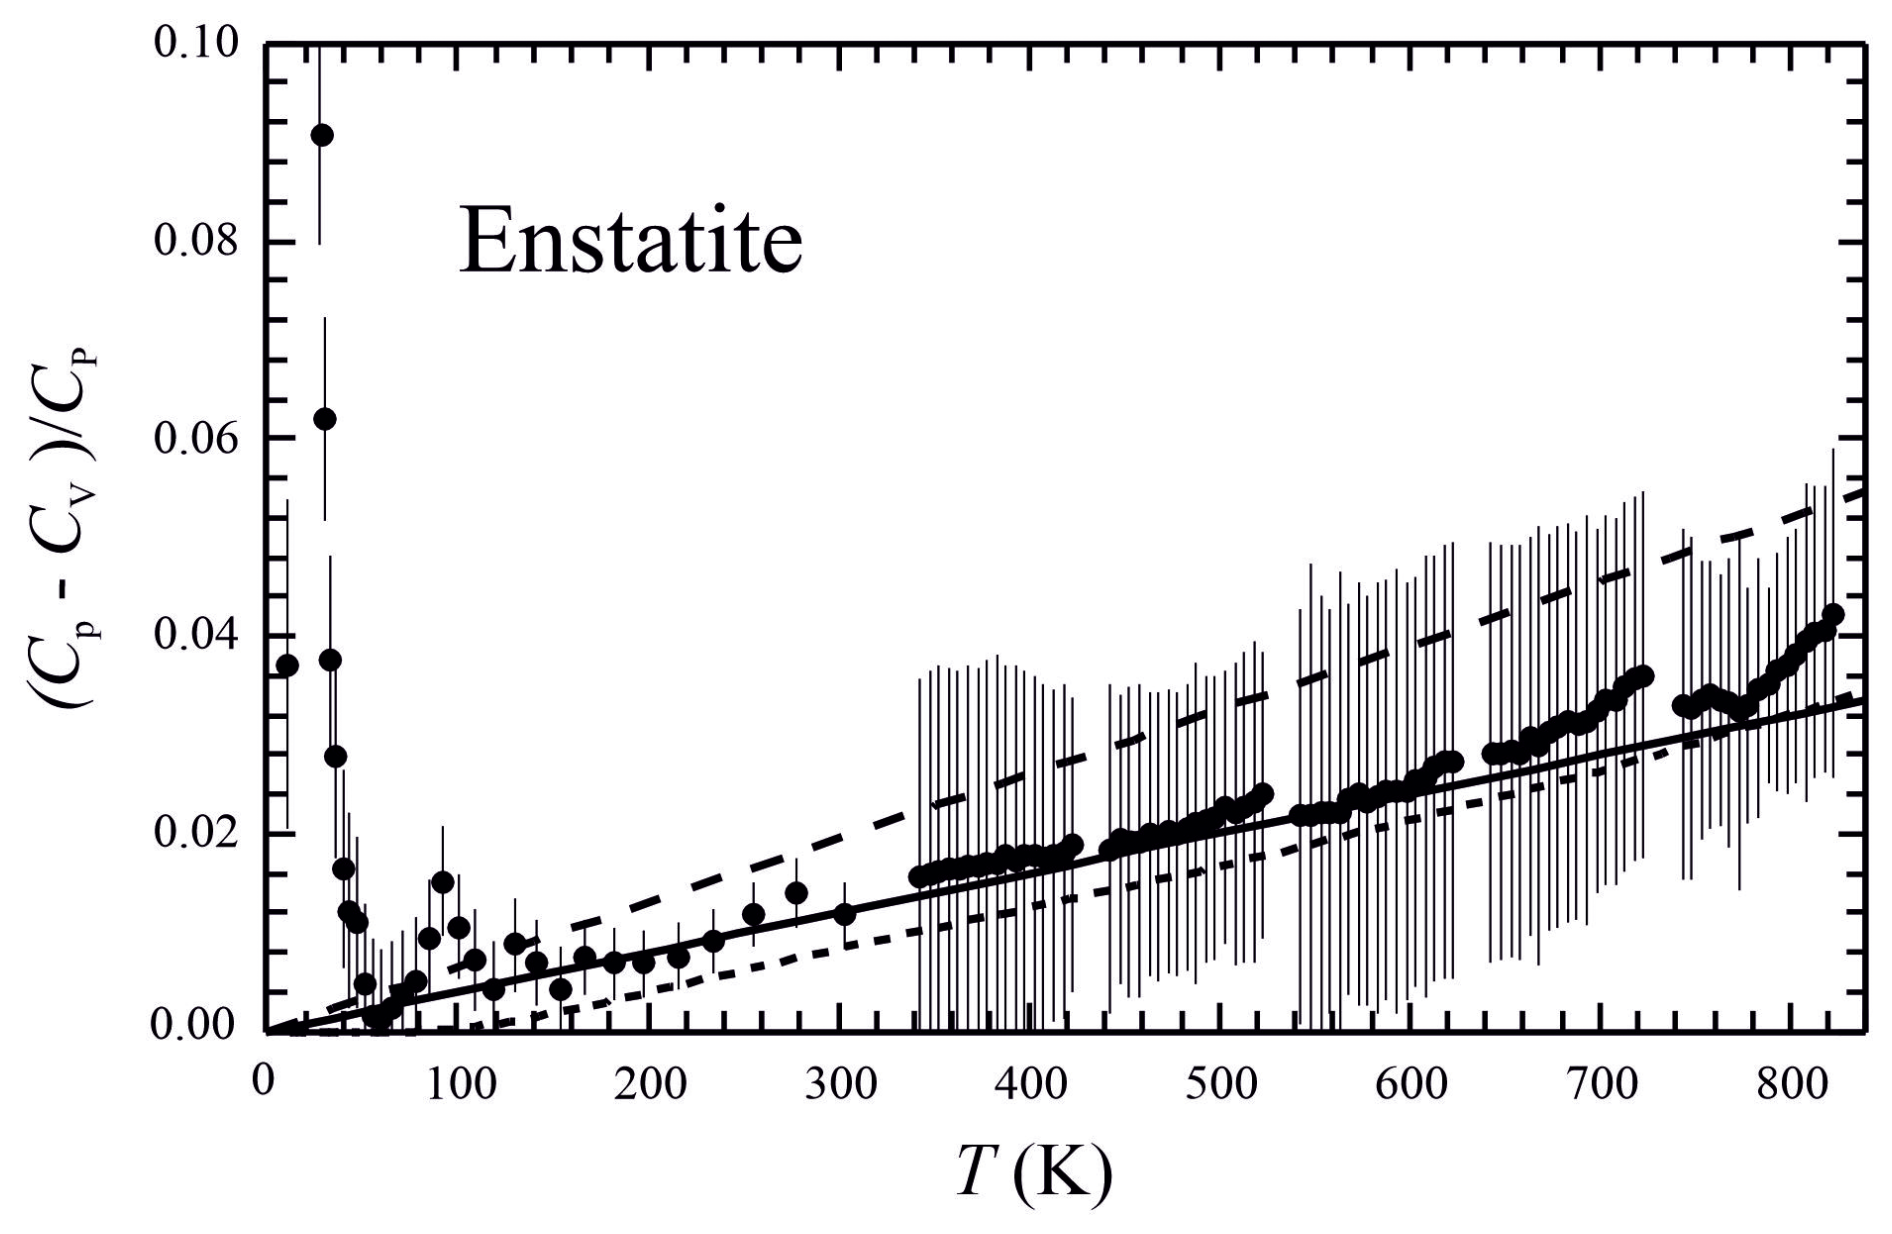
Figure 3 for enstatite as a function of temperature. For Cp, the PPMS- and DSC-measured values of this study were taken, whereas Cv is DFT-computed (error bars are ±2 SDs). Solid line represents Eq. (5) with a slope of m=0.00004. The short-dashed line would result if the Cp−Cv difference were to be calculated from the relation with computed values for V and α in accordance with those of Hovis et al. (2021), giving a slope of m=0.00005; a steeper slope of m=0.00007 would be required (long-dashed line) to achieve a match of Cv with the DSC data of Krupka et al. (1985b).
3.2.1 Converting Cp into Cv
This conversion could be principally done based on the well-known relationship . This requires reliable data for the molar volume, V; the thermal expansivity, α; and the isothermal compressibility, κ, for a specific compound. In this study, we adopted the procedure used by Benisek and Dachs (2018) to calculate ΔC. It was shown in this work that the quotient Cp−Cv over Cp for diopside and jadeite behaves linearly with temperatures approaching zero at 0 K so that
where m is the mineral-specific slope of this line. In order to further test this relationship, we applied DFT methods to directly compute Cv of En. Figure 3 is a plot of for En vs. temperature, showing that a linear relationship is fulfilled well down to T values of around 50 K. We used the solid line indicated in Fig. 3, with a slope of m=0.00004, for computing En's . A slightly steeper slope would result if ΔC was computed from . Solving Eq. (5) for Cp yields the following:
When non-lattice contributions to heat capacity do not play a role, as is the case for En where Cex=0, experimental Cp can thus be represented by a lattice-dynamic model for Cvib (=Cv) divided by the () term.
3.2.2 Lattice-dynamic model for Cvib of enstatite and ferrosilite
We resort to the model developed by Kieffer (1979, 1980) for lattice vibrations of minerals to compute Cvib of En and Fs. For 10 atoms in the formula of orthopyroxenes and 8 formula units per unit cell, the total number of atoms in the unit cell s=80, and there are 3s=240 possible modes of vibration. The Kieffer model requires cut-off frequencies for the three acoustic branches, as well as lower and upper cut-off frequencies of the optical branches that are treated as one continuum or several continua with cut-offs defined from IR or Raman spectra or computed dispersion relations. Additionally, separate Einstein oscillators, e.g. for representing Si–O stretching modes, can be used. The number n of vibrational modes assigned to each oscillator or optical continuum must then sum up to 3s−3.
For En, we used the parameters given by Kieffer (1980) as a starting point. Based on Eq. (6) and taking m=0.00004, the optical cut-offs and n were varied somewhat to obtain the best agreement with measured Cp over the temperature range of the experimental data. With this relatively simple lattice model for Cvib, the experimental Cp of En could be recalculated with a deviation of less than 1 % in the temperature range 50–800 K (Fig. S4; final parameters are given in Table 3, and a Mathematica program code for computing the Kieffer model is available on request). At the lowest temperatures, where absolute values of Cp get rather small, deviations increase to >10 %.
Table 3Parameters of the Kieffer model for computing Cv of En and Fs. The values for En are modified from Kieffer (1980), and those for Fs were read from IR powder absorption spectra published by Tarantino et al. (2002). There are, in total, 240 vibrational modes.
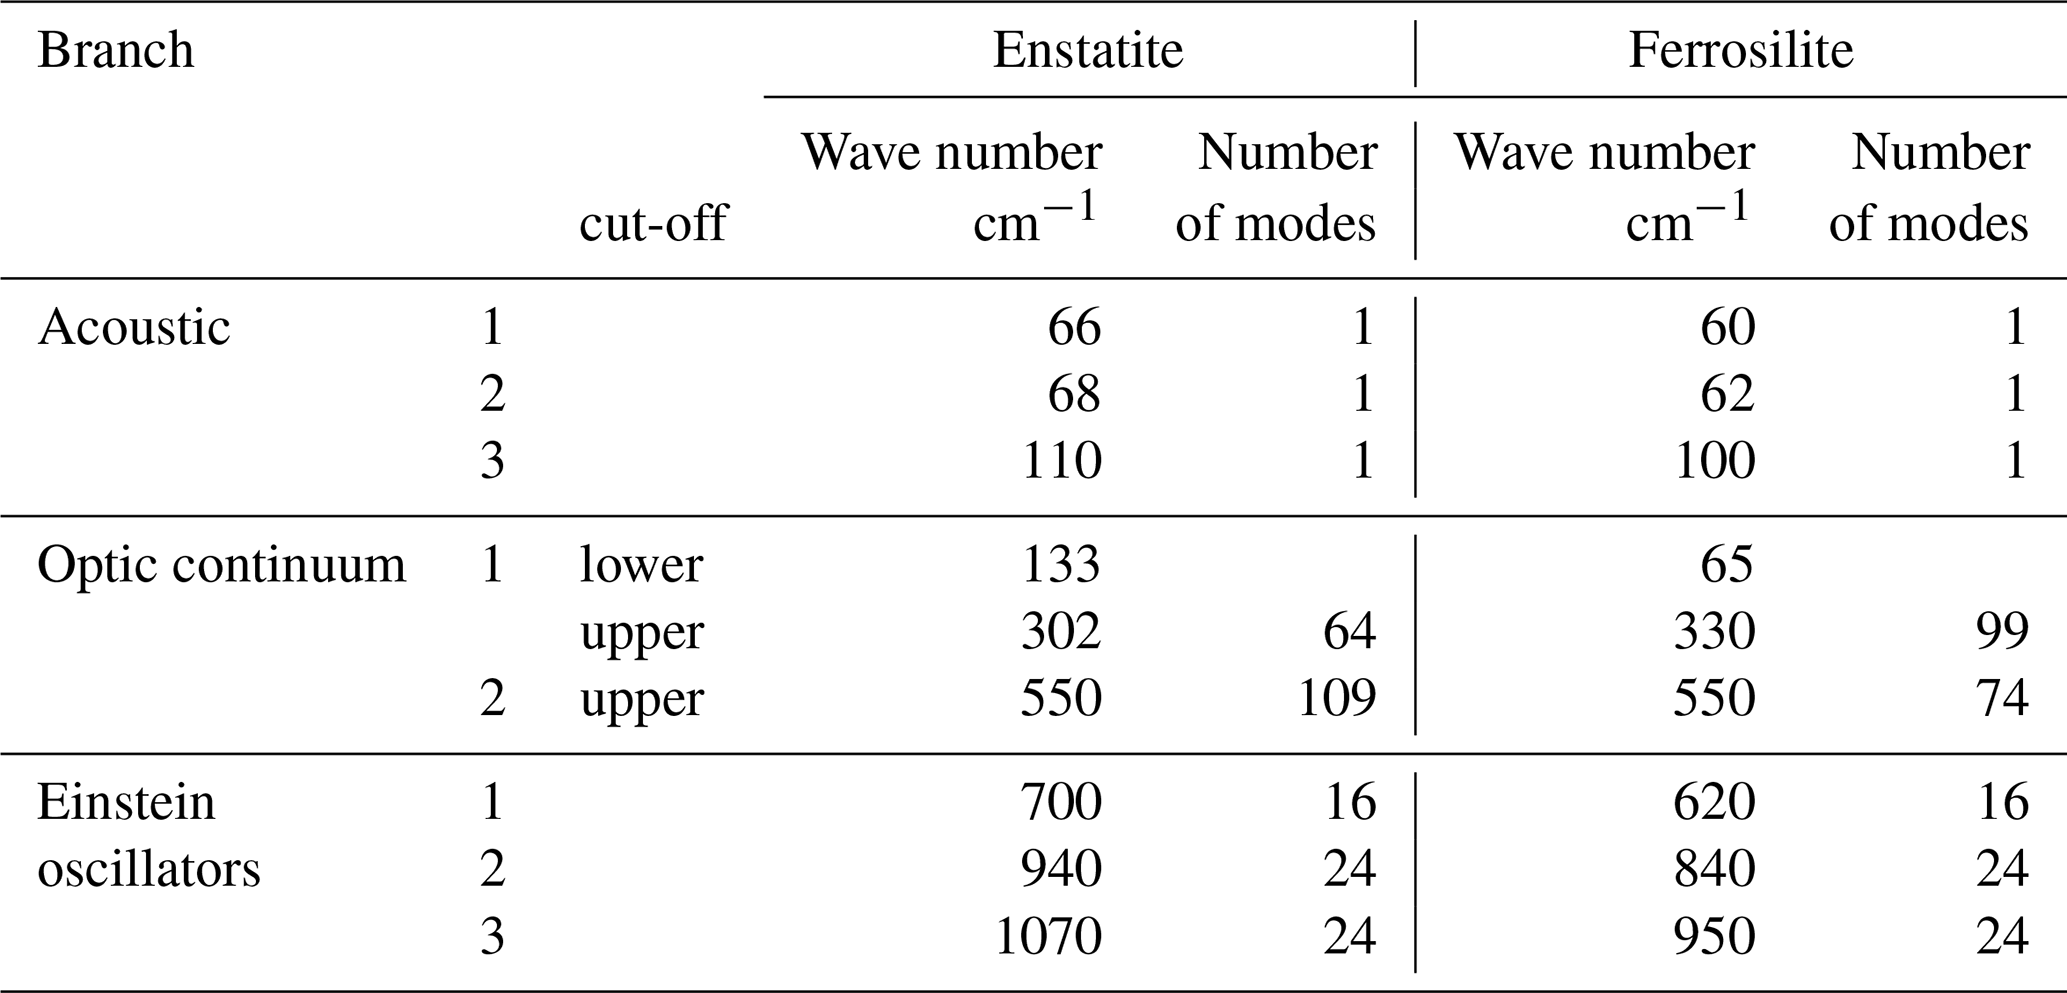
The Cvib that we use for Fs as a function of temperature is shown in Fig. 4. The position of this curve is not arbitrary but a consequence of employing the single-parameter phonon dispersion model of Komada and Westrum (1997, as abbreviated KW) for the measured heat capacity data. Analogously to Debye theory, the key feature of the KW model is that a characteristic temperature, θKW, is introduced and can be determined by fitting the model to the experimental Cp data (Komada, 1986; Komada and Westrum, 1997; Dachs et al., 2007, 2009). At temperatures above a magnetic phase transition, θKW approaches a linear (ideally constant) value that can be used to calculate Cvib. Any marked change in the value of θKW reflects the existence of non-lattice heat capacity contributions. In the case of Fs, θKW is linear with a rather flat slope above approximately 120 K (Fig. 4, inset), indicating that such contributions can be expected to cease in this temperature range. With m=0.0001 and parameters for the Kieffer model of Fs as given in Table 3, a Cvib matching that computed with the KW model was generated for Fs and was used to compute its Cex (initial cut-offs were read from its powder absorption spectrum, as published by Tarantino et al., 2002). The deviation of the so-recalculated Cp of Fs based on Eq. (6) from experimental values is <1 % in the temperature range of 140–700 K.
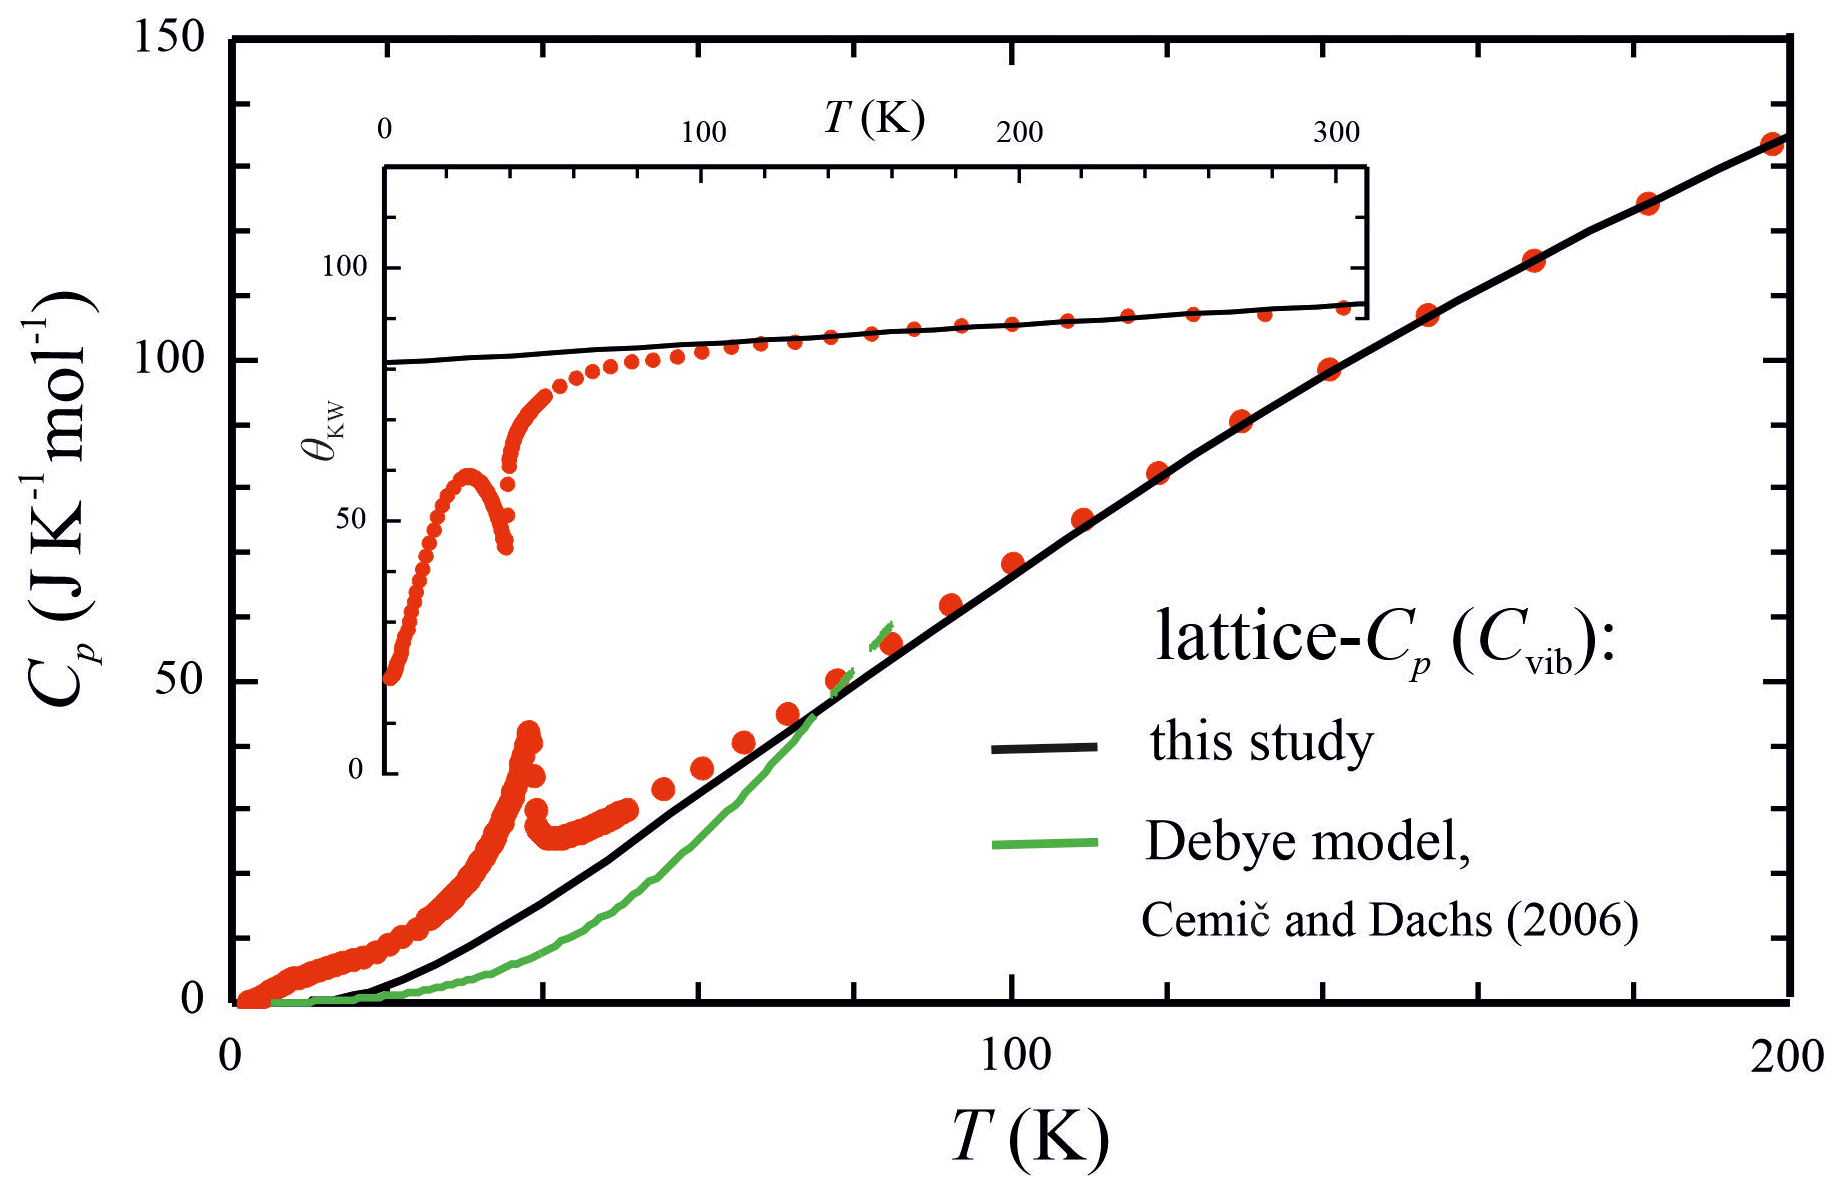
Figure 4PPMS-measured heat capacity of Fs (red points) compared to model calculations for its lattice Cp. The black curve was computed from the relation with m=0.0001 (Eq. 6) and adopting the Kieffer model for computing Fs's Cv with the parameters given in Table 3. This approaches experimental Cp at around 120 K and served as the base line to calculate Cex by subtraction. Cemič and Dachs (2006) used the Debye model for calculating Cv (green curve), which leads to a much larger Cex. The inset shows θKW of the Komada and Westrum (1997) model as a function of temperature.
3.2.3 Excess heat capacities
Whereas the calculation of Cex is straightforward for the Fs endmember (Eq. 4), we used a linear combination of the vibrational models for Cvib of En and Fs, as described above, to come up with the Cvib of a solid-solution member ) as follows:
This implies that the vibrational properties in the En–Fs solid solution behave as an ideal mixture. With an expression analogous to Eq. (7), the conversion of Cp into Cv was done for each solid-solution member. The resulting excess heat capacities are plotted in Fig. 5 in the temperature range of 0–60 K. They smear out around this T in the Mg-rich compositions, whereas the Fe-rich compounds approach zero Cex at successively higher T values up to ∼150 K (not shown in Fig. 5). Recalculated Cp above this T, computed from , deviates by no more than 1 % from the measured Cp of a specific compound up to 820 K.
The features discussed above for the Cp behaviour of the various solid-solution members below 50 K remain, in principle, the same for Cex. Due to the subtraction of Cvib, which becomes increasingly larger with higher T, shoulders, appearing in Fig. 1 for the Cp behaviour between 10 and 25 K, transform into broad bumps in a plot of Cex vs. T, with T maxima being shifted to successively lower values and decreasing in size with decreasing XFs (Fig. 5). At the lowest temperatures of <5 K, the contribution of Cvib is minor, and the observed plateau-like features and even slight upturns in Cp of Mg-rich to intermediate compositions remain unchanged. Schottky contributions to Cp thus seem to play a greater role in such compositions, with a ratio around 1:1. Unexpectedly, these still have a Cex of the order of 1.0 to 1.7 J K−1 mol−1 at 2 K.
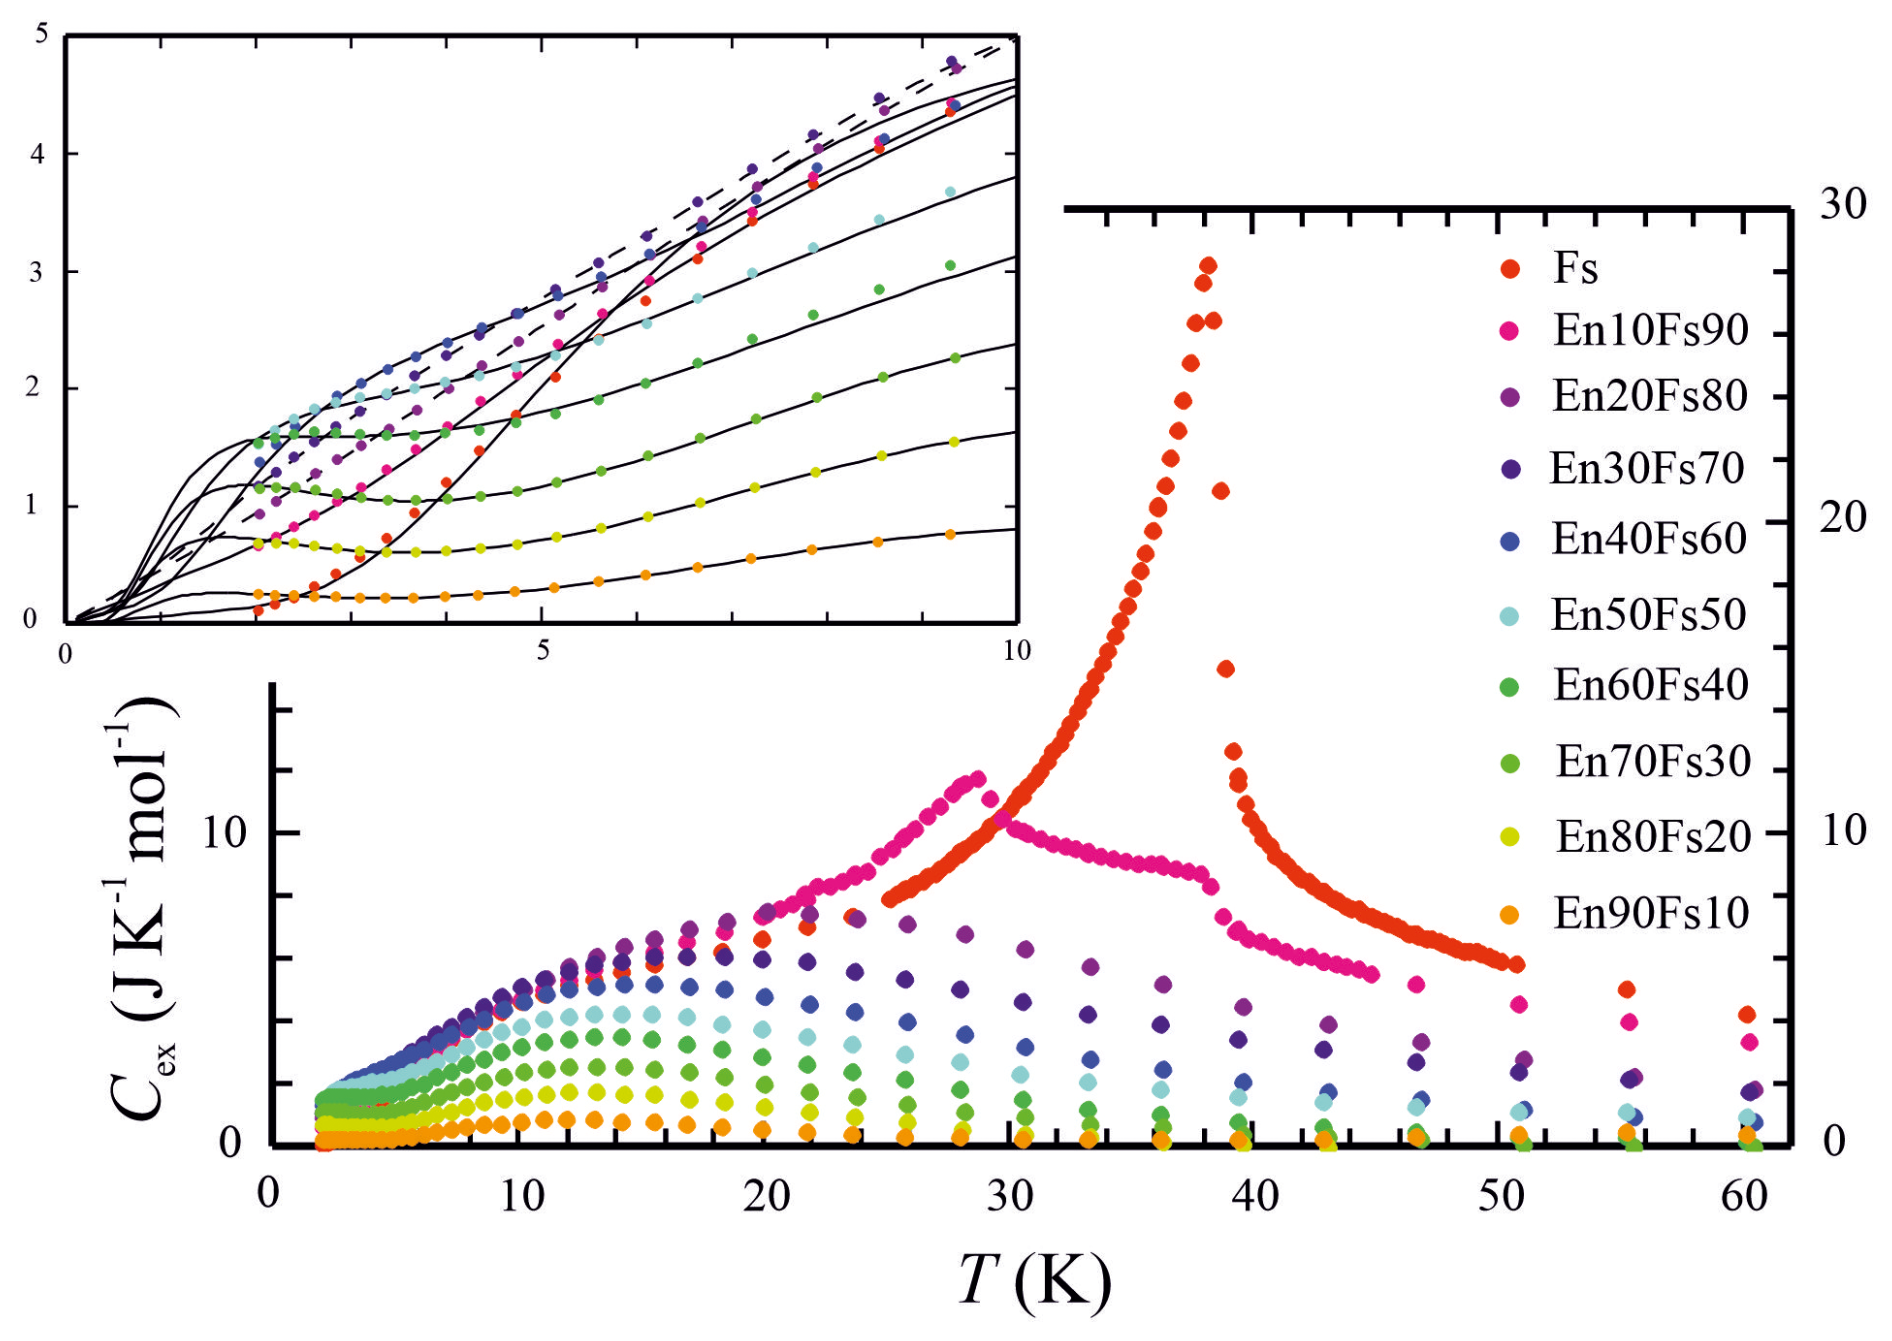
Figure 5Excess heat capacities Cex of members of the enstatite (En)–ferrosilite (Fs) binary in the temperature range from 0 to 60 K. Cex was calculated by subtracting a model lattice heat capacity from measured Cp after converting Cp into Cv. The inset shows the range of 0 to 10 K, where Schottky anomalies play a role, in more detail. Curves in the inset are fits to Cex and are used for extrapolation of Cex from 2 K down to 0 K (those for En30Fs70 and En20Fs80 are shown as dashed lines; see the text for more information).
3.2.4 Fitting the excess heat capacities
As mentioned above, we assigned the heat capacity anomalies occurring at the lowest temperatures in the En–Fs solid solution to Schottky anomalies (CSchottky). We fitted these excess contributions using a simple two-level system (ground state, one exited level) given by the following equation (e.g. Dachs et al., 2007; Rosen and Woodfield, 2020; Jens Biele (DLR Köln, Germany), personal communication, 2024):
where R is the gas constant; SF is an empirical scaling factor of order 1; go and g1 are the degeneracies of the ground state and of the first energy state, whereby the ratio was taken to be similar to that in olivine, namely (Aronson et al., 2007); and θ is the energy gap between the two levels of the Schottky anomaly in units of K (not identical with its temperature maximum, which is at lower temperatures of around ).
For describing Cex behaviour in the temperature region around the paramagnetic–anti-ferromagnetic sharp λ transition in Fs100 at TN=38.4 K, Eq. (8) was combined with the following equations (e.g. Gronvold and Sveen, 1974; Dachs et al., 2007, 2009):
and
The fit for Fs100 is shown in Fig. S5 and fits its Cex behaviour satisfactorily, with small deviations between 10 and 20 K. The discrete Cp peak at 29 K observed in composition En10Fs90 was fitted in a similar manner.
Because the Cex–T behaviour of the Fs–En solid-solution members is characterised by broad, asymmetric bumps as Fe2+ gets successively diluted by Mg (compositions with XFs≤0.8), other empirical functions are required instead of Eqs. (9a) and (9b) for fitting (Fs90En10 is an exception, showing two peak-like features at 29 K and at 38 K; see Fig. 5). In the case of the olivine solid solution, Dachs et al. (2007) used two Gaussian functions for that purpose. In this contribution, we follow this treatment and combine Eq. (8) with three Gaussian functions to model these broad asymmetric Cex features. The low-temperature side of these features could be fitted relatively well (compositions XFs≤0.6), allowing extrapolation from 2 K, the temperature where the experimental data cease, down to 0 K (Fig. 5, inset). The resulting fit parameter θ in Eq. (8) increases with increasing XFs, whereas the parameter SF decreases (values are given in the caption of Fig. S6). In Fs70En30 and Fs80En20, the lowermost Cex data <10 K decrease nearly linearly with falling T, and the fitting of a separate Schottky anomaly, which worked for intermediate and Mg-rich compositions, failed here. The Schottky anomalies in these Fe-rich compositions are obviously superimposed by the increased magnitude of magnetic effects due to the high concentration of Fe2+. For these two cases, we assume that the Schottky anomaly follows the trend as indicated by the intermediate to Mg-rich compositions; i.e. we calculated CSchottky by using extrapolated values for the parameters θ and SF in Eq. (8).
3.2.5 Entropies at 298.15 K
Integrating over the temperature range of 0–2 K, based on the calculated Cex resulting, as described above, from the fitting procedure of the lowermost Cex–T data (Fig. 5, inset), yields small entropy increments of the order of 0.1 to 0.7 J K−1 mol−1 for the Mg-rich and Fe-rich compositions, whereas larger values up to 1.2 J K−1 mol−1 are observed for the intermediate compositions (Table 2). The model lattice heat capacities at such low temperatures are so small that they do not affect the total heat capacity significantly and can be neglected.
The entropy increments from 0 to 2 K have to be added to each Scal value to get the total entropies S298 of all investigated solid-solution members (Table 2). These are thus slightly larger than corresponding Scal values. This modification is, however, small, and the conclusion of ideal entropic mixing behaviour along the En–Fs solid solution, i.e. zero excess entropies of mixing, remains valid (Fig. 2).
3.2.6 Excess entropies and their decomposition into Schottky-type and magnetic contributions
The derived excess entropies (Table 2) along the En–Fs solid solution are plotted in Fig. 6. Within error, they increase from zero in En in a linear manner to a maximum of 19.8 J K−1 mol−1 in Fs. They were calculated by numerically integrating over the temperature range of positive Cex and adding the entropy increment from 0 to 2 K.
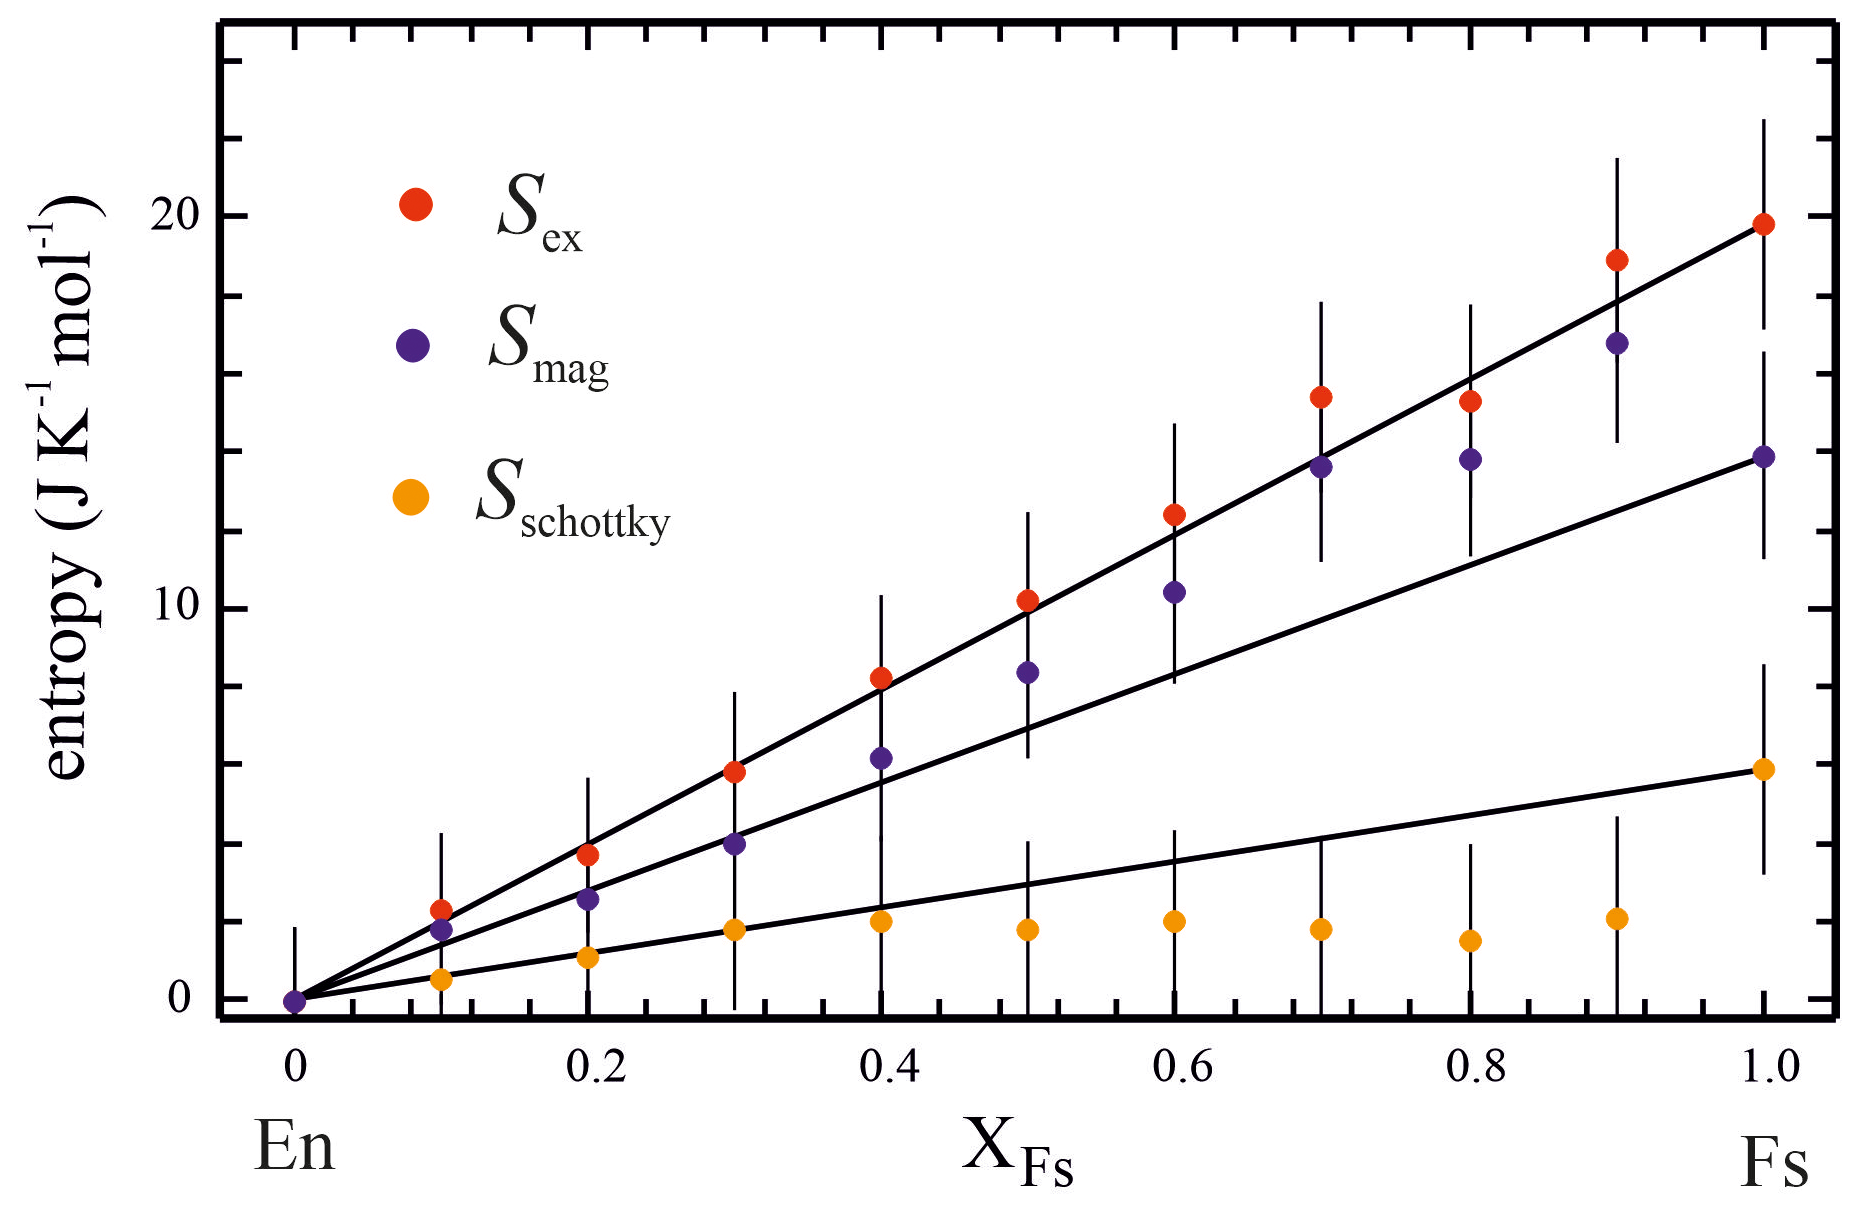
Figure 6Excess entropy Sex and its decomposition into Schottky-type and magnetic contributions (SSchottky and Smag, respectively) along the En–Fs binary.
The entropy due to Schottky effects, SSchottky, increases linearly from zero in En to a value of 2.0 J K−1 mol−1 at intermediate compositions and then plateaus at roughly this value. In endmember Fs, it reaches its maximum at a value of 5.9 J K−1 mol−1. This was computed from appropriate integration of using the parameters θ and SF in Eq. (8), as given in the caption of Fig. S6.
Because the magnetic entropy, Smag, was calculated from the relation , it behaves inversely to the latter. Thus, Smag values larger than that representing ideal mixing result in the Fe-rich portion of the En–Fs binary, where SSchottky shows a plateau. The largest Smag value of 16.8 J K−1 mol−1 is observed for the composition En10Fs90, whereas, in endmember Fs, it is 13.9 J K−1 mol−1.
4.1 Endmember heat capacities and entropies
For phase equilibrium calculations involving En, it can be concluded that the computation of its heat capacity according to Eq. (1) should be preferred over other representations in the literature (Krupka et al., 1985b; Holland and Powell, 2011) that indicate a larger Cp of the order of 1.5 % at 1000 K increasing to 3 % at 1500 K. This is especially applicable at high temperatures, e.g. for mantle equilibria. The reason for preferring the DSC data of this study compared to those of Krupka et al. (1985b) is shown in Fig. 3. With a value of m=0.00004 in Eq. (5) and using the DFT-computed Cv or, alternatively, the Kieffer model calculated with the parameters given in Table 3, the DSC-measured Cp of En from this study, and even the PPMS data down to approximately 50 K can be represented with a deviation of <1 % (Fig. S4). An almost similar slope of m=0.00005 is obtained if the Cp−Cv difference is calculated independently from the relation and using values for V and α computed according to Hovis et al. (2021) and following the references cited therein (Fig. 3, short-dashed line). If, alternatively, the DSC data of Krupka et al. (1985b) were preferred, a steeper slope of m=0.00007 would be the required result (Fig. 3, long-dashed line) to achieve a match with those experimental data, in worse agreement with m based on α and V calculated as described in Hovis et al. (2021). This fact supports the validity of the DSC data of this study.
The standard entropy of J K−1 mol−1 for En resulting from the PPMS data of this study agrees within error with that derived from Krupka et al. (1985a) using adiabatic calorimetry (132.5 J K−1 mol−1).
As outlined above, the heat capacity data of Fs above ∼140 K could be well represented, with a deviation of <1 % with the Kieffer model for its Cv (Table 3) and k=0.0001 following Eq. (5) to account for the Cp−Cv difference. At temperatures below 140 K, the Kieffer model parameters were tuned in such a way as to yield similar lattice heat capacities compared to what would result from the KW model (Fig. 4, inset). The so-calibrated Kieffer model served to compute the excess heat capacity of Fs by subtraction (Fig. 5). Cex shows the prominent λ-shaped anomaly attributed to anti-ferromagnetic ordering peaking at TN=38.4 K, in good agreement with TN=38.7 K, as determined by Cemič and Dachs (2006). These authors used the Debye model for computing the lattice heat capacity of Fs, which predicts considerably smaller Cv values (Fig. 5) compared to this study as it considers only the acoustic phonon branches. The Kieffer model for lattice vibrations, on the other hand, includes both acoustic and optical phonon branches, which makes its use preferable because the so-calculated Cv can be expected to closer represent physical reality.
Fs's standard entropy is determined to be J K−1 mol−1 in this study, 1.6 J K−1 mol−1 larger than that determined by Bohlen et al. (1983) from AC and 0.9 J K−1 mol−1 larger than that tabulated in the data base of Holland and Powell (2011). Based on the improved encapsulation technique for powders as used in this study, this So should be preferred over the value published by Cemič and Dachs (2006), which is too low for the reasons described above.
The decomposition of Fs's Cex into magnetic and Schottky contributions is shown in Fig. S5, yielding, after appropriate integration, values of Smag=13.9 J K−1 mol−1 and SSchottky=5.9 J K−1 mol−1, summing up to 19.8 J K−1 mol−1 for Sex, which, in turn, sums up with a vibrational entropy of Svib=171.0 J K−1 mol−1 to the total entropy S298=So of Fs (Table 2). The Smag value obtained by our modelling is only approximately 52 % of the theoretically maximal value of 2Rln5 = 26.8 J K−1 mol−1 for the magnetic entropy. In relation to So, 89.6 % of Fs's entropy is of vibrational (or lattice) origin, 7.3 % is of magnetic origin, and 3.1 % of electronic origin (Schottky contribution). In the case of almandine and applying a similar modelling procedure, Dachs et al. (2012) obtained comparable relations. Here, 90.1 % of almandines' total entropy was of lattice origin, 9.5 % was of magnetic origin, and 0.4 % was of Schottky origin. In the case of fayalite, Dachs et al. (2007) estimated the various entropy contributions as follows: 79.5 % lattice, 17.2 % magnetic, and 3.3 % electronic. It is clear that all of these estimations depend critically on the size of Cvib as the outcome of the adopted model for the lattice heat capacity.
4.2 Solid-solution heat capacities and entropies
The measured solid-solution heat capacities (nine compositions, spaced in 0.1 XFs intervals) align in a consistent manner at high-enough temperatures (> ca. 140 K), where excess effects (magnetic, electronic) are no longer relevant. The heat capacity of all of these compositions above that temperature could be well represented using a linear combination of endmember lattice models for Cvib of En and Fs according to Eq. (7) and a similar equation used to compute m in Eq. (5) to convert Cv into Cp for the solid-solution members. The so-calculated heat capacities deviate by no more than 1 % from the measured values up to ∼700 K. The excess heat capacities shown in Fig. 5 have then been computed by subtracting these lattice Cp values from the experimental values.
The composition En10Fs90 deserves a special mention. Below ∼30 K, this composition has a larger (excess) heat capacity than the Fs endmember (Figs. 1 and 5), and it shows two magnetic Cp anomalies: a weaker one at the same temperature as TN of endmember Fs (∼38 K) and a stronger one at a TN of ∼29 K. The reason for this is unclear, but it might have to do with the fact that Fe2+ at the M1 site appears to have a different electronic ground state than Fe2+ at the M2 site in orthopyroxene (Shenoy et al., 1969). An almost similar TN (28 K) was determined by Lin et al. (1993) by applying Mössbauer spectroscopy to a synthetic orthopyroxene with a composition of XFs=0.8, whereas an Mg-richer sample (XFs=0.51) did not reveal a TN. Both compositions showing discrete magnetic Cp peaks (pure Fs and En10Fs90) were fitted using Eqs. (8) and (9).
Cex of all other samples with XFs≤0.8 did not show any sharp anomalies but did show broad asymmetric humps down to the lowest temperatures. These cases were fitted combining Eq. (8) with Gaussian functions. The size of these buckles shrinks, and their temperature maximum shifts to successively lower T values with increasing dilution of the magnetically relevant Fe2+ by Mg. This is consistent with results from Shenoy et al. (1969). In their study on the magnetic behaviour of the Fe–Mg orthopyroxene system, they observed that samples with XFs≤0.4 produced only paramagnetic relaxation spectra and did not show magnetic ordering. From the two magnetic hyperfine fields in orthopyroxene (a smaller one for the M2 site and a stronger one for the M1 site), only the smaller field is present, which was interpreted as meaning that only the M2 site seems to be occupied sufficiently with Fe2+ in these magnetically diluted samples.
Schottky-type Cp anomalies are clearly visible in Mg-rich to intermediate compositions as plateaus or even upturns in Cp at the lowest temperatures of less than approximately 5 K (Fig. 5, inset). In pure Fs and En10Fs90, shoulders in the Cp−T behaviour around 10 K on the left flank of the Cp peaks are also attributed to such anomalies. The somewhat surprising observation that, at the lowest temperatures around 2 K, intermediate compositions have the largest Cp values of the order of 1.5 J K−1 mol−1 becomes evident when the Schottky contributions of all solid-solution members are compared (Fig. S6). As a result of the decomposition of Cex, it is exactly these compositions that have the maxima of their Schottky contributions around 2 K. These maxima shift to higher T values around 10 K with increasing XFs so that CSchottky is smaller for the Fe-rich compositions compared to the intermediate compositions at the lowest T values. The entropy increment SSchottky from 0 to 2 K is thus largest for these intermediate compositions and constitutes the main contribution to Sex for low to intermediate XFs solid-solution members (Table 2).
The main conclusion of our investigation is that the entropic mixing behaviour along the En–Fs join follows thermodynamic ideality, and all S298 (Fig. 2) and Sex values (Fig. 6) fall on the line connecting endmember entropies within error; i.e. excess entropies of mixing are zero in this solid solution. Deviations from the linear behaviour are observed for the decomposed values of Smag and SSchottky in the Fe-rich portion of the binary; i.e. Smag is larger and SSchottky is smaller than the linear combinations of endmembers. The composition En10Fs90 even seems to have a larger magnetic entropy than the Fs endmember (16.8 vs. 13.9 J K−1 mol−1). This is shown in Fig. S7, where the entropies Sex, Smag, and SSchottky are compared for Fs and En10Fs90 as a function of temperature. Up to the TN of Fs at 39 K, Sex of En10Fs90 is indeed larger than that of the Fe endmember; at that T, there is a crossover, and relations reverse. This observation is not model dependent. Other models for lattice Cp, though yielding other absolute values of Cex, would preserve this relation. The trends for Smag and SSchottky of these two Fe-richest compositions, on the other hand, are clearly model dependent and would apply if Eqs. (8) and (9) described the physics behind the magnetic and electronic excess heat capacities uniquely. The conclusion that En10Fs90 indeed has a larger magnetic entropy than the Fs endmember (Table 2, Fig. 6) depends critically on the magnitude of SSchottky for this composition as derived from fitting Cex.
4.3 Are the calorimetric results affected by Fe–Mg ordering?
As shown in the recent study of Benisek et al. (2023) on the vibrational entropy of disordering in omphacite, the entropy of disorder, ΔSdis, consists of a vibrational and a configurational part. The latter, , is routinely computed with some order–disorder model in petrological software applications. Holland and Powell (1996), for instance, derived a value of −13.9 kJ mol−1 for the enthalpy change of the ordering reaction En + Fs = 2 FM from published site preference data showing that Fe2+ prefers the M2 site over the M1 site (FM is an ordered ferromagnesion pyroxene with Fe at the M2 site, MgM1FeM2Si2O6). With this ΔH value and applying the symmetric formalism described in this work, a value of would be computed at the synthesis temperature of 800 °C of our samples for the composition En50Fs50 as an example.
With regard to the vibrational part of the entropy of disordering, , Benisek et al. (2023) found that is zero up to high temperatures of around 1000 °C by means of the calorimetric study of several – at different temperatures, disordered – omphacites. This indicates that the vibrational properties in the pyroxene structure are not significantly affected by the combined and cation ordering. We assume that this also applies for Fe–Mg ordering in the En–Fs solid solution, which involves the partitioning of only two cations, Fe and Mg, over the M sites. Moreover, the Fe–Mg substitution in orthopyroxene behaves thermodynamically ideally with regard to entropy, as shown in this study (Fig. 2). The temperature-dependent redistribution of Fe and Mg due to Fe–Mg ordering is, thus, very unlikely to have a measurable effect on the vibrational entropy of a given orthopyroxene solid-solution compound.
All data related to this article can be found in the Supplement.
The supplement related to this article is available online at https://doi.org/10.5194/ejm-37-909-2025-supplement.
ED: PPMS measurements, data evaluation and fitting, paper writing (original draft), figure and table preparation. AB: DFT calculations, literature-based IR spectra evaluation. CL: sample syntheses and characterisation, DSC measurements. All of the authors contributed to the discussion and read and approved the final paper.
The contact author has declared that none of the authors has any competing interests.
Publisher’s note: Copernicus Publications remains neutral with regard to jurisdictional claims made in the text, published maps, institutional affiliations, or any other geographical representation in this paper. While Copernicus Publications makes every effort to include appropriate place names, the final responsibility lies with the authors. Views expressed in the text are those of the authors and do not necessarily reflect the views of the publisher.
We thank E. Forsthofer and colleagues for their professional work in implementing and maintaining the Materials Studio software at the Department of Computer Sciences, Salzburg University. We also thank M. Grodzicki (University of Salzburg) and J. Biele (DLR Köln, Germany) for the helpful discussions. Reviews by two anonymous reviewers are gratefully acknowledged.
This research has been supported by the Austrian Science Fund (grant no. 10.55776/P33904).
This paper was edited by Tiziana Boffa Ballaran and reviewed by two anonymous referees.
Aronson, M. C., Stixrude, L., Davis, M. K., Gannon, W., and Ahilan, K.: Magnetic excitations and heat capacity of fayalite, Fe2SiO4, Am. Mineral., 92, 481–490, https://doi.org/10.2138/am.2007.2305, 2007.
Benisek, A. and Dachs, E.: The accuracy of standard enthalpies and entropies for phases of petrological interest derived from density-functional calculations, Contrib. Mineral. Petr., 173, 90, https://doi.org/10.1007/s00410-018-1514-x, 2018.
Benisek, A., Dachs, E., Carpenter, M. A., Joachim-Mrosko, B., Vielreicher N. M., and Wildner, M.: Vibrational entropy of disordering in omphacite. Phys. Chem. Minerals, 50, 36, https://doi.org/10.1007/s00269-023-01260-7, 2023.
Berman, R. G. and Brown, T. H.: Heat capacity of minerals in the system Na2O-K2O-CaO-MgO-FeO-Fe2O3-Al2O3-SiO2-TiO2-H2O-CO2: representation, estimation, and high temperature extrapolation, Contrib. Mineral. Petr., 89, 168–183, https://doi.org/10.1007/BF00379451, 1985.
Bohlen, S. R., Metz, G. W., Essene, E. J., Anovitz, L. M., Westrum, E. F., and Wall, V. J.: Thermodynamics and phase equilibrium of ferrosilite: potential oxygen barometer in mantle rocks, EOS, 64, 350, 1983.
Bosenick, A., Geiger, C. A., and Cemič, L.: Heat capacity measurements of synthetic pyrope-grossular garnets between 320 and 1000 K by differential scanning calorimetry, Geochim. Cosmochim. Ac., 60, 3215–3227, https://doi.org/10.1016/0016-7037(96)00150-0, 1996.
Cemič, L. and Dachs, E.: Heat capacity of ferrosilite, Fe2Si2O6, Phys. Chem. Minerals, 33, 457–464, https://doi.org/10.1007/s00269-006-0090-1, 2006.
Cemič, L. and Kähler, W.: Calorimetric determination of the enthalpy of Mg-Fe ordering in orthopyroxene, Phys. Chem. Minerals, 27, 220–224, https://doi.org/10.1007/s002690050010, 2000.
Ceperley, D. M. and Alderm, B. J.: Ground state of the electron gas by a stochastic method, Phys. Rev. Lett., 45, 566–569, https://doi.org/10.1103/PhysRevLett.45.566, 1980.
Clark, S. J., Segall, M. D., Pickard, C. J., Hasnip, P. J, Probert, M. I. J., Refson, K., and Payne, M. C.: First principles methods using CASTEP, Z. Kristallogr., 220, 567–570, https://doi.org/10.1524/zkri.220.5.567.65075, 2005.
Dachs, E. and Benisek, A.: A sample-saving method for heat capacity measurements on powders using relaxation calorimetry, Cryogen., 51, 460–464, https://doi.org/10.1016/j.cryogenics.2011.04.011, 2011.
Dachs, E. and Bertoldi, C.: Precision and accuracy of the heat-pulse calorimetric technique: low-temperature heat capacities of milligram-sized synthetic mineral samples, Eur. J. Mineral., 17, 251–261, https://doi.org/10.1127/0935-1221/2005/0017-0251, 2005.
Dachs, E., Geiger, C. A., and Benisek, A.: Almandine: Lattice and non-lattice heat capacity behavior and standard thermodynamic properties. Am. Mineral., 97, 1171–1182, https://doi.org/10.2138/am.2012.4163, 2012.
Dachs, E., Geiger, C. A., von Seckendorff, V., and Grodzicki, M.: A low-temperature calorimetric study of synthetic forsterite-fayalite (Mg2SiO4-Fe2SiO4) solid solutions: An analysis of vibrational, magnetic and electronic contributions to the molar heat capacity and entropy of mixing, J. Chem. Thermodyn., 39, 906–933, https://doi.org/10.1016/j.jct.2006.11.009, 2007.
Dachs, E., Geiger, C. A., Withers, A. C., and Essene E. J.: A calorimetric investigation of spessartine: Vibrational and magnetic heat capacity, Geochim. Cosmochim. Ac., 73, 3393–3409, https://doi.org/10.1016/j.gca.2009.03.011, 2009.
Geiger, C. A. and Dachs, E.: Recent developments and the future of low-T calorimetric investigations in the Earth sciences: Consequences for thermodynamic calculations and databases, J. Metamorph. Geol., 36, 283–295, https://doi.org/10.1111/jmg.12291, 2017.
Gramenopoulou, St.: Eigenschaften und die Oxydationsbeständigkeit synthetischer Orthopyroxene, Ph.D. thesis, Univ. Kiel, 1981.
Gronvold, F. and Sveen, A.: Heat capacity and thermodynamic properties of synthetic magnetite (Fe3O4) from 300 to 1050 K. Ferrimagnetic transition and zero-point entropy, J. Chem. Thermodyn., 6, 859–872, https://doi.org/10.1016/0021-9614(74)90230-4, 1974.
Holland, T. J. B. and Powell, R.: Thermodynamics of order-disorder in minerals: II. Symmetric formalism applied to solid solutions, Am. Mineral., 81, 1425–1437, https://doi.org/https://doi.org/10.2138/am-1996-11-1214 1996.
Holland, T. J. B. and Powell, R.: An improved and extended internally consistent thermodynamic dataset for phases of petrological interest, involving a new equation of state for solids, J. Metamorph. Geol., 29, 333–383, https://doi.org/10.1111/j.1525-1314.2010.00923.x, 2011.
Hovis, G. L., Tribaudino, M., Leaman, A., Almer, C., Altomare, C., Morris, M., Maksymiw, N., Morris, D., Jackson, K., Scott, B., Tomaino, G. and Mantovani, L.: Thermal expansion of minerals in the pyroxene system and examination of various thermal expansion models. Am. Mineral., 106, 883–899, https://doi.org/10.2138/am-2021-7650, 2021.
Kennedy, C. A., Stancescu, M., Marriott, R. A., and White, M. A.: Recommendations for accurate heat capacity measurements using a Quantum Design physical properties measurement system, Cryogen., 47, 107–112, https://doi.org/10.1016/j.cryogenics.2006.10.001, 2007.
Kieffer, S. W.: Thermodynamics and lattice vibrations of minerals: 1. Mineral heat capacities and their relationships to simple lattice vibrational models, Rev. Geophys. Space Phys., 17, 1–19, https://doi.org/10.1029/RG017i001p00001, 1979.
Kieffer, S. W.: Thermodynamics and lattice vibrations of minerals: 4. Application to chain and sheet silicates and orthosilicates, Rev. Geophys. Space Phys., 18, 862–886, https://doi.org/10.1029/RG018i004p00862, 1980.
Koch-Müller, M., Cemič, L., and Langer, K.: Experimental and thermodynamic study of Fe-Mg exchange between olivine and orthopyroxene in the system MgO-FeO-SiO2, Eur. J. Mineral., 4, 115–135, , 1992.
Komada, N.: Measurement and interpretation of heat capacities of several inorganic substances, Ph.D. Thesis, Department of Chemistry, Univ. Michigan, 384 pp., 1986.
Komada, N. and Westrum, E. F.: Modeling lattice heat capacity contributions by a single-parametric phonon dispersion approach, J. Chem. Thermodyn., 29, 311–336, https://doi.org/10.1006/jcht.1996.0159, 1997.
Krupka, K. M., Kerrick, D. M., and Ito, J.: Low-temperature heat capacities and derived themodynamic properties of anthophyllite, diopside, enstatite, bronzite and wollastonite, Am. Mineral., 70, 249–260, 1985a.
Krupka, K. M., Kerrick, D. M., and Ito, J.: High-temperature heat capacities and derived themodynamic properties of anthophyllite, diopside, enstatite, bronzite and wollastonite, Am. Mineral., 70, 261–271, 1985b.
Lashley, J. C., Hundley, M. F., Migliori, A., Sarrao, J. L., Pagliuso, P. G., Darling, T. W., Jaime, M., Cooley, J. C., Hults, W. L., Morales, L., Thoma, D. J., Smith, J. L., Boerio-Goates, J., Woodfield, B. F., Stewart, G. R., Fisher, R. A., and Phillips, N. E.: Critical examination of heat capacity measurements made on a Quantum Design physical property measurement system, Cryogen., 43, 369–378, https://doi.org/10.1016/S0011-2275(03)00092-4, 2003.
Lin, C., Zhang, L. and Hafner, S. S.: Local electronic states of Fe2+ in orthopyroxene. Am. Mineral., 78, 8–15, https://pubs.geoscienceworld.org/msa/ammin/article-pdf/78/1-2/8/4214223/am78_8.pdf, 1993.
Monkhorst, H. J. and Pack, J. D.: On special points for Brillouin zone integrations, Phys. Rev. B, 13, 5188, https://doi.org/10.1103/PhysRevB.13.5188, 1976.
Pfrommer, B. G., Cote, M., Louie, S. G., and Cohen, M. L.: Relaxation of crystals with the quasi-Newton method, J. Comput. Phys., 131, 233–240, https://doi.org/10.1006/jcph.1996.5612, 1997.
Refson, K., Tulip, P. R., and Clark, S. J.: Variational density functional perturbation theory for dielectrics and lattice dynamics, Phys. Rev. B, 73, 155114, https://doi.org/10.1103/PhysRevB.73.155114, 2006.
Rodriguez-Carvajal, J.: Fullprof: a program for Rietveld refinement and pattern matching analysis, in: Abstracts of the satelite meeting on powder diffraction. XVth congress of International Union of Crystallography, Toulouse, France, p. 127, 1990.
Rosen, P. F. and Woodfield, B. F.: Standard methods for heat capacity measurements on a Quantum Design Physical Properties Measurement System, J. Chem. Thermodyn., 141, 105974, https://doi.org/10.1016/j.jct.2019.105974, 2020.
Shenoy, G. K, Kalvius, G. M., and Hafner, S. S.: Magnetic behavior of the feSiO3-MgSiO3 orthopyroxene system from NGR in 57Fe, J. Appl. Phys., 40, 1314–1316, https://doi.org/10.1063/1.1657648, 1969.
Tarantino, S. C., Boffa Ballaran, T., Carpenter, M. A., Domeneghetti, M. C., and Tazzoli, V.: Mixing properties of the enstatite-ferrosilite solid solution: II. A microscopic perspective, Eur. J. Mineral., 14, 537–547, https://doi.org/10.1127/0935-1221/2002/0014-0537, 2002.
Zherebetskyy, D., Amthauer, G., and Grodzicki, M.: Electronic and magnetic structure of pyroxenes: II. Orthoferrosilite, Phys. Chem. Minerals, 37, 455–464, https://doi.org/10.1007/s00269-009-0346-7, 2010.