the Creative Commons Attribution 4.0 License.
the Creative Commons Attribution 4.0 License.
 | 10 Jul 2025
Fibrous tourmaline from San Piero in Campo (Elba, Italy)
Giovanni B. Andreozzi
Dario Di Giuseppe
Alessandro F. Gualtieri
Valentina Scognamiglio
Laura Fornasini
Danilo Bersani
Tommaso Giovanardi
Federico Lugli
Federico Pezzotta
An unusual variety of fibrous tourmaline, not previously described on the island of Elba, was studied using a multi-analytical approach, including powder X-ray diffraction, scanning electron microscopy, electron probe micro-analysis, Raman spectroscopy, and in situ B-isotopic analyses. The investigated sample comes from a miarolitic cavity of the Rosina granitic pegmatite outcropping in the San Piero in Campo area (Elba, Italy) and consists of three generations of tourmaline: a pale green prismatic tourmaline about 200 µm thick and 1 mm long (Tur I); a co-axial tight overgrowth of a dark fibrous cap at the analogous pole termination of the prismatic tourmaline (Tur II); and colourless acicular single crystals about 1 µm thick and 28 µm long (Tur III), which form radial aggregates on both sides of the prismatic crystal, mostly concentrated around the fibrous termination. The prismatic crystal has a large core of elbaite (Tur Ia) and a relatively thin rim, consistent with Ca-bearing fluor-elbaite (Tur Ib). The fibrous cap is made of an inner dark-coloured (Fe,Mg)-bearing darrellhenryite (Tur IIa) terminated by an outer black schorl prone to foitite (Tur IIb). The acicular single crystals Tur III have a complex composition corresponding, on average, to (Ca,F)-rich, (Fe,Mg)-bearing darrellhenryite. On top of the radial aggregates of acicular single crystals, there are globular terminations formed by rose-shaped lath-like particles, which are made of a mixture of layer silicates.
The most likely scenario for the formation of the studied tourmaline assemblage involves the miarolitic cavity fracturing due to a mechanical shock, the subsequent circulation of the highly reactive cavity fluids, and the leaching of accessory biotite in the surrounding pegmatite, which account for the overgrowth of the fibrous cap of dark Tur IIa and black Tur IIb on top of the prismatic elbaite. Leaching of accessory fluorapatite provided late (Fe,Mg)-poor, (Ca,F)-rich fluids that determined the crystallization of the acicular Tur III. The late, highly reactive fluids also interacted with the prismatic tourmaline, locally modifying its rim composition and forming Tur Ib. Moreover, the leaching of local petalite provided Li, Al, and SiO2 that contributed to the crystallization of Tur Ib and Tur III, as well as the final rose-shaped lath-like particles.
- Article
(9760 KB) - Full-text XML
- BibTeX
- EndNote


The island of Elba in the Tuscany region of Italy is famous all over the world for its outstanding mineralogical occurrences in miarolitic pegmatite outcropping in the San Piero in Campo area, which were, mostly during the 19th century, the object of extensive mining for the collection of mineral specimens. The most researched and attractive mineral frequently found in these pegmatites is prismatic tourmaline, exhibiting pastel colours ranging from black to yellow, green, pink, colourless, blue, red, and purple. These multicoloured crystals occur on a quartz and feldspar matrix and grow in the direction of the analogous pole (Pezzotta, 2021), although post-crystallization breakage of the crystals has occurred, and overgrowth is observed at both terminations (Altieri et al., 2023a). In addition, tourmaline from Elba can also occur as acicular crystals, which form, in some cases, fibrous aggregates. This latter morphological variety has been noted since the first description of Elba tourmalines, dating back to the second half of the 19th century (D'Achiardi, 1894, 1897). In modern times, Pezzotta et al. (1996), Tonarini et al. (1998), and Aurisicchio et al. (1999) have described the morphological aspects and compositional variation of such acicular tourmalines, evidencing that their composition typically belongs to foitite or schorl.
The compositional study of fibrous tourmaline aggregates is of great assistance for the understanding of tourmaline minerogenesis and crystallization paths. Fibrous tourmalines typically develop at relatively low temperatures and pressures (T<400 °C; P<3 kbar according to Dutrow and Henry, 2016), and their composition, as well as that of all tourmalines, is a direct expression of the evolution of both the petrological environment and the fluids from which they crystallize (Federico et al., 1998; Lussier et al., 2008a, b; Bosi et al., 2015a, b, 2018, 2019; Dutrow and Henry, 2016; Andreozzi et al., 2020, 2025). The crystallization of foititic fibres requires conditions with less than 0.25 mol L−1 of Na, whereas the crystallization of alkaline tourmalines needs fluids with a relatively high Na content (> 0.25 mol L−1) (von Goerne et al., 2001; Dutrow and Henry, 2016). One of the best examples of fibres' close relationship with the evolving hydrothermal environment was provided by Dutrow and Henry (2000), who described the tourmaline fibre intergrowth from the Cruzeiro mine, Minas Gerais (Brazil). The latter authors identified the first generation of dark blue foitite, the second generation of blue-grey Li-rich schorl that gradually turns to Fe-rich elbaite, and the third generation of yellowish-green fluor-elbaite, with the sequence revealing the compositional evolution of the magmatic and hydrothermal fluids involved in the formation of the Cruzeiro pegmatite.
In Elba pegmatites, fibrous tourmaline exhibits compositions related to two main parageneses: (1) a foititic composition as fibrous overgrowth of polychrome crystals associated with the crystallization of zeolites at the beginning of a zeolite hydrothermal stage and (2) a schorlitic composition as occasionally massive fibrous overgrowth of polychrome crystals, related to a late hydrothermal stage associated with pocket fracturing, followed by a fracture-related circulation system (Aurisicchio et al., 1999). The growth of “hear-like” crystals of both foititic and schorlitic composition is restricted to the analogous pole termination of prismatic multicoloured crystals that range in composition from (a) schorl, fluor-schorl, and elbaite to (b) fluor-elbaite, tsilaisite, fluor-tsilaisite, and rossmanite. Moreover, prismatic crystals with fibrous overgrowth frequently occur in cavities of complexly zoned pegmatite bodies (Pezzotta et al., 1996; Tonarini et al., 1998; Aurisicchio et al., 1999).
The present study focuses on an additional variety of fibrous tourmaline from Elba that has not been described until now. It consists of three generations of tourmaline, with a late phase forming a “fur-hat-like” aggregate (Fig. 1).
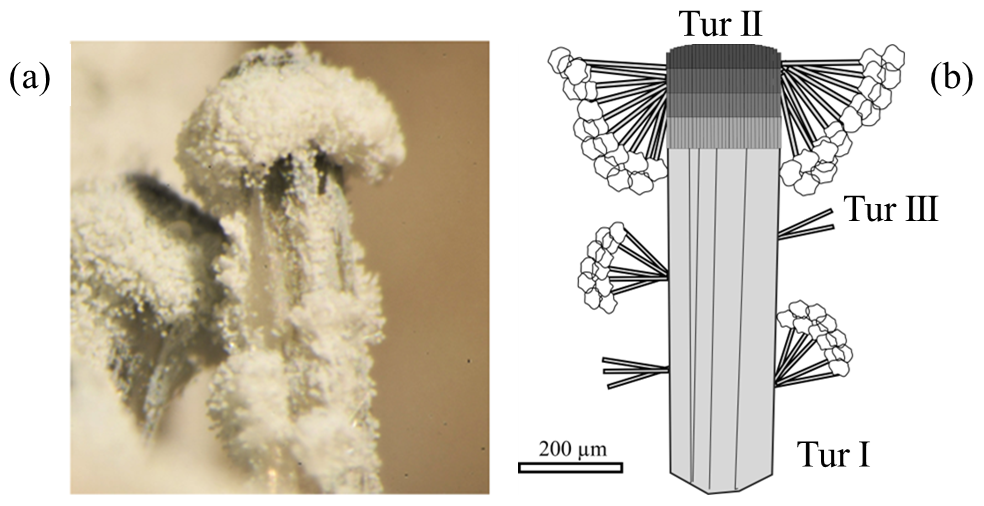
Figure 1Prismatic tourmaline crystal with fur-hat-like analogous termination from Elba: (a) image of the sample captured with a stereoscopic microscope and (b) sketch of the textural relations among the various generations of tourmaline occurring in the studied sample, with (1) a pale green prismatic tourmaline (Tur I) about 200 µm thick and 1 mm long; (2) a co-axial tight overgrowth of a dark fibrous cap (Tur II) at the analogous pole termination of the prismatic tourmaline; and (3) colourless acicular single crystals about 1 µm thick and 28 µm long, which form radial aggregates (Tur III) mostly concentrated around the fibrous termination and covered by tiny globular masses of a whitish mineral, forming a fur-hat-like morphology.
1.1 Tourmaline crystal chemistry
Tourmaline is a widespread borosilicate with a trigonal crystal structure (space group R3m) consisting of six-membered rings of TO4 tetrahedra (T6O18) and isolated BO3 triangles linked by a trigonal antiprism XO9 (located along the threefold axis passing through the centre of each six-membered ring), larger octahedra YO6, and smaller octahedra ZO6 (Bosi and Lucchesi, 2007; Gatta et al., 2012; Bosi, 2018). The tourmaline supergroup encompasses a large number of mineral species with a general formula XY3Z6(T6O18)(BO3)3V3W, where X = [Na+, K+, Ca2+, □ (= vacancy)] at the [9]X site, Y = (Al3+, Fe3+, Cr3+, V3+, Mg2+, Fe2+, Mn2+, Li+) at the [6]Y site, Z = (Al3+, Fe3+, Cr3+, V3+, Mg2+, Fe2+) at the [6]Z site, T = (Si4+, Al3+, B3+) at the [4]T site, and B = B3+ at the [3]B site. Moreover, the letters V and W represent the two anion groups V = [(OH)−, O2−] and W = [(OH)−, F−, O2−] located at the [3]-coordinated O3 and O1 crystallographic sites, respectively (Hawthorne and Henry, 1999). The primary classification of the tourmaline-supergroup minerals is based on the X-site occupancy to give the three groups of X-site vacant, alkali, and calcic tourmaline; in the next step the general tourmaline species are named hydroxy-, fluor-, or oxy-species according to the type of W anion (Henry et al., 2011). The hydroxy- prefix is by convention not reported, leaving only the root name: as an example, the name foitite is used for an X-site vacant tourmaline of the ideal formula X□Y(Fe2+ 2Al)ZAl6 TSi6O18(BBO3)3 V(OH)3 W(OH), while schorl and elbaite are alkali tourmaline (with the X site filled by Na) of ideal formulae XNaYFe2+ Al6 TSi6O18(BBO3)3 V(OH)3 W(OH) and XNaY(Li1.5Al1.5)ZAl6 TSi6O18(BBO3)3 V(OH)3 W(OH), respectively. Moreover, the oxy- prefix is not used when the ideal formula already encompasses the WO, as in the darrellhenryite, XNaY(Al2Li)ZAl6 TSi6O18(BBO3)3 V(OH)3 WO.
2.1 Geological setting and sample description
The studied tourmaline sample has been collected in the Rosina pegmatite, which is located a few hundred metres south of the village of San Piero in Campo (Elba, Italy). This pegmatite was discovered in early 1990, and it was mined for both collectibles and specimens suitable for scientific research (Pezzotta, 2021). The pegmatite is hosted in a porphyritic monzogranite at the eastern border of the Monte Capanne pluton, it has a complex shape, and it trends roughly N–S with a variable dip angle of 40–75° W (Pezzotta, 2000). The major productive section of the body is approximately 14 m long and 0.6–2.1 m wide. In general, the shallowest portions of the pegmatite body are characterized by mostly aplitic textures with minor coarse-grained pegmatitic lenses, whereas going deeper, the body becomes more pegmatitic and divides into two major branches that are interconnected by several small veinlets (Pezzotta, 2000; Bosi et al., 2022). Thin radial fractures and features consistent with cavity collapse are evident around the larger miarolitic cavities. The presence of corroded and altered biotite, sekaninaite, spessartine garnet, petalite, and minor fluorapatite in the pegmatitic rock surrounding the cavities suggests, together with albitization of K-feldspar, fluid circulation during the latest stages of pegmatite evolution (Pezzotta, 2000; Bosi et al., 2022; Altieri et al., 2023a).
The studied tourmaline was collected by one of the authors (Federico Pezzotta) in a small cavity (a few centimetres across) found along the southern extension of the pegmatite, in the intermediate-border zone of the vein. The paragenesis of the cavity is typically composed of albite, K-feldspar, and quartz, with accessory schorl evolving to elbaite. The cavity is coated by a very thin layer of uncharacterized material (possibly a mixture of zeolites and amorphous silica).
That is, the studied sample is a prismatic crystal of tourmaline a few millimetres long that appears dark coloured at the base (portion not examined in this study), almost colourless in the middle, and dark coloured at the fibrous cap. It consists of a tourmaline aggregate tentatively attributed to various generations: (1) a pale green prismatic tourmaline about 200 µm thick and 1 mm long (Tur I); (2) a co-axial tight overgrowth of a dark fibrous portion (Tur II) at the analogous pole termination of the prismatic tourmaline; and (3) sparse colourless acicular single crystals (Tur III), which form radial aggregates mostly concentrated around the fibrous termination and covered by tiny globular masses of a whitish mineral, taking on a fur-hat-like morphology (Fig. 1a, b). Scanning electron microscopy (SEM) images reveal that the fur-hat-like morphology is produced by radial clusters of colourless acicular tourmaline crystals topped by small globes of rose-shaped crystals (Fig. 2a, b). The acicular tourmaline crystals, appearing on both sides of the prismatic crystal, are elongated trigonal prisms with a flat termination (Fig. 2c, d), and their diameter ranges from 0.2 to 3.8 µm (average 1.1 µm), while their length ranges from 3.8 to 103 µm (average 28.3 µm).
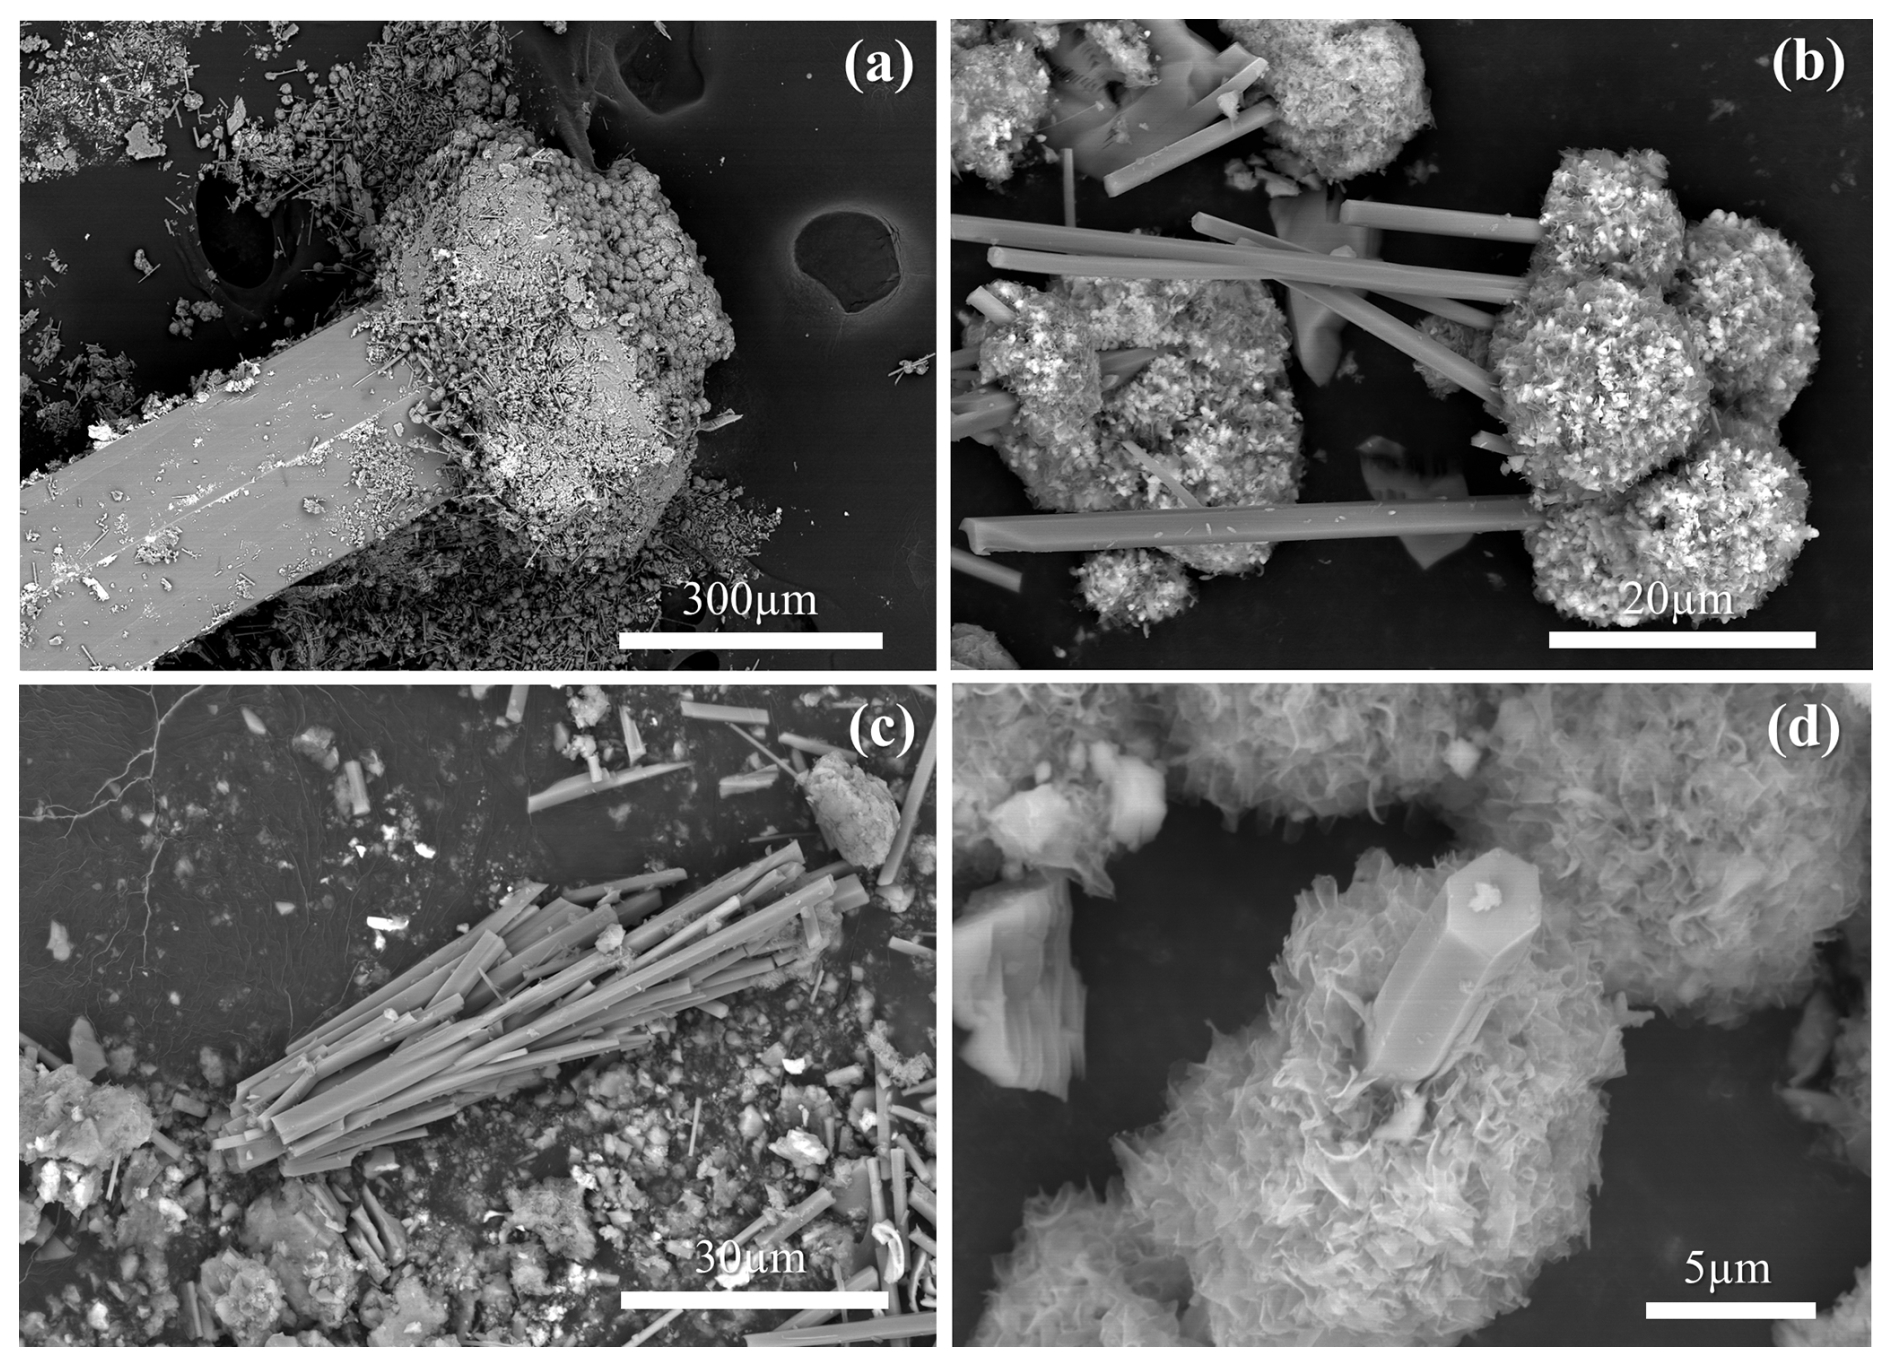
Figure 2Representative SEM images of the tourmaline sample investigated: (a) the low-magnification SEM image shows the prismatic tourmaline crystal covered on top by an aggregate of smaller crystals; (b) the “hat” of the prismatic crystal is formed by a radial aggregate of acicular tourmaline crystals, the tips of which are covered by a globe of clay mineral flakes; and (c, d) single crystals of the acicular tourmaline are elongated trigonal prisms with a flat termination.
2.2 Electron microscopy
Morphological observations were performed using a field emission gun (FEG) SEM FEI Nova NanoSEM 450 FEG-SEM equipped with an energy dispersive X-ray (EDX) spectrometer. Operating conditions were 15 kV accelerating voltage, 3.5 µA emission current, 20 nA beam current, and 6 mm working distance. An aliquot of raw sample was suspended in distilled water and fixed on an aluminium stub with double-stick carbon tape and then sputter-coated with gold (10 nm of thickness) using an Emitech K550 gold sputter coater. Images were acquired using the signal of secondary (SE) and backscattered (BSE) electrons. FEG-SEM was also used to observe sections of tourmaline crystals embedded in epoxy resin.
2.3 Powder X-ray diffraction (XRD) and Rietveld refinement
Fragments of the upward growth sector of the prismatic tourmaline crystal Tur I, picked close to the contact with the fibrous terminations, were successfully isolated from the other two tourmaline portions (Tur II and Tur III) under the optical microscope and investigated using powder XRD to obtain the structure characterization.
The fragments of the prismatic tourmaline were ground into a fine powder in agate mortar, and the powder was loaded on a plexiglass sample holder. The Rietveld structure refinement was conducted using powder data collected with a Philips 1710 diffractometer in the range 5–120°2θ. The step scan was 0.01°2θ, and counting statistics were 10 s per step for the low-angle region (5–37°2θ) and 20 s per step for the high-angle region (37–120°2θ). A 1° fixed divergence slit, 0.2 mm fixed receiving slit, 1° fixed antiscatter slit, and gas proportional detector were used to collect the intensity data sets. The structure refinement was performed using the GSAS (Larson and Von Dreele, 1994) package and its graphical interface EXPGUI (Toby, 2001).
The fit of the pattern was successfully accomplished using the elbaite input model with the coordinates taken from Bosi et al. (2005) in the space group R3m. The site populations were kept fixed to the values determined from the quantitative chemical analysis (see below). During the refinement procedure, the background profile was fitted with a Chebyshev polynomial function with a variable number of coefficients. The profile of the diffraction peaks was modelled using a pseudo-Voigt function with one Gaussian and two Lorentzian components. The refinement of the atomic coordinates and the isotropic thermal parameters has been performed with the aid of soft constraints: Si–O = 1.62(2) Å was imposed with an initial weight of 106 and was used as additional observations in the earlier stages of the refinement, progressively reduced to the value of 15.
2.4 Electron probe micro-analysis (EPMA)
The quantitative chemical composition of the carbon-coated tourmaline portions was obtained using a JEOL 8200 electron superprobe microanalyzer equipped with a wavelength-dispersive X-ray (WDS) spectrometer system and a W hairpin-type filament. The detectable wavelength is 0.087 to 9.3 nm. The atomic number resolution on BSE (Z) is less than or equal to 0.1 (CuZ). The following analytical conditions were used: an excitation voltage of 15 kV, a specimen current of 5 nA, a peak-count time of 30 s, and a background-count time of 10 s. The instrument is also equipped with an EDX system characterized by a detectable element range of Na to U with an energy resolution of 144 eV and a lithium (Li)-doped silicon single-crystal semiconductor detector. Before carrying out the analysis, an aliquot of the sample was embedded in epoxy resin (shaped into a disc with a diameter of 25 mm) and then polished to achieve a flat, shiny surface. For each spot analysis, the following elements were determined: Si, Ti, Al, Fe, Mn, Mg, Ca, Na, K, F, and Cl. The standards utilized were grossular garnet for Si, Al, and Ca; ilmenite for Ti; fayalite for Fe; rhodonite for Mn; forsterite for Mg; omphacite for Na; orthoclase for K; hornblende for F; and scapolite for Cl. The raw data were corrected for matrix effects.
2.5 Raman spectroscopy
Unpolarized micro-Raman spectra were acquired on tourmaline-free samples and cross-sections in epoxy resin in nearly back-scattering geometry using two spectrometers. The first one is a Horiba LabRam (HORIBA Scientific, Kyoto, Japan) micro-spectrometer with 300 mm focal length, a holographic 1800 grooves mm−1 grating, and a Peltier-cooled silicon CCD (1024×256 pixels). The spectrometer is equipped with an Olympus BX40 microscope (4×, 10×, 50× ULWD and 100× objectives) and an XY motorized stage. A He–Ne laser (632.8 nm) and a Nd : YAG laser (473.1 nm) were used as excitation. The spectral resolution is ∼ 2 cm−1 (at 632.8 nm) or ∼ 4 cm−1 (at 473.1 nm). The second instrument is a Horiba LabRam HR Evolution (HORIBA Scientific, Kyoto, Japan) micro-spectrometer with 800 mm focal length and a liquid-nitrogen-cooled silicon CCD. For this set of measurements, a 600 grooves mm−1 grating was used. The spectrometer is equipped with an Olympus BX41 microscope (5×, 10×, 50× ULWD and 100× objectives) and an XYZ motorized stage with autofocus. The measurements were made using a Nd : YAG laser (532 nm), a He–Ne laser (632.8 nm), and a diode laser (785 nm). The spectral resolution is ∼ 1 cm−1 (785 nm), ∼ 2 cm−1 (632.8 nm), and ∼ 3 cm−1 (532 nm). The systems were calibrated using the 520.6 cm−1 Raman peak of silicon in the low-wavenumber spectral range and using the emission lines of a gas lamp in the high-wavenumber range. The laser power on the sample was kept lower than 3 mW using neutral density filters. The minimum spatial resolution was ∼ 2 µm, for both systems, using the 50× ULWD objective. Typical acquisitions were 30 s repeated four times. Data analysis, background subtraction, and Gaussian–Lorentzian deconvolutions were performed with LabSpec 5 software. The fluorescence background was removed by subtracting a polynomial curve as the baseline. The presence of epoxy resin signals was checked in the cross-section spectra, and, when present, they were indicated or removed.
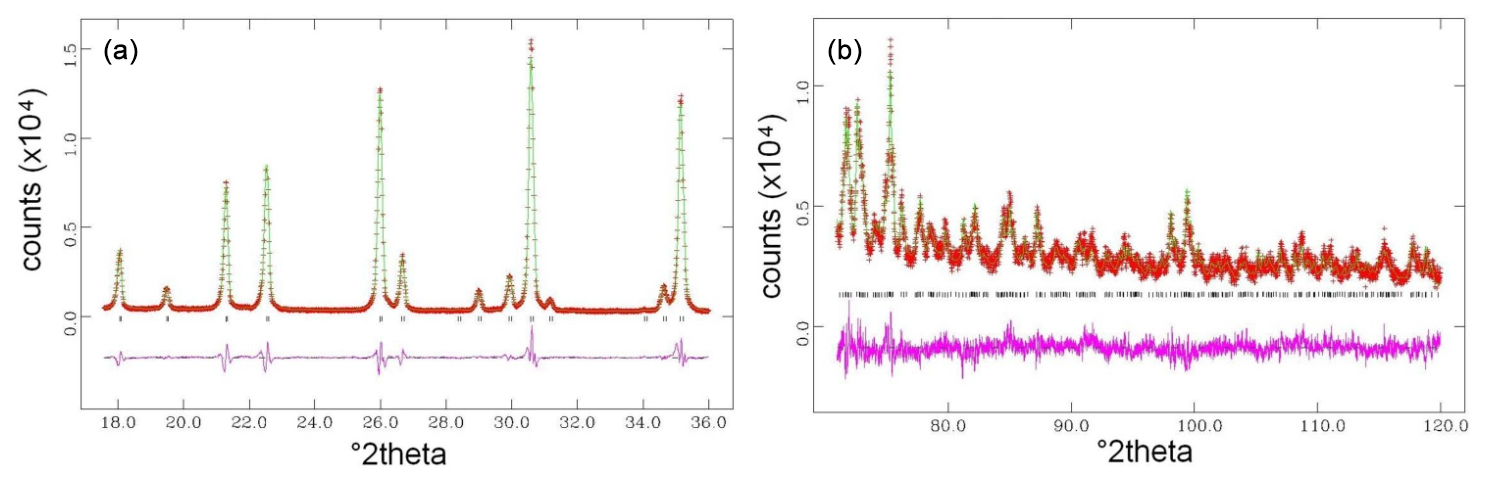
Figure 3Rietveld structure refinement of the studied prismatic tourmaline crystal Tur I: observed vs. calculated curve and difference in curves in selected low-angle (a) and high-angle (b) regions.
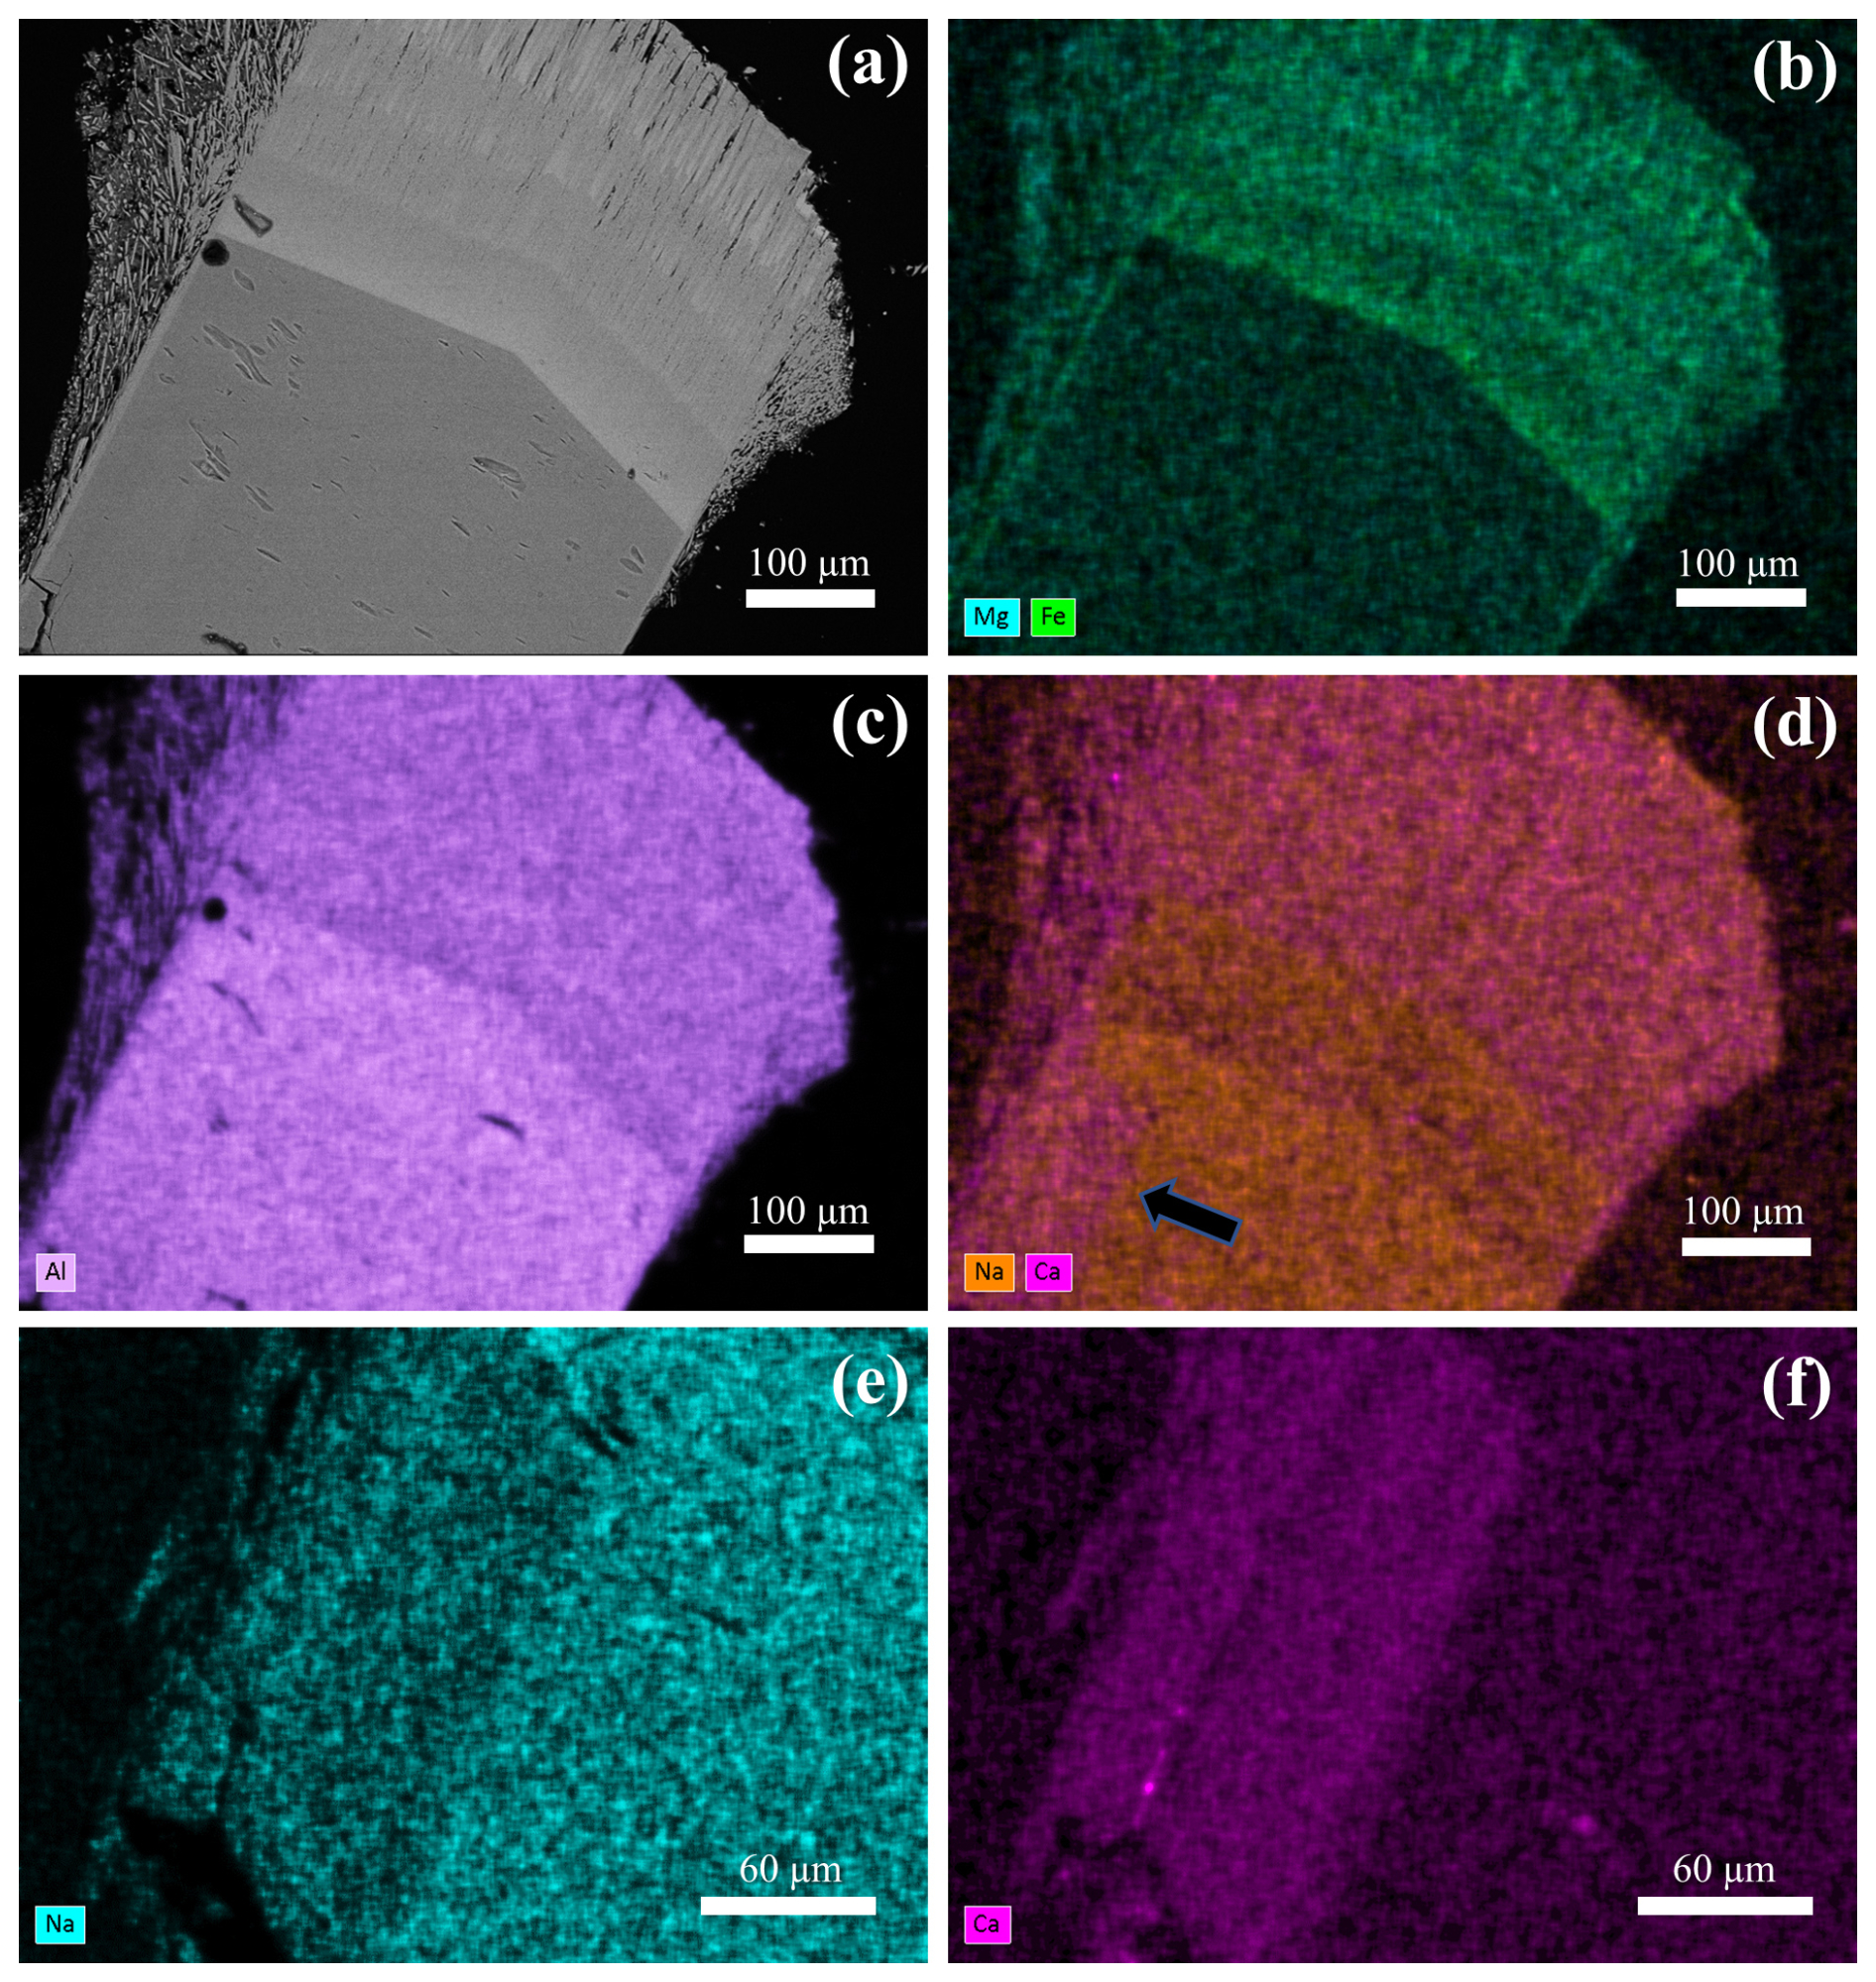
Figure 4Tourmaline prismatic crystal with fibrous cap and acicular crystals on the side: (a) cross-section SEM image and (b–d) SEM-EDX elemental maps. The black arrow in (d) indicates the area shown in more detail in (e) and (f).
2.6 In situ B isotopes
In situ B-isotopic analyses were performed on selected tourmaline portions mounted in epoxy resin. Isotopic data were obtained using a double-focusing MC-ICPMS with a forward Nier–Johnson geometry (Thermo Fisher Scientific, Neptune™) coupled to a 213 nm Nd : YAG laser ablation system (New Wave Research™). Three of nine Faraday cups were used to collect the following masses: 10B (L3), ∼ 10.5 (central), and 11B (H3). The instrument was tuned using NIST-612 reference material and an in-house standard (Lipari obsidian, close to B6 material in Tonarini et al., 2009). During the analytical session, the NIST-612 reference material was analysed to check the accuracy and precision of the measurements and was later used for the 11B 10B ratio (δ11B) calculation. The in-house standard was used to check the accuracy and precision treated as unknown. Isotopic ratios were acquired in static mode with a block of 200 cycles (including laser warm-up, ∼ 120–125 cycles of analysis, and washout), an integration time of 1 s, a laser spot of 40 µm, and a fluence of ∼ 10 J cm−2 with a He flux of ∼ 0.6 L min−1. Two prismatic tourmaline crystals (one larger and one smaller, three spots each) and the overgrowing fibres of the larger crystal (two spots) were analysed in this way. A line of ∼ 2300 µm perpendicular to the larger tourmaline crystal was also acquired to evaluate potential variations perpendicular to the crystal growth in the prismatic portion. Data reduction was performed with in-house Excel software. 11B 10B ratios were converted in delta notation reported to NIST-951 by using NIST-612 (δ11B = −0.51 ‰; Aggarwal and You, 2017) after bracketing. The quality control in-house reference material Lipari yielded an average δ11B of −1.89 ± 0.96 ‰ (n=4; error of 2× SD), in agreement with values reported for solution analyses on fragments (−1.68 ± 0.66 ‰; Tonarini et al., 2003). NIST-612 (ca. 30 ppm of B) yielded an external reproducibility of 0.35 ‰ (n=4; 2× SD).
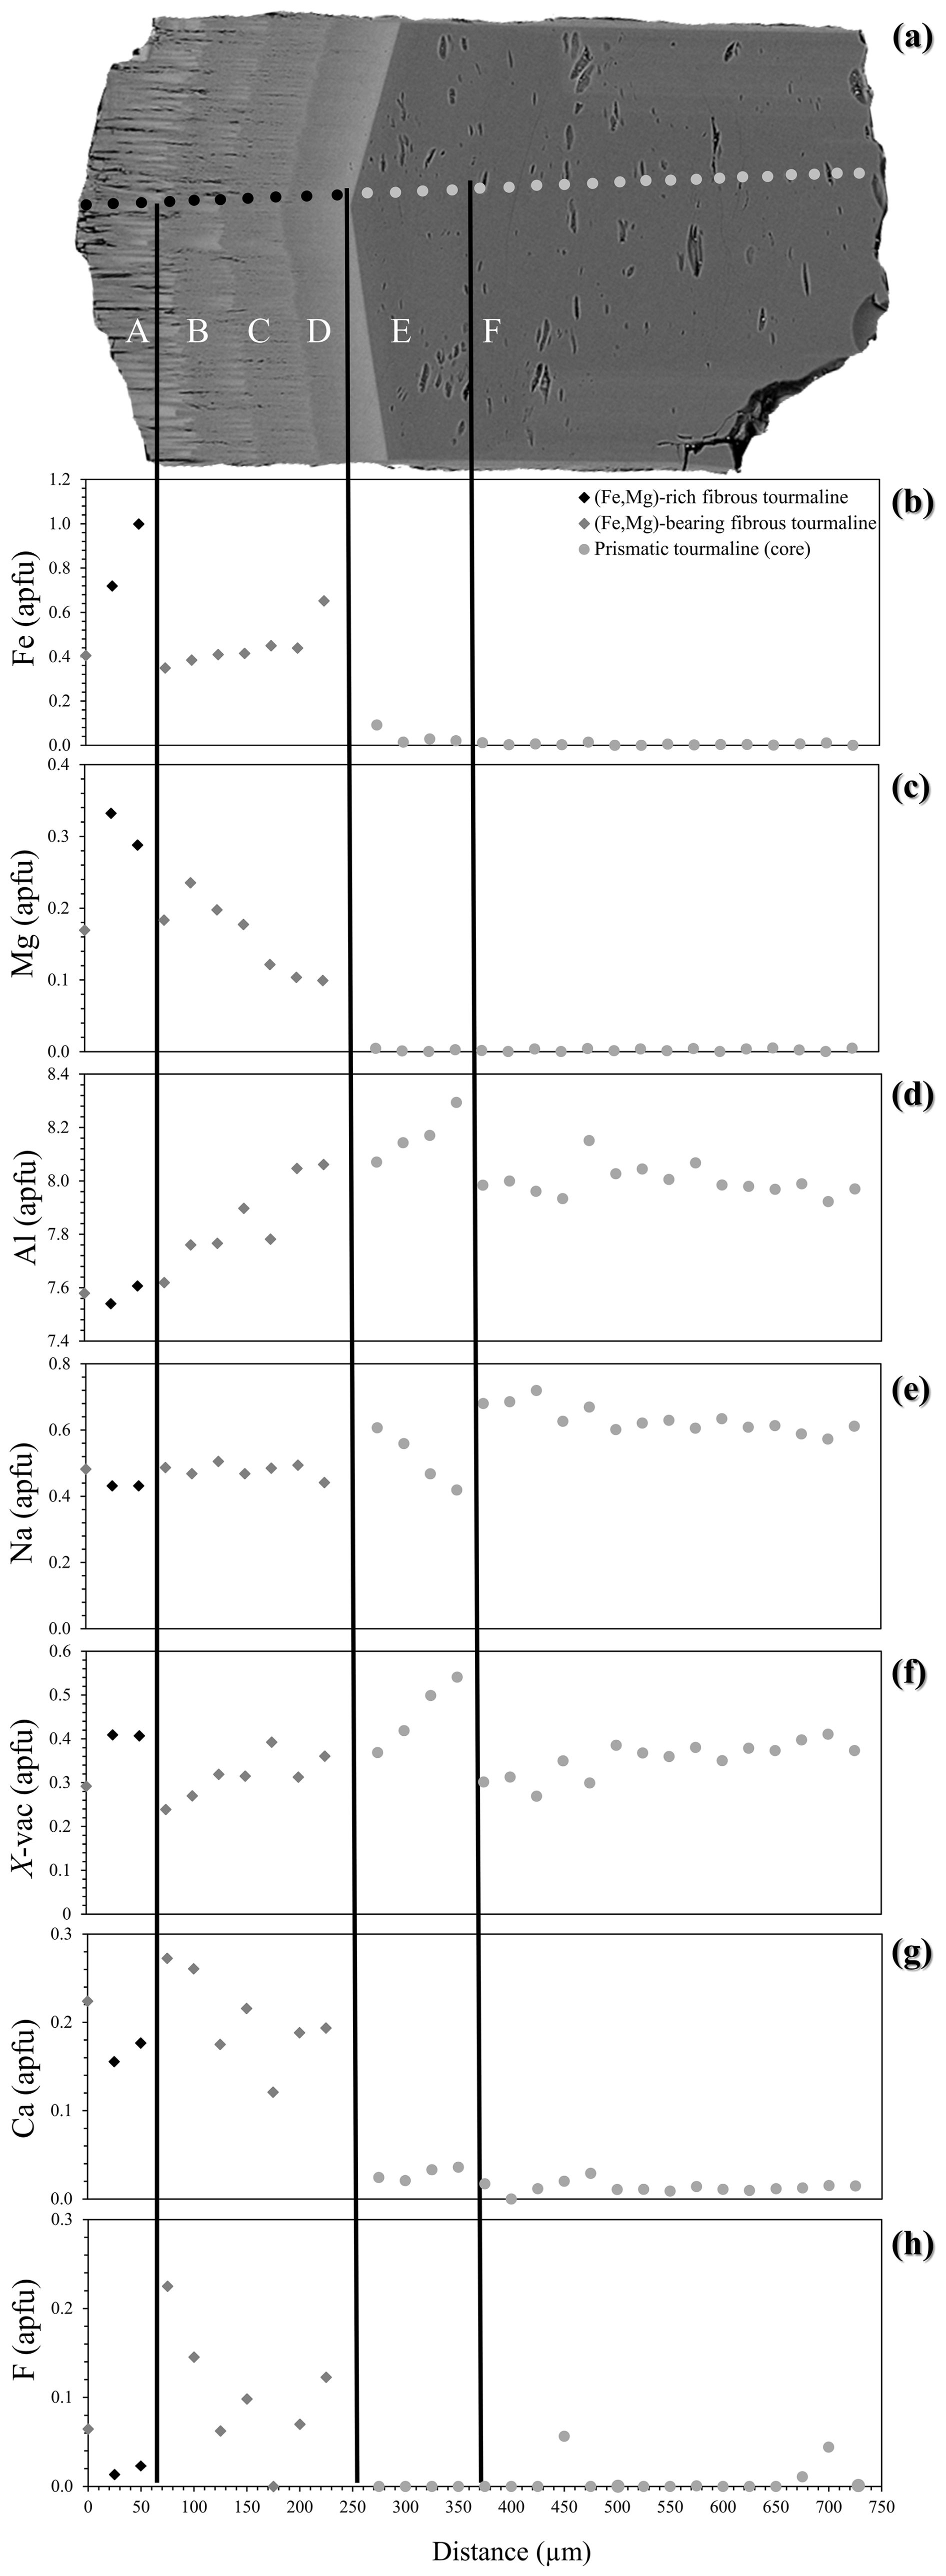
Figure 5Chemical zoning patterns of the studied sample along a longitudinal traverse representative of the evolution from a prismatic to a fibrous tourmaline (areas from F to A). (a) BSE image showing the positions of EPMA spot analyses and (b) Fe, (c) Mg, (d) Al, (e) Na, (f) X-site vacancy, (g) Ca, and (h) F variation as a function of the position along the traverse. The distance between the spots is 25 µm.
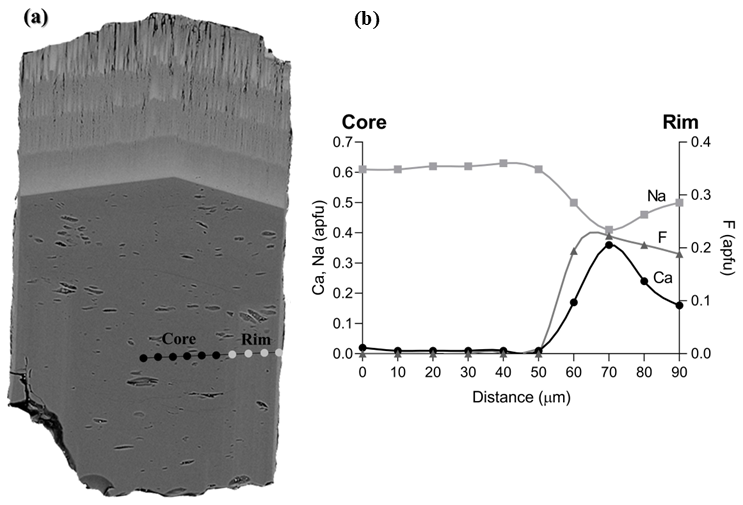
Figure 6Chemical zoning patterns of the studied sample along an alignment perpendicular to the c axis representative of the core–rim evolution of the prismatic tourmaline: (a) BSE image showing the positions of EPMA spot analyses and (b) Ca, Na, and F variation as a function of the position along the alignment. The distance between the spots is 10 µm.
3.1 Tourmaline crystal chemistry
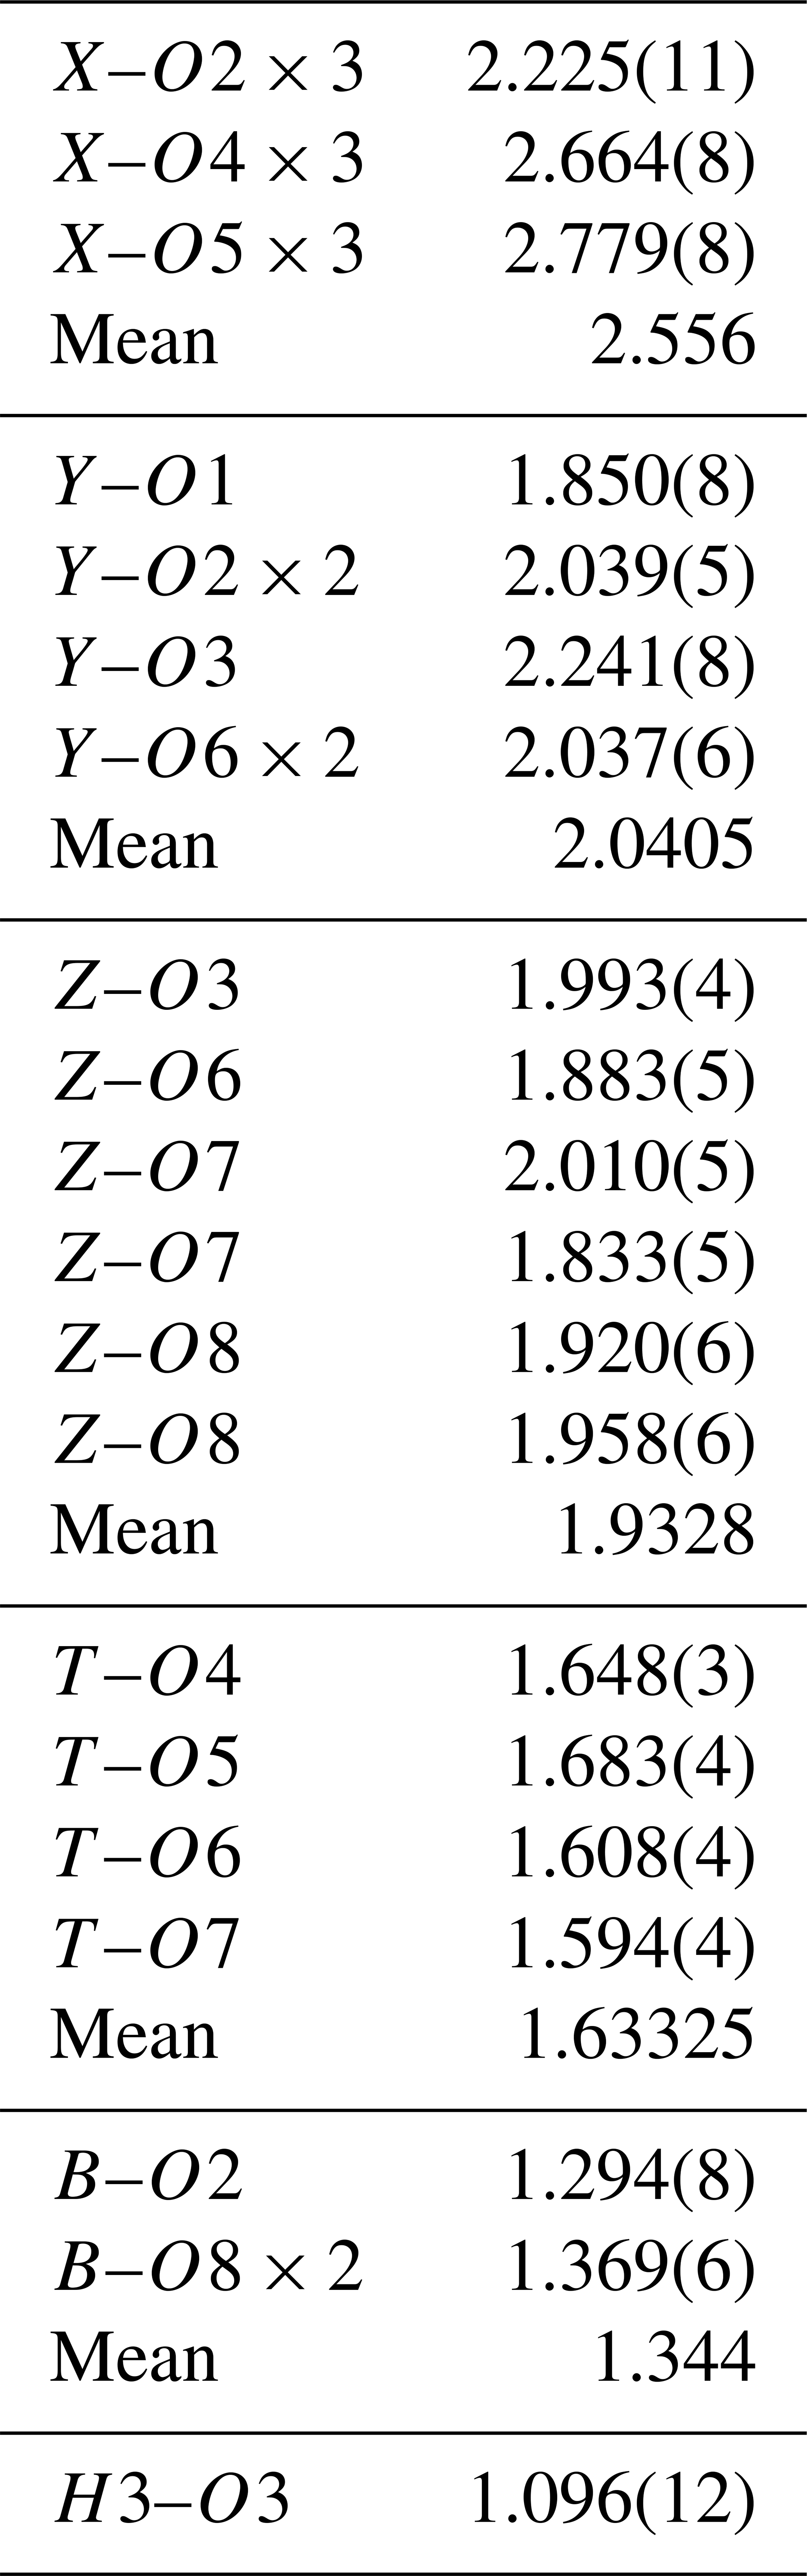
The results of the Rietveld structure refinement of the prismatic tourmaline crystal Tur I are reported in Table 1. Lattice constants are a=15.8225(3) and c=7.0985(1) Å. Table 2 reports the relevant calculated interatomic distances. The graphical result of the Rietveld structure refinement (observed vs. calculated curve and difference curve) in low-angle (17–36°2θ) and high-angle (70–120°2θ) selected regions is shown in Fig. 3. The agreement factors of the refinement are Rwp=0.0838, Rp=0.0649, and χ2=4.359 for 61 variables.
Table 1Atomic coordinates, occupancies, and atomic displacement parameters of prismatic tourmaline Tur I.
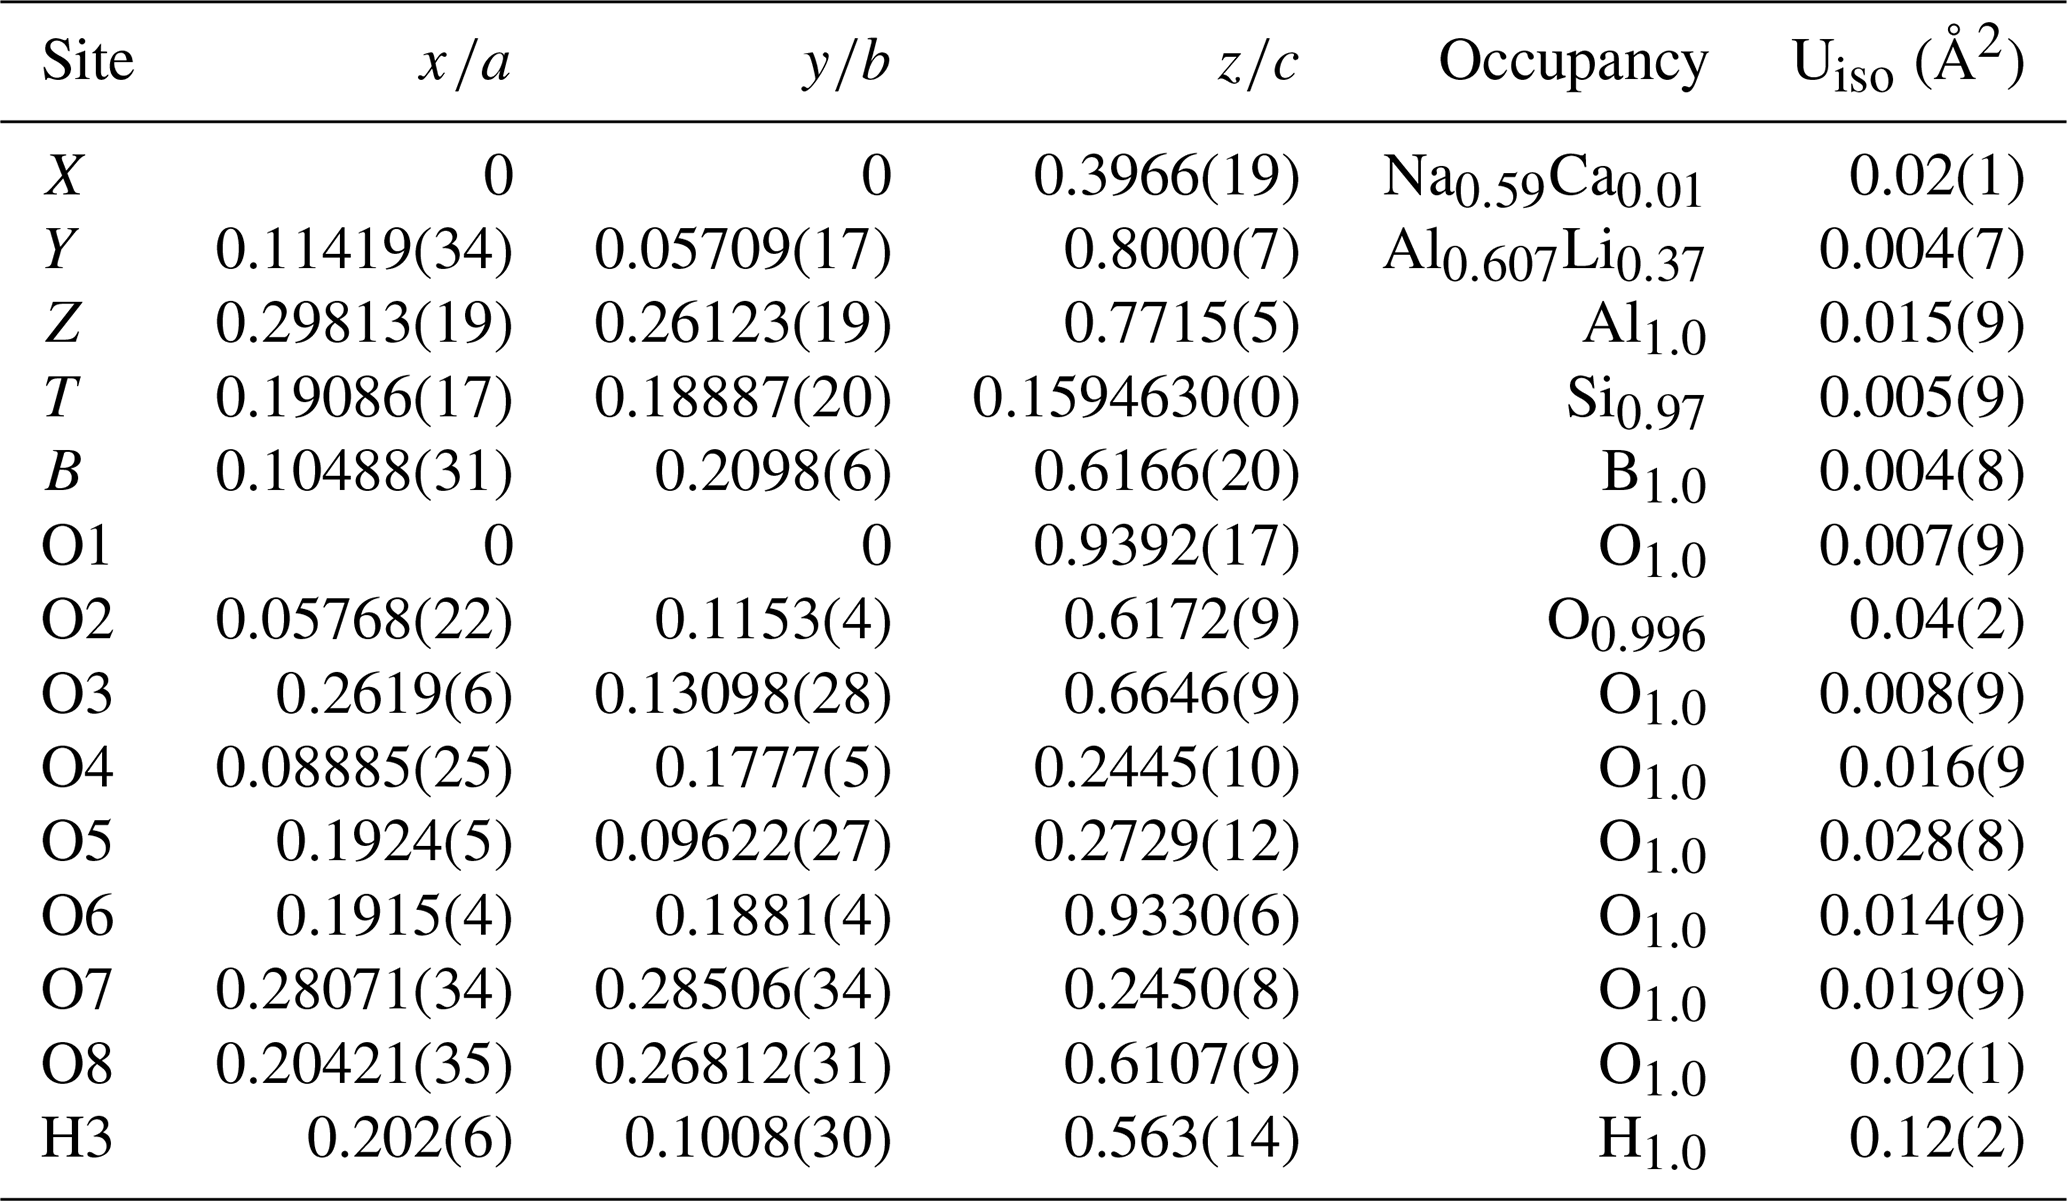
Table 2Selected mean bond distances (Å) of prismatic tourmaline Tur I.
The SEM-EDX maps obtained from the studied sample show an evident compositional zoning pattern along the c axis among the tourmalines of the various generations, with the upper fibrous zones (Tur II) exhibiting a marked differentiation with respect to the lower prismatic zone (Tur I). The upper zones display stepwise chemical variation and a fibrous nature that is very tight at the contact with the lower prismatic zone and thinner at the distal termination (Fig. 4a–d). Moreover, the prismatic zone exhibits lateral chemical variation between the core and the rim (Fig. 4e–f).
The compositional zoning of both the prismatic and the fibrous portions is quantitatively confirmed by results of EPMA collected by two traverses across the sample (Figs. 5 and 6).
Based on BSE image contrast and chemical analysis, six areas (A, B, C, D, E, F) can be distinguished along the tourmaline c axis (Fig. 5a), with areas E–F representing the prismatic tourmaline Tur I and A–D representing the fibrous tourmaline Tur II. The latter can be further described as Tur IIa (areas B–D) and Tur IIb (area A) as a function of position and chemical composition. The inner Tur IIa crystallized directly on top of the prismatic tourmaline and indicates a marked variation in the chemical system in the miarolitic cavity, exhibiting an R content (with R = Fe + Mg + Mn) that is much higher than that of the prismatic Tur I. The outer Tur IIb recorded a further enrichment in Fe and Mg and is characterized by the highest values of R and the lowest values of Al (Figs. 4b, c and 5b, c, d). The contents of Mn (not plotted) are zero or very close to zero in the prismatic Tur I and increase to ca. 0.90 wt % (ca. 0.12 atoms per formula unit, apfu) in Tur IIa, remaining almost constant around this value towards Tur IIb. Sodium contents decrease from the prismatic Tur I to the fibrous Tur II, whereas Ca content suddenly increases from the prismatic Tur I to the fibrous Tur II (Figs. 4d and 5e, g). Furthermore, the prismatic Tur I shows a symmetric core–rim compositional zoning, with the rim (Tur Ib) locally characterized by higher Ca and F and lower Na contents with respect to the core (Tur Ia) (Figs. 4e, f and 6). Moreover, the Tur Ib rim is (Fe,Mg)-free and has no compositional relationship with Tur II, instead showing a closer relationship with Tur III.
Crossing the contacts between Tur Ia and Tur IIa, as well as between Tur IIa and Tur IIb, iron contents show an apparent fluctuation, and this behaviour could be interpreted as oscillatory zoning (Lussier and Hawthorne, 2011). However, the number of fluctuations is very limited, and, moreover, the contents of Mg do not show the same trend. Furthermore, the contents of Ca and F show an apparent fluctuation within Tur IIa and towards Tur IIb, but there is not synchronicity with Fe fluctuation. Therefore, there is no clear evidence of oscillatory zoning during the growth of the studied sample.
Based on the chemical composition of the various generations of tourmaline, distinct compositional domains are identified, and the evolution path among them may be tentatively reconstructed (Fig. 7).
Starting from the homogeneous prismatic tourmaline core Tur Ia and proceeding towards the fibrous portion Tur II, the content of Fe suddenly increases from zero to ca. 0.3 apfu and then continuously increases up to ca. 1.1 apfu spanning Tur IIa and Tur IIb. Magnesium content (not plotted) shows a similar trend, with values of zero in the prismatic tourmaline and increasing from 0.1 to 0.4 apfu in the fibrous portion. Nonetheless, Mn excursion (not plotted) is much more limited, increasing from zero in the prismatic tourmaline to ca. 0.1 apfu and then remaining constant. In the prismatic tourmaline core Tur Ia the Al contents cluster around 8.0 and Na contents cluster around 0.6 apfu, but towards the fibrous portions Tur IIa and Tur IIb they progressively decrease to 7.5 and 0.4 apfu, respectively. Remarkably, from Tur IIb to the acicular crystals Tur III, the opposite trend is registered for Fe, Mg, Al, and Na. A more complex scenario is described by Ca and F, which are both almost absent in the prismatic core Tur Ia, are limited in the fibrous portion Tur II, and reach their highest values (up to 0.4 apfu) in the acicular crystals Tur III and in the prismatic rim Tur Ib (Fig. 7).
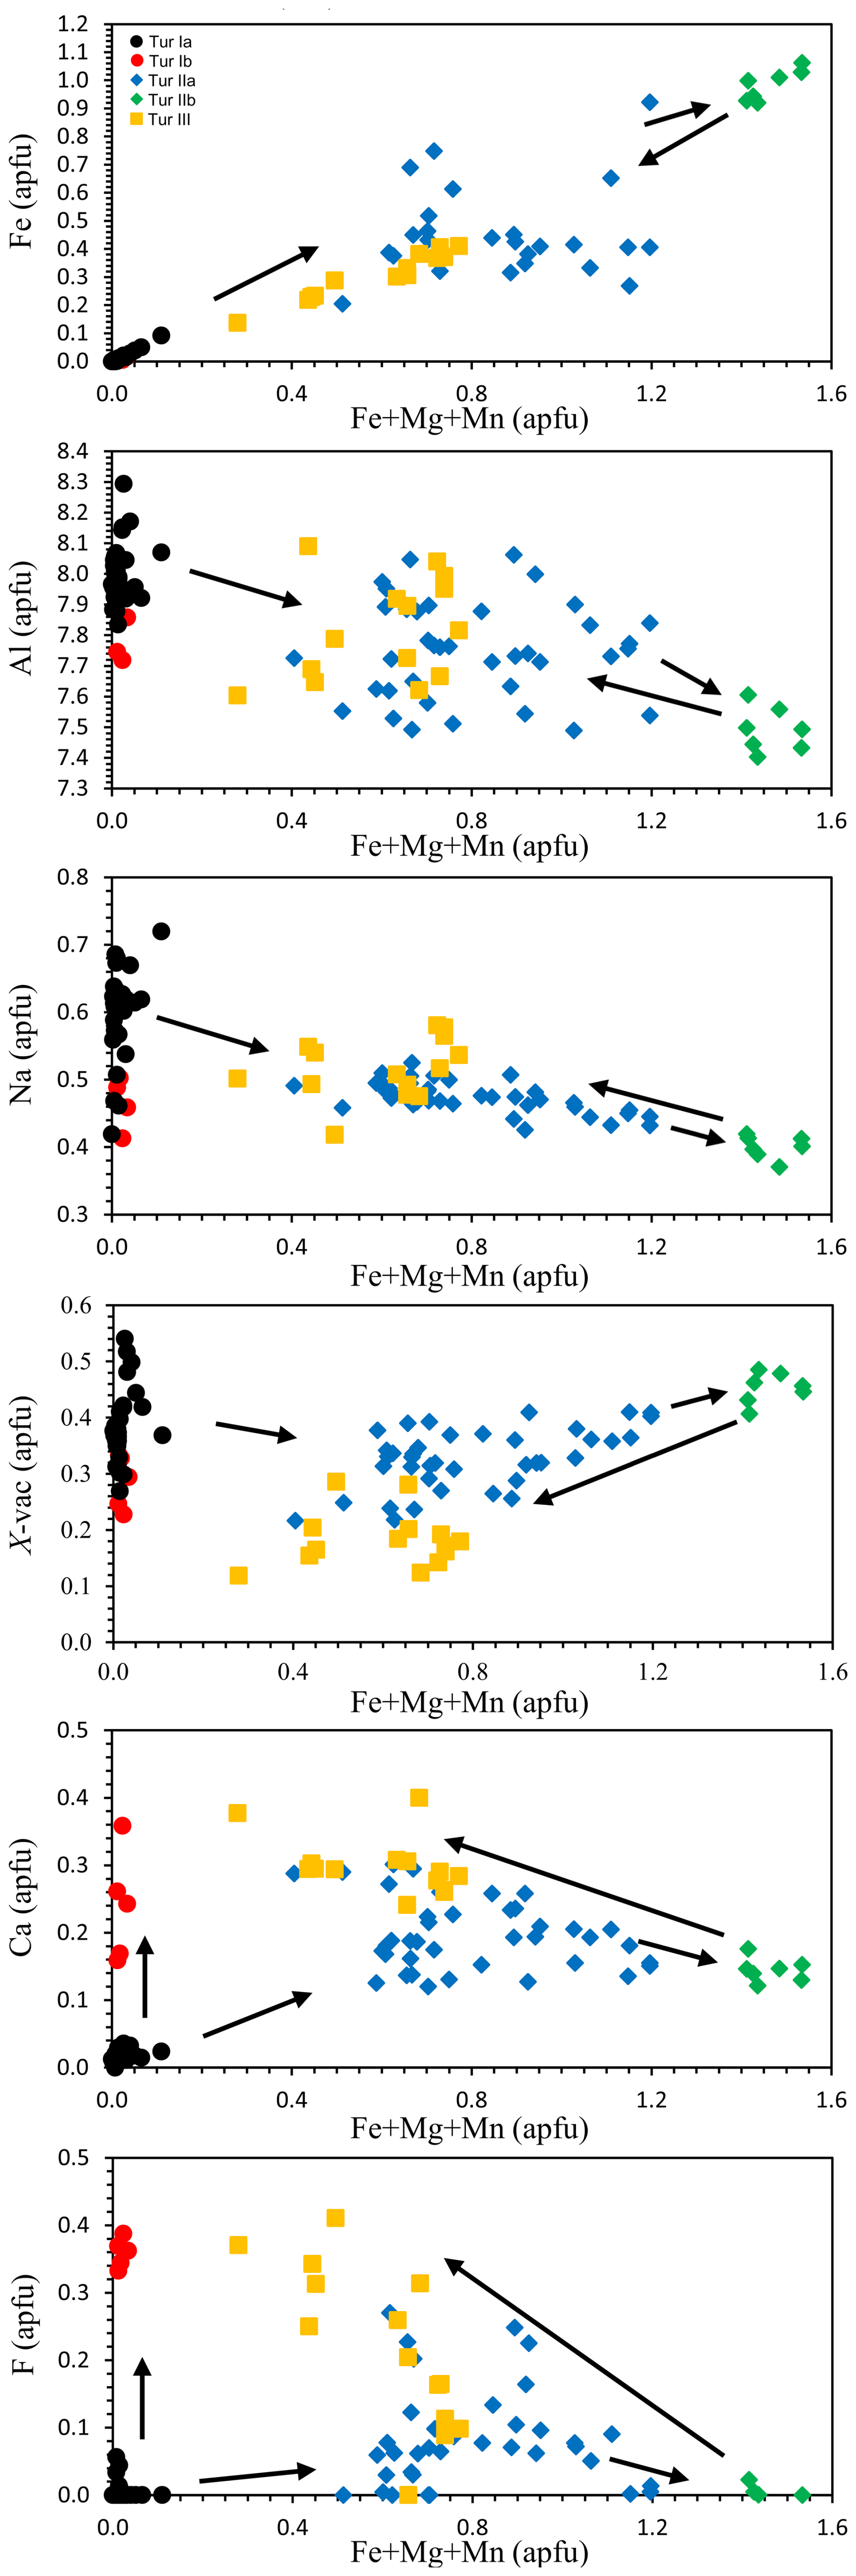
Figure 7Variation in selected elements for tourmaline of the various generations plotted as a function of the R value (R = Fe + Mg + Mn). Black dots – prismatic tourmaline core (Tur Ia), red dots – prismatic tourmaline rim (Tur Ib), blue diamonds – fibrous (Fe,Mg)-bearing inner portion (Tur IIa), green diamonds – fibrous (Fe,Mg)-rich outer portion (Tur IIb), yellow squares – acicular crystals (Tur III).
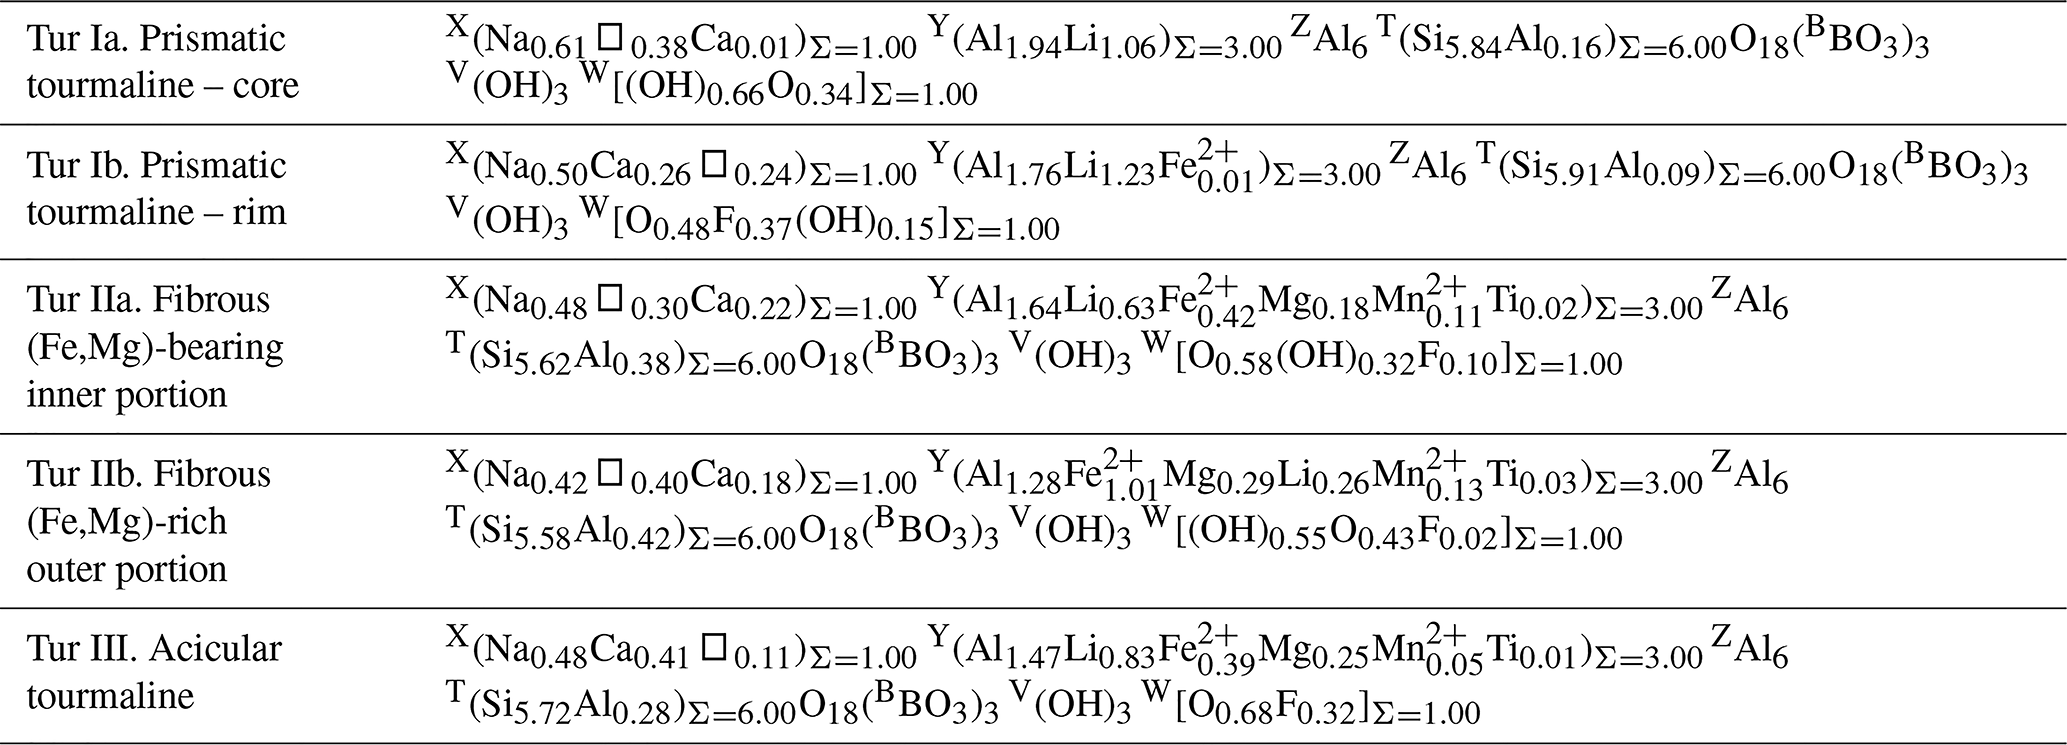
Given that EPMA analyses do not include the determination of B, Li, Fe2+ Fe3+, and OH, we have retrieved the empirical formula of the various generations of tourmaline, adopting the following strategy: B was fixed to 3 apfu on the basis of tourmaline stoichiometry, Li was obtained using the method described in Pesquera et al. (2016), Fe was considered to be Fe2+ (the possible presence of Fe3+ was only taken into account in the case of charge unbalance), and OH was calculated assuming (Y + Z + T) = 15 apfu and 31 anions. The amounts of WO were retrieved at the end of this procedure (and hence should be considered with caution).
Distinct representative empirical formulae are obtained for Tur Ia, Tur Ib, Tur IIa, Tur IIb, and Tur III, and they are classified according to the nomenclature of Henry et al. (2011). The prismatic tourmaline core Tur Ia is quite homogeneous, and its empirical formula corresponds to elbaite. The prismatic rim Tur Ib, though discontinuous and locally very thin, shows a distinct composition corresponding to a Ca-bearing fluor-elbaite. It marks the core-to-rim transition, determined by an increase in Ca and F at the expense of Na and OH (Table 3 and Fig. 8).
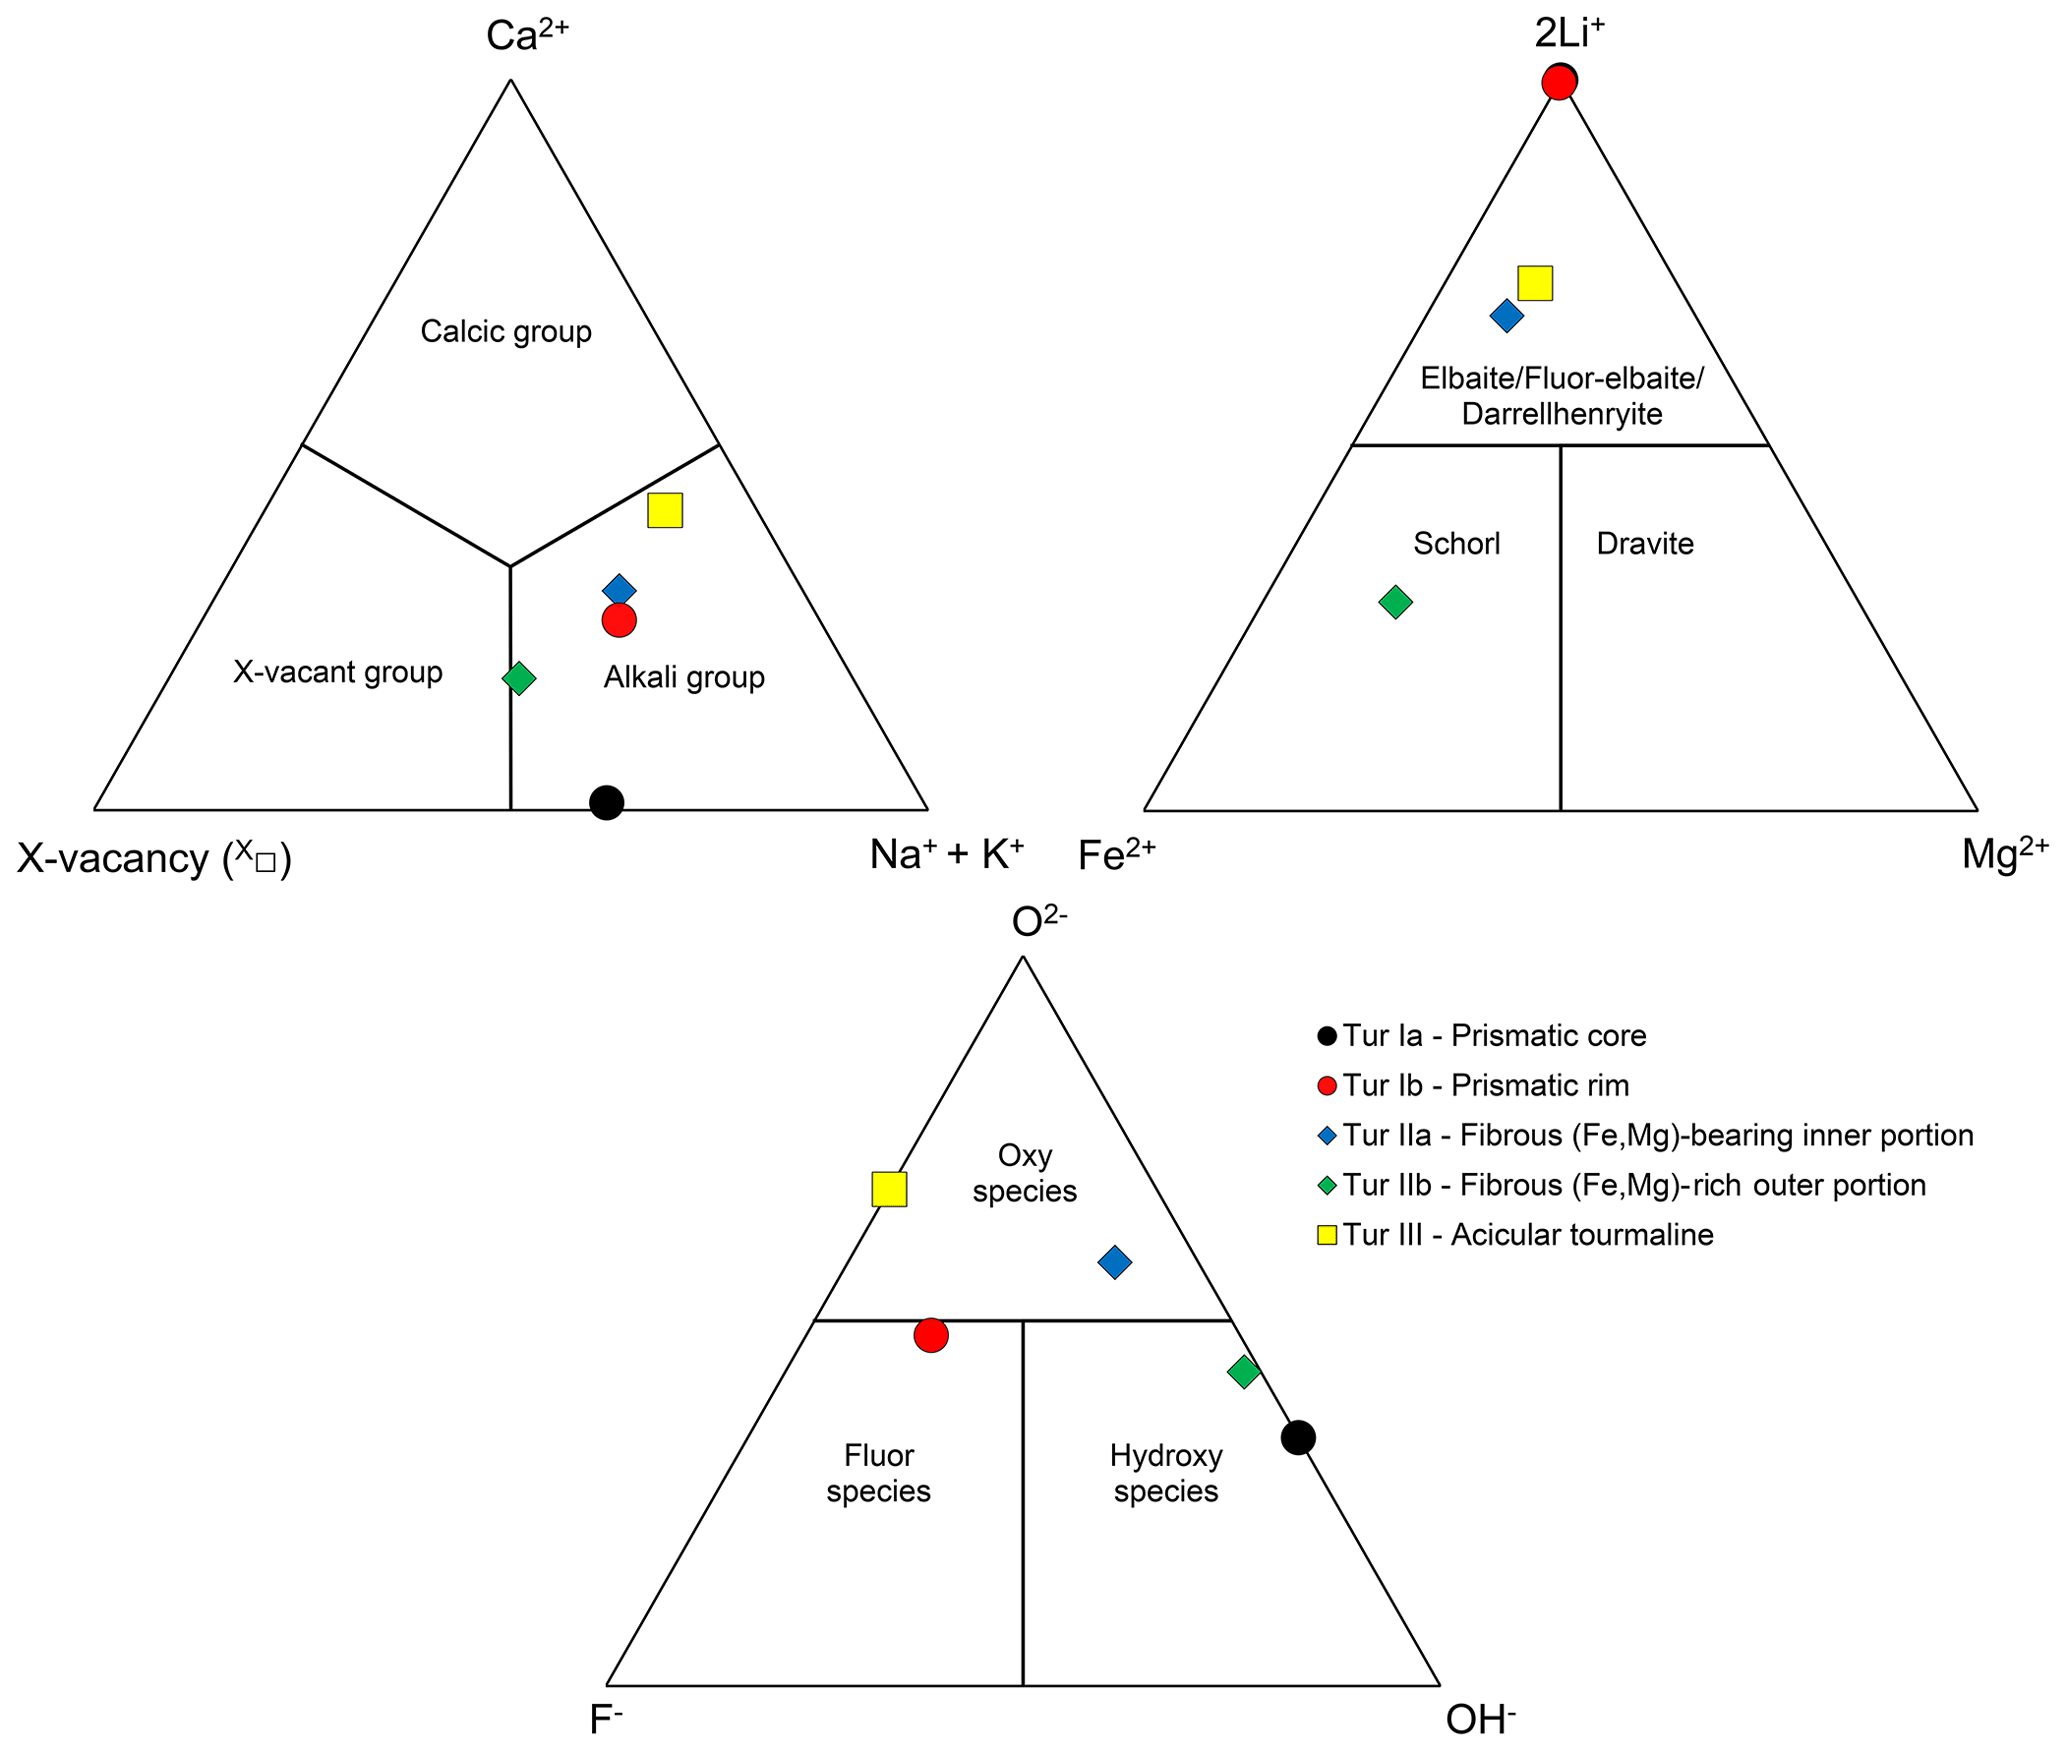
Figure 8Ternary diagrams illustrating the dominant occupancy in terms of X and Y cations and W anions according to the representative formulae of tourmaline of the various generations. Black dots – prismatic tourmaline core (Tur Ia), red dots – prismatic tourmaline rim (Tur Ib), blue diamonds – fibrous (Fe,Mg)-bearing inner portion (Tur IIa), green diamonds – fibrous (Fe,Mg)-rich outer portion (Tur IIb), yellow squares – acicular single crystals (Tur III).
Table 3Representative empirical formulae of tourmaline of the various generations.
The sharp prismatic-to-fibrous evolution from Tur I to Tur II is characterized by an abrupt increase in Fe and Mg, counterbalanced by a significant decrease in Al and Li (but with Al always dominant over Li), and a dominant oxy-component, determined by a marked increase in O2− that substitutes (OH)−. Accordingly, the transition from Tur Ia to Tur IIa consists of a compositional evolution from elbaite to (Fe,Mg)-bearing darrellhenryite. The next transition is characterized by a further Fe–Mg enrichment in the outer fibrous portion Tur IIb, where the tourmaline composition is consistent with schorl, although it is very close to foitite due to the occurrence of comparable amounts of Na and X-site vacancy (Table 3 and Fig. 8).
The single crystals of acicular tourmaline Tur III show heterogeneous chemical composition, which is on average rich in Al and Li, with subordinate Fe and Mg. Their mean composition is consistent with a (Fe,Mg)-bearing darrellhenryite, as O2− is the dominant W anion (over minor F and absent OH). Remarkably, although Fe and Mg contents are comparable to those of Tur IIa, Ca and F contents are significantly higher and closer to those of Tur Ib (Table 3 and Fig. 8).
As anticipated, it was not possible to collect XRPD data on the lath-like particles forming the small globular terminations of the acicular crystals. The shape of the particles (Fig. 2d) is not compatible with that of a zeolite phase. We also considered the possibility that these flakes belong to imogolite, but the particle shape is very different from the tubular one usually observed for natural and synthetic imogolites (see, for example, Paineau et al., 2019). Instead, the shape of the flakes is compatible with that of clay minerals like smectite, illite, and kaolinite (Bailey, 1991), although we cannot exclude allophane (see, for example, Calabi-Floody et al., 2011), an amorphous/paracrystalline hydrous Al-layer silicate with an idealized chemical formula of Al2O3⋅ (SiO2)1.3−22.5–3H2O (Kaufhold et al., 2010). Finally, it is likely that the flakes are actually composed of a mixture of layer silicates (see the following section on Raman spectroscopy).
3.2 Tourmaline Raman spectra
In tourmalines, Raman spectra recorded in the low-wavenumber region (100–1100 cm−1) are characterized by the vibrations of the YO6 octahedra between 200 and 240 cm−1, the ZO6 groups between 360 and 375 cm−1 (in ZAl-dominant tourmalines), the TO4 rings breathing in the range 650–720 cm−1, and the T–O stretching in the range 960–1120 cm−1. Representative examples of the Raman spectra obtained from Tur I, Tur II, and Tur III in the low-wavenumber region are shown in Fig. 9. The three spectra are slightly different, but all of them can be attributed to a prevalent elbaite (or elbaite-like) phase (Watenphul et al., 2016).
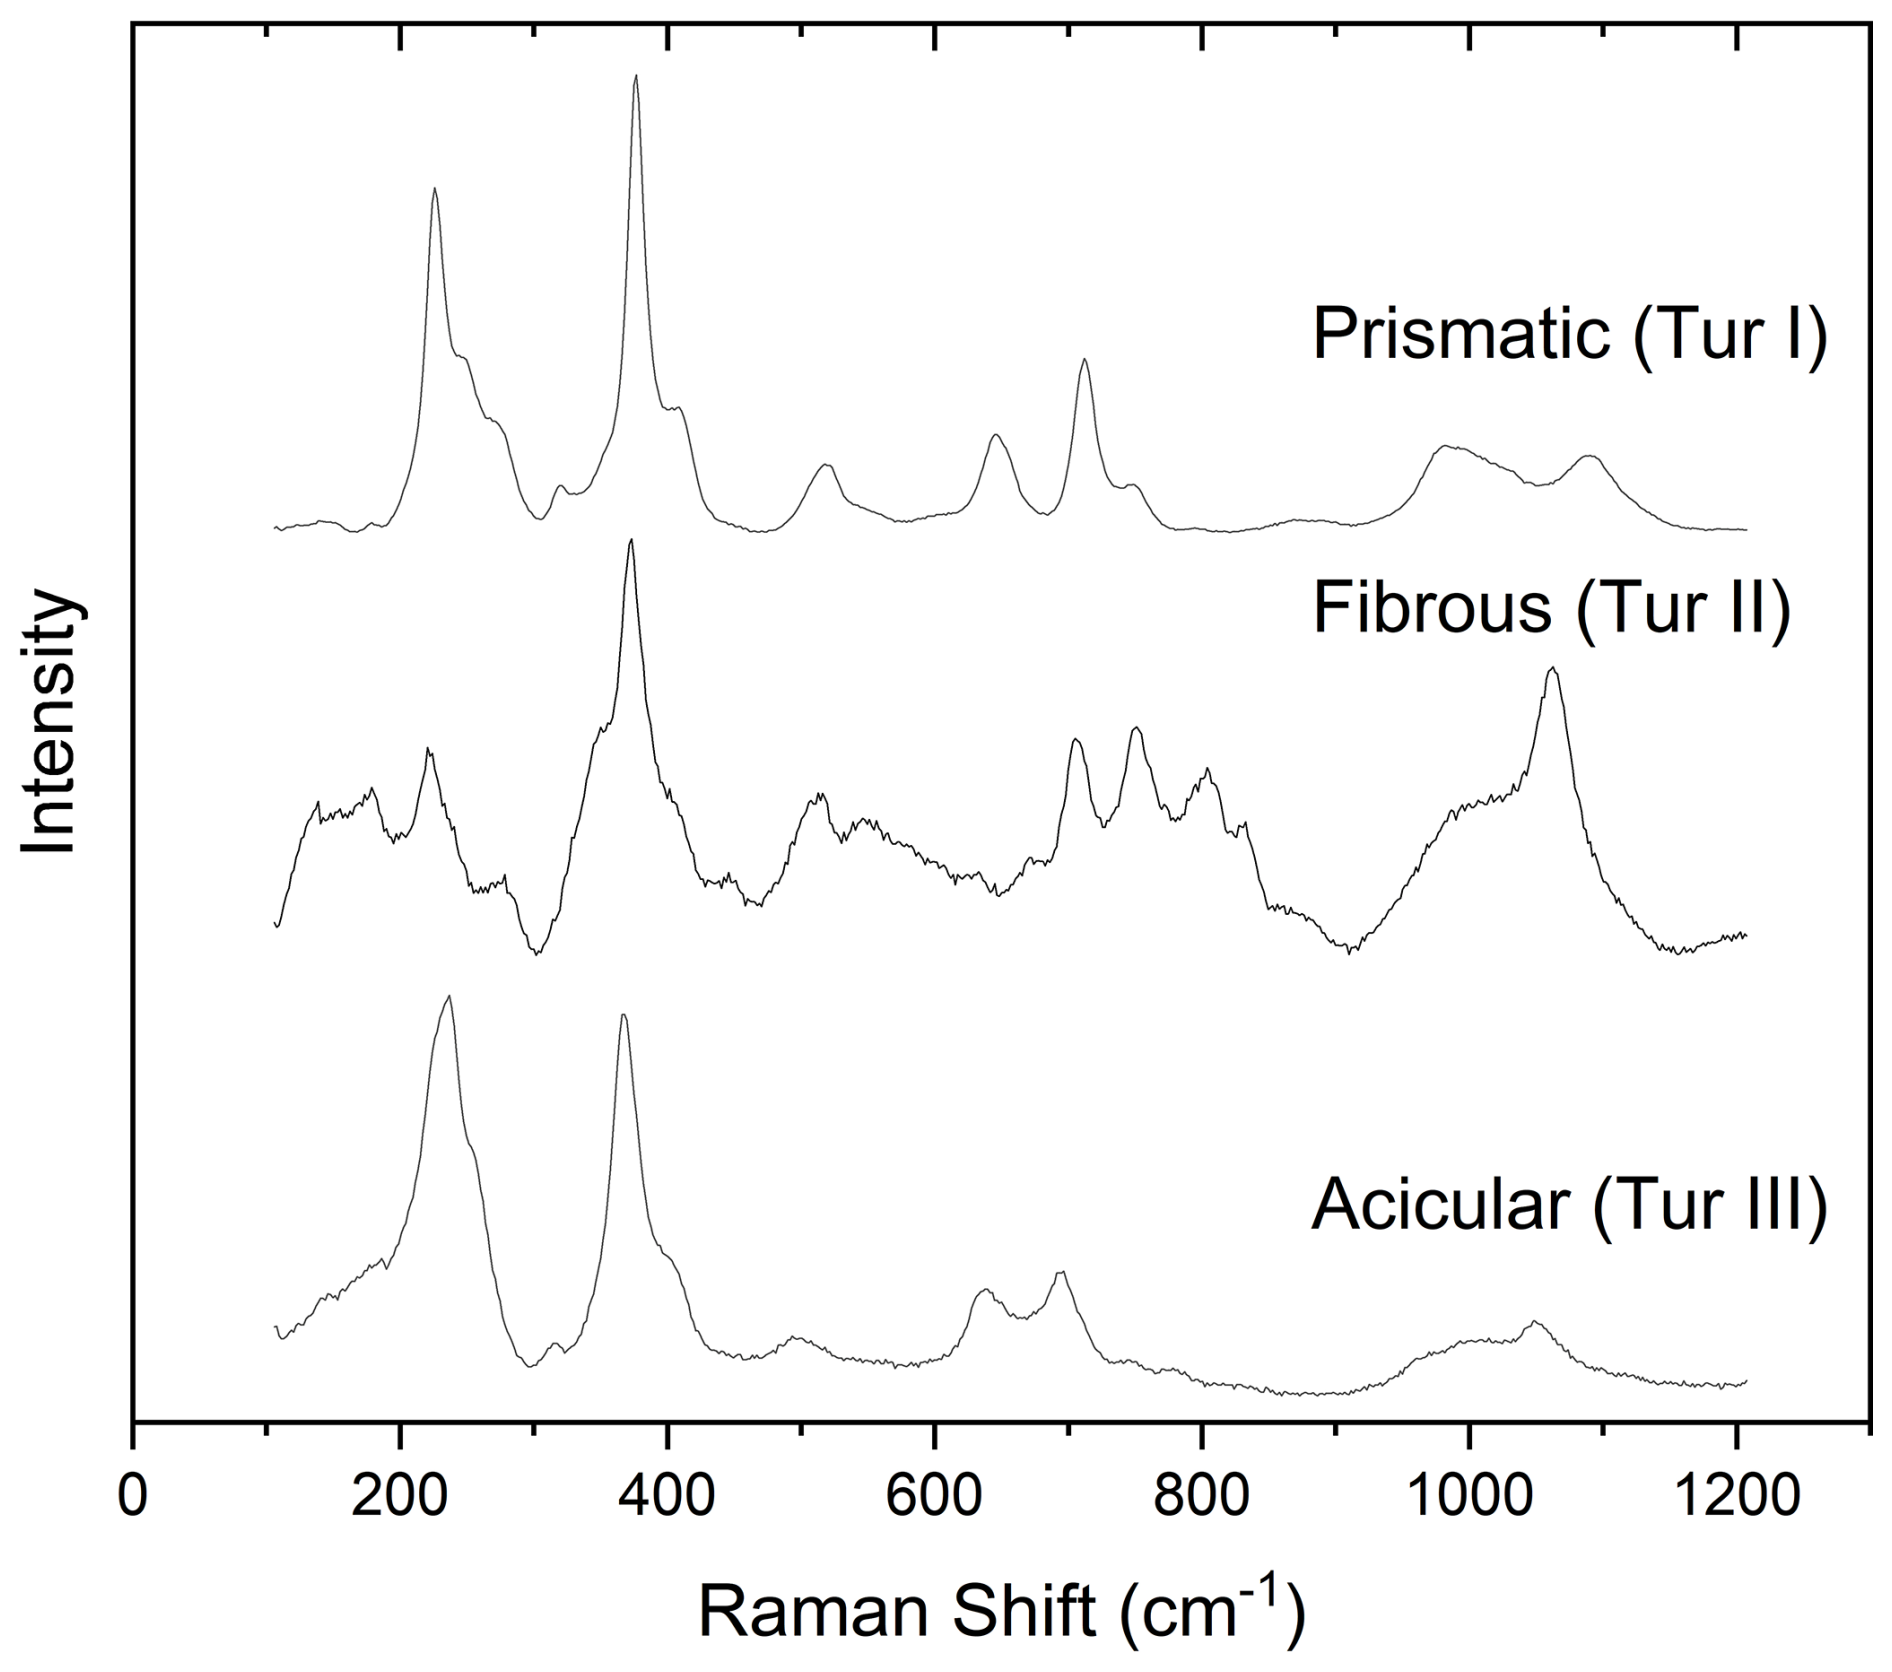
Figure 9Characteristic Raman spectra in the low-wavenumber region of prismatic (Tur I), fibrous (Tur II), and acicular (Tur III) tourmaline belonging to the various generations.
The spectra obtained on the fibrous portion (Tur II) exhibit broader and less resolved Raman bands in comparison to prismatic and acicular tourmalines. No marked differences are evident between lighter (Tur IIa) and darker (Tur IIb) portions of the fibres, and they are compatible with an elbaitic phase and other ZAl-dominant tourmalines, such as schorl or foitite.
Raman spectra of both the acicular single crystals present on the side faces (Tur III) and those forming the hat are very similar to each other, but the hat produced very noisy spectra due to the strong fluorescence generated by the mineral mixture it is made of. In fact, in addition to tourmaline bands, distinct Raman signals attributed to layer silicates (main peaks at nearly 200, 270, and 707 cm−1) and occasionally very noisy signals from very small, colourless, unidentified grains were acquired from the hat. For that reason, most of the considerations on Tur III are based on the spectra obtained from the acicular crystals grown on the side faces of the main prismatic crystal.
In tourmalines, Raman spectra in the high-wavenumber region (3200–3800 cm−1) are characterized by the OH stretching vibrations. According to Watenphul et al. (2016), the main peaks observed in this spectral range lay between 3400 and 3615 cm−1 and can be attributed to the stretching vibrations of OH groups belonging to V anions at O3 sites. Their wavenumbers depend on the most probable population of ions present at the centre of the YZZ octahedra surrounding each of the three V anions present in the cell, with this situation described by a YZZ–YZZ–YZZ configuration. In addition, peaks observed over 3615 cm−1 are weaker and can be attributed to the stretching vibration of the OH groups belonging to W anions at O1 sites. Their wavenumber is influenced by the population of the three Y octahedra and the close X irregular polyhedron surrounding each W anion, described by a YYY–X configuration.
The high sensitivity of the high-wavenumber region allows for a reliable characterization and discrimination of tourmaline of the various generations (Fig. 10).
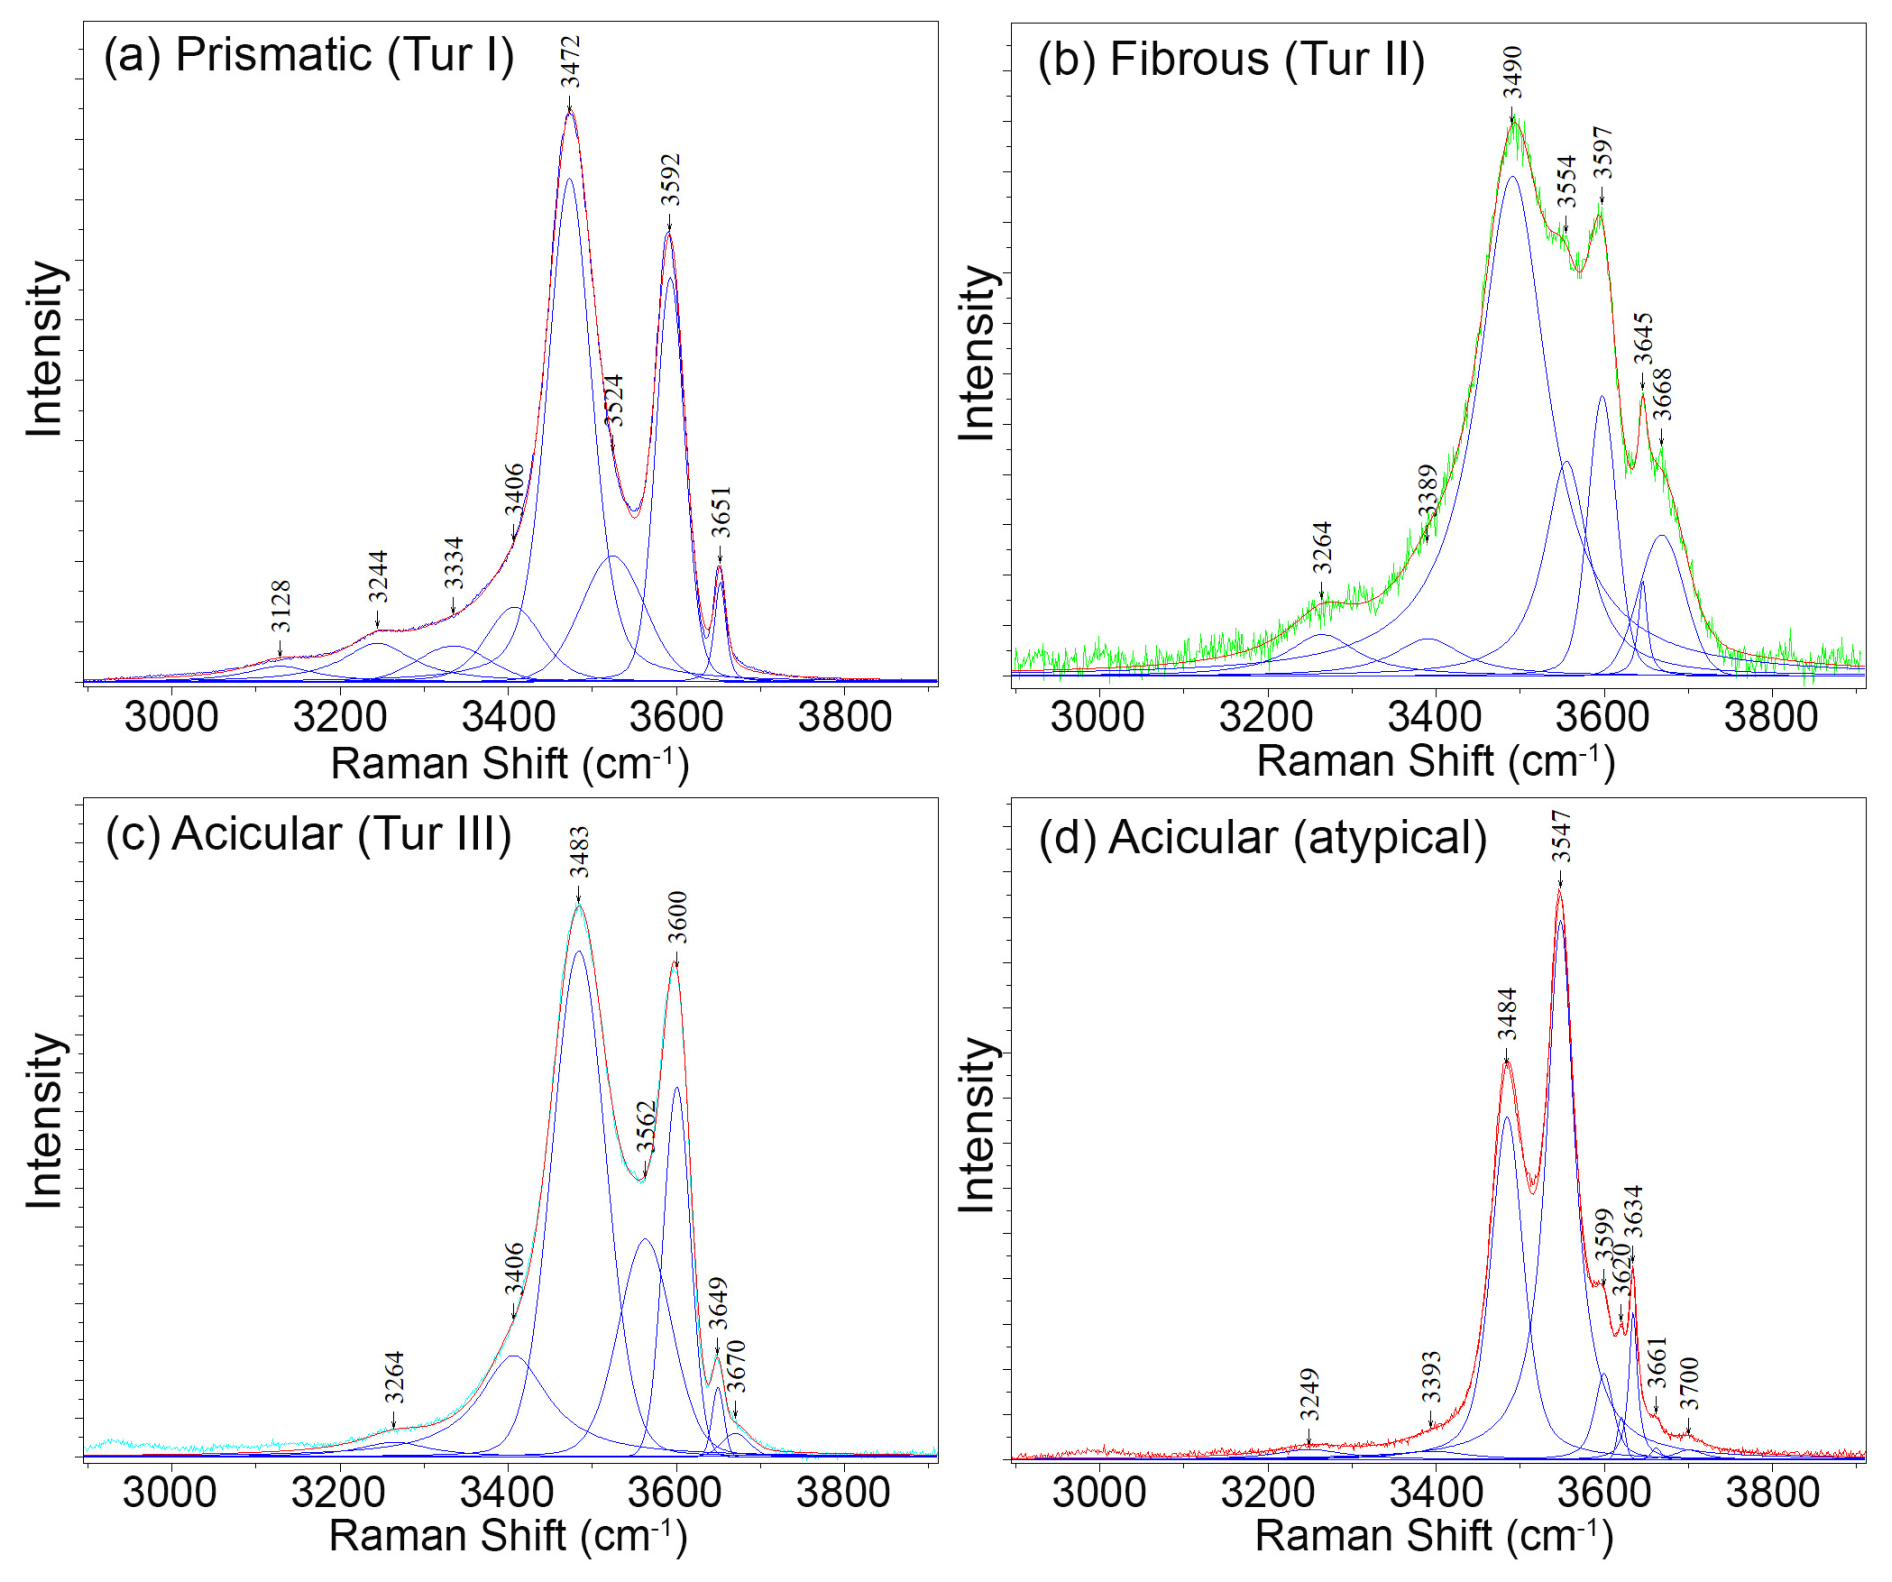
Figure 10Deconvolution of the Raman spectra in the OH region obtained from tourmaline of the various generations: (a) prismatic tourmaline Tur I, (b) fibrous portion Tur II, (c) typical acicular crystals Tur III, and (d) peculiar acicular crystal with foititic composition.
The Raman spectrum of the prismatic tourmaline Tur I (Fig. 10a) is characterized by the 3592 cm−1 peak corresponding to VOH in the 2LiAlAl–AlAlAl configuration, typical of elbaite (Watenphul et al., 2016). The second peak, at 3472 cm−1, is attributed to a 3AlAlAl configuration, suggesting a prevalence of Al at the Y site. This suggestion was confirmed by EPMA data of the prismatic crystal core, which has the Y-site occupancy of Y(Al1.94Li1.06). At 3651 cm−1, the peak due to the vibration of WOH in the LiAlAl–□ configuration is observed, indicating a considerable number of vacancies at the X site. This is in good agreement with chemical analyses that indicated X-site vacancies of up to 0.5 apfu (Figs. 5f and 7).
The Raman spectrum of the fibrous portion Tur II (Fig. 10b) shows features compatible with elbaite/darrellhenryite, but the typical signal of schorl can also be recognized. The main VOH stretching peaks are at 3597 cm−1 (corresponding to the 2LiAlAl–AlAlAl configuration) and 3490 cm−1 (corresponding to LiAlAl–2AlAlAl), near the positions expected for elbaite/darrellhenryite. However, differently to what is observed for the bulk crystal Tur I, an intense intermediate Raman band at 3554 cm−1 appears and has been attributed to the presence of Fe2+ at the Y site in elbaite, which generates the configuration 2Fe2+AlAl–AlAlAl (Watenphul et al., 2016). The WOH peak visible at 3645 cm−1 is attributed to LiAlAl–□ and is accompanied by an additional peak at higher wavenumbers (3668 cm−1) that is compatible with the presence of Fe2+ at the Y site (LiFeAl–□ and Li(Li,Fe)Al–□ configurations). The results of Raman spectroscopy agree with chemical analyses that revealed Fe contents of up to 1.1 apfu (Figs. 5b and 7).
Raman spectra of the colourless acicular single crystals Tur III (Fig. 10c) show features compatible with both elbaite and darrellhenryite. As an exception, only one of the acicular crystals investigated showed a very different spectrum, which is compatible with foitite (Fig. 10d). In the typical Tur III spectra, the wavenumber of the VOH vibration peak at 3483 cm−1, intermediate between the values expected for the LiAlAl–2AlAlAl and the 3AlAlAl configurations, suggests that the amount of Al at the Y site could be lower than that in the prismatic region Tur I, as confirmed by EPMA data (Table 3). The position of the VOH vibration peak at 3600 cm−1, at a wavenumber that is slightly higher than the one shown by the prismatic crystal, can be attributed to the higher amount of Ca ions at the X site, causing a shift towards the higher wavenumbers of the VOH peaks (Watenphul et al., 2016). An intermediate Raman band is visible at 3562 cm−1 (corresponding to the 2Fe2+AlAl–AlAlAl configuration), although with a lower intensity than that at 3554 cm−1 in the fibrous portion Tur II. This band is attributed to the presence of Fe2+ in a lower amount than in the fibrous portion, as confirmed by chemical analyses. Moreover, the WOH peaks at 3649–3670 cm−1 (related to the amounts of Fe2+ at the Y site and the X-site vacancy in the YYY–X configuration) show a lower intensity compared to that observed in the prismatic crystal, and this is due to both the lower number of vacancies at the X site and a very low content (or a substantial absence) of WOH at the O1 site (Table 3).
3.3 Boron isotopic composition of tourmaline
Values obtained on a transect perpendicular to the prismatic portion Tur I of our tourmaline sample are nearly homogeneous and oscillate from −8.33 ‰ to −9.47 ‰ ± 0.58 (2 SD), giving the isotopic signature of the parental melt/fluids during the growth of the prismatic tourmaline crystal (Fig. 11a). An additional transect along both the prismatic and the fibrous portions evidenced marked differences. The three spot analyses collected on the Tur I region gave δ11B values ranging from −8.65 ‰ to −9.11 ‰ ± 0.45, well comparable to each other and to those collected on the transversal transect. Conversely, the two spots acquired on the fibrous portion revealed a large isotopic variation. Namely, in the inner Tur IIa, near the prismatic tourmaline, the recorded δ11B value was −8.83 ± 0.40 ‰, well comparable to that collected on the prismatic portion, whereas in the outer portion Tur IIb, the δ11B value was −11.08 ± 0.17 ‰ (Fig. 11b).
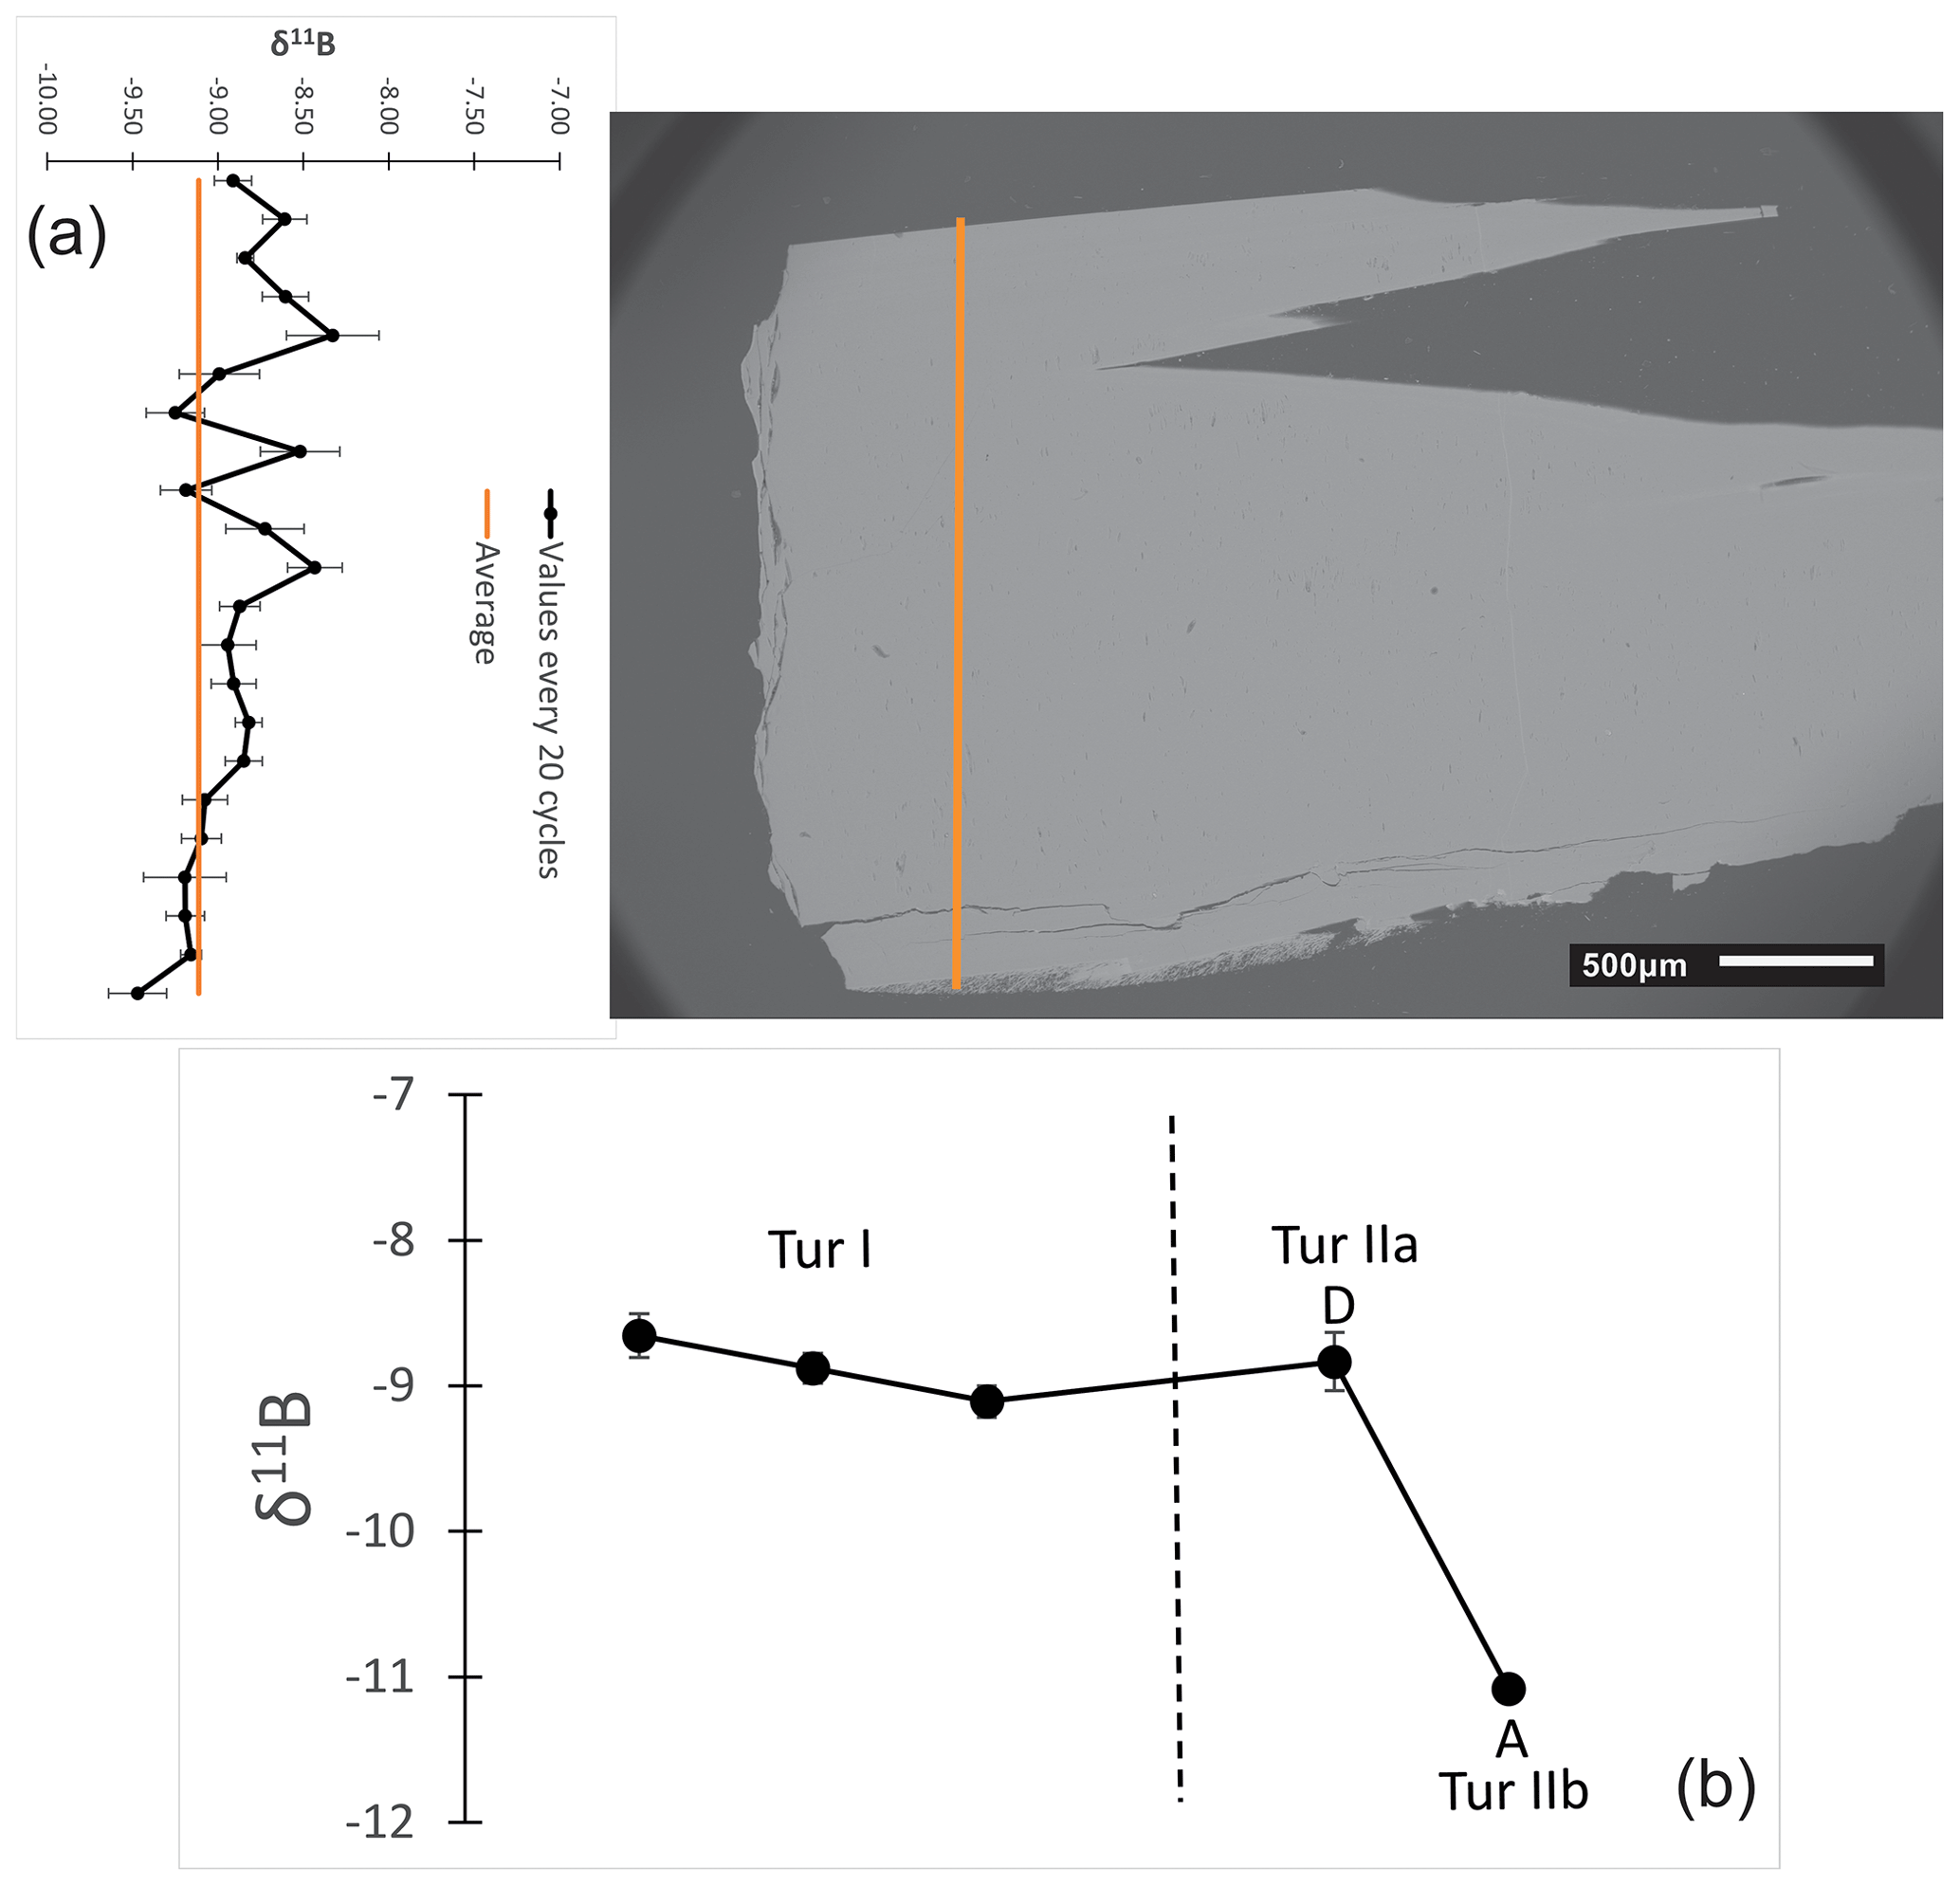
Figure 11Results of δ11B measurements (in ‰) on tourmaline samples of the various generations: (a) δ11B values obtained on a transect perpendicular to the prism. The distance between the spots is approximately 100 µm; (b) δ11B values obtained through spot analyses along the prismatic and fibrous portions, with three spot analyses in the prismatic portion Tur I and two spots in the fibrous portion, near (area D, Tur IIa) and far from (area A, Tur IIb) the prismatic portion. The dashed vertical line marks the prismatic–fibrous transition.
On the island of Elba, the occurrence of fibrous and acicular tourmalines is related to miarolitic cavities in granitic pegmatites and their associated fluid-rich hydrothermal systems (Pezzotta et al., 1996; Aurisicchio et al., 1999). The tourmaline sample studied here is primarily made of a first-generation prismatic core of elbaitic composition (Tur Ia) locally exhibiting, perpendicularly to the c axis, a relatively thin rim, consistent with late Ca-bearing fluor-elbaite (Tur Ib). On top of the prismatic crystal analogous pole, there is a sharp transition to a fibrous portion, made of a tight dark-coloured (Fe,Mg)-bearing darrellhenryite (Tur IIa) that is terminated by a thinner black schorl prone to foitite (Tur IIb). The late acicular single crystals grown on both sides of the prismatic crystal and around the fibrous portion have a complex composition that can be described as a (Ca,F)-rich, (Fe,Mg)-bearing darrellhenryite (Tur III). In addition, the lath-like particles forming the rose-shaped globular terminations of the acicular crystals are likely made of a mixture of layer silicates.
To clarify the formation process of the dark fibrous cap in the tourmaline studied here, previous studies by Bosi et al. (2022) and Altieri et al. (2023a), as well as the genetic model proposed in Altieri et al. (2023b) to account for the dark-coloured overgrowths on multicoloured tourmaline crystals from Elba, are particularly relevant. Notably, some of the samples studied in Altieri et al. (2023a, b) were collected from the Rosina pegmatitic veins – the same pegmatite from which the sample studied here comes. The above-mentioned model is based on contamination of the miarolitic cavity geochemical systems with significant quantities of Fe and occasionally Mn (and a minor occurrence of Mg and Ti) during the latest stages of crystallization within the cavities. Such chemical contamination is locally related to pocket fracturing events due to a rigid mechanical shock, which in turn allowed the highly reactive cavity fluids to permeate the fractures in the enclosing pegmatite. Both fluid circulation and leaching of the (Fe,Mn)-rich primitive accessory minerals (occurring close to the pockets in which the tourmaline crystals were formed) determined a change in the chemical composition of residual fluids within the cavity and then the late crystallization of the dark-coloured overgrowths on top of the existing tourmaline crystals (Bosi et al., 2022; Altieri et al., 2023a, b).
In the present case, the pale green prismatic elbaite Tur Ia represents the pristine tourmaline formed in the miarolitic cavity in equilibrium with the original geochemical system. After cavity fracturing due to a mechanical shock, well documented in the Rosina pegmatite (e.g. Altieri et al., 2023a, b), the subsequent circulation of highly reactive cavity fluids and the leaching of accessory biotite in the surrounding pegmatite may explain the overgrowth of the tight fibrous cap of dark (Fe,Mg)-bearing darrellhenryite (Tur IIa) on top of the prismatic elbaite. This scenario is further supported by the B-isotopic composition of the various portions of the studied tourmaline. All δ11B values obtained from the prismatic elbaite are well comparable among each other and are typical of tourmalines in a closed system with negligible B-isotope fractionation, as previously observed in other Elba pegmatites (Tonarini et al., 1998; Dini et al., 2001). Moreover, the δ11B value exhibited by the inner fibrous portion Tur IIa is well comparable to the values of the prismatic elbaite, suggesting the occurrence of a “near-closed system” characterized by chemical alteration without B-isotope fractionation, which corresponds to the early phase of cavity fracturing, in agreement with the model of Altieri et al. (2023b). The formation of the thinner fibrous cap of black schorl Tur IIb required a rapid crystallization from cavity fluids contaminated by the pronounced leaching of the accessory biotite. The lower δ11B value measured on Tur IIb compared to Tur IIa is due to the temperature effect on B-isotope fractionation and reflects the gradual temperature decrease within the cavity (Tonarini et al., 1998; Dini et al., 2001; Meyer et al., 2008).
After the formation of the black Tur IIb, grown in continuity with dark Tur IIa, the crystallization process conceivably continued in contact with late (Fe,Mg)-poor, (Ca,F)-rich fluids that determined the nucleation and very rapid crystallization of the radial aggregates of colourless acicular tourmaline crystals (Tur III). The late, highly reactive fluids also interacted with the homogeneous prismatic tourmaline, locally modifying its rim composition and forming the (Ca,F)-rich Tur Ib. A reasonable source of Ca and F is represented by the leaching of accessory fluorapatite that commonly occurs in the Rosina pegmatite surrounding the studied cavity. Moreover, the leaching of petalite, locally occurring in the pegmatite as heavily corroded crystals, provided Li, Al, and SiO2 that may have contributed to the crystallization of Tur Ib and Tur III, as well as the final lath-like particles that form the fur-hat-like aggregate.
Chemical, structural, and spectroscopic data are available upon request.
The starting material was collected by FP and characterized by DDG, AFG, VS, LF, DB, TG, and FL. Data processing and integration were performed by DDG and GBA, and discussion and preparation of the paper were carried out by the whole research team.
The contact author has declared that none of the authors has any competing interests.
Publisher’s note: Copernicus Publications remains neutral with regard to jurisdictional claims made in the text, published maps, institutional affiliations, or any other geographical representation in this paper. While Copernicus Publications makes every effort to include appropriate place names, the final responsibility lies with the authors.
This article is part of the special issue “Celebrating the outstanding contribution of Paola Bonazzi to mineralogy”. It is not associated with a conference.
This article is dedicated to the beloved memory of Paola Bonazzi, a brilliant colleague that we will always remember for her integrity and kindness. We thank Jan Cempírek and the anonymous reviewer for their useful comments that prompted a revision of the first version and acknowledge the associate editor Marco Pasero and the chief editor Elisabetta Rampone for their effective handling of the paper.
The research was supported by the Italian MUR through the grants PRIN 2017 – Prot. 20173X8WA4 under the project FIBRES: A Multidisciplinary Mineralogical, Crystal-Chemical and Biological Project to Amend The Paradigm of Toxicity and Cancerogenicity of Mineral Fibres and PRIN 2020 – Prot. 2020WYL4NY under HYDROX – HYDRous – vs. OXo-components in minerals: adding new pieces to the Earth's H2O cycle puzzle. Additional funding was provided by Sapienza University of Rome (Ateneo – Progetti Piccoli e Medi) in 2021 and 2022 awarded to Giovanni B. Andreozzi.
This paper was edited by Marco Pasero and reviewed by Jan Cempírek and one anonymous referee.
Aggarwal, S. K. and You, C. F.: A review on the determination of isotope ratios of boron with mass spectrometry, Mass Spectr. Rev., 36, 499–519, 2017.
Altieri, A., Pezzotta, F., Skogby, H., Hålenius, U., and Bosi, F.: Dark-coloured Mn-rich overgrowths in an elbaitic tourmaline crystal from the Rosina pegmatite, San Piero in Campo, Elba Island, Italy: witness of late-stage opening of the geochemical system, Mineral. Mag., 87, 130–142, 2023a.
Altieri, A., Pezzotta, F., Andreozzi, G. B., Skogby, H., and Bosi, F.: Genetic model for the color anomalies at the termination of pegmatitic gem tourmaline crystals from the island of Elba, Italy, Eur. J. Mineral., 35, 755–771, https://doi.org/10.5194/ejm-35-755-2023, 2023b.
Andreozzi, G. B., Bosi, F., Celata, B., Capizzi, L. S., Stagno, V., and Beckett-Brown, C. E.: Crystal-chemical behavior of Fe2+ in tourmaline dictated by structural stability: insights from a schorl with formula NaY(FeAl)Z(Al5Fe2+)(Si6O18)(BO3)3(OH)3(OH,F) from Seagull batholith (Yukon Territory, Canada), Phys. Chem. Min., 47, 1–9, 2020.
Andreozzi, G. B., Gori, C., Skogby, H., Hålenius, U., Altieri, A., and Bosi, F.: Insights from the compositional evolution of a multi-coloured, zoned tourmaline from the Cruzeiro pegmatite, Minas Gerais, Brazil, Eur. J. Mineral., 37, 1–12, 2025.
Aurisicchio, C., Ottolini, L., and Pezzotta, F.: Electron-and ion-microprobe analyses, and genetic inferences of tourmalines of the foitite-schorl solid solution, Elba Island (Italy), Eur. J. Mineral., 11, 217–226, https://doi.org/10.1127/ejm/11/2/0217, 1999.
Bailey, S. W.: Practical notes concerning the indexing of X-ray powder diffraction patterns of clay minerals, Clay. Clay Miner., 39, 184–190, 1991.
Bosi, F.: Tourmaline crystal chemistry, Am. Mineral., 103, 298–306, 2018.
Bosi, F. and Lucchesi, S.: Crystal chemical relationships in the tourmaline group: structural constraints on chemical variability, Am. Mineral., 92, 1054–1063, 2007.
Bosi, F., Agrosì, G., Lucchesi, S., Melchiorre, G., and Scandale, E.: Mn-tourmaline from island of Elba (Italy): Crystal chemistry, Am. Mineral., 90, 1661–1668, 2005.
Bosi, F., Andreozzi, G. B., Agrosì, G., and Scandale, E.: Fluor-tsilaisite, NaMn3Al6(Si6O18)(BO3)3(OH)3F, a new tourmaline from San Piero in Campo (Elba, Italy) and new data on tsilaisitic tourmaline from the holotype specimen locality, Min. Mag., 79, 89–101, 2015a.
Bosi, F., Andreozzi, G. B., and Skogby, H.: Experimental evidence for partial Fe2+ disorder at the Y and Z sites of tourmaline: a combined EMP, SREF, MS, IR and OAS study of schorl, Min. Mag., 79, 515–528, 2015b.
Bosi, F., Naitza, S., Skogby, H., Secchi, F., Conte, A. M., Cuccuru, S., Hålenius, U., De La Rosa, N., Kristiansson, P., Nilsson, E. J. C., Ros, L., and Andreozzi, G. B.: Late magmatic controls on the origin of schorlitic and foititic tourmalines from late-Variscan peraluminous granites of the Arbus pluton (SW Sardinia, Italy): Crystal-chemical study and petrological constraints, Lithos, 308–309, 395–411, 2018.
Bosi, F., Naitza, S., Secchi, F., Conte, A. M., Cuccuru, S., Andreozzi, G. B., Skogby, H., and Hålenius, U.: Petrogenetic controls on the origin of tourmalinite veins from Mandrolisai igneous massif (Central Sardinia, Italy): Insights from tourmaline crystal chemistry, Lithos, 342, 333–344, 2019.
Bosi, F., Pezzotta, F., Altieri, A., Andreozzi, G. B., Ballirano, P., Tempesta, G., Cempírek, J., Skoda, R., Filip, J., Copiaková, R., Novák, M., Kampf, A. R., Schribner, E. D., Groat, L. A., and Evans, R. J.: Celleriite, □(MnAl)Al6(Si6O18)(BO3)3(OH)3(OH), a new mineral species of the tourmaline supergroup, Am. Mineral., 117, 31–42, 2022.
Calabi-Floody, M., Bendall, J. S., Jara, A. A., Welland, M. E., Theng, B. K., Rumpel, C., and de la Luz Mora, M.: Nanoclays from an Andisol: Extraction, properties and carbon stabilization, Geoderma, 161, 159–167, 2011.
D'Achiardi, G.: Le tormaline del granito elbano, Parte I, Atti della Società toscana di scienze naturali, residente in Pisa, https://www.biodiversitylibrary.org/bibliography/51473 (last access: 5 July 2025), Mem., XIII, 229–322, 1894 (in Italian).
D'Achiardi, G.: Le tormaline del granito elbano, Parte II, Atti della Società toscana di scienze naturali, residente in Pisa. https://www.biodiversitylibrary.org/bibliography/51473 (last access: 5 July 2025), Mem., XV, 3–75, 1897 (in Italian).
Dini, A., Tonarini, S., Leeman, W. P., Ertan, I. E., and Pezzotta, F.: Geochemical behaviour of boron at the magmatic-hydrothermal transition: insights from δ11B of tourmaline in peraluminous granites (Elba Island, Italy), Water-Rock interaction 2001, Proceedings of the 10th International Symposium on Water–Rock Interaction, Cidu (ed.), Swets & Zeitlinger, Lisse, ISBN 90 2651 824 2, 1513–1516, 2001.
Dutrow, B. L. and Henry, D. J.: Complexly zoned fibrous tourmaline, Cruzeiro mine, Minas Gerais, Brazil: A record of evolving magmatic and hydrothermal fluids, Can. Mineral., 38, 131–143, 2000.
Dutrow, B. L. and Henry, D. J.: Fibrous tourmaline: a sensitive probe of fluid compositions and petrologic environments, Can. Mineral., 54, 311–335, 2016.
Federico, M., Andreozzi, G. B., Lucchesi, S., Graziani, G., and Cesar-Mendes, J.: Crystal chemistry of tourmalines, I. Chemistry, compositional variations and coupled substitutions in the pegmatite dikes of the Cruzeiro mine, Minas Gerais, Brazil, Can. Mineral., 36, 415–431, 1998.
Gatta, G., Danisi, R. M., Adamo, I., Meven, M., and Diella, V.: A single-crystal neutron and X-ray diffraction study of elbaite, Phys. Chem. Miner., 39, 577–588, 2012.
Hawthorne, F. C. and Henry, D. J.: Classification of the minerals of the tourmaline group, Eur. J. Mineral., 11, 201–2015, 1999.
Henry, D. J., Novák, M., Hawthorne, F. C., Ertl, A., Dutrow, B. L., Uher, P., and Pezzotta, F.: Nomenclature of the tourmaline-supergroup minerals, Am. Mineral., 96, 895–913, 2011.
Kaufhold, S., Ufer, K., Kaufhold, A. Stucki, J. W., Anastáci, A. S., Jahn, R., and Dohrmann, R.: Quantification of allophane from Ecuador, Clay. Clay Miner., 58, 707–716, 2010.
Larson, A. C. and Von Dreele, R. B.: Generalized Structure Analysis System, Los Alamos National Lab, The Regents of the University of California, New Mexico, LAUR, 86–748, 1994.
Lussier, A. J. and Hawthorne, F. C.: Oscillatory zoned liddicoatite from Anjanabonoina, central Madagascar, II. Compositional variation and mechanisms of substitution, Can. Mineral., 49, 89–104, 2011.
Lussier, A. J., Aguiar, P. M., Michaelis, V. K., Kroeker, S., Herwig, S., Abdu, Y., and Hawthorne, F. C.: Mushroom elbaite from the Kat Chay mine, Momeik, near Mogok, Myanmar, I. Crystal chemistry by SREF, EMPA, MAS NMR and Mössbauer spectroscopy, Mineral. Mag., 72, 747–761, 2008a.
Lussier, A. J., Hawthorne, F. C., Herwig, S., Abdu, Y., Aguiar, P. M., Michaelis, V. K., and Kroeker, S.: Mushroom elbaite from the Kat Chay mine, Momeik, near Mogok, Myanmar, II. Zoning and crystal growth, Mineral. Mag., 72, 999–1010, 2008b.
Meyer, C., Wunder, B., Meixner, A., Romer, R. L., and Heinrich, W.: Boron-isotope fractionation between tourmaline and fluid: an experimental re-investigation, Contrib. Mineral. Petrol., 156, 259–267, 2008.
Paineau, E., Monet, G., Peyre, V., Goldmann, C., Rouzière, S., and Launois, P.: Colloidal Stability of Imogolite Nanotube Dispersions: A Phase Diagram Study, Langmuir, 35, 12451–12459, 2019.
Pesquera, A., Gil-Crespo, P. P., Torres-Ruiz, F., Torres-Ruiz, J., and Roda-Robles, E.: A multiple regression method for estimating Li in tourmaline from electron microprobe analyses, Mineral. Mag., 80, 1129–1133, 2016.
Pezzotta, F.: Internal structures, parageneses and classification of the miarolitic Li-bearing complex pegmatites of Elba Island (Italy), Mem. Soc. It. Sc. Nat. Museo Civ, St. Nat. di Milano, 30, 29–43, 2000.
Pezzotta, F.: A history of tourmaline from the Island of Elba, Mineral. Rec., 52, 669–720, 2021.
Pezzotta, F., Hawthorne, F. C., Cooper, M. A., and Teertstra, D. K.: Fibrous foitite from San Piero in Campo, Elba, Italy, Can. Mineral., 34, 741–744, 1996.
Toby, B. H.: EXPGUI, a graphical user interface for GSAS, J. Appl. Cryst., 34, 210–213, 2001.
Tonarini, S., Dini, A., Pezzotta, F., and Leeman, W. P.: Boron isotopic composition of zoned (schorl-elbaite) tourmalines, Mt. Capanne Li-Cs pegmatites, Elba (Italy), Eur. J. Mineral., 10, 941–952, 1998.
Tonarini, S., Pennisi, M., Adorni-Braccesi, A., Dini, A., Ferrara, G., Gonfiantini, R., Wiedenbeck, M., and Gröning, M.: Intercomparison of Boron Isotope and Concentration Measurements, Part I: Selection, Preparation and Homogeneity Tests of the Intercomparison Materials, Geostandard. Newslett., 27, 21–39, 2003.
Tonarini, S., Pennisi, M., and Gonfiantini, R.: Boron isotope determinations in waters and other geological materials: Analytical techniques and inter-calibration of measurements, Isotopes in Env. Health Stud., 45, 169–183, 2009.
von Goerne, G.: Synthesis of tourmaline solid solutions in the system Na2O-MgO-Al2O3-SiO2-B2O3-H2O-HCl and the distribution of Na between tourmaline and fluid at 300 to 700° and 200 MPa, Contrib. Mineral. Petrol., 141, 160–173, 2001.
Watenphul, A., Burgdorf, M., Schlüter, J., Horn, I., Malcherek, T., Mihailova, B.: Exploring the potential of Raman spectroscopy for crystallochemical analyses of complex hydrous silicates: II. Tourmalines, Am. Mineral., 101, 970–985, 2016.