the Creative Commons Attribution 4.0 License.
the Creative Commons Attribution 4.0 License.
 | 14 Apr 2025
Compressibility of single-crystal zircon up to 19 GPa: implications for the partitioning coefficient of trace elements
Ryosuke Sinmyo
Hikaru Higuchi
Tomoko Ikeda-Fukazawa
Saori Kawaguchi-Imada
Zircon is a widely studied accessory mineral that helps us understand the evolution of the Earth. The unique nature of zircon is due to its chemical and physical strength and the characteristic crystallographic zirconium site, which is compatible with rare Earth elements and actinoids. According to the lattice strain model, trace element partitioning coefficients can be predicted by zircon's compressibility of the cation site. However, the crystal structure of zircon has been precisely determined at less than 5 GPa by single-crystal X-ray diffraction measurements. Here, we have precisely determined the crystal structure of zircon under high-pressure conditions of up to 19 GPa, covering the whole stability field of zircon using a diamond anvil cell. We have also theoretically calculated the unit cell parameters of zircon at high pressure by molecular dynamics simulations. The unit cell parameters and the bond length showed abnormal trends above the high-pressure stability limit of zircon. The previous discrepancy in the compressibility is likely due to the non-hydrostatic condition and instability of the sample. We determined the compressibility of the Zr–O bond and ZrO8 polyhedra based on the determined crystal structure. The averaged length of the Zr–O bond showed a consistent modulus, with the partitioning coefficients predicted by the lattice strain model. On the contrary, the model with a Poisson solid assumption is inconsistent with the partitioning coefficients. The averaged lengths of the cation–anion bonds under high pressure can help in understanding the partitioning coefficient between minerals and melt.
- Article
(2791 KB) - Full-text XML
-
Supplement
(1063 KB) - BibTeX
- EndNote


ZrSiO4, zircon, is the most important accessory mineral for understanding the ancient history of the Earth and planets since it possesses essential information on the genesis of rocks older than billions of years. Indeed, the oldest fragments on the Earth found so far are dated to 4.3–4.4 Ga by U–Pb decay geochronology using detrital zircon that likely formed in the ancient magma chamber (Froude et al., 1983; Wilde et al., 2001). Moreover, zircon can be used to measure the oxygen fugacity of ancient Earth by means of oxybarometry using Ce and Eu anomalies in the rare Earth element (REE) pattern as old as the Hadean (Burnham and Berry, 2012; Yang et al., 2014). In addition to characterizing igneous rocks, zircon can host radioactive elements such as U and Th, which are major heat sources of the Earth. Since zircon can preserve actinoids for a geological timescale, it is also known to be a promising host material for nuclear waste storage (Ewing, 1999). Indeed, zircon containing > 10 wt % of U was found in the reactant of nuclear fuel and zirconium cladding, likely formed during the accident at the Chornobyl nuclear power plant in 1986 (Anderson et al., 1993; Geisler et al., 2005). On the other hand, the stability of the zircon is used to estimate the shock history of meteorites based on the high-pressure and high-temperature phase transition in ZrSiO4 (Reid and Ringwood, 1969; Timms et al., 2017). In the field of high-pressure experiments, zircon crystal is often used as a pressure calibrant in hydro-thermal diamond anvil cells thanks to its chemical and mechanical strength (Schmidt et al., 2013).
The unique crystal chemistry of the zircon is due to the characteristic valence state and crystallographic site of the zirconium (Zr) in the zircon crystal. The eight-fold ZrO8 distorted dodecahedral sites are composed of four shorter Zr–O bonds (2.13 Å at 1 atm) and four longer Zr′–O bonds (2.27 Å at 1 atm), and the polyhedra are share edges with each other. The compressibility of the zircon has been determined by pioneering single-crystal X-ray diffraction (XRD) studies up to 4.8 GPa using a diamond anvil cell (Hazen and Finger, 1979). Although the most recent study reported unit cell parameters of zircon by single-crystal XRD up to 8.5 GPa, the fine structures, such as atomic coordinates, were not fully determined (Ehlers et al., 2022). While the compressibility of zircon has previously been determined by powder XRD data under pressure lower than 27 GPa (Marqués et al., 2006; Ono et al., 2004a; Van Westrenen et al., 2004) and by theoretical data based on ab initio calculations up to 30 GPa (Stangarone et al., 2019), the compressibility results are not consistent with each other. In general, the single-crystal XRD measurements can resolve the crystal structure on a finer scale than the powder XRD measurements can, even at high pressure (Boffa Ballaran et al., 2013).
Previous experimental studies have shown that zircon undergoes a phase transition to a high-pressure polymorph with CaWO4-type (scheelite) structure above 10–15 GPa and 1000–2000 K (Ono et al., 2004b; Reid and Ringwood, 1969). The high-pressure polymorph of zircon was found in the Eocene impact ejecta layer of an ocean drilling sample and named reidite (Glass and Liu, 2001). Reidite is believed to be decomposed into ZrO2 and SiO2 at pressure higher than 20.5 GPa and temperature higher than 1773 K (Tange and Takahashi, 2004). A diamond anvil cell study showed that zircon transformed into reidite at 23 GPa by cold compression (Knittle and Williams, 1993). Single-crystal XRD study has so far been limited to half of the stable pressure condition of zircon (Hazen and Finger, 1979).
To reconstruct the rock-forming process, laboratory experiments have determined the partitioning coefficient of trace elements between zircon and melt at 1 atm (Burnham and Berry, 2012) and in high-pressure experiments up to 2 GPa–1573 K (Luo and Ayers, 2009; Rubatto and Hermann, 2007; Taylor et al., 2015). Although the partitioning coefficient might be altered if the zircon is formed under a high-pressure condition, partitioning experiments of the trace elements have never been determined above 2 GPa because of technical difficulty. It has been argued that the effect of pressure on the REE pattern is not clear in zircon (Rubatto and Hermann, 2007), while a moderate effect is reported in amphibole and clinopyroxene (Adam and Green, 2003). The ambiguous effect of pressure is partly because of the laboratory experiments' relatively short timescale, which may cause disequilibrium partitioning coefficients (Luo and Ayers, 2009). A crystallographic approach, such as using the lattice strain model, may provide alternative information on the partitioning coefficient of trace elements.
Here, we have determined the crystal structure of zircon up to 19 GPa, covering the whole stability field of zircon by single-crystal X-ray diffraction (XRD) and a diamond anvil cell. We found that the compressibility of the averaged bond length can help in understanding the partitioning coefficients of trace elements between zircon and melt.
We used gem-quality zircon (annealed at 900 °C for 16 h) from Sri Lanka. The zircon sample was crushed under pestle and mortar, and three grains of zircon were randomly picked and polished for chemical analysis. The chemical composition of the zircon was determined by wavelength-dispersive X-ray spectroscopy (WDX) analysis using a field-emission-type electron microprobe analyzer (JEOL, JXA-8500F) and analyzer crystals of LIFH, PETH, TAPH, LDE1, and LDE6H. Compositional images were taken to check the chemical homogeneity. Qualitative WDX analysis was conducted at 15 kV and 100 nA with an electron beam of 10 µm in diameter. The analysis covered a wide wavelength of 1.2–102 Å. The elements with detectable amounts were selected for further quantitative WDX analysis, which was conducted at 15 kV and 50 nA with an electron beam of 10 µm in diameter.
The zircon crystal was further crushed under pestle and mortar, and a crystal was carefully picked using a polarization optical microscope so that the sample solely contained a single domain. We conducted single-crystal XRD measurements of the samples of about µm3. Two independent high-pressure experiments were conducted using a Boehler-Almax-type diamond anvil cell with a wide opening angle. The cell is capable of X-ray diffraction measurements under high-pressure conditions. The culets of the diamond anvils were 300 µm in diameter. The samples were put into a 100 µm diameter hole made in the rhenium gasket. The opening angle of the diamond anvil cell was ± 35°. We used a methanol : ethanol (4:1) pressure medium for runs 1 and 2 and a nitrogen pressure medium for run 3, which preserves hydrostatic conditions in the diamond anvil cell up to slightly above 10 GPa (Chen et al., 2021; Klotz et al., 2009).
We used micro-focused X-ray diffractometers (D8 VENTURE, Bruker) at Meiji University with a target of Mo, set to 50 kV and 1.4 mA for single-crystal XRD measurements (Maitani et al., 2024). The software package APEX4 (Bruker) was used for data processing after the measurement, and SHELXL was used for crystal structure refinement (Sheldrick, 2008). After refinement, we calculated the volume, distortion index, and effective coordination number of ZrO8 polyhedra by VESTA software (Baur, 1974; Momma and Izumi, 2011).
The pressure was determined by ruby fluorescence and Raman spectroscopy measurements of the zircon (Mao et al., 1986; Schmidt et al., 2013). We used a confocal laser Raman spectrometer system (NRS-4500, JASCO) composed of a red-enhanced CCD detector (DR324B, Andor) and Czerny–Turner-type spectrometer (f=200 mm) with 1800 G mm−1 grating for the optical measurements. High spatial resolution along the laser axis was achieved (∼ 1.5 µm) by the confocal microscope system used in the NRS-4500. The laser was a TEM00 single-mode 532 nm laser with an output of 50 mW. The exposure time was less than 1 s for the ruby fluorescence and 30–180 s for the zircon. The laser spot was focused on the sample surface to about 1 µm in diameter. The Si and polypropylene standards were used for the calibration before and after experiments. Moreover, we measured zircon and ruby in 1 atm conditions after the pressure determination to double-check the calibration.
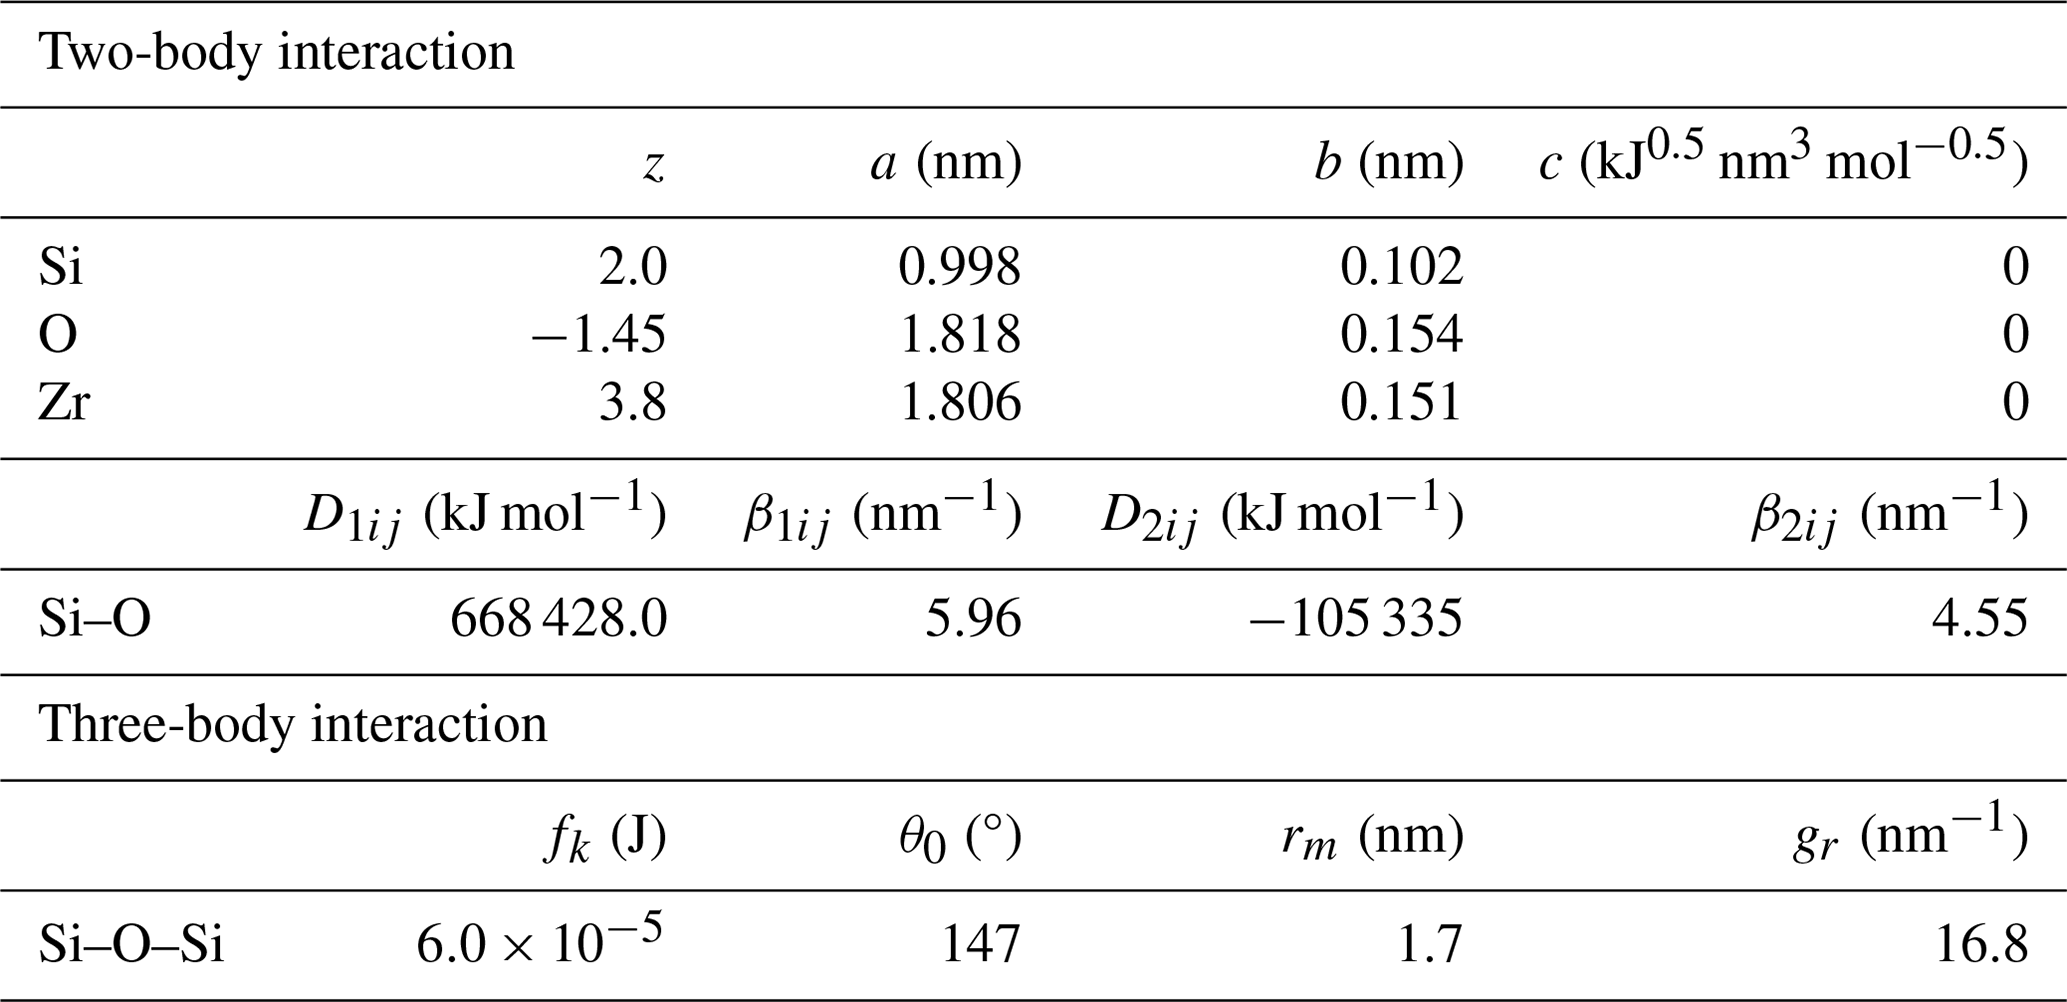
We have theoretically calculated the crystal structure of the zircon at high pressure by molecular dynamics (MD) simulation using MXDORTO (Kawamura, 1996). The interatomic potential models employed in the program offer good explanations about and knowledge of the target material (Kumagai et al., 1994). The velocity Verlet algorithm (Verlet, 1967) and Ewald method (Ewald, 1921) were used to calculate the atomic motions and electrostatic interactions, respectively. For the MD calculations, a fundamental tetragonal cell of zircon in the crystalline state consisting of 375 ZrSiO4 molecules was used as the initial structure. To equilibrate the fundamental cell, the MD code was run using an NTP (constant temperature and pressure) ensemble at 10 K. All MD calculations were performed with a time step of 0.5 fs.
The calculations were performed using an interatomic potential model (Ikeda-Fukazawa, 2016). The model has two-body interactions for Si–O and a three-body force for the Si–O–Si and system. The two-body interactions consist of Coulomb forces, short-range repulsion, and covalent bonds. The interatomic potential energy of the two-body interaction between atoms i and j, uij, is given by
where rij is the distance between atoms i and j; ε0 is the vacuum permittivity; e is the elementary charge; zi, ai, and bi are the partial charge, repulsion diameter, and softness coefficient of atom i, respectively; and f0 is a constant for the unit adaptation between these terms (41.865 kJ nm−1 mol−1). D1ij, β1ij, D2ij, and β2ij are parameters for adjusting the radial covalent bonds.
The potential energy of the three-body part, ujij, is given by
where
θjij is the angle between atoms i and j, and θ0, fk, rm, and gr are parameters for adjusting the angular part of the covalent bond. The potential parameters were determined by constraining the model to reproduce the experimental results of density, unit cell parameters, and compressibility for zircon. Although the parameters were previously proposed by several studies using different potential models (Devanathan et al., 2004; Du et al., 2006), no reported parameter reproduces the unit cell volume and unit cell parameters at high pressure simultaneously. Therefore, we constructed the parameters based on the compression data by single-crystal XRD measurements, referring to the potential model from a previous study (Kubo et al., 2020). We have determined the Zr–O bond length by fitting the pair correlation functions of the equilibrium state.
The electron microprobe analysis showed that the zircon was almost pure ZrSiO4. The chemical composition of the zircon was determined to be Zr = 49.0(2) wt %, Si = 15.9(1) wt %, and O = 32.0(1) wt % by quantitative analysis using WDX. The trace amount of Hf was detected to be 0.7 wt %. The total concentration is slightly less than 100 %, likely because of the surface conditions of the sample. No elements other than Zr, Si, O, or Hf were detected by qualitative WDX analysis conducted across a wide wavelength. The compositional images showed excellent chemical homogeneity of the sample.
We compare the pressure values determined by zircon and the ruby calibrant in run 1. The pressure values were closely consistent with each other under lower-pressure conditions at < 8 GPa (Table 1), as proposed by a previous study (Schmidt et al., 2013). Above the applicable pressure of the zircon calibrant (> 10 GPa), the intensities of the peaks of zircon in the Raman spectra were weak, and the calculated pressure was significantly lower than that of the ruby calibrant (Table 1). Therefore, we preferentially used the ruby scale as a measure for pressure. The pressure values higher than 8 GPa according to the zircon scale (two data points in run 2) are not used for any further analysis because of their lower reliability.
Table 1Unit cell parameters of zircon at high pressure.
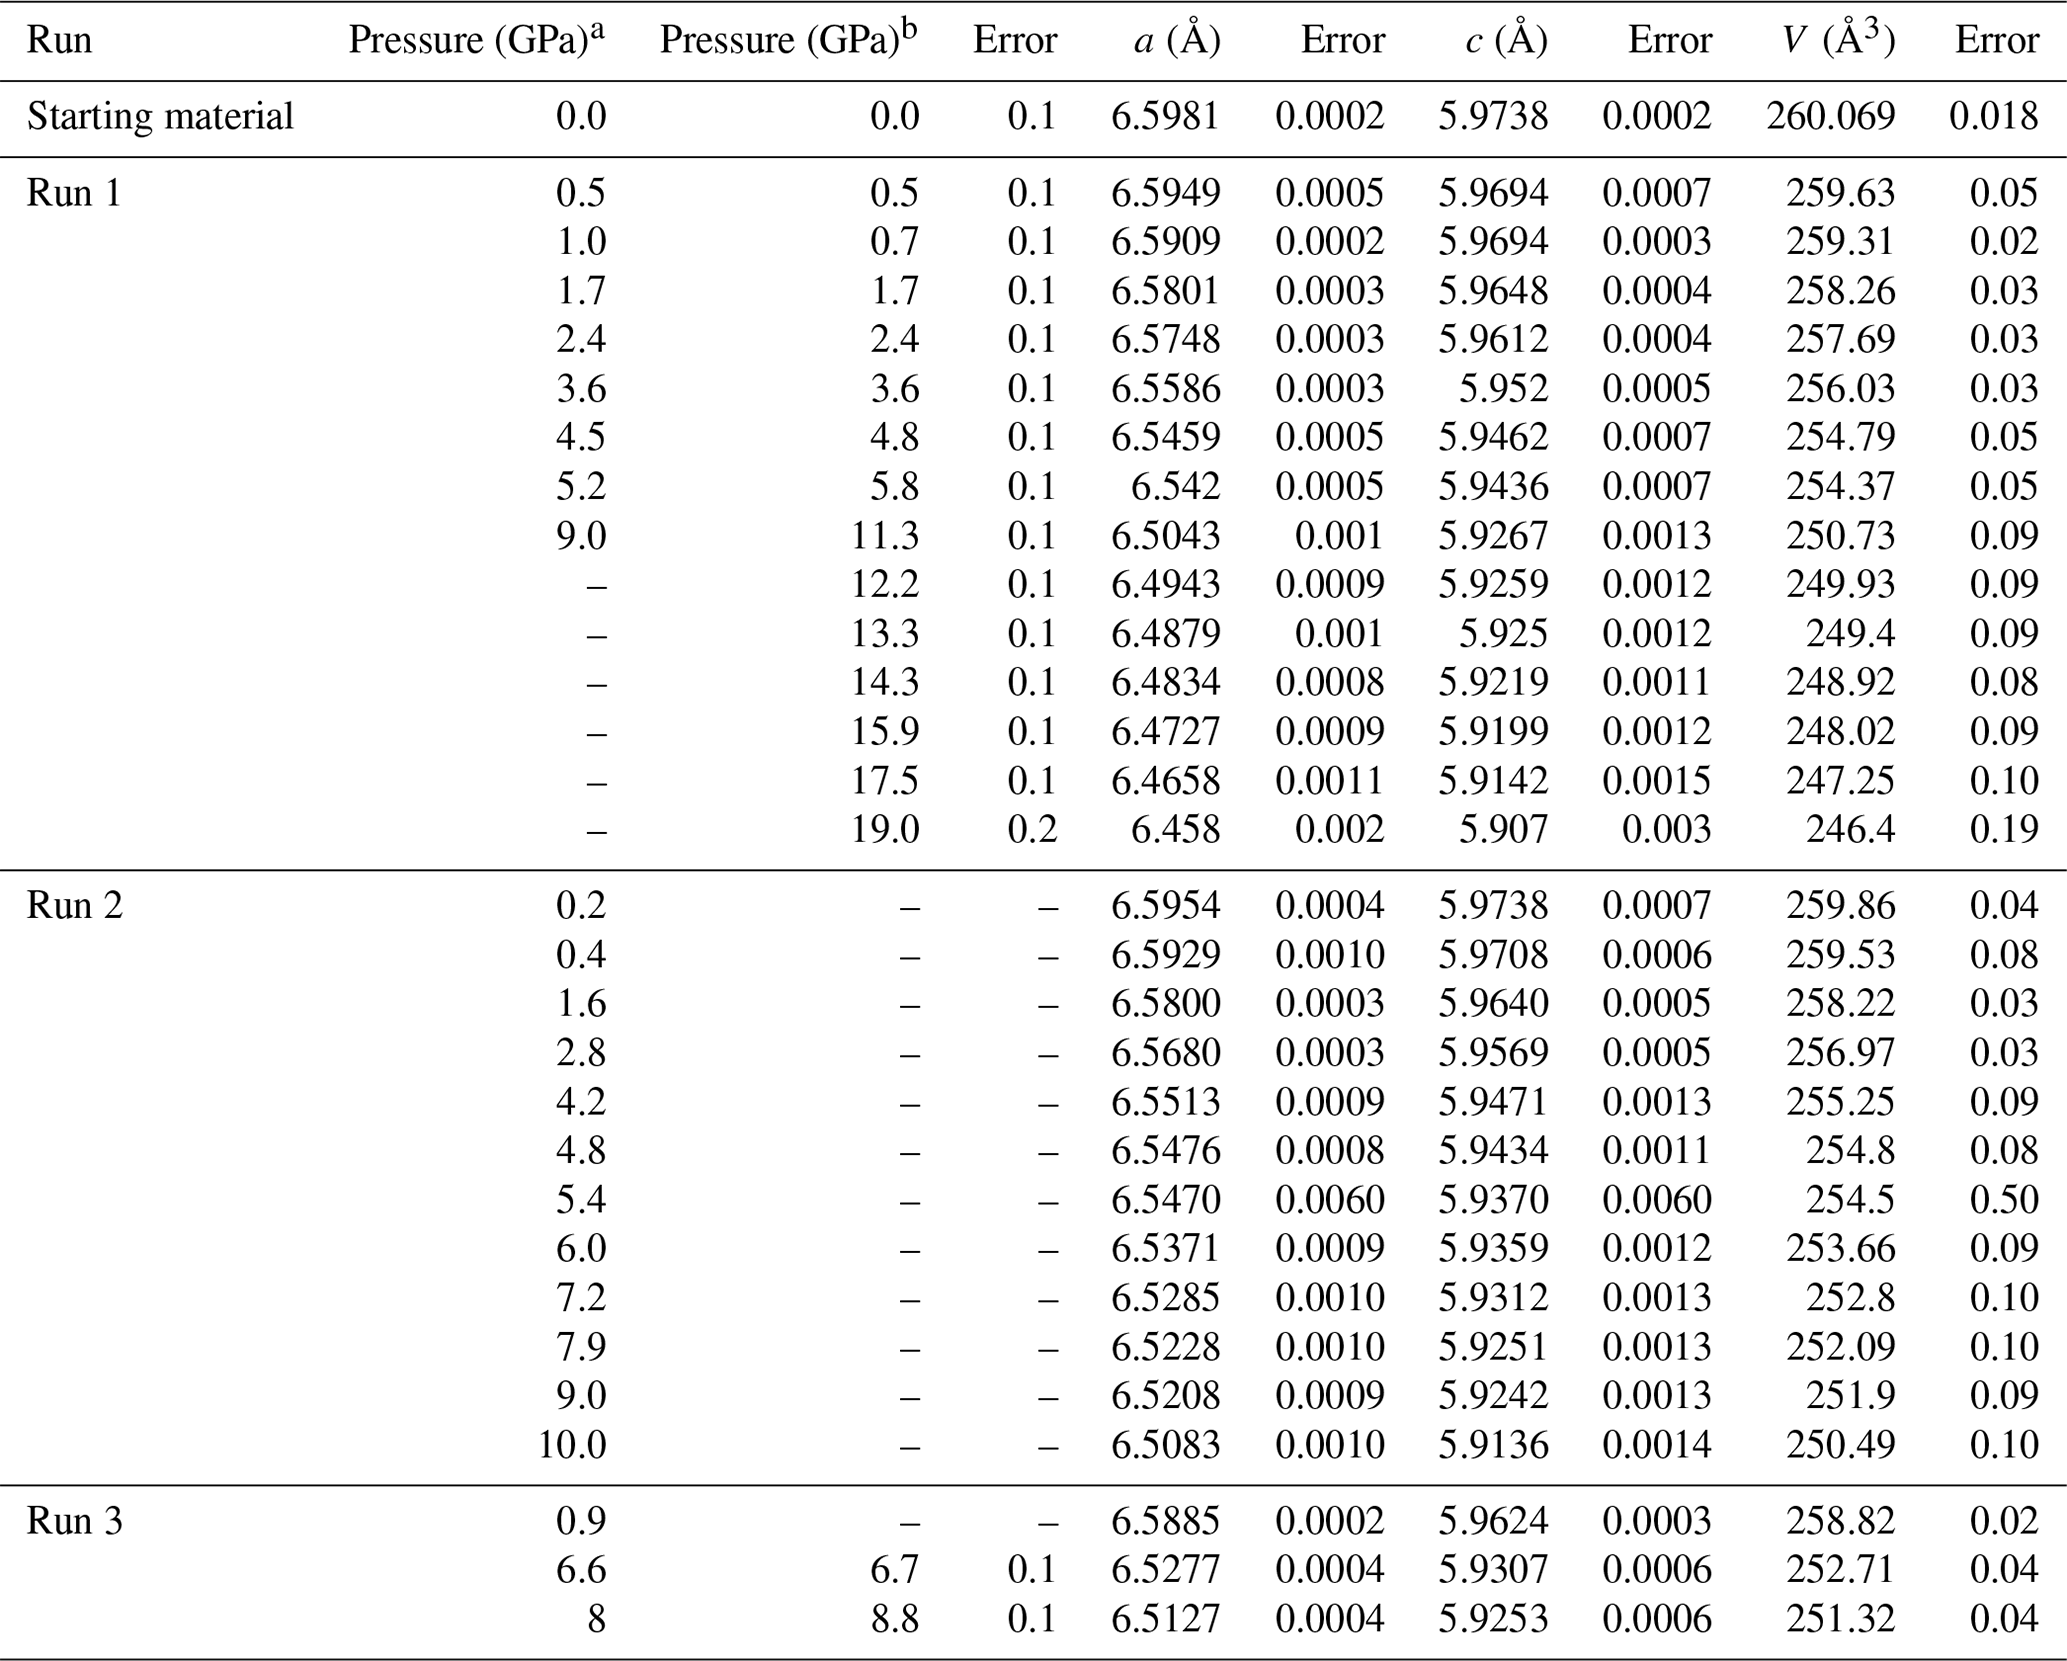
a Pressure determined by Raman spectra of zircon. b Pressure determined by ruby fluorescence.
We have determined the crystal structure of the zircon at high pressure up to 19 GPa by single-crystal XRD using a diamond anvil cell. The obtained number of reflections was typically around 600, covering 6–25°, with a range of −4 < h < 4, −7 < k < 7, and −6 < l < 6. We obtained crystal structure with a tetragonal crystal system and space group I41/amd in all measurements, despite not using any crystal structure known a priori during the analysis. The R values were typically less than ∼ 0.05 in any conditions. The obtained unit cell parameters are summarized in Figs. 1, 2, and 3 and Table 1. The Zr–O bond lengths and ZrO8 polyhedra are shown in Figs. 4 and 5 and Table 2. The unit cell volume (V=260.069(18) Å) at 1 atm was slightly smaller than that reported in previous single-crystal XRD studies: V=260.803 Å (Hazen and Finger, 1979) and V=261.088 Å (Ehlers et al., 2022). This may be due to metamictization by radiational damage, which induces the expansion of the unit cell volume (Woodhead et al., 1991). To clear the metamictization, we annealed the zircon before the experiments. Our unit cell volume is close to that with minimum damage (Woodhead et al., 1991). Regardless of the metamictization, the compressional behavior of the unit cell parameters, bond length, and ZrO8 polyhedra is in excellent agreement with the results of previous studies using single-crystal XRD (Hazen and Finger, 1979) and later powder XRD (Marqués et al., 2006) (Figs. 3–5). The unit cell parameters agree well with those of a recent study (Ehlers et al., 2022). In contrast, the results of earlier powder XRD measurements are significantly different from our data (Ono et al., 2004a; Van Westrenen et al., 2004) (Fig. 3).
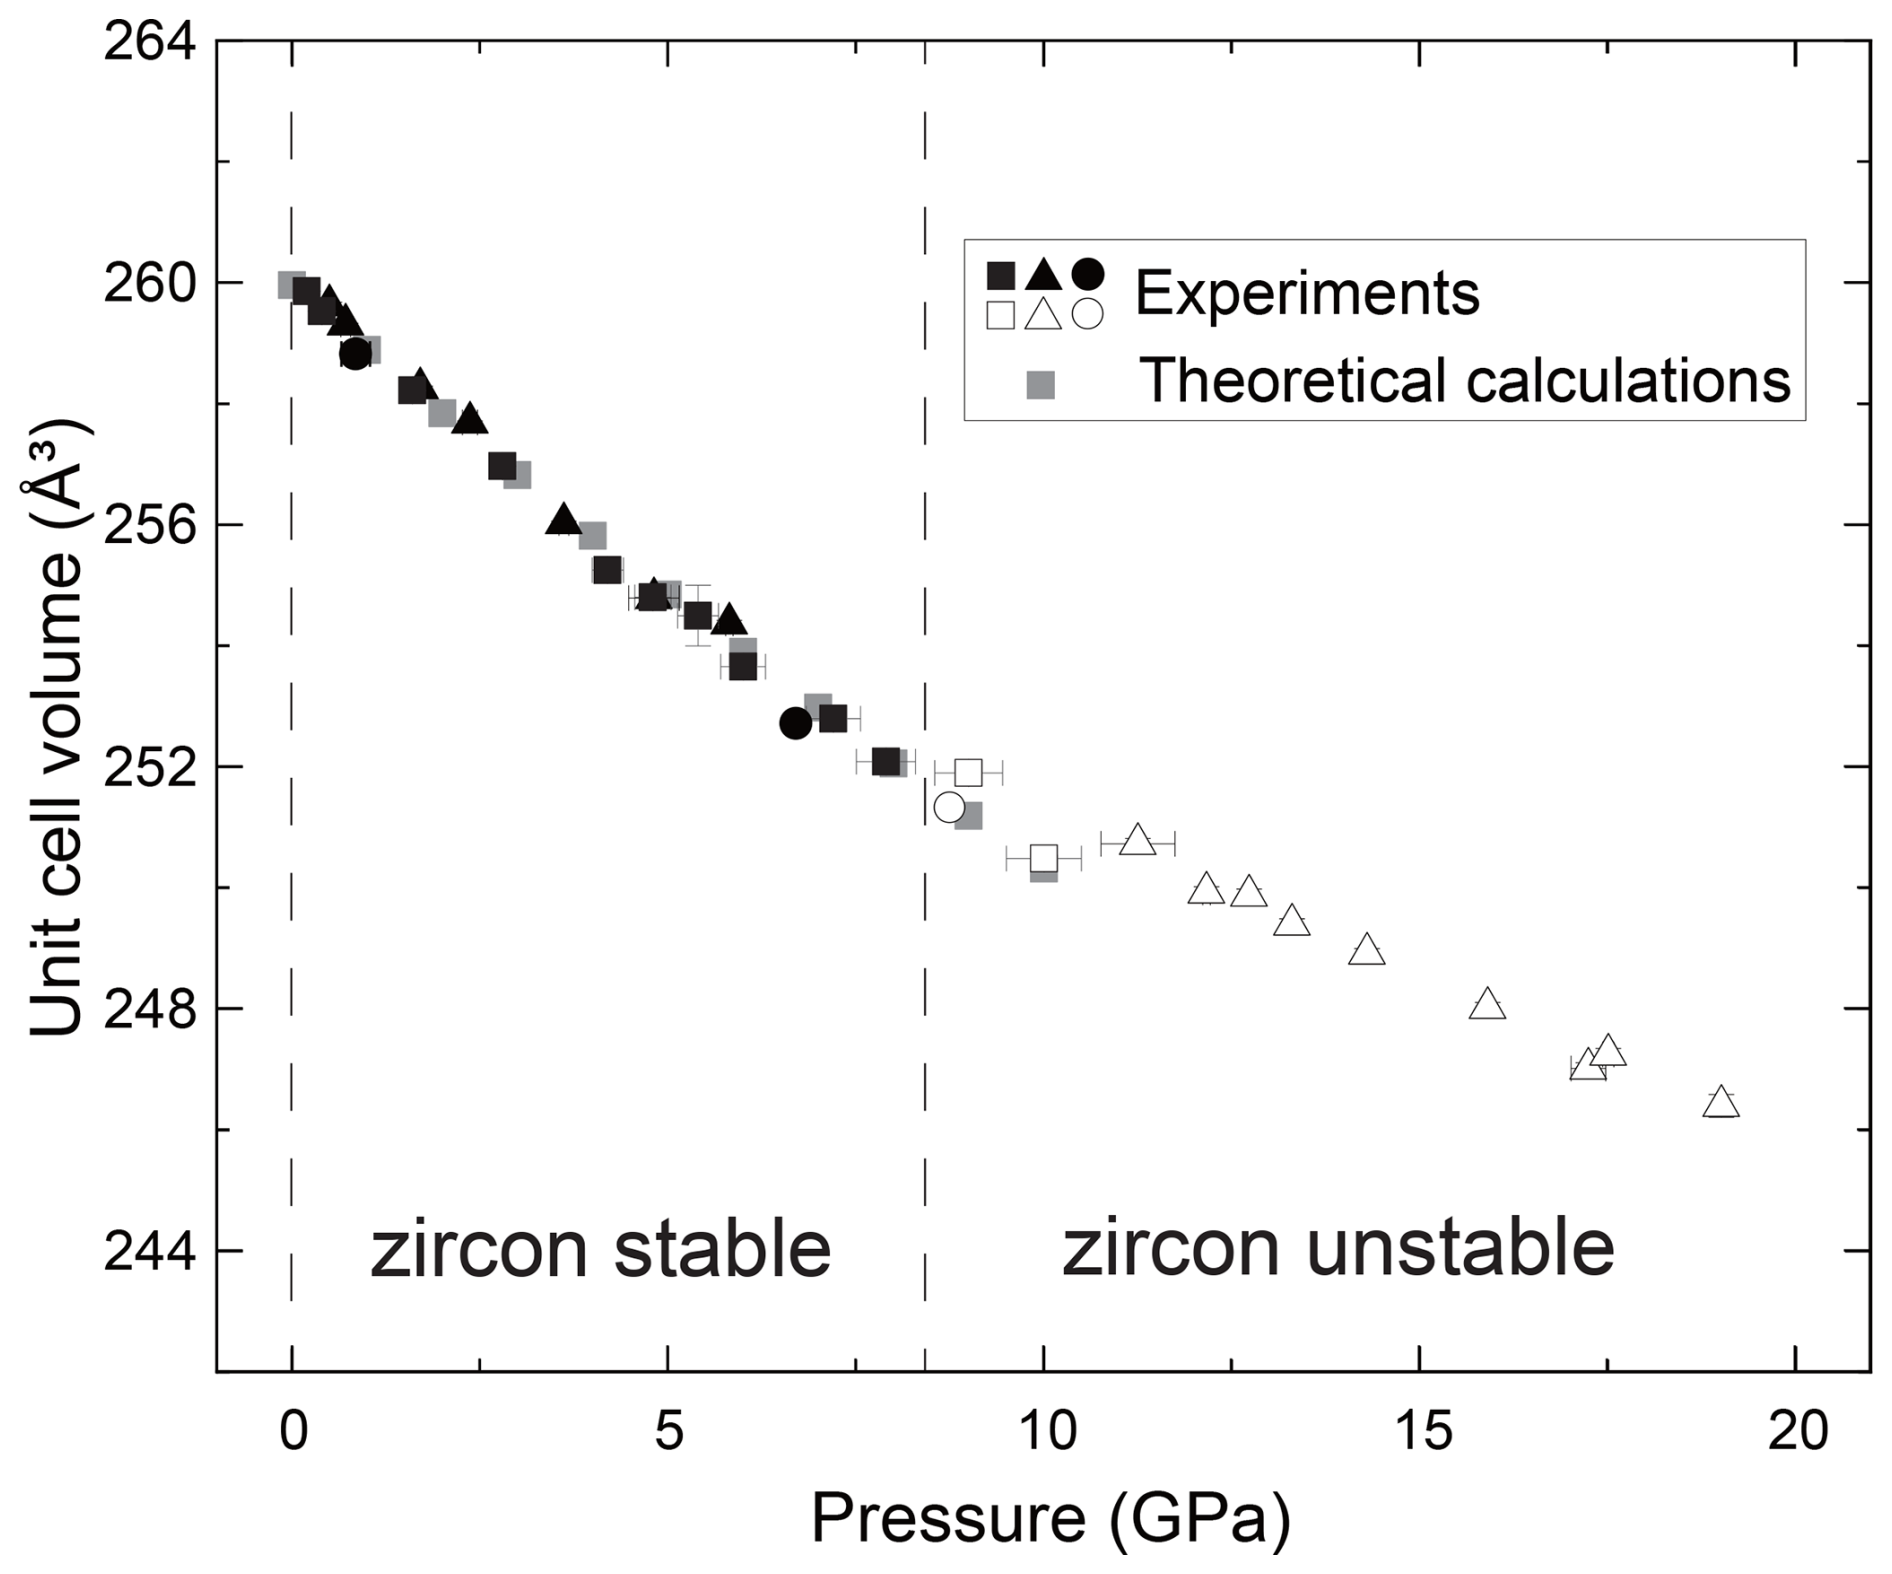
Figure 1The relationships between the pressure and unit cell volume of zircon. Filled black symbols show the data that are likely taken in the zircon stability field, and open symbols show those in metastable pressure conditions. Gray symbols represent the data calculated by MD simulations. Triangles are run 1, squares are run 2, and circles are run 3 in this study.
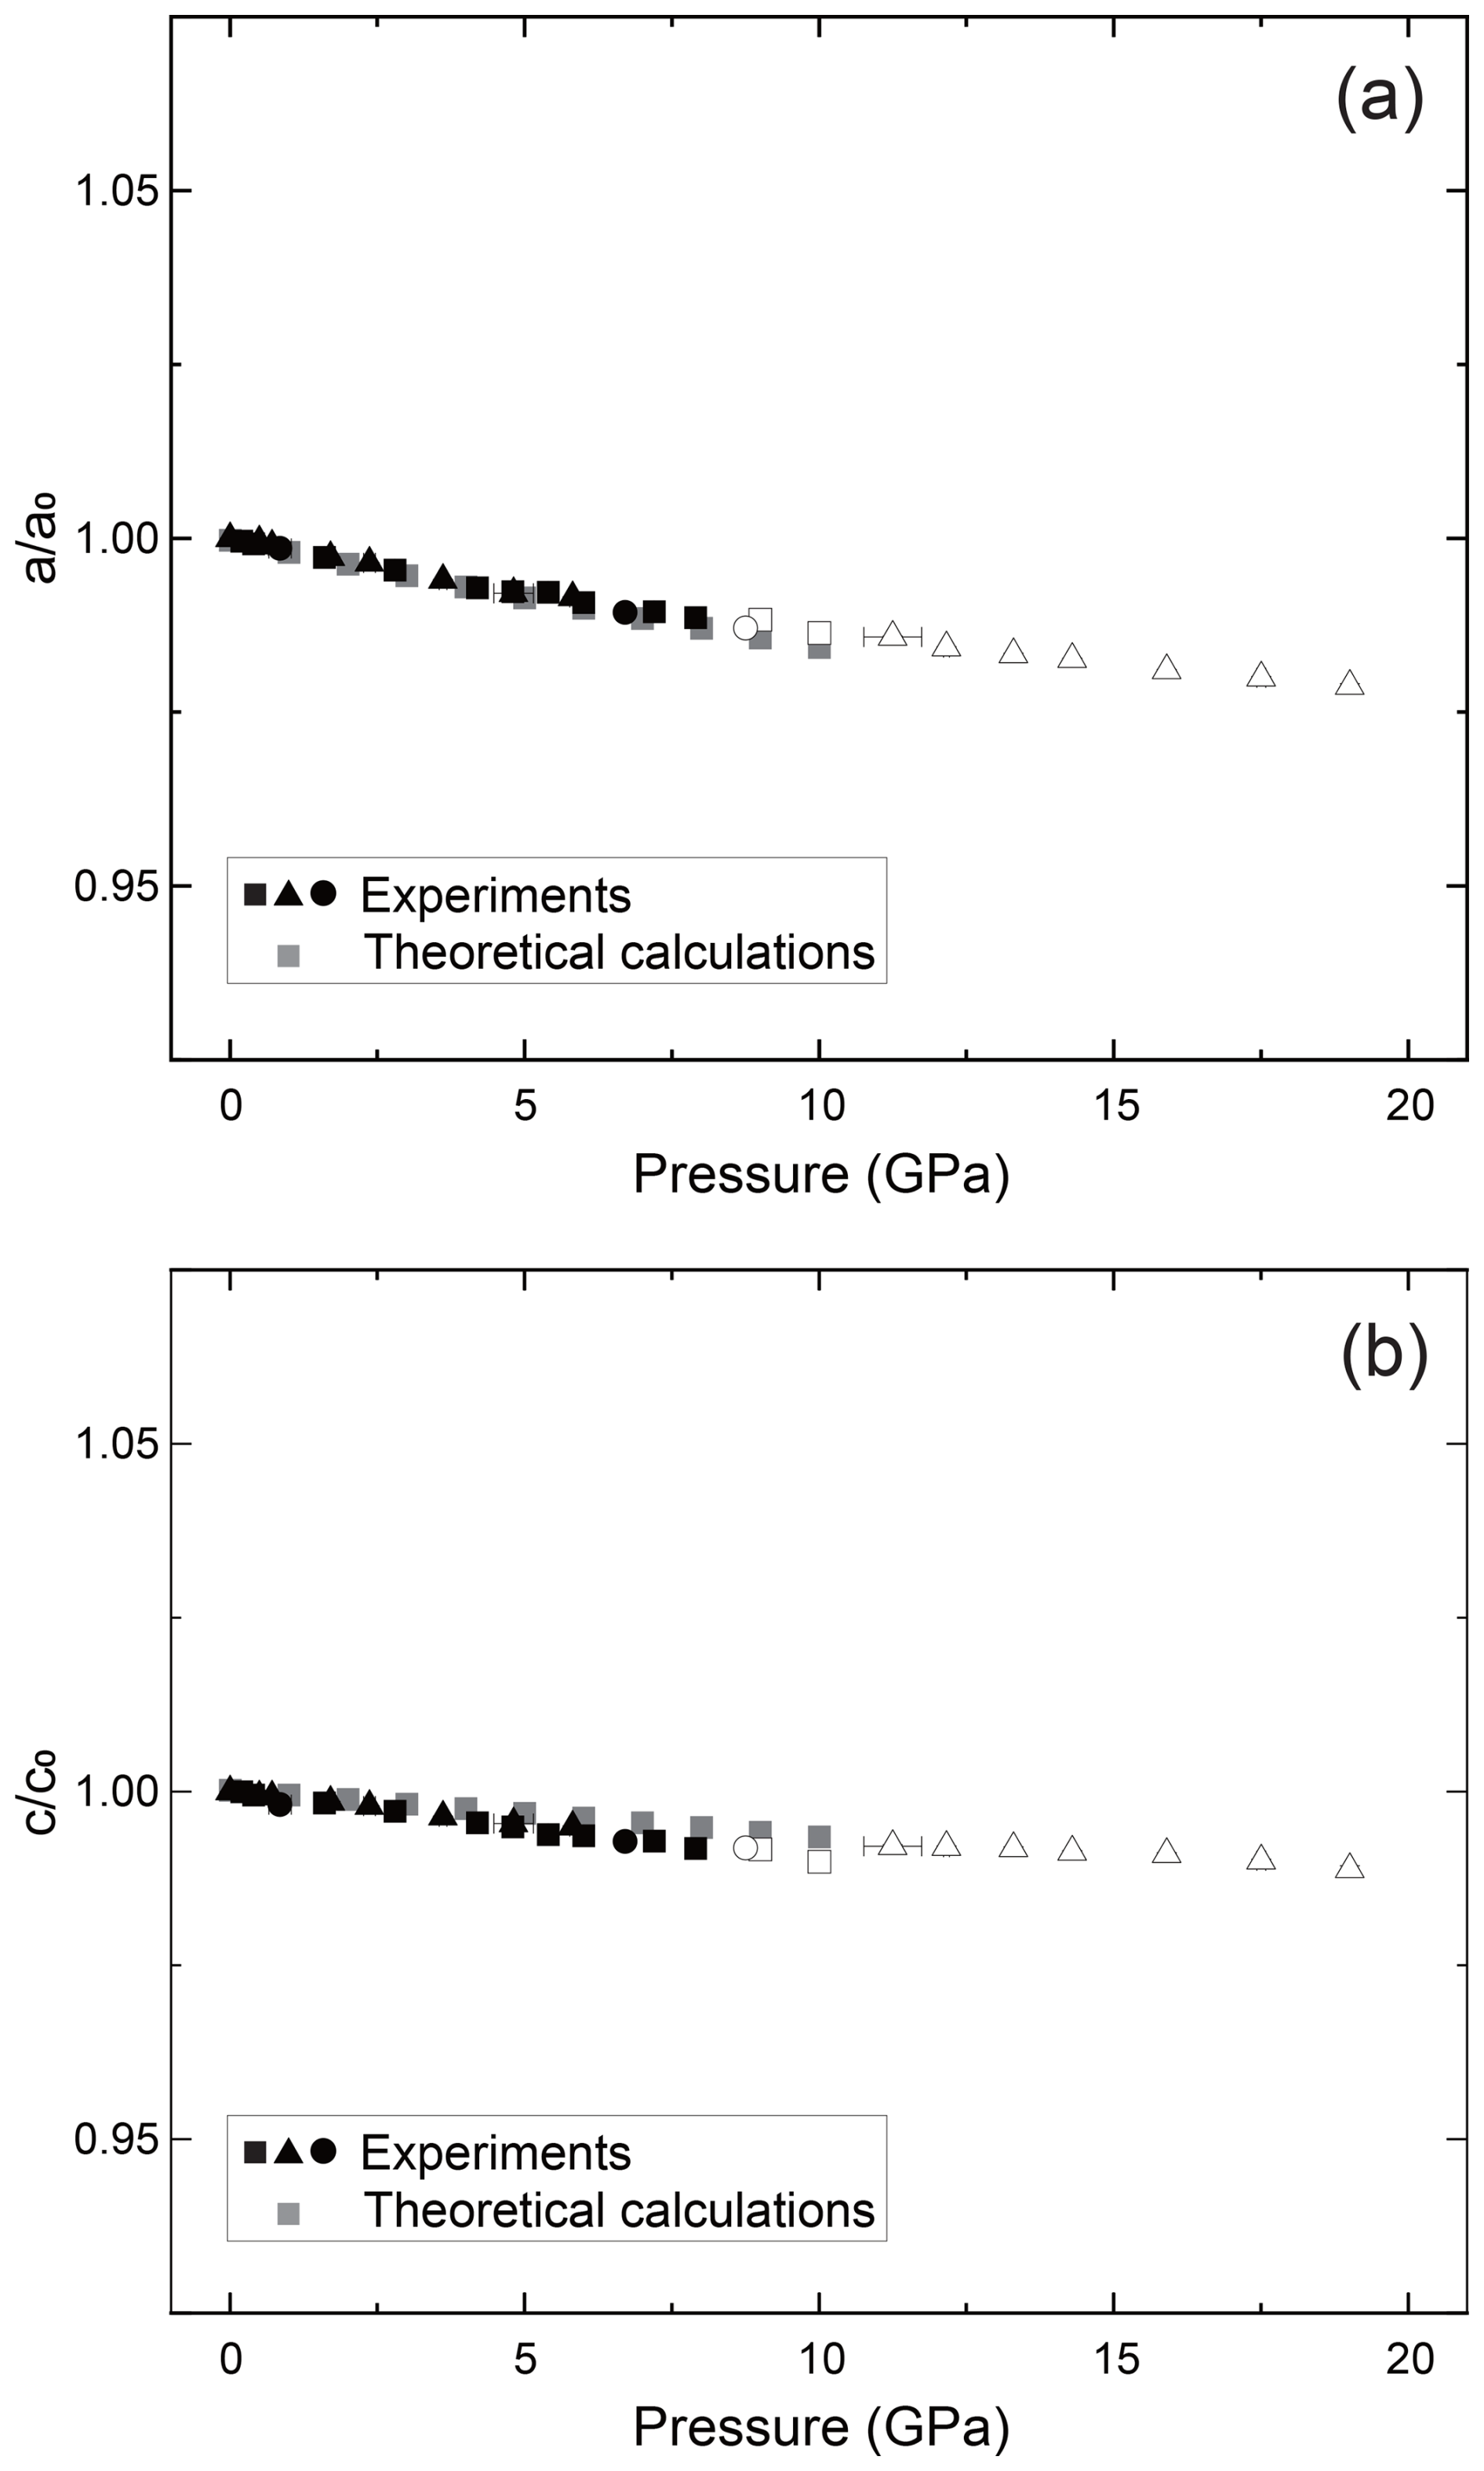
Figure 2The relationships between pressure and unit cell parameter for the (a) a axis and (b) c axis of zircon. The vertical axis is normalized using the values in ambient conditions. Filled black symbols show the data that are likely taken in the zircon stability field, and open symbols show those in metastable pressure conditions. Gray symbols represent the data calculated by MD simulations. Triangles are run 1, squares are run 2, and circles are run 3 in this study.
We have fitted the obtained unit cell volume to the Birch–Murnaghan equation of state with a fixed value of . When we used all data up to 19 GPa, the unit cell parameters showed clear deviation below and above around 8 GPa (Figs. 1, 2, and 3). If we fitted K′ as a free parameter, we obtained an abnormally high K′ value, reaching 30. This may be because the experimental pressure exceeds the high-pressure stability limit of the zircon (Ono et al., 2004b; Tange and Takahashi, 2004). Therefore, we have fitted the obtained unit cell volume to the Birch–Murnaghan equation of state using data below 8 GPa (Fig. 3). The bulk modulus K was 234.80(4) GPa with a fixed value of , which agrees well with the 227(2) GPa reported by previous experiments up to 4.8 GPa (Hazen and Finger, 1979).
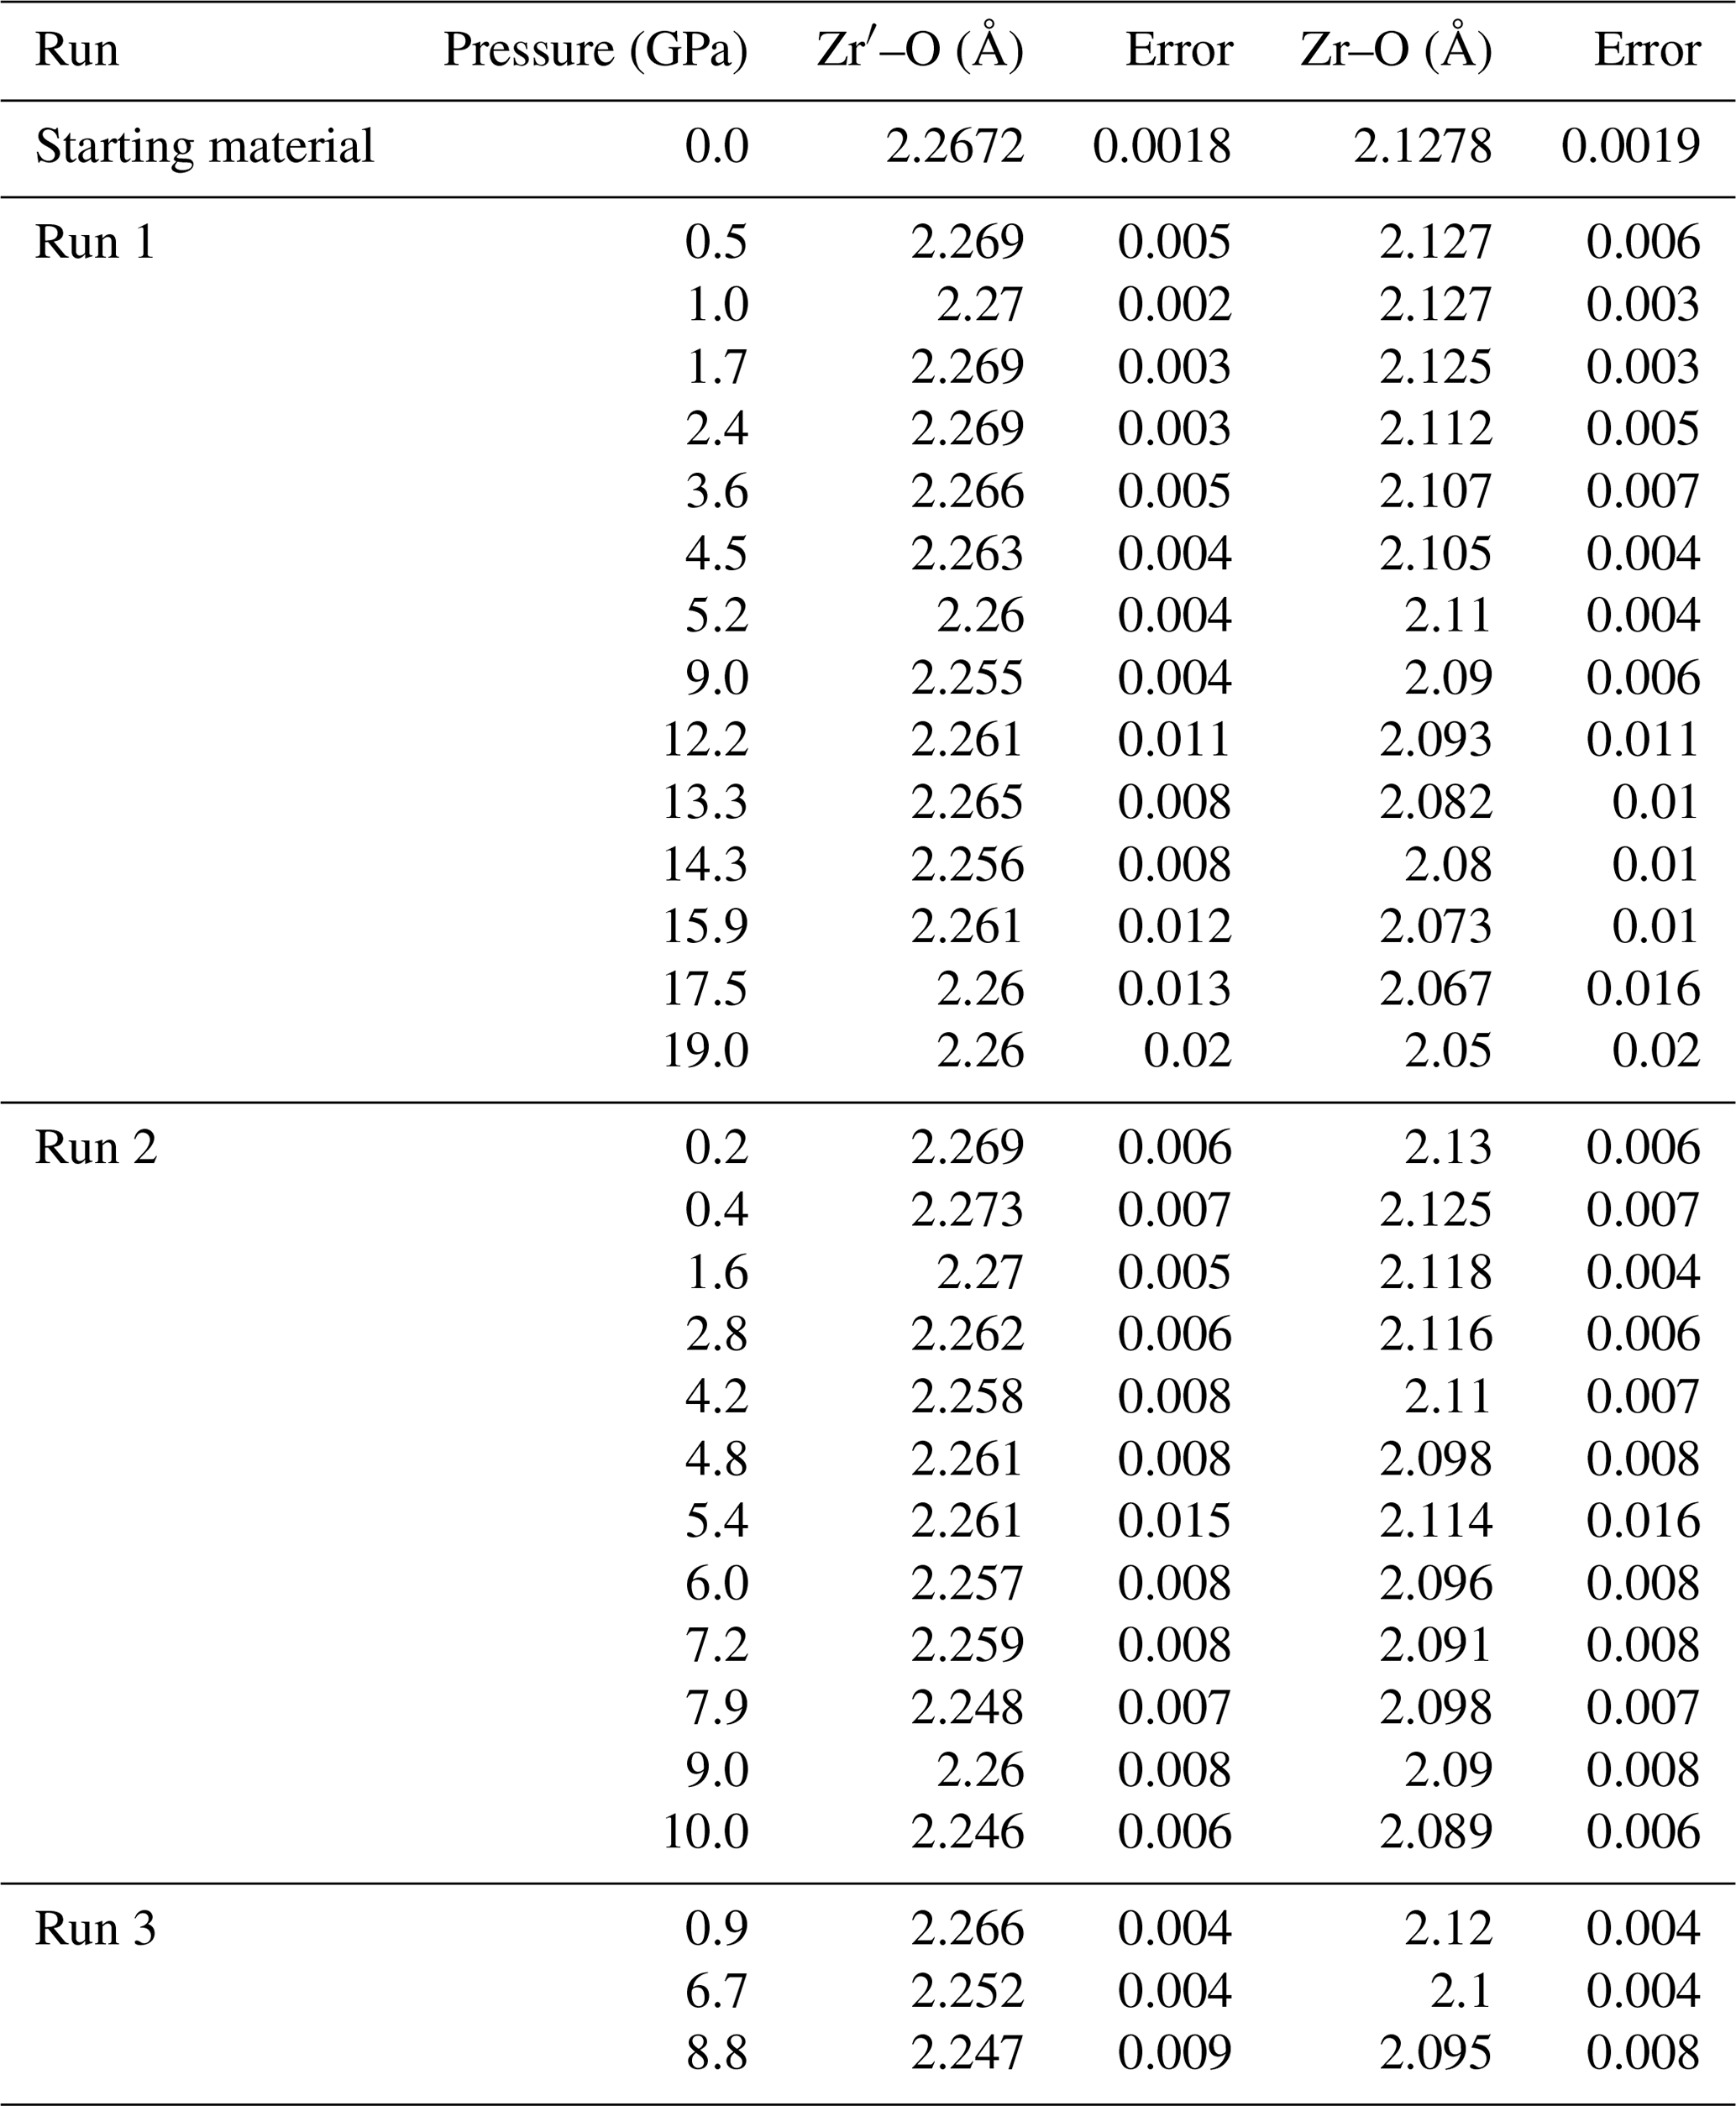
Based on the refined crystal structure data, we have analyzed the Zr–O bond length in zircon (Fig. 4), distortion index and effective coordination number (Fig. S1), and volume of ZrO8 polyhedra (Fig. 5) under high-pressure conditions using VESTA software (Momma and Izumi, 2011). The bulk modulus of the ZrO8 polyhedral volume is 171 GPa with a fixed value of (Fig. 5). Although it has been reported in the literature that the bulk modulus of ZrO8 polyhedra is ∼ 280 GPa (Hazen and Finger, 1979), it has been argued that the value should be re-examined because it is anomalously high compared to the value (225 GPa) of SiO4 polyhedra (Marqués et al., 2006). Our new fitting of previous crystallographic data (Hazen and Finger, 1979) showed that the bulk modulus of ZrO8 polyhedra is 202 GPa and is comparable with that of SiO4. The value is fairly consistent with our data.
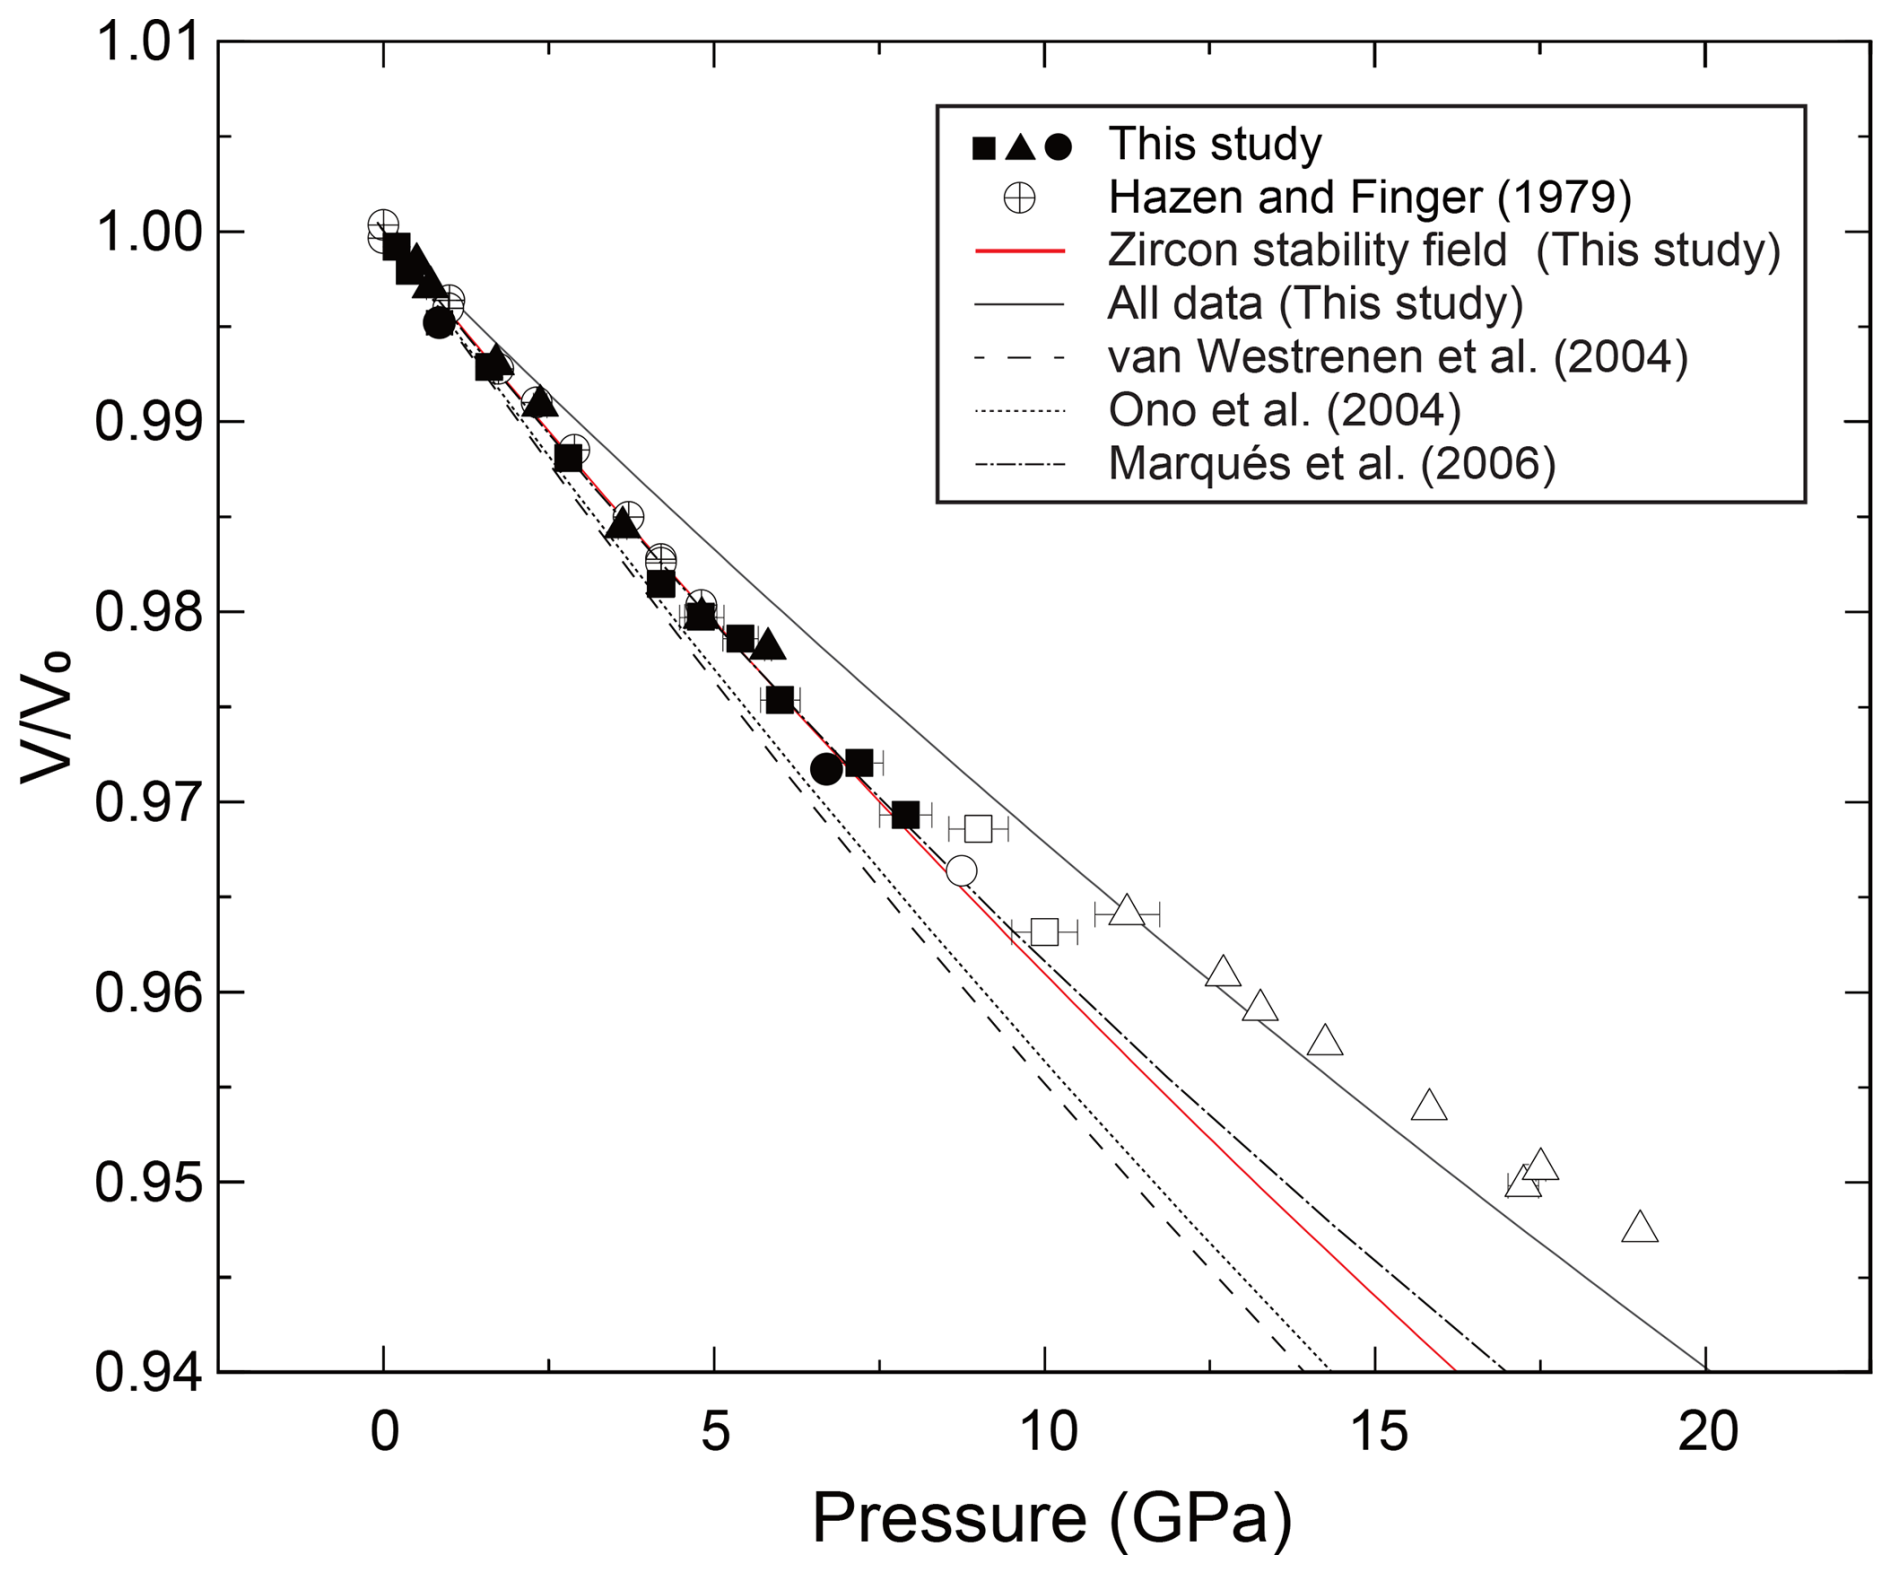
Figure 3The fitting results of the Birch–Murnaghan equation of state in the unit cell volume of the zircon. Filled symbols represent our results in the stability field of the zircon, and open symbols represent data in the metastable pressure conditions. The red line is the results obtained from the data below 8 GPa, including a previous single-crystal XRD study (K=234.80(4) GPa with a fixed value of ) (Hazen and Finger, 1979). The solid black line is the result using all data. The dash-dotted line, dotted line, and dashed line represent previous studies by powder XRD measurements (Marqués et al., 2006; Ono et al., 2004a; Van Westrenen et al., 2004).
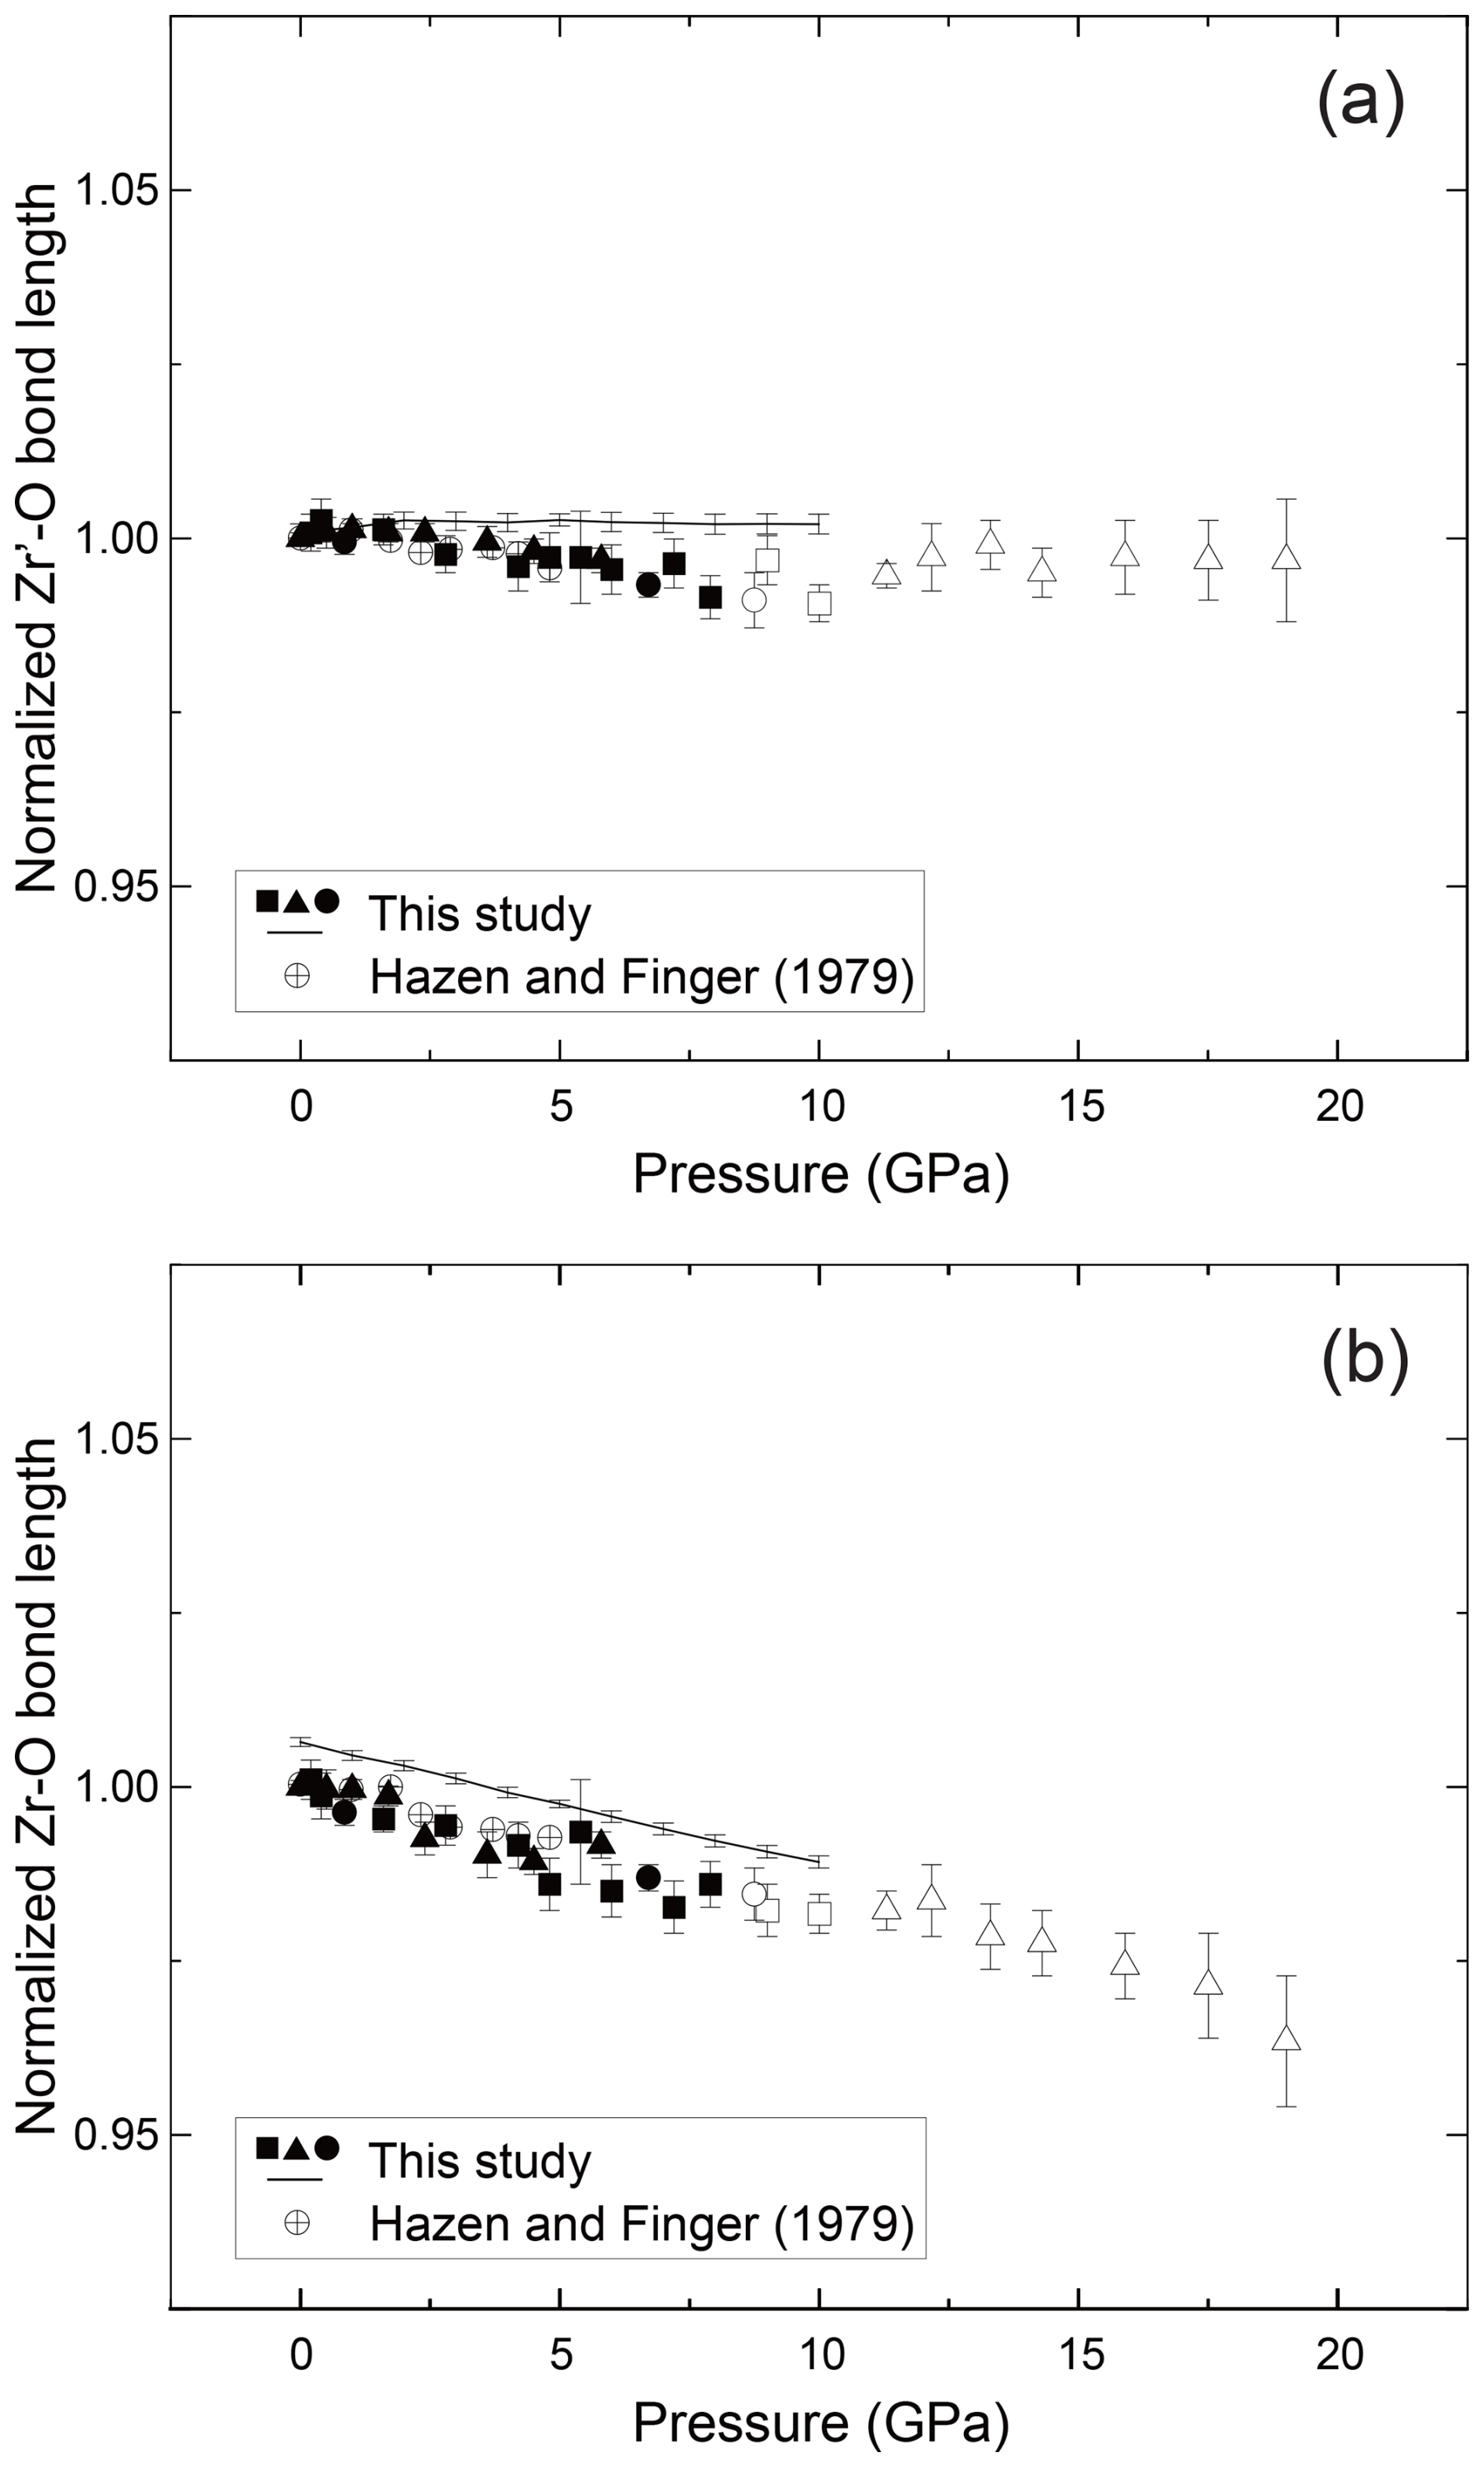
Figure 4The relationships between pressure and the (a) Zr′–O bond and (b) Zr–O bond length of the zircon. Filled symbols represent our results in the stability field of the zircon, and open symbols represent data in the metastable pressure conditions. Lines show the results of MD calculations. The vertical axis is normalized using the values in ambient conditions.
The bond length and volume of ZrO8 polyhedra decreased monotonically with pressure up to ∼ 8 GPa and showed an abnormal trend above the stability field (Figs. 4 and 5). We also determined unit cell parameters and the volume of zircon at high pressure by MD calculations. Both unit cell parameters and the volume are well consistent with the data taken by the single-crystal XRD measurement (Figs. 1 and 2). The parameters used in the present MD calculations are listed in Table 3. This is the first parameter data set for Zr, Si, and O, which is fully consistent with the compressibility of zircon covering all stable pressure conditions.
The obtained compressibility of the zircon was not consistent with some previous studies (Fig. 3). The discrepancy may be due to the hydrostatic condition and instability of the sample. The methanol–ethanol(–water) pressure medium was used in two previous studies (Hazen and Finger, 1979; Marqués et al., 2006) and this study. On the other hand, neon (Van Westrenen et al., 2004) and NaCl (Ono et al., 2004a) were used in other studies. While methanol–ethanol and neon preserve homogeneous pressure conditions in the sample chamber up to around 10 GPa, the pressure effect on the line widths of the ruby R1 fluorescence is different (Klotz et al., 2009). This may indicate that the local stress environment is not equal between methanol–ethanol and neon. Since the experimental data are closely consistent with the results of theoretical calculations in the ideal hydrostatic conditions (Figs. 1, 2, and 3), our experimental samples were in hydrostatic conditions below approximately 10 GPa. In the current study, the compressibility of zircon was determined based on the data taken under relatively lower pressure (< 8 GPa). Below this pressure, it is most likely that zircon is stable and under hydrostatic conditions. Alternatively, the pressure calibrant may also cause the discrepancy. Ono et al. (2004a) used equations of state of gold, and others used the ruby pressure scale (Hazen and Finger, 1979; Marqués et al., 2006; Van Westrenen et al., 2004). The metamictization may also have an effect on compressibility because the metamictization induces the disordered structure in the crystal (Ehlers et al., 2022; Özkan et al., 1974; Özkan and Jamieson, 1978). If the number of defects increases due to metamictization, the compressibility may be lower than in the results of this study.
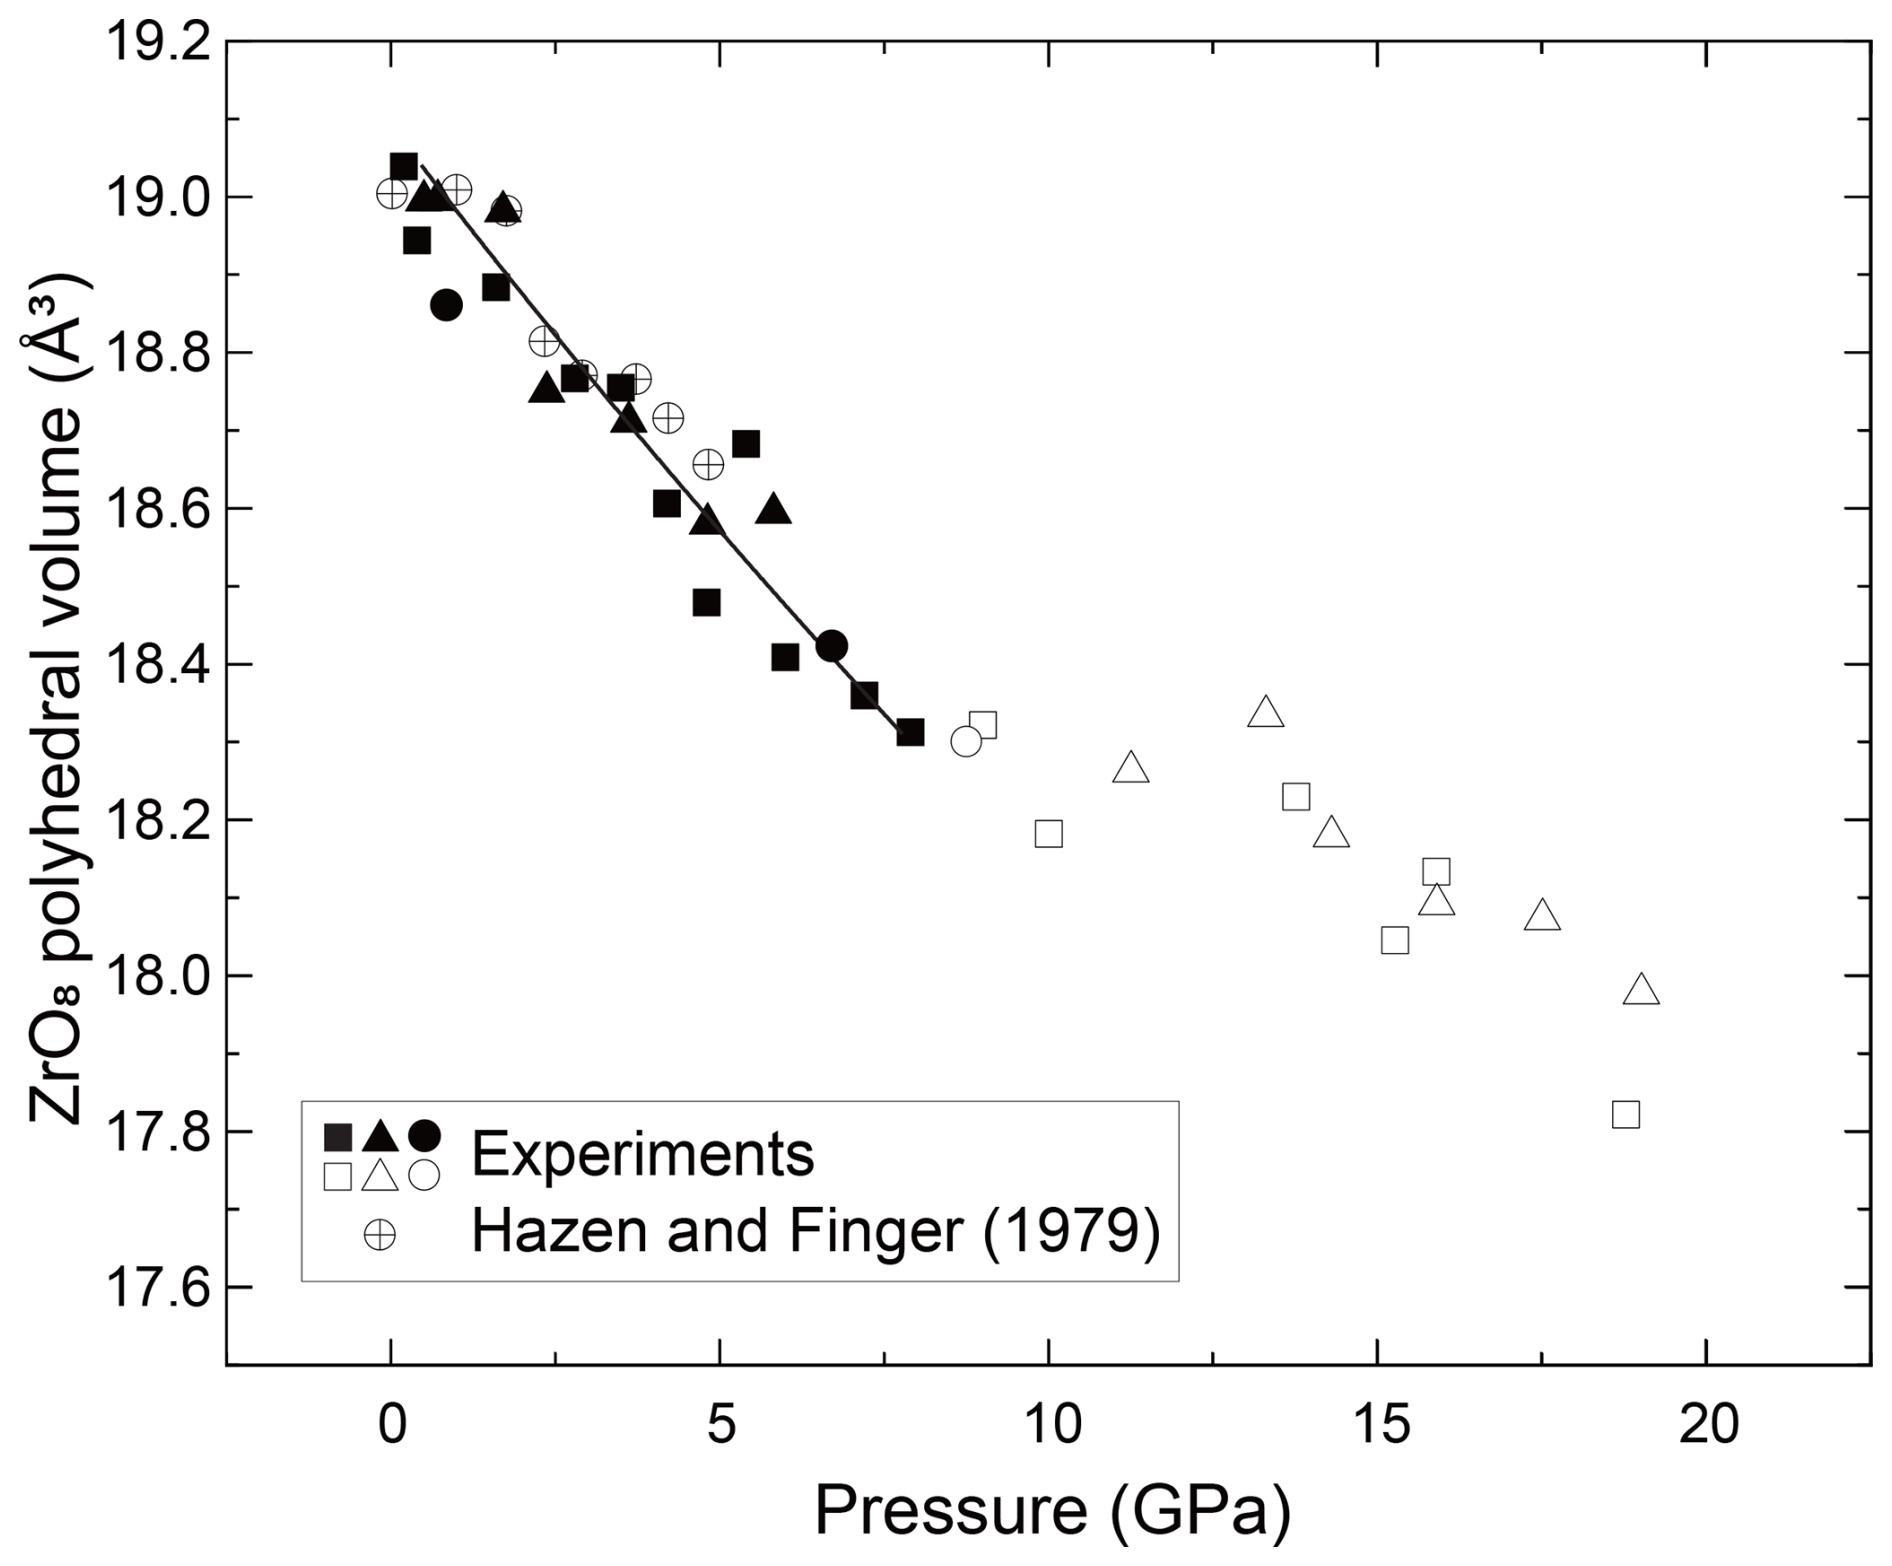
Figure 5The fitting results of the Birch–Murnaghan equation of state in the ZrO8 polyhedral volume of the zircon.
We determined the compression behavior of Zr–O bonds (2.13 Å at 1 atm) and Zr′–O bonds (2.27 Å at 1 atm) of zircon. Both experiments and MD calculations showed that the Zr′–O bonds are less compressible than Zr–O bonds (Fig. 4). This suggests that the ZrO8 polyhedra are more distorted under higher-pressure conditions. Further distortion likely causes the instability of the zircon crystal structure toward the phase transition to reidite. The anisotropic compressibility of the a and c axes of the unit cell is due to the strength of the Zr–O and Zr′–O bonding (Fig. 2), as Zr–O bonds are along the a axis and Zr′–O bonds are along the c axis of the unit cell. In addition, as Zr–O bonds share corners with SiO4 polyhedra, the Zr–O bond may become shorter because of the adjacent rigid Si–O bonds.
The partitioning coefficient of trace elements has been theoretically modeled as a function of ionic radii based on strain in the lattice (Brice, 1975; Onuma et al., 1968). Such a relationship between the partitioning coefficients and the ionic radius is known as the Onuma diagram (Onuma et al., 1968). The lattice strain model considers the substitution of trace elements to cause an expansion or contraction of the crystallographic site, which induces an excess or deficit of free energy. According to the model (Blundy and Wood, 1994), partitioning coefficients can be expressed by the equation below.
where Di denotes the partitioning coefficients of trace elements with an ionic radius of ri under given conditions of pressure (P), temperature (T), and composition (X). Di takes a maximum value (D0) with the most compatible (fictive) element with an ionic radius of r0. E is Young's modulus, NA is the Avogadro constant, and R is the gas constant.
In earlier work, Young's modulus E was estimated from the relationships between E, site bulk moduli Ksite, and the Poisson ratio ν: (1 – 2×ν), with an assumption of a Poisson solid (ν=0.25) (Blundy and Wood, 1994). Our results showed that the site bulk modulus of ZrO8 in the zircon was Ksite=167(25) GPa, resulting in E=251(38) GPa, according to the Poisson solid assumption. To test the validity of the Poisson solid assumption, we compared the partitioning coefficients between the lattice strain model and experimental data taken at 1 atm and 1573 K (Burnham and Berry, 2012) (Fig. 6). For modeling the eight-fold-coordinated M3+ ion, we used D0=3.32 and r0=0.956 Å, as proposed by previous studies. The value of E=251(38) GPa clearly does not match the value based on the partitioning coefficients (Fig. 6). The assumption of the Poisson solid may not be appropriate for modeling the lattice strain of the ion site.
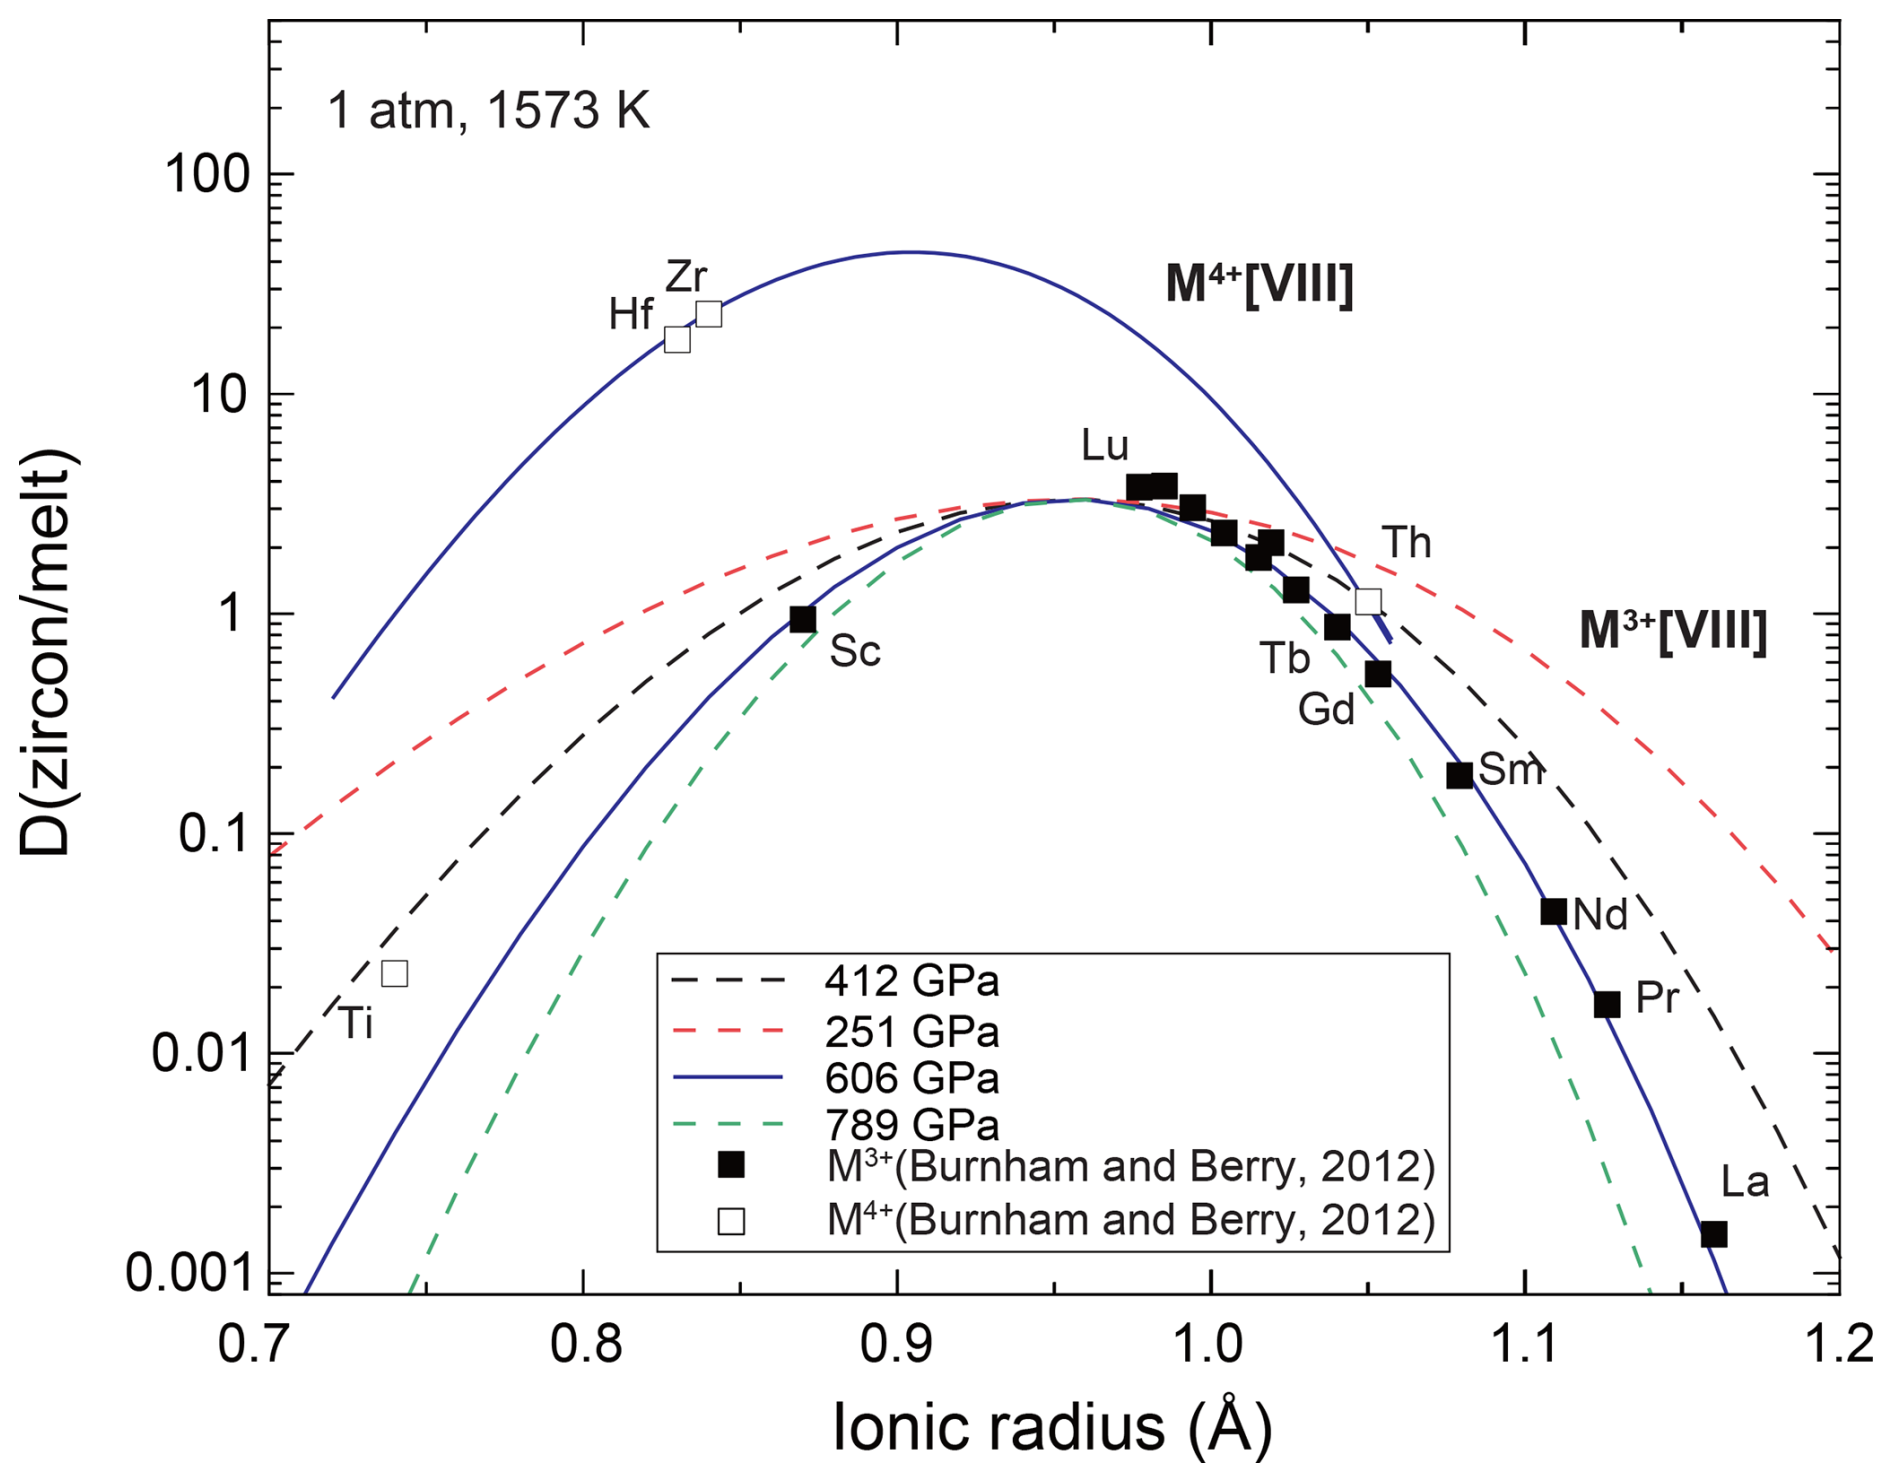
Figure 6The relationship between the ionic radius and partitioning coefficients (Onuma diagram) between zircon and melt at 1 atm and 1573 K. Filled symbols represent the experimental results of the M3+ cation, and the open symbols represent those of the M4+ cation (Burnham and Berry, 2012). Lines are the partitioning coefficient for an eight-fold cation based on the lattice strain model with various Young's moduli (see text).
Alternatively, as a first step, we preliminarily assumed that the ZrO8 polyhedra are in a similar condition to the incompressible fluid, in which the mechanical pressure is equal to the average of the normal stress – P= – because the strains ε of the Zr–O bond are small. The pressure medium preserves hydrostatic conditions in this study, and thus, , and the shear stress is zero. In this preliminary model, the stress applied to the Zr–O bond is equal to the experimentally determined pressure. Young's modulus of the Zr–O bond can be determined by a slope of the strain–stress curve via Hooke's law, (Fig. S2). The linear regression of strain in the average bond length of Zr–O by this study and previous data (Hazen and Finger, 1979) at < 8 GPa showed Young's modulus E=606(40) GPa. The bond length of Zr′–O (2.27 Å at 1 atm) showed a high value of E=789(91) GPa, and Zr–O (2.13 Å at 1 atm) showed a lower value of E=412(41) GPa. We summarize Young's moduli estimated by this study in Table S1 in the Supplement. The linear relationship between stress and strain indicates that the partitioning coefficient does not strongly depend on the pressure according to the lattice strain model. We tested various Young's moduli by comparison with the experimentally determined partitioning coefficients (Fig. 6). The obtained Young's modulus of the average bond length (E=606 GPa) agrees well with the experimentally determined partitioning coefficient of the 14 M3+ ions determined at 1 atm and 1573 K (Burnham and Berry, 2012) (Fig. 6). In addition to the M3+ ion, we fitted Di for four M4+ ions with a fixed E value of 606 GPa. The fitting results showed D0=44(8) and r0=0.905(9) Å for an eight-fold M4+ ion. The results are fairly consistent with experiments except for the results of Ti4+, which may be more compatible with the four-fold-coordinated SiO4 site. Although the model is based on a preliminary assumption, the compressibility of the average bond length agrees well with the partitioning coefficient of the trace elements. The model can predict the partitioning coefficient based on the compression behavior of the bond length, which is relatively straightforward to measure by single-crystal XRD measurements.
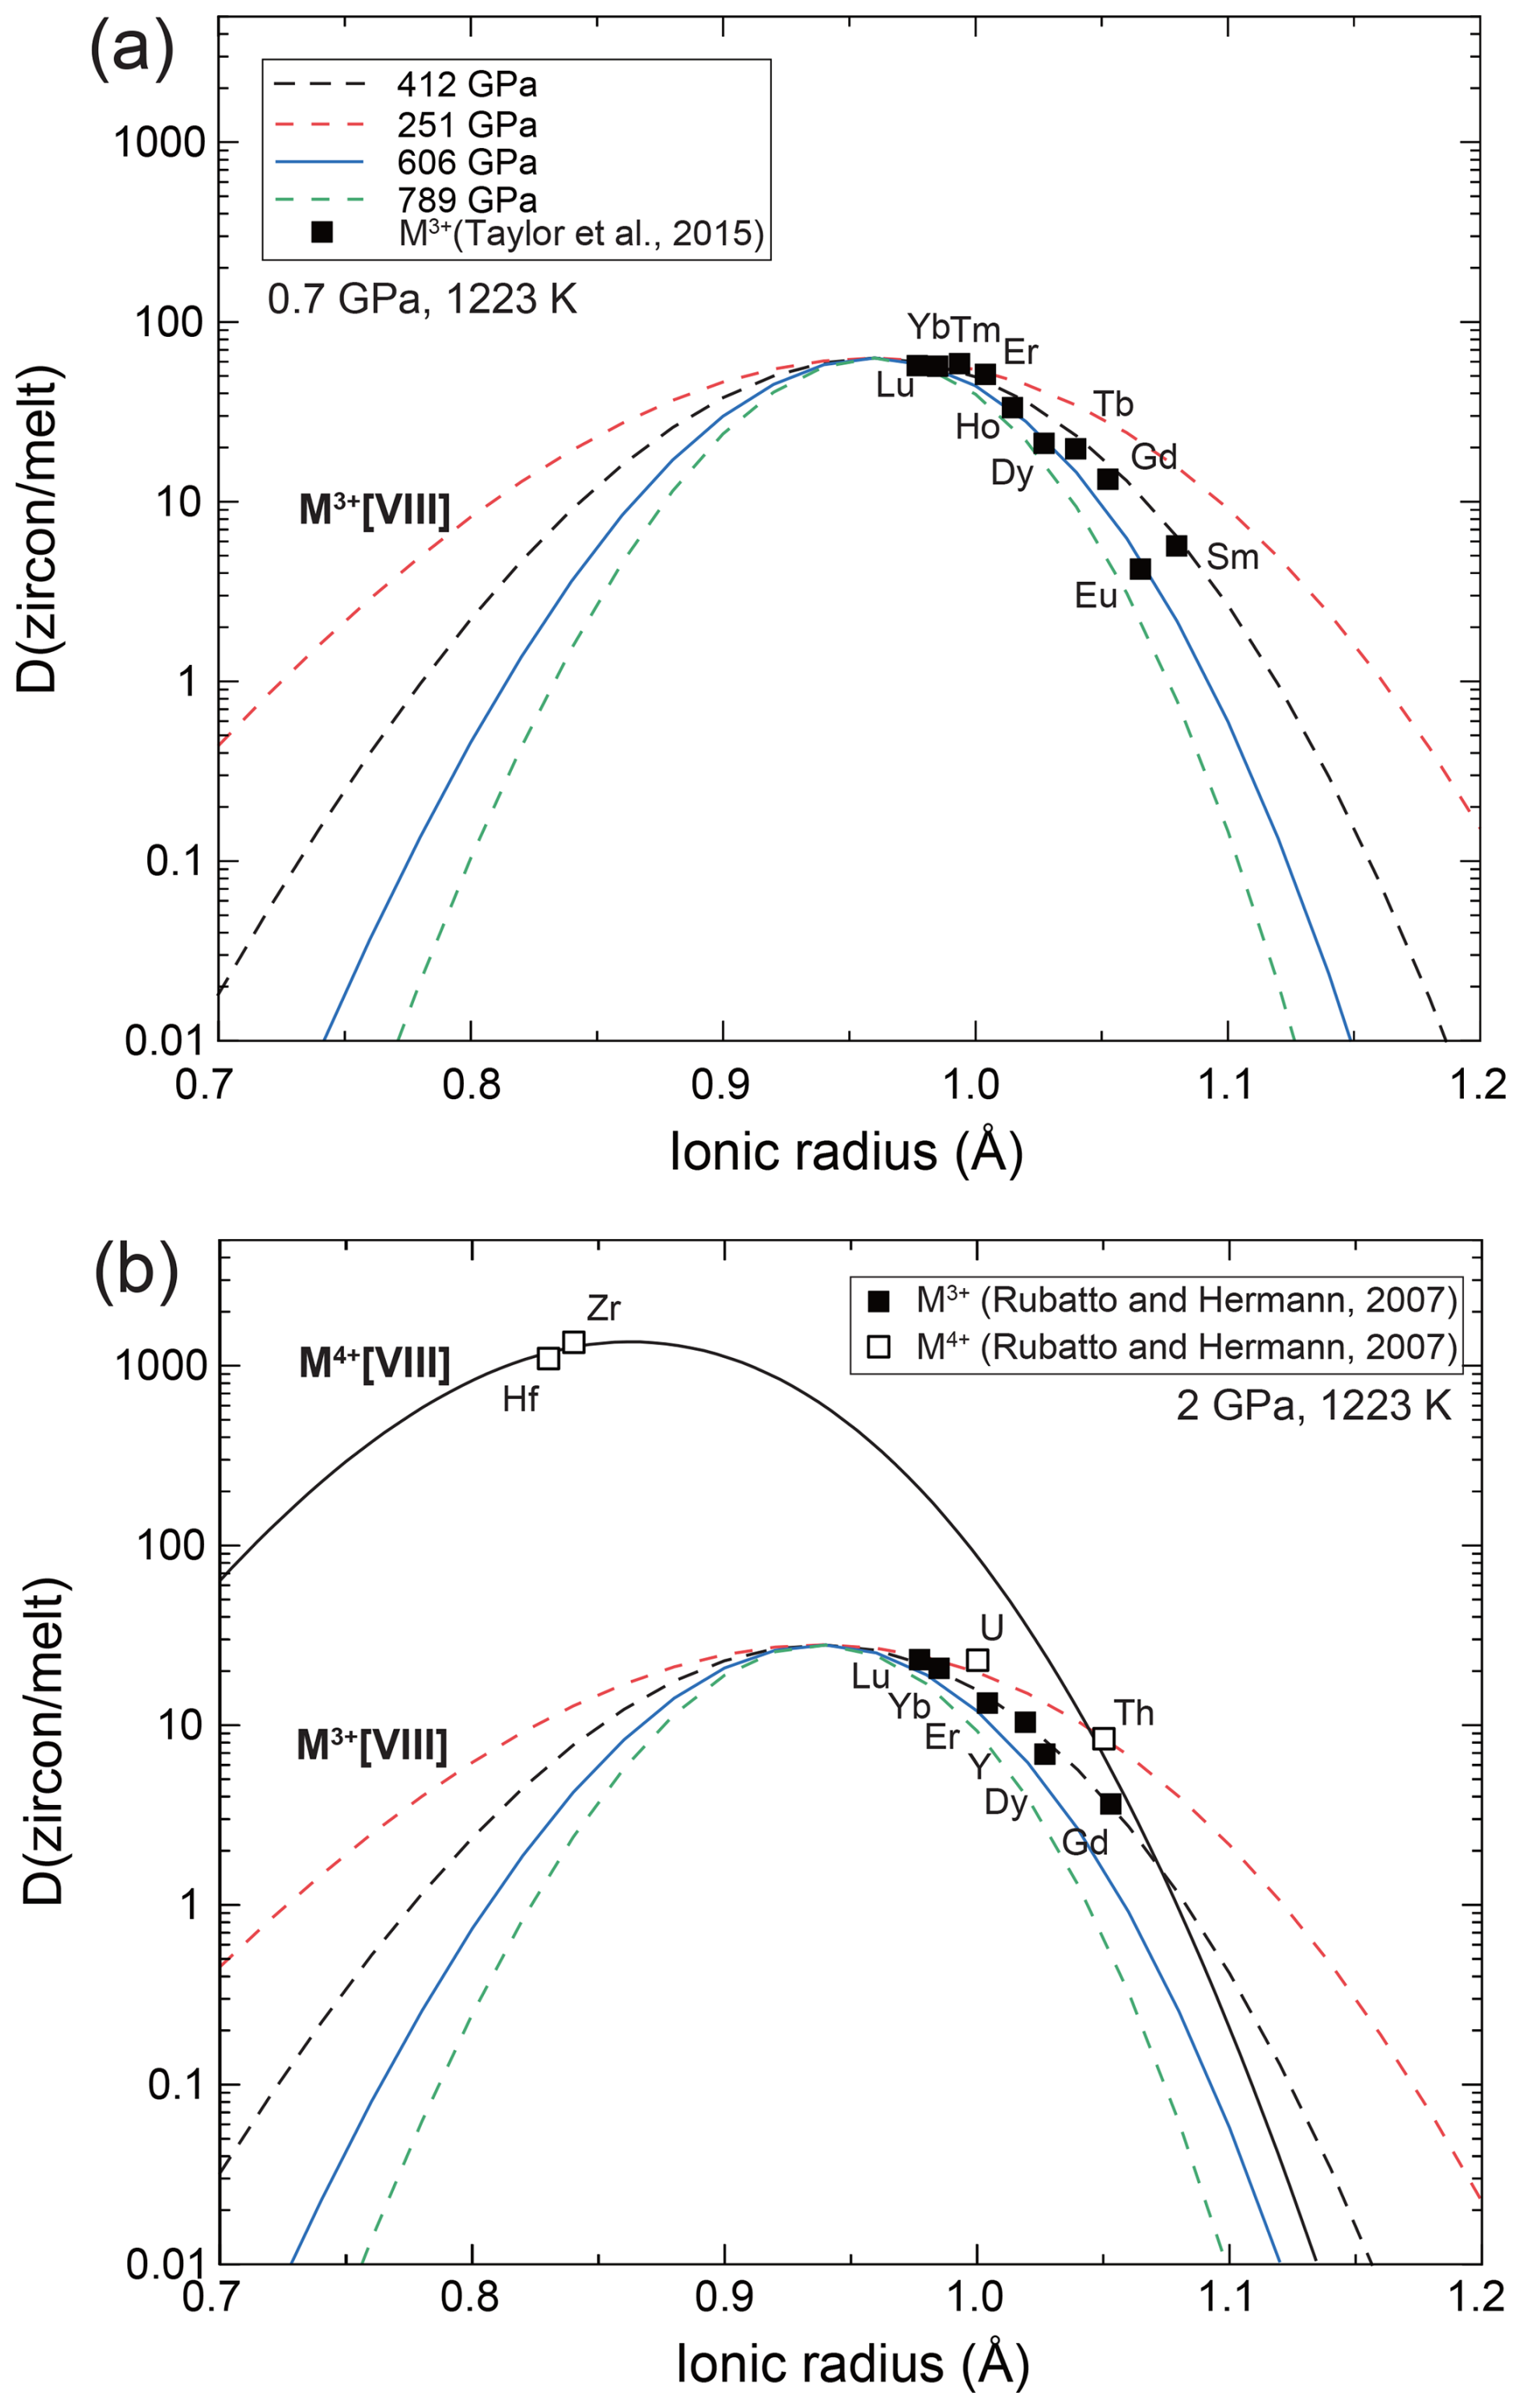
Figure 7The Onuma diagram between zircon and melt at (a) 0.7 GPa and 1223 K (Taylor et al., 2015) and (b) 2 GPa and 1223 K (Rubatto and Hermann, 2007). Lines are partitioning coefficients by the lattice strain model with various Young's moduli. Filled symbols represent the experimental results of the M3+ cation, and the open symbols represent those of the M4+ cation.
We further compared the model with two available experimental data sets under high-pressure conditions (Rubatto and Hermann, 2007; Taylor et al., 2015) (Fig. 7). We modeled the partitioning coefficient between zircon and melt at 1223 K and high pressure based on the elastic parameters of the zircon that were obtained by this study. For modeling the eight-fold-coordinated M3+ ion, we used D0 and r0 as proposed by previous studies (Rubatto and Hermann, 2007; Taylor et al., 2015). We found the D0 and r0 of eight-fold-coordinated M4+ ion to be D0=1329(200) and r0=0.86(2) Å by fitting the partitioning coefficients of Hf, Zr, U, and Th, since this was not determined in the previous study of Rubatto and Hermann (2007). The partitioning coefficient did not match the data when it was modeled by Young's modulus calculated from the site compressibility with an assumption of a Poisson solid (E=251 GPa). In contrast to the result at 1 atm (Fig. 6), the model using a modulus of averaged Zr–O bond length considerably deviates from the experimentally determined partitioning coefficient (Fig. 7). The value is in between the moduli of a shorter Zr–O bond length (2.13 Å at 1 atm) and averaged bond length. The reason for this shift is not clear. The elements may preferentially push/pull the shortest Zr–O bond during the substitution at high pressure. Alternatively, soft Zr–O bonds are preferentially deformed during the substitution of the cation. To test this hypothesis, the compressibility of the bond length and partitioning coefficient in various minerals at high pressure must be compared. Moreover, recently, Karato (2016) revised the lattice strain model by including the bulk modulus of the trace elements, which is a conceptual parameter that infers the stiffness of the trace elements. The bulk modulus of the trace elements may be largely different under high-pressure conditions, although it is far more difficult to determine than the conventional bulk modulus of the crystal. This may explain the deviation of the model under high-pressure conditions, while the bulk modulus of the trace elements has not been well studied so far.
We have precisely determined the crystal structure of zircon under high-pressure conditions up to 19 GPa, covering the whole stability field of zircon using a diamond anvil cell and single-crystal XRD measurements. We also theoretically calculated the crystal structure of zircon at high pressure using molecular dynamics simulations. We determined the compressibility of the Zr–O bond and ZrO8 polyhedra based on the determined crystal structure under pressure conditions lower than 8 GPa, in which zircon is certainly stable. We estimated Young's moduli of the cation site from the bond length to predict the partitioning coefficients of the trace elements via the lattice strain model. The moduli determined based on the averaged Zr–O bond length match the experimentally determined partitioning coefficients well.
MXDORTO is available via the following link: https://kats-labo.jimdofree.com/mxdorto-mxdtricl/, last access: 11 April 2025. APEX4 is commercially distributed by Bruker. SHELXL and VESTA are freely available from Sheldrick (2008) and Momma and Izumi (2011).
The data of the crystal structures, such as the CIF files or the results calculated by the MD simulation studied here, are available upon request.
The supplement related to this article is available online at https://doi.org/10.5194/ejm-37-257-2025-supplement.
SM planned and designed the research based on a discussion with RS. The experiments were carried out by SM, RS, and SKI. The theoretical calculations were carried out by SM, HH, and TIF. SM, RS, and TIF wrote the manuscript based on discussions with all other co-authors. All the authors read and discussed the manuscript.
The contact author has declared that none of the authors has any competing interests.
Publisher's note: Copernicus Publications remains neutral with regard to jurisdictional claims made in the text, published maps, institutional affiliations, or any other geographical representation in this paper. While Copernicus Publications makes every effort to include appropriate place names, the final responsibility lies with the authors.
This article is part of the special issue “Probing the Earth: experiments on and for our planet”. It is not associated with a conference.
Shuhou Maitani was supported by KAKENHI grant number 24KJ2052. Ryosuke Sinmyo was supported by KAKENHI grant numbers 19H01989 and 23H01277. We acknowledge Hans Keppler for providing the zircon crystal.
This research has been supported by the Japan Society for the Promotion of Science (KAKENHI, grant nos. 24KJ2052, 19H01989 and 23H01277).
This paper was edited by Leonid Dubrovinsky and reviewed by two anonymous referees.
Adam, J. and Green, T.: The influence of pressure, mineral composition and water on trace element partitioning between clinopyroxene, amphibole and basanitic melts, Europ. J. Mineral., 15, 831–841, https://doi.org/10.1127/0935-1221/2003/0015-0831, 2003.
Anderson, E. B., Burakov, B. E., and Pazukhin, E. M.: High-Uranium Zircon from “Chernobyl Lavas”, Radiochim. Acta, 60, 149–152, https://doi.org/10.1524/ract.1993.60.23.149, 1993.
Baur, W.: The geometry of polyhedral distortions. Predictive relationships for the phosphate group, Acta Crystallogr. B, 30, 1195–1215, https://doi.org/10.1107/S0567740874004560, 1974.
Blundy, J. and Wood, B.: Prediction of crystal–melt partition coefficients from elastic moduli, Nature, 372, 452–454, 1994.
Boffa Ballaran, T., Kurnosov, A., and Trots, D.: Single-crystal X-ray diffraction at extreme conditions: a review, High Pressure Res., 33, 453–465, https://doi.org/10.1080/08957959.2013.834052, 2013.
Brice, J. C.: Some thermodynamic aspects of the growth of strained crystals, J. Cryst. Growth, 28, 249–253, https://doi.org/10.1016/0022-0248(75)90241-9, 1975.
Burnham, A. D. and Berry, A. J.: An experimental study of trace element partitioning between zircon and melt as a function of oxygen fugacity, Geochim. Cosmochim. Ac., 95, 196–212, https://doi.org/10.1016/j.gca.2012.07.034, 2012.
Chen, X., Lou, H., Zeng, Z., Cheng, B., Zhang, X., Liu, Y., Xu, D., Yang, K., and Zeng, Q.: Structural transitions of 4:1 methanol–ethanol mixture and silicone oil under high pressure, Matter and Radiation at Extremes, 6, 038402, https://doi.org/10.1063/5.0044893, 2021.
Devanathan, R., Corrales, L. R., Weber, W. J., Chartier, A., and Meis, C.: Molecular dynamics simulation of disordered zircon, Phys. Rev. B, 69, 064115, https://doi.org/10.1103/PhysRevB.69.064115, 2004.
Du, J., Devanathan, R., Corrales, L. R., Weber, W. J., and Cormack, A. N.: Short-and medium-range structure of amorphous zircon from molecular dynamics simulations, Phys. Rev. B, 77, 109902, https://doi.org/10.1103/PhysRevB.74.214204, 2006.
Ehlers, A. M., Zaffiro, G., Angel, R. J., Boffa-Ballaran, T., Carpenter, M. A., Alvaro, M., and Ross, N. L.: Thermoelastic properties of zircon: Implications for geothermobarometry, Am. Mineral., 107, 74–81, 2022.
Ewald, P. P.: Die Berechnung optischer und elektrostatischer Gitterpotentiale, Ann. Phys., 369, 253–287, https://doi.org/10.1002/andp.19213690304, 1921.
Ewing, R. C.: Nuclear waste forms for actinides, P. Natl. Acad. Sci. USA, 96, 3432–3439, https://doi.org/10.1073/pnas.96.7.3432, 1999.
Froude, D. O., Ireland, T. R., Kinny, P. D., Williams, I. S., Compston, W., Williams, I. R., and Myers, J. S.: Ion microprobe identification of 4,100–4,200 Myr-old terrestrial zircons, Nature, 304, 616–618, https://doi.org/10.1038/304616a0, 1983.
Geisler, T., Burakov, B. E., Zirlin, V., Nikolaeva, L., and Poml, P.: A Raman spectroscopic study of high-uranium zircon from the Chernobyl “lava”, Europ. J. Mineral., 17, 883–894, https://doi.org/10.1127/0935-1221/2005/0017-0883, 2005.
Glass, B. P. and Liu, S.: Discovery of high-pressure ZrSiO4 polymorph in naturally occurring shock-metamorphosed zircons, Geology, 29, 371–373, https://doi.org/10.1130/0091-7613(2001)029<0371:dohpzp>2.0.co;2, 2001.
Hazen, R. M. and Finger, L. W.: Crystal structure and compressibility of zircon at high pressure, Am. Mineral., 64, 196–201, 1979.
Ikeda-Fukazawa, T.: Molecular dynamical investigations for effect on temperature history of forsterite glass, J. Soc. Inorg. Matter. Jpn., 23, 130–135, 2016.
Karato, S.-I.: Physical basis of trace element partitioning: A review, Am. Mineral., 101, 2577–2593, https://doi.org/10.2138/am-2016-5665, 2016.
Kawamura, K.: Mxdorto, Japan Chemistry Program Exchange, Society of Computer Chemistry, Japan, 29, 1996.
Klotz, S., Chervin, J., Munsch, P., and Le Marchand, G.: Hydrostatic limits of 11 pressure transmitting media, J. Phys. D, 42, 075413, https://doi.org/10.1088/0022-3727/42/7/075413, 2009.
Knittle, E. and Williams, Q.: High-pressure Raman spectroscopy of ZrSiO4: Observation of the zircon to scheelite transition at 300 K, Am. Mineral., 78, 245–252, 1993.
Kubo, A., Nishizawa, J., and Ikeda-Fukazawa, T.: Structure and dynamics of interface between forsterite glass and amorphous ice, Chem. Phys. Lett., 760, 138028, https://doi.org/10.1016/j.cplett.2020.138028, 2020.
Kumagai, N., Kawamura, K., and Yokokawa, T.: An interatomic potential model for H2O: applications to water and ice polymorphs, Mol. Simulat., 12, 177–186, 1994.
Luo, Y. and Ayers, J. C.: Experimental measurements of zircon/melt trace-element partition coefficients, Geochim. Cosmochim. Ac., 73, 3656–3679, 2009.
Maitani, S., Sinmyo, R., Ishii, T., and Yoza, K.: Inert structural transition in 4H and 6H SiC at high pressure and temperature: a Raman spectroscopy study, J. Phys. Commun., 8, 065001, https://doi.org/10.1088/2399-6528/ad5410, 2024.
Mao, H. K., Xu, J., and Bell, P. M.: Calibration of the ruby pressure gauge to 800 kbar under quasi-hydrostatic conditions, J. Geophys. Res., 91, 4673–4676, https://doi.org/10.1029/JB091iB05p04673, 1986.
Marqués, M., Flórez, M., Recio, J., Gerward, L., and Olsen, J. S.: Structure and stability of ZrSiO4 under hydrostatic pressure, Phys. Rev. B, 74, 014104, https://doi.org/10.1103/PhysRevB.74.014104, 2006.
Momma, K. and Izumi, F.: VESTA 3 for three-dimensional visualization of crystal, volumetric and morphology data, J. Appl. Crystallogr., 44, 1272–1276, https://doi.org/10.1107/s0021889811038970, 2011.
Ono, S., Tange, Y., Katayama, I., and Kikegawa, T.: Equations of state of ZrSiO4 phases in the upper mantle, Am. Mineral., 89, 185–188, 2004a.
Ono, S., Funakoshi, K., Nakajima, Y., Tange, Y., and Katsura, T.: Phase transition of zircon at high PT conditions, Contrib. Mineral. Petrol., 147, 505–509, 2004b.
Onuma, N., Higuchi, H., Wakita, H., and Nagasawa, H.: Trace element partition between two pyroxenes and the host lava, Earth Planet. Sc. Lett., 5, 47–51, https://doi.org/10.1016/S0012-821X(68)80010-X, 1968.
Özkan, H. and Jamieson, J.: Pressure dependence of the elastic constants of nonmetamict zircon, Phys. Chem. Miner., 2, 215–224, 1978.
Özkan, H., Cartz, L., and Jamieson, J.: Elastic constants of nonmetamict zirconium silicate, J. Appl. Phys., 45, 556–562, 1974.
Reid, A. and Ringwood, A.: Newly observed high pressure transformations in Mn3O4, CaAl2O4, and ZrSiO4, Earth Planet. Sc. Lett., 6, 205–208, 1969.
Rubatto, D. and Hermann, J.: Experimental zircon/melt and zircon/garnet trace element partitioning and implications for the geochronology of crustal rocks, Chem. Geol., 241, 38–61, 2007.
Schmidt, C., Steele-MacInnis, M., Watenphul, A., and Wilke, M.: Calibration of zircon as a Raman spectroscopic pressure sensor to high temperatures and application to water-silicate melt systems, Am. Mineral., 98, 643–650, 2013.
Sheldrick, G. M.: A short history of SHELX, Acta Crystallogr. A, 64, 112–122, https://doi.org/10.1107/s0108767307043930, 2008.
Stangarone, C., Angel, R. J., Prencipe, M., Mihailova, B., and Alvaro, M.: New insights into the zircon-reidite phase transition, Am. Mineral., 104, 830–837, 2019.
Tange, Y. and Takahashi, E.: Stability of the high-pressure polymorph of zircon (ZrSiO4) in the deep mantle, Phys. Earth Planet. Int., 143, 223–229, https://doi.org/10.1016/j.pepi.2003.10.009, 2004.
Taylor, R., Harley, S., Hinton, R., Elphick, S., Clark, C., and Kelly, N.: Experimental determination of REE partition coefficients between zircon, garnet and melt: A key to understanding high – T crustal processes, J. Metamor. Geol., 33, 231–248, 2015.
Timms, N. E., Erickson, T. M., Pearce, M. A., Cavosie, A. J., Schmieder, M., Tohver, E., Reddy, S. M., Zanetti, M. R., Nemchin, A. A., and Wittmann, A.: A pressure-temperature phase diagram for zircon at extreme conditions, Earth-Sci. Rev., 165, 185–202, https://doi.org/10.1016/j.earscirev.2016.12.008, 2017.
Van Westrenen, W., Frank, M. R., Hanchar, J. M., Fei, Y., Finch, R. J., and Zha, C.-S.: In situ determination of the compressibility of synthetic pure zircon (ZrSiO4) and the onset of the zircon-reidite phase transition, Am. Mineral., 89, 197–203, 2004.
Verlet, L.: Computer “experiments” on classical fluids, I. Thermodynamical properties of Lennard-Jones molecules, Phys. Rev., 159, 98–103, https://doi.org/10.1103/PhysRev.159.98, 1967.
Wilde, S. A., Valley, J. W., Peck, W. H., and Graham, C. M.: Evidence from detrital zircons for the existence of continental crust and oceans on the Earth 4.4 Gyr ago, Nature, 409, 175–178, https://doi.org/10.1038/35051550, 2001.
Woodhead, J. A., Rossman, G. R., and Silver, L. T.: The metamictization of zircon: Radiation dose-dependent structural characteristics, Am. Mineral., 76, 74–82, 1991.
Yang, X., Gaillard, F., and Scaillet, B.: A relatively reduced Hadean continental crust and implications for the early atmosphere and crustal rheology, Earth Planet. Sc. Lett., 393, 210–219, https://doi.org/10.1016/j.epsl.2014.02.056, 2014.