the Creative Commons Attribution 4.0 License.
the Creative Commons Attribution 4.0 License.
 | 09 Sep 2024
Magma storage conditions of Lascar andesites, central volcanic zone, Chile
André Stechern
Magdalena Blum-Oeste
Roman E. Botcharnikov
François Holtz
Gerhard Wörner
Lascar volcano, located in northern Chile, is among the most active volcanoes of the Andean Central Volcanic Zone (CVZ). Its activity culminated in the last major explosive eruption in April 1993. Lascar andesites which erupted in April 1993 have a phase assemblage composed of plagioclase, clinopyroxene, orthopyroxene, Fe–Ti oxides, and rhyolitic glass. To better constrain storage conditions and mechanisms of magmatic differentiation for andesitic magmas in a thick continental crust, crystallization experiments were performed in internally heated pressure vessels at 300 and 500 MPa, in the temperature (T) range of 900–1050 °C, at various water activities (aH2O) and oxygen fugacities (logfO2 between QFM+1.5 and QFM+3.3 at aH2O =1; QFM is quartz–fayalite–magnetite oxygen buffer). The comparison of experimental products with natural phase assemblages, phase compositions, and whole-rock compositions was used to estimate magma storage conditions and to reconstruct the magma plumbing system.
We estimate that Lascar two-pyroxene andesitic magmas were stored at 975±25 °C, 300±50 MPa, and logfO2 of QFM, under H2O-undersaturated conditions with 2.5 wt % to 4.5 wt % H2O in the melt. The geochemical characteristics of the entire suite of Lascar volcanics indicates that a fractionating magmatic system located at a depth of 10–13 km is periodically replenished with less evolved magma. Some eruptive stages were dominated by volcanic products resulting most probably from the mixing of a mafic andesitic magma with a felsic component, whereas compositional variations in other eruptive stages are better explained by crystal fractionation processes. The relative importance of these two mechanisms (mixing vs. crystal fractionation) may be related to the amount and frequency of magma recharge in the reservoir.
- Article
(17722 KB) - Full-text XML
-
Supplement
(8312 KB) - BibTeX
- EndNote


The products of major volcanic eruptions related to subduction zone settings are the object of a considerable number of studies to understand storage and migration of magma in the continental crust. One of the most important contributions of petrology and geochemistry is to define the structure of the plumbing system and to establish the role and timescale of magmatic processes such as fractional crystallization, magma mixing, crustal contamination, and magma recharge.
In continental-arc settings, primary mafic magmas are assumed to be generated in the mantle wedge (e.g., Davies and Stevenson, 1992). Well-studied volcanoes in this tectonic environment have a complex magma plumbing system with reservoirs located at various depths. For example, petrological data for Mount St. Helens indicate that the primitive magma is emplaced in a crustal reservoir at depths of 7–14 km, feeding in this case the eruption of 18 May 1980. All subsequent dome-building eruptions from 1981 to 1986 tapped magma stored at a shallower depth of less than 4.5 km, suggesting a close relationship with a deeper-seated reservoir feeding this shallow magma reservoir (Cashman, 1992; Blundy and Cashman, 2005).
These well-studied examples and many other continental-arc volcanoes are seated in a crust with a typical thickness of ∼30 km. Comparatively, the continental crust in the central Andes can reach more than 2 times the thickness of a “typical” continental crust. The main cause for the rise of the Andes is the compression of the western South American plate due to the subduction of the Nazca plate, leading to maximum crustal thicknesses of 70–74 km under the Cordillera Oriental and Cordillera Occidental (Beck et al., 1996). In such environments, the geochemistry of volcanic rocks depends highly on variations in the subduction style and on the location of magma reservoirs in the crust. Variations along the subduction zones are primarily related to the buoyancy of the submerging oceanic crust (Gutscher, 2002). Within the regions of steep subduction (angles of ∼30°), such as at the trench of the Central Volcanic Zone (CVZ), primary melts may form not only in the mantle wedge but also as a result of the dehydration of the subducting oceanic plate, resulting in different geochemical signatures. The depth of magma reservoirs at which differentiation occurs also controls the geochemical characteristics of volcanic systems. A key phenomenon in a thick continental crust is that garnet becomes a stable phase in the mineral assemblage of magmas at the expense of plagioclase (Hildreth and Moorbath, 1988; Müntener et al., 2001; Lee et al., 2006). The presence of garnet (as well as amphibole and plagioclase) affects the trace element signature of magmas generated in the lower part of a thick continental crust (e.g., McMillan et al., 1993). These processes are recorded by the rare earth element (REE) distribution and especially by Sr Y and Sm Yb ratios (e.g., Haschke et al., 2002; Mamani et al., 2010), since Sr and Sm are preferentially incorporated into plagioclase (Drake and Weill, 1975) and Y and Yb are incorporated into garnet (Shimizu and Kushiro, 1975; Green et al., 1989). Low Sr Y and Sm Yb ratios are indicative of the presence of plagioclase and absence of garnet during magma genesis and differentiation. Thus, these particular geochemical signatures are crucial to determine the level of stagnation of magmas at different crustal reservoir levels and may also be an indicator of the degree of crustal contamination undergone by magmas ascending from the mantle wedge.
Along the CVZ, most volcanic rocks have a typical trace element signature of magmas that were in equilibrium with garnet-bearing systems, indicating a differentiation and magma storage in deep levels of the crust. Among the Quaternary eruptives from the CVZ, Lascar and the Lazufre volcanic system represent two exceptions with very low Sm Yb and Sr Y ratios (Mamani et al., 2010; Sm Yb of ∼2 and Sr Y of ∼25 for Lascar), indicating that the magma plumbing system may differ from other volcanoes. Lascar's low Sr Y and Sm Yb ratios may imply a shallow level of differentiation, meaning that mafic melts from the mantle wedge migrated through the thick crust (∼70 km) without major stagnation periods in deep crustal zones. Magnetotelluric and seismic surveys have confirmed the existence of a broad conductive zone characterized by seismic velocity at depths of ∼20–40 km (Brasse et al., 2002), but no magmatic reservoirs could be clearly detected directly beneath Lascar, neither with magnetotellurics and three-dimensional modeling (Díaz et al., 2012) nor with broadband seismic monitoring (Gaete et al., 2019). Both approaches were not able to reveal evidence of a major magma chamber at depths of 6 km or below and were only able to detect hydrothermal systems. Therefore, the structure and the temporal and spatial evolution of Lascar's magmatic plumbing system are still not well understood. Based on thermobarometry, the depth of the deepest magma reservoirs feeding the 1986–1993 eruptive products were estimated to be 15 to 29 km (Robidoux et al., 2020). However, the applied thermobarometers were mainly mineral–liquid pairs, which should be treated with caution due to potential disequilibrium caused by modifications of melt compositions during ascent and crystallization of microlites. Robidoux et al. (2020) also reported disequilibria between minerals and liquid. This probably explains the extremely high temperatures estimated by Robidoux et al. (2020), which range between 1070 and 1180 °C. This mineral–liquid disequilibrium is also expected to affect the estimated pressure. Thus, other approaches based on mineral–mineral thermobarometry and phase equilibria studies are necessary to better constrain magma storage conditions.
The aim of this study is (1) to constrain the current depth of magma storage region(s) beneath Lascar volcano and (2) to identify pre-eruptive magmatic processes occurring within the magma plumbing system. Magma storage conditions were determined from the investigations of the chemistry of natural-rock samples (bulk-rock and mineral chemistry) and thermobarometric calculations using mineral pairs. The geochemical analyses are complemented by phase equilibria studies of a typical andesite which erupted in the recent 1993 eruption (experimental conditions of 900–1050 °C and 300–500 MPa). The influence of oxygen fugacity was tested by conducting experiments at moderately reducing conditions (QFM+1.5, quartz–fayalite–magnetite oxygen buffer) and at relatively oxidizing conditions (QFM+3.3).
Lascar volcano is located at 23°22′ S, 67°41′ W in the region of Antofagasta in northern Chile, east of the Salar de Atacama and to the northeast of Laguna Lejía, and lies directly between the Altiplano and Puna plateaus. Lascar is the most active volcano of the Andean Central Volcanic Zone. Its historic activity has been recorded since 1848, which is characterized by continuous fumarolic emissions in the form of a steam and SO2 column, typically 1 km high, with intermitted short-lived volcanic explosions (Gardeweg and Medina, 1994) and occasional sub-Plinian eruptions, like the one in April 1993. The volcanic body consists of two conjoined truncated cones with three ENE–WSW-aligned summit craters and several minor craters. The active center has migrated from east to west, before switching back to the east at ∼7 ka (Calder et al., 2000). Lascar volcanic rocks cover the compositional range from basaltic andesites to dacites (Mamani et al., 2010). The evolution of the volcano can be subdivided in four major stages as described in detail by Gardeweg et al. (1998). A brief summary of this evolution is given here as a background for the interpretation of the experimental and analytical results.
The volcanic activity started before the last glacial maximum but less than 50 kyr ago. Stage I began less than 43 kyr ago with the eruption of blocky two-pyroxene andesitic lava and three small-volume, coarse-grained pyroclastic flow deposits building a stratocone on the eastern side of the present location. Ejecta from younger andesitic pyroclastic flow deposits from Stage I contain dacitic xenoliths.
Stage II (>26.5–22.3 kyr ago) activity is characterized by a migration of the active center to the west of the Stage I stratocone and the development of a silicic andesite dome complex, which has been widely destroyed. This unit, named Piedras Grandes, consists of large blocks of andesites with amphibole phenocrysts set in a welded ashy matrix. The Piedras Grandes unit is followed by the Soncor eruption (26.45±0.5 kyr ago, dated by radio carbon geochronology; Gardeweg et al., 1998), the largest explosive eruption of the volcano, which produced 10–15 km3 of amphibole-bearing andesitic-to-dacitic pyroclastic flow deposits and large Plinian fallout deposits.
Stage III (22.3–9.3 kyr ago) began with the formation of the andesitic and dacitic stratocone on the western side of the recent location overlaying the Soncor eruption vent. This western cone is composed of thick porphyritic, amphibole-free silicic-andesite-to-dacite lavas and small andesite scoria flow deposits.
Finally, Stage IV began 9.2 kyr ago with the Tumbre andesitic pumice fall and scoria flow eruption, shifting the active center again eastwards to the currently active part of the volcano. The deposits of this eruption consist of moderately vesicular basaltic-andesite-to-andesitic scoria clasts and volcanic bombs, which are exposed on the northwest and west of the volcano. The most significant eruption from Stage IV was the amphibole-bearing Tumbre–Talabre lava (7.1 kyr ago), which extends 8 km to the northwest of the volcano. This andesitic blocky lava flow was truncated by the formation of the first of three deep collapse craters that document a progressive westward migration of the active volcanic center.
Since 1984 the activity of the volcano has been intensively monitored and described as a new eruptive phase with four recurring periodic cycles (3–4 years), summarized by Matthews et al. (1997). Cycles involve growth and subsidence of lava domes and the crater system, followed by explosive events in September 1986 and February 1990, with the last major explosive eruption occurring on 18–20 April 1993, which generated an eruption column of 5–2 km height and pyroclastic flows reaching up to 9 km from the vent on the northwestern side of the volcano. The overall 1993 eruption produced more than 0.1 km3 of volcanic material (Matthews et al., 1997). Numerous smaller eruptions occurred after 1993 and are listed by Tassi et al. (2009) and Gaete et al. (2020). Presently the activity of Lascar volcano is restricted to a permanent, sustained plume that is fed by the fumarolic field in the active crater (Tassi et al., 2009). As of today, the last eruption occurred on 10 December 2022.
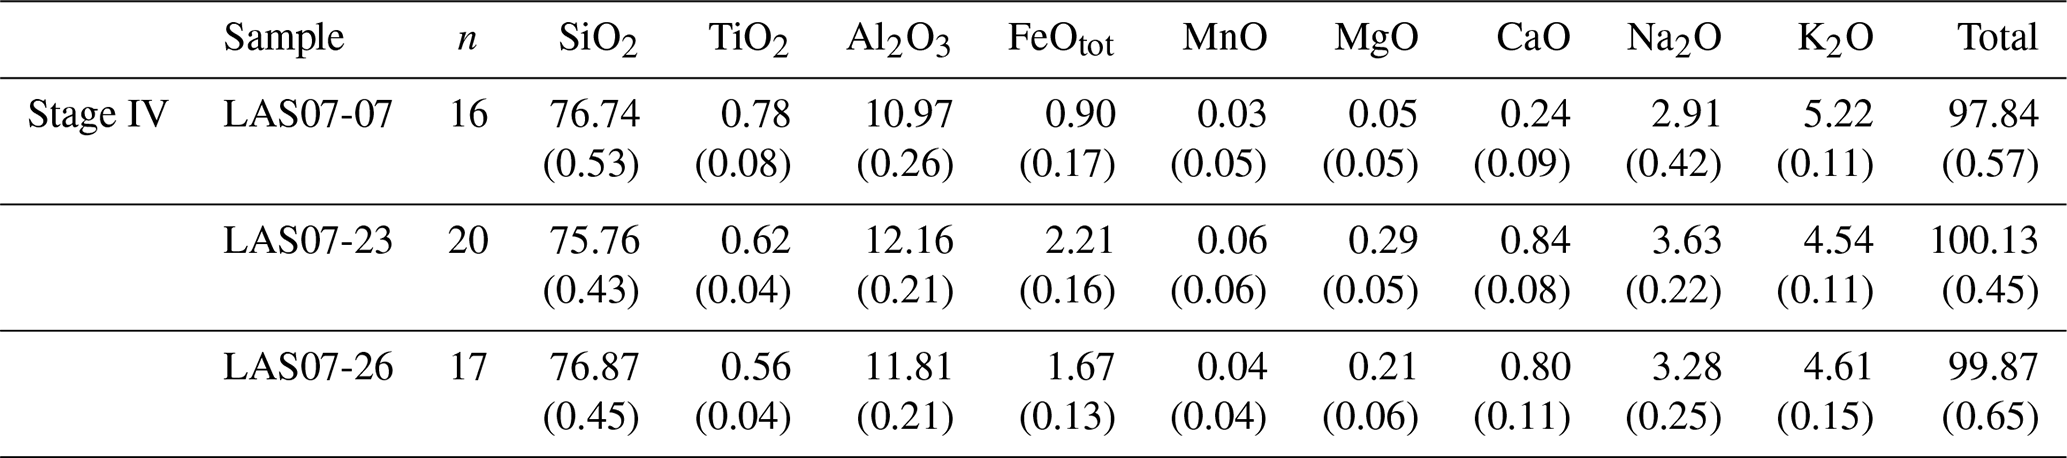
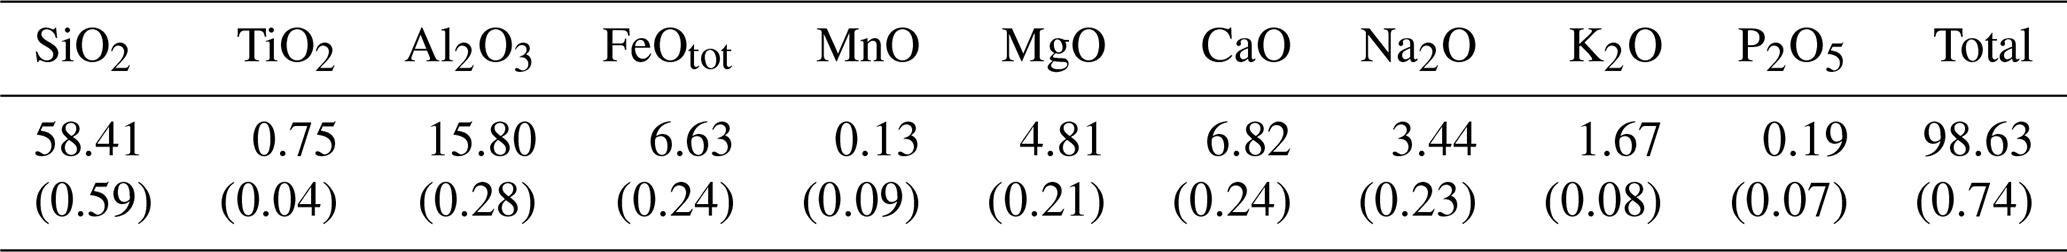
Table 1Whole-rock major (determined by X-ray fluorescence, XRF) compositions of Lascar (Stage I to Stage IV) lavas. All iron is expressed as FeOtotal.
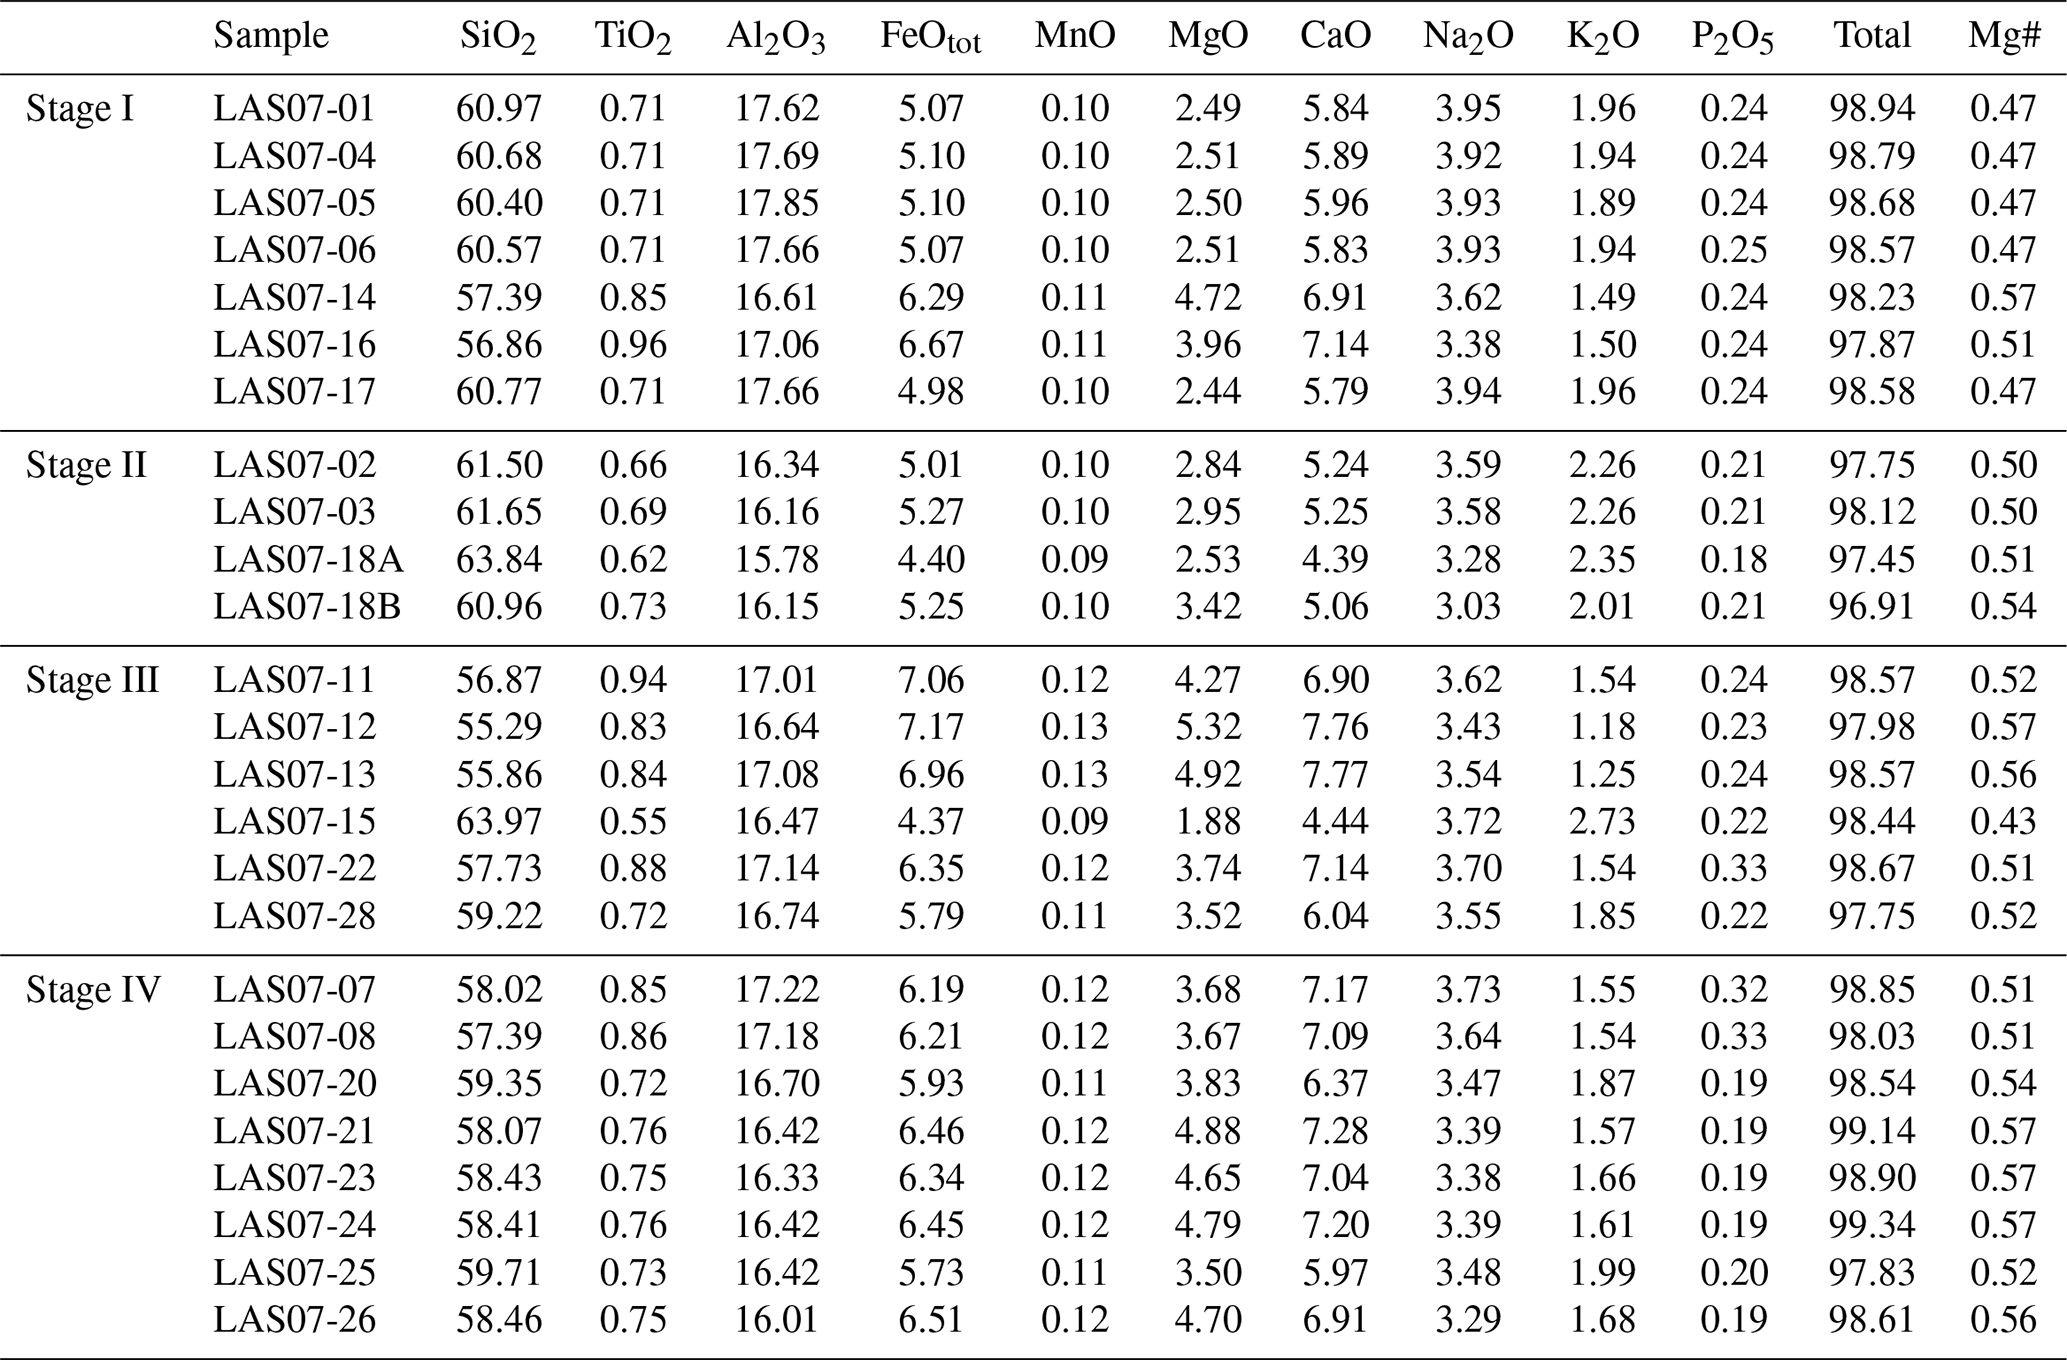
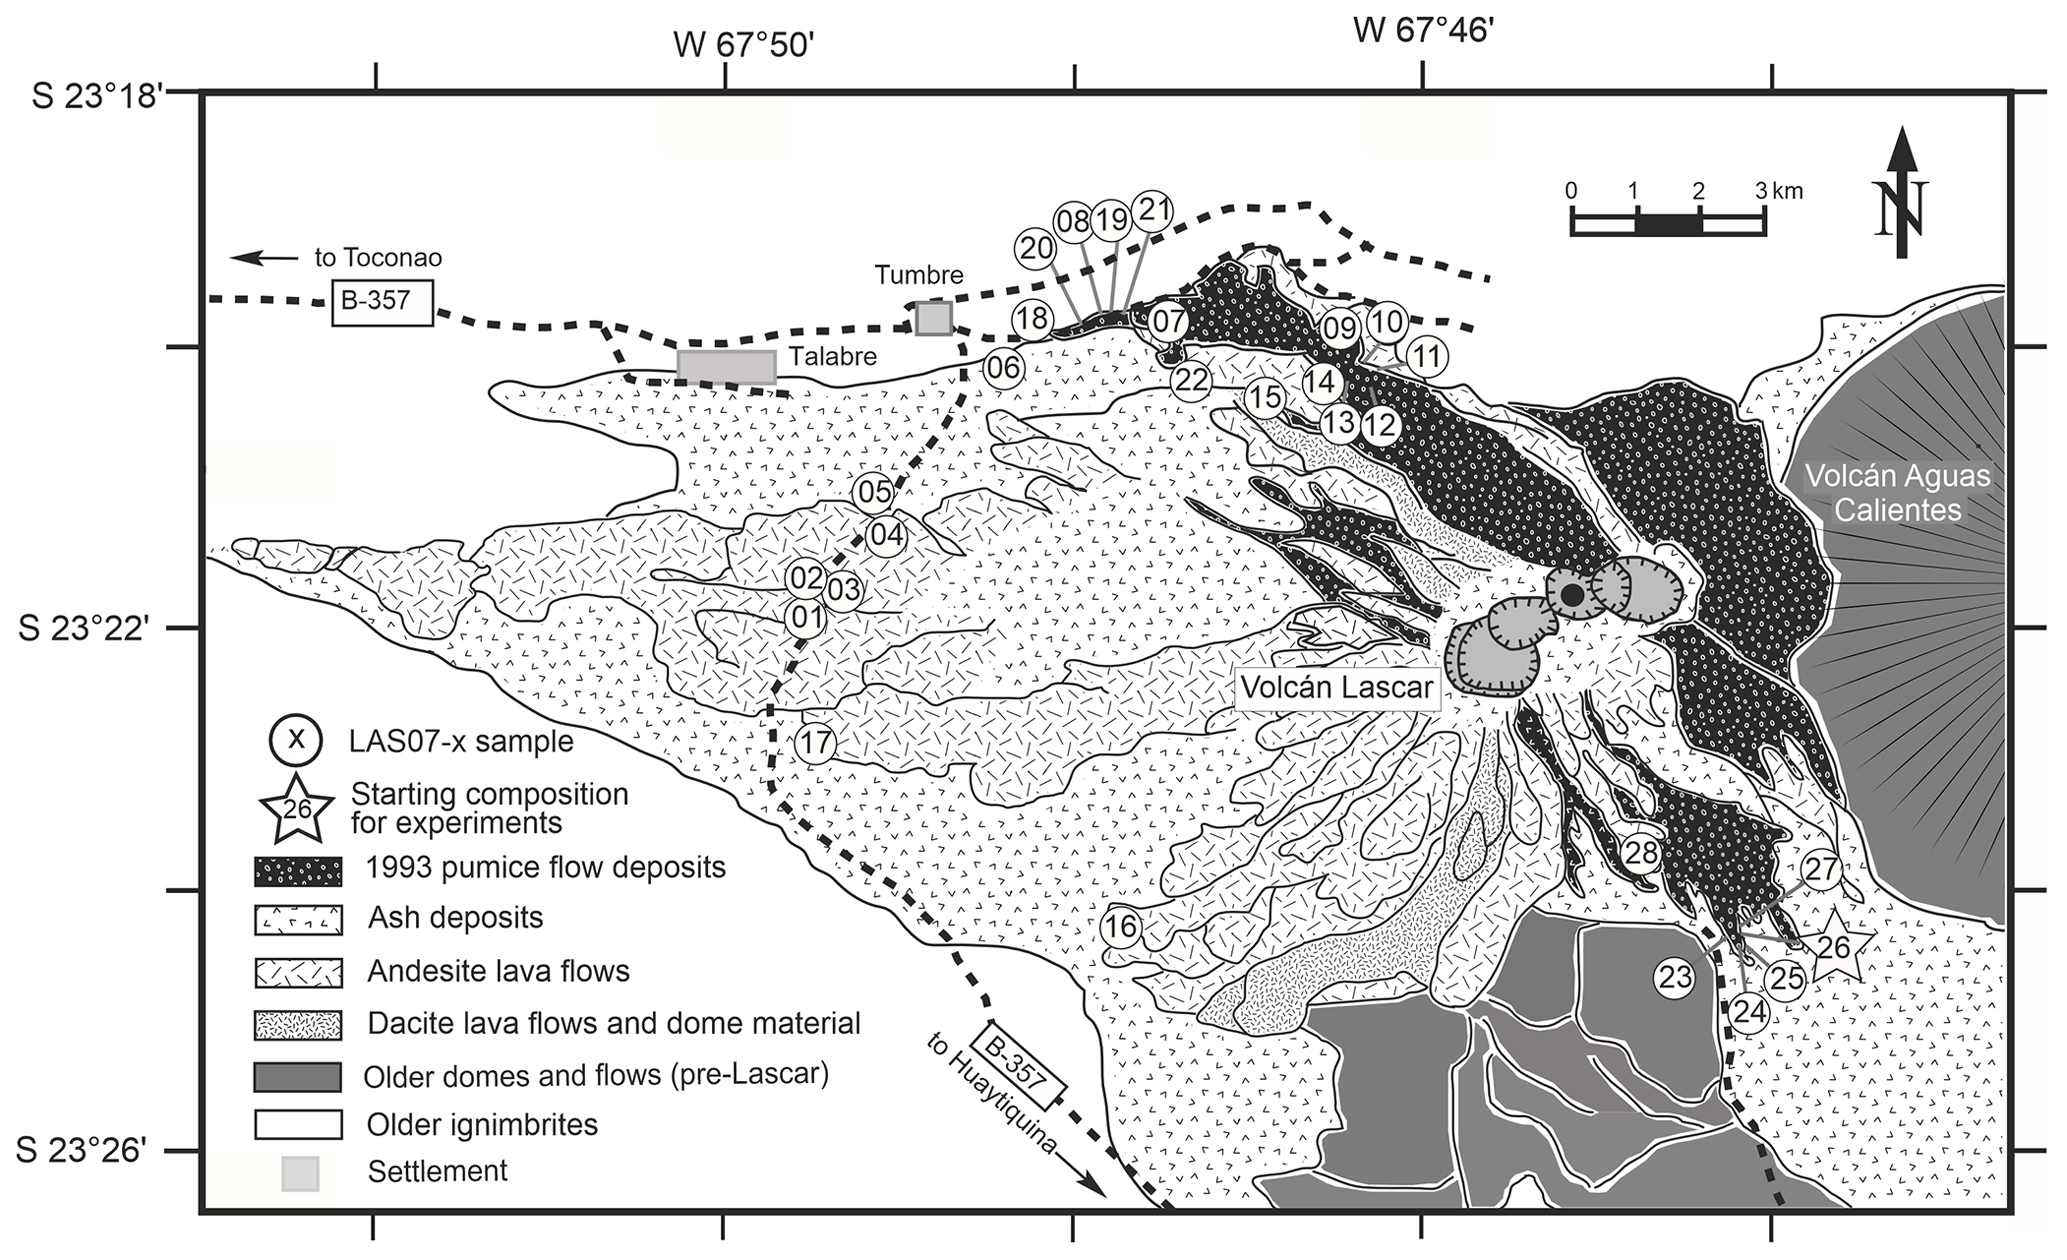
Figure 1Simplified geological map of Lascar volcano and sample sites (drawn after satellite images and field observations).
3.1 Bulk-rock compositions
Twenty-five rock samples were used to characterize the four stages of Lascar eruptive history (Fig. 1, Table 1). The sampled materials are representative of lava flows as well as of different types of pyroclastic rocks. Major element and trace element concentrations were determined by XRF and inductively coupled plasma mass spectrometry (ICP-MS) analyses. The major element compositions are listed in Table 1. The trace element concentrations and details on analytical methods can be found in the Supplement provided by Mamani et al. (2010).
Compositions of the samples vary from medium-K andesites (55.6 wt % SiO2, 5.4 wt % MgO) to dacites (65.2 wt % SiO2, 2.6 wt % MgO). As shown in the binary diagrams in Fig. 2, only Stage II covers the whole range of compositions between the most primitive and the most evolved end-members. The Stage I rocks have SiO2 contents between ∼58 wt % and 62 wt % (Fig. 2) and MgO contents between 4.8 wt % and 2.3 wt %, respectively. Eruptive materials from Stage II (this study and a large number of samples collected by Matthews et al., 1999) cover the largest SiO2 and MgO range. To our knowledge, the most primitive material collected from Lascar (lowest SiO2 content of ∼56 wt %, 5.5 wt % MgO to 6 wt % MgO) was erupted during Stage II (only few samples) and especially during Stage III. These MgO-rich samples from Stage III, named Manquez agglutinate (Gardeweg et al., 1998), are interpreted as the late phase of the Tumbre eruption or may be associated with the late cone on the eastern margin of the western stratocone. Rocks from Stage IV have a relatively narrow compositional range between ∼58 wt % SiO2 and ∼61 wt % SiO2 (3.5 wt % MgO–5 wt % MgO).
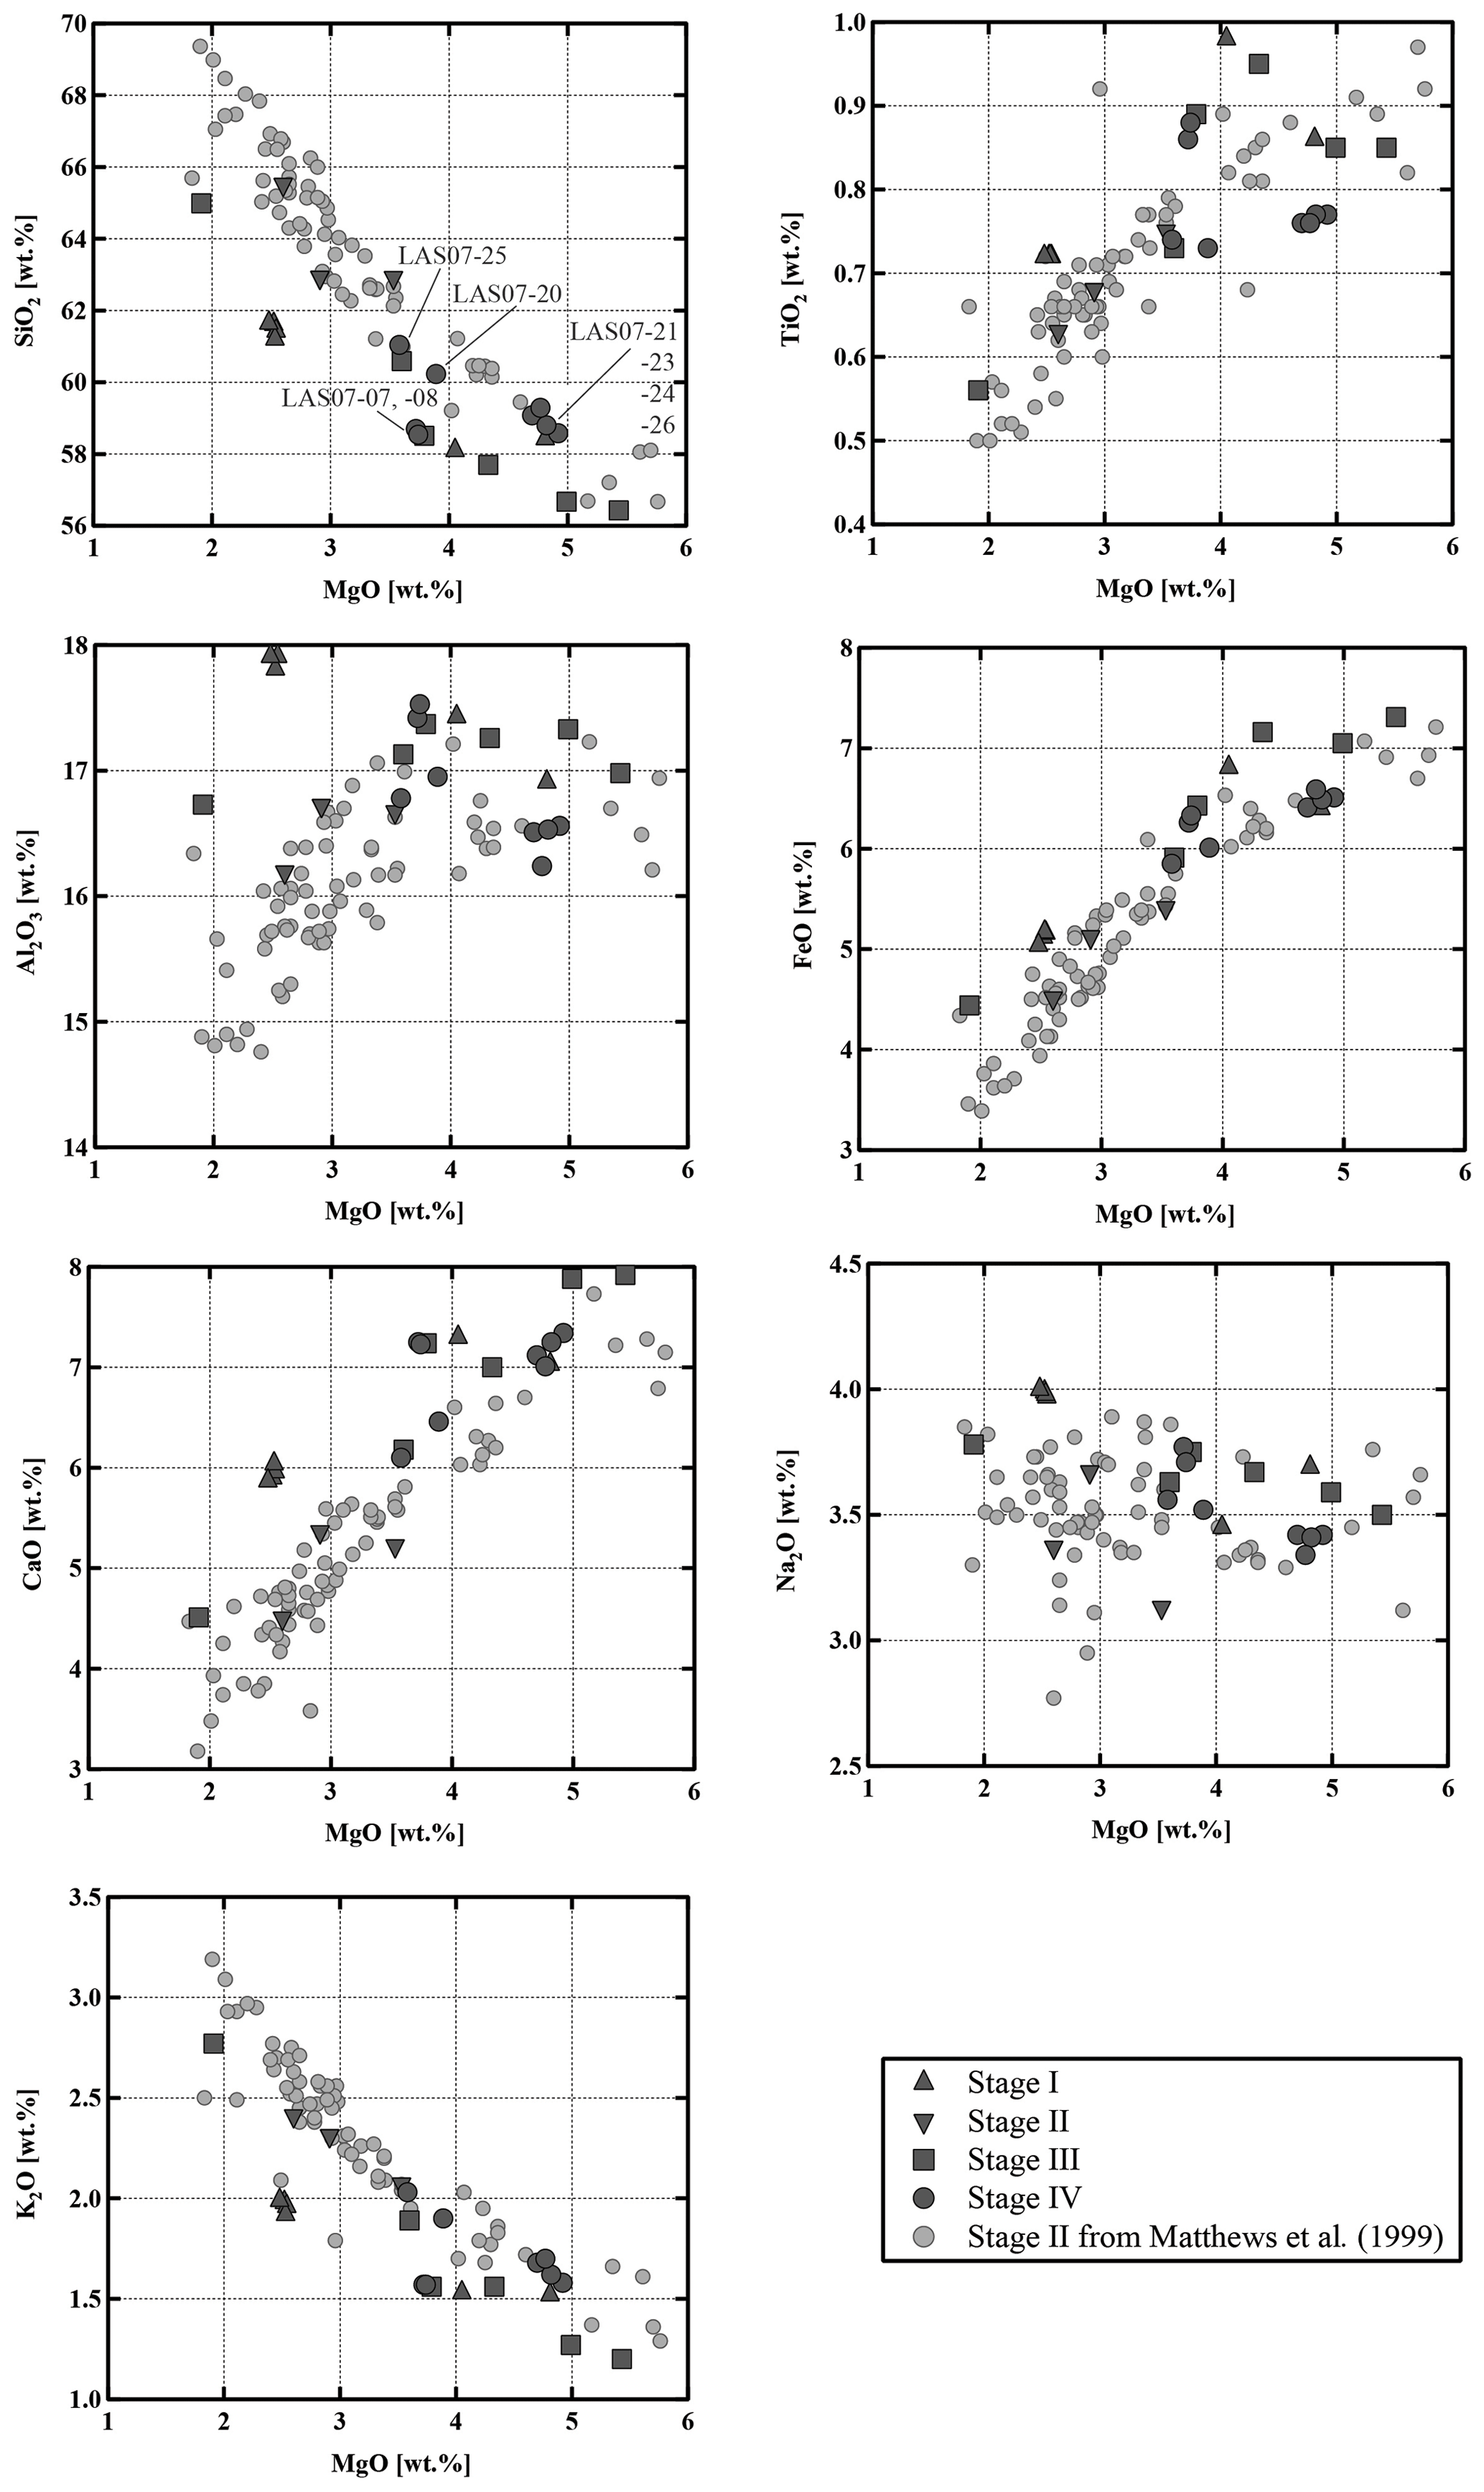
Figure 2Major element composition of Lascar volcanic rocks from all four stages plotted against MgO. Also shown are detailed bulk-rock data from Stage II from Matthews et al. (1999). All data points normalized to 100 %.
3.2 Mineral abundances and compositions of Stage IV volcanic rocks
In the following section, we focus on further investigations of rocks from Stage IV (samples LAS07-23, LAS07-24, LAS07-26, LAS07-07) to be able to make possible statements about the current state of the magmatic system beneath the volcano.
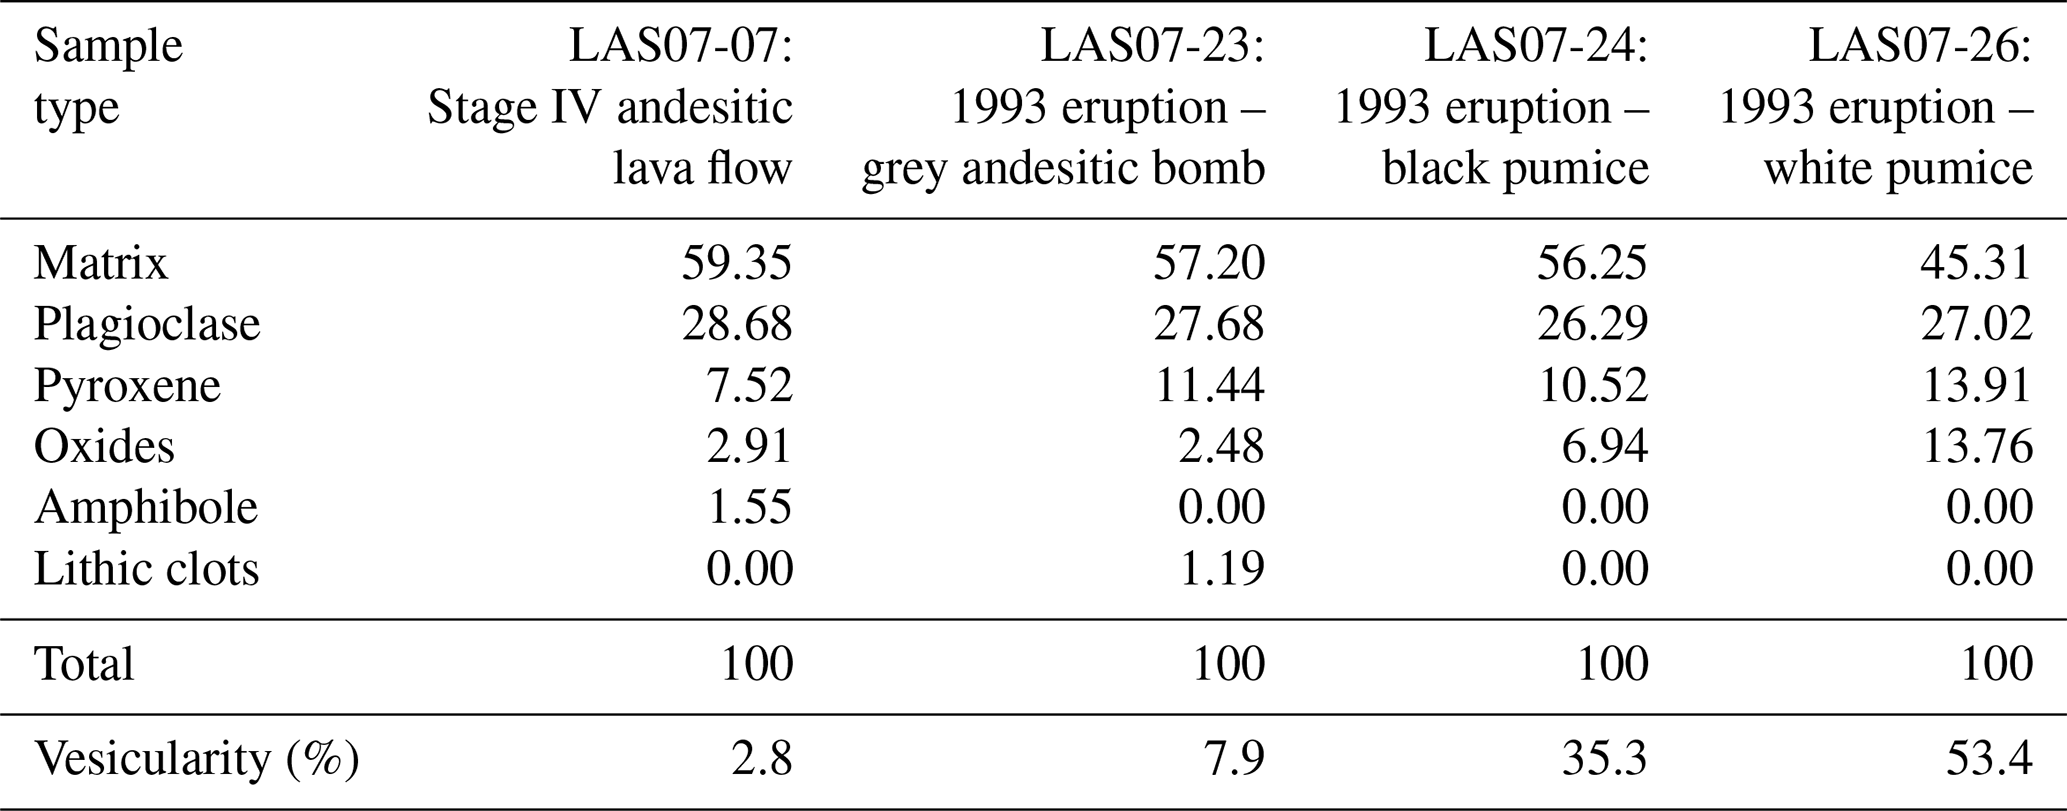
Table 2Modal phase proportions in Lascar's Stage IV rocks gained from point counting (recalculated on a bubble-free basis).
3.2.1 Modal proportions
A modal analysis of minerals (calculated on a bubble-free basis) in three samples from the 1993 eruptive material (Table 2; samples LAS07-23, LAS07-24, LAS07-26) and in one older sample (LAS07-07; 7.1 kyr old) from Stage IV was carried out by point counting on selected thin sections. The minerals were determined with a step size of either 300 or 350 µm (two directions), resulting in a number of points ranging from ∼6000 to ∼9000. Approximately 40 % by area of the thin sections is composed of phenocrysts. Results given in Table 2 show that plagioclase, followed by clinopyroxene and orthopyroxene, composes the main mineral assemblage. The proportion of plagioclase and pyroxene phenocrysts is ∼27 %–28 % and 7 %–14 %, respectively (surface area). The oxide proportions can vary strongly from ∼2.5 % up to 14 % by area.
Additional minerals present in the natural rocks are accessory apatite microphenocrysts, as well as very rare olivine (<0.1 % by area) in only a few samples. Millimeter-sized patches of lithic clasts can be found in some thin sections. Amphibole is not present as major phenocrysts in 1993 rocks but can be found with various breakdown textures in two older samples from Stage IV (LAS07-07, LAS07-08; Tumbre–Talabre lava, 7.1 kyr old, Table 2).
It is worth mentioning that the modal abundance of amphibole in Lascar rocks (if present) is usually very small (maximum of 8 % by area calculated on a vesicle-free basis in the Piedras Grandes unit). Samples of older eruptive stages (Stage I to Stage III), in particular the Piedras Grandes and Soncor eruptions (21.0 kyr), contain amphibole and biotite in some dacitic products.
Amphibole phenocrysts are ragged and partially or wholly replaced to pyroxene and Fe–Ti oxides (Matthews et al., 1994, 1999).
3.2.2 Mineral compositions
Mineral compositions were determined by electron probe microanalyzer (EPMA; see analytical conditions below). Plagioclases from the 1993 eruption have a wide range of anorthite contents between An37 and An80 but with a clear maximum between An50 and An65 (see Fig. S1 and Table S1 in the Supplement). Rarely sieve texture in corroded, partially resorbed plagioclase cores can be observed. Orthoclase components in the analyzed plagioclases range between ∼ Or0.5 and ∼ Or4.5, with most of the compositions having ∼ Or1.0. Pyroxenes from Stage IV have a relatively narrow range of compositions. Orthopyroxenes are clinoenstatite with enstatite components between En62 to En83 and Wo (wollastonite) of <5 and with typical Mg numbers (Mg# =100 Mg/(Mg+Fe), in mol %) in the range of 66–86. Clinopyroxenes are all high-Ca augites with Mg# in the range of 71–89. The enstatite component ranges from En39 to En53 with wollastonite values from Wo38 to Wo45. It can be observed that pyroxenes from the lava flow samples (LAS07-07) have a narrow compositional field with En and Wo values varying by less than 5 mol %, whereas samples from volcanic ejecta erupted in 1993 reveal the largest variation in pyroxene end-member components (up to 20 mol %). In order to check whether the clinopyroxenes exhibit strong chemical zoning, we selected three representative crystals for each of the samples LAS07-07, LAS07-23, and LAS07-26 and carried out profile measurements on the microprobe. The results are listed in Table S9. Overall, the pyroxene profiles show a variation in Mg# of less than ±5 mol % for each selected crystal. Among the nine analyzed crystals, four had no significant zoning with an average Mg# of ∼80. The other five minerals show more compositional variations but without systematics, except that the rims have always Mg# in the range of 0.80–0.84. Some crystal cores have a higher Mg# (up to 0.9), whereas one has a slightly lower Mg# (down to ∼0.75). The different compositional zonings demonstrate that there is most probably different populations of clinopyroxene in the magmas and that the clinopyroxenes have a complex history and may originate from different magma reservoirs (or different parts of one reservoir). However, the identical rim compositions indicate that all the phase were re-equilibrated with a common surrounding for a short duration prior to eruption. The homogeneous rim composition also allows us to apply two-pyroxene thermobarometry based on the composition of the rims of pyroxene crystals.
Rims of adjacent orthopyroxenes and clinopyroxenes from different types of volcanic ejecta were analyzed to determine temperatures (and pressures) of the last equilibration using the model of Andersen et al. (1993) for temperature (Fig. S2 and Table S2) and the model of Putirka (2008) to estimate temperatures (Eq. 36) and pressures (Eq. 38) (see Fig. 3 and Table S3). Most of the clinopyroxenes have Mg# close to 0.8, which confirms the observation made in clinopyroxenes selected for compositional profiles (see above). In addition, the Mg# number of the large majority of the coexisting orthopyroxenes and clinopyroxenes differs by less than ±2 mol %–3 mol %, indicating that they were close to equilibrium with each other (see also Mg# of co-existing pyroxenes obtained experimentally, Table S6). Temperatures calculated after Andersen et al. (1993) give average values between 980 °C for a pumice sample (LAS07-26) and 1030 °C for an andesitic lava flow sample (LAS07-07). Average temperatures calculated with the model of Putirka (2008) are between 940 °C and 1010 °C, with maximum values of 1050 °C. These values are significantly lower than those determined by Robidoux et al. (2020) based on mineral–liquid pairs. Most pressures determined using this model are between 200 and 550 MPa, with two frequency maxima around 300 and 500 MPa. Maximum determined pressures are up to 1 GPa. The P–T range is not identical for each sample. For example, the pressures obtained from the white-pumice sample (P>550 MPa; LAS07-20) are higher on average when compared to pressures determined from the black-pumice sample (mostly 200 to 400 MPa; LAS07-08). The bulk compositions of these two samples are not very different, but for a similar MgO concentration (3.7 wt %–3.8 wt %) the SiO2 content is ∼2 wt % higher in the white pumice when compared to the black pumice (Table 1). It can be noted that pressures >500 MPa were also estimated by Robidoux et al. (2020). In general, most pyroxene pairs predicting high pressures (>500 MPa) have the lowest Mg# values (∼0.75–0.74 for clinopyroxene), whereas a large population of pyroxenes predicting pressures between 200 and 400 MPa have a higher Mg# (∼0.80–0.79 for clinopyroxene). Since the large majority of pairs yield a low pressure range and since the compositional profiles indicate that the high Mg# of ∼0.80 may result from a last re-equilibration, the low-Mg# pyroxenes predicting higher pressures may be inherited from deeper reservoirs and may not have been re-equilibrated in a low-pressure reservoir prior to eruption.
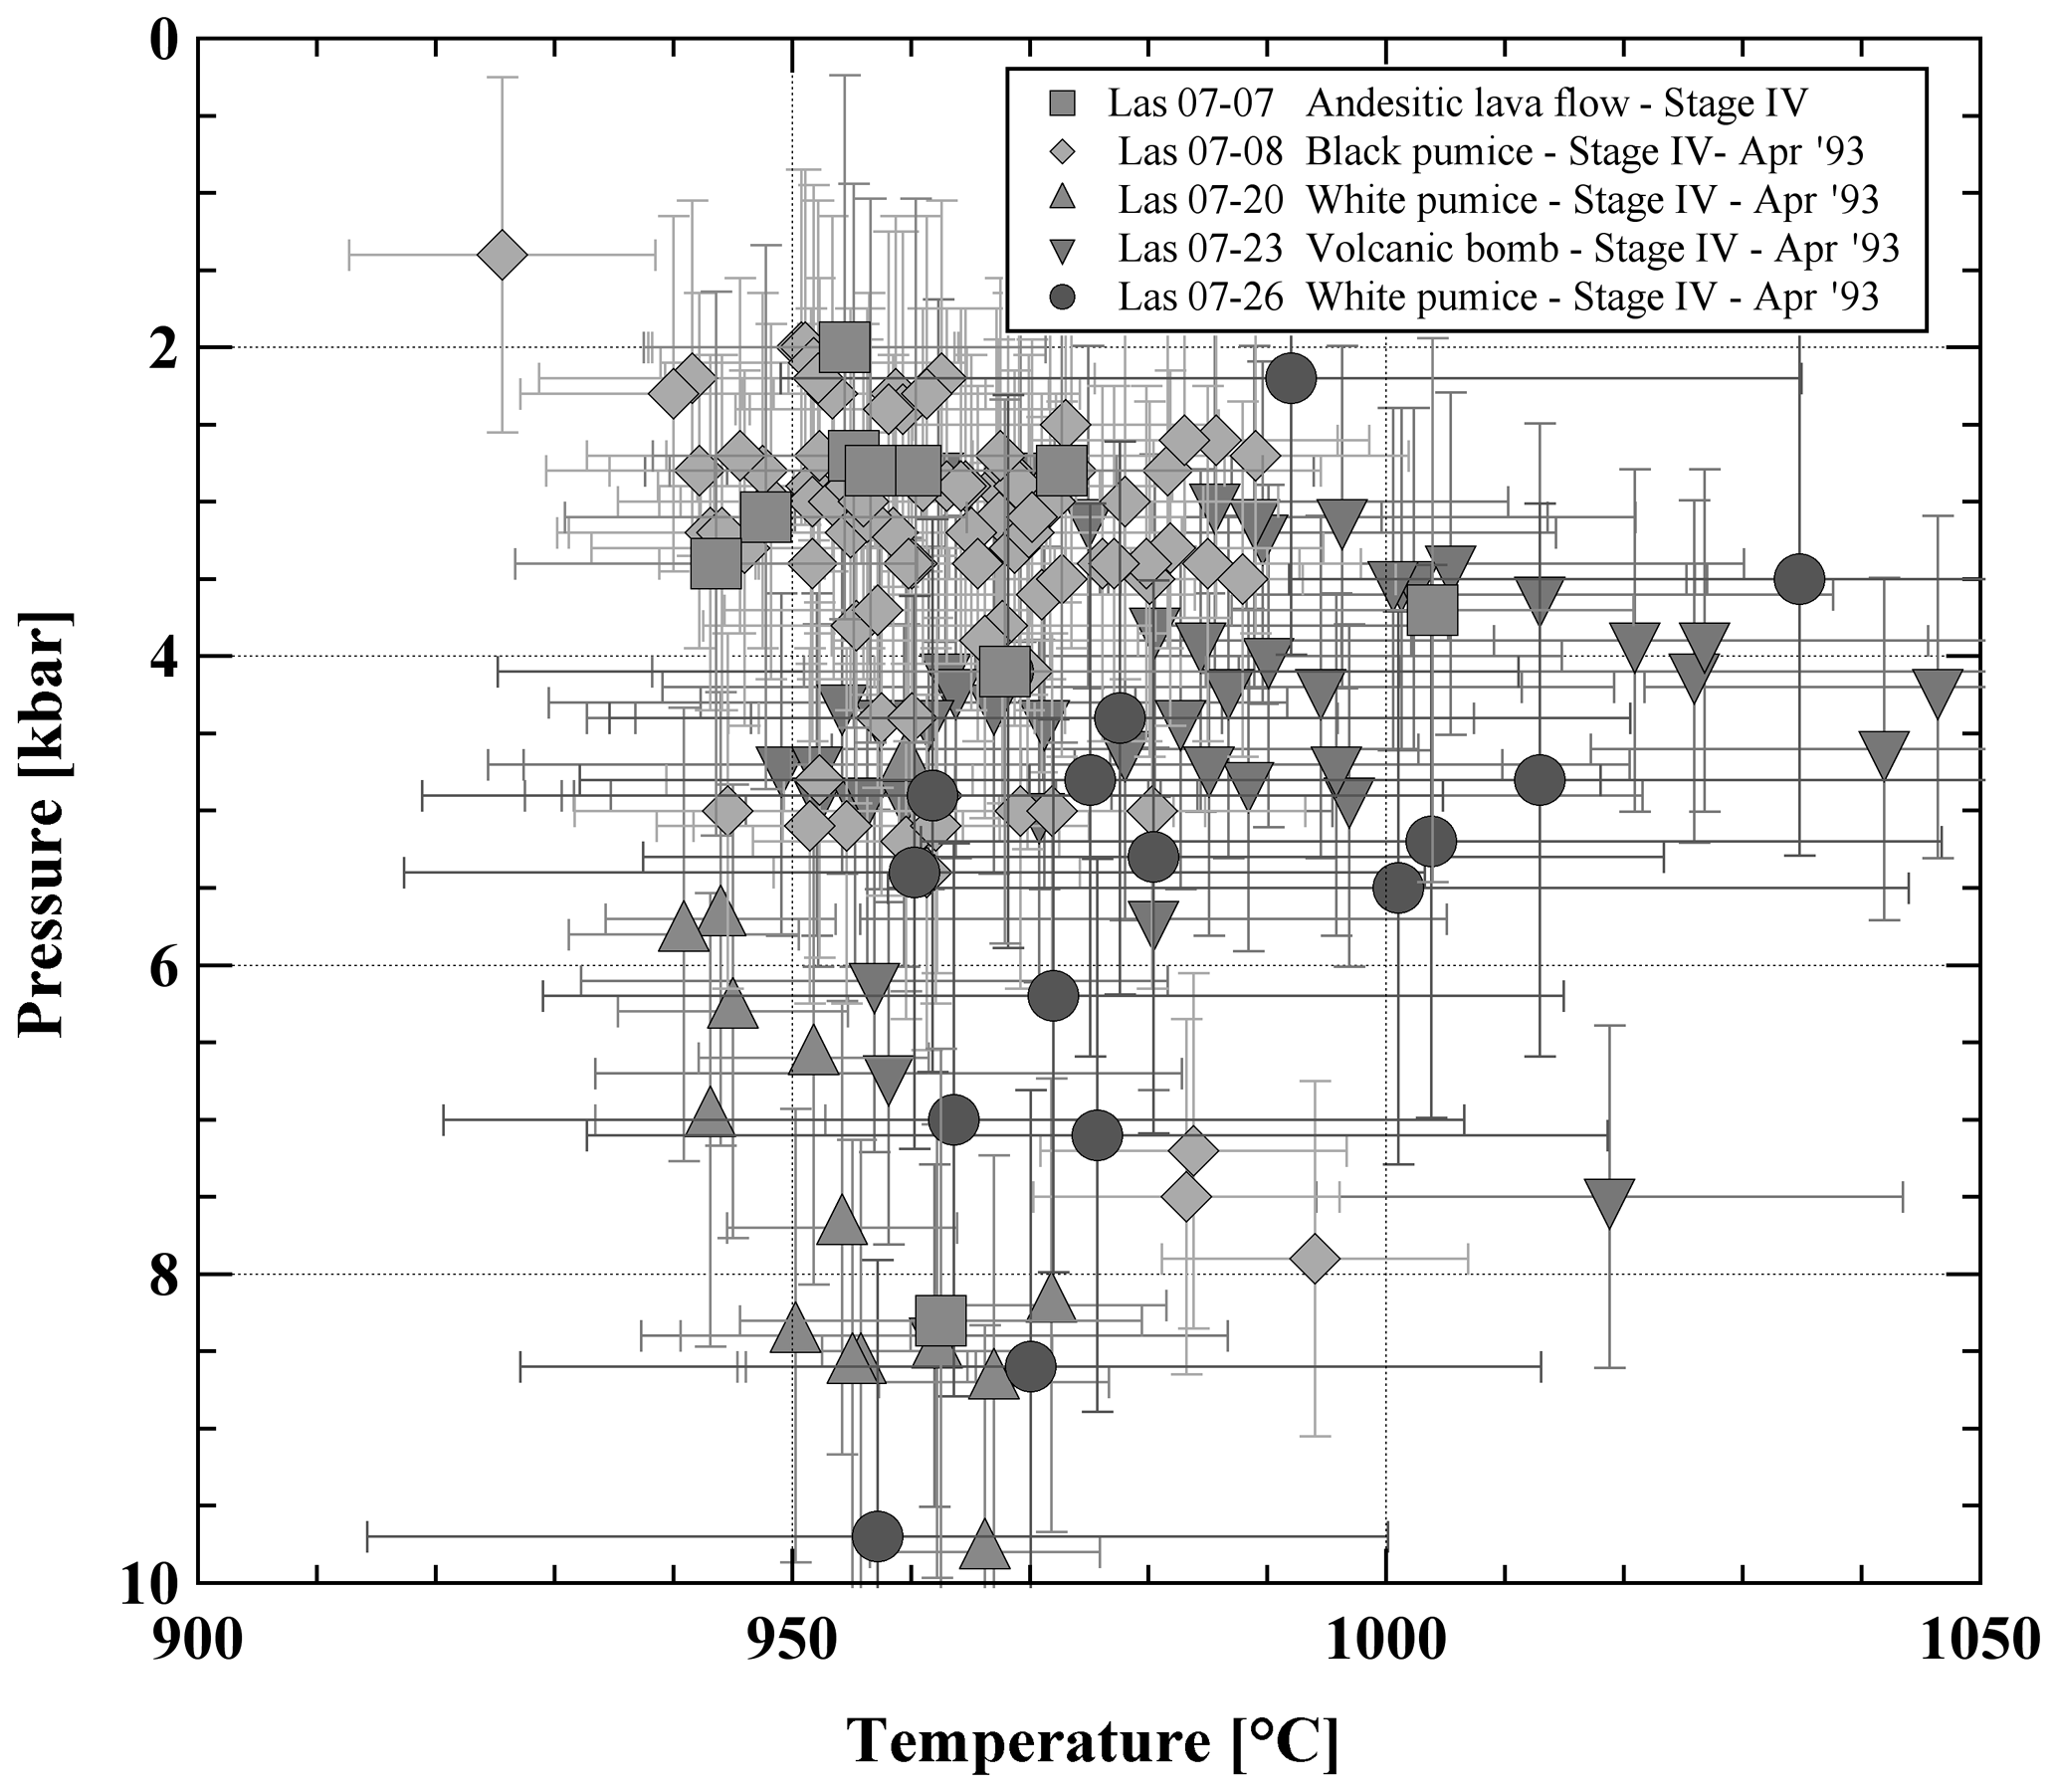
Figure 3Pressure–temperature (P–T) estimates for representative Stage IV lavas. P–T estimates are obtained using the orthopyroxene–clinopyroxene (Opx–Cpx) geothermobarometer (Eq. 36 for T and Eq. 30 for P) from Putirka (2008). Only results which are in the Kd(Fe–Mg) (partition coefficient) confidence interval (1.09±0.14) recommended by Putirka (2008) are shown.
Magnetite and an additional Ti-rich oxide phase are present in the five investigated samples. Small oxides sometimes show exsolution lamellae, whereas large phases are homogeneous. Only homogeneous phases were selected for microprobe analyses, and oxide pairs used for oxythermobarometry were always in contact with each other. In two investigated samples (LAS07-23 and LAS07-27) the Ti-rich oxide phases contained ∼40 wt % TiO2 and are clearly ilmenite (Table S4). In samples LAS07-07, LAS07-08, and LAS07-20, the TiO2 is lower, varying between ∼29 wt % and 36 wt %. Strictly, this phase is not ilmenite, but it still belongs to ilmenite–hematite series. In our samples, this phase always coexists with magnetite. Oxygen fugacities and temperatures were calculated according to the method of Andersen (1985) and Andersen and Lindsley (1988), applying the ILMAT scheme of Lepage (2003), and are shown in Fig. 4 (see Table S4 for details). Magnetite and ilmenite were checked for equilibrium using Mg–Mn partitioning criteria after Bacon and Hirschmann (1988), and only assemblages with equilibrium compositions, low compositional variability, and the absence of exsolution lamellae were used following the suggestions of Hou et al. (2020). The calculated logfO2 is in a relatively narrow field, ranging from ∼ QFM+1 to QFM+2, with temperatures between 880 and 940 °C (QFM is quartz–fayalite–magnetite oxygen buffer). Considering that only two samples (LAS07-23 and LAS07-27) contain end-member ilmenite compositions, the calculated logfO2 values using ILMAT are probably the most reliable for these samples, with values in the range of ∼ QFM. One of these samples was selected as staring material for the experiments (LAS07-23).
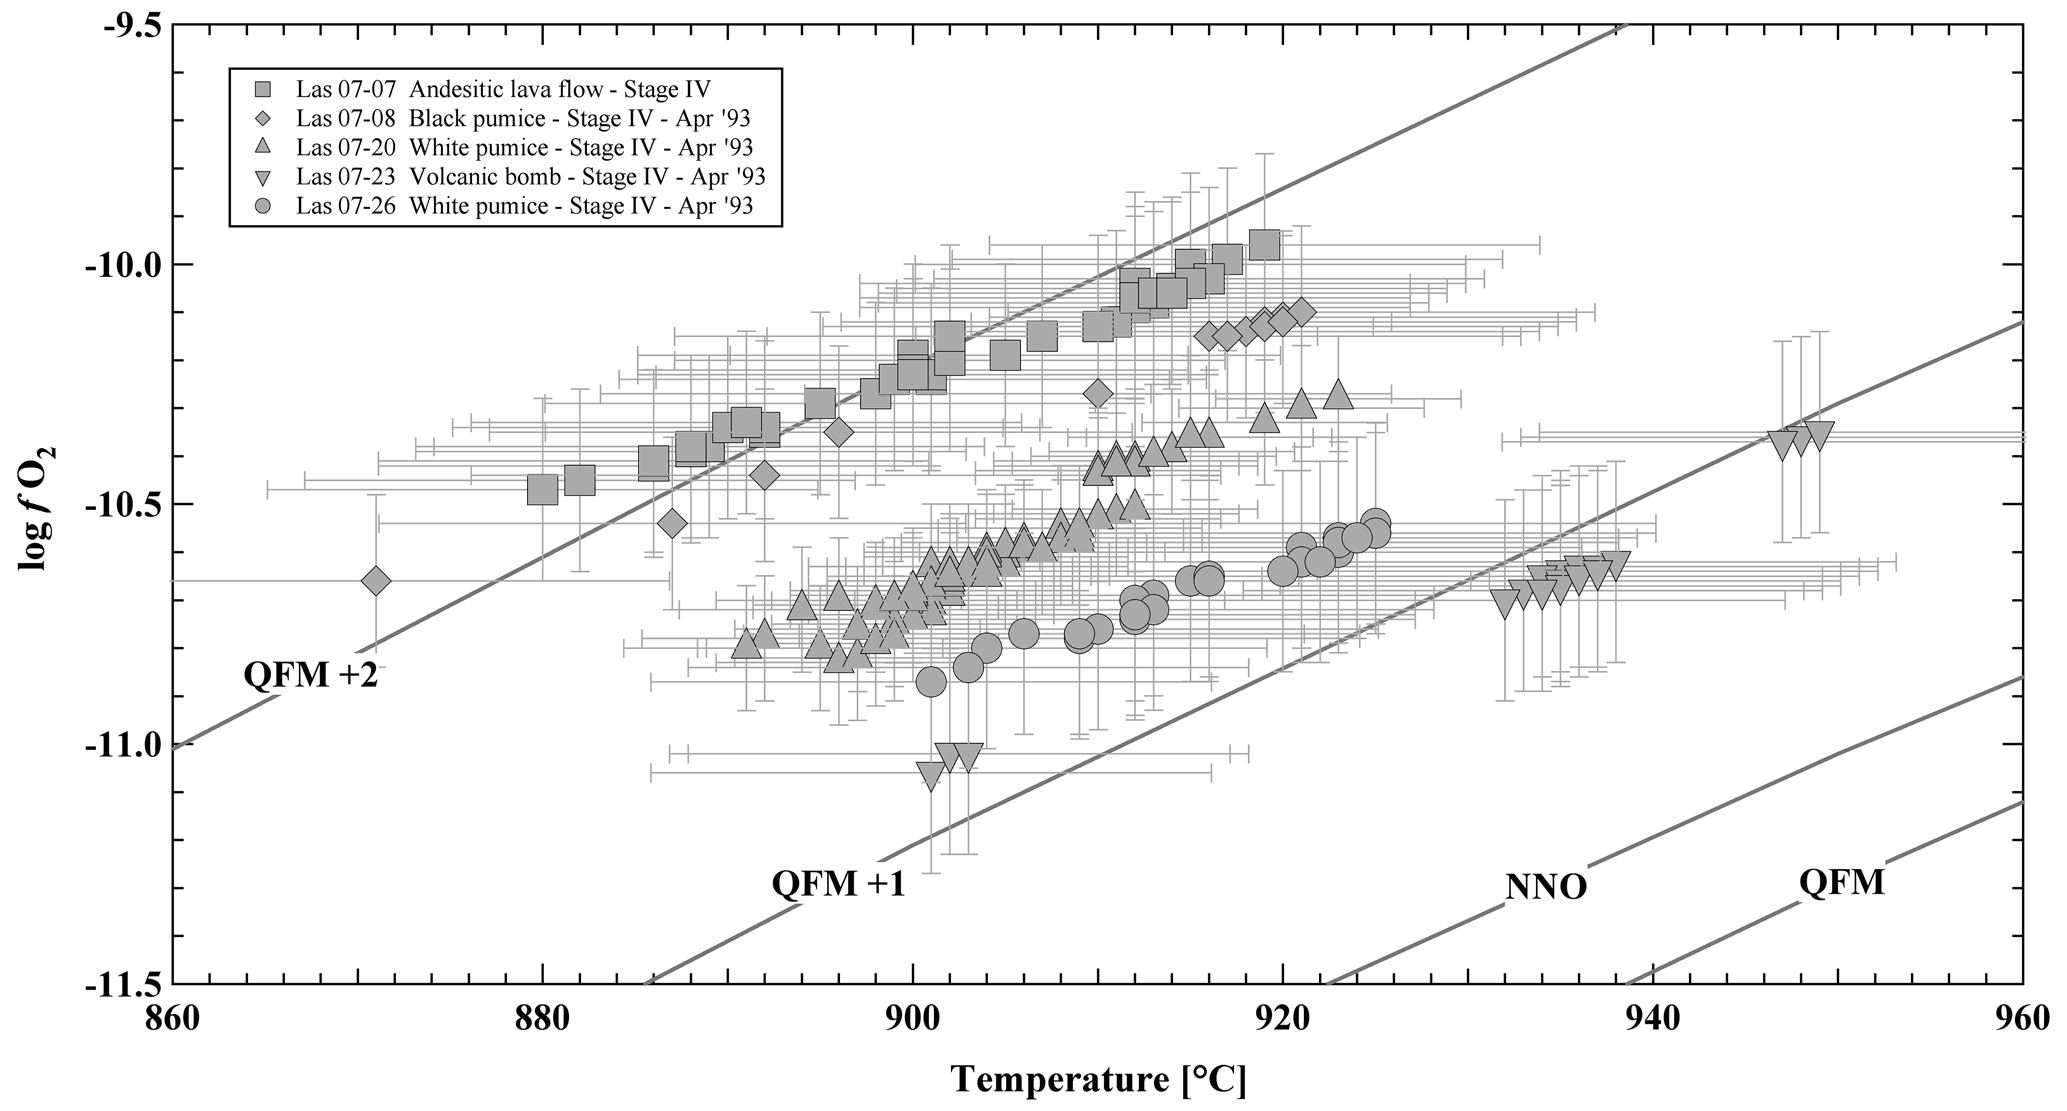
Figure 4Oxythermobarometry of Stage IV Lascar volcanic rocks: log oxygen fugacity (log fO2) versus temperature, calculated from magnetite–ilmenite (Mt–Ilm) equilibria (Stormer, 1983) using the ILMAT calculation sheet (Lepage, 2003). Oxygen buffer curves (NNO: Ni–NiO, QFM: quartz–fayalite–magnetite) are taken from Frost (2018).
In summary, the applied Opx–Cpx thermobarometers yield results, which span a relatively large P–T range (Fig. 3), although only data which are in the Kd(Fe–Mg) confidence interval recommended by Putirka (2008; 1.09±0.14) were selected. Therefore, an additional approach based on the experimental determination of phase relationships at known P, T, and fO2 values was applied. Although this approach is time-consuming, it offers the advantage of bracketing the meltwater contents.
3.2.3 Melt inclusions and interstitial glass
The glass inclusions in phenocrysts of Lascar lavas and pyroclastics of the 1993 eruption were analyzed in sample LAS07-26. Phenocrysts of plagioclase, orthopyroxene, and clinopyroxene contain entrapped and well-preserved melt inclusions (MIs). To avoid possible compositional effects due to formation of daughter crystals after entrapment (e.g., Roedder, 1979), rock cylinders were drilled and treated at a high temperature to re-homogenize melt inclusions prior to analysis following the approach of Botcharnikov et al. (2008b). Homogenization was performed at a pressure of 200 MPa using a drilled cylinder of the rock sample with a diameter of 4 mm and a length of about 15 mm. The rock cylinder was placed in an Au80Pd20 capsule and was heated in an internally heated pressure vessel (IHPV) pressurized with an Ar–H2 gas mixture (see description of the apparatus below) at 1000 °C and 200 MPa for 40 min. A relatively low temperature of 1000 °C and short run duration were chosen to minimize a possible reaction between the host mineral and the trapped melts. A reducing atmosphere in the IHPV was generated to prevent the loss of H2 and therefore an oxidation of the trapped melts (e.g., Sobolev and Danyushevsky, 1994). The capsule was left open to prevent the formation of water inside the capsule at reducing conditions and to minimize physical stress on the sample. After the homogenization process, the samples were rapidly quenched with a rate of approximately 150 °C s−1. The rock cylinder was cut along the axis to access as many melt inclusions as possible.
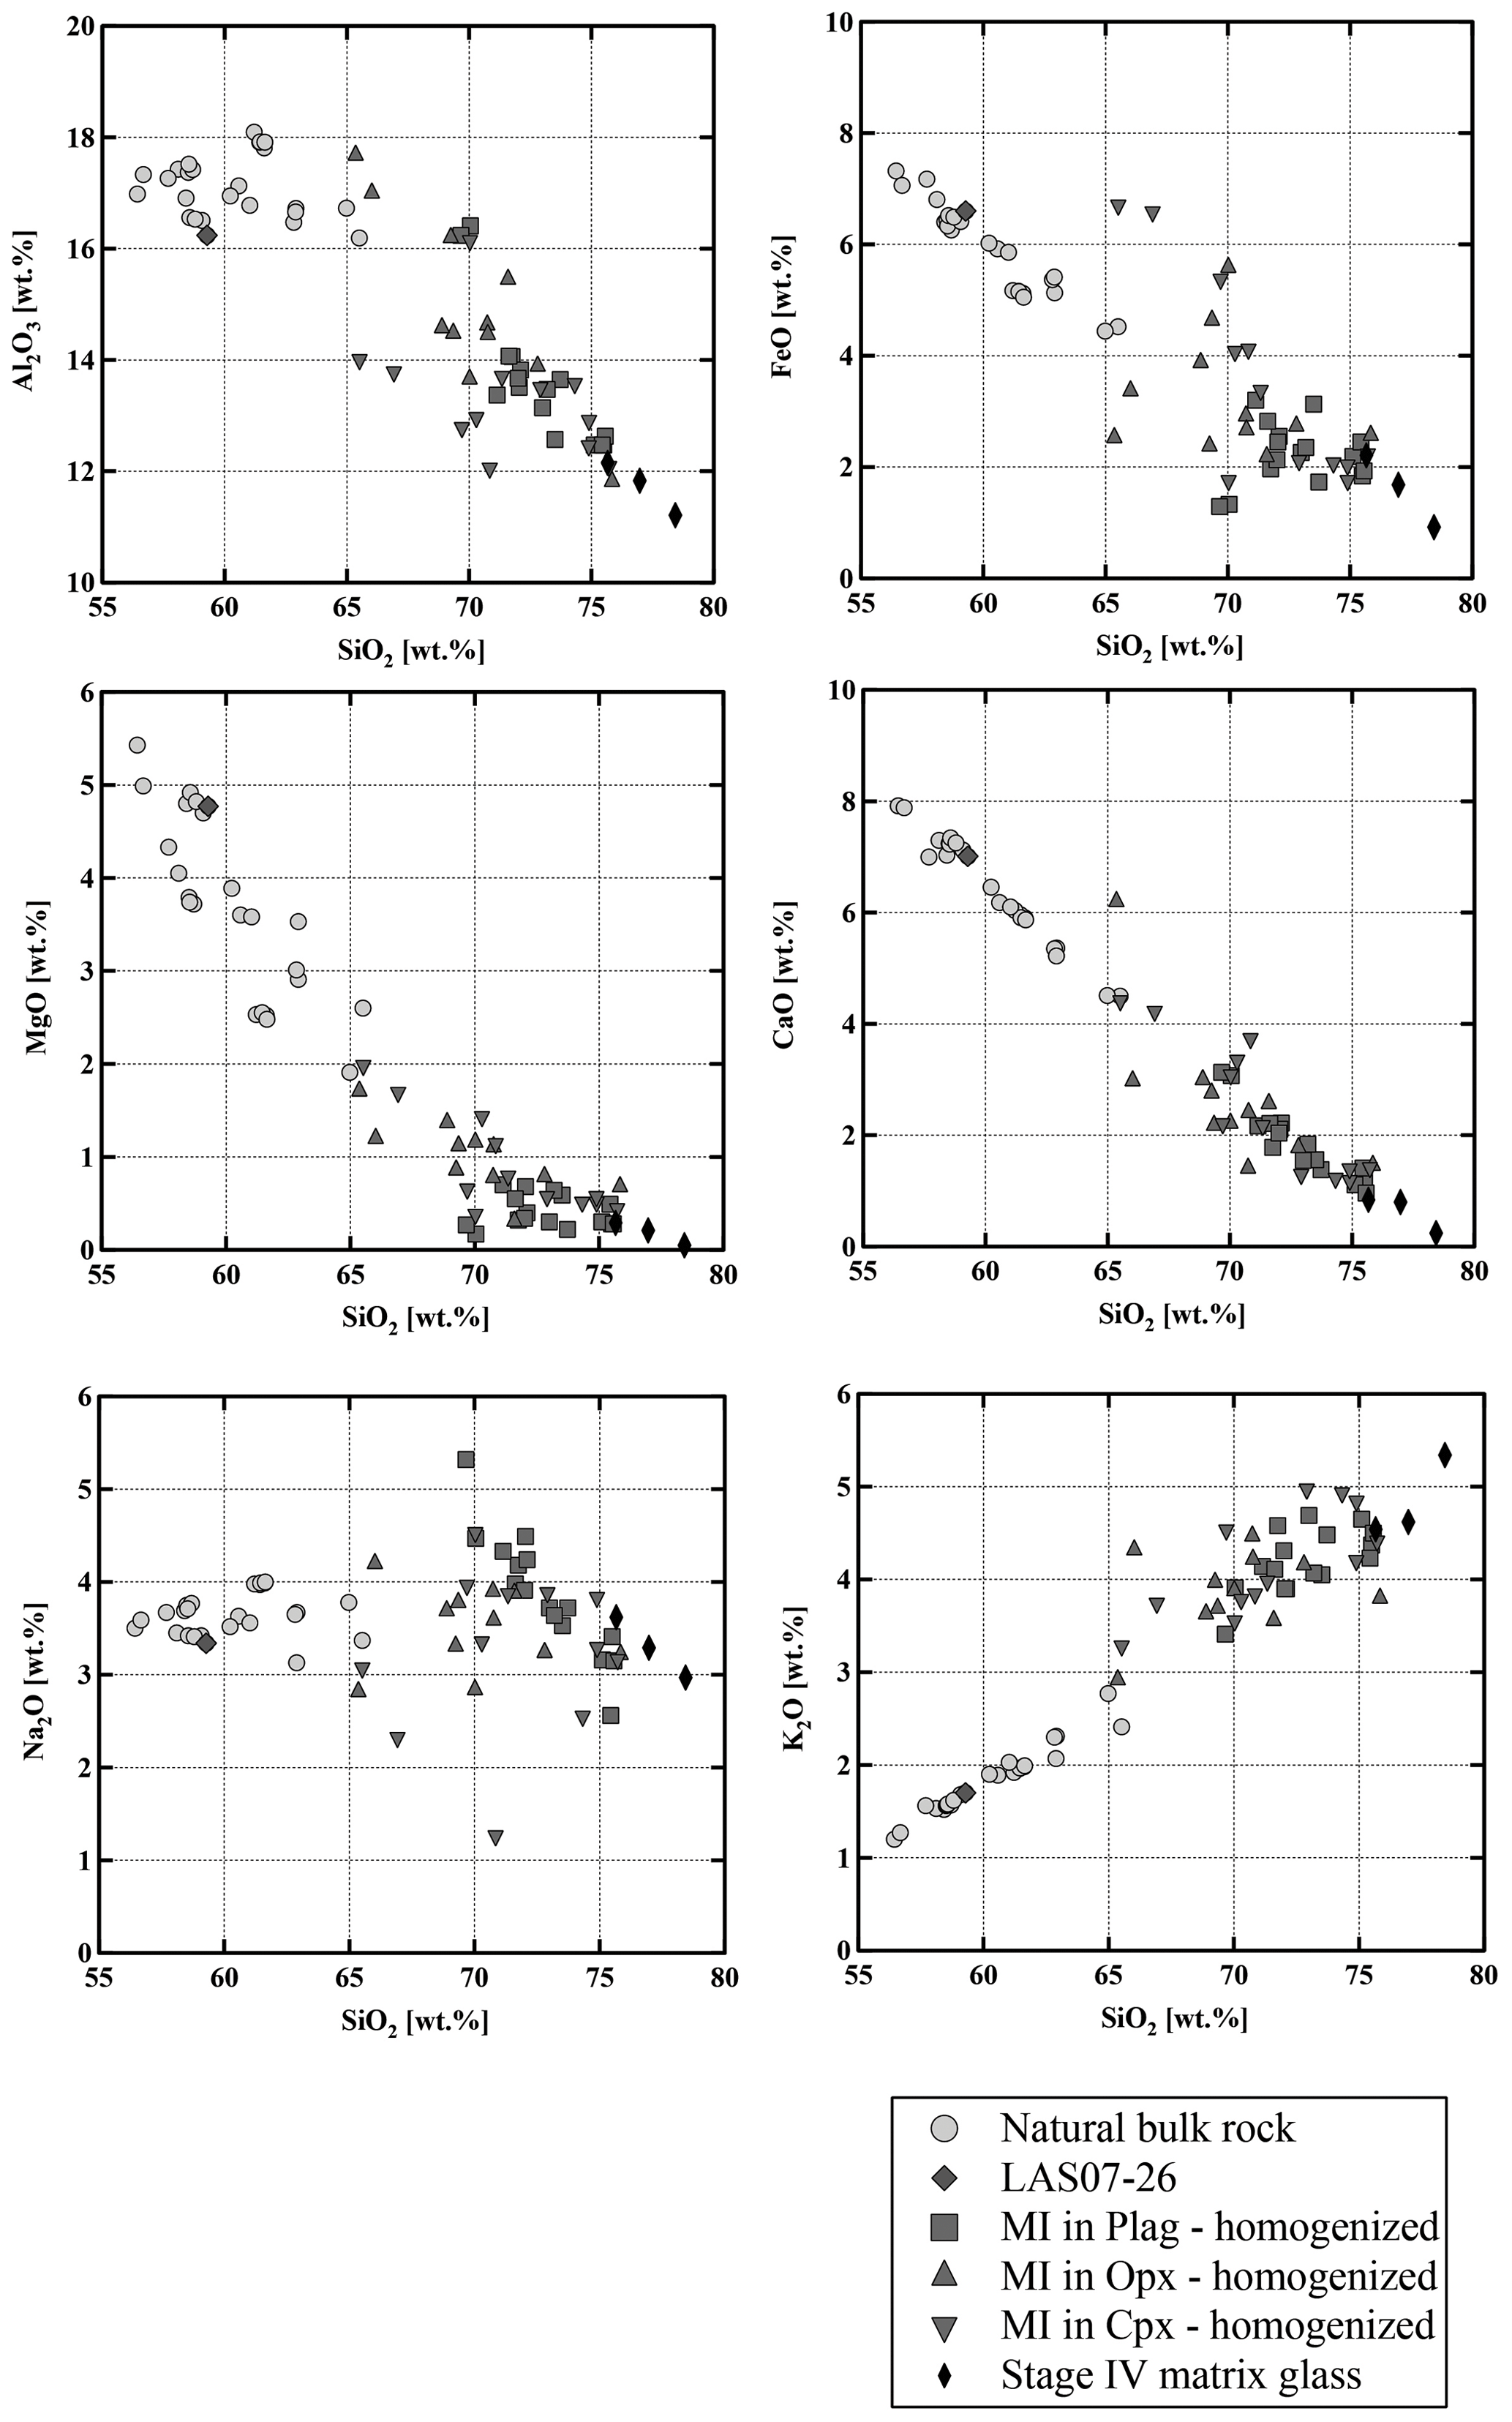
Figure 5Composition of homogenized melt inclusions in plagioclase, orthopyroxene, and clinopyroxene. Compositions of natural bulk-rock and residual matrix glass. All data points normalized to 100 %.
The composition of the glasses in the inclusions was analyzed by electron microprobe (analytical details are given in Sect. 3). Major element compositions and volatile contents are given in Table S5. The inclusions are dacitic to rhyolitic in composition and more differentiated than the host bulk rocks (Fig. 5) and are within the same compositional range than determined by Robidoux et al. (2020). The SiO2 contents range from 65 wt % to 78 wt %, and the composition of the most evolved bulk-rock sample from Stage IV is almost identical to the least evolved melt inclusion (∼65 wt % SiO2 and ∼1.9 wt % MgO). The plagioclase composition in the vicinity of the MIs ranges from An55 to An74. The MIs in plagioclase cover a relatively small compositional range with 70 wt %–75 wt % SiO2 and 0.2 wt % MgO–0.7 wt % MgO. In contrast, compositions of glass inclusions in both clinopyroxene and orthopyroxene cover a broader compositional range from dacitic to rhyolitic glasses. MgO concentrations are typically low (0.1 wt %–2.0 wt %) and correlate negatively with SiO2. This negative correlation is also observed for Al2O3, FeOtot, and CaO. K2O is the only major oxide showing a positive correlation with SiO2. The water concentrations in MIs can be estimated from the “by-difference” method (100 % – microprobe analytical total) and range from 0 to ∼3 wt % H2O. However, these estimations should be interpreted with caution because of possible water loss during eruption and during the re-homogenization process. Sulfur concentrations are low with a maximum of ∼260 µg g−1. Chlorine concentrations in the melt inclusions range from ∼300 up to ∼1700 µg g−1. Fluorine concentrations are up to ∼1500 µg g−1.
Interstitial quenched glasses of Stage IV eruptive material (1993 eruption and older lavas) were analyzed in areas with large interstitial melt pools (>100 µm) in which no quench phases could be detected (e.g., plagioclase). However, many other melt pools in the same sample contained a high proportion of microlites, mainly composed of plagioclase. Glasses were measured several times to ensure the homogeneity of the matrix. Analyzes of the natural glasses are given in Table 3. The natural quenched glasses have higher SiO2 contents and represent the most evolved glass compositions with ∼75 wt % SiO2–77 wt % SiO2 and 0.3 wt % MgO–0.05 wt % MgO (Fig. 5). However, the compositions of the interstitial glasses need to be interpreted with caution considering that microlites were formed.
Table 4Experimental starting compositions of re-molten andesite in phase equilibrium experiments (sample LAS07-26).
4.1 Starting material
The natural andesite sample LAS07-26 (Stage IV, April 1993 eruption) was chosen as starting material for the phase equilibrium experiments. This sample represents one of the most primitive compositions found at Lascar volcano with 58.9 wt % SiO2 and 4.7 wt % MgO (Fig. 2). Rock fragments were crushed and ground in a rotary swing mill. After 90 min of melting in a Pt crucible at 1600 °C and 1 atm in a chamber furnace, the resulting melt was quenched in a water bath and the obtained glass was ground in an agate mortar. The homogeneity of the silicate glass was verified by electron microprobe (see analyses in Table 4). Two fractions with grain sizes of <100 and 100–200 µm were mixed together in a ratio of 1:1 to decrease the free volume between grains.
4.2 Experimental strategy
We conducted crystallization experiments in which the andesite was equilibrated with H2O–CO2-bearing fluids at 300 MPa and at two oxygen fugacities corresponding to QFM+1.5 and QFM+3.3 at H2O-saturated conditions. However, the prevailing redox conditions also depend on the activity of H2O in the system (see below). In addition, experiments at 500 MPa and QFM+1.5 for H2O-saturated samples were conducted to evaluate a possible pressure effect on the phase relations.
First-order constraints for the experimental conditions were gained from the thermobarometric calculations using the natural pyroxene pairs (Figs. 3 and S2). The temperature of the experimental runs was varied from 900 to 1050 °C (in either 25 or 50 °C intervals), which is within the range of 940–1020 °C indicated by natural pyroxene pairs. The pressure range of 300 to 500 MPa is in agreement with estimates using the model of Putirka (2008) as shown in Fig. 3. The fO2 conditions chosen for the high-pressure experiments were estimated using compositions of coexisting ilmenite–magnetite pairs from different types of eruptive material (Fig. 4).
4.3 Experimental technique
The experiments were conducted in Au capsules, which were approximately 15 mm long (inner diameter of 2.6 mm). Different proportions of H2O and CO2 were added to 50 mg of glass powder to vary the composition of the fluid phase in our experiments. The total volatile content (CO2 + H2O) was kept at ∼12 wt % of the total charge. Silver oxalate (Ag2C2O4) was used as a source of CO2. In order to investigate the role of water activity on phase assemblages, the initial mole fraction of H2O (X) in the fluid phase was varied from an X value of 0.0 (nominally dry, pure CO2 in the fluid) to 1.0 (water-saturated), as listed in Tables 5 to 6. This large variation was necessary because no preliminary indication of possible meltwater content in the Lascar magmas was available. The amount of added volatiles was sufficient to produce a free fluid phase in all experimental runs, which was verified using the weight-loss method after opening the capsules.
The experiments were conducted in an IHPV. Total pressure (P) was measured and recorded continuously with an uncertainty of about 1 MPa using a strain gauge manometer. The variations in pressure during the experiments were ≤5 MPa. Temperature (T) was measured with four unsheathed S-type (Pt–Pt90Rh10) thermocouples over a length of about 35 mm, and temperature variations between the two sample thermocouples were below 5 °C. The IHPV was pressurized with an Ar–H2 gas mixture for the experiments at reducing conditions (QFM+1.5 at H2O-saturated conditions). Hydrogen diffuses through the gold inside the capsules, and at 700 °C osmotic equilibrium is reached within ∼2 h (Schmidt et al., 1995). To control the fH2 prevailing at high P and T, the IHPV is equipped with a Shaw membrane made of Pt (a detailed description of the apparatus is given by Berndt et al., 2002). The fugacity of H2 in the experimental runs was chosen to ensure redox conditions close to QFM+1.5 in the capsules at H2O-saturated conditions. The calculation of fH2 at certain P–T conditions is based on the equations of Schwab and Küstner (1981). Since fH2 and fO2 are linked by the equilibrium reaction for water formation (H O2↔ H2O), the prevailing oxygen fugacity in the individual capsules varied with aH2O in the melt. The calculated fO2 for each experiment is reported in Tables 5–7.
The experiments at oxidizing conditions were performed in another IHPV pressurized with pure Ar gas providing high intrinsic oxygen fugacity within the vessel (close to QFM+3.3 at H2O-saturated conditions; Schuessler et al., 2008). The fO2 at H2O-undersaturated conditions can be estimated using the relation logfO log fO2 (at aH2O =1) +2 log aH2O (e.g., Botcharnikov et al., 2005), where aH2O is determined from the water concentration in the melt following the model of Burnham (2015). The overall error in the determination of the fO2 in each experiment is estimated to be ∼0.2 log units (Botcharnikov et al., 2005). The duration of all experiments varied from 2 to 7 d, with a longer duration at lower temperatures. After the experiment, all capsules were rapidly quenched with a quench rate of about 150 °C s−1.
4.4 Analytical methods
Analyses of the experimental products were performed with a Cameca SX100 electron microprobe at the Abteilung Mineralogie, Institut für Erdsystemwissenschaften (IESW), Leibniz Universität Hannover. Residual glasses were measured with a 5–10 µm defocused beam; a 4 nA beam current; and counting times of 4 s for Na and K, 20 s for P, and 8 s for the other elements. In samples with a low melt fraction, the microprobe beam was defocused as much as possible. No significant alkali loss (within the uncertainty) was detected using these analytical conditions.
Minerals were analyzed with a 15 kV focused beam, a 15 nA beam current, and counting times for major elements of 10 s. Na and K were analyzed first to minimize alkali loss. Phosphorous was analyzed at last with counting times of 20 s. Multiple measurements were made for each phase within a sample to minimize possible analytical errors and check for homogeneity.
The by-difference method was applied to determine the H2O concentration in the quenched experimental glasses. To improve the quality of the by-difference technique, hydrous standard basaltic and andesitic glasses with well-characterized water contents from 0.28 wt % H2O to 8.81 wt % H2O (glasses characterized by Botcharnikov et al., 2006, and Shishkina et al., 2010) were analyzed with the same EPMA setting. The results were used to establish a relation between the by-difference value and the H2O concentrations of the standard glasses. As an example, a typical relationship obtained for an analytical session is H2O H2Oby-difference−0.3024. The typical error using this approach is estimated to be ±0.5 wt % H2O. To further constrain the accurate determination of H2O contents in the experimental glasses, samples above the liquidus were measured with Karl Fischer titration (KFT) (for a detailed description of the method, see Behrens et al., 1996). H2O concentrations measured with KFT (see Table S7) are in a good agreement (±0.5 wt % H2O) with the corrected values obtained by an EPMA.
Table 5Conditions of phase equilibrium experiments at 300 MPa, QFM+1.5, and phase assemblage in experimental products.
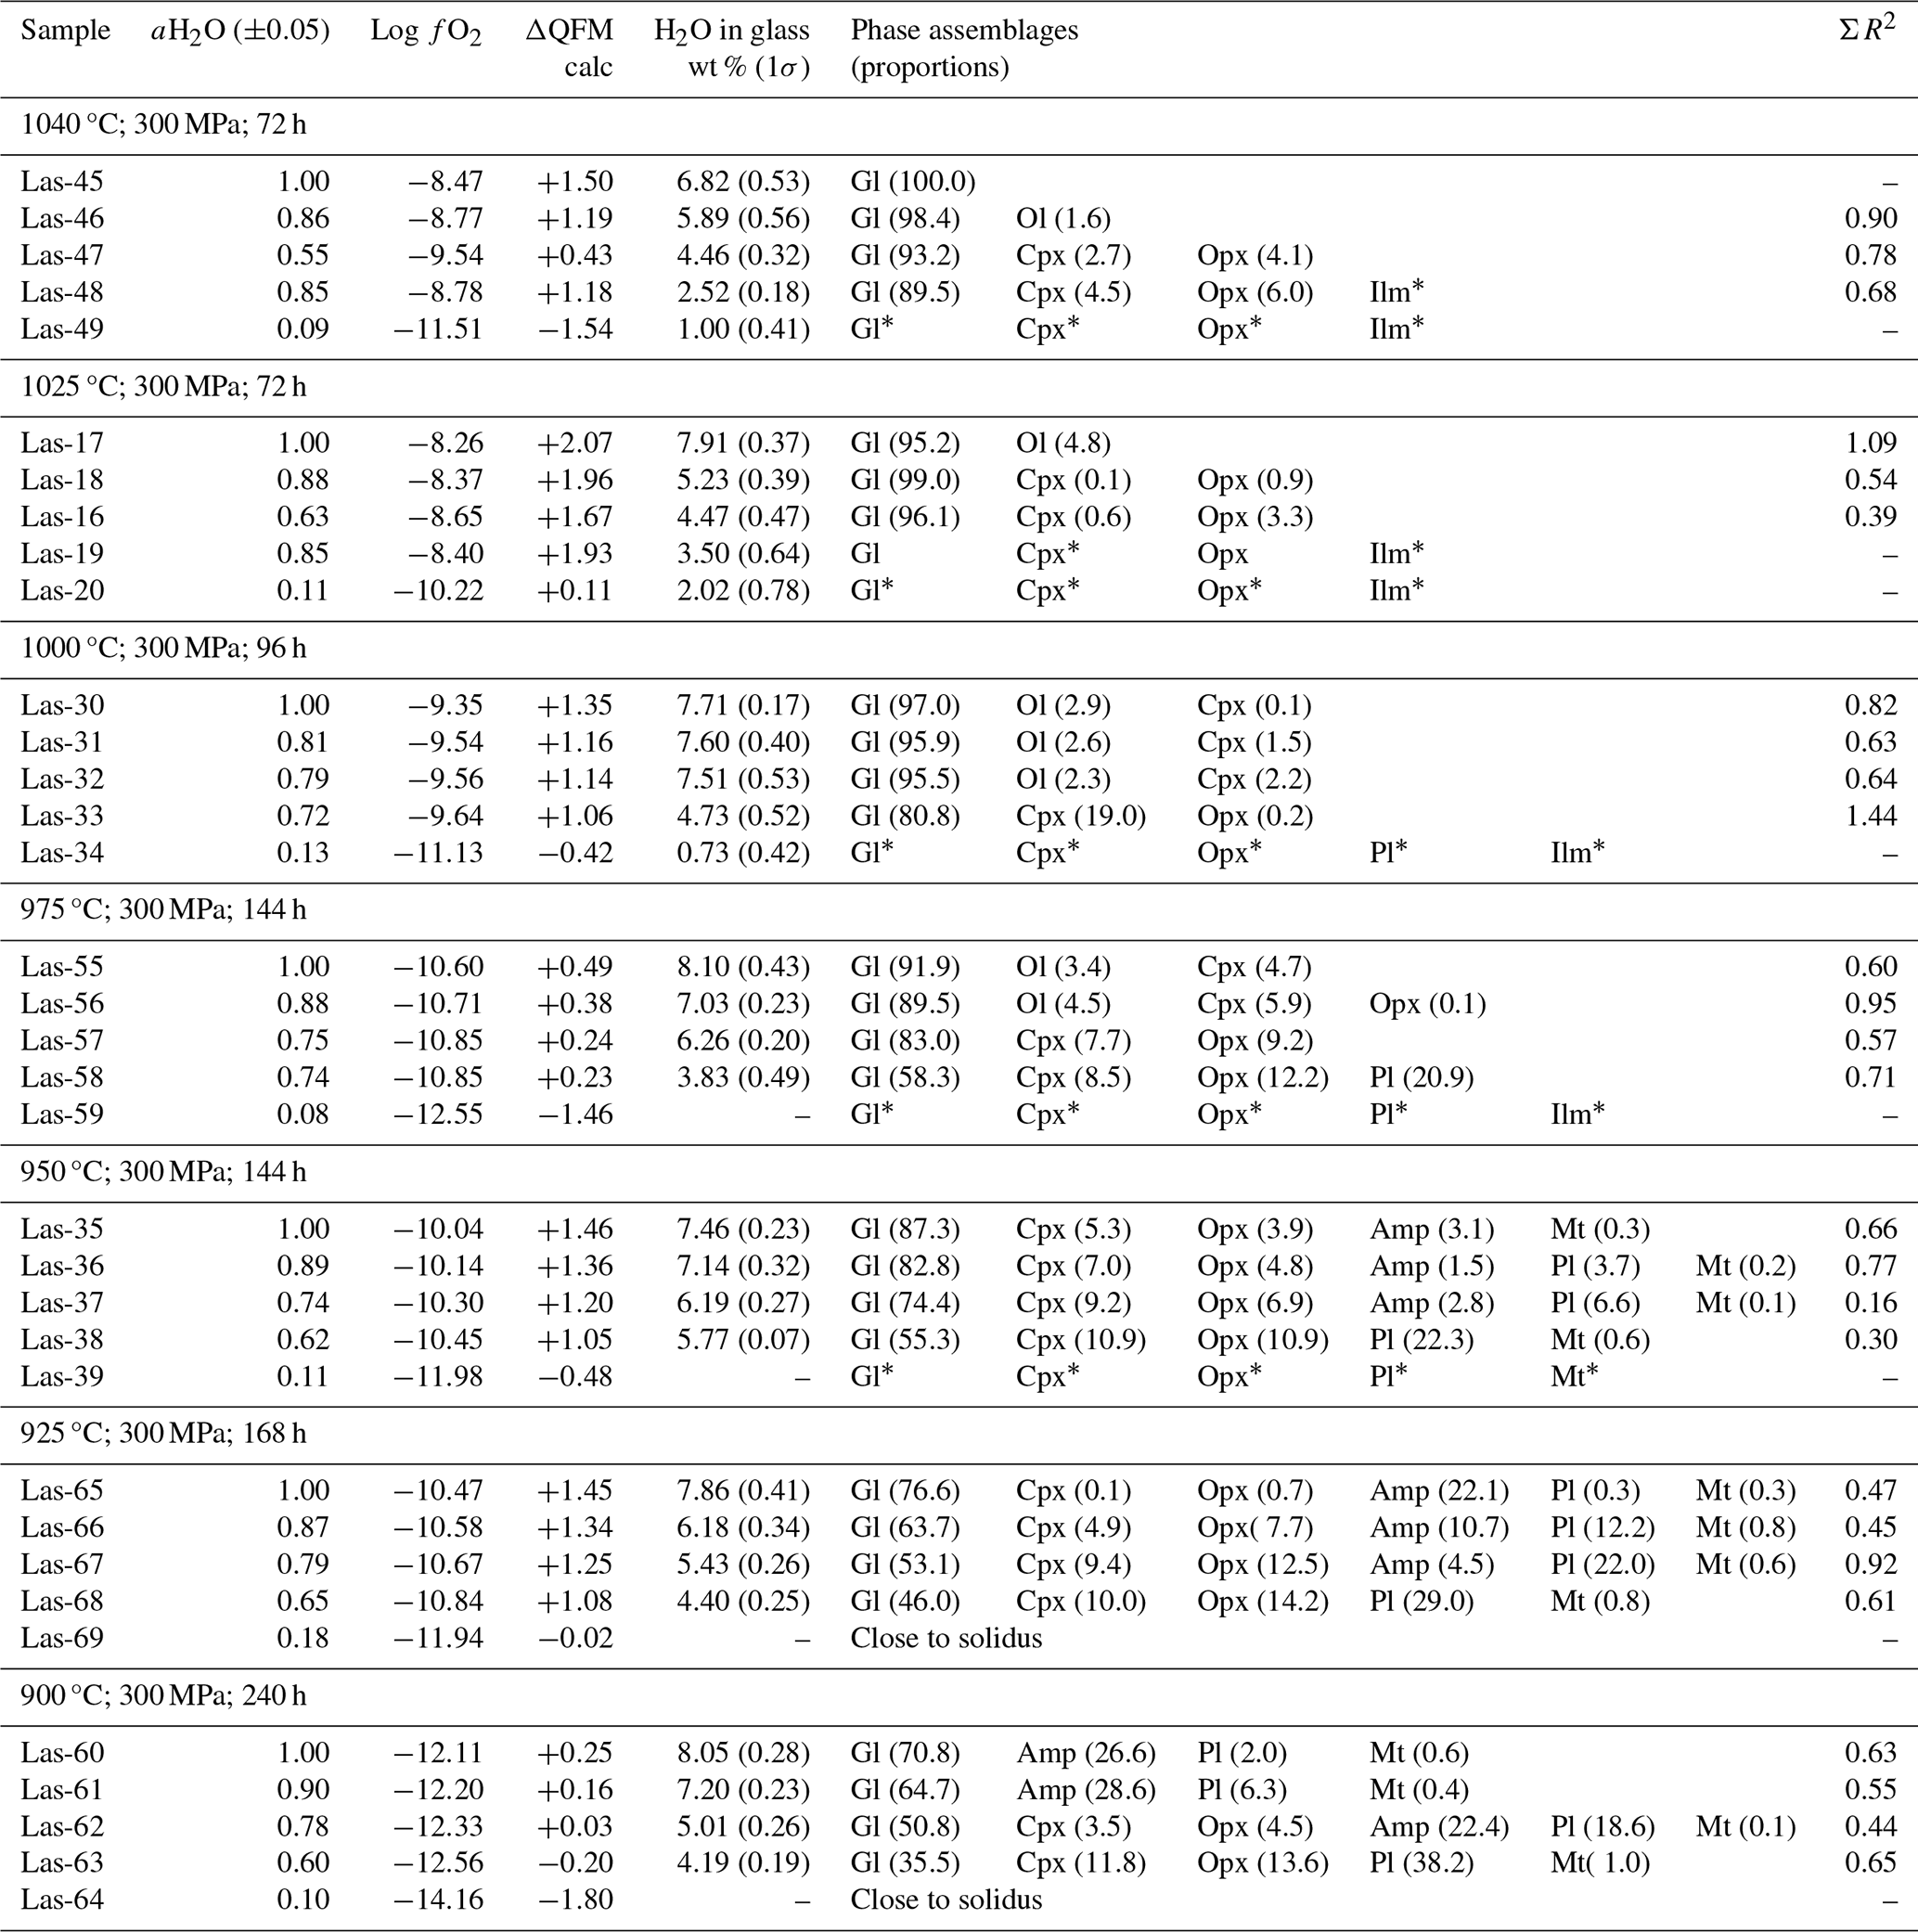
* Phase composition is not determined.
Table 6Conditions of phase equilibrium experiments at 500 MPa, QFM+1.5, and phase assemblage in experimental products.
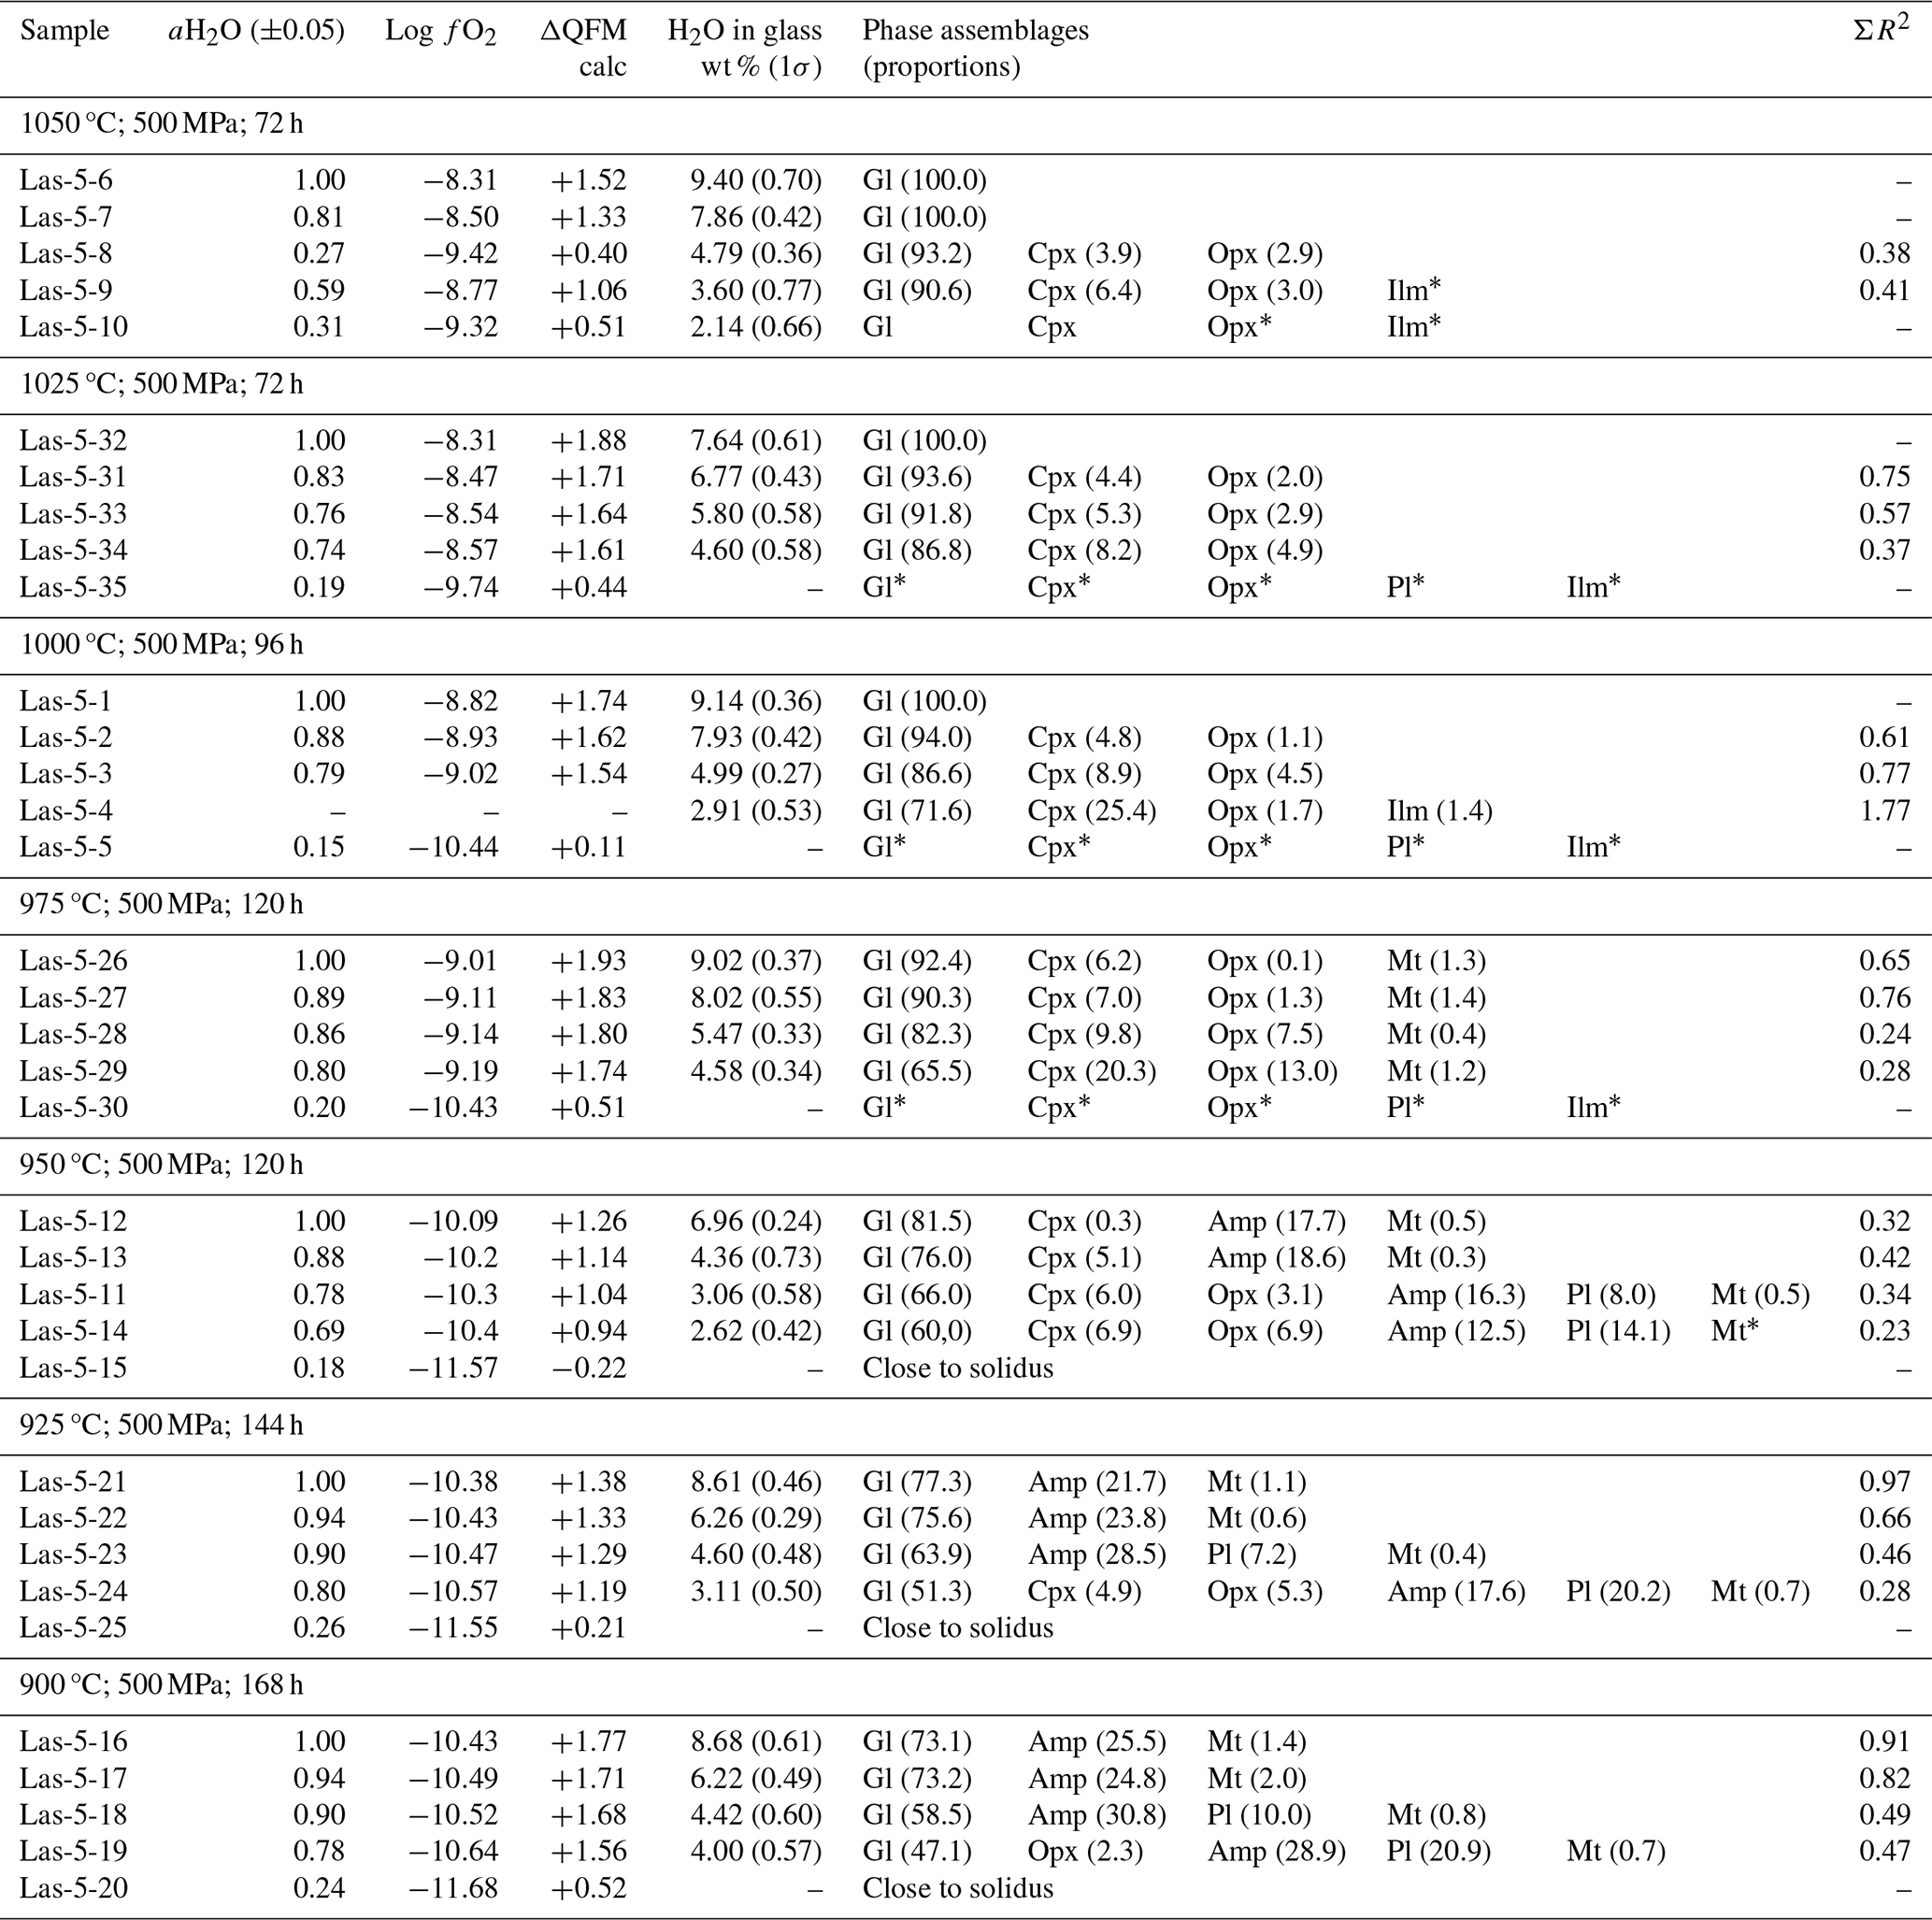
* Phase composition is not determined.
5.1 Phase assemblages
The experimental conditions and the produced phase assemblages are given in Tables 5, 6, and 7. Detailed compositions of minerals and glasses are listed in Table S6. The phase compositions were used to calculate mineral proportions, using a least-square fit of the starting composition, based on the mass balance residual program PETMIX (Wright and Doherty, 1970). Calculated values (wt %) are given in Tables 5, 6, and 7, together with the sum of the squares of the fit (ΣR2). Results of most fits were satisfying with ΣR2 values around 0.5. Nevertheless, some fits produced poor ΣR2 (>0.7 to max 1.77) for experimental products with high crystallinity or for experiments in which the compositions of the individual phases could not be analyzed correctly. In experiments where proportions are not given in the table, one or more phases were too small to be analyzed accurately with an EPMA.
Table 7Conditions of phase equilibrium experiments at 300 MPa, QFM+3.3, and phase assemblage in experimental products.
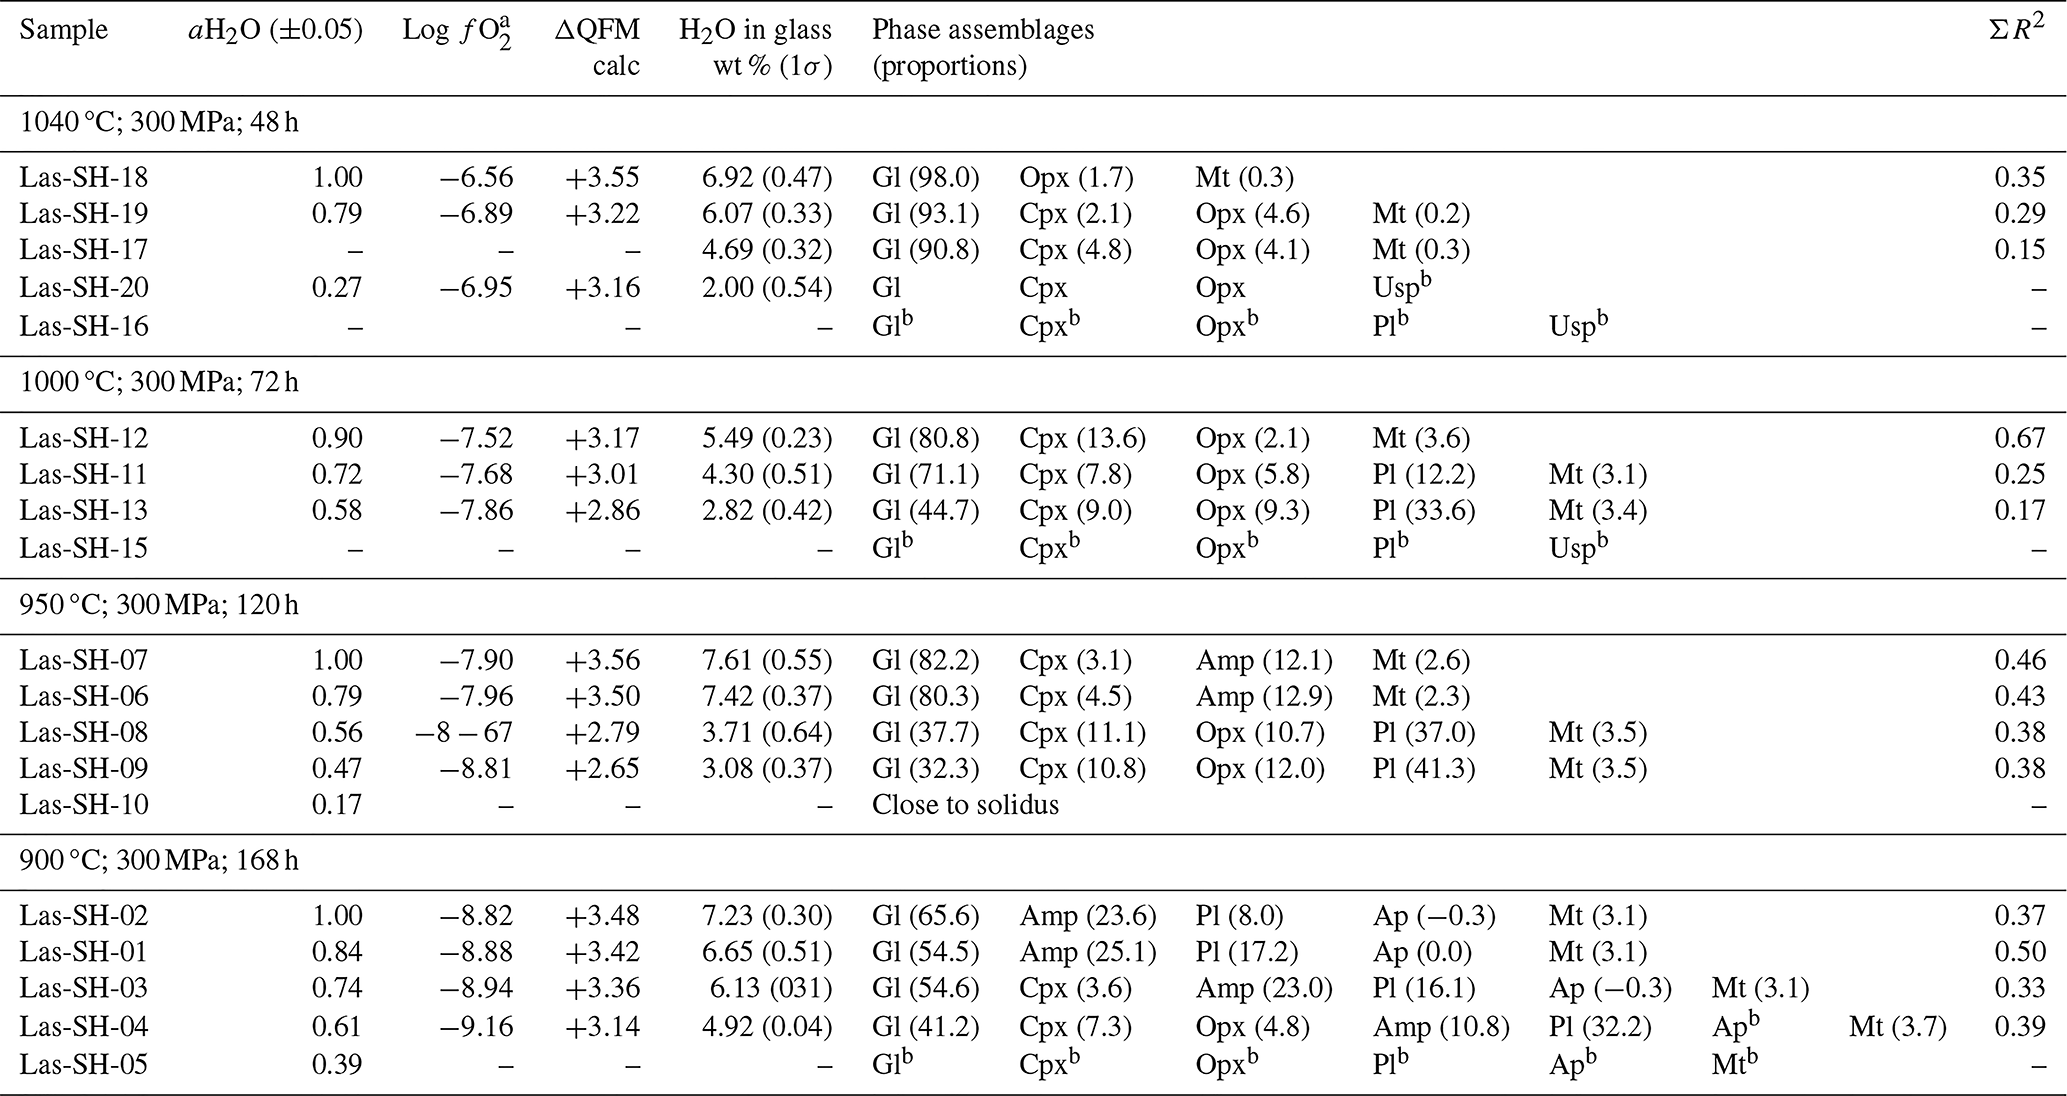
afO2 calculated using the model of Burnham (2015) for experiments with aH2O <1.00. b Phase composition is not determined.
Major crystalline phases identified in all three experimental series include plagioclase (Pl), clinopyroxene (Cpx), orthopyroxene (Opx), amphibole (Amp), and magnetite (Mt). Phases observed in minor amounts are olivine (Ol), apatite (Ap), ilmenite (Ilm), and ulvöspinel (Usp). Figure 6 displays representative backscattered electron (BSE) images of a typical experimental series obtained at 1040 °C and 300 MPa. Experiments conducted at high T and/or with high H2O contents in the melt have low crystal contents and a homogeneous distribution of the mineral phases throughout the glass matrix. Crystals are generally euhedral in shape and show no detectable compositional zoning, which is an indication for equilibrium in our experimental products. Some of the experimental products with high crystallinity have a heterogeneous crystal distribution (e.g., at 900 °C), which is probably due to strong undercooling effects which may locally affect crystal nucleation and growth.
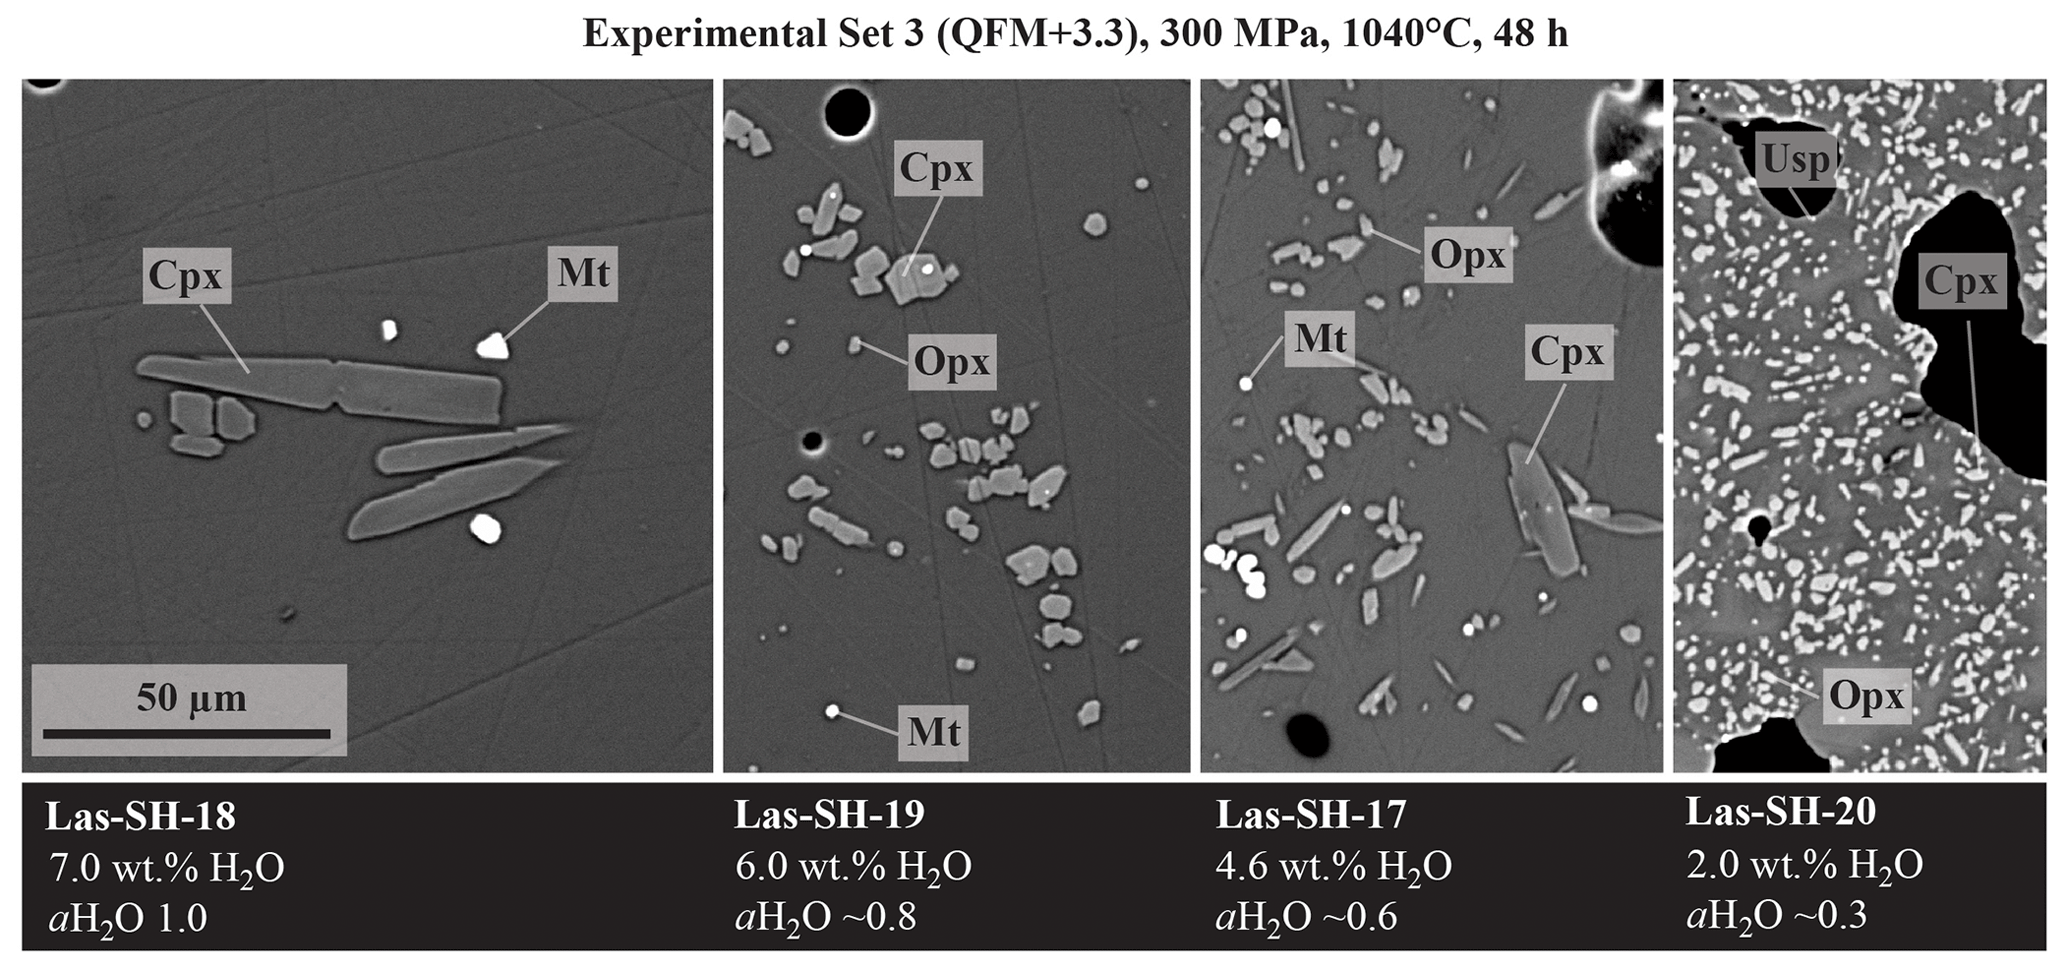
Figure 6Backscattered electron images of experimental products, obtained at 300 MPa and 1040 °C after 48 h with different water contents in the glass (7 wt %, 6 wt %, 4.5 wt %, and 2.0 wt % H2O). Scale is the same in all pictures.
Isobaric (300 or 500 MPa) stability fields and phase relations as a function of T (in the range of 900–1050 °C) and H2O content of the melt (from ∼0.5 wt % H2O to ∼9 wt % H2O) are illustrated in Fig. 7. As shown in several previous studies using the same experimental approach (e.g., Dall' Agnol et al., 1999; Botcharnikov et al., 2008a), oxygen fugacity is not similar in each capsule of a single experimental run and depends on the prevailing water fugacity. Conditions are more reducing at a lower X and therefore have lower water activity. For each experiment, the oxygen fugacity calculated using the procedure described above and taking the H2O content in the melt estimated by difference (or by KFT for liquidus experiments) is listed in Tables 5–7. In Fig. 7, black arrows and dashed lines have been added to indicate the approximate oxygen fugacity range of the experiments. Water-saturation curves in Fig. 7 have been drawn on the basis of the experimental results and data from Botcharnikov et al. (2006).

Figure 7Phase equilibria of Lascar andesite LAS07-26 studied at (a, b) 300 MPa and (c) 500 MPa as a function of water content in the melt and temperature. The nominal redox conditions are (a, c) QFM+1.5 and (b) QFM+3.3, with fixed hydrogen fugacities at aH2O=1. Black arrows and vertical dotted lines represent estimated redox conditions in the experiments (in ΔQFM notation). Ol: olivine; Plag: plagioclase; Cpx: clinopyroxene; Opx: orthopyroxene; Amp: amphibole; Mt: magnetite; Ilm: ilmenite; Usp: ulvöspinel; Ap: aptite. Continuous lines outline the stability fields of mineral phases. Dashed lines mark the disappearance of phases. The grey-shaded area represents the phase equilibrium assemblage fitting to the natural two-pyroxene samples of Lascar (e.g., LAS07-26; 1993 eruption). The water solubility curve is estimated from experiments conducted with X.
5.1.1 Experimental set 1 (300 MPa, reducing conditions)
Olivine is the first crystallizing phase in our composition (Fig. 7a) and is only stable at high H2O concentrations in the melt (∼6–8 wt % H2O) and at high T (975–1040 °C). Cpx and Opx crystallize after Ol at lower T. For lower H2Omelt (<5 wt % H2O) both types of pyroxenes are also observed at ≤1040 °C. The Ol-out and Opx-in curves in Fig. 7a almost overlap, indicating that Ol stability field is limited by a peritectic reaction involving the formation of Opx. Cpx and Opx are not stable at low T (<950 and 925 °C, respectively, and H2Omelt>6.0 wt %).
At water-saturated conditions, Pl starts to crystallize below 950 °C. With decreasing H2O content in the melt, the crystallization of Pl is shifted to higher temperatures and is at 1040 °C for nearly dry melts (<1 wt % H2Omelt). Ilm and Mt stability fields are controlled mainly by the prevailing redox conditions of the experiments and not by water activity (e.g., Snyder and Carmichael, 1992; Toplis and Carroll, 1995; Botcharnikov et al., 2008a). Mt is stable below 975 °C, independently of H2Omelt. Both Fe phases, Mt and Ilm, do not coexist in a single experiment. Amp is only stable at low T (<975 °C) and high H2Omelt (>4.0 wt % H2O), as already observed in experimental studies performed with similar compositions (e.g., Botcharnikov et al., 2008b; Costa et al., 2004; Andújar et al., 2017).
5.1.2 Experimental set 2 (300 MPa, oxidizing conditions)
Compared with the phase diagram of experimental set 1 at 300 MPa and reducing conditions, the topology of the system and phase stability fields for major minerals are not impacted by fO2 (Fig. 7a and b). However, at high fO2 the crystallization of Ol is completely suppressed and Mt is the liquidus phase. At low H2Omelt (<2.5 wt % H2O) and relatively high T (>1000 °C) Usp is the Fe–Ti phase, replacing Ilm at these redox conditions. Ap was detected in all experiments at 900 °C, which contrasts with the experimental results of sets 1 and 3 in which this mineral is absent at the same temperature.
5.1.3 Experimental set 3 (500 MPa, reducing conditions)
At 500 MPa, the field above liquidus is enlarged compared to both experimental sets at 300 MPa (Fig. 7c). In contrast to the 300 MPa data, Ol was never observed. These results are in agreement with studies on basaltic andesites from Bezymianny volcano, Kamchatka (Almeev et al., 2013a). Almeev et al. (2013a) also observed the replacement of Ol by Opx (and later Opx + Cpx) with increasing pressure (compare Fig. 7a and c). Liquidus phases are Cpx and Opx, crystallizing nearly together below 1000 °C at H2O-saturated conditions (∼9.0 wt % H2O). Stability fields for oxide phases are similar to the ones in experimental set 1 (Fig. 7a), with Mt crystallizing below 1000 °C, independently of H2Omelt. Ilm crystallizes in a field at relatively low H2Omelt (1.0–2.5 wt % H2O), when fO2 is below QFM + 0.75. As for experimental set 1, Mt and Ilm were not found as co-existing phases. The Pl-in curve is shifted towards lower H2Omelt and lower temperature in the 500 MPa experimental set, beginning at ∼6 wt % H2Omelt at 900 °C and ∼1 wt % H2Omelt at 1025 °C. This is in agreement with general knowledge on the effect of pressure on plagioclase stability (e.g., Almeev et al., 2012). Compared to the 300 MPa experiments, the stability field of Amp is enlarged to lower H2Omelt (2.5 wt % H2O) at 500 MPa. The temperature at which Amp starts to crystallize at high H2Omelt is not dependent on pressure and is in the temperature range of 950–975 °C.
5.2 Crystallinity
Calculated phase proportions are listed in Tables 5–7. At a given temperature, the proportion of crystalline phases increases with decreasing H2Omelt for all investigated experimental charges (Fig. 8). As expected, the crystal fraction increases with decreasing T at a given H2Omelt. In the high-T range, the variation is ∼10 wt % for a T change of 50 °C. At low experimental T (between 950 and 900 °C) and low aH2O, the crystal fraction increase is more pronounced, especially at conditions at which Pl is crystallizing. At 900 °C the melt fraction decreases by ∼35 wt % (from 70 wt % to 35 wt %) with a decrease in H2Omelt from 8 wt % to 4 wt %. Comparing experiments at different oxygen fugacities performed at 300 MPa, it is noticeable that the experiments at more oxidizing conditions have generally a slightly higher crystal fraction of about 5 wt %. However, this variation remains within the error of the determination of crystal fractions by mass balance and should be interpreted with caution. In particular, there is no systematic change in the Pl proportions when comparing experiments at QFM+1.5 and QFM+3.3 at similar values of T and H2Omelt (Fig. 9). These results are in agreement with a study of Botcharnikov et al. (2008a) for ferrobasalts where no detectable or only a small effect of fO2 on the proportions of melt, Cpx, and Pl has been observed. At a given H2Omelt there is also no significant variation in the melt fraction when comparing experiments at 300 MPa and 500 MPa in the high-T runs (1050–1000 °C). At lower T (950–900 °C), experiments at 500 MPa have a significantly higher melt fraction than at 300 MPa, which is most probably due to the depression of the Pl stability field with decreasing P. Figure 9 displays the amount of Pl in the run products (wt % calculated by mass balance) as a function of H2Omelt, T, P, and fO2. An increase from 300 to 500 MPa with similar H2Omelt results in ∼20 wt % less Pl at 900 °C.
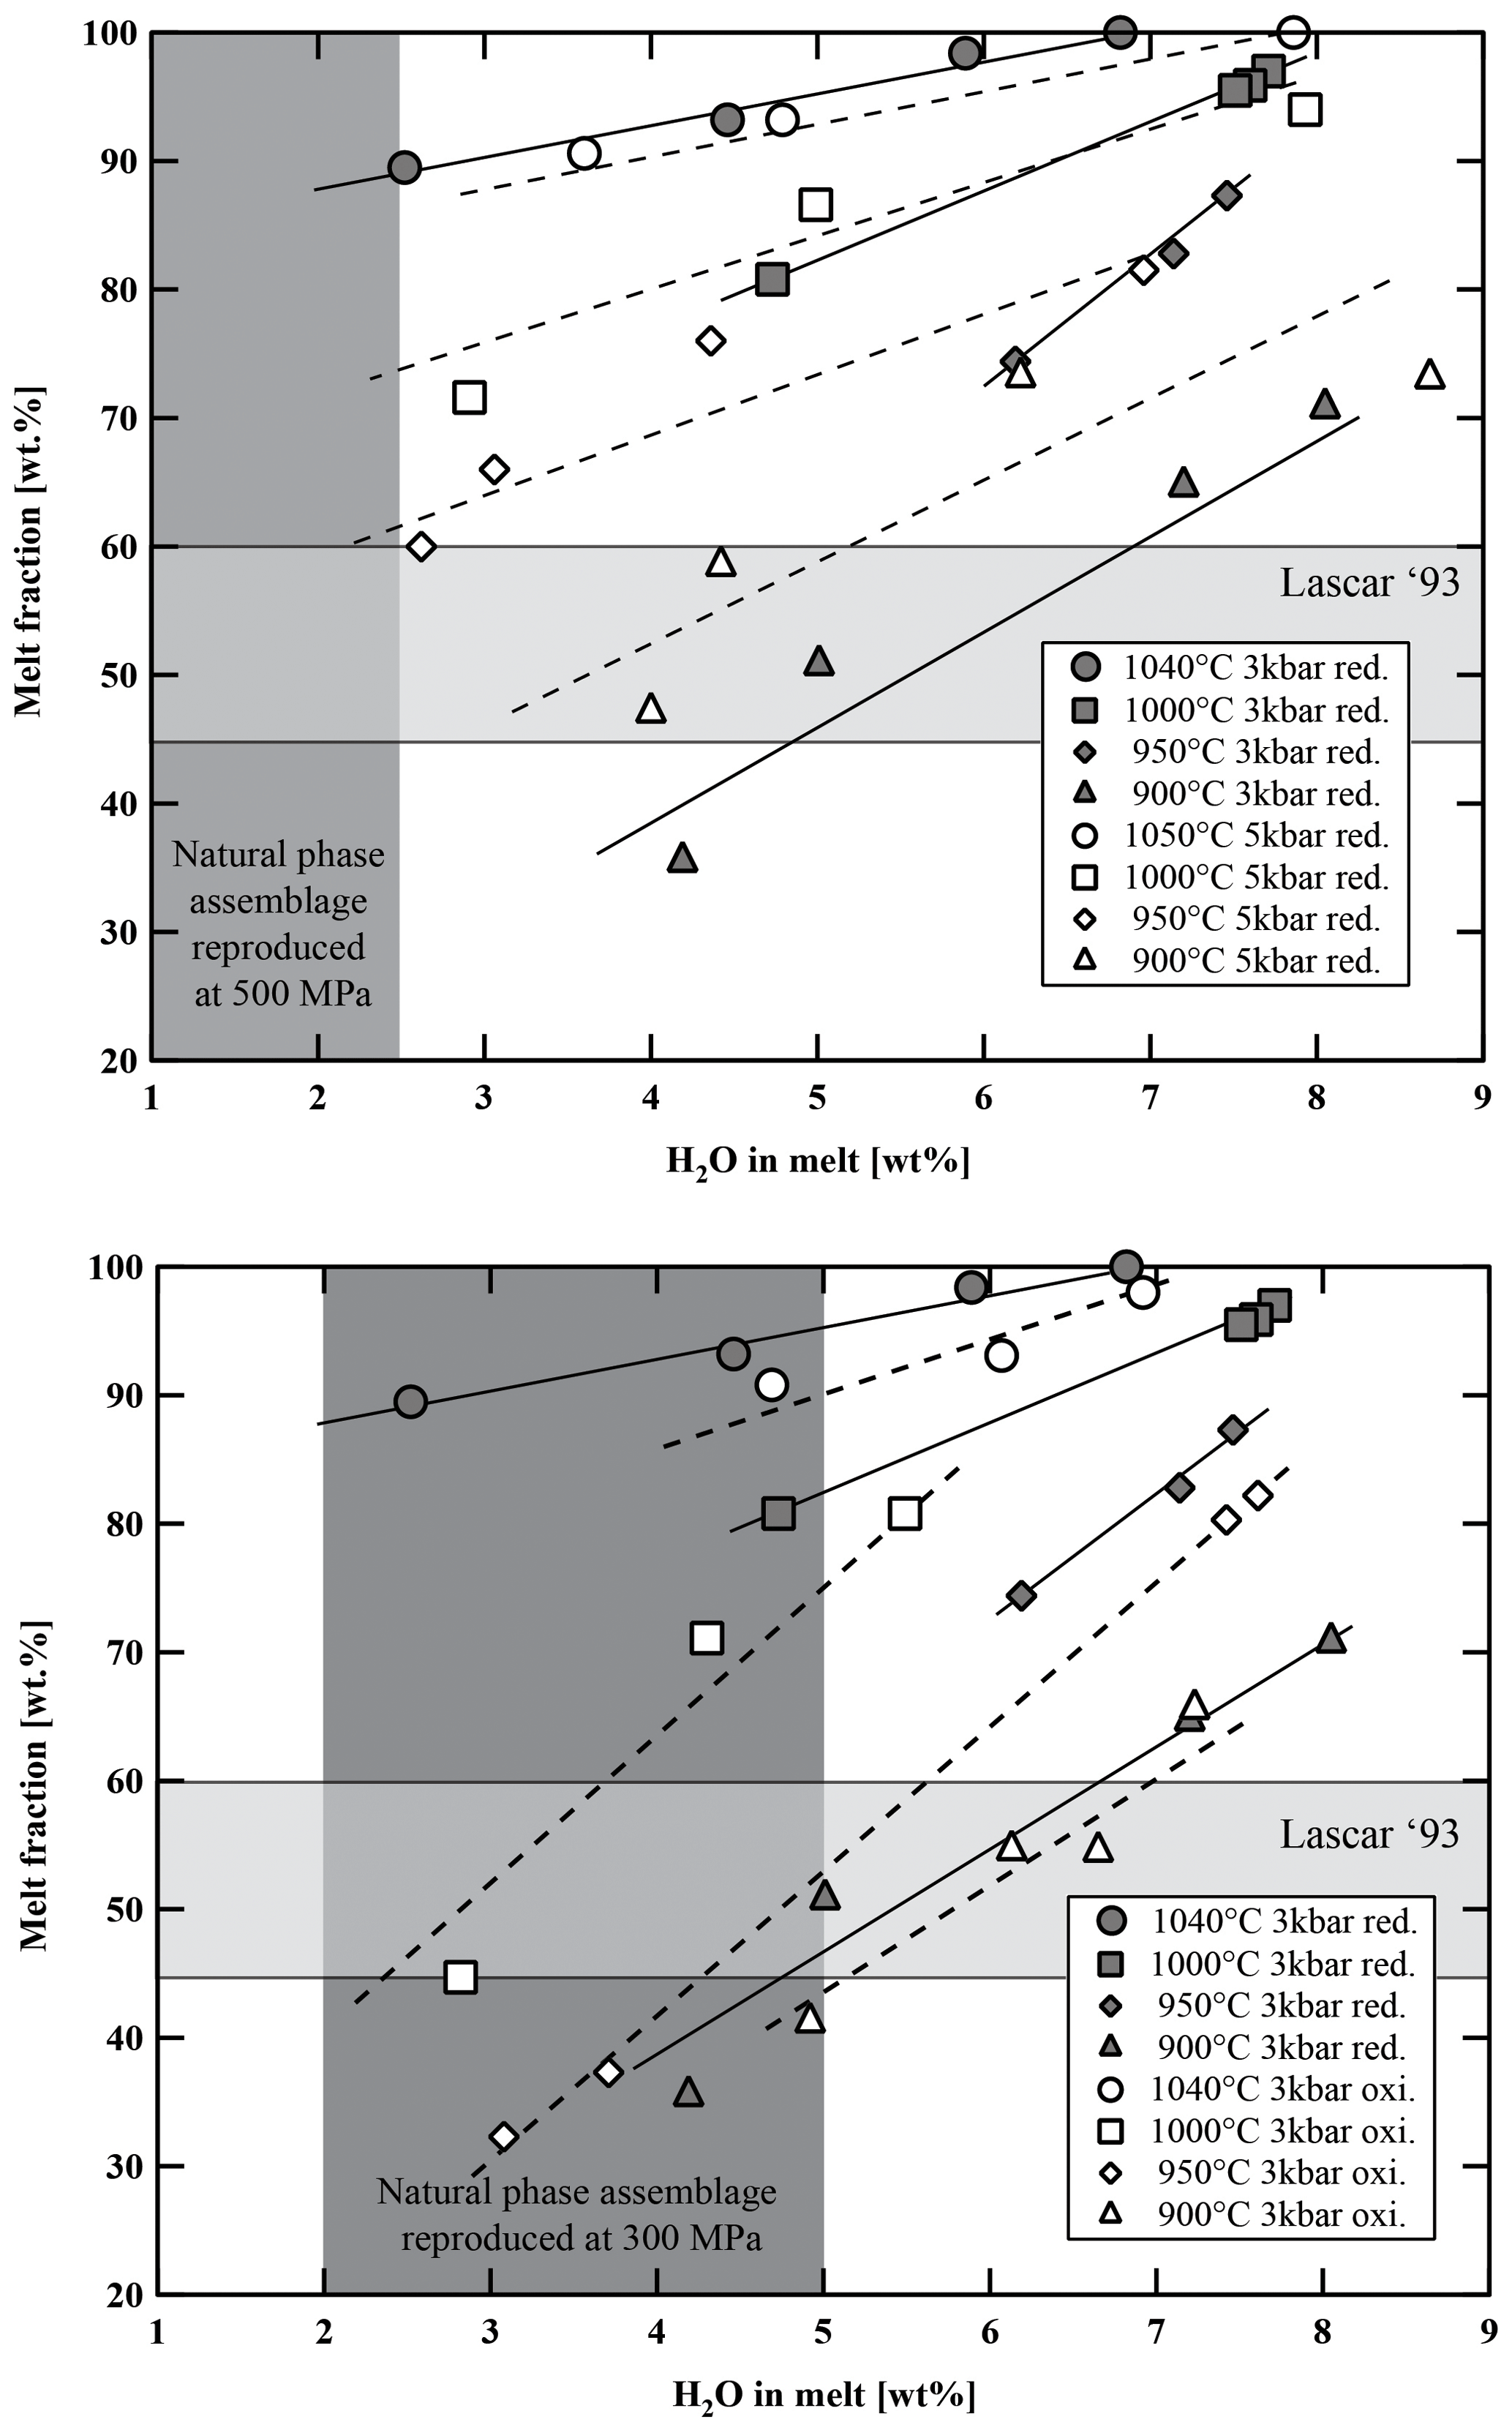
Figure 8Variation in melt fraction versus water content in the melt, temperature, and fO2. Light-grey-shaded area represents the proportion of groundmass in natural Lascar andesites. Dark-grey-shaded field represents the experimental phase assemblage field of Plag, Cpx, Opx, and Fe–Ti oxides with respect to H2Omelt. red.: reducing; oxi.: oxidizing.
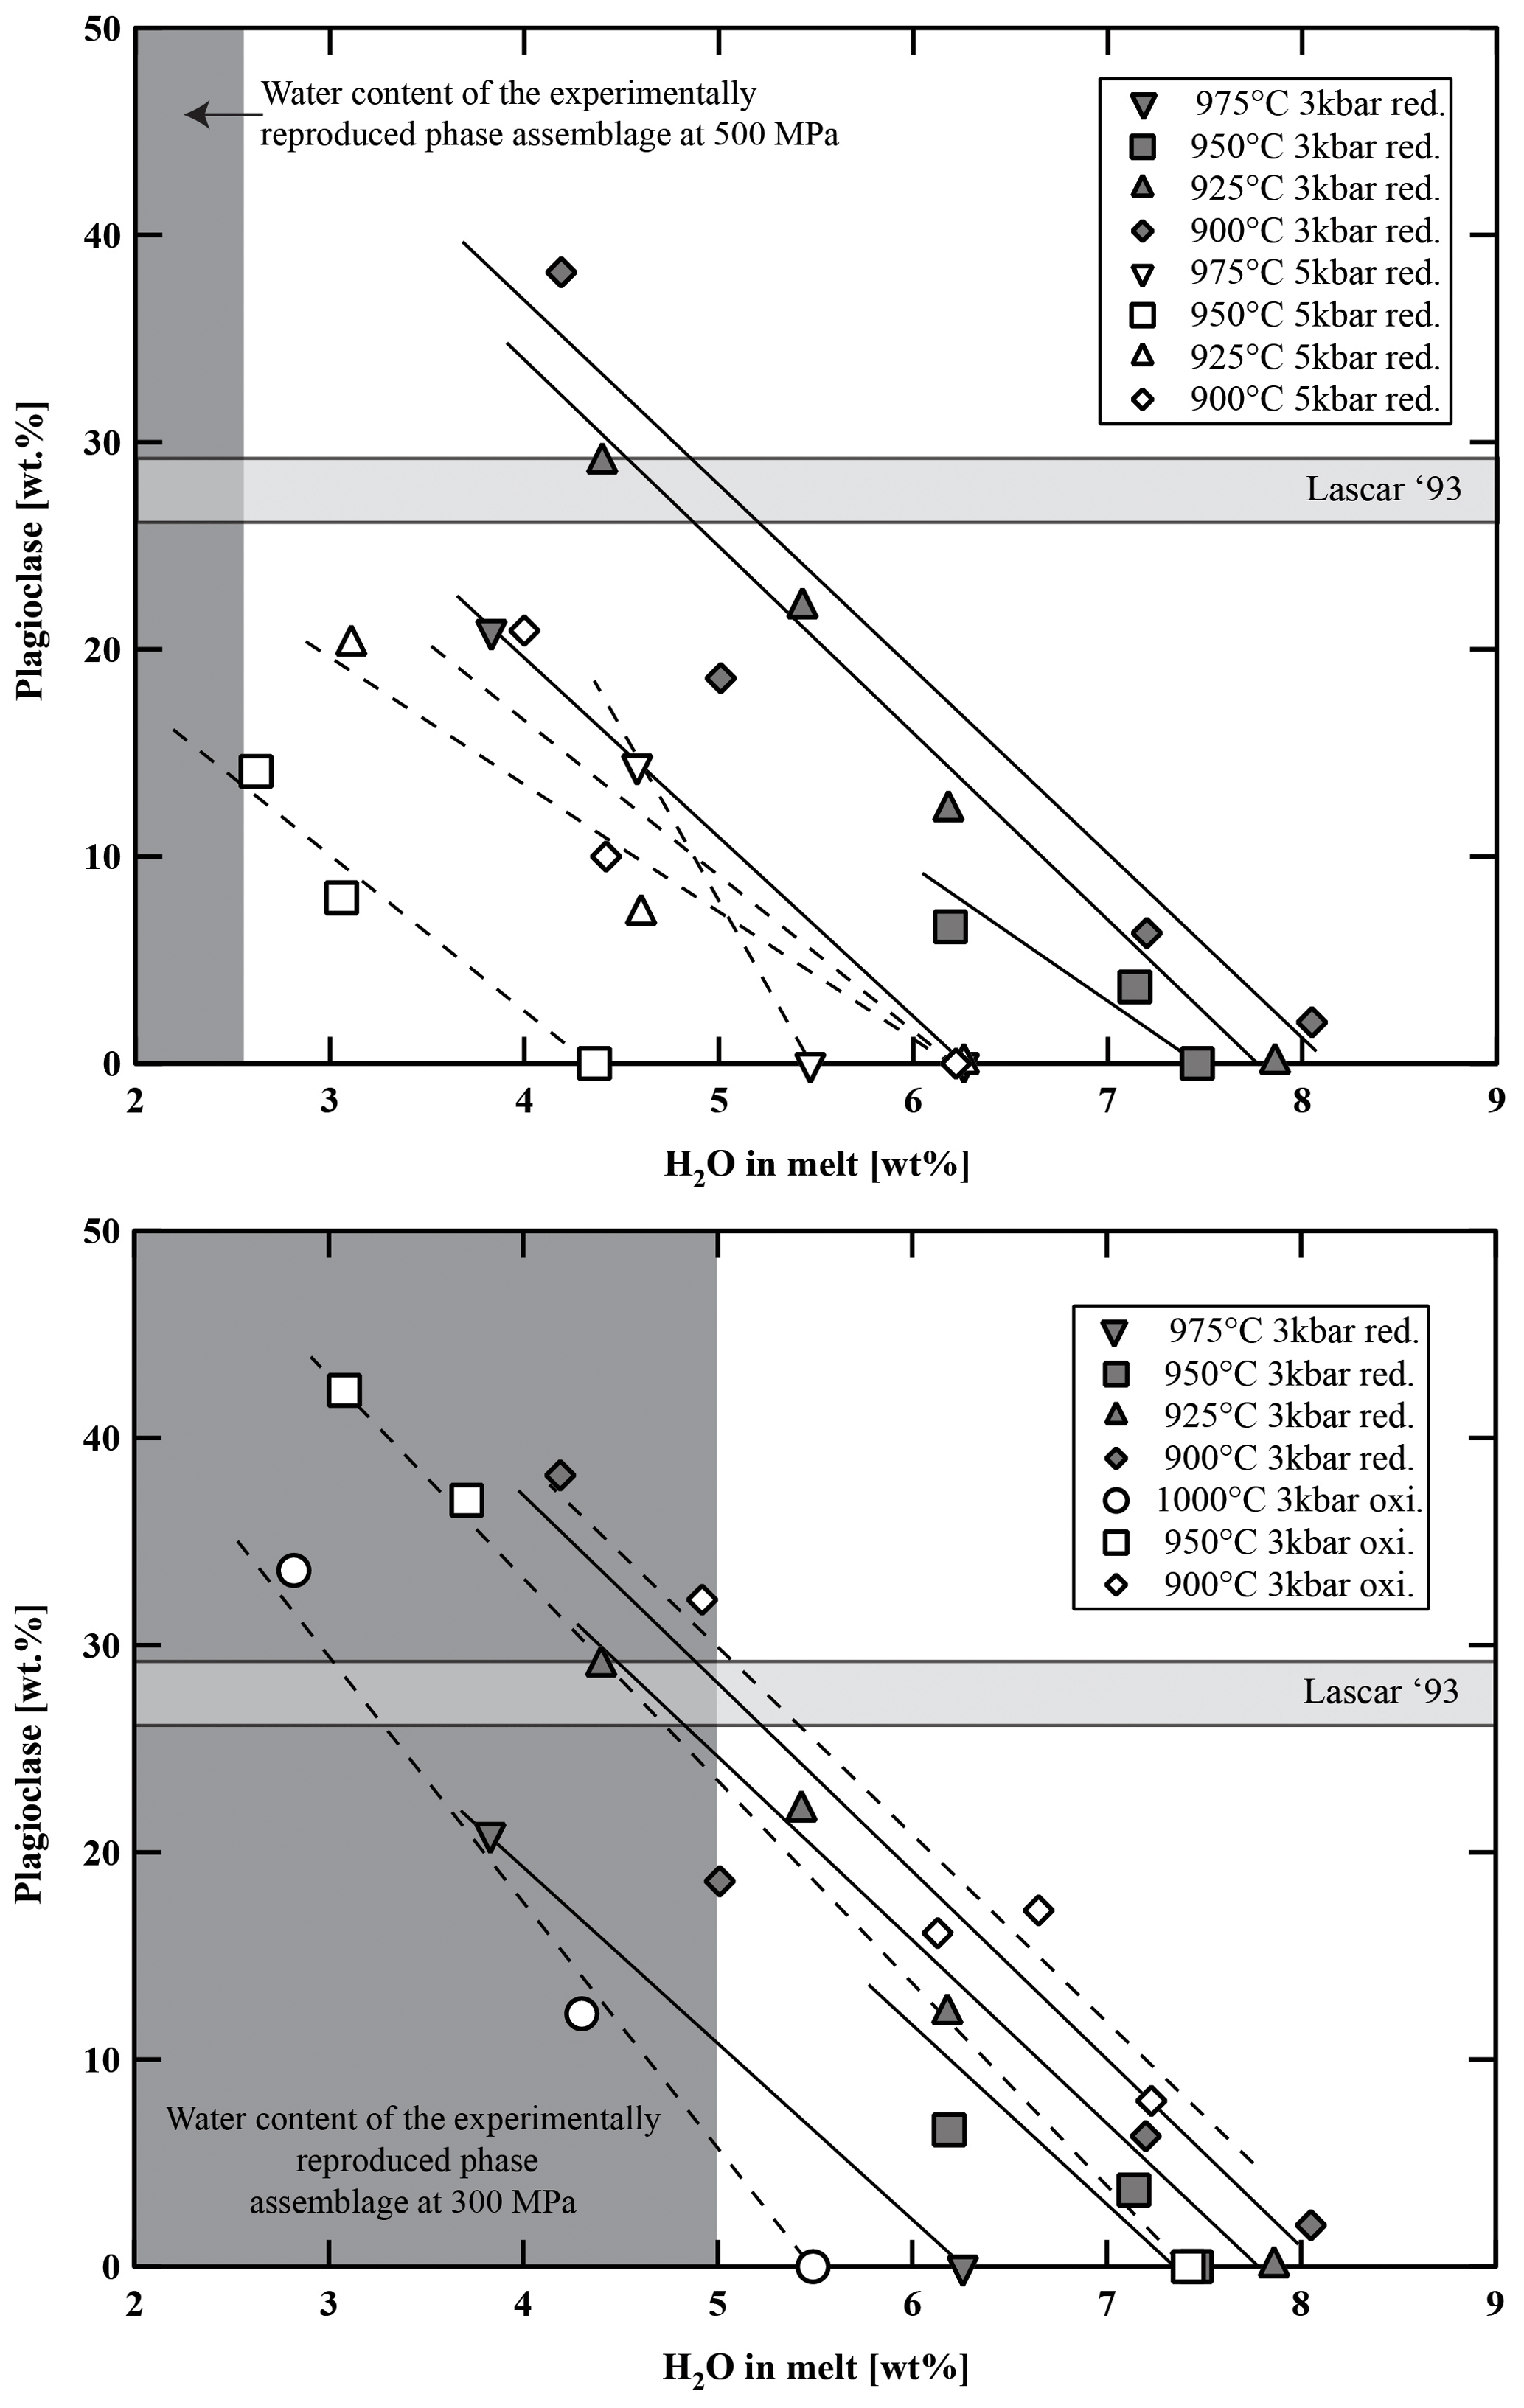
Figure 9Variation in plagioclase fraction (in wt %) versus water content in the melt, temperature, and fO2. Light-grey-shaded area represents the proportion of plagioclase in natural Lascar andesites. Dark-grey-shaded field represents the experimental phase assemblage field of Plag, Cpx, Opx, and Fe–Ti oxides with respect to H2Omelt.
5.3 Phase compositions
5.3.1 Olivine
Olivines are only present in experimental set 1 (300 MPa; QFM+1.5). The forsterite content (Fo=Mg/[Mg+Fe], in mol %) of Ol varies only little from Fo79 to Fo84 (Table S6), which is due to the small stability field of Ol (Fig. 8). A slight decrease in the Fo content from Fo82 to Fo79 can be observed with decreasing water content in the melt at 1000 °C.
5.3.2 Plagioclase
Plagioclase analyses without contamination from surrounding glasses were difficult to obtain due to their poor contrast with the residual glasses in backscattered electron (BSE) images and the small sizes of the crystals at low temperatures and low H2O concentrations in the melt (usually <5 µm below 950 °C and H2Omelt<4 wt %). Pl compositions are listed in Table S6 and shown in Fig. 10 as a function of T and H2Omelt at different P and fO2 values. As shown in previous experimental studies on andesites (e.g., Martel et al., 1999; Botcharnikov et al., 2008a; Almeev et al., 2013a), the An content increases with increasing H2Omelt at a constant temperature (Fig. 10; up to ∼25 mol % variation in this study). In experiments at low-T and H2O-saturated conditions, maximum An contents of about 76 mol % were determined. In agreement with observations of Martel et al. (1999), no systematic effect of fO2 on the compositions of plagioclase in andesitic systems is observed. The orthoclase component in the Pl varies from 0.4 to 5.1 mol %. Lower K2O concentrations at similar temperatures are observed in plagioclases from experiments with high H2Omelt (Table S6). The relatively high concentration of minor elements such as MgO and TiO2 (below 1.0 wt %) as well as FeO (0.7 wt % to 1.9 wt %) is difficult to interpret and is most probably due to the presence of small oxides in Pl or to contamination by the glass matrix.
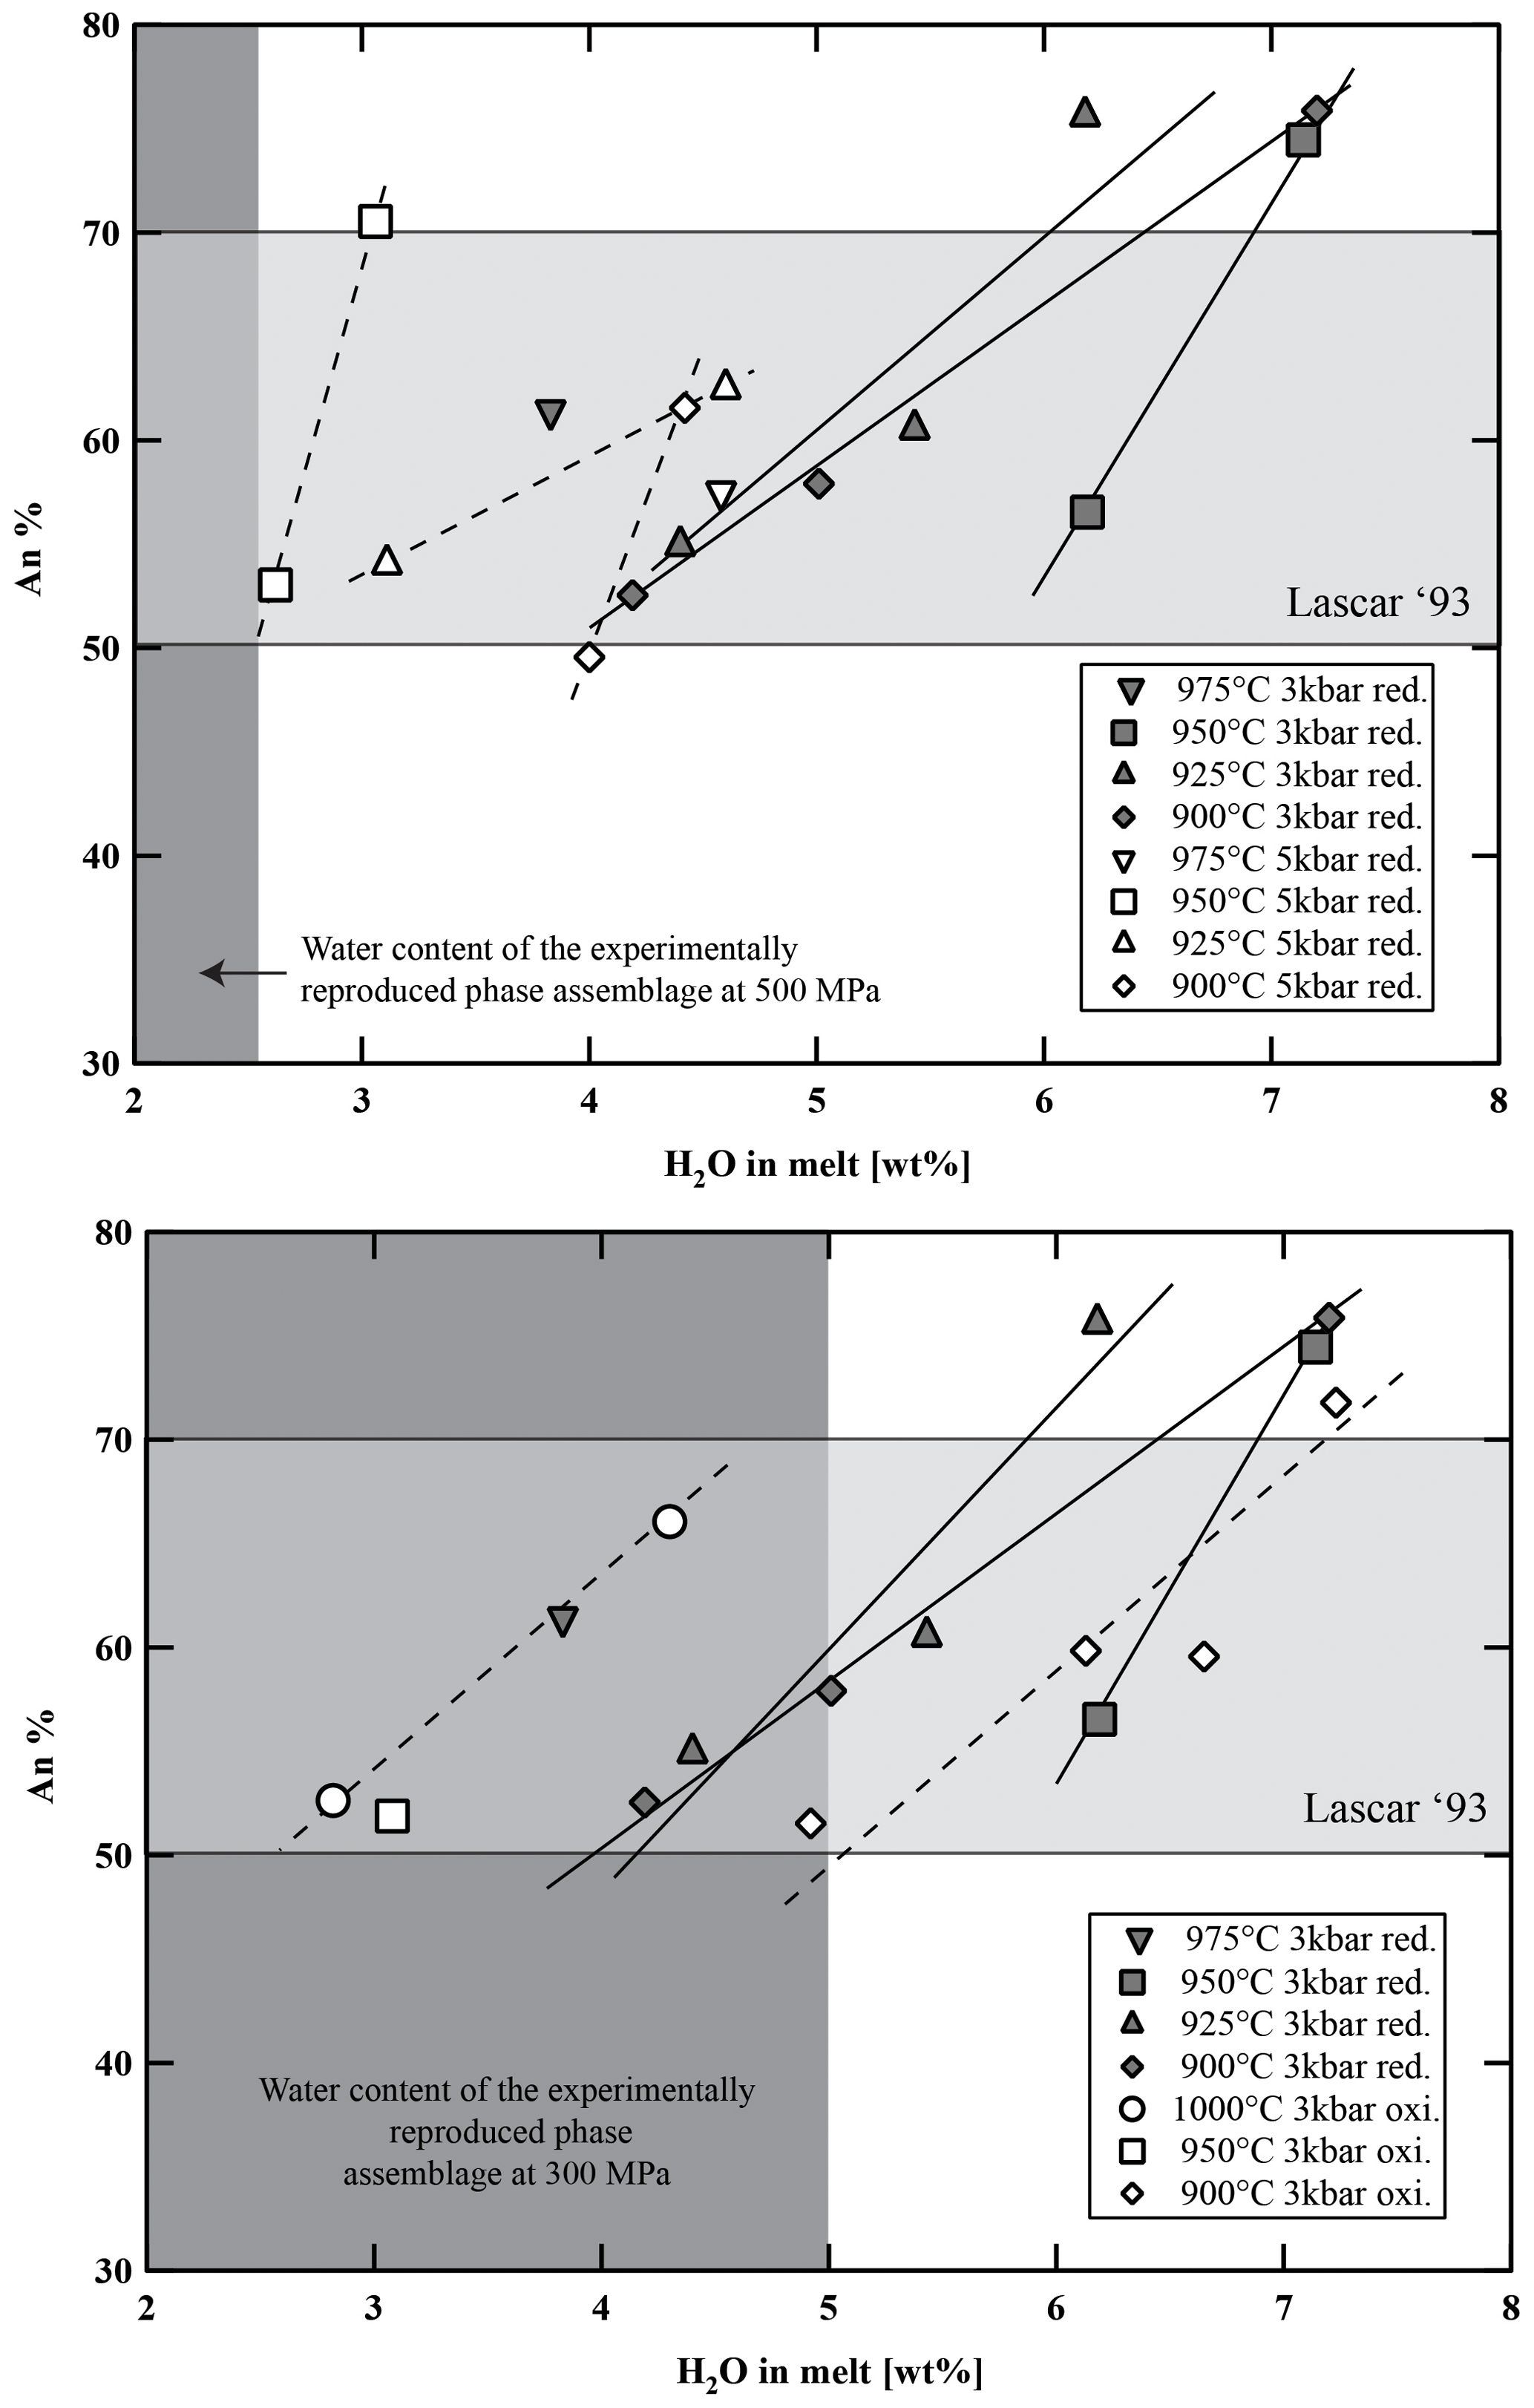
Figure 10Variation in anorthite content in experimental plagioclase versus water content in the melt, temperature, and fO2. Light-grey-shaded area represents the range of anorthite content of the natural Stage IV plagioclases of Lascar andesites (see histogram in Fig. S1). Dark-grey-shaded field represents the experimental phase assemblage field of Plag, Cpx, Opx, and Fe–Ti oxides with respect to H2Omelt.
5.3.3 Pyroxenes
The compositions of pyroxenes are given in Table S6 and plotted in Fig. 11. The change in pressure from 300 to 500 MPa does not influence the experimental pyroxene compositions significantly. Comparing both sets at 300 MPa at different fO2 values (Fig. 7), it can be noted that Opx compositions at oxidizing conditions (QFM+3.3) are clearly shifted towards higher enstatite components (En84 to En71). Opx obtained at more reducing conditions contains fewer En components with En80 to En59 values. The wollastonite component in the Opx is not influenced by fO2 and is between Wo3 to Wo5 in both sets (300 and 500 MPa). Experimental Cpx in both sets with reducing conditions has a relatively wide range of compositions with En40 to En50 and Wo35 to Wo44. In contrast, Cpx obtained at 300 MPa and oxidizing conditions has a narrow compositional field with En43 to En46 and Wo40 to Wo44 values. Finally, it is emphasized that the compositions of the experimental Opx and Cpx at high T are in reasonable agreement (±100 at 300 MPa) with the thermobarometer of Putirka (2008), as shown in Fig. 12. At 300 and 500 MPa, the calculated pressures for the low-T experiments (900–975 °C) are in reasonable agreement with the experimental pressures. In contrast, the calculated pressures for the high-T experiments (1000–1050 °C) are underestimated using Eq. (39) (using the experimental T as a temperature input) from Putirka (2008), especially for the 500 MPa experiments.
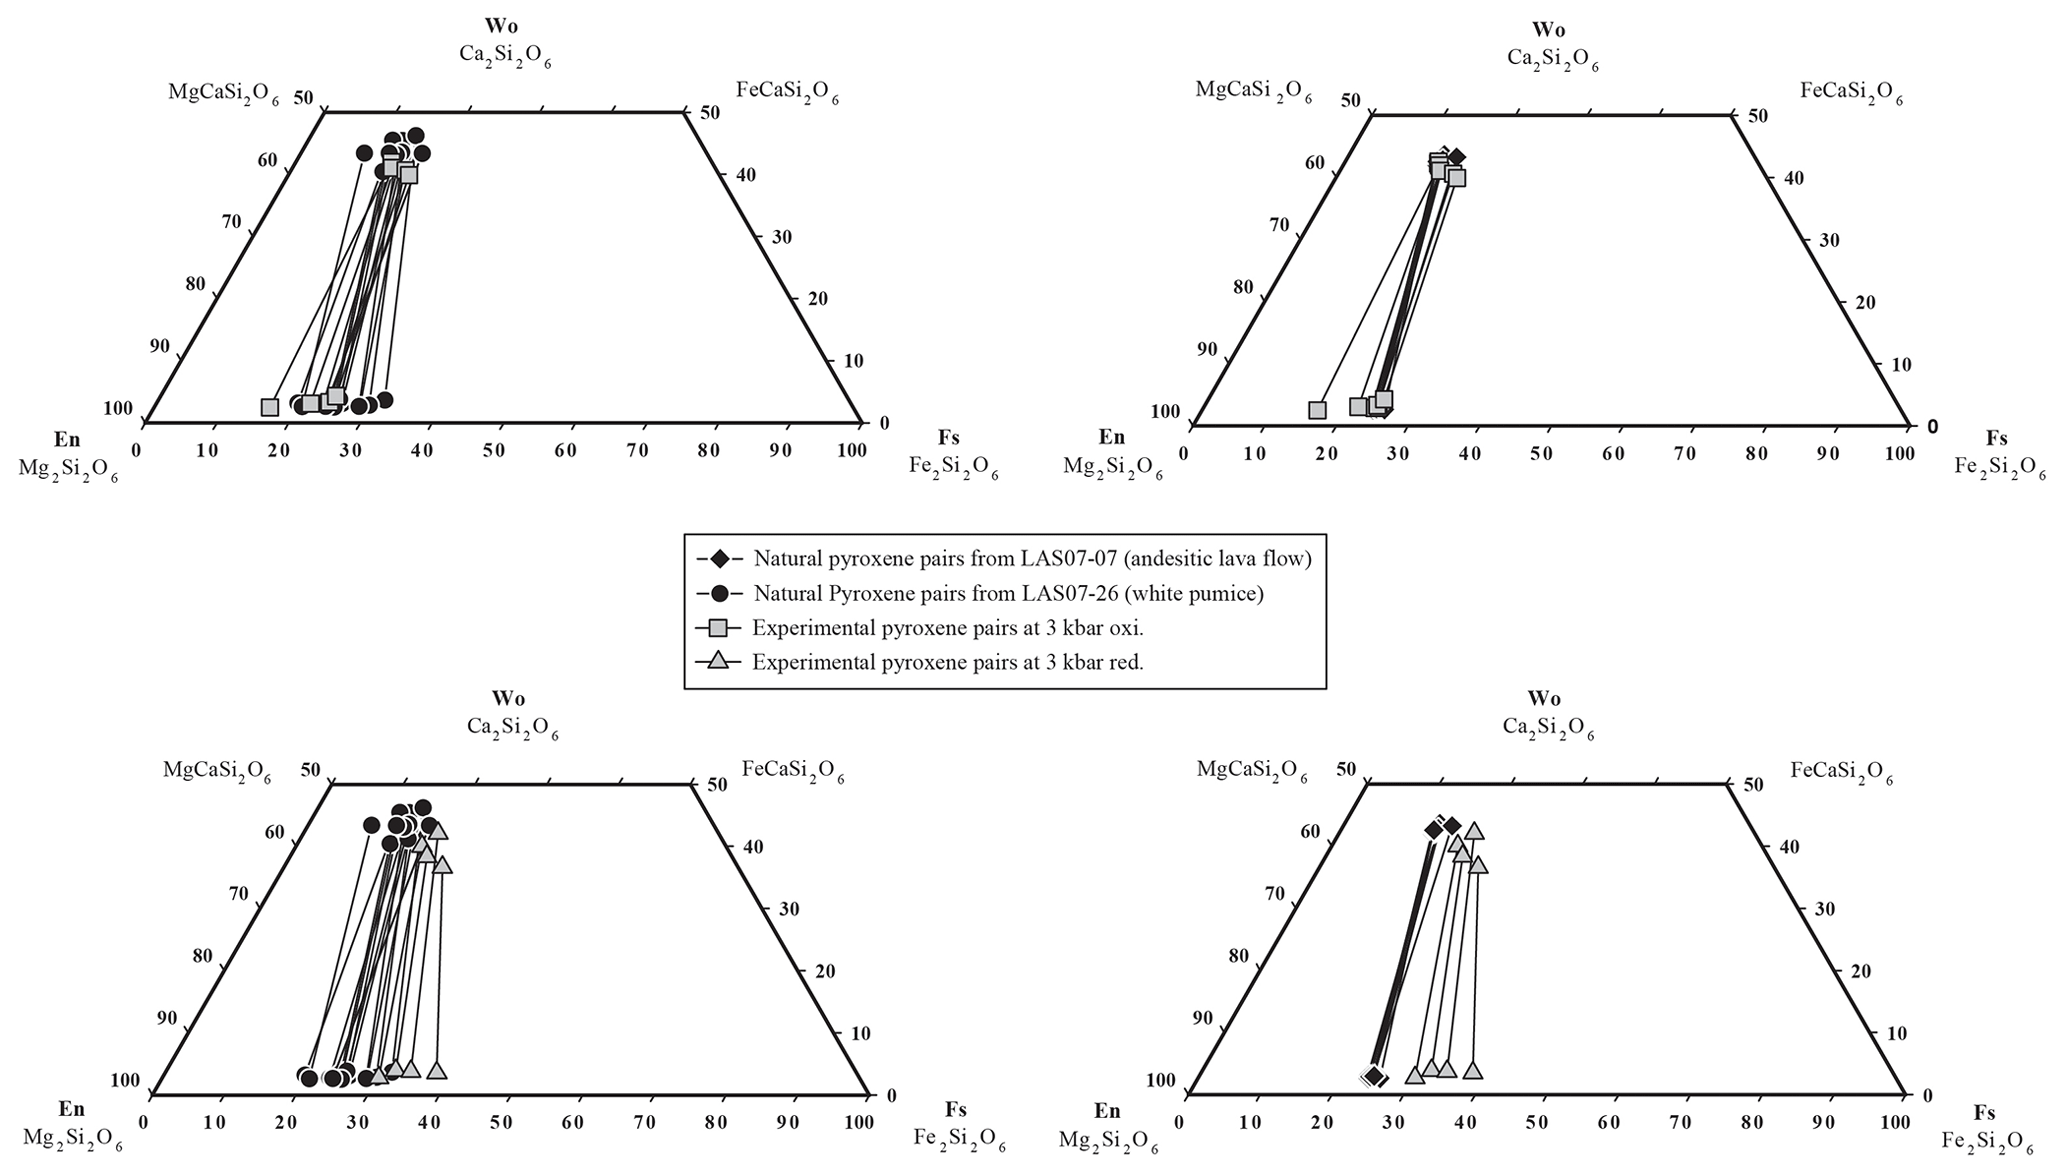
Figure 11Natural pyroxene pairs and experimental pyroxene pairs as a function of fO2. Connecting lines between the markers represent corresponding pairs. Only 300 MPa data are plotted to highlight the compositional difference at oxidizing and reducing conditions. Data at 500 MPa were only obtained at reducing conditions and are not reported. En: enstatite; Wo: wollastonite; Fs: ferrosilite.
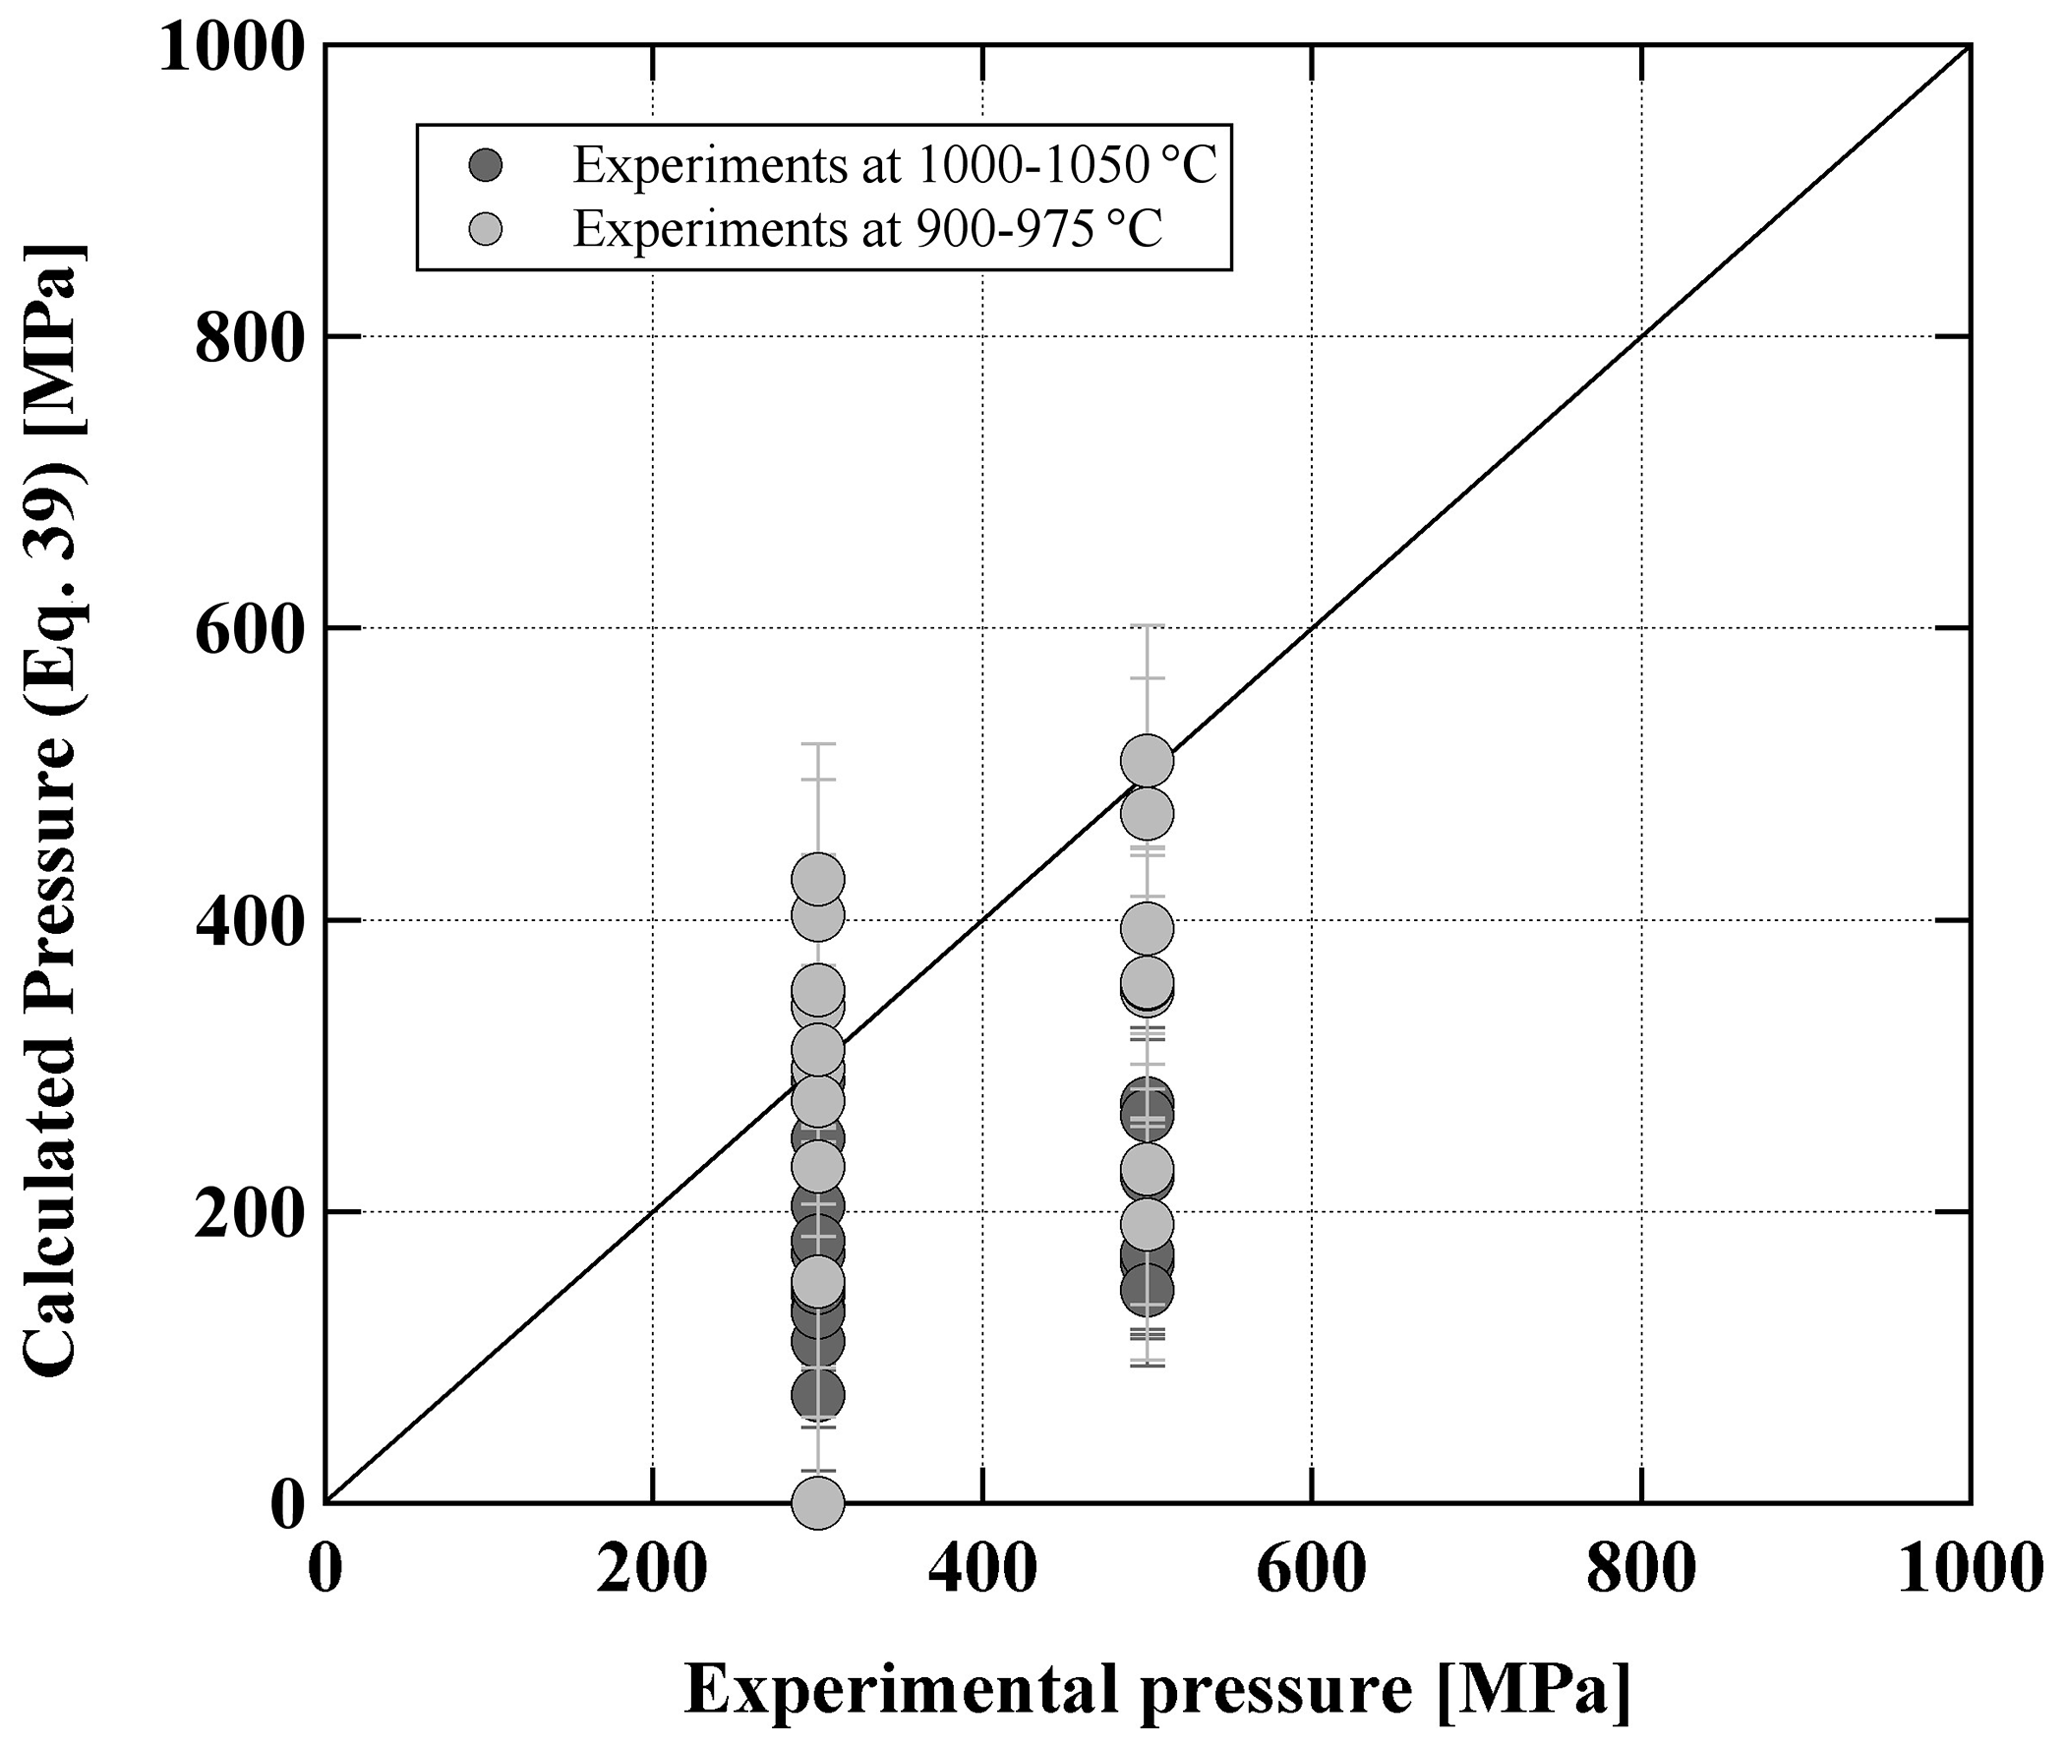
Figure 12Experimental pressures vs. calculated pressures from experimental pyroxene pairs using Eq. (39) from Putirka (2008). Experimental T is included in the calculation.
5.3.4 Amphibole
Experimental amphiboles are euhedral, unzoned tschermakites (Table S6) according to the classification of Leake et al. (2004). The Mg# of the crystallized Amp (calculated with all iron as FeOtot) increases with increasing H2Omelt. In agreement with previous experimental studies (e.g., Sisson and Grove, 1993, for basalts, and Martel et al., 1999, for andesites) AlIV increases with increasing T, whereas the number of Si atoms in the tetrahedral position of the amphibole formed at 975 °C is lower than that of Amp obtained at lower T.
5.3.5 Fe–Ti oxides
Due to the small size of the experimental oxide phases (Mt, Usp, Ilm), analyses of these phases are difficult and often contaminated by the surrounding glass as illustrated by the high and changing SiO2 contents. Ilmenite needles were usually too thin to obtain correct data, but an identification was possible with energy-dispersive X-ray (EDX) spectroscopy, allowing us to constrain the upper stability field in the phase diagrams (Fig. 7). Analyses of Mt given in Table S6 must be treated with caution and cannot be used to calculate pure end-member compositions or to compare with natural products.
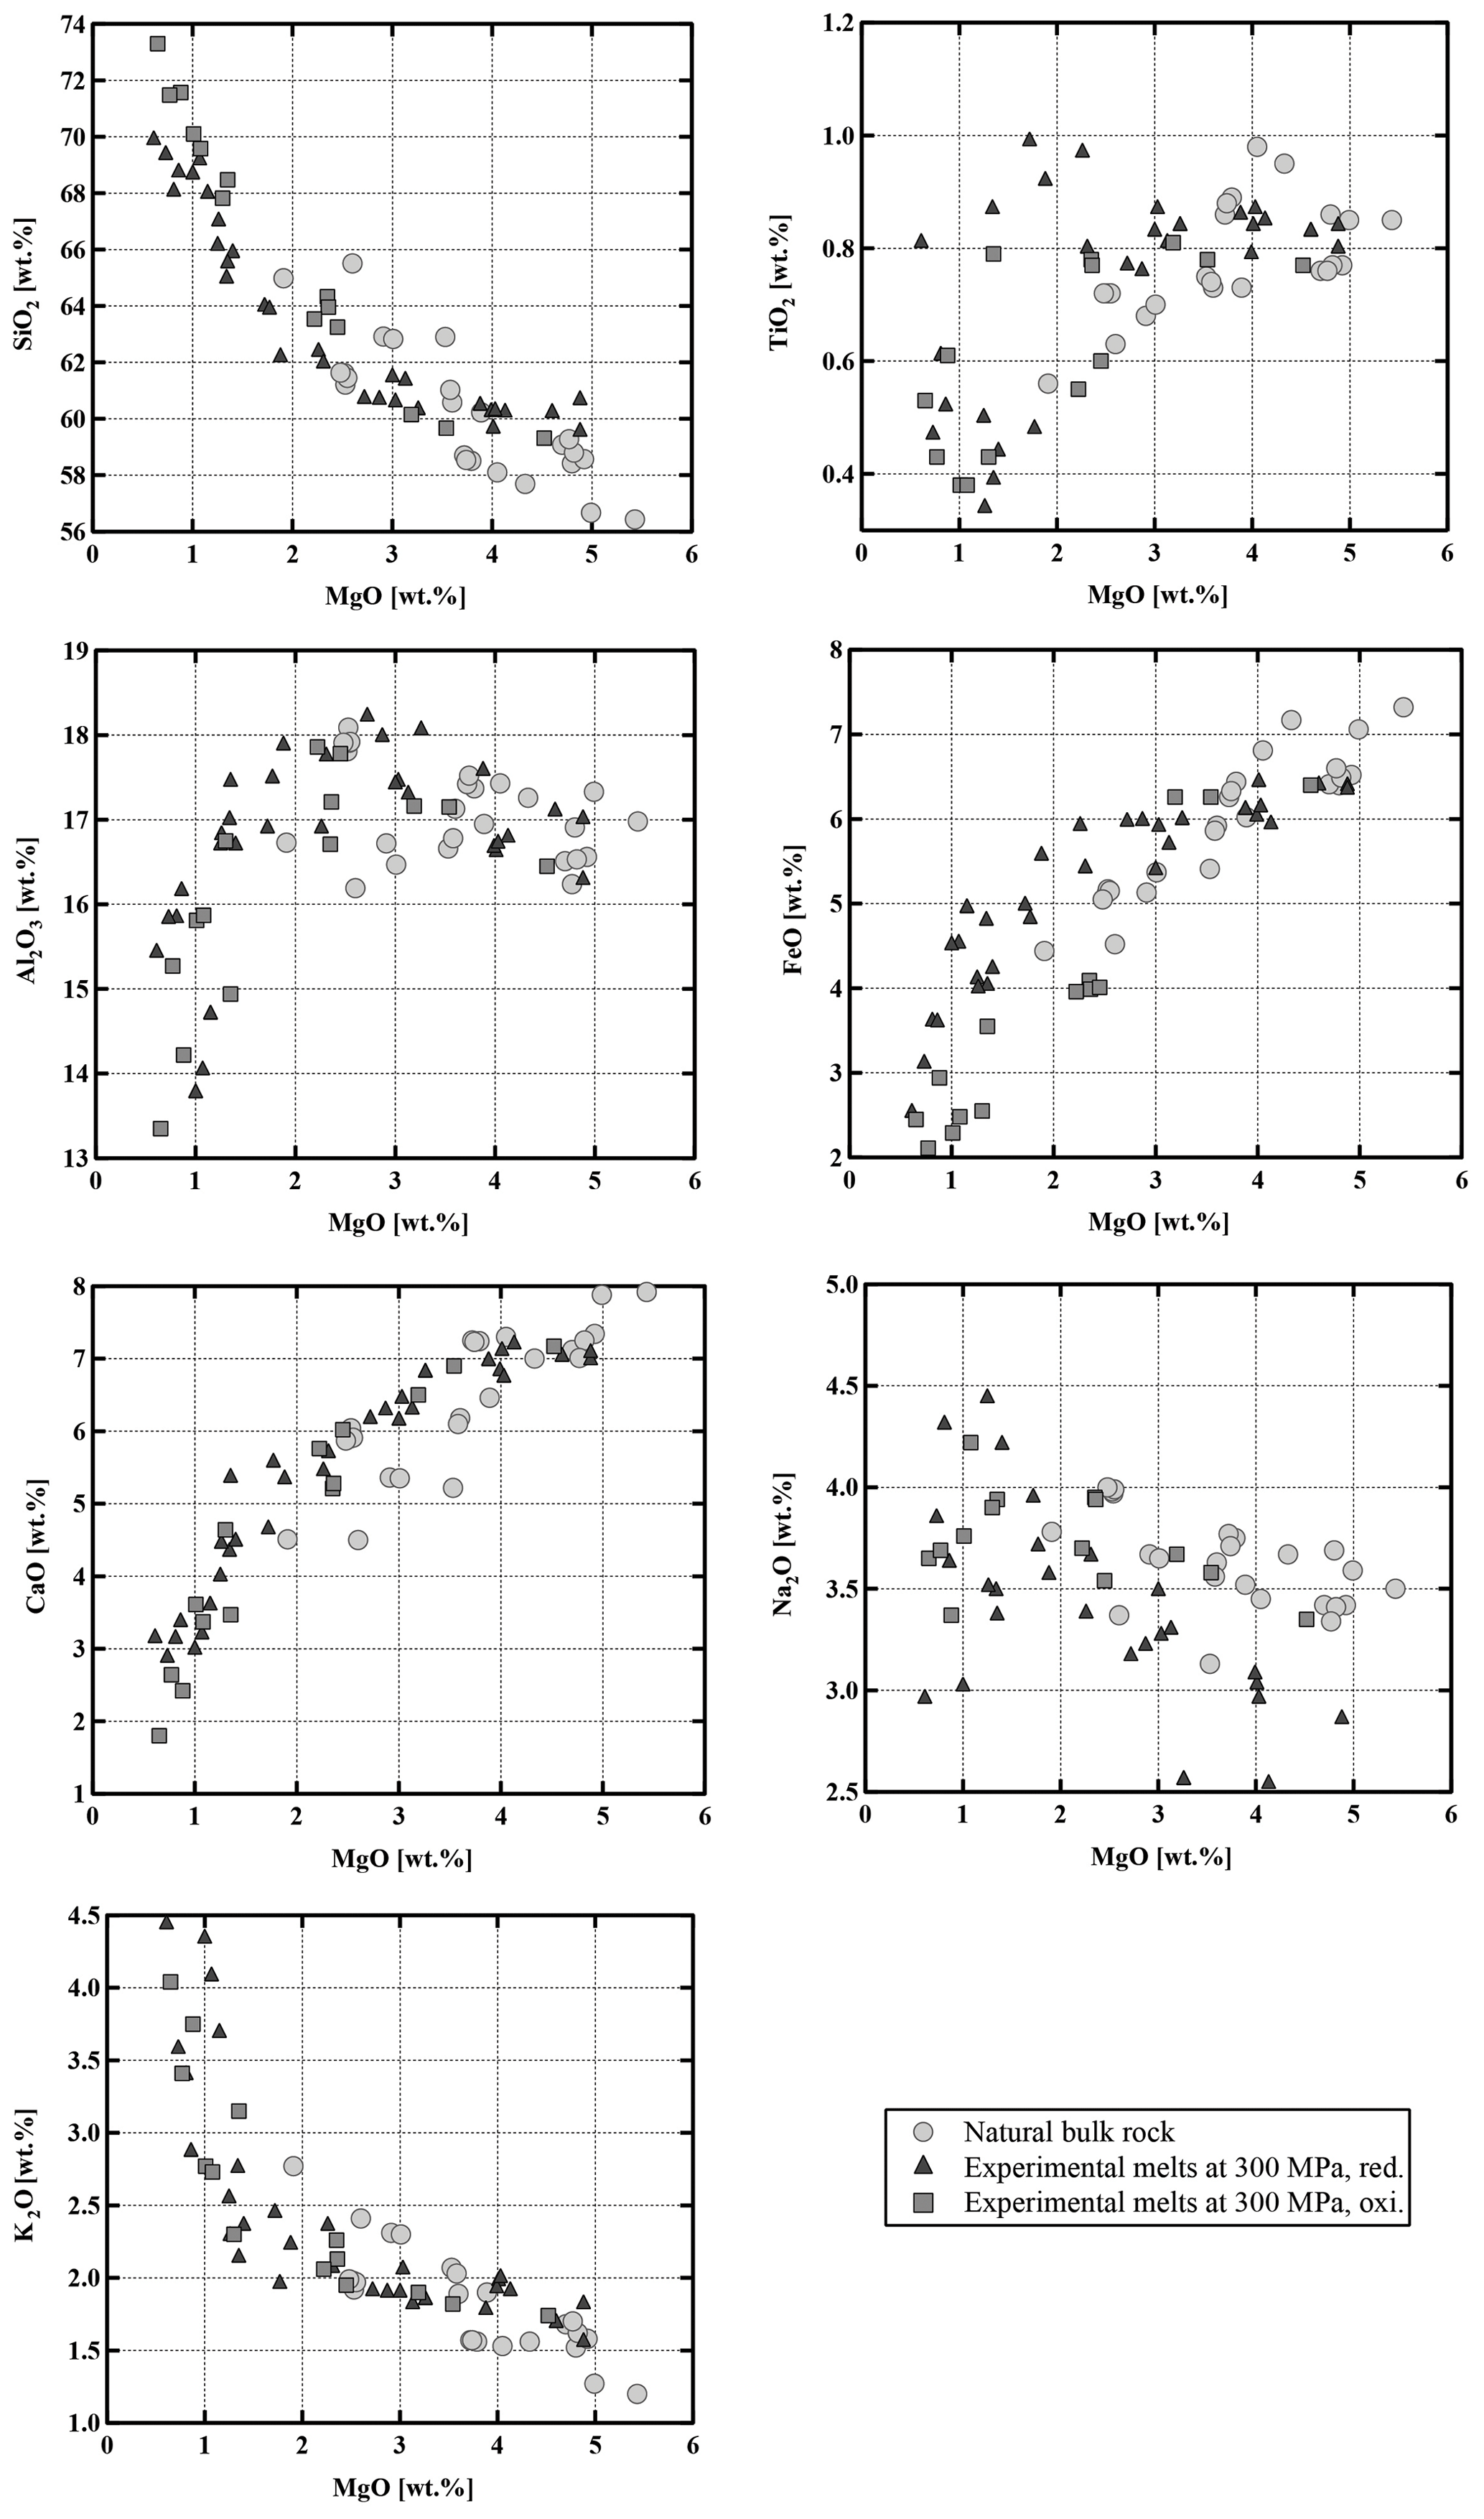
Figure 13Compositional evolution of experimental melts as a function of MgO (wt %) content (all comparisons are normalized to 100 %). The natural bulk rocks plotted on this figure are only samples from our field campaign (Table 1). For clarity, literature data (see Fig. 2) are not plotted. All data points normalized to 100 %.
5.3.6 Glass
Residual experimental glasses have compositions ranging from andesitic through dacitic to rhyolitic, depending on the experimental conditions (Fig. 13, Table S6). In all cases, compositions proved to be homogeneous within the analytical uncertainty, shown by the relatively small standard deviations of the measurements (Table S6). As expected, glass compositions show systematic compositional variations and are more evolved with an increasing crystal fraction as a result of decreasing temperature and H2Omelt. SiO2 and K2O increase with decreasing MgO, while Al2O3, CaO, and FeOtot decrease. Na2O shows no systematic variation or only a slight increase. Comparing experimental sets 1 and 2, both at reducing conditions but different pressures, no changes in general differentiation trends could be observed and the data at 500 MPa are not reported in Fig. 13 for clarity. A detailed analysis of FeOtot and TiO2 concentrations shows that there are major differences depending on the prevailing oxygen fugacity (by comparing experiments at the same P and T). At reducing conditions TiO2 increases with decreasing MgO content from 5 wt % to 1 wt %, indicating that the amount of oxides and especially Ilm remains low with increasing crystallinity. In contrast, at oxidizing conditions TiO2 decreases with decreasing MgO content due to the higher proportion of Mt crystallization. FeOtot decreases with decreasing MgO content in the melt at both investigated redox conditions. However, the decrease is more pronounced in the oxidizing experiments, which is related to the presence of Mt. At a constant MgO content in the melt, the FeOtot value can be up to ∼2 wt % higher at reducing conditions. The compositional differences as a function of fO2 are also very clear in a diagram of FeOtot MgO vs. SiO2 (Fig. 14). The FeOtot MgO ratio increases more strongly with increasing SiO2 in the reducing experiments when compared with the oxidizing experiments. In evolved residual melts, the FeOtot MgO values at reducing conditions cross the boundary from the calc–alkaline to the tholeiitic field (Miyashiro, 1974), as shown previously (e.g., Toplis and Carroll, 1995; Sisson and Grove, 1993; Andujar et al., 2015).
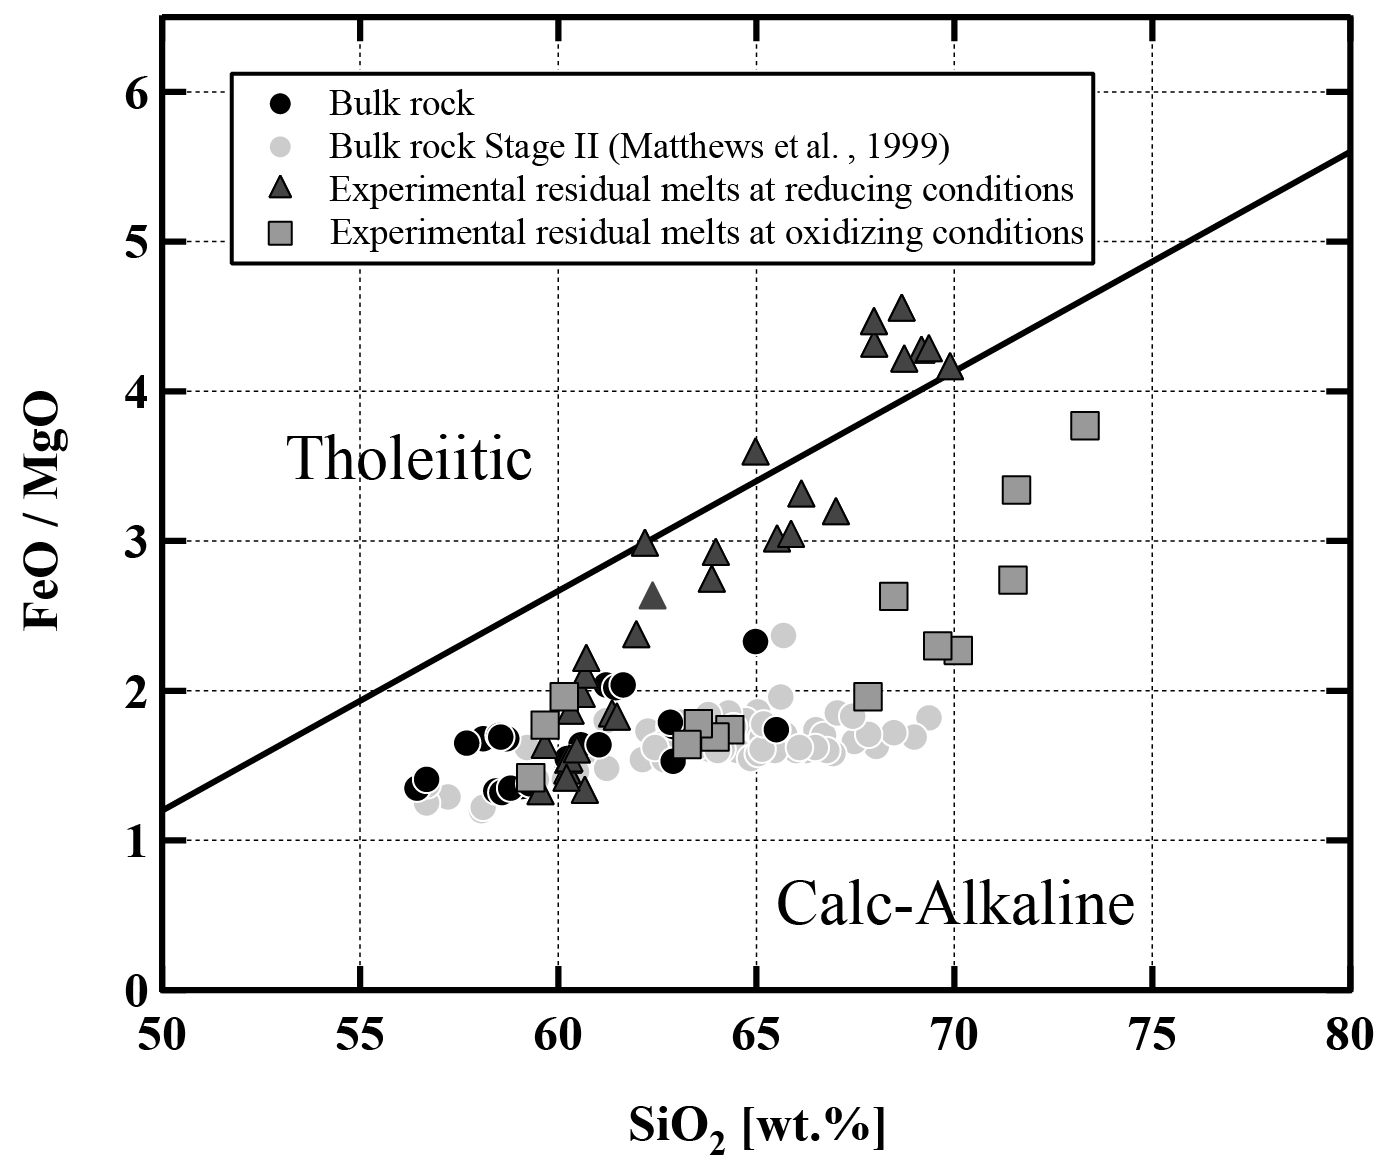
Figure 14SiO2 versus the FeOtot MgO ratio. Classification diagram for Lascar lavas and experimental residual glasses. Subdivision line after Miyashiro (1974). All data points normalized to 100 %.
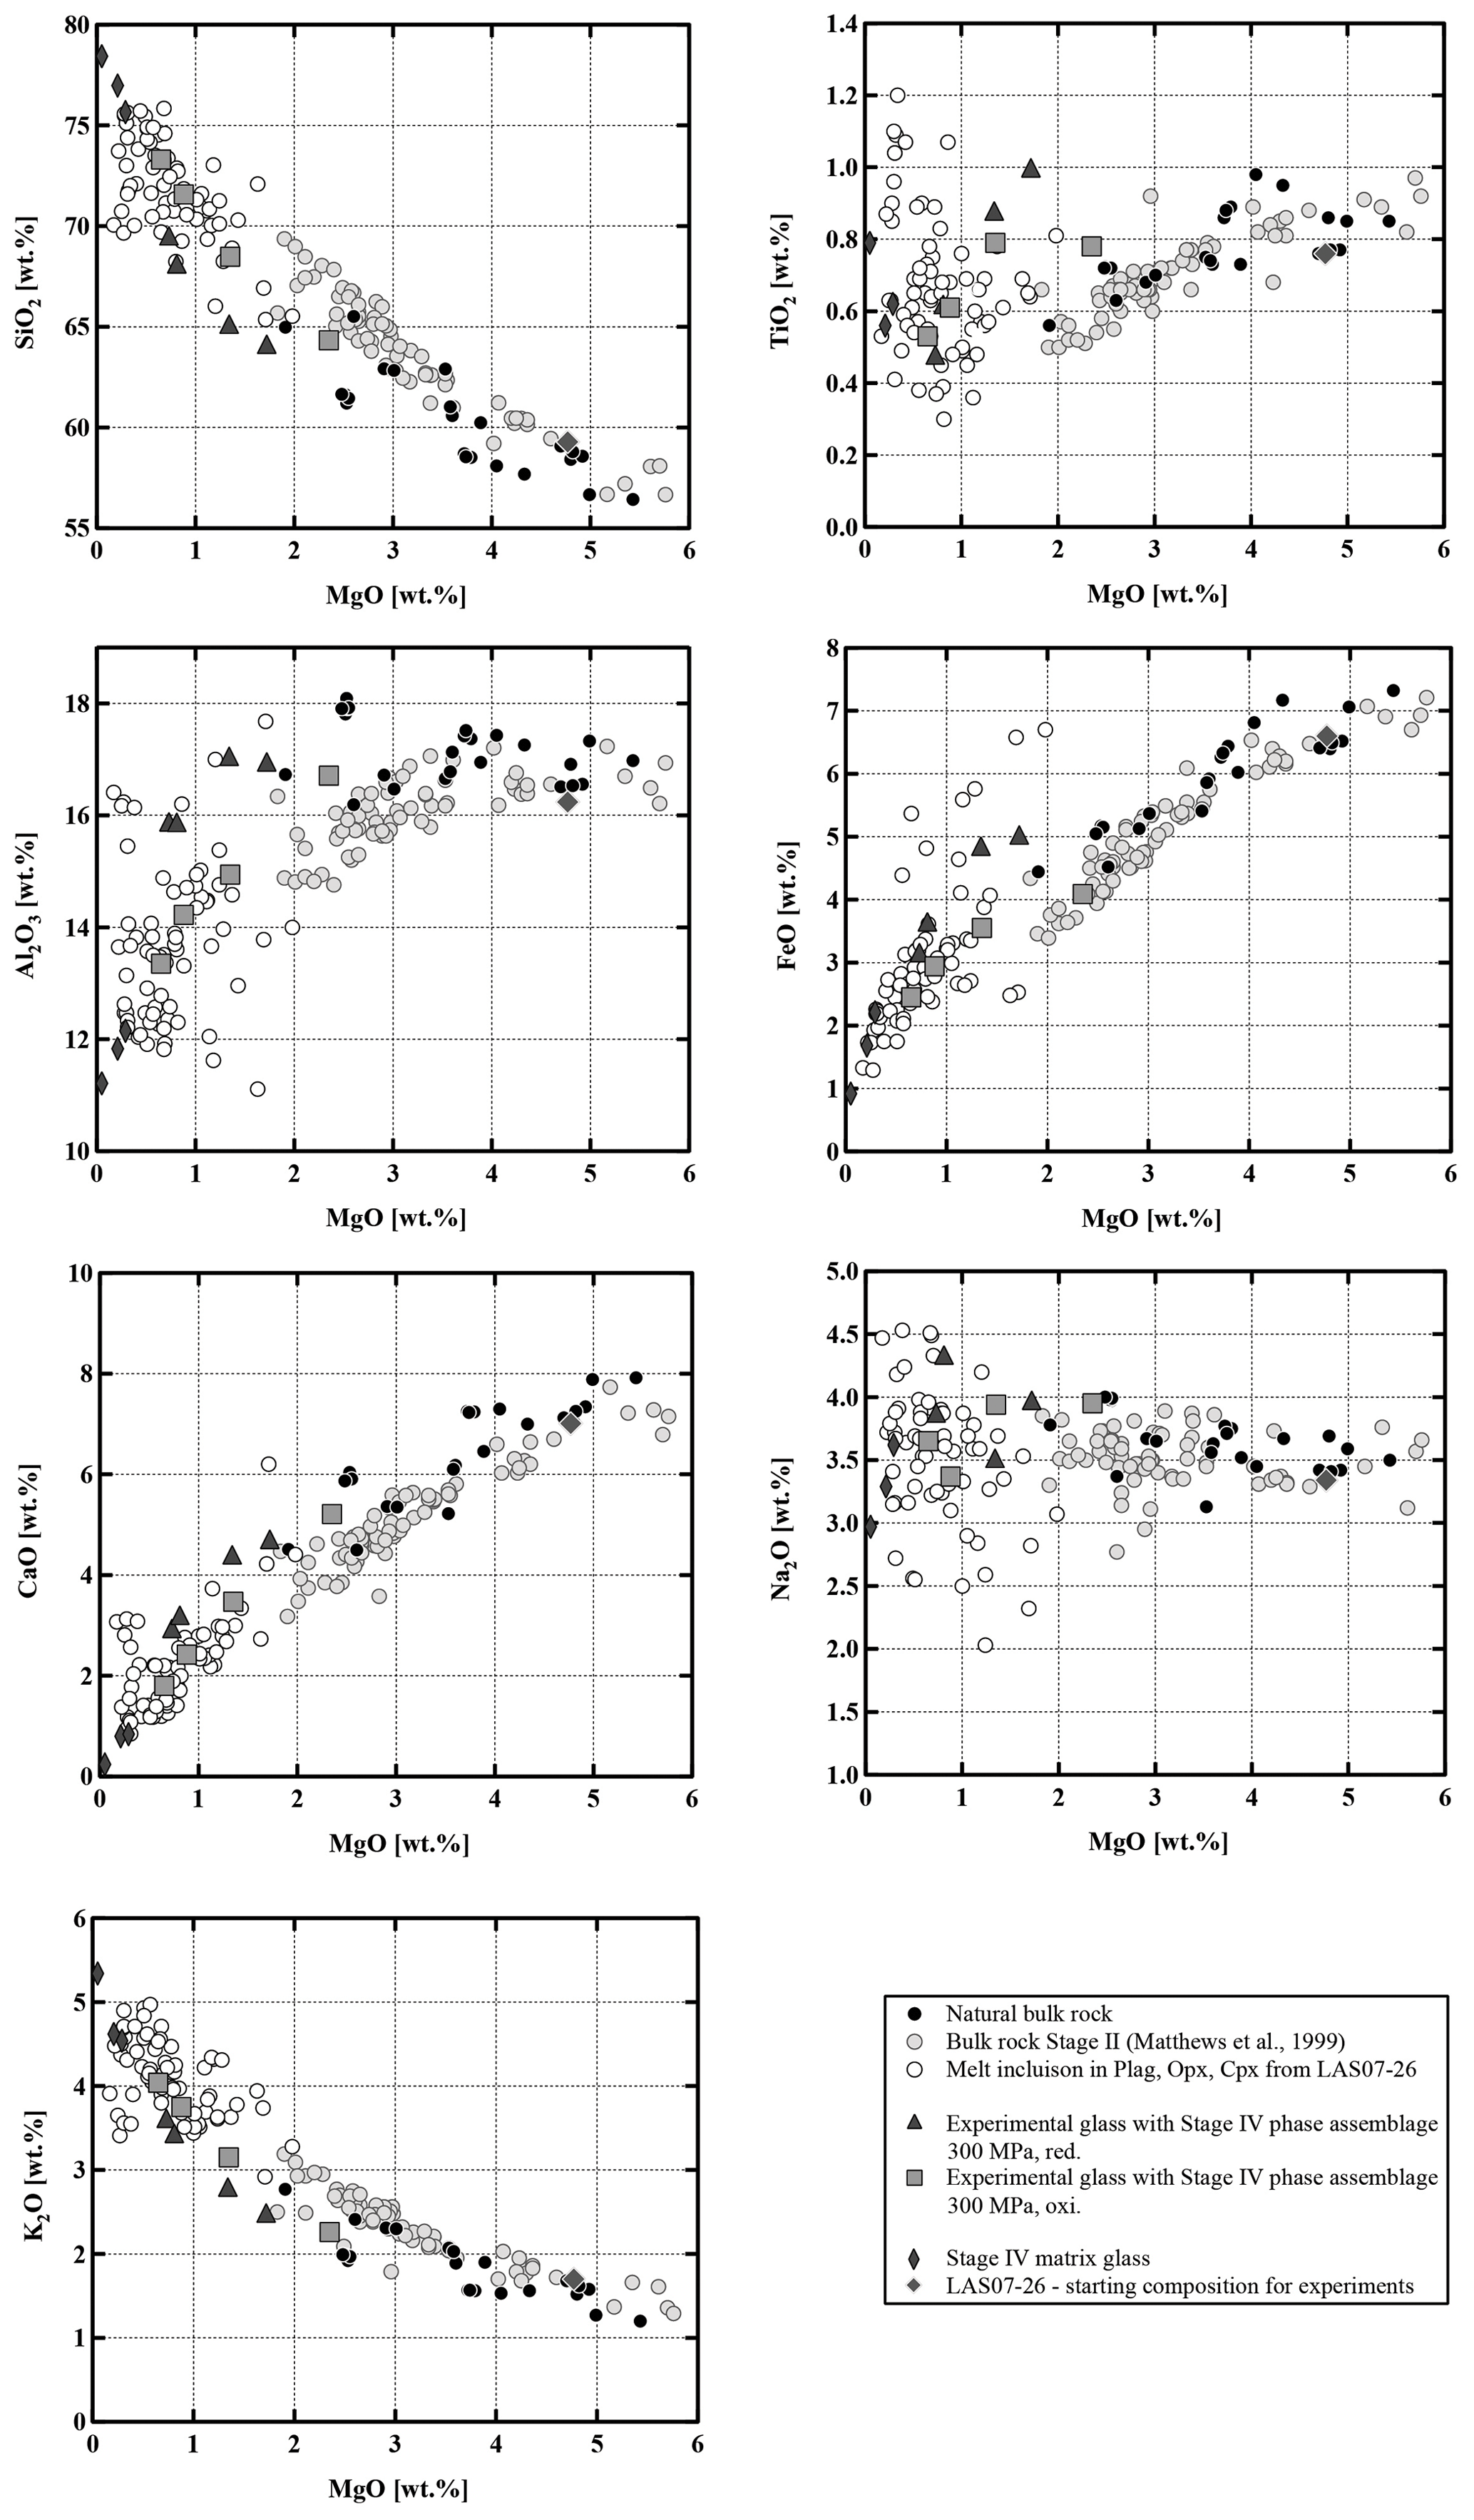
Figure 15Composition of natural bulk rocks; experimental melts in equilibrium with Stage IV mineral assemblage (Plag, Cpx, Opx); matrix glasses; and homogenized melt inclusions in Plag, Cpx, and Opx. All data points normalized to 100 %.
6.1 Comparison with previous work
The present work is in general agreement with previous experimental data sets performed on intermediate volcanic rocks and with the same experimental approach based on the determination of T–aH2O phase equilibrium diagrams (Martel et al., 1999, 2018; Scaillet and Evans, 1999; Costa et al., 2004; Botcharnikov et al., 2008a; Parat et al., 2008; Almeev et al., 2013a; Andújar et al., 2016, 2017). The main stable phases in andesitic magmas are Pl, Opx, Cpx, Amp, and Fe–Ti oxides. The decrease in the stability field of Pl with increasing pressure is in agreement with studies of Sekine et al. (1979) and Maksimov et al. (1978). Ol has a restricted stability field in andesitic systems, and this field is increasing with H2Omelt. Ol was only found to be present at reducing conditions (QFM+1.5) at 300 MPa, which is also shown by Botcharnikov et al. (2008a) at 200 MPa but is not stable in any experiments at 500 MPa (QFM+1.5) or at 300 MPa (QFM+3.3). Opx and Cpx tend to be stable in the water-poor part of the phase diagrams with a maximum extension to high H2Omelt between 850 to 950 °C as shown in experimental sets 1 and 2. This behavior is in very good agreement with studies from Scaillet and Evans (1999) and Costa et al. (2004). The compilation of all studies as well as of additional data for more basaltic or dacitic compositions (Dall' Agnol et al., 1999; Freise et al., 2009; Feig et al., 2010) indicates that the stability fields of Cpx and Opx always reach a maximum in terms of H2Omelt at an intermediate T of around 850–1000 °C. At lower T, Amp becomes the predominant Fe–Mg-bearing phase and reduces the stability field of the other mafic phases. Amp stability requires at least 4 wt % of water in the melt at 300 MPa, which is in good agreement with all mentioned previous studies. Data at 200 MPa indicate that H2Omelt above 5.5 wt % H2O may be necessary to stabilize Amp in andesitic systems (Martel et al., 1999). Considering our 300 and 500 MPa data, the Amp stability field seems to expend towards lower H2Omelt at higher P (compare Fig. 7a and c). This observation, which needs to be confirmed, would imply that amphibole breakdown not only may occur in the low-P range (100 MPa and below) when the water solubility in the melt is below ∼4 wt % H2O but also takes place during decompression in the range of 500–100 MPa.
6.2 P–T–fO2–H2O constraints on storage of the 1993 andesite
The crystallization experiments using an andesitic bulk composition confirm that T, fO2, and dissolved H2O significantly influence the crystallization sequence, the composition of minerals and their modal abundance, and therefore the chemistry of the residual melts. There is no evidence of a disequilibrium between the rim of the main mineral phases and the matrix glass (e.g., dissolution features, reaction rims), indicating that the mineral assemblage existing in natural phases can be used as a proxy to constrain pre-eruptive meltwater contents.
The phase diagrams at 300 MPa (Fig. 7a and b) show that the natural phase assemblage can only be reproduced within a restricted field of H2Omelt and T (grey field in Fig. 7). The lack of Amp phenocrysts and the presence of Pl in the Lascar volcanic rocks from the recent 1993 eruption (samples LAS07-23 and LAS07-26) and also in eruptive rocks from previous stages with a very similar phase assemblage (e.g., sample LAS07-12 from Stage III) restrict conditions to the low-H2Omelt side of the phase diagrams in Fig. 7, with T in the range of 950–1000 °C and with H2Omelt contents of <5 wt %. One anhydrous mineral phase having a composition particularly sensitive to the H2O content in the melt is Pl (e.g., Sisson and Grove, 1993; Almeev et al., 2012). Thus, the pre-eruptive H2Omelt and T can be more accurately bracketed by the comparison of the melt fraction, Pl composition, and Pl abundance between the experimental products and the eruptive material (Figs. 9 and 10). Within the field reproducing the natural phase assemblage, the compositions of natural Pl phenocrysts (An50 to An70) were obtained under water-undersaturated conditions (aH2O 0.75–0.56) with H2Omelt of ∼2.8 wt %–4.5 wt % in the T range of 950–1000 °C (300 MPa). The amount of melt, estimated from the proportion of groundmass and phenocrysts (Table 2), was also reproduced for this range of water contents at 950 to 1000 °C (Fig. 8). The experiment at 300 MPa, 1000 °C, and ∼2.8 wt % H2Omelt (sample no. Las-SH-13; with Cpx Mg# of 0.98, Opx Mg# of 0.94, and An# of 0.71) led to the same crystal melt ratio of that observed in the Lascar 1993 eruptive material, including all major phases of the natural rocks. These T and H2Omelt constraints are obtained assuming that all the Pl observed in the natural rock crystallized from the investigated bulk composition. If part of the phenocrysts, especially those with high An contents, are inherited (magma mixing or inherited from a crystal mush), the H2Omelt should be slightly higher and the temperature should be slightly lower. Thus, the estimated H2Omelt is a minimum value, and the estimated temperature is a maximum value. On the other hand, the H2Omelt contents cannot be higher than 4 wt %–5 wt % since Amp is not present.
The pre-eruptive pressure is more difficult to assess accurately. Results of the two-pyroxene barometer suggest a minimum pressure of crystallization of 300 MPa. But pressures of up to 500 MPa may be realistic (Fig. 3) using the model of Putirka (2008). However, the experimental T–H2Omelt field in which the natural phenocryst assemblage is reproduced shrinks significantly at 500 MPa (Fig. 7) and is shifted towards very low H2Omelt concentrations (<2.5 wt %). In this field the natural Pl compositions and their abundance cannot be reproduced (Figs. 9 and 10). In addition, the field in which crystal melt proportions observed in the natural lavas and ejecta are reproduced does not overlap with the field of the natural phase assemblage at 500 MPa (Fig. 8), suggesting that crystallization pressure needs to be considerably lower than 500 MPa. This relatively low pressure contrasts with calculations from Opx–Cpx pairs reported in Fig. 3 for some samples. However, taking into account the comparison between the model of Putirka (2008) and our experimental data (see above), pressures in the range of 500–1000 MPa calculated from Opx–Cpx pairs may be significantly overestimated.
The prevailing fO2 is best constrained by pyroxene compositions. Pyroxene pairs from experiments at oxidizing conditions and relatively reducing conditions were compared with natural pairs (Fig. 11) from the andesitic lava flow (sample LAS07-07, which also contains small amounts of Amp) and the white pumice (sample LAS07-26), which were used as starting material for the experiments.
Most of the pyroxene pairs produced from the experimental set at 300 MPa and high logfO2 (QFM+3.3 at aH2O=1) match the compositions of natural pairs from the andesitic lava flow and white pumice. Thus, a relatively high fO2 is necessary to obtain Fe Mg ratios such as those observed in natural pairs. On the contrary, most of the Cpx and Opx from experiments at lower fO2 values (QFM+1.5 at aH2O=1) are clearly shifted towards higher hedenbergite and ferrosilite components, indicating that experimental redox conditions may have been reducing too much. In general, the calculated logfO2 values for the experiments reproducing the Opx–Cpx pairs at oxidizing conditions are between QFM+2.7 and QFM+3.0 (Fig. 7, Table 7). These values are approximately one log unit higher than those calculated from the natural Mt–Ilm pairs. However, Opx and Cpx compositions can also match natural phases for some reducing experiments performed at relatively high H2Omelt levels and 975 °C (e.g., Las-56 and Las-57), but in these experiments Pl is missing, so the phase relations do not fall into the natural phase assemblage (experiments are outside the grey field in Fig. 7). It is emphasized that coexisting Mt–Ilm pairs could not be analyzed in our experiments. Thus, intermediate redox conditions between the two phase diagrams in Fig. 7a and b (reducing and oxidizing conditions) are the most realistic. Based on the phase diagrams conducted at 300 MPa, a field in which Mt and Ilm as well as Pl, Opx, and Cpx coexist (T–H2Omelt field covering the natural phase assemblage; grey fields in Fig. 7) is expected to be in the range of QFM+0.5 to QFM+1.5, which is consistent with the data from natural samples (Fig. 4).
In addition, the combination of experimental results and mineral chemistry of natural phases indicates that the pre-eruptive temperature prevailing in the magma reservoir of the Lascar 1993 andesites can be constrained to be 975±25 °C (Figs. 3 and 7). The pressure constraints obtained from the general phase assemblages and phase proportions indicate that the pressure of the magma reservoir cannot be much higher than 300 MPa. This pressure is confirmed by compositions of natural Opx–Cpx pairs of some samples (e.g., LAS07-07 and LAS07-08; Fig. 3). However, it cannot be ruled out that part of the pyroxene assemblage observed in some samples (e.g., LAS07-20, LAS07-23 and LAS07-26; Fig. 3) may have crystallized in a deeper reservoir. For example, Cpx and Opx crystallizing at 400 MPa from a composition similar to that used in this study (Tungurahua andesite from Andujar et al., 2017) at ∼ QFM+1 have compositions close the natural assemblage at 400 MPa and 1000 °C for H2Omelt of ∼6 wt %. However, at these conditions, Pl is not reproduced in our 500 MPa experiments. In our experiments, there is a restricted field in which Pl coexists with Cpx and Opx (MG# of 0.98 for both) at relatively low H2Omelt (<3 wt %). A pressure of 300 MPa was estimated to be the main pre-eruptive magma reservoir in the plumbing system in recent investigations of Robidoux et al. (2020) based on Opx–liquid, Cpx–liquid, and Opx–Cpx thermobarometry. It can be noted that the temperatures estimated by Robidoux et al. (2020) are generally higher (1050–1175 °C) and not representative of the main 300 MPa magma reservoir. One possible explanation for these high temperatures may be related to the choice of the liquid composition, which was determined from the analysis of matrix glasses. However, the matrix contains microlites and may not be representative of melt co-existing with Opx and Cpx.
At a pressure of 300 MPa, H2Omelt of 2.5 wt % to 4.5 wt % is necessary to obtain the natural phase assemblage, but the crystal melt ratio and the phase compositions are best reproduced for an H2Omelt value of 2.5±0.5 wt %. Thus, the mineralogy of the investigated sample is best reproduced for experiments Las-SH-08 and Las-SH-09 conducted at 300 MPa and 950 °C (compare Tables S2 and S6) with Mg# relatively close to 0.90 for Opx and Cpx and with an An# value of 0.86–0.70 for Plag. The corresponding logfO2 is in the range of QFM. As mentioned above, natural pyroxene compositions match with experiments better at slightly lower fO2, and natural Ilm–Mt pairs also indicate a logfO2 which could be in the range of QFM. However, note that the corresponding temperature for natural Mt–Ilm pairs is 880–920 °C, which is lower than the T estimated experimentally from Pl and pyroxene compositions.
Additionally, pre-eruptive conditions for Amp-bearing samples can also be constrained on the basis of the presented phase equilibrium experiments. A somewhat higher H2Omelt content (4 wt %–5 wt % at 300 MPa) would favor the crystallization of Amp from a two-pyroxene andesite. In this case the pre-eruptive temperature can be bracketed even more precisely due to the upper thermal stability of Amp at around 960 °C and the small stability field in which Plag, Cpx, Opx, Mt, and Amp are present (see Fig. 7).
6.3 Lascar andesitic magmas: differentiation vs. magma mixing
The Lascar rocks have a wide range of bulk compositions (55.6 wt %–65.2 wt % SiO2), and the observed compositional variations, including all eruptive phases as well as melt inclusions, cannot be interpreted by assuming a unique differentiation process during the whole volcanic history. The Lascar bulk-rock compositions do not follow a single evolution trend, indicating that complex interactions between various differentiation processes control the compositional evolution. Strong linear correlations for oxides pairs (e.g., SiO2, TiO2, FeO, CaO vs. MgO) on variation diagrams, which are not expected in the case of crystal fractionation processes, can be found for Stage II eruptions (Figs. 2 and 15, grey dots), although those for the alkalis (in particular Na2O) tend to be more scattered. The large variation in Al2O3 for a given MgO concentration and linear compositional variations in some binary diagrams in Fig. 2 indicate that the whole evolution trend cannot be explained by fractional crystallization only. These features could be interpreted as evidence of magma mixing of at least two end-members during Stage II magmatic processes. Blum-Oeste and Wörner (2016) and Wörner et al. (2018) for example propose that a majority of central Andean compositions can potentially be explained by highly variable mixing proportions of three ubiquitous end-members. In contrast, the bulk compositions of Lascar ejecta from Stage I and in particular Stage III do not plot along a straight line in the binary variation diagrams (Figs. 2 and 15), indicating that fractional crystallization may control the differentiation for these samples. This is supported by the experimental data showing the compositional evolution of selected residual melts coexisting with the mineral assemblage Pl + Cpx + Opx (Fig. 15).
The different differentiation processes (magma mixing vs. crystal fractionation) are also confirmed by the field observations. Typical features indicating magma mixing, like porphyritic or equigranular mafic inclusions in the andesitic and dacitic ejecta as can be found frequently at other CVZ volcanoes (e.g., Taapaca, Banaszak, 2014), were only found in one sample of the 1993 eruption (LAS07-19) and are mostly found in Stage II rocks as described by Matthews et al. (1999). However, the compositional-zoning patterns in some plagioclases from Stage IV (e.g., oscillatory reverse zoning in plagioclase and/or sieve-textured plagioclase) also indicate that the formation of these crystals involves complex processes such as repeated recharge and mixing with less evolved melts and possibly degassing events. The different P–T ranges given by pyroxenes from different samples from the same 1993 eruption also indicate that part of the pyroxene crystal cargo may have crystallized in the deeper magma plumbing system before being transported in the magma chamber at 300 MPa.
In addition to mixing processes, changing redox conditions in the magma reservoir may lead to different crystal fractionation trends in the natural samples, as illustrated by the liquid lines of descent determined experimentally (compare grey squares and grey triangles in Fig. 15). Experiments at reducing and oxidizing conditions at the same P and T conditions show that the most reducing melts follow a more bent trend in the variation diagrams. This not only is noticeable for redox-sensitive oxides such as FeO but also can be observed in diagrams with SiO2, Al2O3, CaO, and K2O vs. MgO. The crystal fractionation trends obtained at different pressures (300 and 500 MPa) and at the same oxygen fugacity do not show noticeable differences (within the error of the analytical techniques). Therefore, small variations in the major element trends of natural samples can be explained by minor variations in the oxygen fugacity.
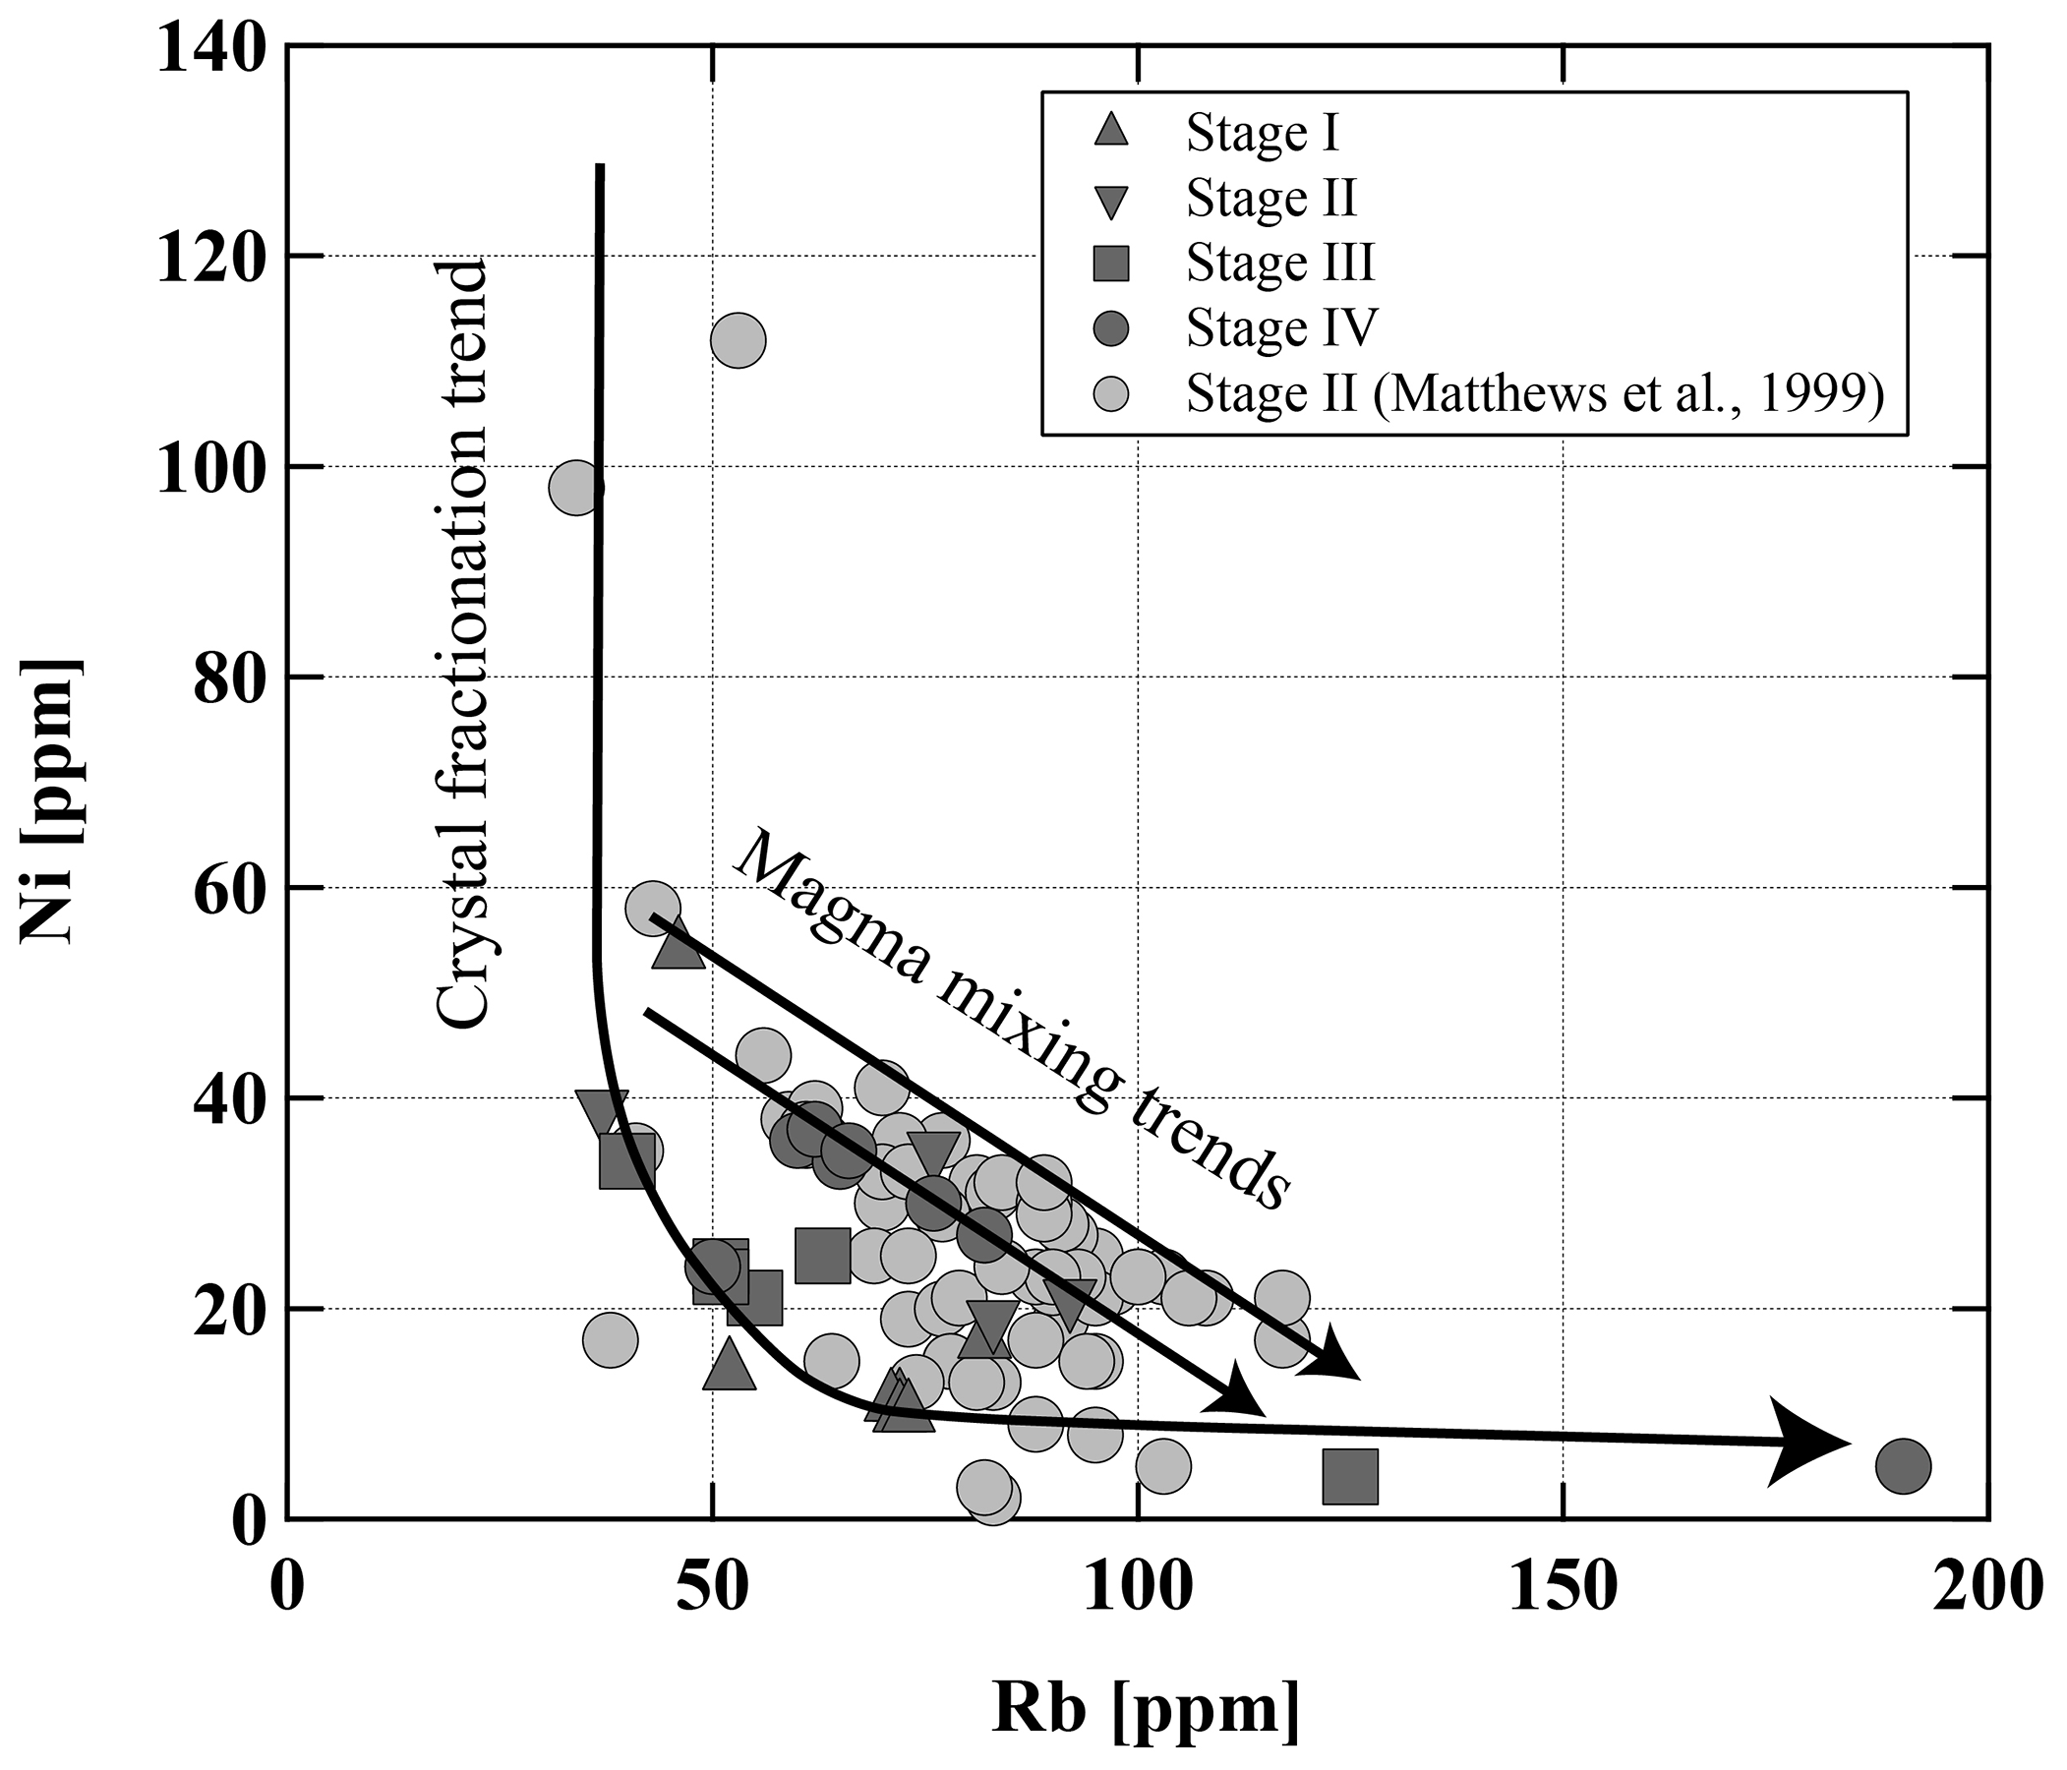
Figure 16Ni vs. Rb in Lascar rocks. Curved line is a fractional crystallization path; straight lines are mixing lines (both schematic).
Our general observations, indicating that eruptive samples may result from the complex interaction of mixing and crystal fractionation processes, are confirmed by the trace element distribution in whole-rock analyses. For example, the diagram of Ni vs. Rb (Wörner et al., 1988) in Fig. 16 underlines that magma mixing is a major factor controlling the compositional variation in Stage II. The majority of samples from Stage IV also follow also a typical mixing trend in the diagram of Ni vs. Rb, even though no clear petrographic evidence for mixing was found in some of these samples. Data of Ni vs. Rb show that crystal fractionation processes may dominate for other stages, such as Stage I and Stage III, but must be a contributing factor to the geochemical evolution in all four stages in the eruptive history of Lascar.
The detailed investigation of the mineralogy of samples from Stage IV also indicate that magmas which erupted within one eruptive event may record different differentiation processes. Although the majority of Stage IV samples do not plot along a fractionation trend, two samples, LAS07-07 and LAS07-26, follow the fractionation trend (Fig. 16). They correspond to the andesitic lava flow (7.1 kyr ago) and white-pumice samples (1993 eruption).
The detailed investigation of the mineralogy of samples of the 1993 eruption also indicate that the geochemistry of magmas erupted within one eruptive event may record different differentiation processes, some being controlled by crystal fractionation and others by magma mixing. The magmas erupted in the current Stage IV represent a more mafic, hotter, and drier system compared to previous stages.
Andesitic magma genesis and a magma reservoir model
A variety of models for andesitic magma genesis were proposed based on various approaches including experimental work (e.g., Martel et al., 1999; Sisson and Grove, 1993), melt inclusion studies (e.g., Reubi and Blundy, 2009), classic petrological studies (Almeev et al., 2013a), and geochemical modeling (e.g., Annen et al., 2006; Almeev et al., 2013b). Based on the experimental and analytical constraints gained in this study, the differentiation processes and magma-mixing processes occurred mainly in the upper part of the crust at pressures of MPa, corresponding to a depth of 10–13 km, assuming a density of the surrounding material of 2.8 g cm−3 (Lucassen et al., 2001). This is in agreement with the very low Sr Y (∼25) and Sm Yb (∼2) ratios for Lascar eruptives, suggesting that these processes did not occur in the lower crust due to the lack of a garnet signature, which would lead to higher Sr y and Sm Yb ratios (Mamani et al., 2010). This also implies that, even for the environment of a thickened continental crust, mafic magmas from the mantle migrated upwards into shallow magma reservoirs without major stagnation times in lower-crustal reservoirs.
Several studies have suggested storage at lower pressures of about 150±50 MPa for more silicic ignimbritic eruptions in the Altiplano–Puna Volcanic Complex (APVC) in the central Andes (Lindsay et al., 2001; Schmitt et al., 2001; Muir et al., 2014). Our phase equilibrium experiments and geobarometric calculations indicate that Lascar andesites are stored deeper (∼300 MPa). It is interesting to note that magnetotelluric measurements in combination with 3D modeling (Díaz et al., 2012) as well as seismic investigations (Gaete et al., 2019) fail to detect a magma reservoir beneath Lascar at a depth of 10–13 km. Magnetotelluric results point towards a very shallow conductive layer observed directly beneath the volcanic edifice, which is interpreted to be caused by fluids from the hydrothermal system rather than by very shallow magma reservoirs. A large, highly conductive anomaly was found beneath the Puna plateau, ∼80 km to the east of Lascar, starting at ∼20 km depth and probably expending to a greater depth (Díaz et al., 2012). The presence of such an anomaly fits well with previous conductivity models obtained beneath the Altiplano to the north (Brasse et al., 2002; Brasse and Eydam, 2008). In addition, seismic data identify a regional low-velocity zone, which is proposed as the magma source for many eruptions in the Altiplano region (Chmielowski et al., 1999; Schmitz et al., 1997). However, it is not clear if this region has a direct connection to a magmatic reservoir beneath Lascar.
The erupted material of the Stage IV magmas contains a large number of phenocrysts (Plag, Cpx, Opx,) with dacitic-to-rhyolitic MIs, indicating that these minerals were stored in a magma reservoir at relatively low temperature (and probably high crystallinity) before being entrained in the andesitic magma. Based on our results constraining temperature and meltwater content, the melt and mineral compositions of the 1993 andesitic magma were best reproduced at 975±25 °C, 300±50 MPa, and a logfO2 of QFM, under H2O-undersaturated conditions with 2.5 wt % H2O to 4.5 wt % H2O in the melt. The stability field of coexisting Plag, Cpx, and Opx significantly shrinks at higher pressure and shifts towards lower water concentrations in the melt, but pressures up to 400–500 MPa cannot be excluded. Taking the observations made for the Stage IV lavas into account, the geochemical characteristics of the entire suite of Lascar volcanics indicates that a fractionating magmatic system located at a depth of 10–13 km is periodically replenished with less evolved magma. It has to be noted that experiments at P<300 MPa have so far not been conducted. Thus, a shallower magma reservoir cannot be excluded. Additional experiments would be needed to test this hypothesis. However, the Opx–Cpx thermobarometric results as well as magnetotelluric investigations do not indicate the presence of such a shallow reservoir.
Some eruptive stages, such as Stage II, were dominated by products resulting most probably from the mixing of a mafic andesitic magma with a felsic component, which could be the silicic melt of a highly crystalline mush. The experiments confirm that residual melts after 40 %–55 % crystallization (with 25 %–30 % plagioclase) already match the composition of the silicic MIs (compare grey squares and triangles with MI compositions marked by open circles in Fig. 15). In this model, part of the phenocrysts present in the eruptive products may also be inherited from this low-temperature end-member. On the other hand, the compositional variation in some eruptive units such as Stage III can better be interpreted in terms of crystal fractionation. The change in one dominant mechanism to the other mechanism (mixing vs. crystal fractionation) may be related to the amount and frequency of magma recharge in the reservoir. Long episodes without significant recharge favor crystal fractionation, whereas frequent recharge events may favor mixing processes.
All data derived from this research are presented in the enclosed tables, figures, and Supplement. Additional data used in Figs. 2, 14, 15, and 16 are taken from Matthews et al. (1999).
The supplement related to this article is available online at: https://doi.org/10.5194/ejm-36-721-2024-supplement.
Samples were collected by MBO, REB, FH, and GW in 2007. AS designed and conducted the experiments; performed the analyses on the experimental products; and wrote the initial draft, including tables and figures. MBO performed all analyses on natural samples and did the P–T–fO2 calculations. REB took over supervision responsibilities for the research activity and mentorship of AS. FH and GW were in charge of the acquisition of the financial support by the Deutsche Forschungsgemeinschaft (DFG, German Research Foundation) for the project leading to this publication, supported the writing process, and took over supervision responsibilities of AS and MBO.
The contact author has declared that none of the authors has any competing interests.
Publisher’s note: Copernicus Publications remains neutral with regard to jurisdictional claims made in the text, published maps, institutional affiliations, or any other geographical representation in this paper. While Copernicus Publications makes every effort to include appropriate place names, the final responsibility lies with the authors.
This article is part of the special issue “Probing the Earth: magma and fluids, a tribute to the career of Michel Pichavant”. It is a result of the Magma & Fluids workshop, Orléans, France, 4–6 July 2022.
We thank Heinrich Brasse and Daniel Diaz for sharing with us their knowledge of Lascar volcano and help before and during the field campaign. We thank Otto Dietrich and Julian Feige for the preparation of the samples and the microprobe team at Leibniz Universität Hannover (LUH) for their help and support. Thoughtful and constructive reviews from Saskia Erdmann, Joan Andujar, and José L. Arce as well as the editorial handling by Fabrice Gaillard are gratefully acknowledged and helped to improve the presentation of this paper.
This research has been supported by the Deutsche Forschungsgemeinschaft (grant no. HO 1337/15-1).
This paper was edited by Fabrice Gaillard and reviewed by Joan Andujar, Saskia Erdmann, and José L. Arce.
Almeev, R. R., Holtz, F., Koepke, J., and Parat, F.: Experimental calibration of the effect of H2O on plagioclase crystallization in basaltic melt at 200 MPa, Am. Mineral., 97, 1234–1240, 2012.
Almeev, R. R., Holtz, F., Ariskin, A. A., and Kimura, J.-I.: Storage conditions of Bezymianny Volcano parental magmas: results of phase equilibria experiments at 100 and 700 MPa, Contrib. Mineral. Petr., 166, 1389–1414, 2013a.
Almeev, R. R., Kimura, J.-I., Ariskin, A. A., and Ozerov, A. Y.: Decoding crystal fractionation in calc-alkaline magmas from the Bezymianny Volcano (Kamchatka, Russia) using mineral and bulk rock compositions, J. Volcanol. Geoth. Res., 263, 141–171, 2013b.
Andersen, D. J.: New (and final!) models for the Ti-magnetite/ilmenite geothermometer and oxygen barometer, Abstracts of American Geophysical Union 1985 Spring Meeting, 1985.
Andersen, D. J. and Lindsley, D. H.: Internally consistent solution models for Fe-Mg-Mn-Ti oxides; Fe-Ti oxides, Am. Mineral., 73, 714–726, 1988.
Andersen, D. J., Lindsley, D. H., and Davidson, P. M.: QUILF: A pascal program to assess equilibria among Fe-Mg-Mn-Ti oxides, pyroxenes, olivine, and quartz, Comput. Geosci., 19, 1333–1350, 1993.
Andújar, J., Scaillet, B., Pichavant, M., and Druitt, T. H.: Differentiation conditions of a basaltic magma from Santorini, and its bearing on the production of andesite in arc settings, J. Petrol., 56, 765–794, 2015.
Andújar, J., Scaillet, B., Pichavant, M., and Druitt, T. H.: Generation conditions of dacite and rhyodacite via the crystallization of an andesitic magma. Implications for the plumbing system at Santorini (Greece) and the origin of tholeiitic or calc-alkaline differentiation trends in arc magmas, J. Petrol., 57, 1887–1920, 2016.
Andújar, J., Martel, C., Pichavant, M., Samaniego, P., Scaillet, B., and Molina, I.: Structure of the plumbing system at Tungurahua volcano, Ecuador: insights from phase equilibrium experiments on July–August 2006 eruption products, J. Petrol., 58, 1249–1278, 2017.
Annen, C., Blundy, J., and Sparks, R.: The genesis of intermediate and silicic magmas in deep crustal hot zones, J. Petrol., 47, 505–539, 2006.
Bacon, C. R. and Hirschmann, M. M.: Mg/Mn partitioning as a test for equilibrium between coexisting Fe-Ti oxides, Am. Mineral., 73, 57–61, 1988.
Banaszak, M.: Differentiation regimes in the Central Andean magma systems: case studies of Taapaca and Parinacota volcanoes, Northern Chile, Doctoral Thesis, Niedersächsische Staats- und Universitätsbibliothek Göttingen, https://doi.org/10.53846/goediss-4748, 2014.
Beck, S. L., Zandt, G., Myers, S. C., Wallace, T. C., Silver, P. G., and Drake, L.: Crustal-thickness variations in the central Andes, Geology, 24, 407–410, 1996.
Behrens, H., Romano, C., Nowak, M., Holtz, F., and Dingwell, D. B.: Near-infrared spectroscopic determination of water species in glasses of the system MAlSi3O8 (M= Li, Na, K): an interlaboratory study, Chem. Geol., 128, 41–63, 1996.
Berndt, J., Liebske, C., Holtz, F., Freise, M., Nowak, M., Ziegenbein, D., Hurkuck, W., and Koepke, J. R.: A combined rapid-quench and H2-membrane setup for internally heated pressure vessels: Description and application for water solubility in basaltic melts, Am. Mineral., 87, 1717–1726, 2002.
Blum-Oeste, M. and Wörner, G.: Central Andean magmatism can be constrained by three ubiquitous end-members, Terra Nova, 28, 434–440, 2016.
Blundy, J. and Cashman, K.: Rapid decompression-driven crystallization recorded by melt inclusions from Mount St. Helens volcano, Geology, 33, 793–796, 2005.
Botcharnikov, R. E., Koepke, J., Holtz, F., McCammon, C., and Wilke, M.: The effect of water activity on the oxidation and structural state of Fe in a ferro-basaltic melt, Geochim. Cosmochim. Ac., 69, 5071–5085, 2005.
Botcharnikov, R., Behrens, H., and Holtz, F.: Solubility and speciation of C–O–H fluids in andesitic melt at T= 1100–1300 C and P= 200 and 500 MPa, Chem. Geol., 229, 125–143, 2006.
Botcharnikov, R., Almeev, R., Koepke, J., and Holtz, F.: Phase relations and liquid lines of descent in hydrous ferrobasalt–implications for the Skaergaard intrusion and Columbia River flood basalts, J. Petrol., 49, 1687–1727, 2008a.
Botcharnikov, R. E., Holtz, F., Almeev, R. R., Sato, H., and Behrens, H.: Storage conditions and evolution of andesitic magma prior to the 1991–95 eruption of Unzen volcano: Constraints from natural samples and phase equilibria experiments, J. Volcanol. Geoth. Res., 175, 168–180, 2008b.
Brasse, H. and Eydam, D.: Electrical conductivity beneath the Bolivian Orocline and its relation to subduction processes at the South American continental margin, J. Geophys. Res.-Sol. Ea., 113, https://doi.org/10.1029/2007JB005142, 2008.
Brasse, H., Lezaeta, P., Rath, V., Schwalenberg, K., Soyer, W., and Haak, V.: The Bolivian altiplano conductivity anomaly, J. Geophys. Res.-Sol. Ea., 107, EPM 4-1–EPM 4-14, 2002.
Burnham, C. W.: The importance of volatile constituents, in: Evolution of the Igneous Rocks, Princeton University Press, 439–482, https://doi.org/10.1515/9781400868506-017, 2015.
Calder, E., Sparks, R., and Gardeweg, M.: Erosion, transport and segregation of pumice and lithic clasts in pyroclastic flows inferred from ignimbrite at Lascar Volcano, Chile, J. Volcanol. Geoth. Res., 104, 201–235, 2000.
Cashman, K. V.: Groundmass crystallization of Mount St. Helens dacite, 1980–1986: a tool for interpreting shallow magmatic processes, Contrib. Mineral. Petr., 109, 431–449, 1992.
Chmielowski, J., Zandt, G., and Haberland, C.: The central Andean Altiplano-Puna magma body, Geophys. Res. Lett., 26, 783–786, 1999.
Costa, F., Scaillet, B., and Pichavant, M.: Petrological and experimental constraints on the pre-eruption conditions of Holocene dacite from Volcán San Pedro (36 S, Chilean Andes) and the importance of sulphur in silicic subduction-related magmas, J. Petrol., 45, 855–881, 2004.
Dall' Agnol, R., Scaillet, B., and Pichavant, M.: An experimental study of a lower Proterozoic A-type granite from theEastern Amazonian Craton, Brazil, J. Petrol., 40, 1673–1698, 1999.
Davies, J. H. and Stevenson, D. J.: Physical model of source region of subduction zone volcanics, J. Geophys. Res.-Sol. Ea., 97, 2037–2070, 1992.
Díaz, D., Brasse, H., and Ticona, F.: Conductivity distribution beneath Lascar volcano (Northern Chile) and the Puna, inferred from magnetotelluric data, J. Volcanol. Geoth. Res., 217, 21–29, 2012.
Drake, M. J. and Weill, D. F.: Partition of Sr, Ba, Ca, Y, Eu2+, Eu3+, and other REE between plagioclase feldspar and magmatic liquid: an experimental study, Geochim. Cosmochim. Ac., 39, 689–712, 1975.
Feig, S. T., Koepke, J., and Snow, J. E.: Effect of oxygen fugacity and water on phase equilibria of a hydrous tholeiitic basalt, Contrib. Mineral. Petr., 160, 551–568, 2010.
Freise, M., Holtz, F., Nowak, M., Scoates, J. S., and Strauss, H.: Differentiation and crystallization conditions of basalts from the Kerguelen large igneous province: an experimental study, Contrib. Mineral. Petr., 158, 505–527, 2009.
Frost, B. R.: Introduction to oxygen fugacity and its petrologic importance, in: Oxide minerals, De Gruyter, 1–10, https://doi.org/10.1515/9781501508684-004, 2018.
Gaete, A., Cesca, S., Franco, L., San Martin, J., Cartes, C., and Walter, T. R.: Seismic activity during the 2013–2015 intereruptive phase at Lascar volcano, Chile, Geophys. J. Int., 219, 449–463, 2019.
Gaete, A., Walter, T. R., Bredemeyer, S., Zimmer, M., Kujawa, C., Franco Marin, L., San Martin, J., and Bucarey Parra, C.: Processes culminating in the 2015 phreatic explosion at Lascar volcano, Chile, evidenced by multiparametric data, Nat. Hazards Earth Syst. Sci., 20, 377–397, https://doi.org/10.5194/nhess-20-377-2020, 2020.
Gardeweg, M. and Medina, E.: La erupción subpliniana del 19–20 de Abril de 1993 del volcan Lascar, N de Chile, Actas del 7. Congreso Geologico Chileno, 7, 299–304, 1994.
Gardeweg, M., Sparks, R., and Matthews, S.: Evolution of Lascar volcano, northern Chile, J. Geol. Soc., 155, 89–104, 1998.
Green, T., Sie, S., Ryan, C., and Cousens, D.: Proton microprobe-determined partitioning of Nb, Ta, Zr, Sr and Y between garnet, clinopyroxene and basaltic magma at high pressure and temperature, Chem. Geol., 74, 201–216, 1989.
Gutscher, M.-A.: Andean subduction styles and their effect on thermal structure and interplate coupling, J. S. Am. Earth Sci., 15, 3–10, 2002.
Haschke, M., Siebel, W., Günther, A., and Scheuber, E.: Repeated crustal thickening and recycling during the Andean orogeny in north Chile (21–26 S), J. Geophys. Res.-Sol. Ea., 107, ECV 6-1–ECV 6-18, 2002.
Hildreth, W. and Moorbath, S.: Crustal contributions to arc magmatism in the Andes of central Chile, Contrib. Mineral. Petr., 98, 455–489, 1988.
Hou, T., Botcharnikov, R., Moulas, E., Just, T., Berndt, J., Koepke, J., Zhang, Z., Wang, M., Yang, Z., and Holtz, F.: Kinetics of Fe–Ti oxide re-equilibration in magmatic systems: implications for thermo-oxybarometry, J. Petrol., 61, egaa116, https://doi.org/10.1093/petrology/egaa116, 2020.
Leake, B. E., Woolley, A. R., Birch, W. D., Burke, E. A., Ferraris, G., Grice, J. D., Hawthorne, F. C., Kisch, H. J., Krivovichev, V. G., and Schumacher, J. C.: Nomenclature of amphiboles: additions and revisions to the International Mineralogical Association's amphibole nomenclature, Am. Mineral., 89, 883–887, 2004.
Lee, C.-T. A., Cheng, X., and Horodyskyj, U.: The development and refinement of continental arcs by primary basaltic magmatism, garnet pyroxenite accumulation, basaltic recharge and delamination: insights from the Sierra Nevada, California, Contrib. Mineral. Petr., 151, 222–242, 2006.
Lepage, L. D.: ILMAT: an excel worksheet for ilmenite-magnetite geothermometry and geobarometry, Comput. Geosci., 29, 673–678, 2003.
Lindsay, J., Schmitt, A., Trumbull, R., De Silva, S., Siebel, W., and Emmermann, R.: Magmatic evolution of the La Pacana caldera system, Central Andes, Chile: Compositional variation of two cogenetic, large-volume felsic ignimbrites, J. Petrol., 42, 459–486, 2001.
Lucassen, F., Becchio, R., Harmon, R., Kasemann, S., Franz, G., Trumbull, R., Wilke, H.-G., Romer, R. L., and Dulski, P.: Composition and density model of the continental crust at an active continental margin–the Central Andes between 21 and 27 S, Tectonophysics, 341, 195–223, 2001.
Maksimov, A., Kadik, A., Korovushkina, E. Y., and Ivanov, B.: Crystallization of an andesite melt with a fixed water content at pressures up to 12 kbar, Geochem. Int., 15, 20–29, 1978.
Mamani, M., Wörner, G., and Sempere, T.: Geochemical variations in igneous rocks of the Central Andean orocline (13 S to 18 S): Tracing crustal thickening and magma generation through time and space, Bulletin, 122, 162–182, 2010.
Martel, C., Pichavant, M., Holtz, F., Scaillet, B., Bourdier, J. L., and Traineau, H.: Effects of f O2 and H2O on andesite phase relations between 2 and 4 kbar, J. Geophys. Res.-Sol. Ea., 104, 29453–29470, 1999.
Martel, C., Andújar, J., Mothes, P., Scaillet, B., Pichavant, M., and Molina, I.: Storage conditions of the mafic and silicic magmas at Cotopaxi, Ecuador, J. Volcanol. Geoth. Res., 354, 74–86, 2018.
Matthews, S., Sparks, R., and Gardeweg, M.: The Piedras Grandes–Soncor eruptions, Lascar volcano, Chile; evolution of a zoned magma chamber in the central Andean upper crust, J. Petrol., 40, 1891–1919, 1999.
Matthews, S. J., Jones, A., and Gardeweg, M.: Lascar Volcano, Northern Chile; evidence for steady-state disequilibrium, J. Petrol., 35, 401–432, 1994.
Matthews, S. J., Gardeweg, M. C., and Sparks, R. S. J.: The 1984 to 1996 cyclic activity of Lascar Volcano, northern Chile: cycles of dome growth, dome subsidence, degassing and explosive eruptions, B. Volcanol., 59, 72–82, 1997.
McMillan, N. J., Davidson, J. P., Wörner, G., Harmon, R. S., Moorbath, S., and Lopez-Escobar, L.: Influence of crustal thickening on arc magmatism:, Nevados de Payachata volcanic region, northern Chile, Geology, 21, 467–470, 1993.
Miyashiro, A.: Volcanic rock series in island arcs and active continental margins, Am. J. Sci., 274, 321–355, 1974.
Muir, D. D., Blundy, J. D., Rust, A. C., and Hickey, J.: Experimental constraints on dacite pre-eruptive magma storage conditions beneath Uturuncu volcano, J. Petrol., 55, 749–767, 2014.
Müntener, O., Kelemen, P. B., and Grove, T. L.: The role of H2O during crystallization of primitive arc magmas under uppermost mantle conditions and genesis of igneous pyroxenites: an experimental study, Contrib. Mineral. Petr., 141, 643–658, 2001.
Parat, F., Holtz, F., and Feig, S.: Pre-eruptive conditions of the Huerto andesite (Fish canyon system, San Juan volcanic field, Colorado): influence of volatiles (C–O–H–S) on phase equilibria and mineral composition, J. Petrol., 49, 911–935, 2008.
Putirka, K. D.: Thermometers and barometers for volcanic systems, Rev. Miner. Geochem., 69, 61–120, 2008.
Reubi, O. and Blundy, J.: A dearth of intermediate melts at subduction zone volcanoes and the petrogenesis of arc andesites, Nature, 461, 1269–1273, 2009.
Robidoux, P., Rizzo, A. L., Aguilera, F., Aiuppa, A., Artale, M., Liuzzo, M., Nazzari, M., and Zummo, F.: Petrological and noble gas features of Lascar and Lastarria volcanoes (Chile): Inferences on plumbing systems and mantle characteristics, Lithos, 370, 105615, https://doi.org/10.1016/j.lithos.2020.105615, 2020.
Roedder, E.: Origin and significance of magmatic inclusions, B. Mineral., 102, 487–510, 1979.
Scaillet, B. and Evans, B. W.: The 15 June 1991 eruption of Mount Pinatubo. I. Phase equilibria and pre-eruption P–T–f O2–f H2O conditions of the dacite magma, J. Petrol., 40, 381–411, 1999.
Schmidt, B. C., Scaillet, B., and Holtz, F.: Accurate control of fH2 in cold-seal pressure vessels with the Shaw membrane technique, Eur. J. Mineral., 893–904, 1995.
Schmitt, A., De Silva, S., Trumbull, R., and Emmermann, R.: Magma evolution in the Purico ignimbrite complex, northern Chile: evidence for zoning of a dacitic magma by injection of rhyolitic melts following mafic recharge, Contrib. Mineral. Petr., 140, 680–700, 2001.
Schmitz, M., Heinsohn, W.-D., and Schilling, F.: Seismic, gravity and petrological evidence for partial melt beneath the thickened central Andean crust (21–23 S), Tectonophysics, 270, 313–326, 1997.
Schuessler, J. A., Botcharnikov, R. E., Behrens, H., Misiti, V., and Freda, C.: Amorphous materials: properties, structure, and durability: oxidation state of iron in hydrous phono-tephritic melts, Am. Mineral., 93, 1493–1504, 2008.
Schwab, R. and Küstner, D.: Die Gleichgewichtsfugazitäten technologisch und petrologisch wichtiger Sauerstoffpuffer, Neues Jb. Miner. Abh., 140, 111–142, 1981.
Sekine, T., Katsura, T., and Aramaki, S.: Water saturated phase relations of some andesites with application to the estimation of the initial temperature and water pressure at the time of eruption, Geochim. Cosmochim. Ac., 43, 1367–1376, 1979.
Shimizu, N. and Kushiro, I.: The partitioning of rare earth elements between garnet and liquid at high pressures: preliminary experiments, Geophys. Res. Lett., 2, 413–416, 1975.
Shishkina, T., Botcharnikov, R., Holtz, F., Almeev, R., and Portnyagin, M. V.: Solubility of H2O-and CO2-bearing fluids in tholeiitic basalts at pressures up to 500 MPa, Chem. Geol., 277, 115–125, 2010.
Sisson, T. and Grove, T.: Experimental investigations of the role of H2O in calc-alkaline differentiation and subduction zone magmatism, Contrib. Mineral. Petr., 113, 143–166, 1993.
Snyder, D. A. and Carmichael, I. S.: Olivine-liquid equilibria and the chemical activities of FeO, NiO, Fe2O3, and MgO in natural basic melts, Geochim. Cosmochim. Ac., 56, 303–318, 1992.
Sobolev, A. V. and Danyushevsky, L. V.: Petrology and geochemistry of boninites from the north termination of the Tonga Trench: constraints on the generation conditions of primary high-Ca boninite magmas, J. Petrol., 35, 1183–1211, 1994.
Stormer, J. C.: The effects of recalculation on estimates of temperature and oxygen fugacity from analyses of multicomponent iron-titanium oxides, Am. Mineral., 68, 586–594, 1983.
Tassi, F., Aguilera, F., Vaselli, O., Medina, E., Tedesco, D., Delgado Huertas, A., Poreda, R., and Kojima, S.: The magmatic-and hydrothermal-dominated fumarolic system at the Active Crater of Lascar volcano, northern Chile, B. Volcanol., 71, 171–183, 2009.
Toplis, M. and Carroll, M.: An experimental study of the influence of oxygen fugacity on Fe-Ti oxide stability, phase relations, and mineral–melt equilibria in ferro-basaltic systems, J. Petrol., 36, 1137–1170, 1995.
Wörner, G., Harmon, R., Davidson, J., Moorbath, S., Turner, D., McMillan, N., Nyes, C., Lopez-Escobar, L., and Moreno, H.: The Nevados de Payachata volcanic region (18 S/69 W, N. Chile) I. Geological, geochemical, and isotopic observations, B. Volcanol., 50, 287–303, 1988.
Wörner, G., Mamani, M., and Blum-Oeste, M.: Magmatism in the central Andes, Elements, 14, 237–244, 2018.
Wright, T. L. and Doherty, P. C.: A linear programming and least squares computer method for solving petrologic mixing problems, Geol. Soc. Am. Bull., 81, 1995–2008, 1970.
- Abstract
- Introduction
- Evolution of Lascar volcano
- Natural samples and melt inclusions
- High-temperature, high-pressure phase equilibrium experiments
- Experimental results
- Discussion
- Conclusions
- Data availability
- Author contributions
- Competing interests
- Disclaimer
- Special issue statement
- Acknowledgements
- Financial support
- Review statement
- References
- Supplement