the Creative Commons Attribution 4.0 License.
the Creative Commons Attribution 4.0 License.
 | 08 Aug 2024
Re-equilibration of quartz inclusions in garnet
Jay B. Thomas
Inclusion–host elastic thermobarometers are widely used to determine the pressure and temperature (P–T) histories of metamorphic rocks. Complex metamorphic P–T paths can affect the pressures that develop in host–inclusion systems. There are limited experimental studies that investigate how changing P–T conditions may re-equilibrate or “reset” residual pressures of inclusions. To evaluate re-equilibration of the quartz-in-garnet (QuiG) elastic thermobarometer, we performed single-, two-, and three-stage isothermal experiments. In the first stage of the experiments, oxide starting materials hydrothermally crystallised to grow garnet crystals with quartz inclusions between 700 and 800 °C and 1.0 and 3.2 GPa with constant P–T conditions for 48 h. In the second and third stage of the experiments, we isothermally changed pressure by 1.0 to 1.2 GPa for durations up to 38 d. We used Raman spectroscopy to measure strain-induced changes to the 128, 207, and 465 cm−1 Raman bands of quartz inclusions to determine the inclusion pressures (Pinc) and entrapment pressures (Ptrap) at the experimental temperature. The multi-stage experiments show that elasticity primarily controlled changes to Pinc values that occur from Ptrap through quenching to room conditions and that Pinc values measured at room conditions along with elastic modelling can be used to accurately calculate Ptrap. Quartz Pinc values in two-stage experiments re-equilibrated to give Pinc values between P1 and P2. The three-stage isothermal experiments show that the observed changes to inclusion pressures are reversible along different P–T paths to restore the re-equilibrated Pinc values back to their original entrapment isomeke at Ptrap. For rocks that underwent protracted metamorphism along complicated P–T paths, the re-equilibration experiments and viscoelastic calculations show that QuiG may underestimate maximum Ptrap conditions.
- Article
(6437 KB) - Full-text XML
-
Supplement
(1893 KB) - BibTeX
- EndNote


Determining the pressures (P), temperatures (T), and timings (t) of rock formation is of paramount fundamental importance for petrogenetic interpretations. Rocks may contain useful physical and chemical evidence to interpret their formation histories. There are numerous geochemical methods to determine the P–T histories of rocks (e.g. Essene, 1989; Spear and Peacock, 1989; Spear et al., 1999; Holland and Powell, 2011; Gonzalez et al., 2019; Osborne et al., 2019). Elastic thermobarometry uses the thermoelastic properties of host and inclusion minerals to estimate P–T conditions of mineral inclusion entrapment (Adams et al., 1975; Angel et al., 2014, 2015, 2024; Enami et al., 2007; Gonzalez et al., 2021; Kohn, 2014; Kohn et al., 2023; Rosenfeld, 1969; Rosenfeld and Chase, 1961; Sorby and Butler, 1868; Spear et al., 2014; Van der Molen and Van Roermund, 1986; Zhang, 1998). The quartz-in-garnet (QuiG) elastic thermobarometer is now widely used along with other thermobarometric methods to determine the P–T conditions of mineral crystallisation for garnet-bearing rocks.
When garnet crystallises, it commonly entraps near quartz crystals as inclusions. At entrapment conditions (Ptrap), the cavity in a host garnet perfectly accommodates the volume of its quartz inclusion, and the pressure on the host mineral is the same as the pressure on the inclusion mineral (e.g. Rosenfeld and Chase, 1961; Adams et al., 1975; Angel et al., 2014, 2015, 2017b). There is a single P–T path, called an entrapment isomeke (e.g. Rosenfeld and Chase, 1961; Adams et al., 1975; Angel et al., 2014, 2015, 2017b), along which the fractional volume changes in the host and the inclusion are equivalent and the pressure applied to the host mineral (Phost) is equivalent to the inclusion pressure (Pinc). Isomekes define the P–T points along which inclusions with a specific inclusion pressure (Pinc) could have been entrapped. After entrapment, changes in pressure, temperature, or both away from the isomeke will cause unequal volumetric changes to the host and inclusion minerals to produce Pinc values that are different than pressures applied to the host (Phost) (Adams et al., 1975; Angel et al., 2015; Rosenfeld and Chase, 1961; Zhang, 1998). Because garnet has different thermoelastic properties than quartz, volumetric changes to quartz inclusions are constrained by the surrounding garnet host, which strains the quartz inclusions to produce residual inclusion pressures (i.e. Pinc≠Phost). Elastic thermobarometry uses Pinc to estimate the possible P–T conditions of entrapment.
Many metamorphic rocks experience complex P–T histories (Fig. 1). The potential that quartz inclusions entrapped along a metamorphic path can give accurate crystallisation conditions after complex P–T histories and exhumation requires elasticity. Elasticity is the ability for an object to return to its original size and shape when stress is removed. Elasticity is possible to a certain stress limit before the object becomes permanently deformed by plastic deformation. Any process that changes Pinc so that it does not reflect entrapment conditions effectively re-equilibrates strains in the quartz inclusions to give apparent entrapment conditions. Several studies considered how plastic deformation might reset pressures of quartz inclusions in garnet to give isomekes that do not represent Ptrap (e.g. Zhang, 1998; Dabrowski et al., 2015; Moulas et al., 2020; Zhong et al., 2020; Gilio et al., 2022; Moulas et al., 2023). An experimental study that subjected zircon inclusions in garnet to high temperatures at 0.001 GPa readily reset Pinc values (Campomenosi et al., 2023b). All thermobarometric applications of QuiG require elasticity to determine Pinc and the inclusion entrapment pressure (Ptrap). Quantifying timescales of viscoelastic responses to P–T changes also requires that inclusion–host systems behave elastically because the difference between Phost and Pinc is the force driving plastic deformation (i.e. viscous flow) in the host mineral.
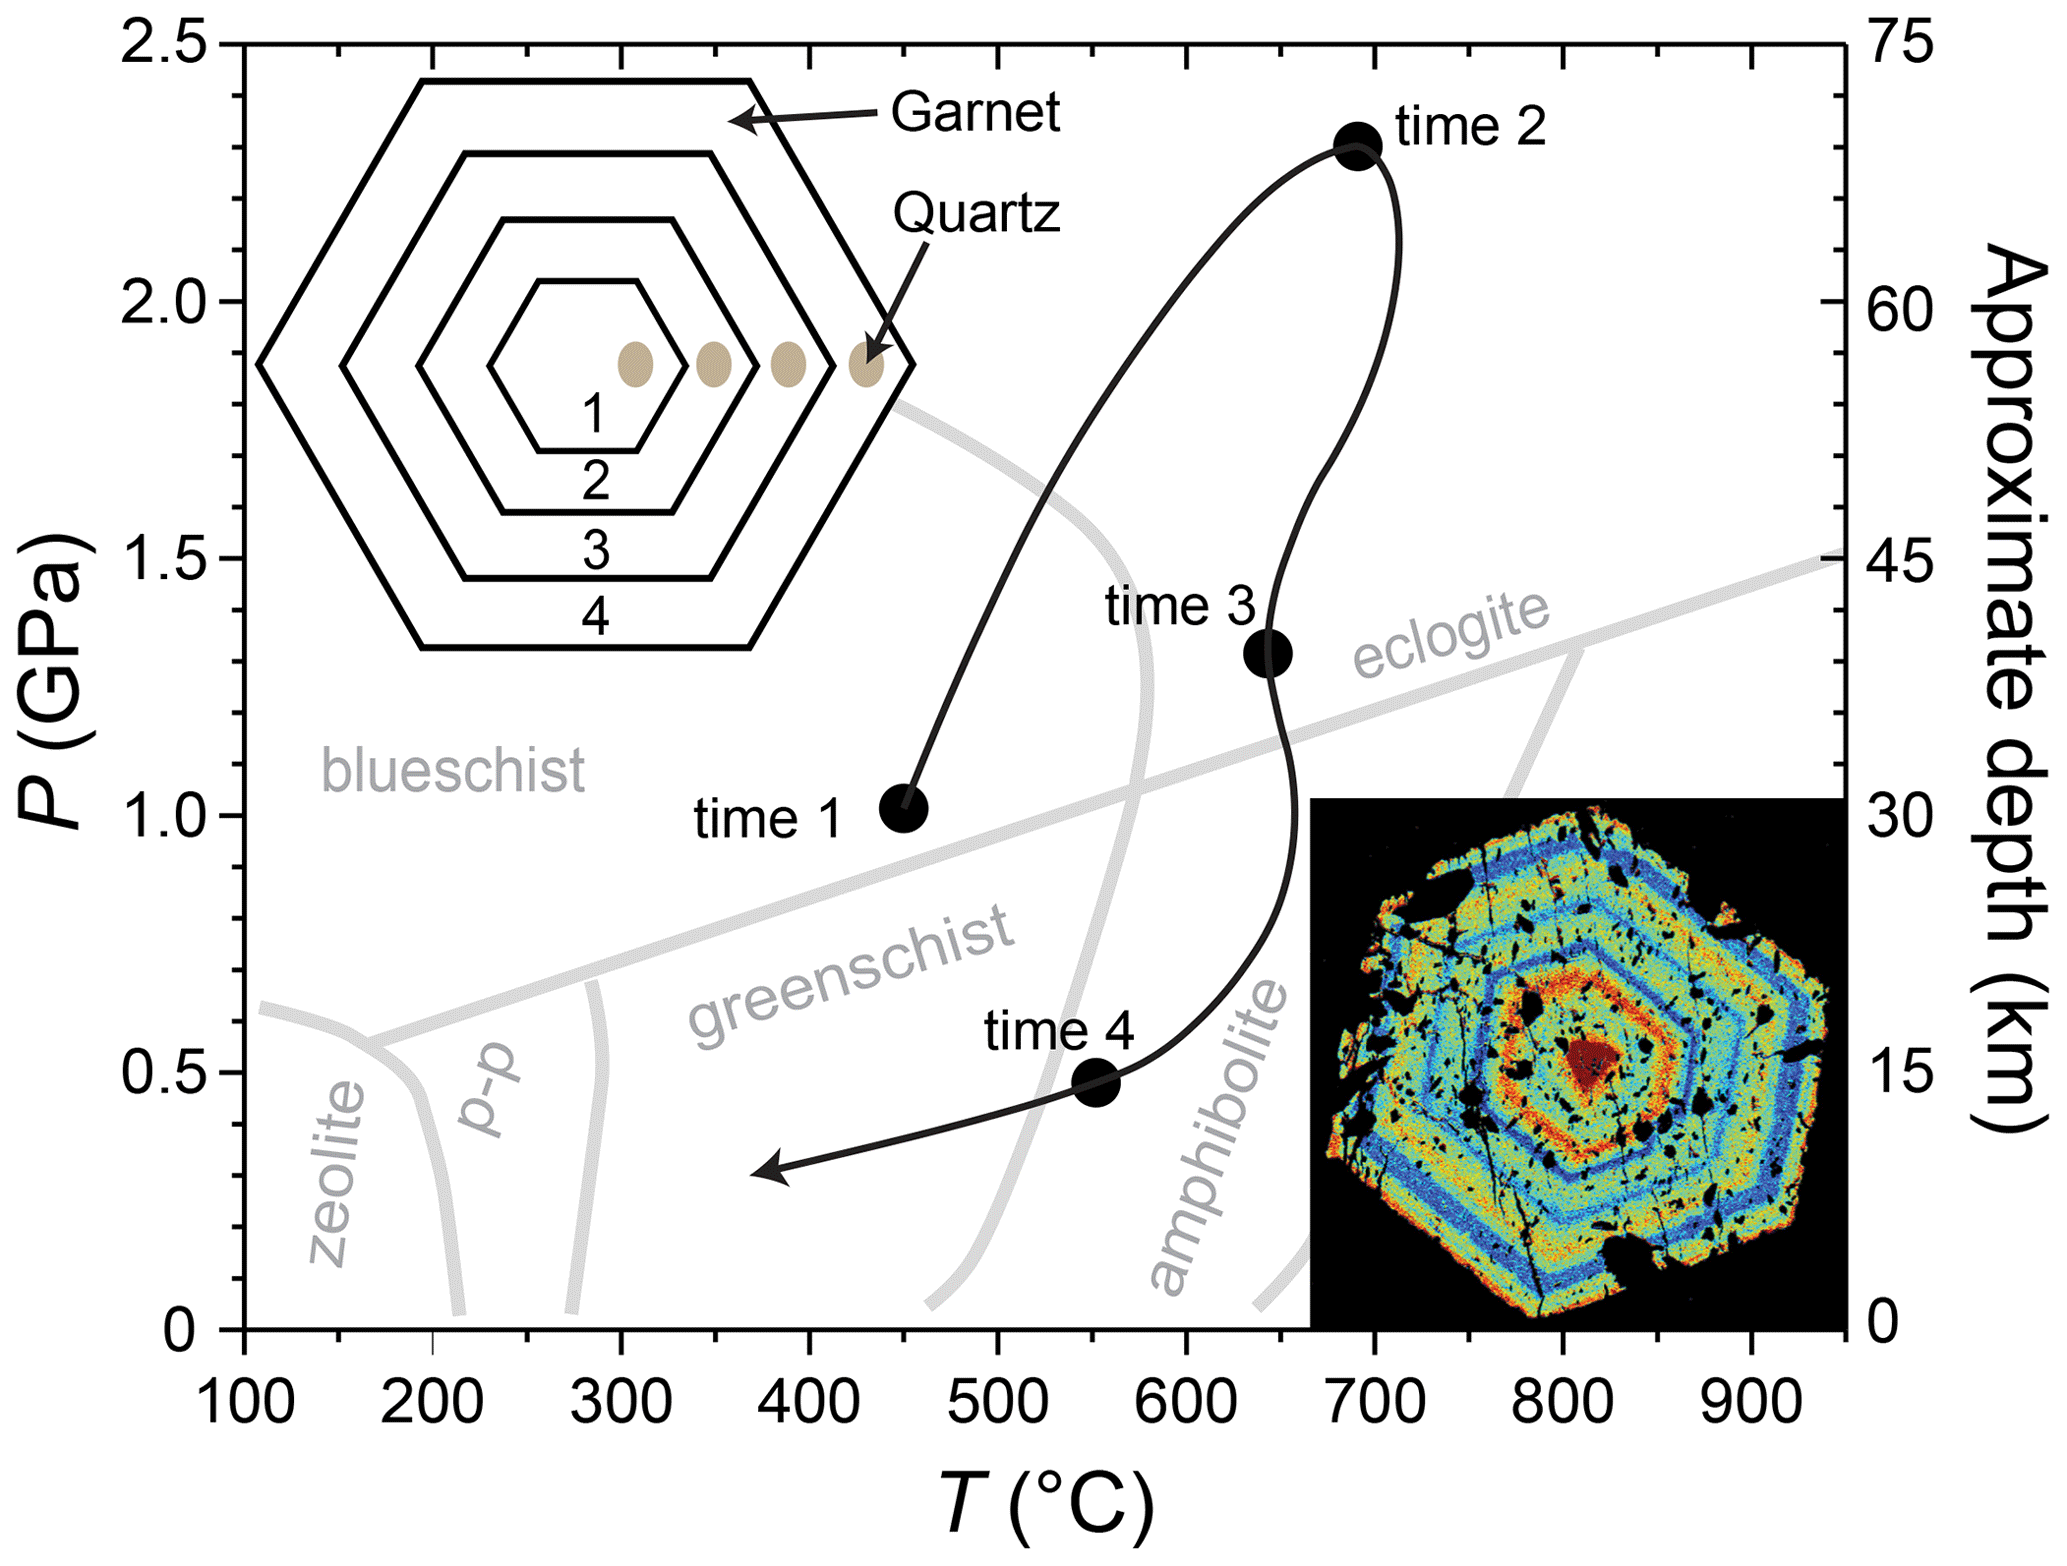
Figure 1Pressure–temperature diagram showing a hypothetical path experienced by a rock during metamorphism with four periods of garnet growth depicted in the schematic garnet with tan-coloured quartz inclusions. Inset at lower right is an X-ray map showing Mn zoning in garnet (1 mm diameter) from Vermont (red is high Mn and blue is low; dark regions inside the garnet are quartz inclusions).
Previous experimental studies that crystallised and entrapped quartz inclusions in garnet at a single P–T condition followed by quenching to room conditions (i.e. 0.1 MPa and 25 °C) showed that QuiG accurately returns measured experimental conditions (Thomas and Spear, 2018; Bonazzi et al., 2019). An experimental study applied in situ high-pressure Raman spectroscopic measurements of quartz inclusions in garnet samples at room temperature and demonstrated elastic behaviour well into the coesite stability field (Campomenosi et al., 2023a). In the present study, we performed multi-stage experiments at 700 and 800 °C to which the final measured inclusion pressures are modified by isothermally changing pressure after entrapment.
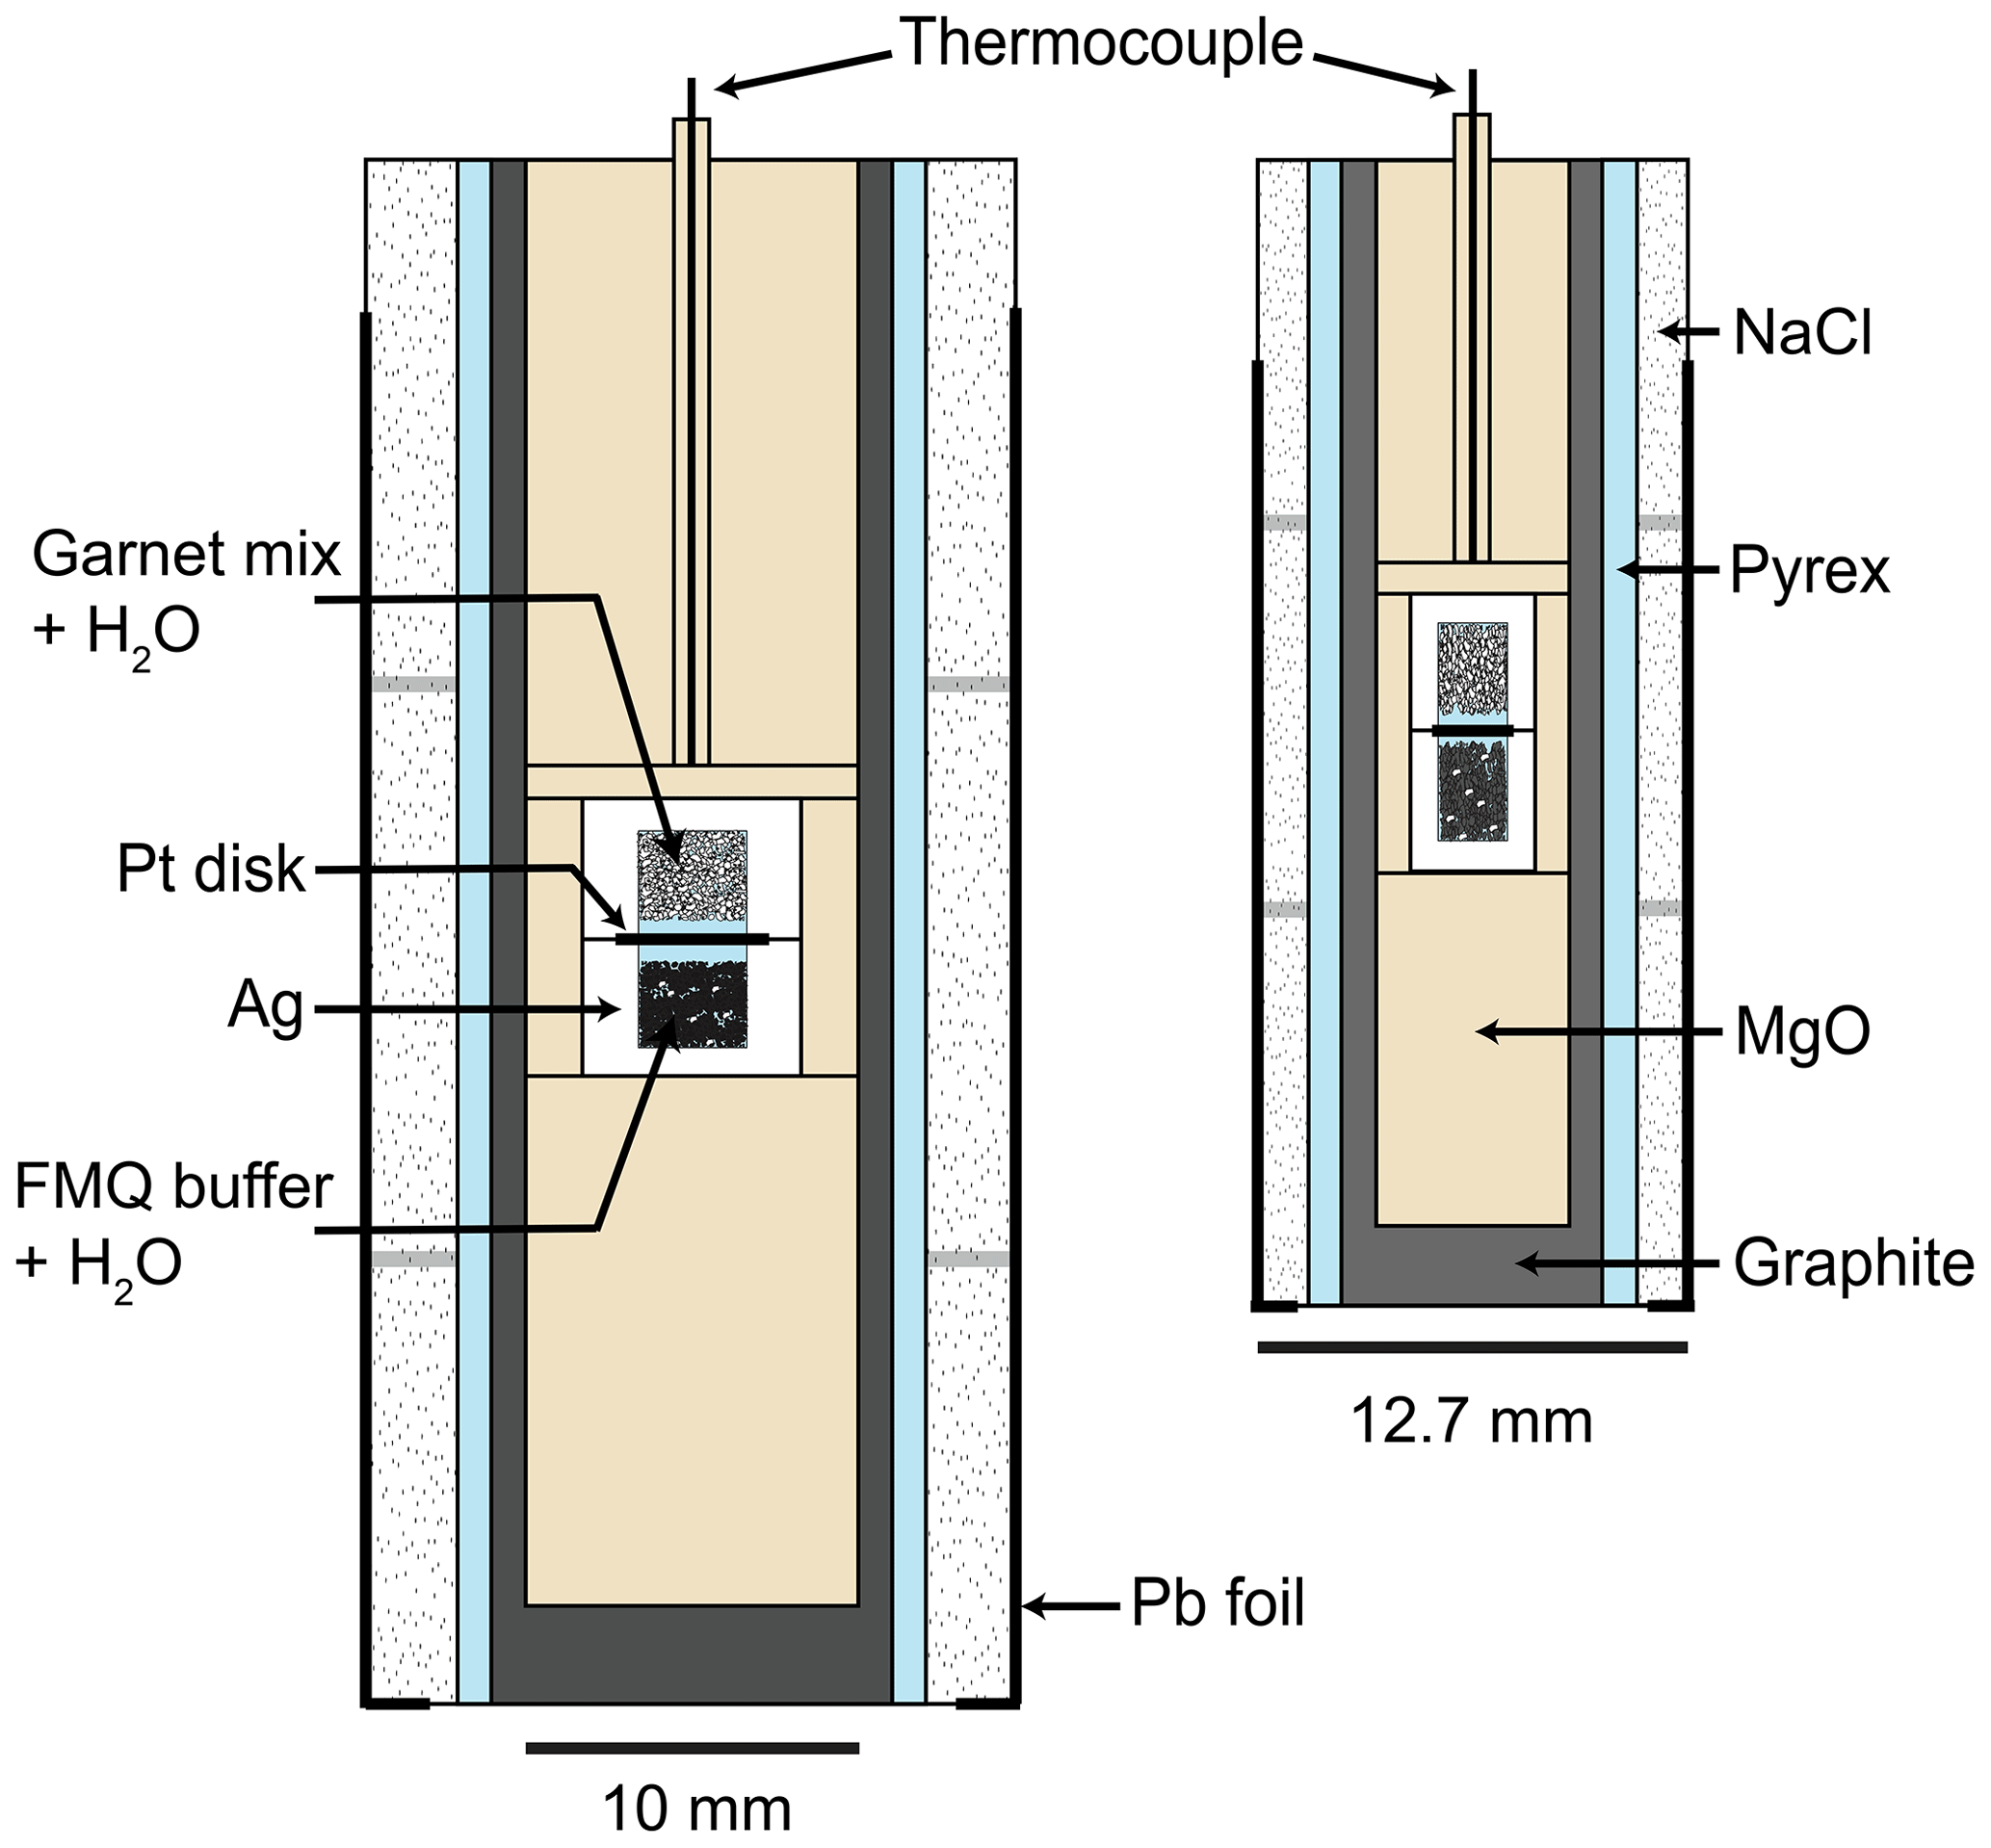
Figure 2Schematic drawings of the experimental assemblies used in piston-cylinder experiments.
2.1 Piston-cylinder experiments
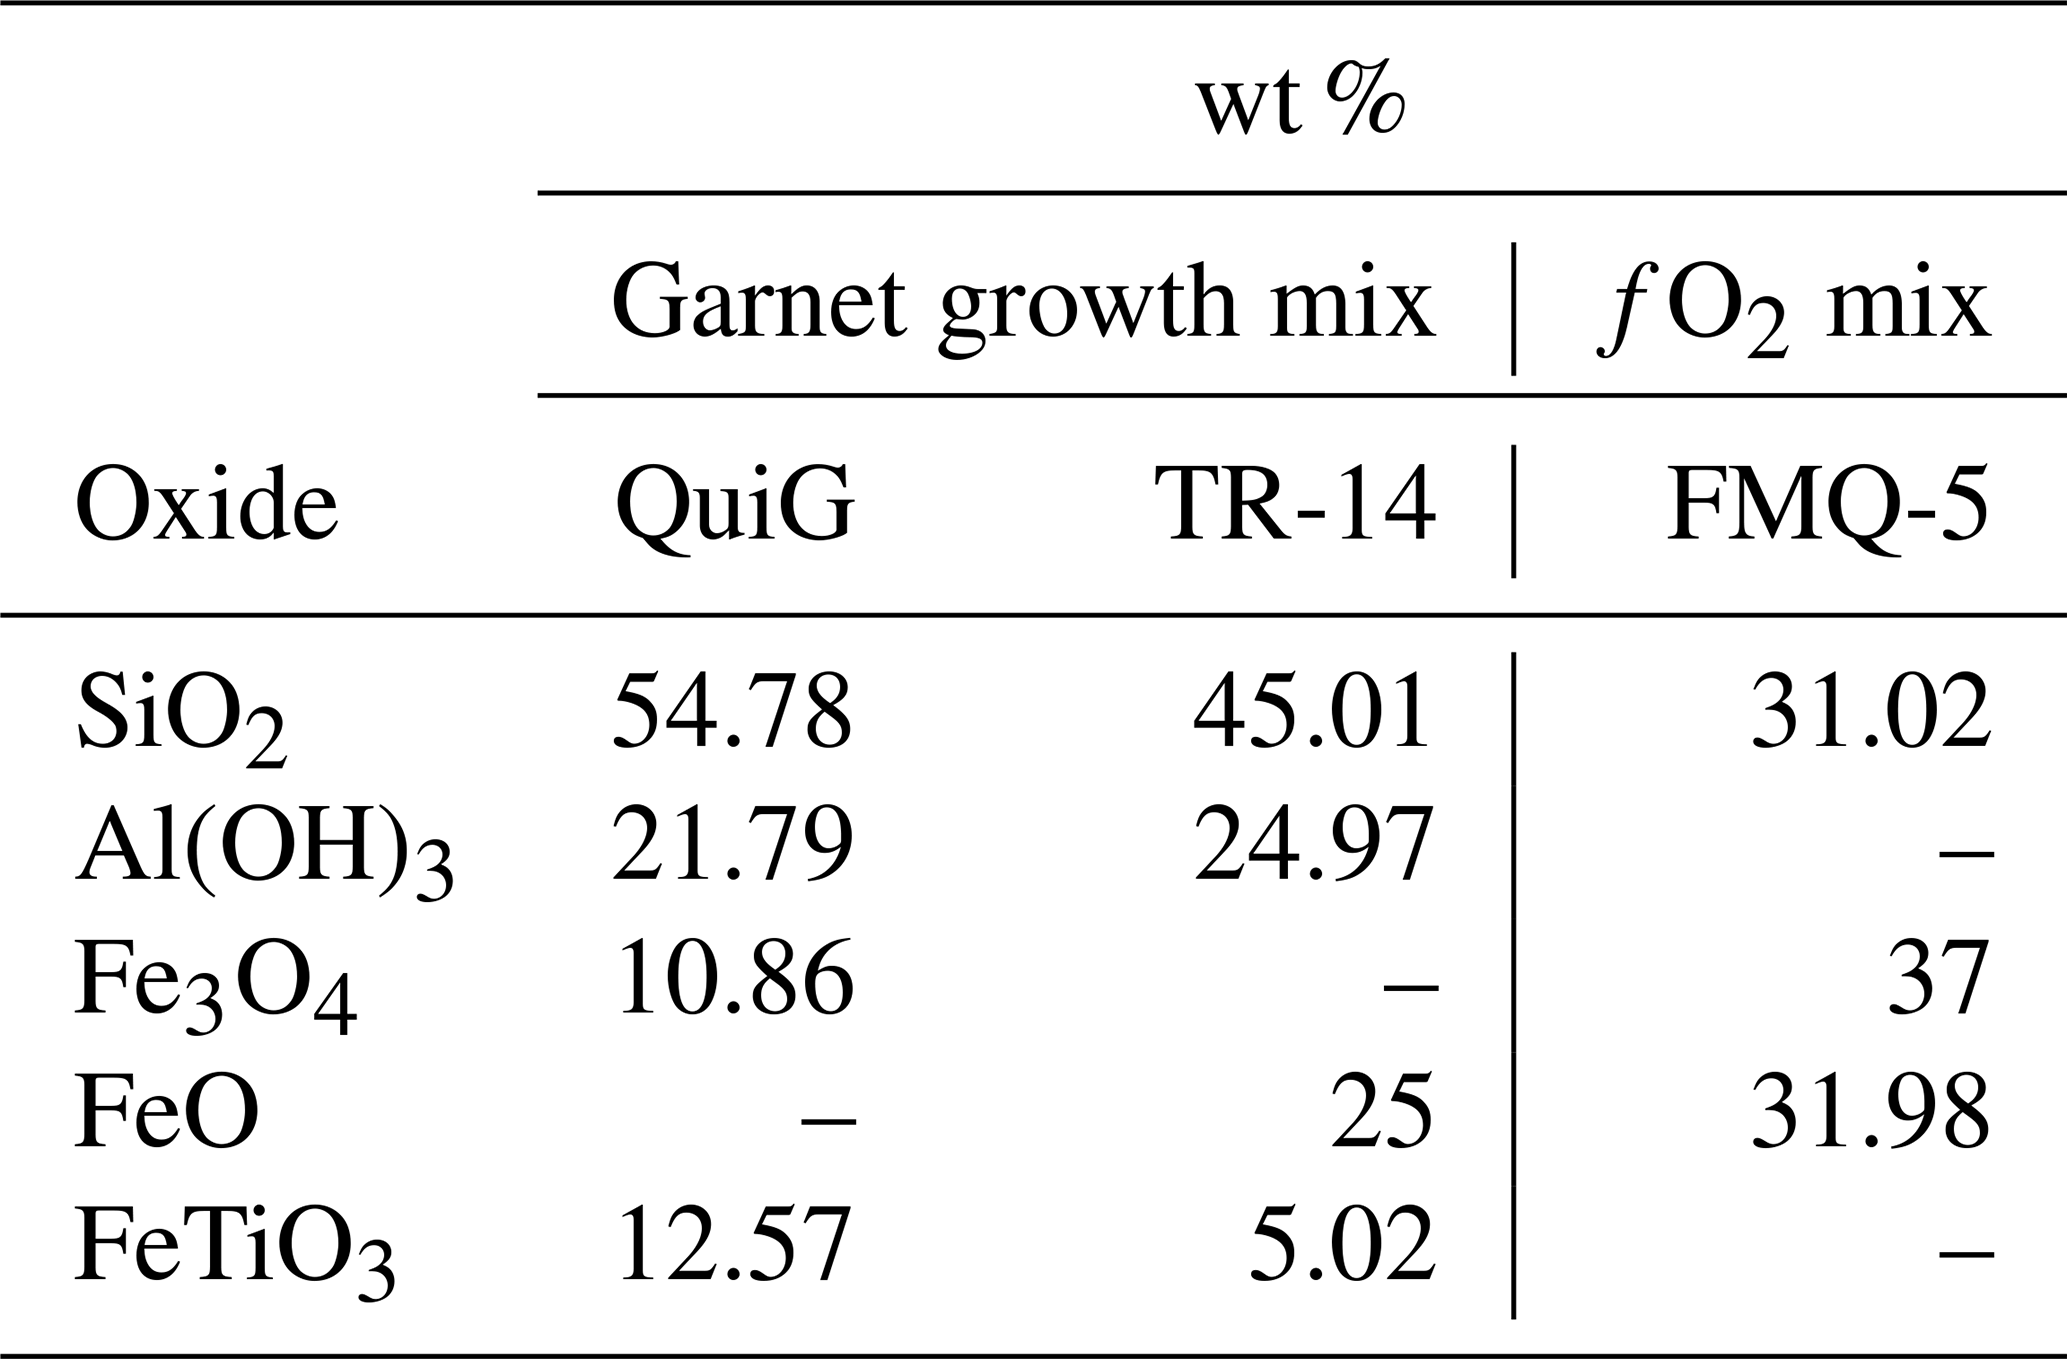
We hydrothermally crystallised garnet with silica mineral inclusions (quartz and coesite) from oxide starting materials (Table 1) in end-loaded piston-cylinder devices (Boyd and England, 1960) at pressures from 1.0 to 3.2 GPa and temperatures ranging from 700 to 800 °C. Powdered starting materials – SiO2 glass, Al(OH)3, FeO, Fe3O4, and FeTiO3 (Alfa Aesar) – were gently packed into silver capsules (Table 1; Fig. 2). The diameters of silver capsules were ∼ 5.9 mm for the 19 mm assembly and ∼ 3.5 mm for the 12.7 mm assembly (Fig. 2). We added sufficient water to completely wet the oxide powders. Almandine- and pyrope-rich (Alm44Prp42Grs14Sps1) garnet seed crystals (Gore Mountain; North River, New York; Ferrero et al., 2021) were added to experiments performed at P<2.0 GPa. We controlled the oxygen fugacity by crystallising an assemblage of fayalite–magnetite–quartz contained in a separate adjacent capsule (Fig. 2). The capsules in the 19 mm diameter assemblies contained ∼ 30 mg of the oxide mixtures (Table 1) and ∼ 10–15 mg H2O; capsules in the 12.7 mm diameter assemblies contained ∼ 10 mg of oxide mixtures and 3–5 mg H2O (Fig. 2). It was important to leave ∼ 0.5 mm of headspace in the capsules to prevent contaminating the tops of capsules with starting materials, which would compromise the seal. In our fO2-buffered experiments tailored for piston-cylinder assemblies (Jakobsson, 2012; Trail et al., 2012), 150 µm thick platinum disks were placed between the open ends of the capsules containing the garnet-producing oxide mixture and the fayalite–magnetite–quartz “buffer” assemblage that controlled the oxygen fugacity (Trail et al., 2012; Thomas and Spear, 2018). Hydrogen diffusion across the Pt disks separating the two capsules controlled the oxygen fugacity in both capsules (Fig. 2). The capsule stacks were sealed during cold pressurisation of each experiment.
Table 1Major-element compositions of starting materials used to grow garnets and the fayalite–magnetite–quartz assemblage crystallised in adjacent capsules to control oxygen fugacity (fO2).
NaCl–borosilicate-glass–MgO assemblies were used in all piston-cylinder experiments (Thomas and Spear, 2018; Watson et al., 2002). Experiments at P<2.0 GPa used the 19 mm diameter piston-cylinder assemblies and higher-pressure experiments utilised the 12.7 mm diameter assemblies (Fig. 2). We wrapped a 90 µm thick piece of Pb foil around the piston-cylinder assemblies to hold the three-part NaCl sleeve components together and mitigate friction between the assembly and the vessel. Eurotherm nanodac PID controllers and type-D thermocouples (W97Re3–W75Re25) with reported accuracies of < 0.2 % (Concept Alloys) controlled temperatures. The capsules were stacked in the experimental assembly so that the thermocouples rested in the MgO within < 1 mm from the closed end of the capsule containing the garnet-producing mixture (Fig. 2). We measured the oil pressures in the piston-cylinder hydraulic rams with Enerpac Bourdon-tube gauges (20 000 psi; 140 MPa) with 18 cm diameter dials. After end-loading the piston-cylinder devices, we pressurised to the target pressures at room temperature, followed by ramping to experimental temperatures at 100 °C min−1. After stabilising at target experimental conditions, oil pressure to the piston was adjusted if it dropped 100 psi beneath the target pressure, which is the smallest graduation on the pressure gauges (100 psi equals 25 MPa with a 12.7 mm diameter piston and 10 MPa with a 19 mm diameter piston). Based on previous work evaluating measured pressures in piston-cylinder devices (Thomas and Spear, 2018) that indicated pressures of single-stage experiments are likely accurate within < 0.05 GPa, we did not apply friction corrections to pressures reported in Table 2.
Table 2Experimental run conditions, number of inclusion measurements (n), changes to Raman band positions (Δω; Δ128, Δ207, and Δ465 cm−1), quartz inclusion pressure (Pinc), and calculated average entrapment pressures (Ptrap) using two equations of state for almandine listed in table notes. P1, P2, and P3 denote the first-, second-, and third-stage pressures of the experiments, and t1, t2, and t3 are durations at P1, P2, and P3, respectively. Values in parentheses are . See text for details on calculating Pinc and Ptrap.
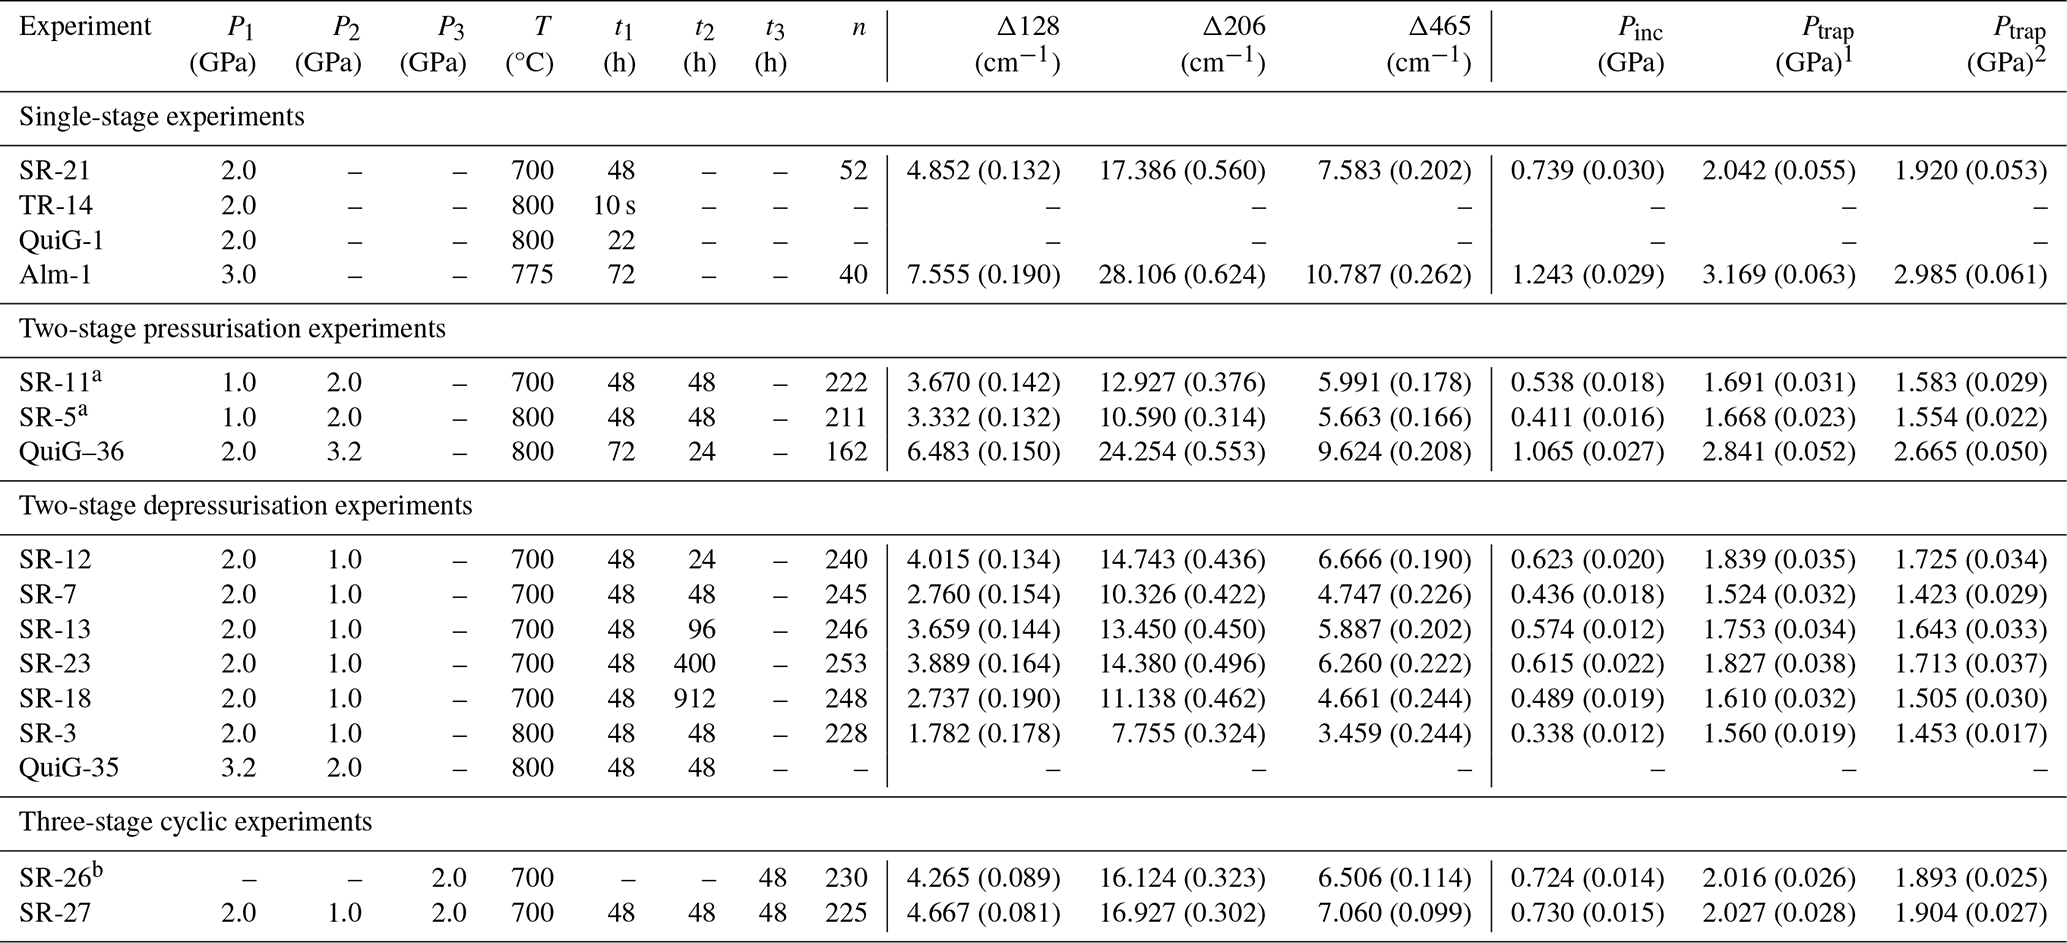
1 Milani et al. (2015). 2 Angel et al. (2022). a Experiments using Gore Mountain garnet seed crystals. b Experiment used SR-7 run products as starting material.
Figure 3 and Table 2 show the ranges of experimental conditions explored. We used single-stage experiments run at one P–T condition to ensure that applying QuiG thermobarometry to experimental run products returned pressures and temperatures similar to those measured with pressure gauges and temperature controllers (Table 2; SR-21; Alm-1 is from Thomas and Spear, 2018). Single-stage experiments ran from 10 s to 72 h. In multi-stage experiments (Fig. 3), we increased pressure with a hydraulic pump or opened a valve to decrease pressure. Two-stage experiments involved maintaining an initial pressure (P1) for 48–72 h and then isothermally changing to a second pressure stage (P2) and holding that pressure for the experimental duration. In multi-stage pressurisation experiments (Fig. 3), we increased pressure in < 10 s. The two-stage depressurisation experiments with P1> P2 required a slower depressurisation (∼ 0.1 GPa every 10 min) to minimise decrepitating quartz inclusions. A time series of two-stage depressurisation experiments was conducted with identical P–T paths in which the duration of the second pressure stage (i.e. P2) ranged up to 912 h.
Experimental errors may cause differences between measured pressures and the actual pressures (Bose and Ganguly, 1995; McDade et al., 2002). Pressurising an experiment to P1 involves advancing the piston into the experimental vessel (i.e. the cylinder) that contains the experimental assembly (Fig. 2), and decreasing pressure in the piston-cylinder device requires retracting the piston out of the cylinder. At experimental P–T conditions the NaCl, borosilicate glass, and the Pb foil softened to minimise friction between the assembly components (Fig. 2) and between the assembly and the tungsten-carbide core of the piston-cylinder vessel. During some experiments, a small amount of the Pb foil (Fig. 2) may extrude downwards around the piston. It is probable that any extruded Pb foil will inhibit piston motion in all types of experiments, which leads to error in the measured experimental pressure.
We also evaluated how crossing the quartz–coesite phase boundary affects inclusion pressures (QuiG-35 and 36; Fig. 3; Table 2). Previous experimental work at 800 °C demonstrated that coesite readily grows at 3.2 GPa (Osborne et al., 2022). Experiment QuiG-36 was stabilised at 800 °C and 2.0 GPa in the α-quartz stability field, followed by isothermally increasing pressure well into the coesite stability field at 3.2 GPa (Fig. 3; Table 2). Experiment QuiG-35 followed the opposite path where the experiment was stabilised initially at 3.2 GPa and 800 °C, followed by isothermally decreasing pressure over ∼ 10 s to 2.0 GPa in the α-quartz stability field (Fig. 3; Table 2).
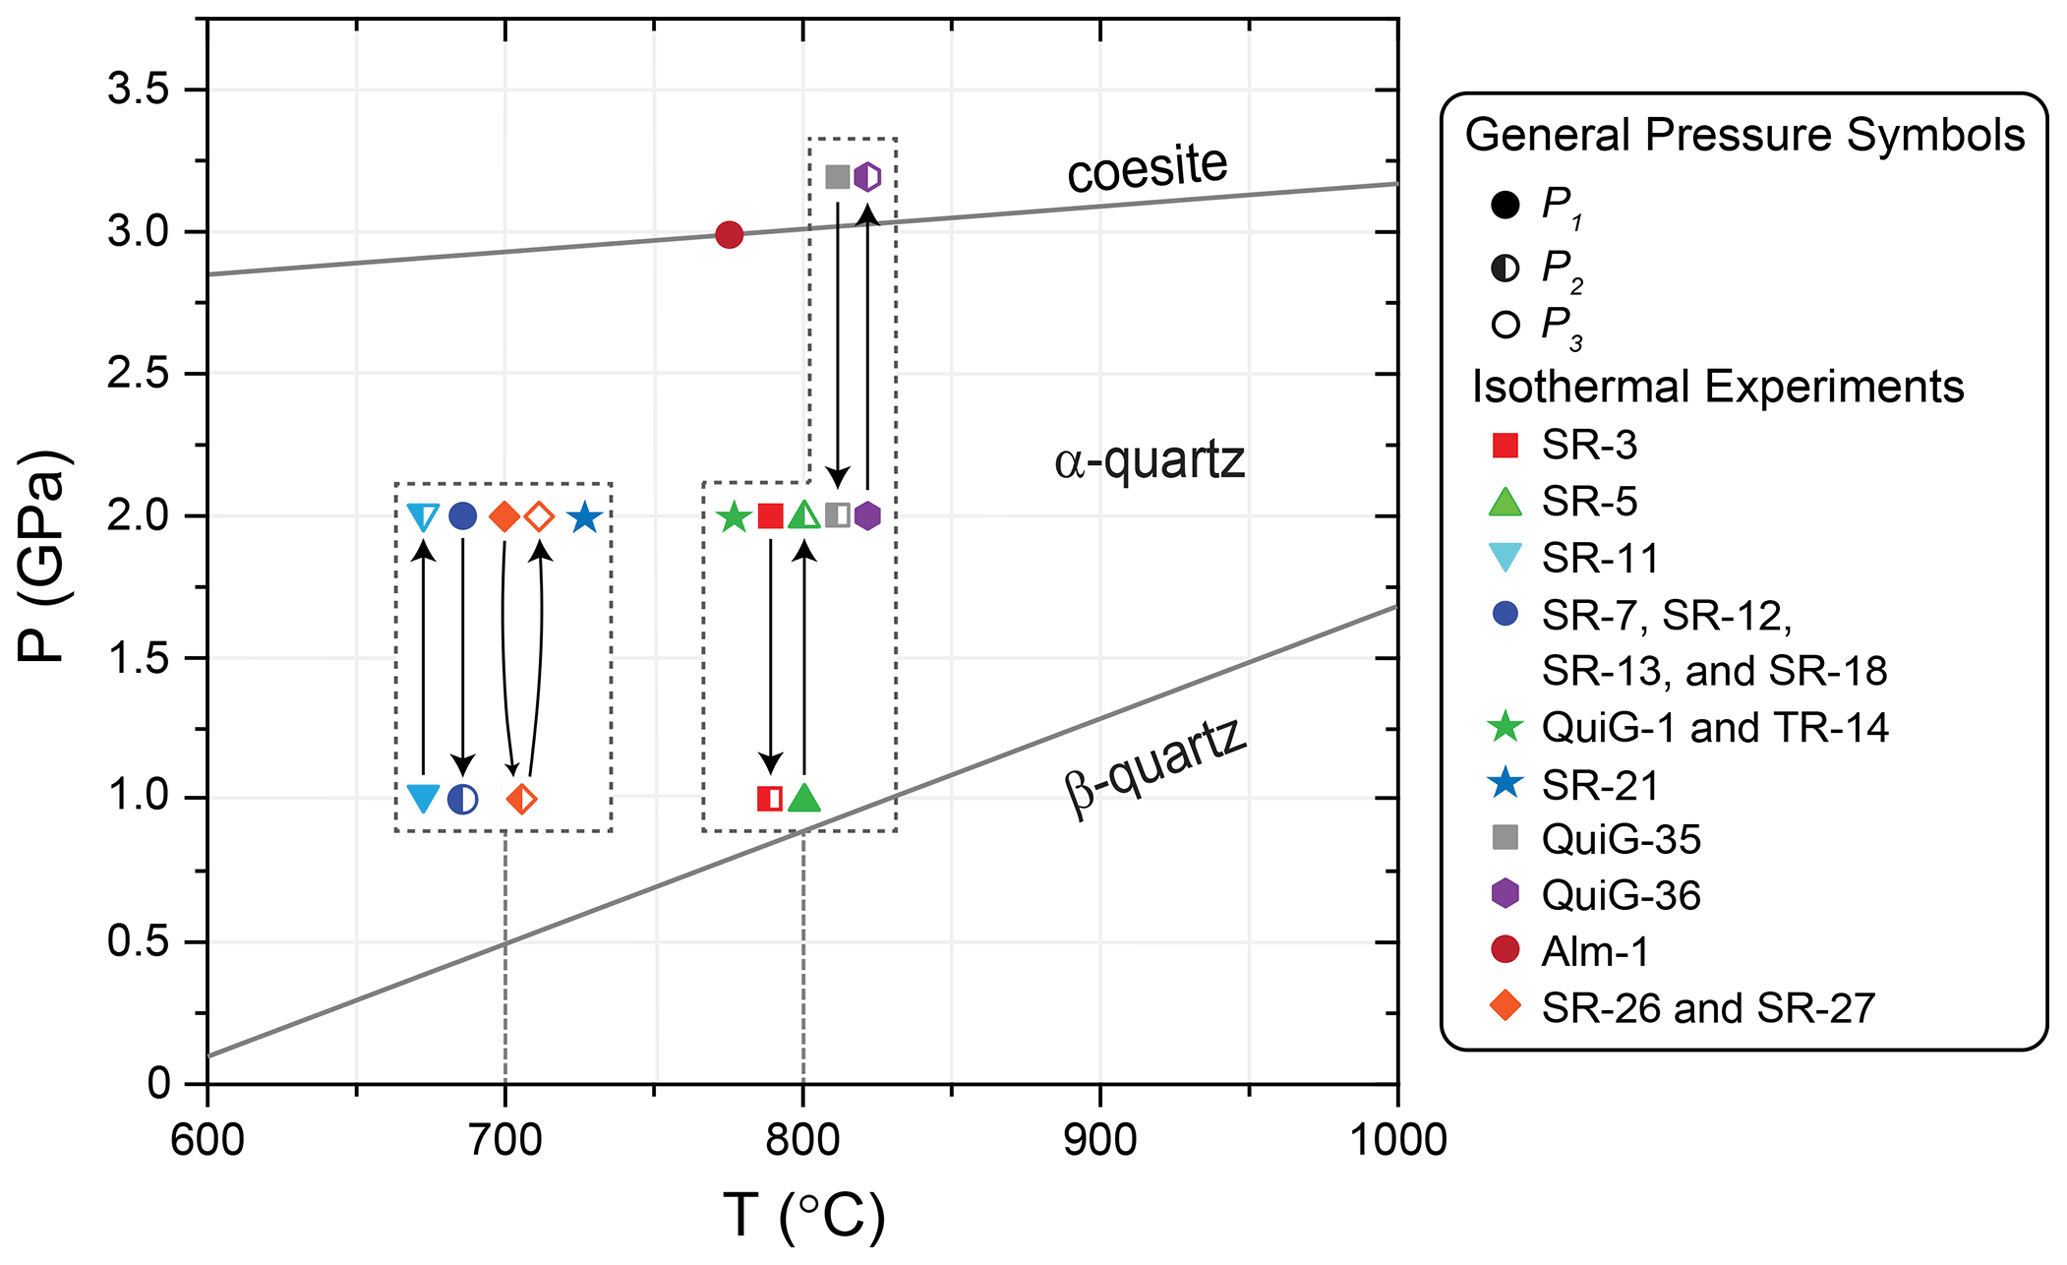
Figure 3Silica phase diagram showing primary (P1 – fully shaded), secondary (P2 – half shaded), and tertiary (P3 – empty) pressure conditions for isothermal experiments (Table 2). Arrows connecting corresponding pressure symbols indicate the pressurisation or depressurisation path of the experiments. The quartz–coesite boundary is from Osborne et al. (2022), and the α-quartz–β-quartz curved boundary is from Angel et al. (2017a).
To evaluate reversibility of changes to inclusion pressures, we performed two types of three-stage experiments at 700 °C (SR-26 and SR-27; Fig. 3; Table 2) in which we adjusted pressure back to the initial entrapment pressure (P3=P1). In experiment SR-27, we performed a continuous experiment in which we isothermally changed experimental pressure from P1=2.0 to P2=1.0 and then back to GPa. In experiment SR-26, we used previously characterised QuiG garnets and other experimental run products from experiment SR-7 (P1=2 GPa, P2=1 GPa, 700 °C) as the starting materials. The SR-7 starting materials were loaded with H2O into a new capsule and run at the original entrapment pressure and temperature (Fig. 3; Table 2).
All experiments were terminated by shutting off the furnace power, which quenched experiments to < 100 °C within 20 s. The silver capsules were opened, and loose crystals were washed out of capsules into sample boxes using ethyl alcohol. We handpicked single crystals of garnet (and other minerals), mounted them in epoxy, and polished them prior to subsequent analyses.
2.2 Analytical details
We carefully selected inclusions for Raman measurements using an Olympus BX 53-P petrographic microscope. Crack-free and isolated inclusions located > 2 inclusion radii from any interface (e.g. crystal surfaces, other inclusions, fractures) were measured. Experiment SR-26 produced garnets with obvious core–rim relations in which experiment SR-7's starting material formed distinct cores overgrown by rims that formed at P3; we measured inclusions that occurred only in the cores. It is possible that some inclusions contained submicrometric features that would be difficult to observe using light microscopy during analytical sessions.
We measured the Raman spectra of fully encapsulated quartz inclusions at room conditions (i.e. 25 °C and 0.1 MPa) with a Renishaw inVia Raman microprobe in the Department of Earth and Environmental Sciences at Syracuse University. A 532 nm laser operated at ∼ 3 mW (10 % laser output) was focused onto analytical spots in the centre of inclusions using a Leica DM2500M microscope and a 100× objective (numerical aperture (NA) = 0.9). Few, if any, inclusions are perfectly spherical, which can cause stress concentrations within individual inclusions (Mazzucchelli et al., 2018; Zhang, 1998). We operated the instrument in high-confocal mode to maximise signal from quartz inclusions. Raman-shifted light was backscattered (180° geometry) and statically dispersed using 1800 groove per millimetre gratings onto a charge-coupled device. Spectra were acquired for 20 s. The Raman spectrometer has 0.5 cm−1 spectral resolution and precision is typically < 0.1 cm−1. We calibrated the spectrometer against numerous Ne lines, and spectral accuracy and linearity were checked throughout each analytical session by measuring the Rayleigh-scattered light from the 532 nm laser and the 520.5 cm−1 band of silicon metal standard.
We did not perform spectral processing prior to peak fitting the three main Raman-active bands in quartz at approximately 128, 207, and 465 cm−1. Throughout each analytical session we referenced the 128, 207, and 465 cm−1 bands from an unstrained, free quartz crystal (synthetic). The referenced Raman band positions were subtracted from the 128, 207, and 465 cm−1 bands of the quartz inclusions to determine changes to Raman bands (Δω) caused by strain in the quartz inclusions. Errors from inclusion measurements arise from challenges of measuring relatively small fully encapsulated quartz inclusions inside garnet crystals. The 128 and 465 cm−1 peaks are larger and narrower (full width at half maximum (FWHM) < 10 cm−1) than the broader 206 cm−1 peak (FWHM ∼ 22 cm−1). The 206 cm−1 peak of quartz is also close to the 215 cm−1 peak of garnet and often overlaps in measurements of strained inclusions. Only inclusion measurements with all three bands present were used in this study.
2.3 Calculating quartz inclusion pressures and isomekes
To calculate pressures of quartz inclusions, we used the freely available stRAinMAN software (Angel et al., 2019) that uses Raman shifts of multiple peaks to implement the mode Grüneisen tensor and calculate strains on the a and c axes of quartz. Using the axial strains on quartz inclusions, and assuming that stresses are symmetric, one can perform matrix multiplications using the elastic tensor of quartz (Wang et al., 2015) to calculate axial stresses σ1, σ2, and σ3 of quartz inclusions. The negative average of σ1, σ2, and σ3 gives Pinc. We used the equations of state (EoSs) for quartz (curved boundary model) (Angel et al., 2017a) and almandine (Angel et al., 2022; Milani et al., 2015) and the freely available software programs EosFit-Pinc (Angel et al., 2017b) and EntraPT (Mazzucchelli et al., 2021) to evaluate strains, convert strains to Pinc, and plot entrapment isomekes. Discussions, figures, and tables include calculations using both almandine EoSs listed in chronological order (Angel et al., 2022; Milani et al., 2015). We then used measured experimental temperatures to calculate Ptrap from the isomekes (Table 2) at P1, P2, and P3. For the two-stage experiments, we predicted Pinc at P2 using both the EosFit-Pinc program (Angel et al., 2017b) and the viscoelastic model code from Zhong et al. (2020) (refer to Zhong et al., 2020, for details and methods regarding the viscoelastic model). Table 3 lists the room condition Pinc and apparent Ptrap values predicted for an elastic response and a viscoelastic response to changing P–T conditions in the two-stage experiments.
Table 3Predicted inclusion pressures (Pinc) and apparent entrapment pressure (Ptrap) caused by isothermally changing pressure from P1 to P2. The apparent Ptrap and room condition Pinc values were calculated using the quartz equation of state from Angel et al. (2017a), two almandine equations of state listed in table notes, and host–inclusion calculations assuming isotropic elasticity implemented with EosFit-Pinc (Angel et al., 2017). All Pinc values were calculated using the exact relaxation model in EosFit-Pinc (Angel et al., 2014, 2017b).
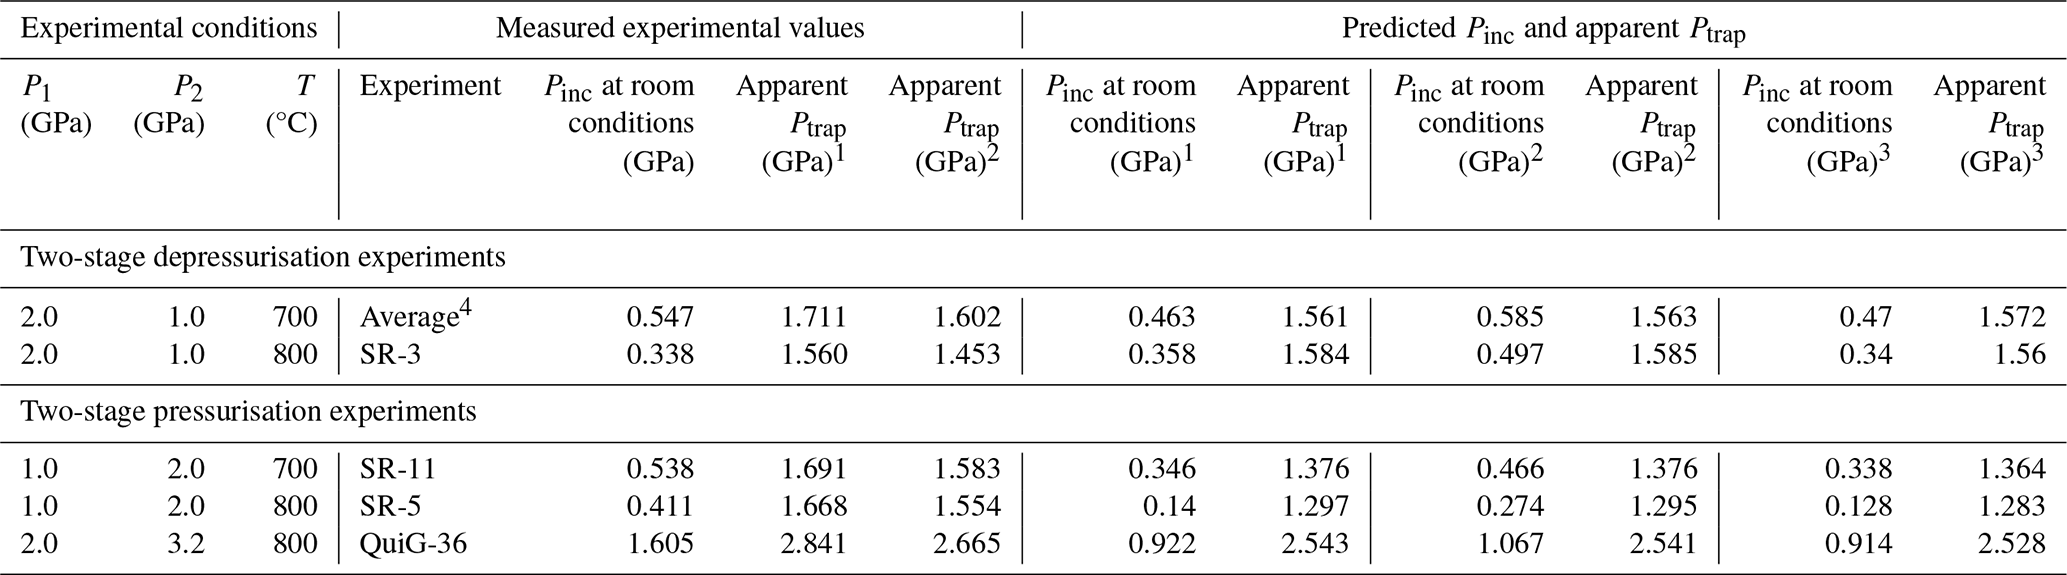
1 Milani et al. (2015). 2 Angel et al. (2022). 3 Zhong et al. (2020). 4 Average of two-stage depressurisation time series of experiments SR-7, SR-12, SR-13, SR-18, and SR-23 conducted at 700 °C.
Upon opening the silver capsules, experiments contained aqueous fluid and loose crystals. Experiments typically crystallised quartz, kyanite, rutile, ilmenite, and hundreds to thousands of faceted, lavender- (700 °C) to red-coloured (800 °C) garnet crystals ranging up to ∼ 300 µm in diameter (Fig. 4). The buffer capsules contained aqueous fluid, fayalite, magnetite, and quartz. A “zero-time” experiment that ran for 10 s (TR-14 in Table 2) grew garnets that ranged up to a maximum diameter of 8 µm. The oxide mixture starting compositions (Table 1) produced experimental garnet compositions that are > 99 % almandine.
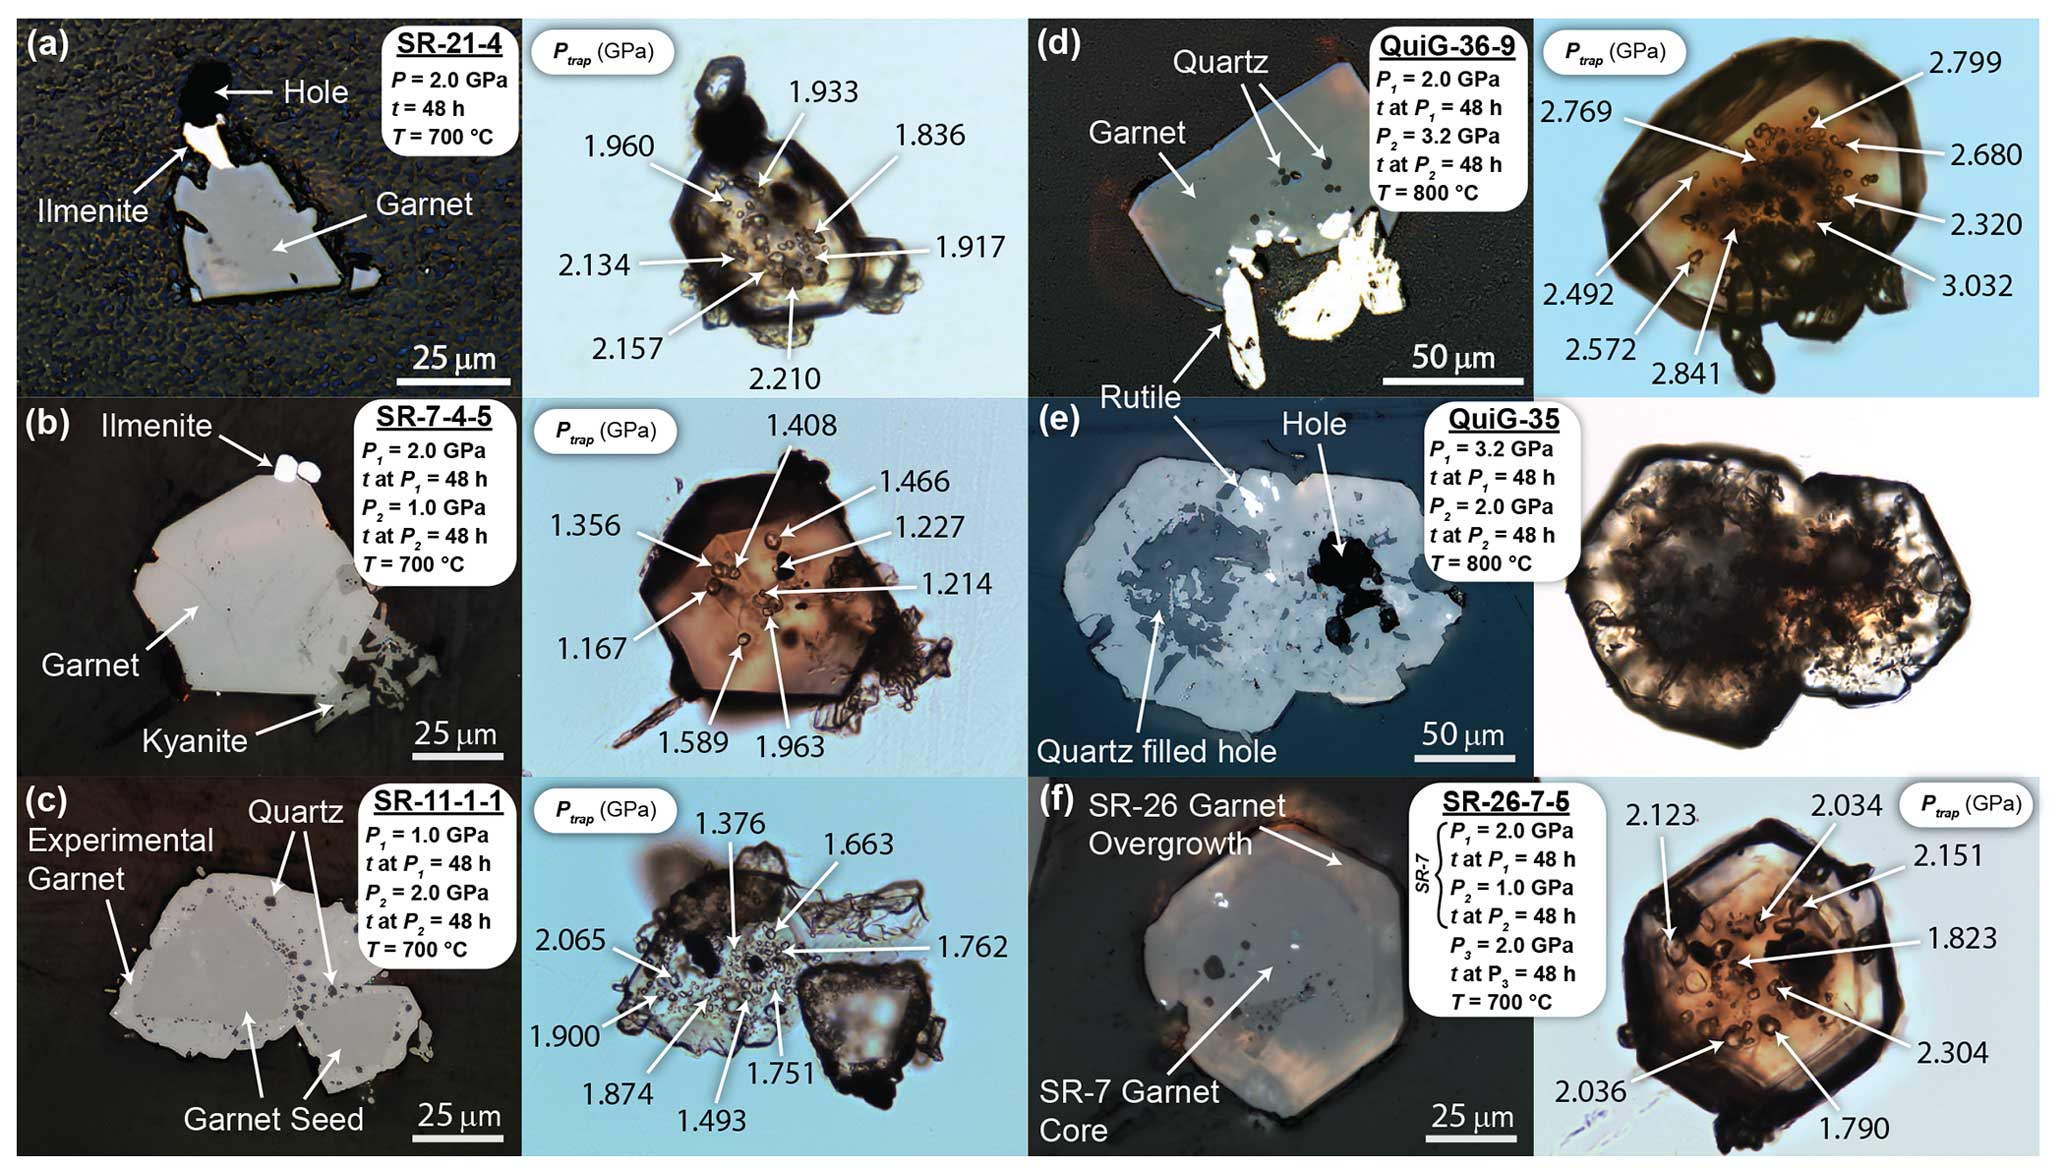
Figure 4Reflected and transmitted light photomicrographs of typical garnet crystals containing quartz inclusions grown in experiments. Calculated apparent entrapment pressures are given for individual quartz inclusions.
Garnet crystals contained quartz inclusions ranging up to ∼ 10 µm with most measuring ≤ 5 µm in diameter (Fig. 4a–d). Garnet crystals commonly have sieve textures with abundant inclusions of co-crystallising minerals in the cores of crystals and significantly fewer inclusions in the rims (Fig. 4). All experiments contained some cracked inclusions, but most garnets contained numerous crack-free quartz inclusions. Cracking was more prevalent in the two-stage depressurisation experiments. Decrepitation textures ranged from inclusions with radial fractures to garnets with holes presumably previously occupied by individual inclusions (Fig. 4e; Supplement Fig. S1). We did not measure any inclusions in QuiG-35 because all the inclusions decrepitated.
In seeded experiments (P1<2 GPa; Fig. 3), quartz inclusions are typically entrapped near the interface of the garnet seed and the experimentally grown garnet (Fig. 4c). The only observable boundary in the two-stage experiments is the distinct seed–overgrowth interfaces present in the experiments at P1<2 GPa that required garnet seeds (Table 2). Garnet crystals do not contain physical evidence for growth or dissolution in the second stage of two-stage experiments. The seed crystals in SR-5 and SR-11 produced an overgrowth rim of garnet with a lower almandine composition than unseeded experiments (Alm97.2Pyr0.3Grs1.2Sps0.2). The composition for the garnet overgrowth rims for seeded experiments was measured with a Cameca SX-5 electron microprobe at the Department of Earth and Environmental Sciences at Syracuse University.
The three-stage experiment SR-26 (P3=2 GPa, 700 °C; Table 2) used garnets from experiment SR-7 (P1=2, P2=1 GPa, 700 °C; Figs. 3 and 4b; Table 2) as the starting material, which produced garnets with visible core–overgrowth relationships. As shown in Fig. 4f, garnets in the SR-7 starting material formed well-faceted cores ∼ 100 µm in diameter, and new garnet overgrowths ∼ 10−15 µm wide formed during experiment SR-26. Three-stage experiment SR-27 (Fig. 3; Table 2) produced garnets with quartz inclusions similar in appearance to those formed in single-stage and two-stage pressurisation experiments.
The average Δω for the 128, 207, and 465 cm−1 Raman band positions and the respective standard errors in the means () are in Table 2. Throughout the analytical sessions, 79 measurements of the 128, 207, and 465 cm−1 Raman bands of the unstrained quartz crystal averaged 127.98 ± 0.032, 207.029 ± 0.058, and 464.866 ± 0.036 cm−1. Standard errors in the unstrained quartz crystals translate to calculated Ptrap values for experimental inclusions ranging ± 0.002 GPa. To evaluate how changing pressure affects the distribution of Pinc and Ptrap values, we measured > 160 individual inclusions for each of the multi-stage experiments (n in Table 2; Fig. 5). Relative to a free quartz crystal, the average Δω values for Raman bands of all quartz inclusions are positive, and the magnitude of Δω systematically varies with experimental run conditions. The for the 128, 207, and 465 cm−1 in each individual experiment is less than 0.190, 0.625, and 0.262 cm−1, respectively (Table 2). Considering the for the calculated experimental quartz peaks translates to Ptrap values ranging approximately ± 0.009 GPa.
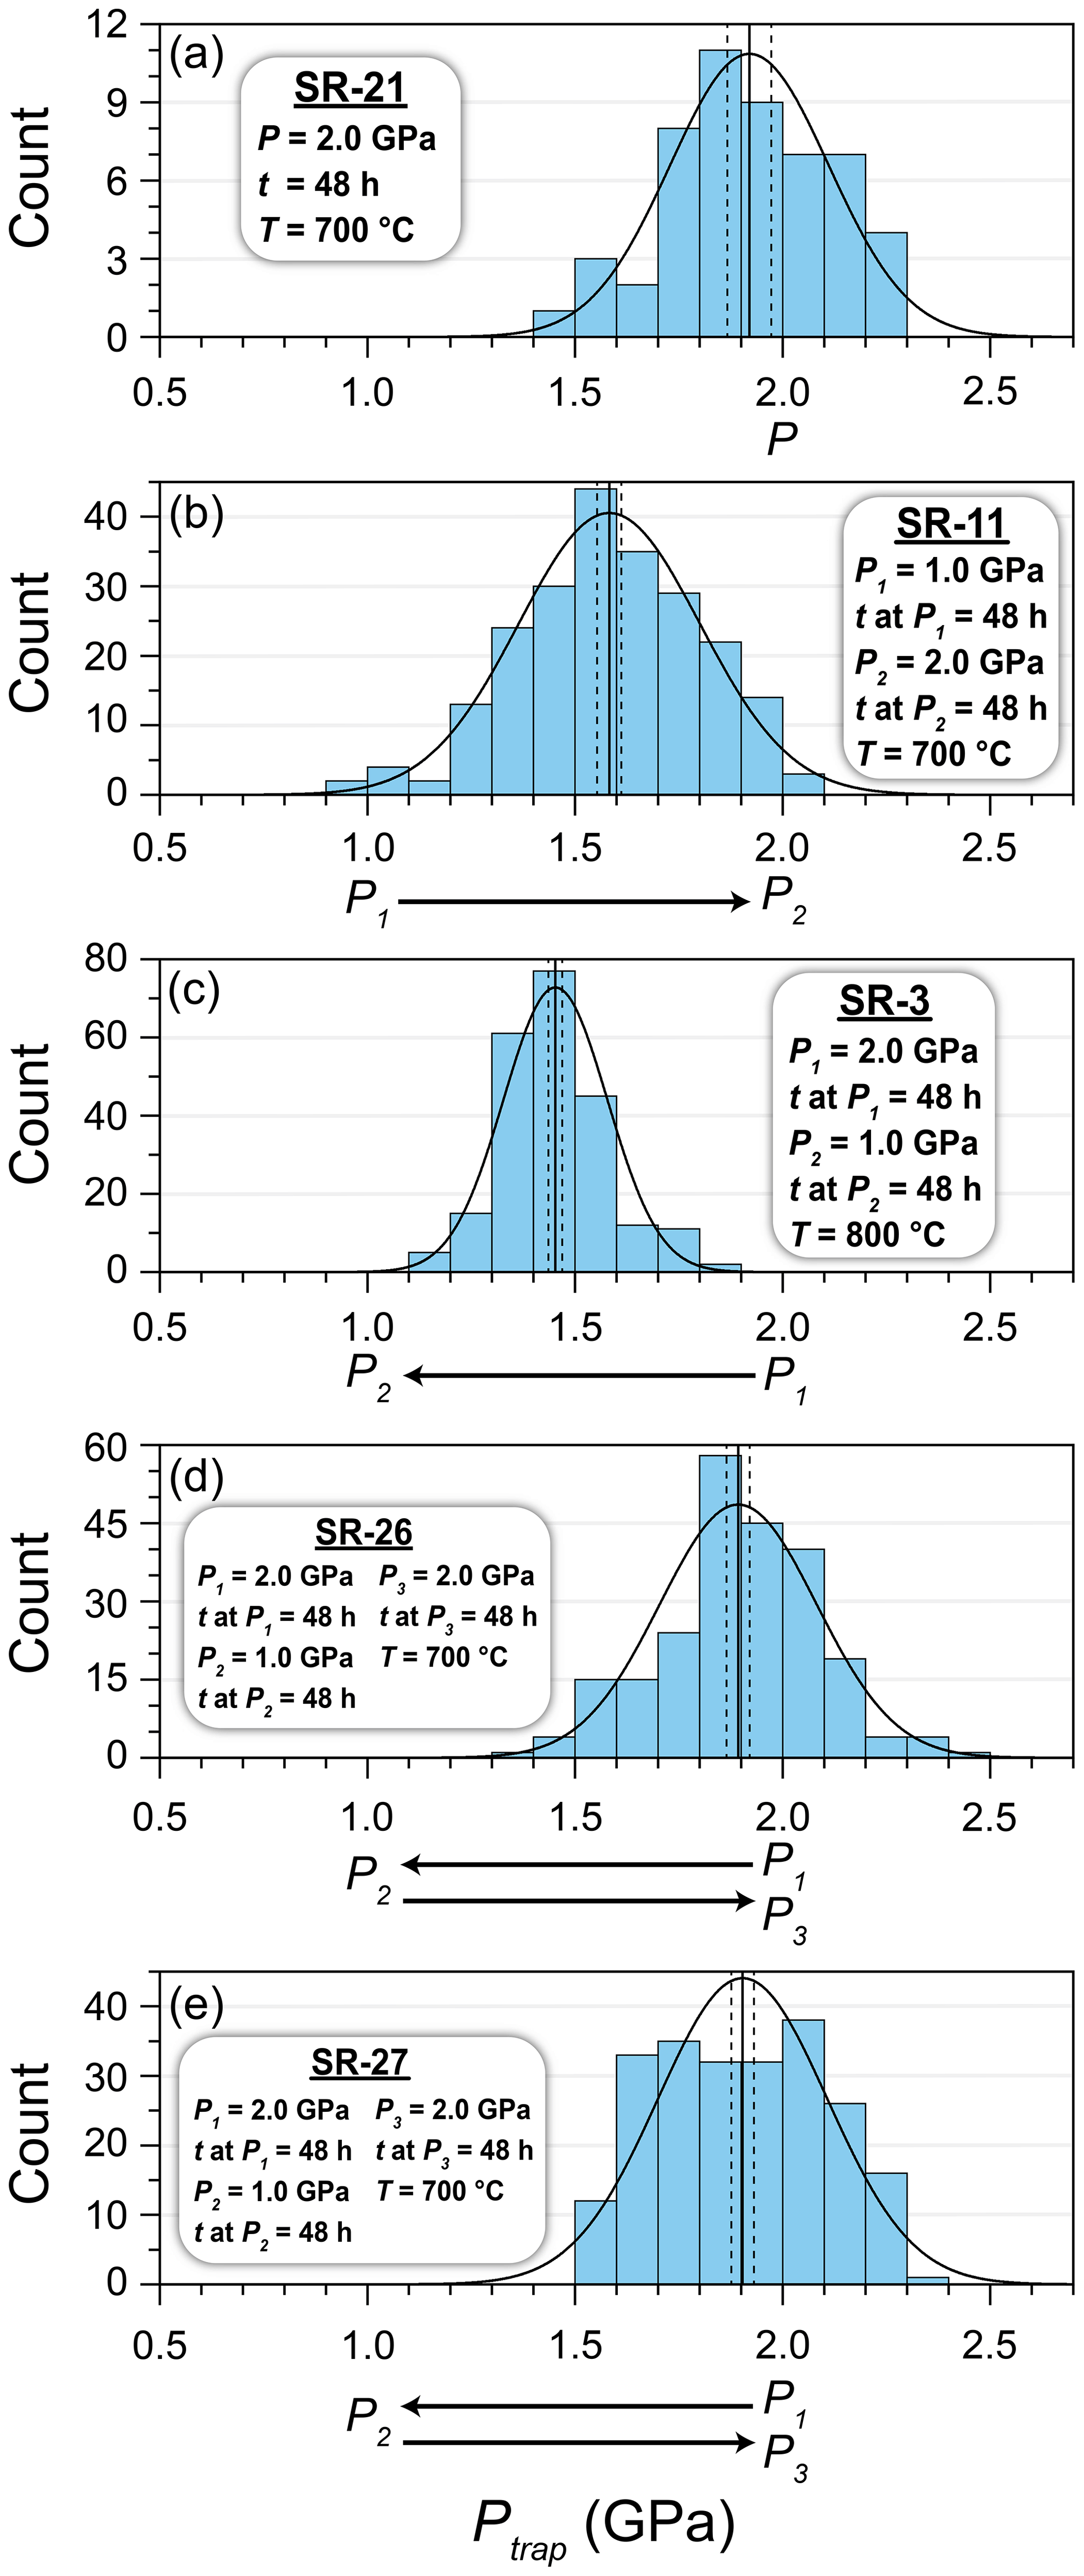
Figure 5Histograms showing normal distributions of the calculated Ptrap values of inclusions for experiments (a) SR-21, (b) SR-11, (c) SR-3, (d) SR-26, and (e) SR-27. The solid, vertical black lines are the average calculated Ptrap values with shown with dashed lines (Table 2). P1 and P2 values shown on the x axis with the direction of pressure change indicated with arrows.
Table 2 lists the Pinc values at room conditions used to calculate entrapment isomekes and the Ptrap values for the experimental run temperature using two equations of state for almandine (Angel et al., 2022; Milani et al., 2015). All experiments have unimodal distributions with individual Ptrap determinations ranging approximately ± 0.5 GPa around average calculated Ptrap values (Fig. 5; Supplement Fig. S2) and GPa (Fig. 5; Table 2). Numerous factors may contribute to the widths of the calculated Ptrap distributions including experimental error, inclusion shape (Campomenosi et al., 2018; Mazzucchelli et al., 2018; Zhong et al., 2021), crystal imperfections (e.g. quartz entrapped with another inclusion phase), strain fields that overlap with adjacent inclusions or interfaces, inelastic post-entrapment modifications (e.g. cracking), and inaccurate Raman band measurement or peak fitting of both the quartz reference material and inclusions. Interestingly, the Pinc and Ptrap ranges and distributions for single-stage and multi-stage experiments are similar (Fig. 5). The range of Ptrap distributions demonstrates that using only a few QuiG measurements can yield inaccurate P–T estimates.
Single-stage experiments produced quartz inclusions in garnet with Pinc values that give isomekes with pressures calculated at the experimental run temperature (i.e. Ptrap) that are similar to pressures measured on piston-cylinder gauges (Fig. 5a; Table 2) (Bonazzi et al., 2019; Thomas and Spear, 2018). The average apparent Ptrap values for the two-stage experiments are between P1 and P2 measured on the piston-cylinder gauges (Fig. 5b and c; Table 2). The calculated Ptrap values from the three-stage experiments are remarkably close to pressures imposed at P1 and P3 (Fig. 5d and e; Table 2).
The time series of experiments do not show a systematic change to Ptrap with increasing time at P2 (Fig. 6; Tables 2 and 4). The five two-stage time-series experiments have a cumulative average apparent Ptrap value of 1.60 ± 0.06 GPa with a standard deviation of 0.12 GPa.
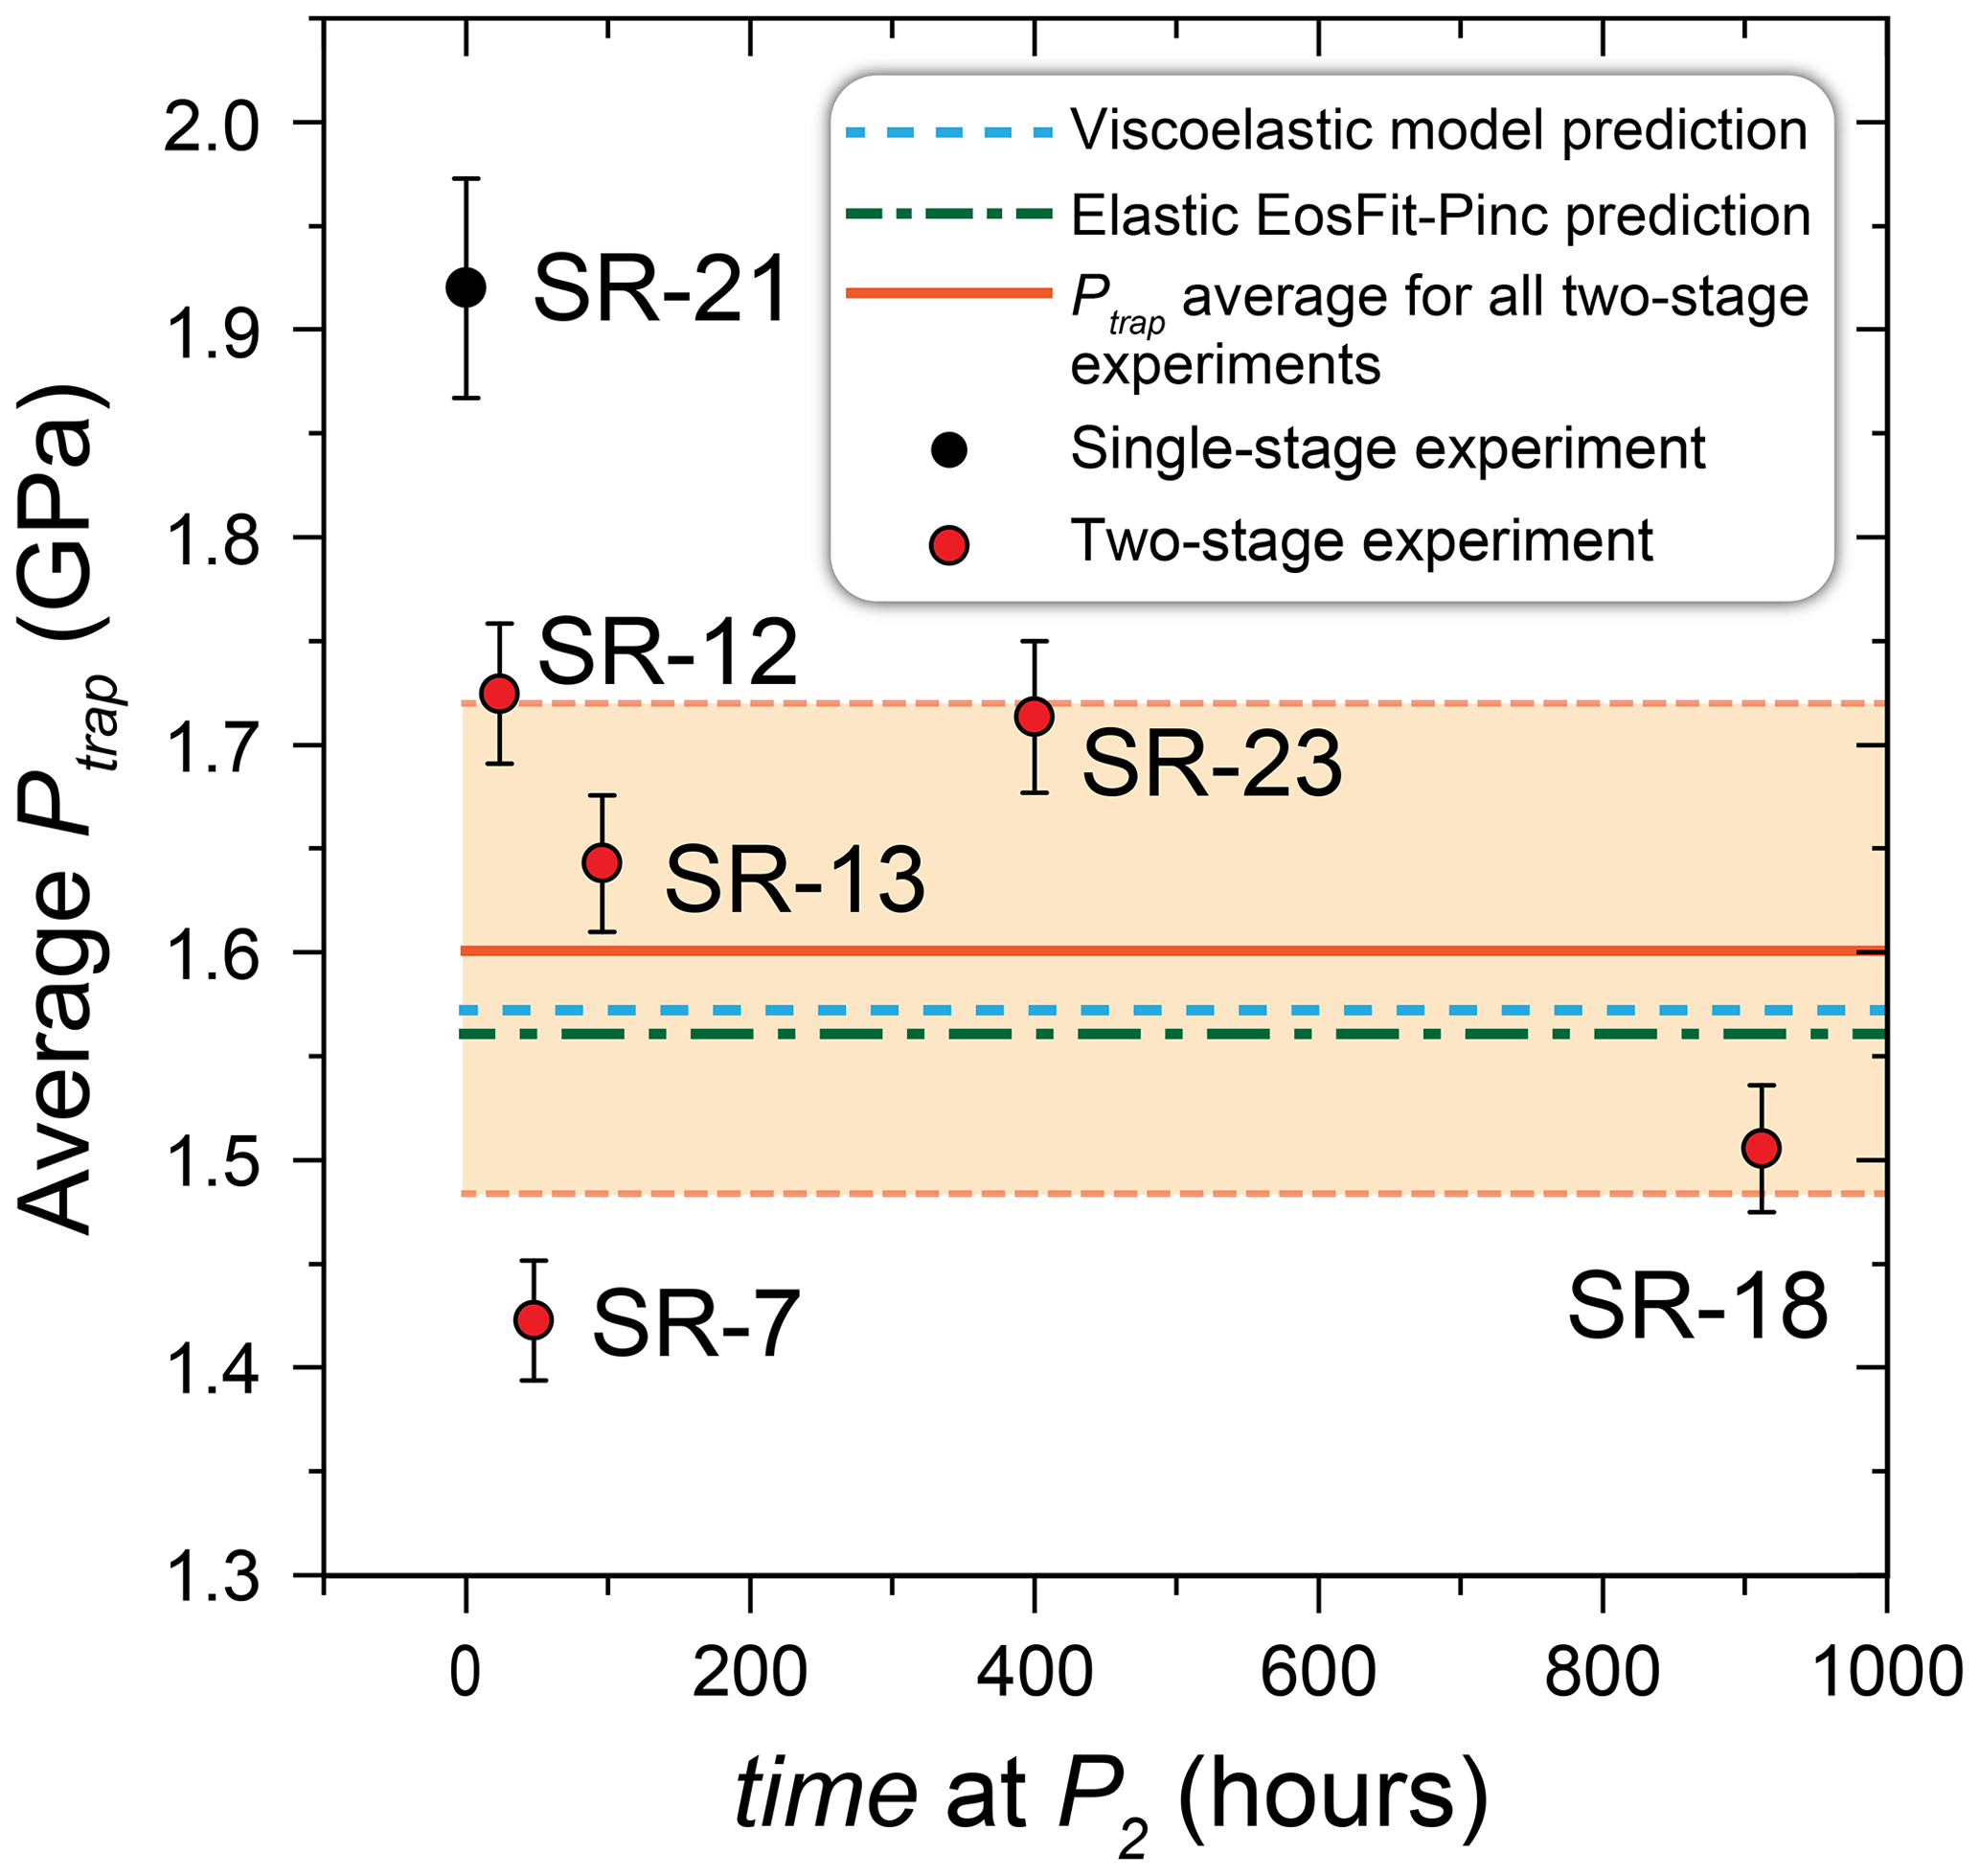
Figure 6Average apparent entrapment pressures (Ptrap) calculated from quartz inclusions from the depressurisation time-series experiments. The dashed green and blue lines show the respective predicted apparent Ptrap values from the elastic EosFit-Pinc (Angel et al., 2017b) and viscoelastic models (Zhong et al., 2020). The average apparent Ptrap of all the two-stage time-series experiments is shown with the orange line, with the shaded area showing the .
The controlled experiments of this study permit us to evaluate how changing P–T conditions might affect QuiG thermobarometry. Previous single-stage experiments (Bonazzi et al., 2019; Thomas and Spear, 2018) showed that Pinc values observed at room conditions reflected the pressures exerted on garnets and quartz during entrapment, which means that quenching and elasticity effectively preserved the stress states of the host–inclusion system at Ptrap. All QuiG applications assume that elasticity controls development of inclusion pressures when P–T conditions change. Elasticity in QuiG was demonstrated during in situ Raman analyses at room T of characterised samples, returning to the expected Pinc values (Campomenosi et al., 2023a). However, previous studies did not demonstrate that the QuiG system behaved elastically during multi-stage changes to P–T conditions. An outstanding question remained: “can quartz inclusions in garnet survive significant changes to Pinc that occur during metamorphism and exhumation?” Moreover, we did not know if it was possible to quench (i.e. preserve) the inclusion–host stress states that existed at pressures that were different from Ptrap in multi-stage experiments. The collective range of conditions imposed on the QuiG system in the single-, two-, and three-stage experiments (Fig. 3) are analogous to a cycle of high-grade metamorphism followed by exhumation and reburial to high-grade conditions along multiple P–T paths. Quenching the experiments at various stages of the cycle permits us to examine how the inclusion–host system physically responded to develop Pinc values observed at room conditions.
4.1 Textural development
When garnet crystallised in our experiments, it enclosed nearby quartz crystals as inclusions. Garnet crystals grown in 10 s with a maximum diameter of 8 µm (TR-14; Table 2) indicate that garnet nucleation occurs early in the experiments. Experiments conducted for < 24 h contain garnets with similar sizes to those of experiments run for > 900 h. In two-stage experiments there is no correlation between the position of quartz inclusions in garnet crystals (i.e. cores versus rims of garnets) and Pinc values. Adjacent inclusions may give Pinc values that span the range of measurements (Fig. 4). The unimodal distributions of calculated Ptrap values suggest inclusion entrapment occurred at P1 and then travelled through P–T space during the multi-stage experiments (Fig. 5). The zero-time experiment showed that mineral nucleation occurs within the first few seconds of an experiment, followed by rapid growth to near-maximum dimensions of minerals and concomitant inclusion entrapment, followed by little subsequent increased diameter.
Most of the garnet hosts are not cracked around the quartz inclusions (Fig. 4). Cracking was more prevalent in the two-stage depressurisation experiments (SR-3 and QuiG-35) presumably because quartz inclusions increased in volume during depressurisation (Fig. 7) so that the tangential stresses on inclusions exceeded the elastic limit of host garnet crystals (Wang and Ji, 1999; Zhang, 1998). For a free quartz crystal isothermally depressurised from 2.0 to 1.0 GPa, the quartz molar volume increases by 2.8 % and 3.3 % at 700 and 800 °C, respectively (Angel et al., 2017a; Fig. 7), and the molar volume of a free almandine crystal following the same P–T path increases by 0.61 % and 0.6 % at 700 and 800 °C, respectively (Angel et al., 2022; Milani et al., 2015; Fig. 7). At P2 in the two-stage depressurisation experiments, Pinc values are always higher than the pressures applied to the host garnet crystals, which caused cracking of some inclusions in those experiments. Decrepitated garnets from experiment QuiG-35 (Fig. 4e) likely formed during the phase transition from coesite to α-quartz. Depressurisation magnitude, depressurisation rate, inclusion geometry (Campomenosi et al., 2018), relative molar volume changes in the garnet host and quartz inclusion, disposition relative to phase boundaries, and radial position of inclusions in garnet hosts must affect the extent of cracking.
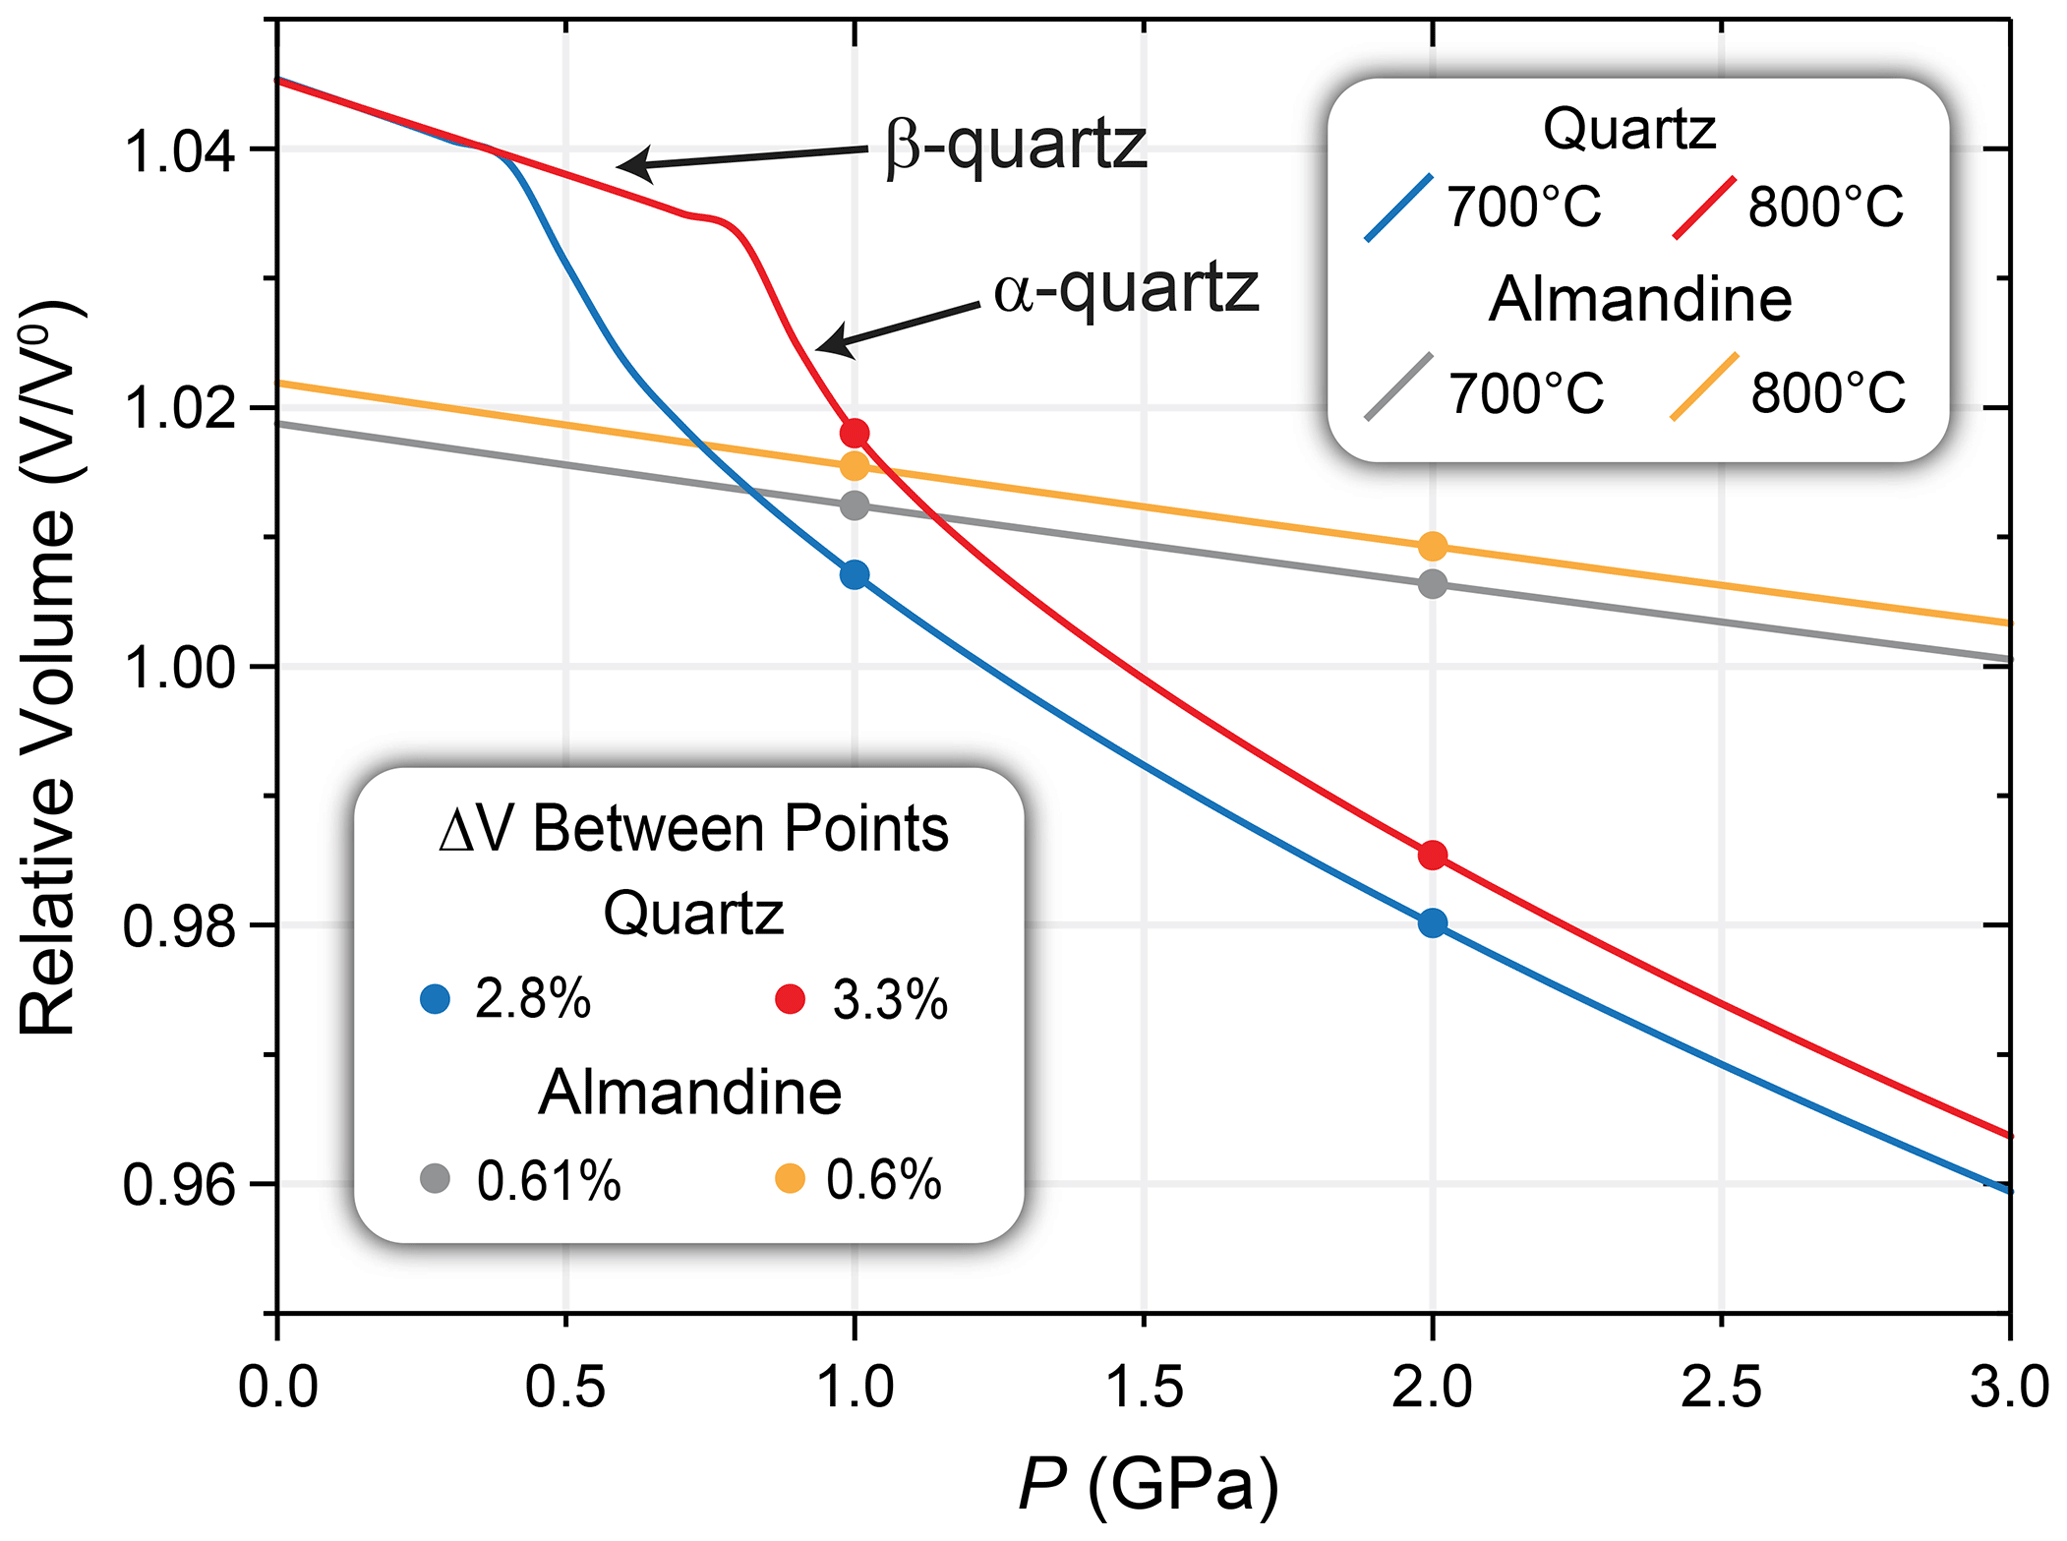
Figure 7Quartz and almandine volumes calculated from the respective equation of state (Angel et al., 2017a, 2022) for the 700 and 800 °C isotherms. The inflection points on the quartz curves are the α–β transition.
4.2 Post-entrapment changes to pressures of inclusions
4.2.1 Single-stage experiments
The single-stage experiments provide a simple case for examining how changing the P–T conditions affects the pressures of quartz inclusions in garnet. The calculated Ptrap values were compared to pressures measured on piston-cylinder pressure gauges to evaluate the accuracy of calculated entrapment pressures. The average Pinc value of SR-21 is 0.739 GPa, which gives a calculated Ptrap at 700 °C of 2.04 and 1.92 GPa using the two almandine EoSs (Angel et al., 2022; Milani et al., 2015) (Table 2; Fig. 8a). Ptrap values calculated using the two almandine EoSs bracket the measured experimental pressure. The similarity of calculated Ptrap values and pressures measured on gauges demonstrates that the inclusions developed elastic equilibrium at run conditions that was preserved through the quenching and depressurisation steps of our experiments. Numerous other similar single-stage experiments in Thomas and Spear (2018) and Bonazzi et al. (2019) demonstrate that QuiG can reliably provide accurate Ptrap values.
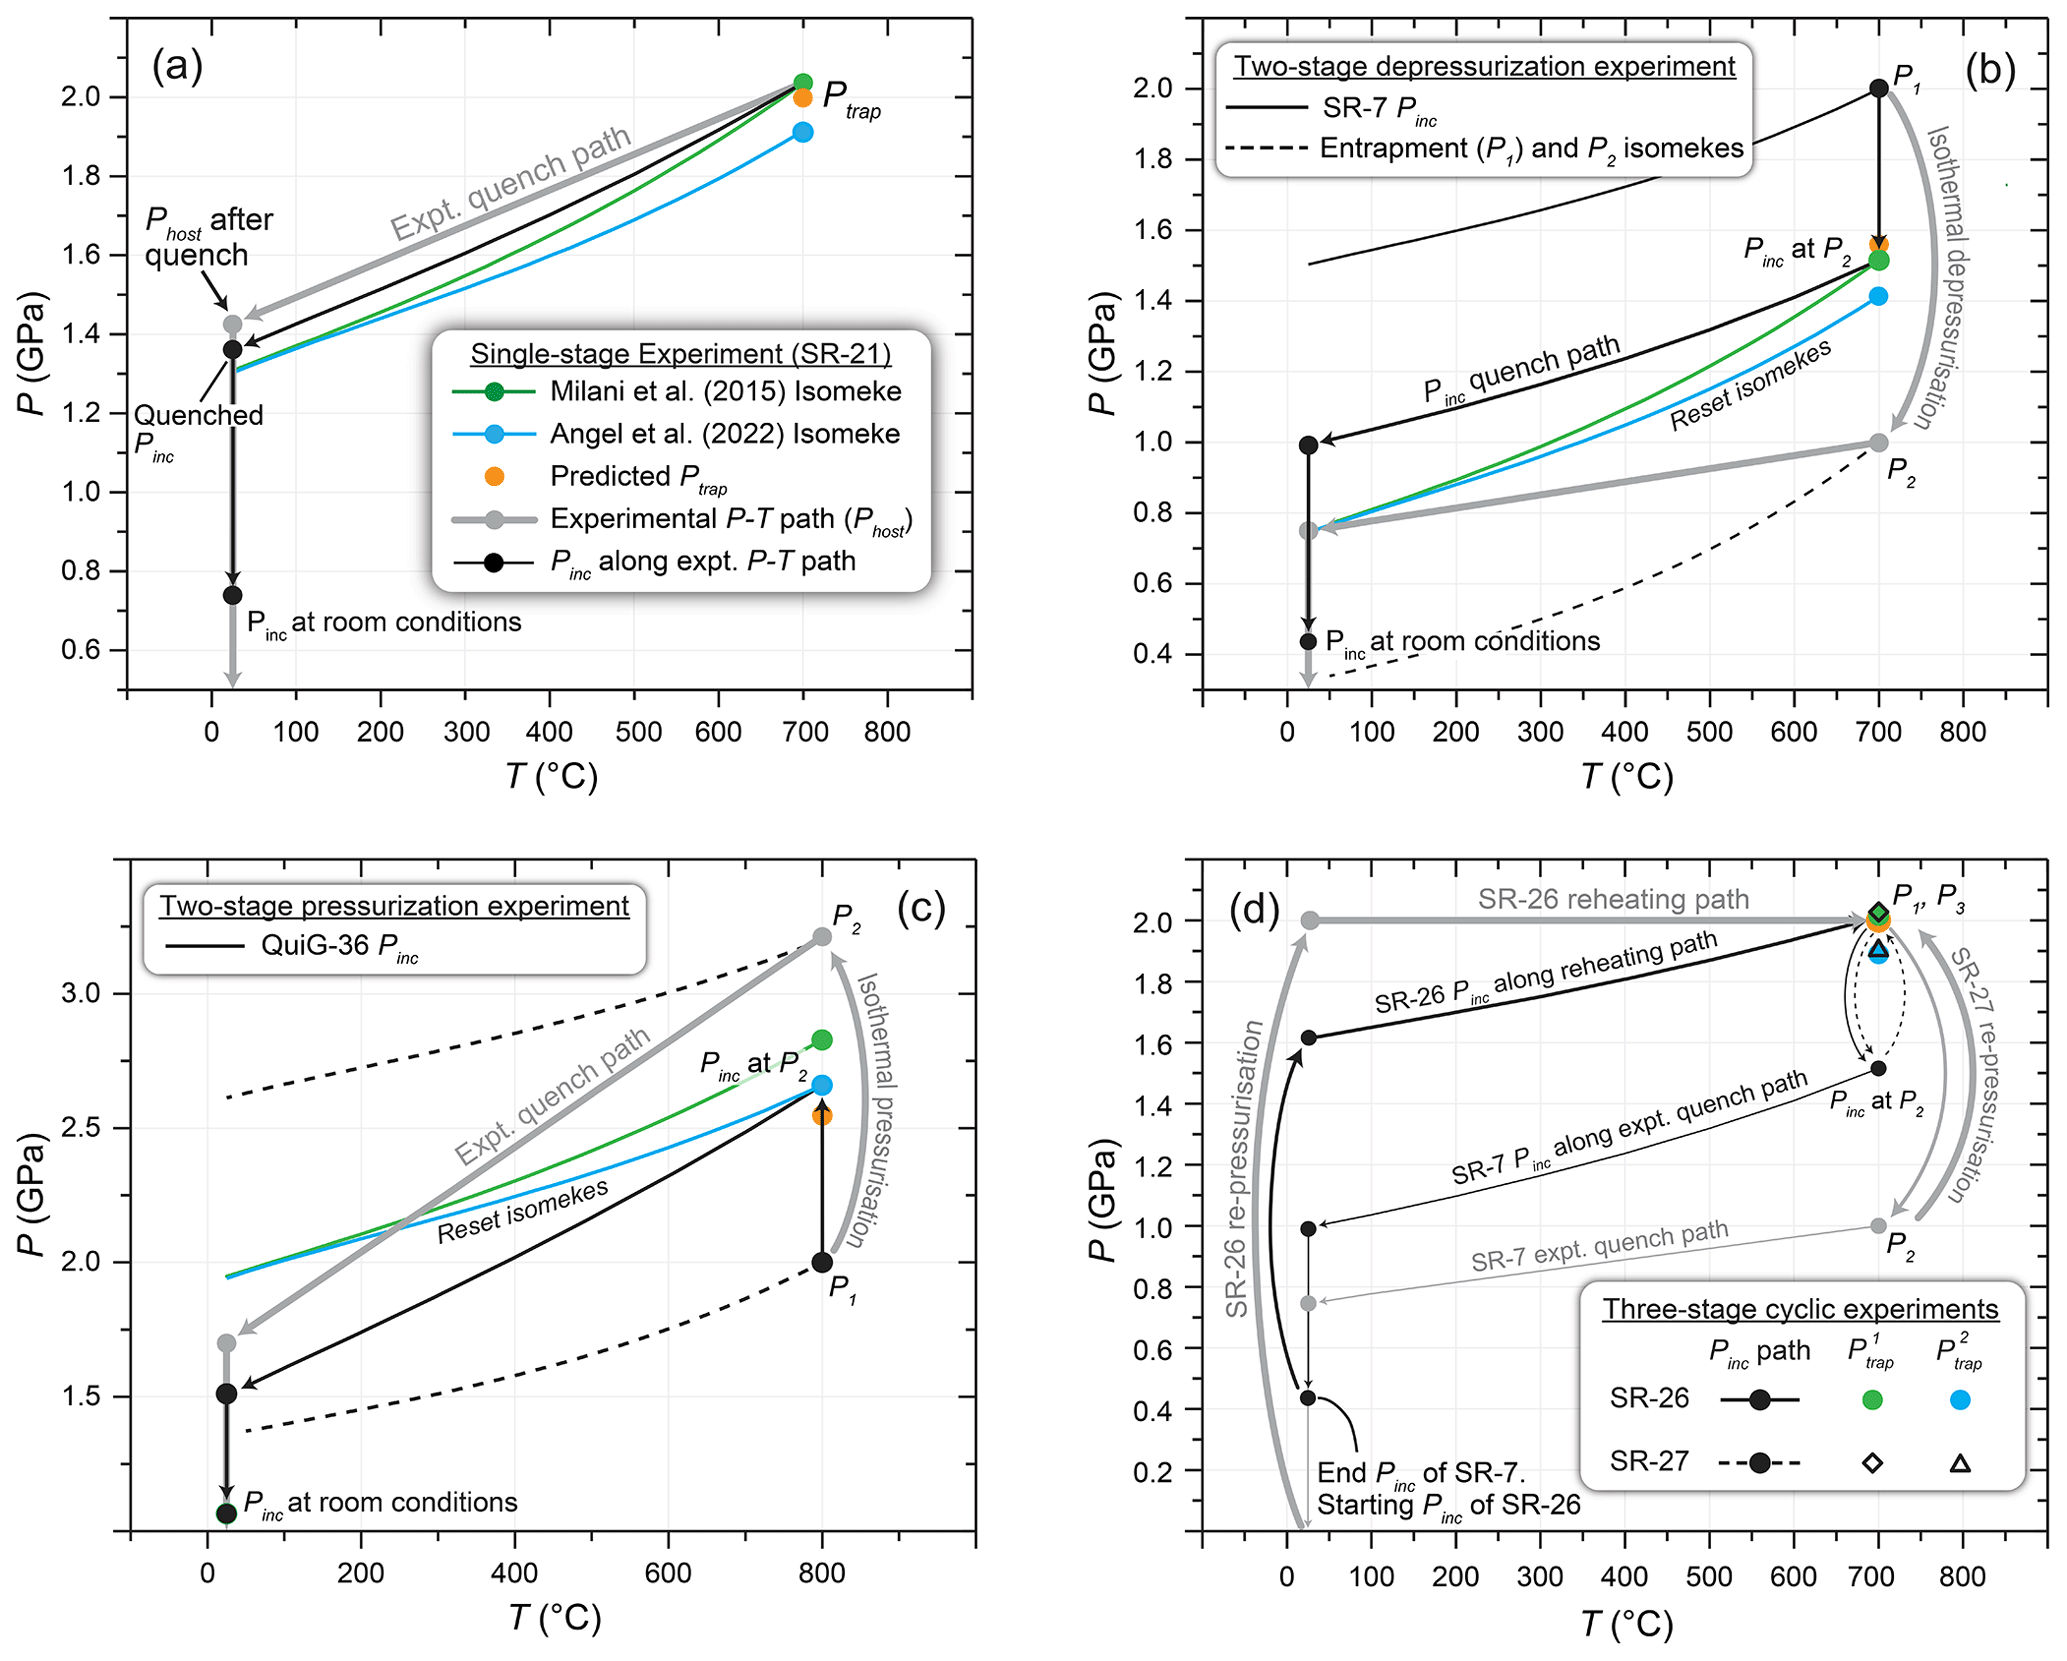
Figure 8Experimental P–T paths of (a) static experiment SR-21, (b) two-stage depressurisation experiment SR-7, (c) two-stage pressurisation experiment QuiG-36, and (d) three-stage cyclic experiments SR-26 and SR-27. Each plot shows the experimental P–T path (Phost) and the resulting Pinc path that follows. Calculated isomekes for the average apparent Ptrap values are given for both almandine equations of state (Milani et al., 2015; Angel et al., 2022). The predicted apparent Ptrap values are shown. Errors for apparent Ptrap values are smaller than the symbols used in the plots. In plot (d), and are calculated using the Milani et al. (2015) and Angel et al. (2022) almandine EoSs, respectively.
In single-stage experiments, pressures of quartz inclusions that are different from pressures applied to host garnets develop when experiments are quenched to room conditions (Fig. 8a). The P–T path followed by an experiment during quenching depends on the experimental assembly design (Fig. 2) and the P–T conditions. During the quench to room temperature, experimental pressures decreased linearly by ∼ 15 %–45 % and experiments followed decompression paths that were not coincident with entrapment isomekes. Thus, in single-stage experiments, the pressure applied to the host garnet (Phost) equals Pinc only at Ptrap (Fig. 8). We used P and T conditions along the experimental quench path to calculate pressure development in quartz inclusions. After quenching experiment SR-21 to 25 °C, the pressure applied to the garnet hosts was 1.43 GPa, Pinc values were 1.36 GPa, and the calculated foot of the entrapment isomeke was 1.31 GPa (Fig. 8a). Once depressurised to room conditions below the foot of the isomeke, quartz inclusions had Pinc > Phost, which caused elastic relaxation in the host garnet (Angel et al., 2014), and the inclusions developed an average Pinc value of 0.739 GPa (Fig. 8a; Table 2).
4.2.2 Two-stage experiments
In two-stage experiments, pressure developed in the host–inclusion system when pressure was isothermally adjusted from P1 to P2 so that Pinc≠Phost and during quenching and depressurisation to room conditions (Fig. 8b and c). For example, in experiment SR-7, quartz inclusions were entrapped at 2.0 GPa and 700 °C followed by isothermal depressurisation to 1.0 GPa (Table 2). Upon depressurisation to P2=1 GPa, the garnet hosts “shielded” the quartz inclusions from the external pressure applied to the garnet crystals. For experiment SR-7, the observed average Pinc value of 0.436 GPa gives an apparent Ptrap value at 700 °C of ∼ 1.42–1.52 GPa (Milani et al., 2015; Angel et al., 2022; Table 2; Fig. 8b). Calculations using the EoSs and EosFit-Pinc (Angel et al., 2017b), assuming elasticity for SR-7, predict a re-equilibrated isomeke with an apparent Ptrap=1.56 GPa at P2 (Figs. 6 and 8b; Table 3). The room-condition Pinc value representative of actual Ptrap at 2.0 GPa and 700 °C is approximately 0.7–0.8 GPa (Angel et al., 2022; Milani et al., 2015). Similar calculations assuming elasticity show that had the inclusions fully reset to P2=1.0 GPa, room-condition measurements would give a Pinc value of approximately 0.08–0.10 GPa (Angel et al., 2022; Milani et al., 2015). Because the isothermal change in garnet volume is smaller than the change in quartz volume (Fig. 7), an elastic response to changes in pressure will produce a re-equilibrated isomeke that is intermediate of the expected isomekes for P1 and P2 (Fig. 8b and c). For the two-stage depressurisation experiments, Pinc values are always significantly higher than the pressures applied to the host garnets at P2, during quenching, and during depressurisation (Fig. 8b).
For the two-stage pressurisation experiments, Pinc values are always significantly lower than pressures applied to the host garnets at P2 and during quenching. Calculations using run conditions for experiment QuiG-36 (P1=2, P2=3.2 GPa, 800 °C; Table 2) predict an apparent Ptrap=2.55 GPa at P2 (Fig. 8c; Table 3). Similar to natural garnets that entrapped quartz inclusions followed by transport to the coesite field (Alvaro et al., 2019), none of the quartz inclusions in our experiments entrapped at P1 transformed to coesite at P2 because the garnet hosts “shielded” the quartz inclusions from the external pressure applied to the garnet crystals. The observed average Pinc for experiment QuiG-36 is 1.065 GPa, which gives a calculated apparent Ptrap at 800 °C of 2.66 GPa using the published almandine EoS from Angel et al. (2022), which agrees reasonably well with the predicted elastic resetting of Pinc at P2 caused by isothermal pressurisation (Fig. 8c; Table 3). The almandine EoS from Milani et al. (2015) gives a higher apparent Ptrap of 2.84 GPa but still well within the quartz stability field (Table 2). Our results demonstrate that re-equilibration occurs in < 48 h of dwelling at P2. Importantly, for both types of two-stage experiments, the re-equilibrated Pinc at P2 was preserved through experimental quenching and depressurisation. The resulting Pinc at the experimental temperature represents apparent entrapment at a pressure matching the predicted Pinc developed elastically as a result of the external pressure change from P1 to P2 (Fig. 8b and c; Table 3). Thus, these re-equilibrated Pinc values do not represent the actual Ptrap.
4.2.3 Three-stage cyclic experiments
The two-stage experiments provide strong evidence that the re-equilibration is driven by the elastically generated Pinc in the relatively short duration experiments. Elasticity is reversible. Thus, if the Pinc values were reset from P1 to P2 by elastic processes, then it should be possible to reverse the re-equilibrated Pinc values (P3=P1) to give isomekes that represent Ptrap at P1. As described above in the Methods section, we performed two types of three-stage reversal experiments by re-pressurising to GPa. The average Pinc for experiment SR-26 is 0.724 GPa, which gives a calculated apparent Ptrap at 700 °C of 2.02 to 1.89 GPa using the two almandine EoSs (Table 2; Fig. 8d). Experiment SR-27 has an average Pinc=0.730 GPa, which gives a calculated Ptrap at 700 °C of 2.03 GPa to 1.90 GPa using the two almandine EoSs.
Figure 8d shows the changes to Pinc that occurred throughout the two types of three-stage experiments. For experiment SR-27 that ran continuously without quenching to room conditions, Pinc changed from P1=2.0 GPa at 700 °C to approximately Pinc=1.5 GPa after isothermal depressurisation to P2=1.0 GPa (Table 2). Upon isothermal re-pressurisation back to GPa, Pinc reversed back to approximately 2.027 and 1.904 GPa (Milani et al., 2015; Angel et al., 2022; Fig. 8d; Table 2). Experiment SR-26 shows reversibility along a more complicated P–T path. As shown in Fig. 8d, applying 2.0 GPa of hydrostatic pressure to the exterior surfaces of the garnets from experiment SR-7 increased Pinc from a measured value of 0.436 to ∼ 1.6 GPa. By heating to 700 °C at 100 °C min−1 back to P1 conditions, Pinc increased to 2.016 and 1.893 GPa (Milani et al., 2015; Angel et al., 2022; Fig. 8d; Table 2). Similar to the single-stage experiments, the calculated apparent Ptrap values from the two almandine EoSs bracket the measured experimental pressure. Both types of three-stage cyclic experiments give calculated Ptrap values that closely agree with the P1 and P3 conditions. The excursions through P–T space for the three stages of SR-7, SR-26, and SR-27 demonstrate remarkable integrity and reversible elastic responses of the quartz inclusion and almandine host system to attain mechanical equilibrium independent of P–T path in < 48 h.
Re-equilibration can change Pinc values so that they do not reflect the true entrapment conditions (e.g. Zhang, 1998; Wang and Ji, 1999; Dabrowski et al., 2015; Ferrero and Angel, 2018; Alvaro et al., 2019; Moulas et al., 2020; Zhong et al., 2020; Morana et al., 2023; Moulas et al., 2023). If pressure changed from P1 to P2, and then garnets with quartz inclusions were rapidly exhumed, for example by kimberlite or maar eruptions (e.g. Alvaro et al., 2019), QuiG would return pressures between P1 and P2 in a response similar to our two-stage experiments. Importantly, if the garnet with quartz inclusions was returned to its original entrapment condition similar to our three-stage experiments, it would re-equilibrate leaving no evidence of its P–T path. The response of quartz inclusions in garnet to changes in P–T conditions in our experiments occurs rapidly compared to temperature-, time-, and ΔP-dependent changes to inclusion pressures caused by plastic deformation (e.g. Dabrowski et al., 2015; Ferrero and Angel, 2018; Moulas et al., 2020; Zhong et al., 2020; Morana et al., 2023; Moulas et al., 2023).
4.3 The role of plastic deformation on resetting Pinc values
Rate-dependent plastic deformation must occur over protracted periods of time and eventually diminish stress gradients around quartz inclusions. Given sufficient time, ΔP, and elevated temperatures at P2≠Ptrap conditions, rate-dependent plastic deformation can completely reset Pinc to give an isomeke indicating P2. In simple terms, there must be sufficient energy and time available at P2 to reorganise the host and inclusion so that Pinc=P2. The rate at which plastic deformation can change the Pinc values is highest immediately after changing to a new P–T condition, and the rate decreases as ΔP between Pinc and Phost decreases.
The Zhong et al. (2020) viscoelastic model implements an elastic response and plastic response according to changes in P–T conditions (e.g. P1 to P2) to the quartz inclusion and entire garnet host to determine the re-equilibrated Pinc (Tables 3 and 4). Stress fields localised around the quartz inclusion are described in this model. Applying the Zhong et al. (2020) viscoelastic model to the time-series experiments (Tables 2–4) indicates that rate-dependent plastic deformations do not affect the Pinc of our time-series experiments. Considering the experimental conditions of the time-series experiments (P1=2, P2=1, T=700, t up to 912 h; Table 2), each experiment was predicted to have an apparent Ptrap=1.57 GPa (Table 4). The experiment-to-experiment variability in the measured Pinc values in our time-series experiments gives an indication of combined experimental and analytical errors (Fig. 6; see Methods section). If we performed repeat experiments for the multi-stage experiments, averages of numerous experiments would likely be even closer to the predicted elastic response than observed (Fig. 6). For the time series of experiments with P1=2 and P2=1 GPa at 700 °C, elastic calculations using EosFit-Pinc predict Pinc at P2 should be 1.56 GPa, which is in close agreement with the average 1.60 ± 0.12 GPa calculated from all the measured Pinc from the time-series experiments (Fig. 6; Table 3).
Table 4Predicted inclusion pressures (Pinc) for extended durations of P2 of the time-series experiments (i.e. P1=2.0 GPa, P2=1.0 GPa, T=700 °C; Table 2) using the Zhong et al. (2020) viscoelastic model.
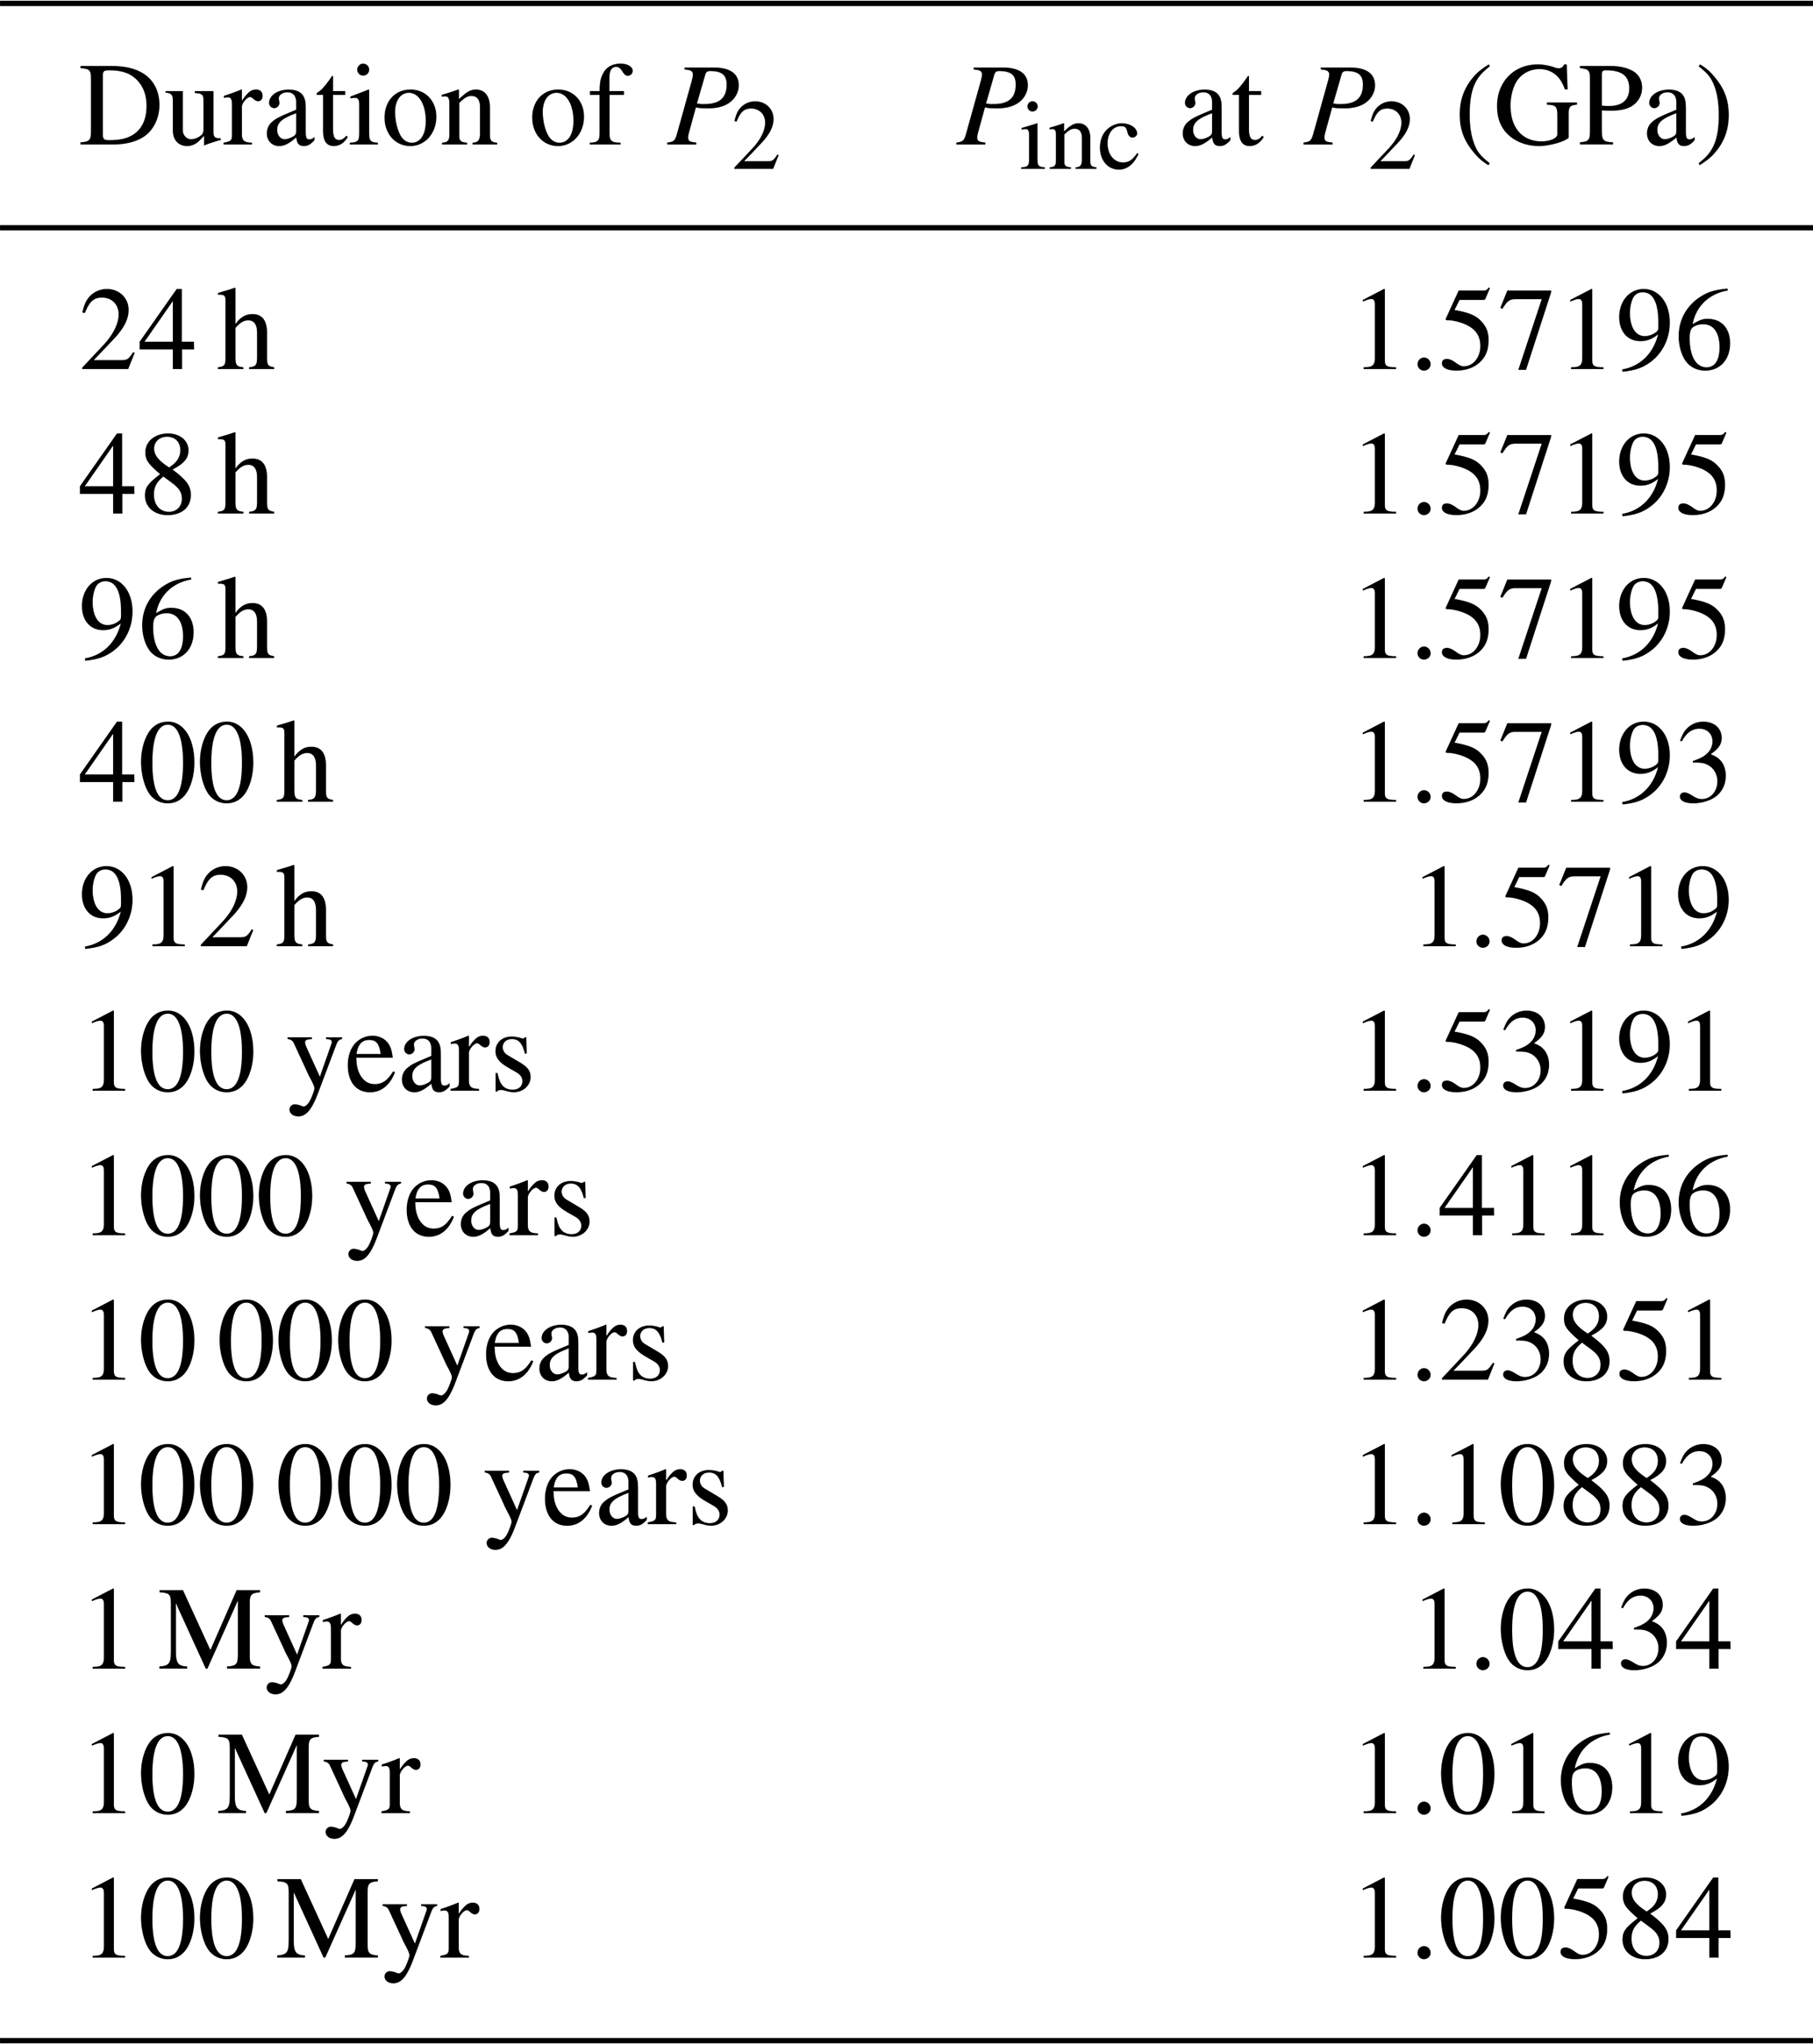
Table 5Changes to Pinc of quartz inclusions in garnet caused by elastic and viscoelastic responses to changes in P–T conditions along four points (t1–t4) of the P–T–t path shown in Figs. 1 and 9 assuming instantaneous garnet growth and quartz inclusion entrapment followed by dwelling at that point for 5 Myr and then transport to the next P–T condition over a 5 Myr duration.
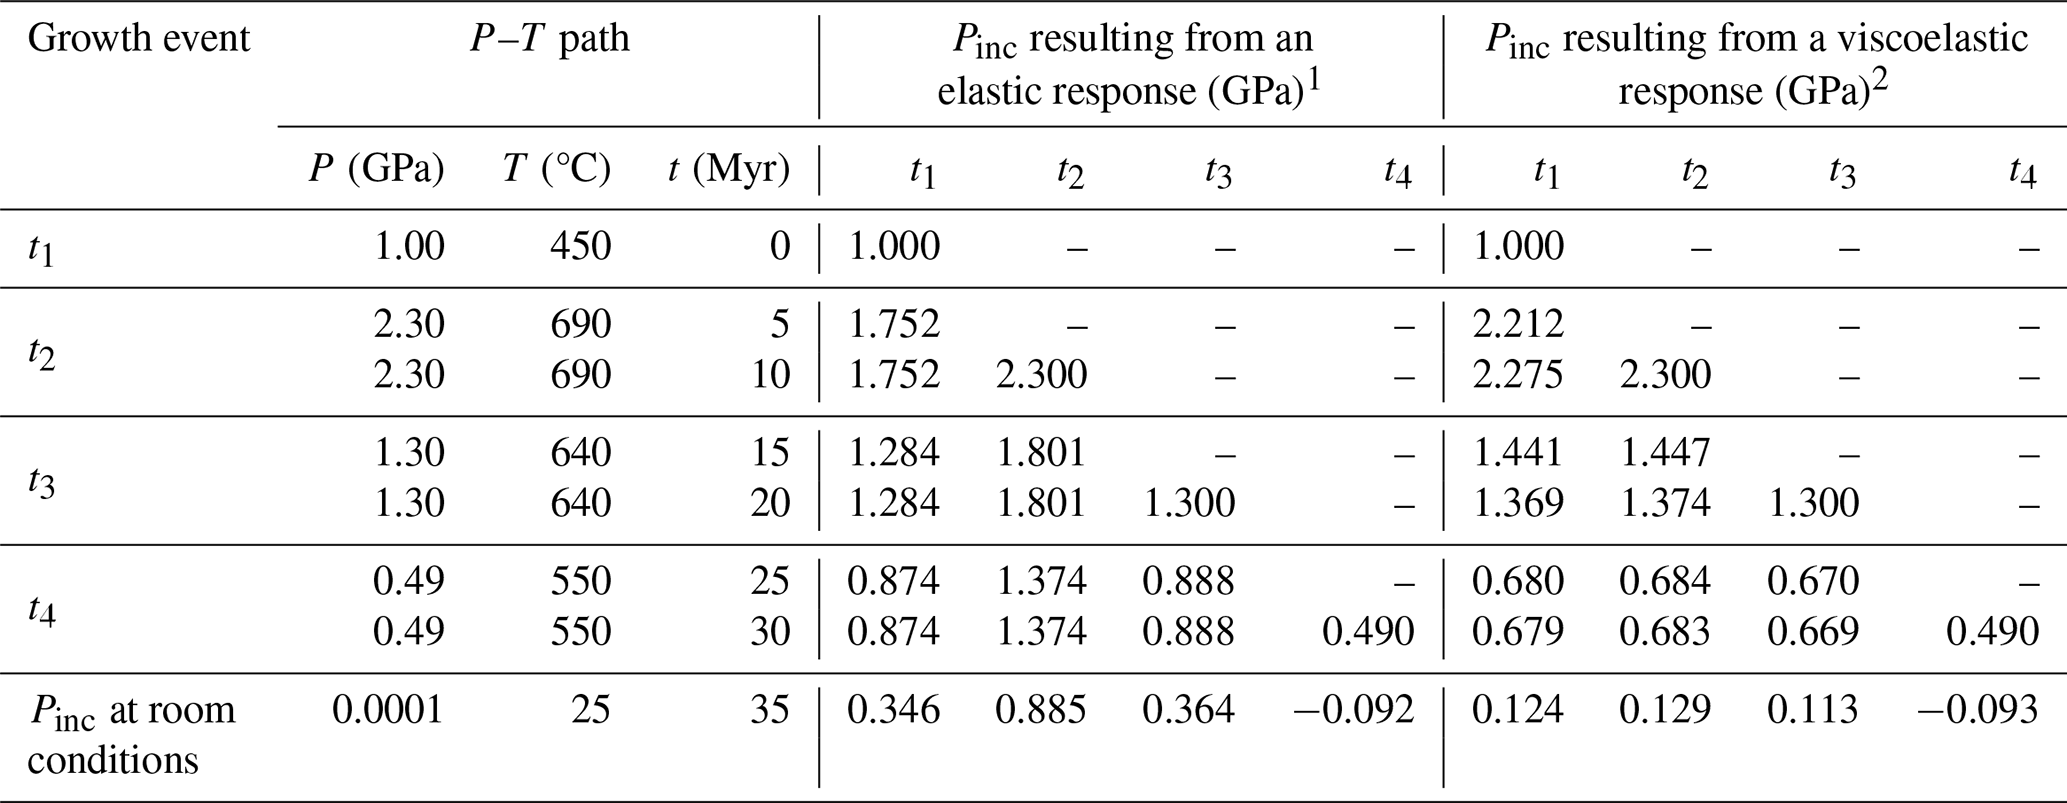
All Pinc values were calculated using the exact relaxation model in EosFit-Pinc (Angel et al., 2017b). 1 Milani et al. (2015). 2 Zhong et al. (2020).
Given sufficient time at the elevated temperatures of this study, plastic deformation will significantly change Pinc values. Considering the same P–T path as the time-series experiments (P1=2 and P2=1 GPa at 700 °C), the Zhong et al. (2020) viscoelastic model predicts that it will take ∼ 100 years at P2 for plastic deformation to change Pinc by 0.04 GPa (Table 4). It would take ∼ 100 Myr to reset Pinc to be ∼ 1.006 GPa at P2 (Table 4). At temperatures explored in our study, the viscoelastic model from Zhong et al. (2020) predicts that the timescales of resetting by rate-dependent plastic deformation are significantly longer than feasible in our laboratory-based experiments (Tables 2–3).
To compare a viscoelastic response to an elastic response along a P–T path, we applied the viscoelastic model from Zhong et al. (2020) to the clockwise path shown in Fig. 1. This P–T path is shown with four metamorphic events attributed to garnet growth (t1–t4). We assume instantaneous garnet growth with concomitant quartz entrapment at each event, followed by dwelling at the same P–T conditions for 5 Myr. Transport to the next P–T point was modelled to take another 5 Myr, followed by another episode of garnet growth and quartz inclusion entrapment, which was repeated until the entire P–T loop spanned 35 Myr (Fig. 9a–d; Table 5). A purely elastic response without any plastic deformation would produce a core-to-rim zoned garnet (Fig. 9e) that has quartz inclusions with room-condition Pinc values of 0.346, 0.885, 0.364, and –0.092 GPa. Assuming elastic behaviour throughout the P–T loop, the quartz inclusions in garnet would accurately reflect entrapment conditions of each garnet growth zone. If the garnet behaved similar to our experiments and quenched along the P–T path like our experiments (Fig. 8), the inclusions would preserve re-equilibrated Pinc values.
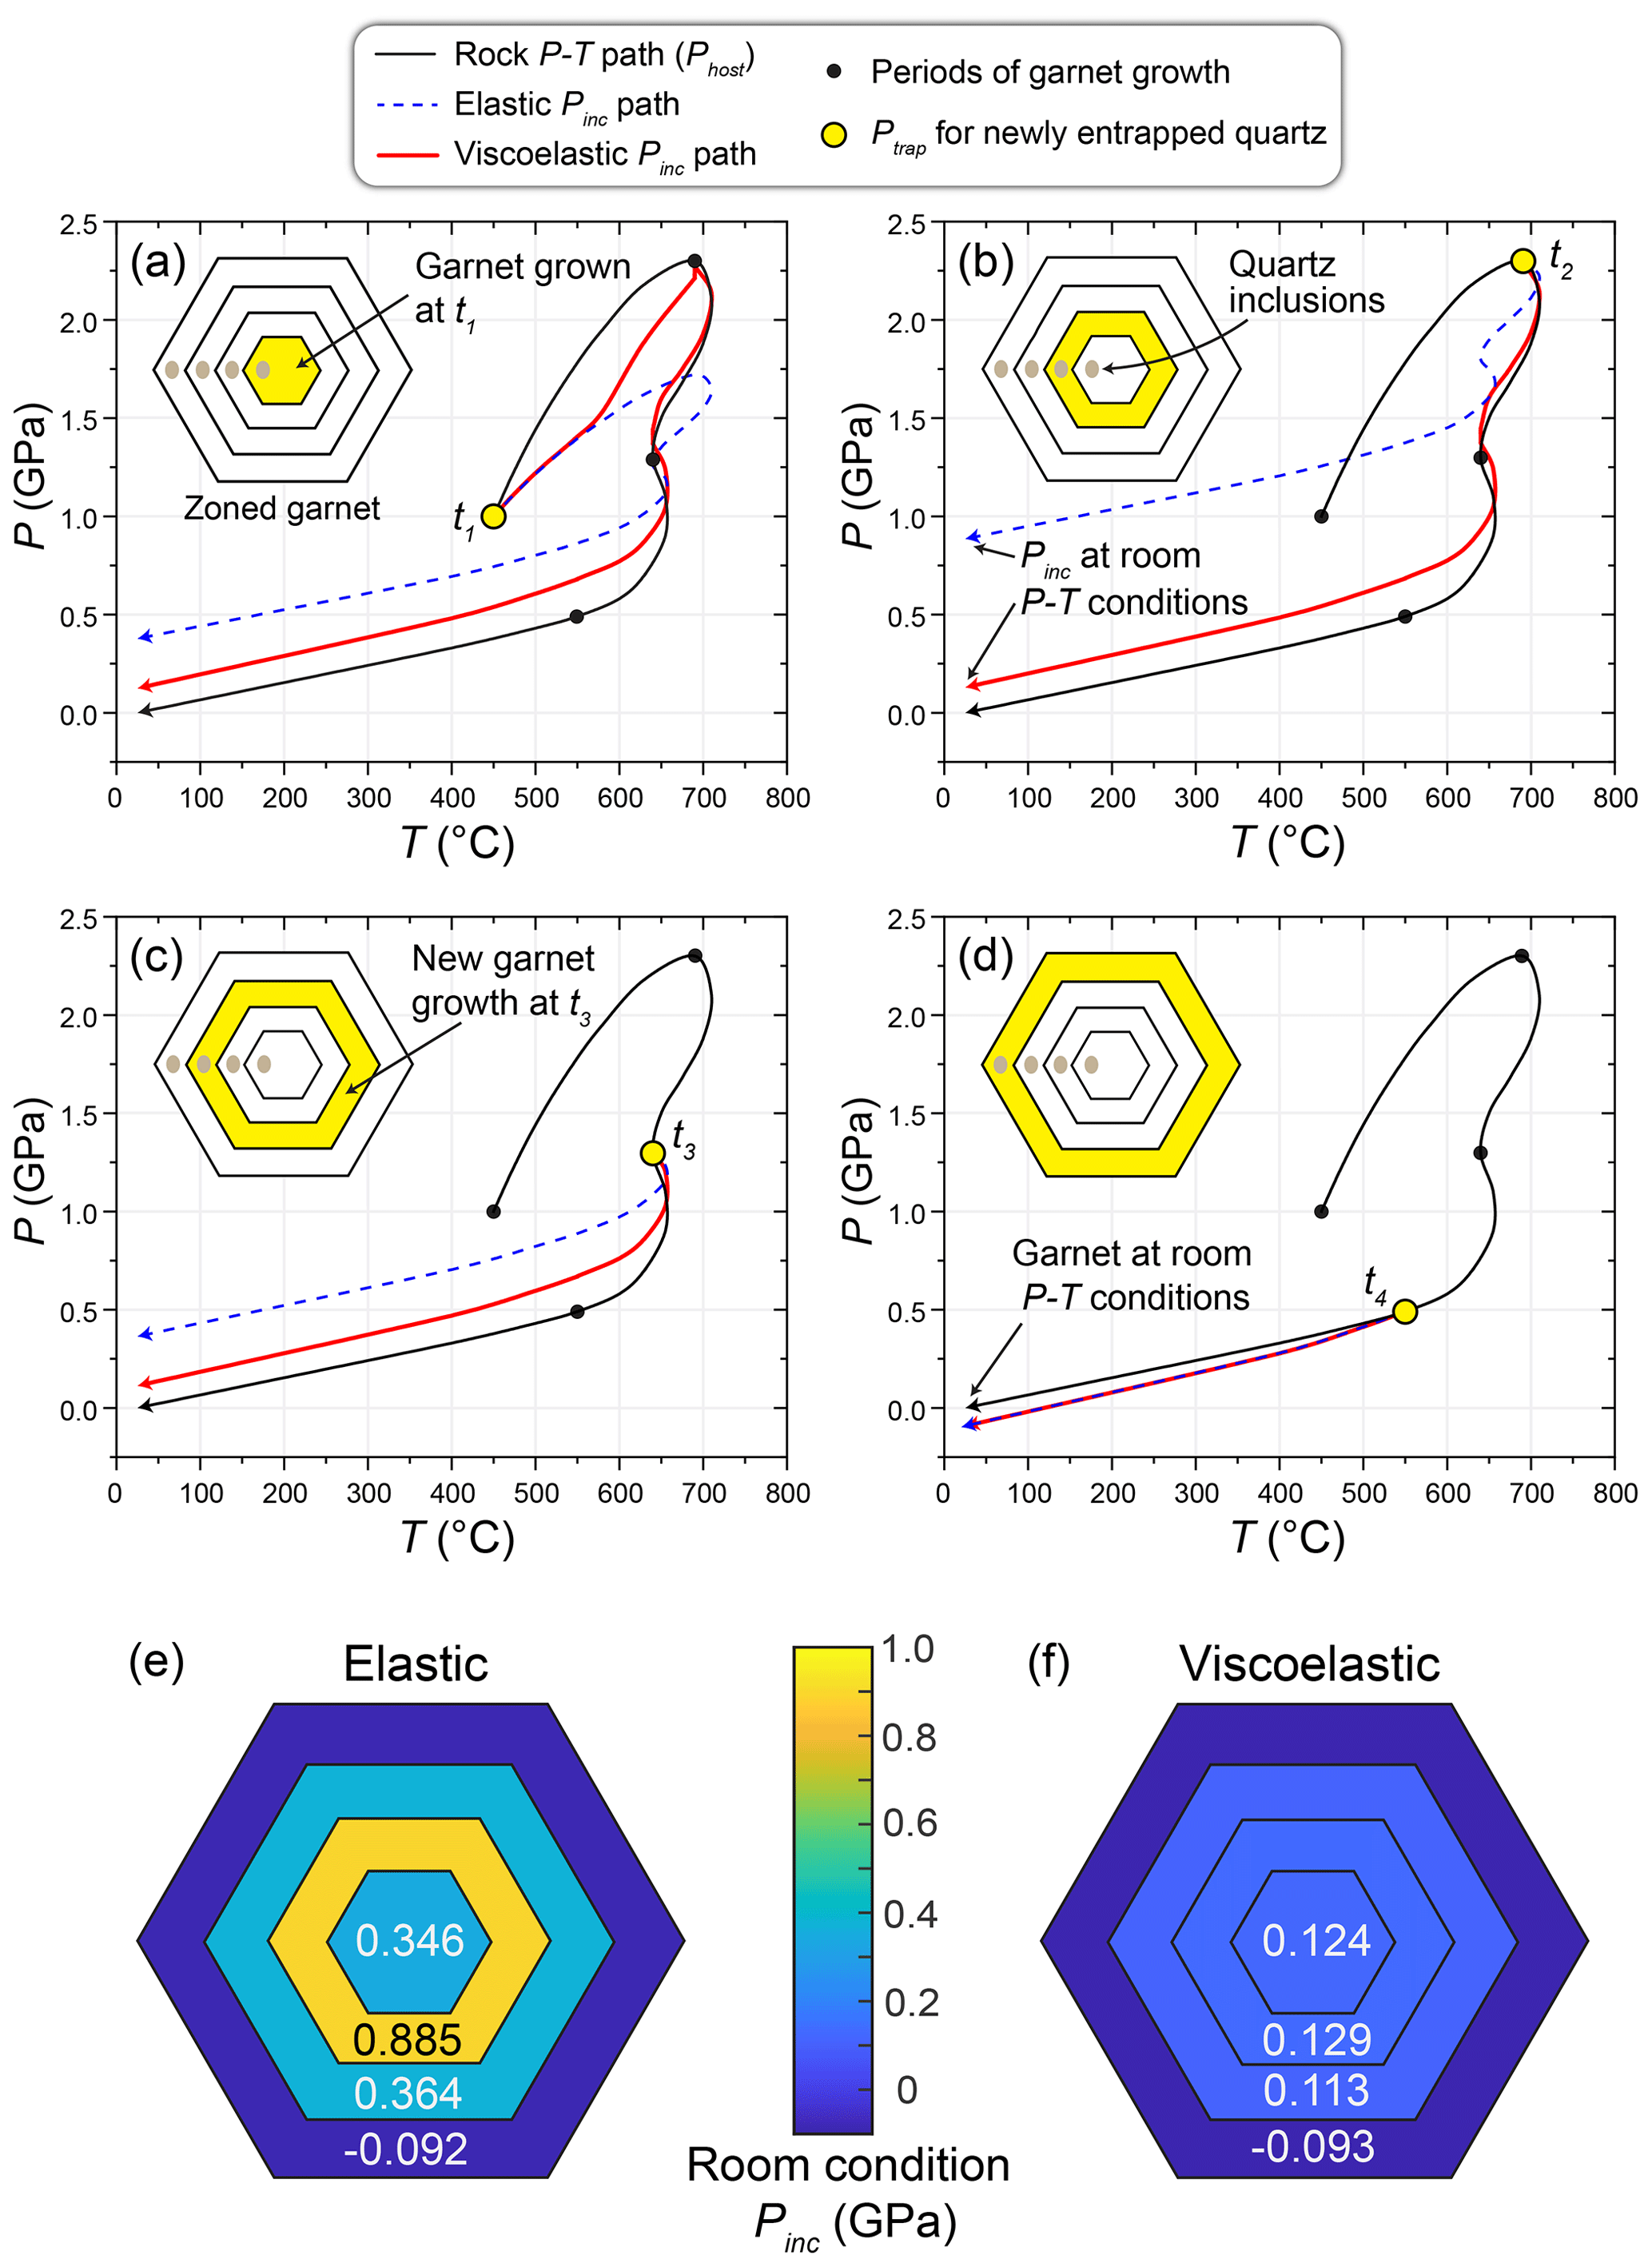
Figure 9(a–d) Pressures of quartz inclusions in garnet (Pinc) entrapped along the hypothetical P–T path in Fig. 1 and Table 5. The elastic Pinc path was calculated using EosFit-Pinc (Angel et al., 2017b), and the viscoelastic Pinc path was calculated using the viscoelastic model from Zhong et al. (2020). Insets highlight schematic growth zones of garnet formed during four episodes of garnet growth at P–T conditions in Fig. 1 and Table 5. Schematic zoned garnets showing room condition Pinc values that would develop from purely elastic (e) and viscoelastic (f) responses to changes in P–T conditions. See text for details.
Plastic deformation of the host garnet can partially to fully re-equilibrate Pinc values, thereby erasing QuiG-based evidence of the P–T path experienced by the inclusion–host system (Gilio et al., 2022). Along the 5 Myr prograde path from t1 (1.0 GPa, 450 °C) to t2 (2.3 GPa, 690 °C; Figs. 1 and 9; Table 5), plastic deformation would cause Pinc values to deviate significantly from the elastic response at ∼ 550 °C (Fig. 9a; Table 5) so that the Pinc values of the inclusion entrapped at t1 would change from 1.0 to 2.12 GPa. After dwelling at t2 for 5 Myr, plastic deformation would further change the same t1 inclusion Pinc to 2.275 GPa (Table 5; Fig. 9a). Along the retrograde path to t3 (1.3 GPa, 640 °C), an inclusion entrapped at t2 with a Pinc value of 2.3 GPa would change to 1.447 GPa (Table 5; Fig. 9a and b). After dwelling at t3 for 5 Myr, plastic deformation would further change the t2 inclusion Pinc to 1.374 GPa (Table 5; Fig. 9a and b). Continuing along the retrograde path from t3 to t4 (0.49 GPa, 550 °C) over 5 Myr, plastic deformation would cause previously reset quartz inclusions with Pinc values of ∼ 1.3 GPa to change to ∼ 0.68 GPa (Table 5; Fig. 9a–c). Dwelling at t4 for 5 Myr would further change the Pinc of previously entrapped inclusions by < 0.01 GPa (Table 5; Fig. 9a–c). Entrapment of quartz inclusions at t4 followed by exhumation over 5 Myr to room conditions would produce a garnet with respective quartz inclusion Pinc values in zones t1–t4 of 0.679, 0.683, 0.669, and –0.093 (Fig. 9d and f; Table 5). Considering observed distributions of Ptrap values in our simple experiments (Fig. 5), the reset Pinc values for zones t1–t3 would be essentially indistinguishable from one another despite significantly different entrapment conditions. Only inclusions entrapped at the lower P–T conditions at t4 would retain inclusion pressures that reflect the entrapment conditions (Fig. 9d).
Experimental results showed that quartz inclusions and almandine hosts primarily responded elastically to isothermal pressure changes. At Ptrap, Pinc values were the same as Phost. Changing pressure applied to garnet hosts during isothermal pressure adjustments and during experimental quenching to room conditions produced Pinc values significantly different than Phost because the garnet host shielded the quartz inclusions from external pressures applied to the garnet crystals. Some inclusions cracked, indicating inelastic behaviour, but most inclusions survived the rapid changes to pressure without cracking. A preponderance of uncracked quartz inclusions in single-stage experiments shows that elasticity primarily controlled changes to Pinc values that occur from quenching to room conditions. Pinc values measured for two-stage experiments re-equilibrated to give Pinc values between P1 and P2, indicating an apparent entrapment pressure between P1 and P2. This indicates that the inclusions were not completely equilibrated with the external pressure. Instead, the garnet host around each inclusion was mechanically re-equilibrated with the inclusion to the inclusion pressure, indicating a localised process of re-equilibration (Campomenosi et al., 2023b). The three-stage isothermal experiments (P3=P1) unequivocally demonstrate that the observed changes to inclusion pressures are reversible along vastly different P–T paths to restore the re-equilibrated Pinc values back to their original entrapment isomeke at Ptrap. We find it especially remarkable that it is possible to quench the stress states of the quartz inclusions and garnets to capture the elastic responses that occur along complex P–T paths.
Beyond the permanent deformation that fractured a minor fraction of garnet hosts, there is no evidence for rate-dependent plastic deformation at the temperatures and timescales of our experiments. More evidence for plastic deformation may be gathered with transmission electron microscopy imaging of the quartz inclusion and surrounding garnet host. For laboratory-based experiments, resetting by rate-dependent plastic deformation must occur on significantly longer timescales than obtainable at 700 °C, at higher temperatures, and/or with greater ΔP. We showed that re-equilibration can change Pinc values so that they do not reflect the original Ptrap conditions. Re-equilibration may significantly affect Pinc values in rapidly transported rocks with multi-stage storage histories (e.g. kimberlites, maars). Viscoelastic modelling demonstrates that viscoelasticity can change QuiG Pinc values in rocks that undergo protracted metamorphism. Accurately applying QuiG to rocks with multi-stage P–T histories requires additional thermobarometric and geochronological constraints to obtain ΔP and durations of each metamorphic condition. Unlike chemically zoned crystals in which initially sharp boundaries between chemical zones relax by diffusion over time and thus leave a record of the temperature–time path (Fig. 1), the entireties of quartz inclusions in garnet will re-equilibrate to new P–T conditions and leave no record of the magnitude of pressure changes that occurred (Fig. 9f). For this reason, quartz inclusions in garnets may give apparent Ptrap values that underestimate the maximum pressures imposed on the rocks (Alvaro et al., 2019; Angel et al., 2015; Moulas et al., 2023; Zhang, 1998; Zhong et al., 2020). Based on our re-equilibration experiments and viscoelastic calculations, calculated reaction overstepping of the garnet isograd based on QuiG results (e.g. Spear et al., 2014; Castro and Spear, 2017; Spear and Pattison, 2017; Moulas et al., 2020; Spear and Wolfe, 2020; Zhong et al., 2020) may underestimate the total amount of overstepping required to nucleate garnet in many rocks.
Our multi-stage experiments were purposely simple and limited. Future research efforts must focus on exploring larger ranges of experimental conditions to examine re-equilibration processes that affect QuiG Pinc values. Exploring larger differences between P1 and P2 may further reveal elastic limits of the QuiG host–inclusion system. In this study, we explored isothermal experiments at 700 and 800 °C at several different pressures with Ptrap in the α-quartz stability field, but clearly a wider range of temperature conditions would permit us to evaluate potential temperature limits at which QuiG may re-equilibrate. Also, higher-temperature experiments may produce detectable resetting by viscous creep. Results from isothermal and isobaric experiments may guide research on more complicated P–T paths that rocks encounter during exhumation. Additional experimentation may also improve our understanding of changes to Pinc that occur across the quartz α–β phase transition (Gonzalez et al., 2024) and reveal conditions required to preserve SiO2 polymorphs (Morana et al., 2023; Van der Molen and Van Roermund, 1986) across the quartz–coesite phase boundary.
Raman data (Δω) for individual inclusions for each experiment are available in the Supplement.
The supplement related to this article is available online at: https://doi.org/10.5194/ejm-36-581-2024-supplement.
Both authors conducted experiments and analyses. BAP conducted all experiments except QuiG-35, QuiG-36, and Alm-1, which were performed by JBT. Experiment analyses were completed by BAP. Experimental and analytical laboratories were designed, fabricated, and maintained by JBT. BAP and JBT wrote and revised the manuscript.
The contact author has declared that neither of the authors has any competing interests.
Publisher’s note: Copernicus Publications remains neutral with regard to jurisdictional claims made in the text, published maps, institutional affiliations, or any other geographical representation in this paper. While Copernicus Publications makes every effort to include appropriate place names, the final responsibility lies with the authors.
This article is part of the special issue “Probing the Earth: Melt and solid inclusions as probes to understand nature”. It is not associated with a conference.
Discussions with Ross Angel, Matteo Alvaro, Joseph Gonzalez, Karolina Kośmińska, and Frank Spear helped guide our research. Support from Xin Zhong helped provide and facilitate our use of his QuiG viscoelastic model code. Reviews of an earlier version of this paper by Ross Angel, Evangelos Moulas, and Peter Tropper greatly improved the paper.
This research was supported by the National Science Foundation Earth Sciences Division (grant no. EAR2147528) and Syracuse University's CUSE grant program.
This paper was edited by Silvio Ferrero and reviewed by Ross Angel and one anonymous referee.
Adams, H. G., Cohen, L. H., and Rosenfeld, J. L.: Solid inclusion piezothermometry I: Comparison dilatometry, Am. Mineral., 60, 574–583, 1975.
Alvaro, M., Mazzucchelli, M. L., Angel, R. J., Murri, M., Campomenosi, N., Scambelluri, M., Nestola, F., Korsakov, A., Tomilenko, A. A., Marone, F., and Morana, M.: Fossil subduction recorded by quartz from the coesite stability field, Geology, 48, 24–28, https://doi.org/10.1130/G46617.1, 2019.
Angel, R. J., Mazzucchelli, M. L., Alvaro, M., Nimis, P., and Nestola, F.: Geobarometry from host-inclusion systems: The role of elastic relaxation, Am. Mineral., 99, 2146–2149, https://doi.org/10.2138/am-2014-5047, 2014.
Angel, R. J., Nimis, P., Mazzucchelli, M. L., Alvaro, M., and Nestola, F.: How large are departures from lithostatic pressure? Constraints from host–inclusion elasticity, J. Metamorph. Geol., 33, 801–813, https://doi.org/10.1111/jmg.12138, 2015.
Angel, R. J., Alvaro, M., Miletich, R., and Nestola, F.: A simple and generalised P-T-V EoS for continuous phase transitions, implemented in EosFit and applied to quartz, Contrib. Mineral. Petr., 172, 1–15, https://doi.org/10.1007/s00410-017-1349-x, 2017a.
Angel, R. J., Mazzucchelli, M. L., Alvaro, M., and Nestola, F.: EosFit-Pinc: A simple GUI for host-inclusion elastic thermobarometry, Am. Mineral., 102, 1957–1960, https://doi.org/10.2138/am-2017-6190, 2017b.
Angel, R. J., Murri, M., Mihailova, B., and Alvaro, M.: Stress, strain and Raman shifts, Z. Krist.-Cryst. Mater., 234, 129–140, https://doi.org/10.1515/zkri-2018-2112, 2019.
Angel, R. J., Gilio, M., Mazzucchelli, M., and Alvaro, M.: Garnet EoS: a critical review and synthesis, Contrib. Mineral. Petr., 177, 54, https://doi.org/10.1007/s00410-022-01918-5, 2022.
Angel, R. J., Alvaro, M., and Ferrero, S.: A brief history of solid inclusion piezobarometry, Eur. J. Mineral., 36, 411–415, https://doi.org/10.5194/ejm-36-411-2024, 2024.
Bonazzi, M., Tumiati, S., Thomas, J. B., Angel, R. J., and Alvaro, M.: Assessment of the reliability of elastic geobarometry with quartz inclusions, Lithos, 350–351, 105201, https://doi.org/10.1016/j.lithos.2019.105201, 2019.
Bose, K. and Ganguly, J.: Quartz-coesite transition revisited: Reversed experimental determination at 500–1200 °C and retrieved thermochemical properties, Am. Mineral., 80, 231–238, https://doi.org/10.2138/am-1995-3-404, 1995.
Boyd, F. R. and England, J. L.: Apparatus for phase-equilibrium measurements at pressures up to 50 kilobars and temperatures up to 1750 °C, J. Geophys. Res., 65, 741–748, https://doi.org/10.1029/JZ065i002p00741, 1960.
Campomenosi, N., Mazzucchelli, M. L., Mihailova, B., Scambelluri, M., Angel, R. J., Nestola, F., Reali, A., and Alvaro, M.: How geometry and anisotropy affect residual strain in host-inclusion systems: Coupling experimental and numerical approaches, Am. Mineral., 103, 2032–2035, https://doi.org/10.2138/am-2018-6700CCBY, 2018.
Campomenosi, N., Angel, R. J., Alvaro, M., and Mihailova, B.: Quartz-in-garnet (QuiG) under pressure: insights from in situ Raman spectroscopy, Contrib. Mineral. Petr., 178, 44, https://doi.org/10.1007/s00410-023-02026-8, 2023a.
Campomenosi, N., Angel, R. J., Alvaro, M., and Mihailova, B.: Resetting of zircon inclusions in garnet: Implications for elastic thermobarometry, Geology, 51, 23–27, https://doi.org/10.1130/G50431.1, 2023b.
Castro, A. E. and Spear, F. S.: Reaction overstepping and re-evaluation of peak P-T conditions of the blueschist unit Sifnos, Greece: implications for the Cyclades subduction zone, Int. Geol. Rev., 59, 548–562, https://doi.org/10.1080/00206814.2016.1200499, 2017.
Dabrowski, M., Powell, R., and Podladchikov, Y.: Viscous relaxation of grain-scale pressure variations, J. Metamorph. Geol., 33, 859–868, https://doi.org/10.1111/jmg.12142, 2015.
Enami, M., Nishiyama, T., and Mouri, T.: Laser Raman microspectrometry of metamorphic quartz: A simple method for comparison of metamorphic pressures, Am. Mineral., 92, 1303–1315, https://doi.org/10.2138/am.2007.2438, 2007.
Essene, E. J.: The current status of thermobarometry in metamorphic rocks, Geol. Soc. Lond. Spec. Publ., 43, 1–44, https://doi.org/10.1144/GSL.SP.1989.043.01.02, 1989.
Ferrero, S. and Angel, R. J.: Micropetrology: Are Inclusions Grains of Truth?, J. Petrol., 59, 1671–1700, https://doi.org/10.1093/petrology/egy075, 2018.
Ferrero, S., Wannhoff, I., Laurent, O., Yakymchuk, C., Darling, R., Wunder, B., Borghini, A., and O'Brien, P. J.: Embryos of TTGs in Gore Mountain garnet megacrysts from water-fluxed melting of the lower crust, Earth Planet. Sc. Lett., 569, 117058, https://doi.org/10.1016/j.epsl.2021.117058, 2021.
Gilio, M., Scambelluri, M., Angel, R. J., and Alvaro, M.: The contribution of elastic geothermobarometry to the debate on HP versus UHP metamorphism, J. Metamorph. Geol., 40, 229–242, https://doi.org/10.1111/jmg.12625, 2022.
Gonzalez, J. P., Thomas, J. B., Baldwin, S. L., and Alvaro, M.: Quartz-in-garnet and Ti-in-quartz thermobarometry: Methodology and first application to a quartzofeldspathic gneiss from eastern Papua New Guinea, J. Metamorph. Geol., 37, 1193–1208, https://doi.org/10.1111/jmg.12508, 2019.
Gonzalez, J. P., Mazzucchelli, M. L., Angel, R. J., and Alvaro, M.: Elastic Geobarometry for Anisotropic Inclusions in Anisotropic Host Minerals: Quartz-in-Zircon, J. Geophys. Res.-Sol. Ea., 126, e2021JB022080, https://doi.org/10.1029/2021JB022080, 2021.
Gonzalez, J. P., Thomas, J. B., Mazzucchelli, M. L., Angel, R. J., and Alvaro, M.: First evaluation of stiff-in-soft host–inclusion systems: experimental synthesis of zircon inclusions in quartz crystals, Contrib. Mineral. Petr., 179, 13, https://doi.org/10.1007/s00410-023-02081-1, 2024.
Holland, T. J. B. and Powell, R.: An improved and extended internally consistent thermodynamic dataset for phases of petrological interest, involving a new equation of state for solids, J. Metamorph. Geol., 29, 333–383, https://doi.org/10.1111/j.1525-1314.2010.00923.x, 2011.
Jakobsson, S.: Oxygen fugacity control in piston-cylinder experiments, Contrib. Mineral. Petr., 164, 397–406, https://doi.org/10.1007/s00410-012-0743-7, 2012.
Kohn, M. J.: “Thermoba-Raman-try”: Calibration of spectroscopic barometers and thermometers for mineral inclusions, Earth Planet. Sc. Lett., 388, 187–196, https://doi.org/10.1016/j.epsl.2013.11.054, 2014.
Kohn, M. J., Mazzucchelli, M. L., and Alvaro, M.: Elastic Thermobarometry, Ann. Rev. Earth Pl. Sc., 51, 331–366, https://doi.org/10.1146/annurev-earth-031621-112720, 2023.
Mazzucchelli, M. L., Burnley, P., Angel, R. J., Morganti, S., Domeneghetti, M. C., Nestola, F., and Alvaro, M.: Elastic geothermobarometry: Corrections for the geometry of the host-inclusion system, Geology, 46, 231–234, https://doi.org/10.1130/G39807.1, 2018.
Mazzucchelli, M. L., Angel, R. J., and Alvaro, M.: EntraPT: An online platform for elastic geothermobarometry, Am. Mineral., 106, 830–837, https://doi.org/10.2138/am-2021-7693CCBYNCND, 2021.
McDade, P., Wood, B. J., Van Westrenen, W., Brooker, R., Gudmundsson, G., Soulard, H., Najorka, J., and Blundy, J.: Pressure corrections for a selection of piston-cylinder cell assemblies, Mineral. Mag., 66, 1021–1028, https://doi.org/10.1180/0026461026660074, 2002.
Milani, S., Nestola, F., Alvaro, M., Pasqual, D., Mazzucchelli, M. L., Domeneghetti, M. C., and Geiger, C. A.: Diamond–garnet geobarometry: The role of garnet compressibility and expansivity, Lithos, 227, 140–147, https://doi.org/10.1016/j.lithos.2015.03.017, 2015.
Morana, M., Angel, R. J., Alvaro, M., and Mihailova, B.: High-temperature behavior of quartz-in-garnet system revealed by in situ Raman spectroscopy, Phys. Chem. Mineral., 50, 21, https://doi.org/10.1007/s00269-023-01246-5, 2023.
Moulas, E., Kostopoulos, D., Podladchikov, Y., Chatzitheodoridis, E., Schenker, F. L., Zingerman, K. M., Pomonis, P., and Tajčmanová, L.: Calculating pressure with elastic geobarometry: A comparison of different elastic solutions with application to a calc-silicate gneiss from the Rhodope Metamorphic Province, Lithos, 378–379, 105803, https://doi.org/10.1016/j.lithos.2020.105803, 2020.
Moulas, E., Podladchikov, Y., Zingerman, K., Vershinin, A., and Levin, V.: Large-strain Elastic and Elasto-Plastic Formulations for Host-Inclusion Systems and Their Applications in Thermobarometry and Geodynamics, Am. J. Sci., 323, 2, https://doi.org/10.2475/001c.68195, 2023.
Osborne, Z. R., Thomas, J. B., Nachlas, W. O., Baldwin, S. L., Holycross, M. E., Spear, F. S., and Watson, E. B.: An experimentally calibrated thermobarometric solubility model for titanium in coesite (TitaniC), Contrib. Mineral. Petr., 174, 1–13, https://doi.org/10.1007/s00410-019-1575-5, 2019.
Osborne, Z. R., Thomas, J. B., Nachlas, W. O., Angel, R. J., Hoff, C. M., and Watson, E. B.: TitaniQ revisited: expanded and improved Ti-in-quartz solubility model for thermobarometry, Contrib. Mineral. Petr., 177, 31, https://doi.org/10.1007/s00410-022-01896-8, 2022.
Rosenfeld, J. L.: Stress effects around quartz inclusions in almandine and the piezothermometry of coexisting aluminum silicates, Am. J. Sci., 267, 317–351, https://doi.org/10.2475/ajs.267.3.317, 1969.
Rosenfeld, J. L. and Chase, A. B.: Pressure and temperature of crystallization from elastic effects around solid inclusions in minerals?, Am. J. Sci., 259, 519–541, https://doi.org/10.2475/ajs.259.7.519, 1961.
Sorby, H. C. and Butler, P. J.: On the structure of rubies, sapphires, diamonds, and some other minerals, Proc. R. Soc. Lond., 17, 291–302, https://doi.org/10.1098/rspl.1868.0050, 1868.
Spear, F. S. and Pattison, D. R. M.: The implications of overstepping for metamorphic assemblage diagrams (MADs), Chem. Geol., 457, 38–46, https://doi.org/10.1016/j.chemgeo.2017.03.011, 2017.
Spear, F. S. and Peacock, S. M.: Metamorphic pressure-temperature-time paths, American Geophysical Union, ISBN: 0875907040, 1989.
Spear, F. S. and Wolfe, O. M.: Revaluation of “equilibrium” P–T paths from zoned garnet in light of quartz inclusion in garnet (QuiG) barometry, Lithos, 372–373, 105650, https://doi.org/10.1016/j.lithos.2020.105650, 2020.
Spear, F. S., Kohn, M. J., and Cheney, J. T.: P-T paths from anatectic pelites, Contrib. Mineral. Petr., 134, 17–32, https://doi.org/10.1007/s004100050466, 1999.
Spear, F. S., Thomas, J. B., and Hallett, B. W.: Overstepping the garnet isograd: a comparison of QuiG barometry and thermodynamic modeling, Contrib. Mineral. Petr., 168, 1059, https://doi.org/10.1007/s00410-014-1059-6, 2014.
Thomas, J. B. and Spear, F. S.: Experimental study of quartz inclusions in garnet at pressures up to 3.0 GPa: evaluating validity of the quartz-in-garnet inclusion elastic thermobarometer, Contrib. Mineral. Petr., 173, 1–14, https://doi.org/10.1007/s00410-018-1469-y, 2018.
Trail, D., Bruce Watson, E., and Tailby, N. D.: Ce and Eu anomalies in zircon as proxies for the oxidation state of magmas, Geochim. Cosmochim. Ac., 97, 70–87, https://doi.org/10.1016/j.gca.2012.08.032, 2012.
Van der Molen, I. and Van Roermund, H. L. M.: The pressure path of solid inclusions in minerals: the retention of coesite inclusions during uplift, Lithos, 19, 317–324, https://doi.org/10.1016/0024-4937(86)90030-7, 1986.
Wang, J., Mao, Z., Jiang, F., and Duffy, T. S.: Elasticity of single-crystal quartz to 10 GPa, Phys. Chem. Mineral., 42, 203–212, https://doi.org/10.1007/s00269-014-0711-z, 2015.
Wang, Z. and Ji, S.: Deformation of silicate garnets: Brittle-ductile transition and its geological implications, Can. Mineral., 37, 525–541, 1999.
Watson, E. B., Wark, D. A., Price, J. D., and Van Orman, J. A.: Mapping the thermal structure of solid-media pressure assemblies, Contrib. Mineral. Petr., 142, 640–652, https://doi.org/10.1007/s00410-001-0327-4, 2002.
Zhang, Y.: Mechanical and phase equilibria in inclusion–host systems, Earth Planet. Sc. Lett., 157, 209–222, https://doi.org/10.1016/S0012-821X(98)00036-3, 1998.
Zhong, X., Moulas, E., and Tajčmanová, L.: Post-entrapment modification of residual inclusion pressure and its implications for Raman elastic thermobarometry, Solid Earth, 11, 223–240, https://doi.org/10.5194/se-11-223-2020, 2020.
Zhong, X., Dabrowski, M., and Jamtveit, B.: Analytical solution for residual stress and strain preserved in anisotropic inclusion entrapped in an isotropic host, Solid Earth, 12, 817–833, https://doi.org/10.5194/se-12-817-2021, 2021.