the Creative Commons Attribution 4.0 License.
the Creative Commons Attribution 4.0 License.
 | 29 Jan 2024
Synthesis of jadarite in the Li2O–Na2O–B2O3–SiO2–NaCl–H2O system: FTIR, Raman, and Li and B K-edge XANES characterizations and theoretical calculations
Xiu-Zhen Xie
Huiyao Kuang
Eli Wiens
Reza Deevsalar
Ayetullah Tunc
Sarah Purdy
Lucia Zuin
John S. Tse
Jin-Xiao Mi
Yuanming Pan
The occurrence of jadarite (LiNaSiB3O7OH) as a major ore mineral in the world-class lithium–boron deposit of the Miocene Jadar lacustrine basin (western Serbia) raises interesting questions about its formation conditions and potential associations for lithium mineralization in other sedimentary basins. This contribution reports on the first successful synthesis of jadarite in the Li2O–Na2O–B2O3–SiO2–NaCl–H2O system at temperatures from 180 to 230 ∘C and pH values from 6 to 12. Synthetic jadarite has been characterized by powder X-ray diffraction (PXRD), Fourier transform infrared (FTIR) spectroscopy, laser Raman spectroscopy, and synchrotron Li and B K-edge X-ray absorption near-edge structure (XANES). First-principles theoretical calculations reproduce the measured FTIR and Raman spectra and allow definitive assignments of vibration modes. Similarly, the measured Li and B K-edge XANES spectra are reasonably reproduced by first-principles theoretical calculations. Our synthesis results, together with its association with searlesite in the Jadar basin, suggest jadarite forms in deep sediments derived from Li-rich alkaline brines under high-temperature diagenetic conditions.
- Article
(4407 KB) - Full-text XML
-
Supplement
(2155 KB) - BibTeX
- EndNote


Jadarite (LiNaSiB3O7OH) was discovered in Miocene carbonate–clastic sedimentary rocks of the Jadar lacustrine basin in western Serbia in 2004, with its formal definition as a new mineral in 2007 (Stanley et al., 2007; Whitfield et al., 2007; Borojević Šoštarić and Brenko, 2023). Jadarite's initial claim to fame was its compositional similarity to the fictional substance “kryptonite” featured in “Superman” movies and TV shows. To date, the Jadar basin remains the only known occurrence of this mineral (Stanley et al., 2007; Borojević Šoštarić and Brenko, 2023). The Jadar deposit, also containing abundant searlesite (NaBSi2O5(OH)2), has the measured ore of 16.6 Mt grading 1.81 wt % Li2O and 13.4 wt % B2O3, as well as substantially larger indicated and inferred ores (Borojević Šoštarić and Brenko, 2023), representing one of the largest lithium resources in the world meeting the ever-increasing demand of this critical mineral for its applications in green technologies such as rechargeable Li batteries (Global Battery Alliance, 2019; U.S. Geological Survey, 2022).
This enormous Li–B deposit in the Jadar basin raises interesting questions about the condition and process for the formation of jadarite and the possible occurrences of this mineral in other lacustrine basins, with important implications for the discovery and sustainable development of similar Li–B deposits. Another salient feature of jadarite is its main chemical constituents of several light elements such as H, Li, and B, which are generally not detectable by conventional analytical techniques such as X-ray fluorescence (XRF) spectrometry and electron microprobe analysis (EMPA) and, therefore, may be overlooked during routine analyses. Therefore, the development and application of other analytical techniques such as laser Raman spectroscopy are also important for the detection of jadarite in the quest for the sustainable development of the critical Li resource.
The crystal structure of jadarite consists of a tetrahedral layer of corner-sharing LiO4, SiO4, and two BO4 groups parallel to (010), which is decorated with triangular BO3 groups (Fig. 1; Whitfield et al., 2007). One of the two crystallographically distinct BO4 groups containing a long bond of 1.602 Å (Whitfield et al., 2007) deviates significantly from the tetrahedral configuration and is better described as an OBO3 pyramid (Fleet and Liu, 2001; Zhou et al., 2016). The Na ion occurs at a distorted octahedral site between the tetrahedral layers, while the H atom is located at the apex of the BO3 group and is involved in a weak hydrogen bond between the tetrahedral layers (Whitfield et al., 2007). Comboni et al. (2022) performed an in situ single-crystal and powder synchrotron X-ray diffraction study of jadarite under a hydrostatic pressure of up to 20 GPa and reported a first-order, iso-symmetric, reconstructive phase transition with a volume reduction of ∼ 3 % between 16.57(5) and 17.04(5) GPa.

Figure 1The crystal structure of jadarite from Whitfield et al. (2007; Na atoms are large yellow balls, Li medium light green balls, B small green balls, Si blue balls, O red balls, and H small pink balls).
This contribution reports on the results of our hydrothermal synthesis of jadarite in the Li2O–Na2O–B2O3–SiO2–NaCl–H2O system under sedimentary–diagenetic conditions (temperatures of 100–230 ∘C and pH = 4–12). Synthetic jadarite was then characterized by a combination of analytical techniques from powder X-ray diffraction (PXRD) analysis to Fourier transform infrared (FTIR) spectroscopy, laser Raman spectroscopy, and synchrotron Li and B K-edge X-ray absorption near-edge structure (XANES) spectroscopy. These new data of synthetic jadarite are then compared with those available for its natural counterpart (e.g. PXRD and FTIR; Stanley et al., 2007; Comboni et al., 2022). In addition, first-principles theoretical calculations have been made to add to the interpretation of these experimental data (i.e. assignments of FTIR and Raman vibrational peaks, as well as the measured Li and B K-edge XANES features). Moreover, the new data of jadarite synthesis are discussed in the context of its formation conditions and implications for the exploration of Li–B deposits in sedimentary basins.
2.1 Hydrothermal synthesis
The starting materials used in this study include lithium chloride monohydrate (LiCl ⋅ H2O, analytical reagent or AR, Sigma-Aldrich), sodium borate (Na2B4O7 ⋅ 10H2O, AR, Sigma-Aldrich), and fumed silica (SiO2, 99.8 wt %; Evonik Degussa Co.). All starting materials were used without further purification. All synthesis experiments started with a mixture of SiO2 (10 mmol, 0.601 g), LiCl ⋅ H2O (10 mmol, 0.604 g), and Na2B4O7 ⋅ 10H2O (7.5 mmol, 2.860 g). This mixture was added into a beaker with 12 mL of H2O by vigorous stirring to produce a slurry with the Li : Na : Si : B molar ratio of 2 : 3 : 2 : 6. The measured pH value of this slurry was ∼ 8. In order to evaluate the effects of pH, the slurry was adjusted to different pH values of 4, 6, 10, 12, and 14 by adding sodium hydroxide (NaOH) or hydrochloric acid (HCl). The pH-adjusted slurries were then transferred into 25 mL Teflon-lined stainless-steel autoclaves. The autoclaves were heated to and kept at temperatures (T) from 100 to 230 ∘C for durations from 3 to 8 d. The solid products from these hydrothermal experiments were centrifuged and washed three times with deionized water and were dried at 75 ∘C for 24 h.
2.2 Characterization by PXRD, FTIR, and Raman
All solid products from the synthesis experiments were first characterized by PXRD on a Bruker D8 Advance powder X-ray diffractometer (Bruker Corporation, Germany) with CuKα (λ=1.54178 Å) radiation, operated at 40 kV and 40 mA. All PXRD patterns were measured at room temperature in the 2θ range from 10 to 90∘, with a uniform step size of 0.016∘ (2θ) at a constant scan rate of 0.1 s per step.
One synthetic jadarite (T=230 ∘C, pH = 8, and 3 d) was selected on the basis of its purity (Fig. 2) and was used for all subsequent FTIR, Raman, and synchrotron Li and B K-edge XANES analyses. The FTIR spectrum was measured at room temperature using an IlluminatIR II (Smiths Detection) attached to the Raman microscope, with a 36× attenuated total reflectance (ATR) objective. The FTIR data were collected in the 650–4000 cm−1 range, with a spectral resolution of 4 cm−1. The synthetic jadarite and a natural sample from the Jadar basin, both in the form of powder aggregates, were investigated by micro-Raman spectroscopy, using a Renishaw InVia Reflex Raman microscope with a 785 nm diode laser (Renishaw Inc.) and a 1200 L mm−1 grating. A Leica 20× and a Leica 50× long working distance objective were used for the synthetic and natural samples, respectively, with a laser power of approximately 141 and 95 mW at the sample.
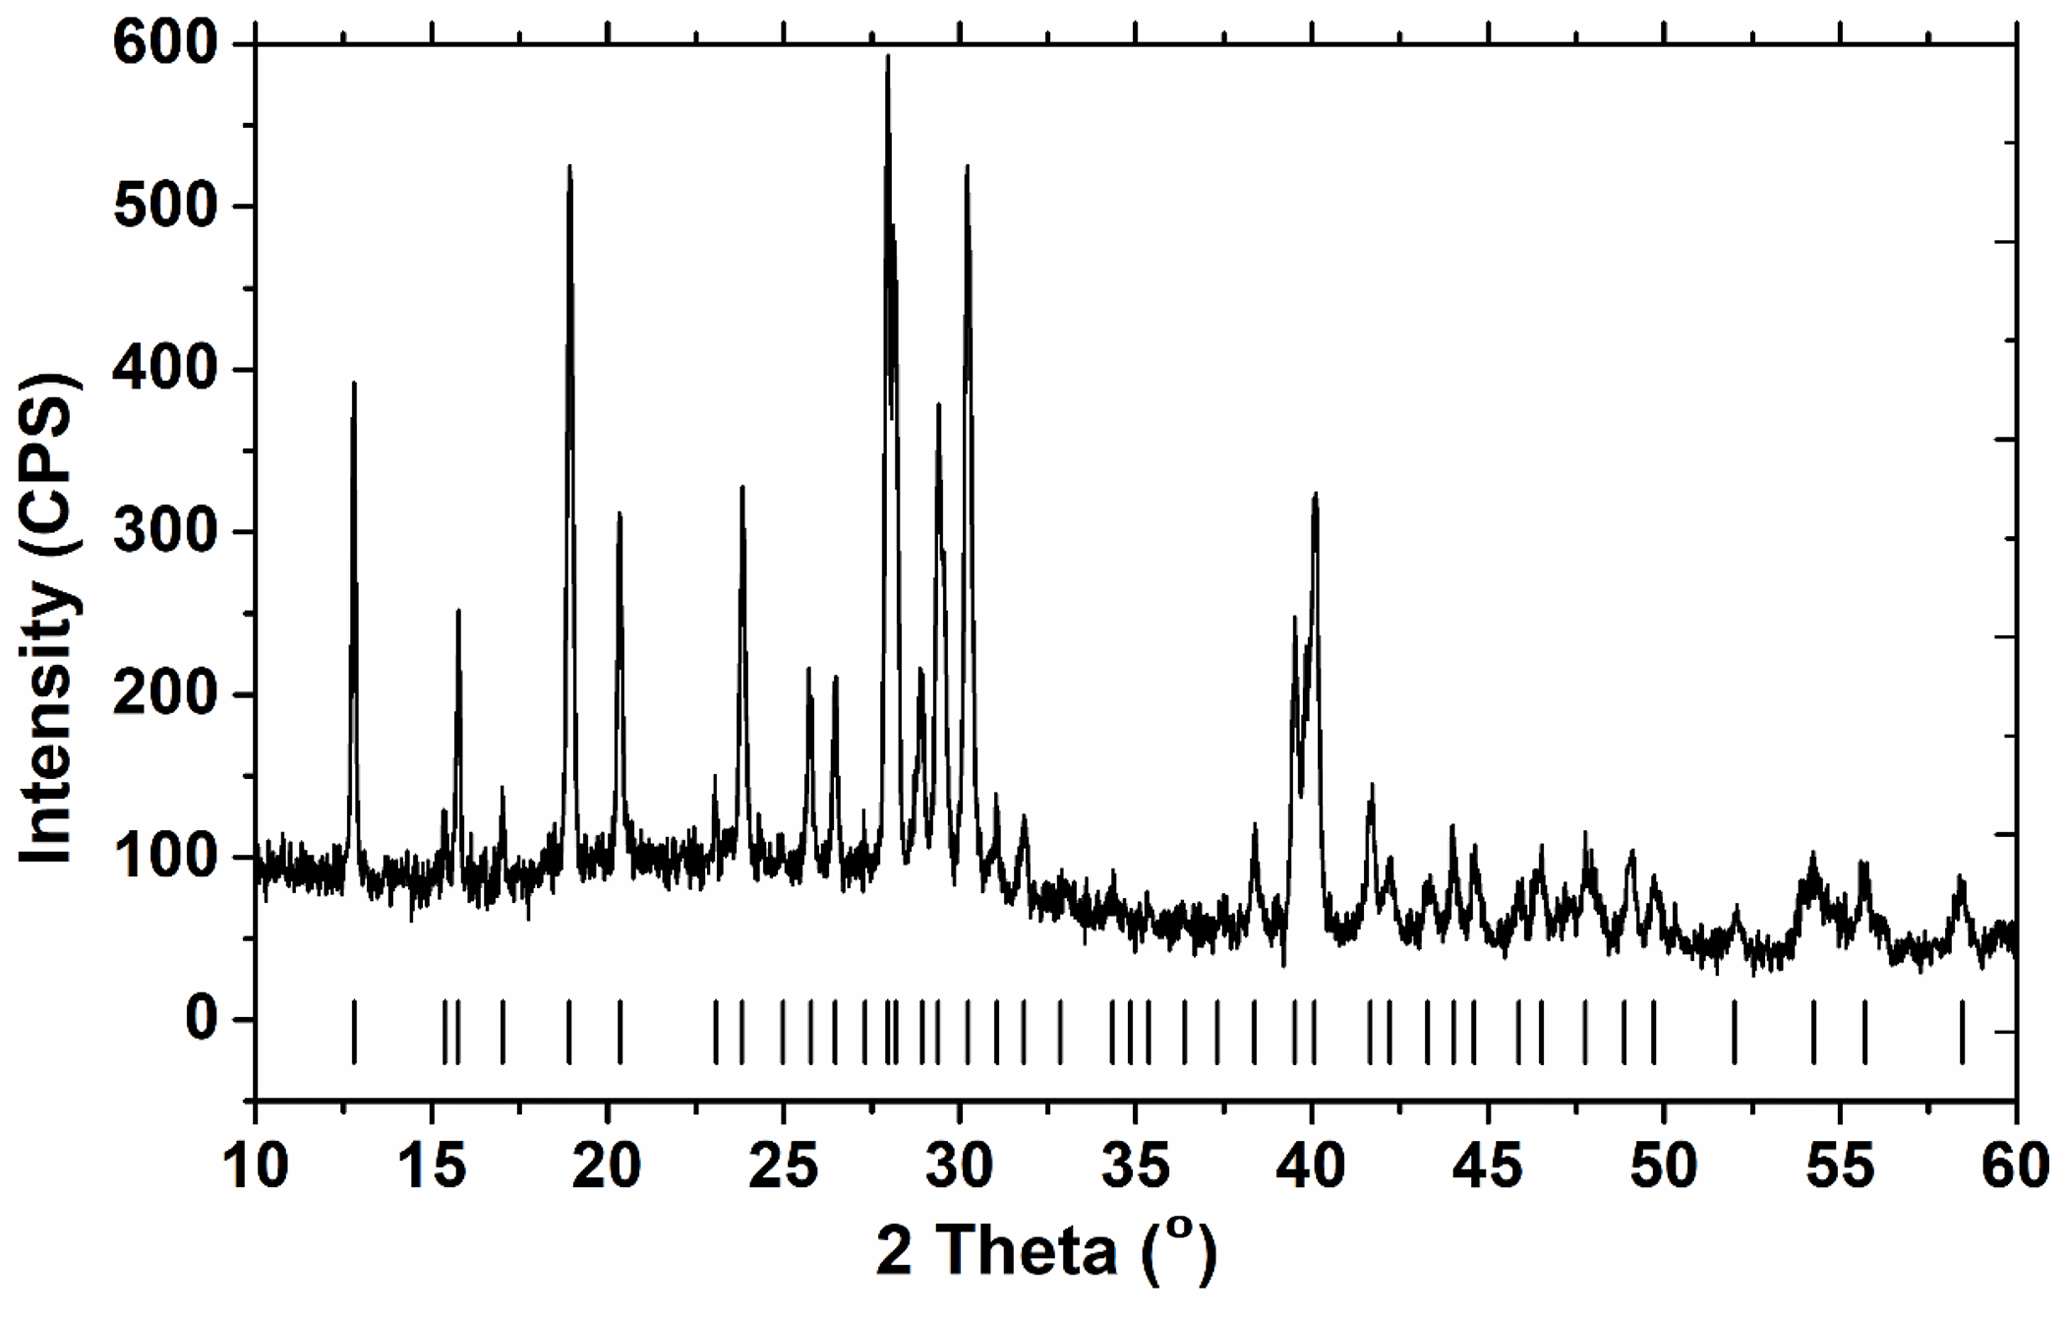
Figure 2Powder X-ray diffraction pattern of synthetic jadarite formed at T = 230 ∘C and pH = 8 for 3 d in comparison with the calculated Bragg positions indicated by vertical bars. CPS is counts per second.
2.3 Synchrotron Li and B K-edge XANES
A total of 10 samples, including natural and synthetic Jadarite, as well as eight boron and lithium model compounds, were used for B and Li K-edge XANES measurement at the variable-line-spacing plane-grating monochromator (VLS-PGM) beamline (Hu et al., 2007) at the Canadian Light Source. Four lithium model compounds (LiF, Li2CO3, Li2B4O7, and Li2MoO2) are analytical-grade chemicals (>99 %), while four boron model compounds are colemanite (Ca2B6O11 ⋅ 5H2O), howlite (Ca2B5SiO9(OH)5), vitreous boric oxide (v-B2O3; AR, Sigma Aldrich), and borax (Na2[B4O5(OH)4] ⋅ 8H2O). The samples of colemanite, howlite, and borax from the University of Saskatchewan reference mineral collection had been characterized for purity by PXRD in a previous 11B magic angle spinning nuclear magnetic resonance (MAS NMR) study (Zhou et al., 2012). All samples, including jadarite and model compounds, were pulverized into powders and kept in a desiccator before being transferred to the beamline and loaded into the chamber. All spectra were collected simultaneously in total fluorescence yield (TFY) and total electron yield (TEY), and at least two scans were made on each sample.
Considering the X-ray penetration depths of 75–95 nm for TFY versus ∼ 1 nm for TEY (Wang and Zuin, 2017), the samples of jadarite and model compounds were evenly distributed on a piece of double-sided carbon tape (0.5 cm2) to form a thin layer for Li and B K-edge XANES measurements. To avoid interference from neighbouring elements, such as Mn M2,3-edge (47 eV) and Al L2,3-edge (73 eV), Li and B K-edge spectra were collected in the photon ranges of 47.5–70 and 185–210 eV, respectively. All spectral measurements were performed in the conventional step-scan mode with a step size of 0.1 eV. The beamline slits were maintained at 100 µm for all model compounds but opened to 150 µm to increase signal-to-noise ratios for the jadarite samples. The chamber's pressure was kept below 10−7 torr during data collection (Wang and Zuin, 2017). Only the TFY data were reported in this contribution because the TEY data were of very poor quality.
The following procedure was used for processing the Li and B K-edge spectra: (i) normalizing the fluorescence signals to the incident photon flux (I0) recorded as drain current by a nickel mesh located just upstream of the sample and (ii) normalizing the spectra using polynomial subtraction in the pre- and post-edge regions. This normalization step was applied to all measured and calculated spectra to facilitate their direct comparison. Note that the measured Li K-edge position of the model compound Li2CO3 was calibrated to 61.8 eV (Yang et al., 2012) and that the measured B K-edge position of howlite was calibrated to 194.0 eV (Fleet and Muthupari, 2000).
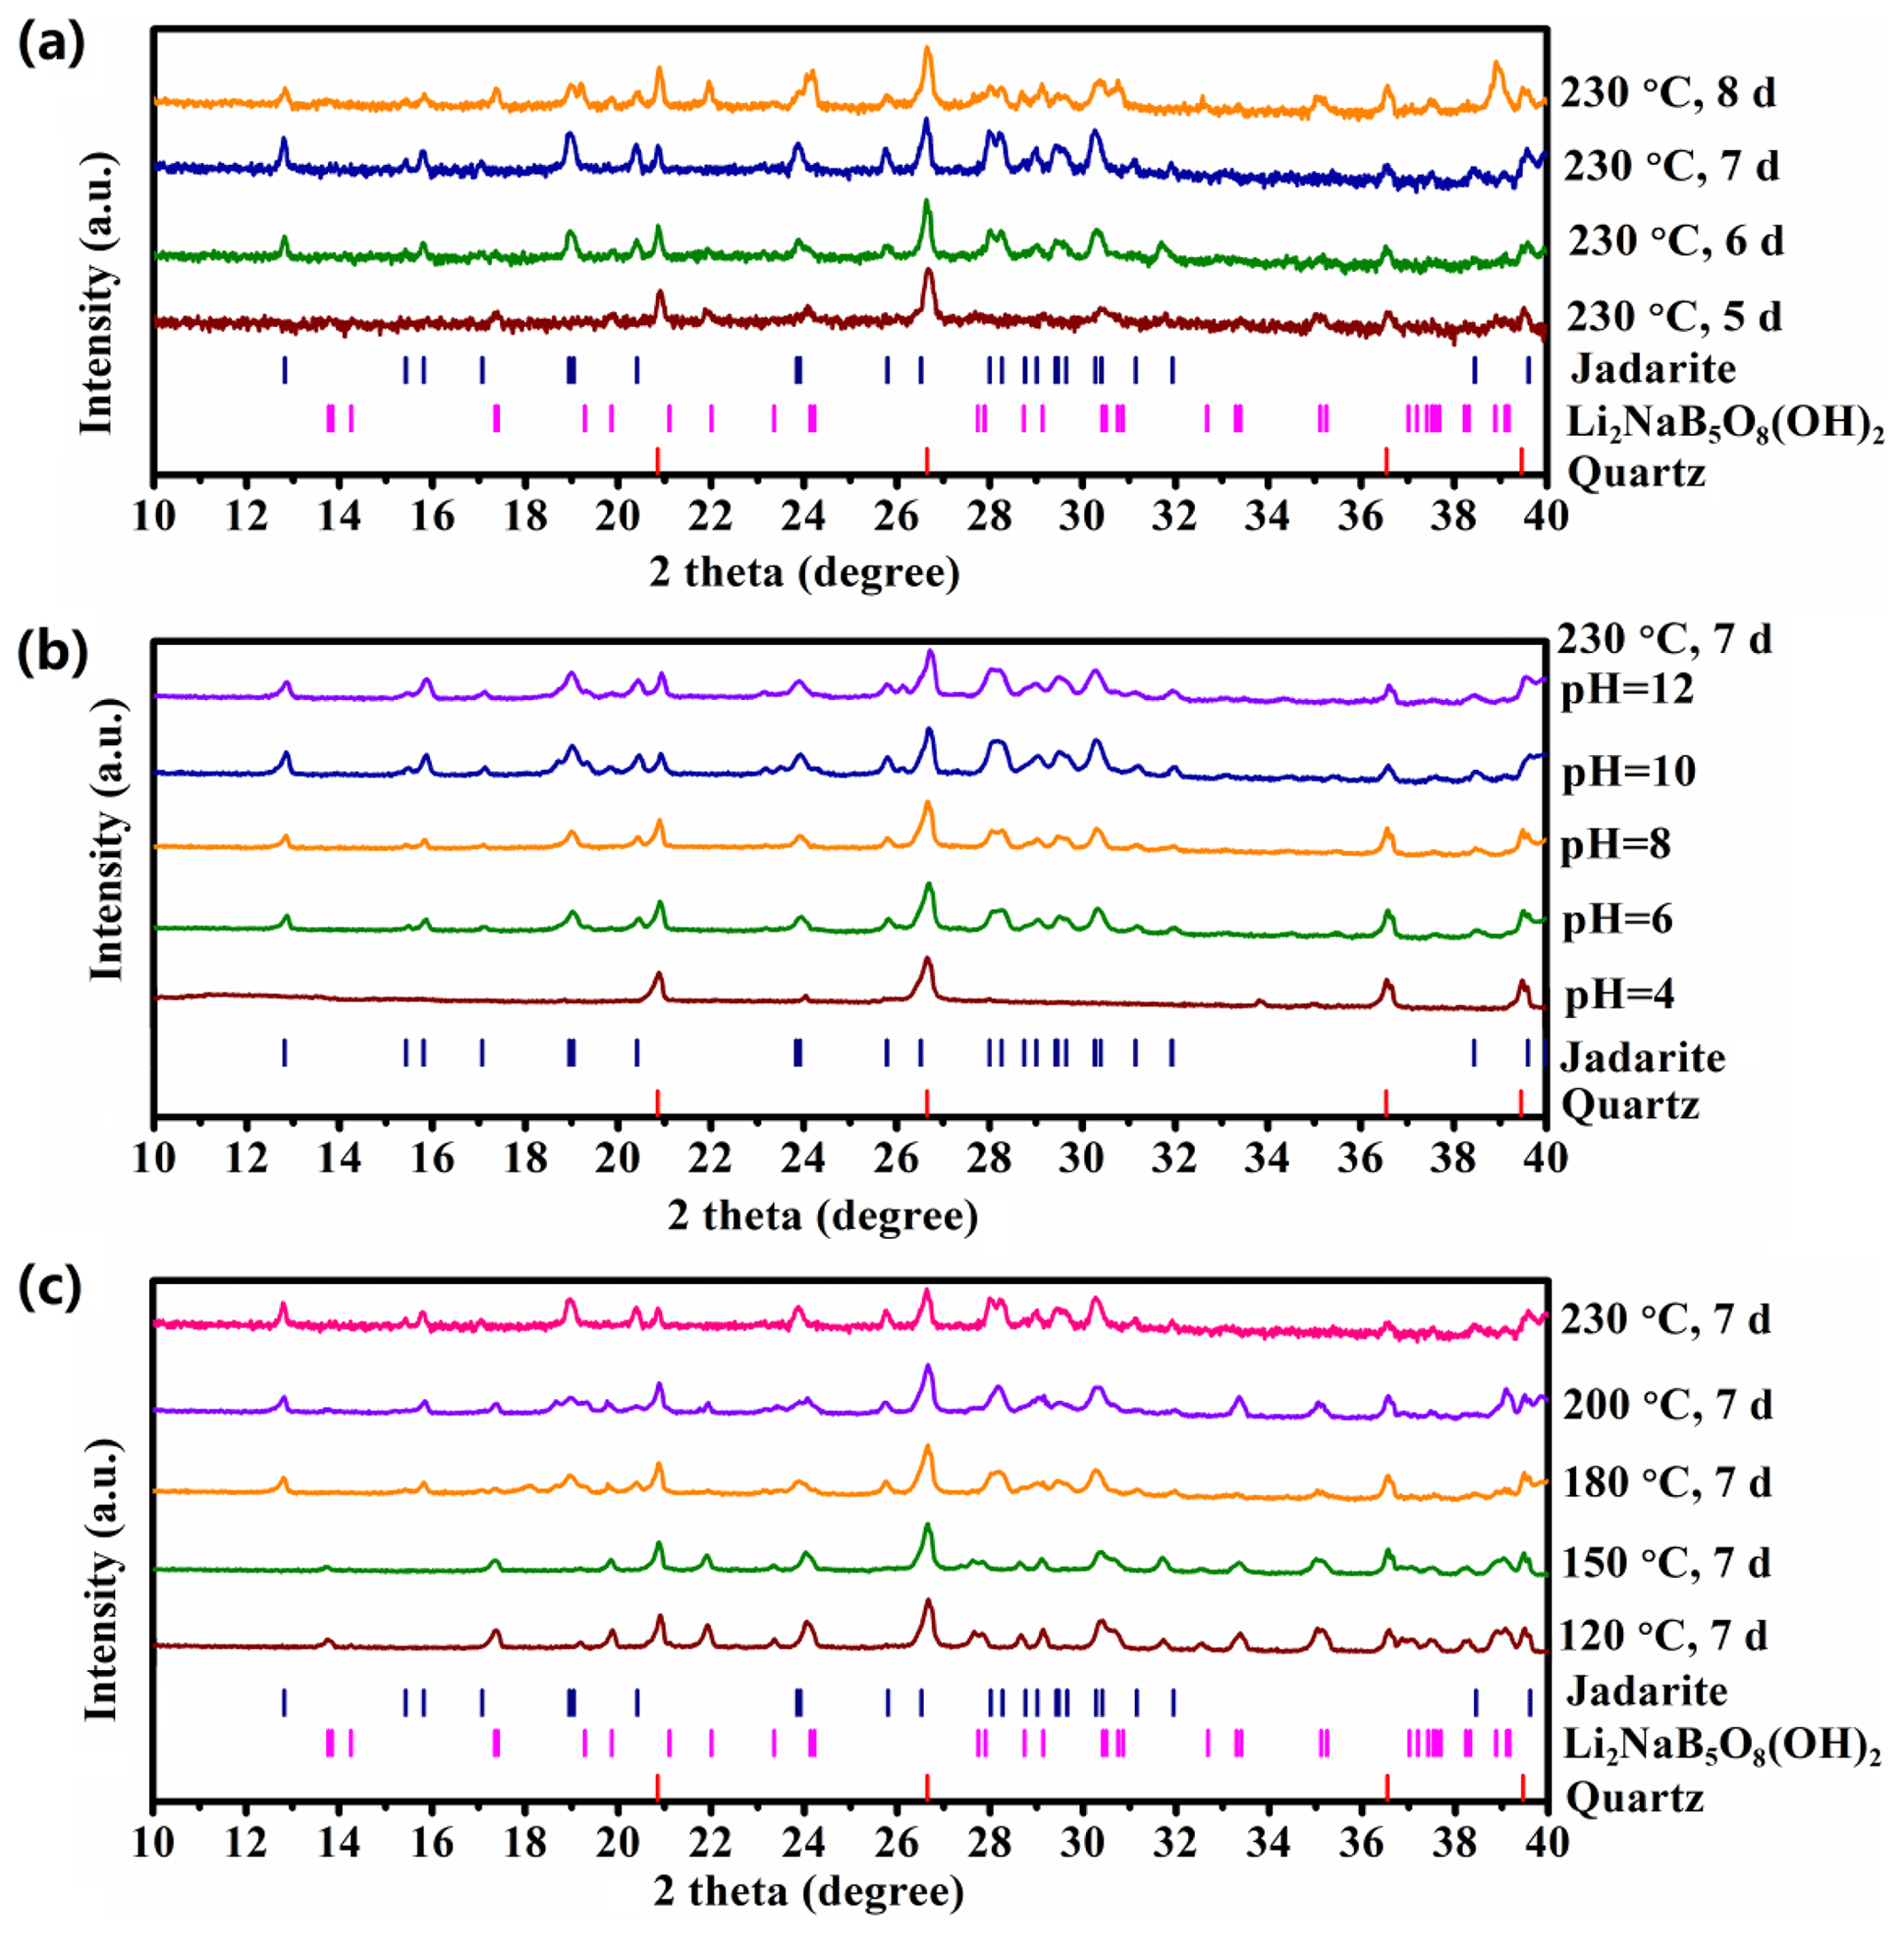
Figure 3PXRD patterns of the solid products synthesized from three series of experiments in the Li2O–Na2O–B2O3–SiO2–NaCl–H2O system: (a) a constant T of 230 ∘C and a uniform pH = 8 at variable durations from 5 to 8 d showing the optimal synthesis of jadarite at 7 d; (b) a constant T of 230 ∘C and a uniform duration of 7 d at variable pH values from 4 to 12 showing the formation of jadarite only at the pH range of 6 to 12; and (c) a constant pH value of 8 and a uniform duration of 7 d at variable temperatures from 120–230 ∘C showing the formation of jadarite only in the temperature range from 180 to 230 ∘C. Note that the y axis in arbitrary units (a.u.) is shown in the logarithmic (log 10) scale to make weak reflections more clear.
2.4 First-principles theoretical calculations
The theoretical calculations of jadarite started with the crystal structure of jadarite (Whitfield et al., 2007), consisting of four LiNaSiB3O7(OH) units with a total of 60 atoms. The structure was first optimized with an energy convergence threshold of 10−6 eV and a force convergence threshold of eV Å−1. The FTIR and Raman calculations were performed with the VASP (Vienna Ab initio Simulation Package) code (Kresse and Hafner, 1993; Furthmüller et al., 1994; Kresse and Furthmüller, 1996; Kresse and Joubert, 1999), using the projector augmented plane wave (PAW) potentials and the Perdew–Burke–Enzerhof (PBE) exchange–correlation functional (Perdew et al., 1996). Density functional perturbation theory (DFPT) was performed to obtain the Born effective charge tensors and to compute the IR intensities and the Raman spectra. In geometry optimization, FTIR, and Raman calculations, 4 × 4 × 4 k points were used. The B and Li K-edge XANES spectra were calculated with the OCEAN code (Gilmore et al., 2015), which solves the Bethe–Salpeter equation (BSE) to perform spectral calculations. A total of 2 × 2 × 2 k points were used in the XANES calculations. The plane wave cutoff is truncated at 60 Ryd, and 2400 bands were used in the calculations. The incident photons were incoming from 16 directions. The final XANES spectra are the average of all photons for different B or Li atoms at crystallographically distinct sites.
3.1 Synthesis of jadarite
The use of LiCl ⋅ H2O and Na2B4O7 ⋅ 10H2O as the sources for Li, Na, and B makes our synthesis experiments deviate from the stoichiometric composition of jadarite with excess Na and Cl, which also come from the addition of NaOH and HCl for adjusting the pH values of the starting slurries. Therefore, our synthesis experiments are best described by the Li2O–Na2O–B2O3–SiO2–NaCl–H2O system. The pressures of our synthesis experiments have not been quantified directly but can be estimated approximately by the pressure–volume–temperature relations for 12 mL water/brines in the 25 mL autoclaves in the temperature range of 100–230 ∘C (Soreide and Whitson, 1992).
The first series of synthesis experiments were made with a mixture of fumed SiO2 (10 mmol, 0.601 g), LiCl ⋅ H2O (10 mmol, 0.604 g), and Na2B4O7 ⋅ 10H2O (7.5 mmol, 2.860 g) for a constant duration of 3 d in the temperature range from 100 to 230 ∘C and pH values from 4 to 12. Only one run at 230 ∘C and pH = 8 in this series produced a pure jadarite as confirmed by PXRD (Fig. 1 and see also Table S1 in Supplement) and FTIR/Raman (see below), while all solid products from all other experiments of this series are dominantly amorphous, with the sporadic presence of halite NaCl (Fig. S1 in the Supplement). The PXRD pattern of synthetic jadarite (Fig. 1) was indexed to the unit-cell parameters of a=6.838(6), b=13.8152(4), c=6.786(7) Å, β=111.146(7), and V=597.87 Å3 in the monoclinic space group P21/n (14) (Table S1), in agreement with those reported by previous studies (Stanley et al., 2007; Whitfield et al., 2007).
The experiment for the successful synthesis of jadarite at T = 230 ∘C and pH = 8 for 3 d was then evaluated by three replicated runs with the starting materials under the same condition. However, these replicated experiments yielded mixed results: one successfully reproduced pure jadarite (Fig. S1d), but two others formed either dominantly amorphous solids or millimeter-sized crystals of Li2NaB5O8(OH)2. Single-crystal XRD structure refinements show that the synthetic Li2Na[B5O8(OH)2] is monoclinic (a=8.9327(4), b=8.4132(3), c=9.1994(4) Å, β=90.315(4), V=691.35 Å3) in the space group P21/n (14), thus similar but not identical to the orthorhombic compound reported by Wang et al. (2017).
These mixed results from the four experiments at T=230 ∘C and pH = 8 for 3 d suggest that the dominantly amorphous products from the experiments at various temperatures and pH values (Fig. S1) were potentially related to insufficient times, while the incomplete dissolution and recrystallization of fumed silica did not affect the formation of jadarite. This suggestion was evaluated by a series of four experiments with the same molar ratio of the starting materials as described above (but micron-sized quartz instead of fumed SiO2) at T = 230 ∘C and pH = 8 for 5, 6, 7, and 8 d. Figure 3a shows that residual quartz from the starting materials persisted in all four experiments and that the change from fumed silica to quartz as the Si source did not affect the formation of jadarite. Moreover, Fig. 3a suggests that the optimal duration for the formation of jadarite was 7 d.
Subsequently, two more series of synthesis experiments with the same starting materials as the second series (i.e. micron-sized quartz instead of fumed SiO2) were made to evaluate the effects of temperature and pH. One series of experiments at a constant T of 230 ∘C and a uniform duration of 7 d but variable pH values from 4 to 12 (Fig. 3b) shows that jadarite can be synthesized in the pH range from 6 to 12. The other series of experiments at a constant pH value of 8 and a uniform duration of 7 d but different temperatures from 120 to 230 ∘C, Fig. 3c) suggests that jadarite can be synthesized in the temperature range from 180 to 230 ∘C. The PXRD peaks of jadarite synthesized in different experiments at temperatures from 180 to 230 ∘C and pH from 6 to 12 (Figs. 2 and 3) do not show any detectable variations, suggesting no significant difference in synthetic jadarite.
3.2 FTIR spectrum of synthetic jadarite
The FTIR spectrum of synthetic jadarite (Fig. S2) is closely comparable to that of its natural counterpart reported by Stanley et al. (2007), including weak and noise-like bands at 0–750 cm−1, strong and sharp bands at 750–1250 cm−1, weak bands at 1250–1400 cm−1, and a sharp band at the high wavenumber of ∼ 3500 cm−1 (Table 1). Similar features have been obtained from theoretical calculations and are herein used for comparison with the tentative assignments of Stanley et al. (2007).
Table 1Comparison of FTIR data of natural and synthetic jadarite with theoretical results.
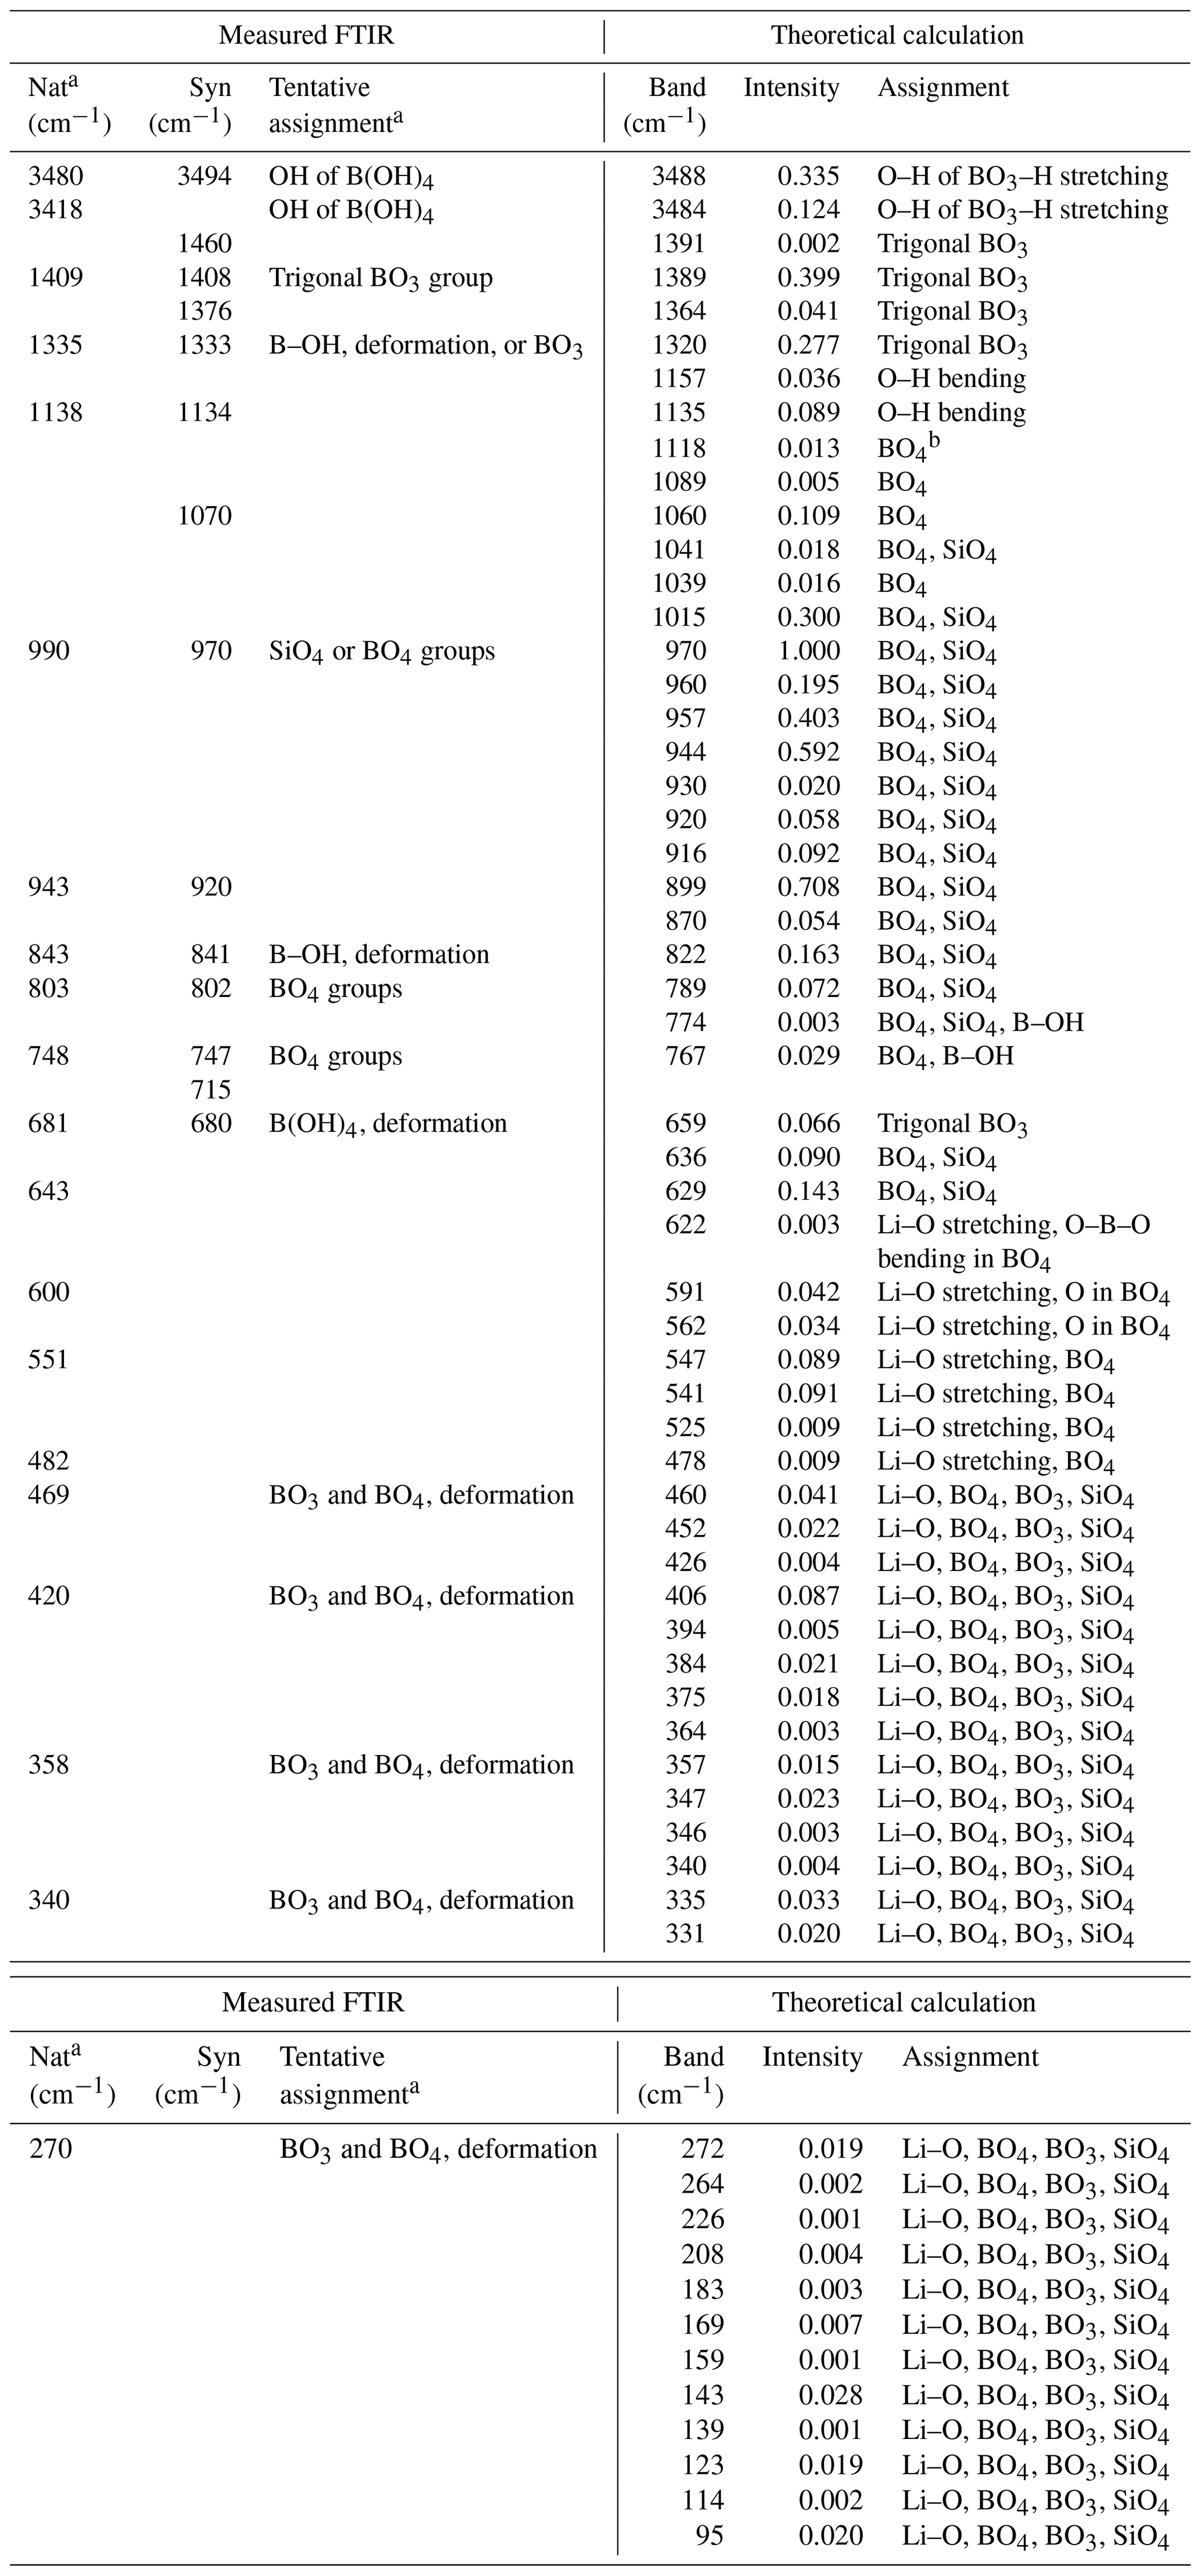
Natural and synthetic jadarite samples are abbreviated as “Nat” and “Syn”, respectively. a The FTIR data of natural jadarite and tentative assignments of Stanley et al. (2007). b All BO4 groups in the table include both the BO4 tetrahedron and the OBO3 pyramid. Theoretical intensities (unitless) have been normalized to 1.
Specifically, theoretical calculations yield two distinct peaks at 3488 and 3484 cm−1, which are due to the O–H stretching from the H atom linked to an apex of the trigonal BO3 group. They are in close agreement with the band at 3480 cm−1 measured from both natural and synthetic jadarite (Stanley et al., 2007; Fig. S2 and Table 1). At the 1250–1400 cm−1 region, four calculated peaks at 1391, 1389, 1364, and 1320 cm−1 correspond to the measured bands of the synthetic jadarite at 1408, 1376, and 1333 cm−1 (Table 1). They are assigned to the asymmetric stretching of the BO3 groups. More specifically, the peak at 1391 cm−1 is due to B stretching with the O atom connecting the BO4 group, and the 1389 cm−1 peak is due to B stretching with the O atoms connecting to the OBO3 group and the BO4 group. The peaks at 1364, 1320, and 1312 cm−1 in the calculation and 1333 cm−1 in the experiment represent the stretching of the B atom with the bridging O atom among B, Li, and H. The calculated peaks in the 750–1250 cm−1 region are attributed to the Si–O stretching, B–O stretching, and the O–H bending. The most protruding peak at 970 cm−1, which corresponds to the measured 970 cm−1 band, represents the symmetric Si–O bond stretching. Another strong peak at 957 cm−1 is due to the asymmetric stretching of the Si–O bond. Other sharp peaks at 899, 944, and 1015 cm−1 are related to the BO4 and OBO3 groups. The 899 cm−1 peak represents the asymmetric stretching of the B–O bonds, the 944 cm−1 peak is the wagging of B–O–B in the BO4 and OBO3 groups, and the 1015 cm−1 peak is due to the scissoring of B–O–B. The peak at 960 cm−1 arises from the asymmetric stretching of the bridging oxygen between the three- and four-coordinated B. The O–H bending mode occurs at 1157 and 1135 cm−1. Below 750 cm−1, weak Li–O stretching can be observed at about 600 cm−1.
3.3 Raman spectra of natural and synthetic jadarite
Figure 4 shows the Raman spectra of natural (red) and synthetic (blue) jadarite compared with the calculated spectrum (blue). Table 2 lists the vibrational frequencies observed in experiments and theoretical calculations and their assignments. The spectra are in good agreement with each other. Figure 4a compares natural and synthetic jadarite spectra at about 3490 cm−1, which can be assigned to the O–H stretching in the BO3–H unit, with the calculated spectrum (Table 2). The position of peaks in the calculated spectrum slightly shifts to the lower frequency with a difference of about 5 cm−1. The FTIR and Raman O–H stretching vibration bands of synthetic jadarite are 3494 and 3497 cm−1, respectively (Tables 1 and 2). The two calculated FTIR O–H stretching vibration bands at 3488 and 3484 cm−1 (Table 1) are close to the two calculated Raman bands at 3485 and 3484 cm−1 (Table 2), although FTIR and Raman modes are known to be mutually exclusive from each other.
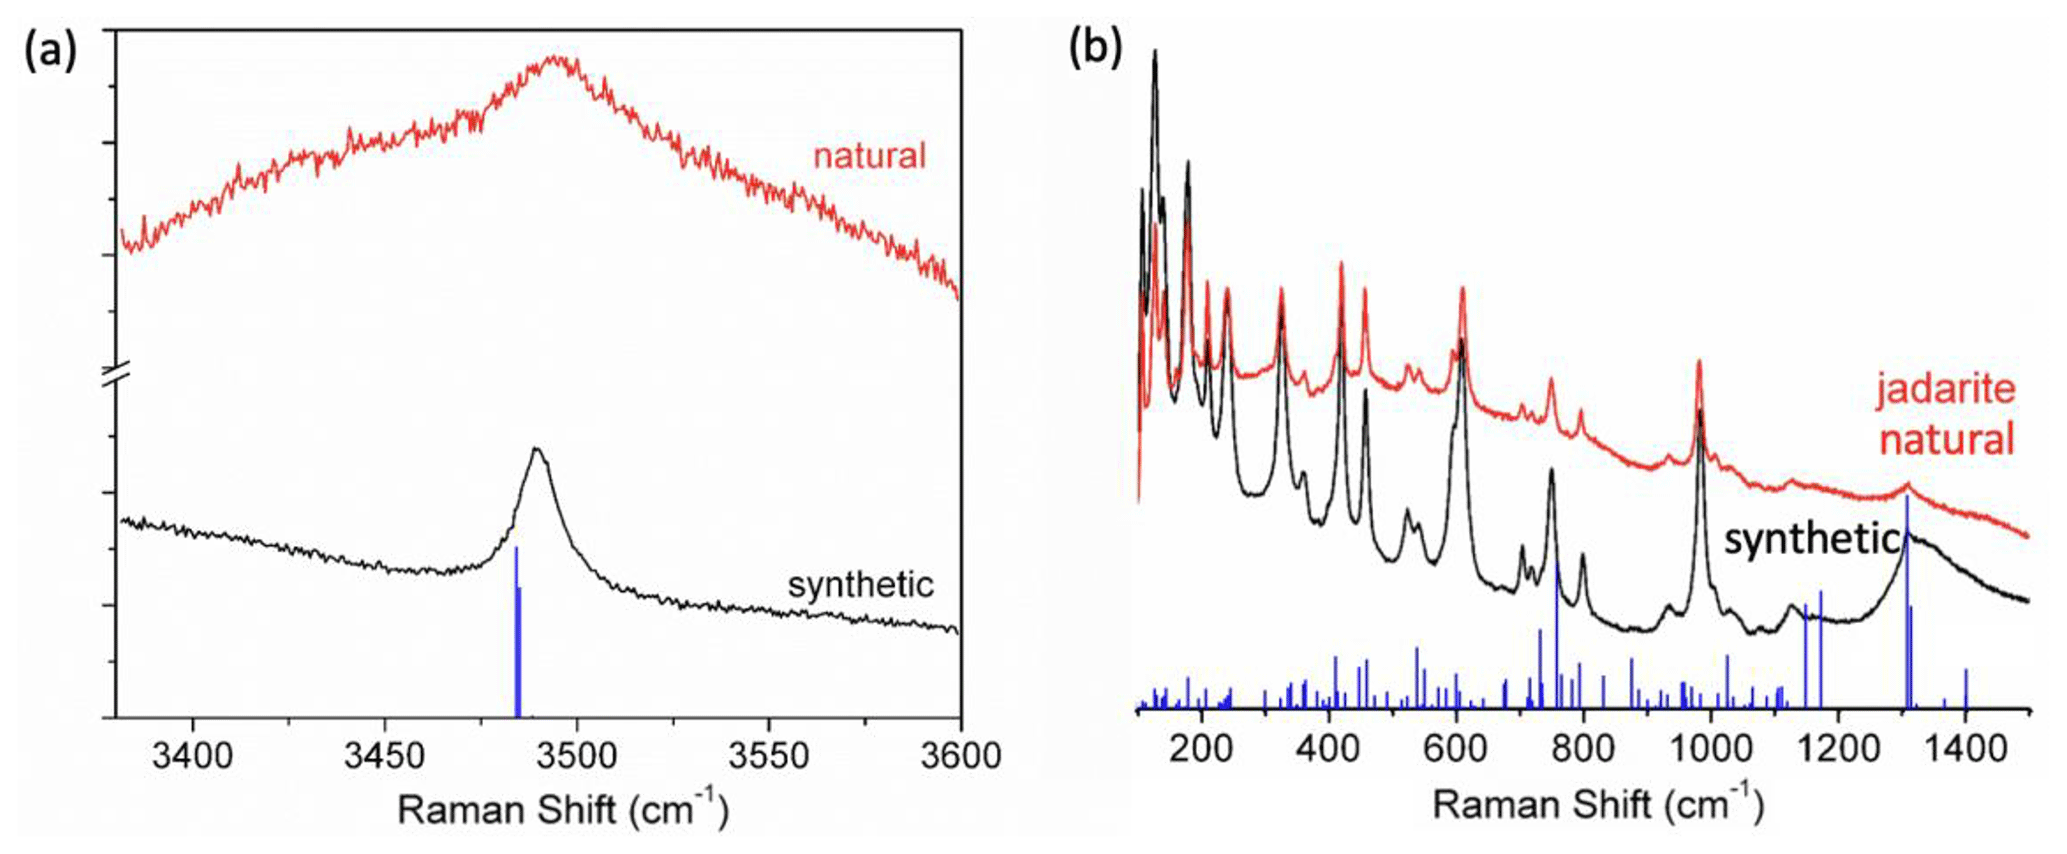
Figure 4Comparison of Raman spectra of natural (black) and synthetic (red) jadarite. Also included for comparison are the intensities of calculated Raman modes. (a) Raman spectra at the high-frequency range. (b) Raman spectra at the low-frequency range.
Table 2Comparison of Raman data of natural and synthetic jadarite with theoretical results.

* All BO4 groups in the table include both the BO4 tetrahedron and the OBO3 pyramid. Theoretical intensities (unitless) have been normalized to 1.
In Fig. 4b and Table 2, the calculated Raman spectrum shows several strong spikes in the 1305–1398 cm−1 region, which correspond to the measured bands at 1311 and 1308 cm−1 in natural and synthetic jadarite. The features in this region can be assigned to the asymmetric stretching of the BO3 groups, which was also revealed from the abovementioned FTIR results. The 1100–1135 cm−1 region can be assigned to the bending mode of O–H. Small bands at 1127 and 1126 cm−1 in natural and synthetic jadarite are observed in this region. The measured Raman spectra of natural and synthetic jadarite have a sharp band at 982 and 984 cm−1, respectively, and a small shoulder at 934 and 935 cm−1 (Fig. 4b and Table 2). In the calculated spectrum, many frequencies with weak intensities are found from 820–1100 cm−1. They are assigned to the vibrations of the OBO3 and BO4 groups mixed with SiO4 vibrations. The crystallographically distinct BO4 and OBO3 groups (Zhou et al., 2016) cannot be distinguished by FTIR or Raman because the atoms in the model structure are strongly coupled. Moreover, the BO4 and OBO3 groups have a shared O atom, making it difficult to distinguish the individual vibrational modes of each group. Some sharp bands are also observed at frequencies ranging from 680 to 850 cm−1 in both experimental and calculated spectra. In addition to the mixed vibrational modes caused by OBO3, BO4, and SiO4 groups, O–H bending and trigonal BO3 vibrations are observed in this range. The Li–O stretching modes are observed at frequencies below ∼ 628 cm−1 (Table 2).
3.4 Boron K-edge XANES spectra of natural and synthetic jadarite
Figure 5a shows the measured B K-edge XANES spectra of natural and synthetic jadarite in comparison with those of selected model compounds. The measured B K-edge XANES spectra of natural and synthetic jadarite are similar to those of other borate and borosilicate minerals containing mixed BO3, BO4, and OBO3 groups (Fleet and Muthupari, 2000).

Figure 5(a) Measured B K-edge XANES spectra of natural and synthetic jadarite in comparison with those of selected model compounds and (b) calculated B K-edge XANES spectra of three crystallographically distinct B sites (B1: OBO3; B2: BO4; and B3: BO3). Also shown for comparison are the calculated (i.e. summation of the three B sites) B K-edge XANES spectrum and that of synthetic jadarite.
In particular, the BO3 and BO4 groups are readily identified by B K-edge XANES spectra, manifested by two primary peaks for the former but three for the latter. Both polyhedra share a common sharp main peak at 194 eV, as well as a broad post-edge peak at either 200–201 eV for the BO4 group or 203–204 eV for the BO3 group (e.g. Fleet and Muthupari, 2000). However, in samples containing the tetrahedral BO4 group, the broad post-edge peak has an asymmetric shape with an additional bump at ∼ 198 eV (Fig. 5b). Fleet and Liu (2001) noted that the B K-edge XANES spectrum of sinhalite is characterized by three distinct post-edge features at 196.8, 197.9, and 199.6 eV assigned to the OBO3 pyramid of different B–O bond lengths at 1.564, 1.483 (×2), and 1.442 Å, respectively. In comparison, the calculated B K-edge XANES spectrum of the OBO3 pyramid in jadarite is characterized by one broad and strong peak at ∼ 196.9 eV and a weak peak at ∼ 199.3 eV, attributable to its three B–O bonds in the range from 1.49 to 1.60 Å and one B–O short bond at 1.40 Å, respectively (Fig. 5b).
Figure 5b shows the separate and averaged B K-edge XANES spectra calculated from the BO3, BO4, and OBO3 groups in jadarite. The peak positions of the calculated spectra are shifted to align with the edge position of boron reference samples, i.e. 194.0 eV, as illustrated in Fig. 5a. The averaged B K-edge XANES spectrum is characterized by a sharp and narrow π* peak at 194.0 eV, while the σ* peak region is broad and has several characteristic features arising from the three types of B atoms with different local environments. Specifically, B1 is the OBO3 pyramid, and B2 is the BO4 tetrahedron. B1 has a peak at 196.9 eV (red line), clearly different from that of B2 with one peak at 199.3 eV (blue line). B3 is the planar triangular BO3 group, with a π* peak at 194.0 eV and the σ* peak at 200.9 eV (black lines). The positions of the characteristic features of the OBO3, BO4, and BO3 groups are also in good agreement with the previous calculation of B K-edge XANES spectra for B2O3 glass (Kuang, 2022).
3.5 Lithium K-edge XANES spectra of natural and synthetic jadarite
Figure 6 shows the Li K-edge XANES spectra of natural and synthetic jadarite in comparison with those of four model compounds (LiF, Li2CO3, Li2B4O7, and Li2MoO4). Also included in Fig. 6 for comparison is a calculated Li K-edge XANES spectrum of jadarite. Note that the Li K-edge XANES spectrum of the model compound Li2MoO4 has the main edge at 62.5 eV (Fig. 6), in agreement with the value of 62.6 eV reported by Wang and Zuin (2017). Validation of the Li pseudopotential was proven by calculating the Li K-edge XANES spectra of three crystalline compounds (Fig. S3).
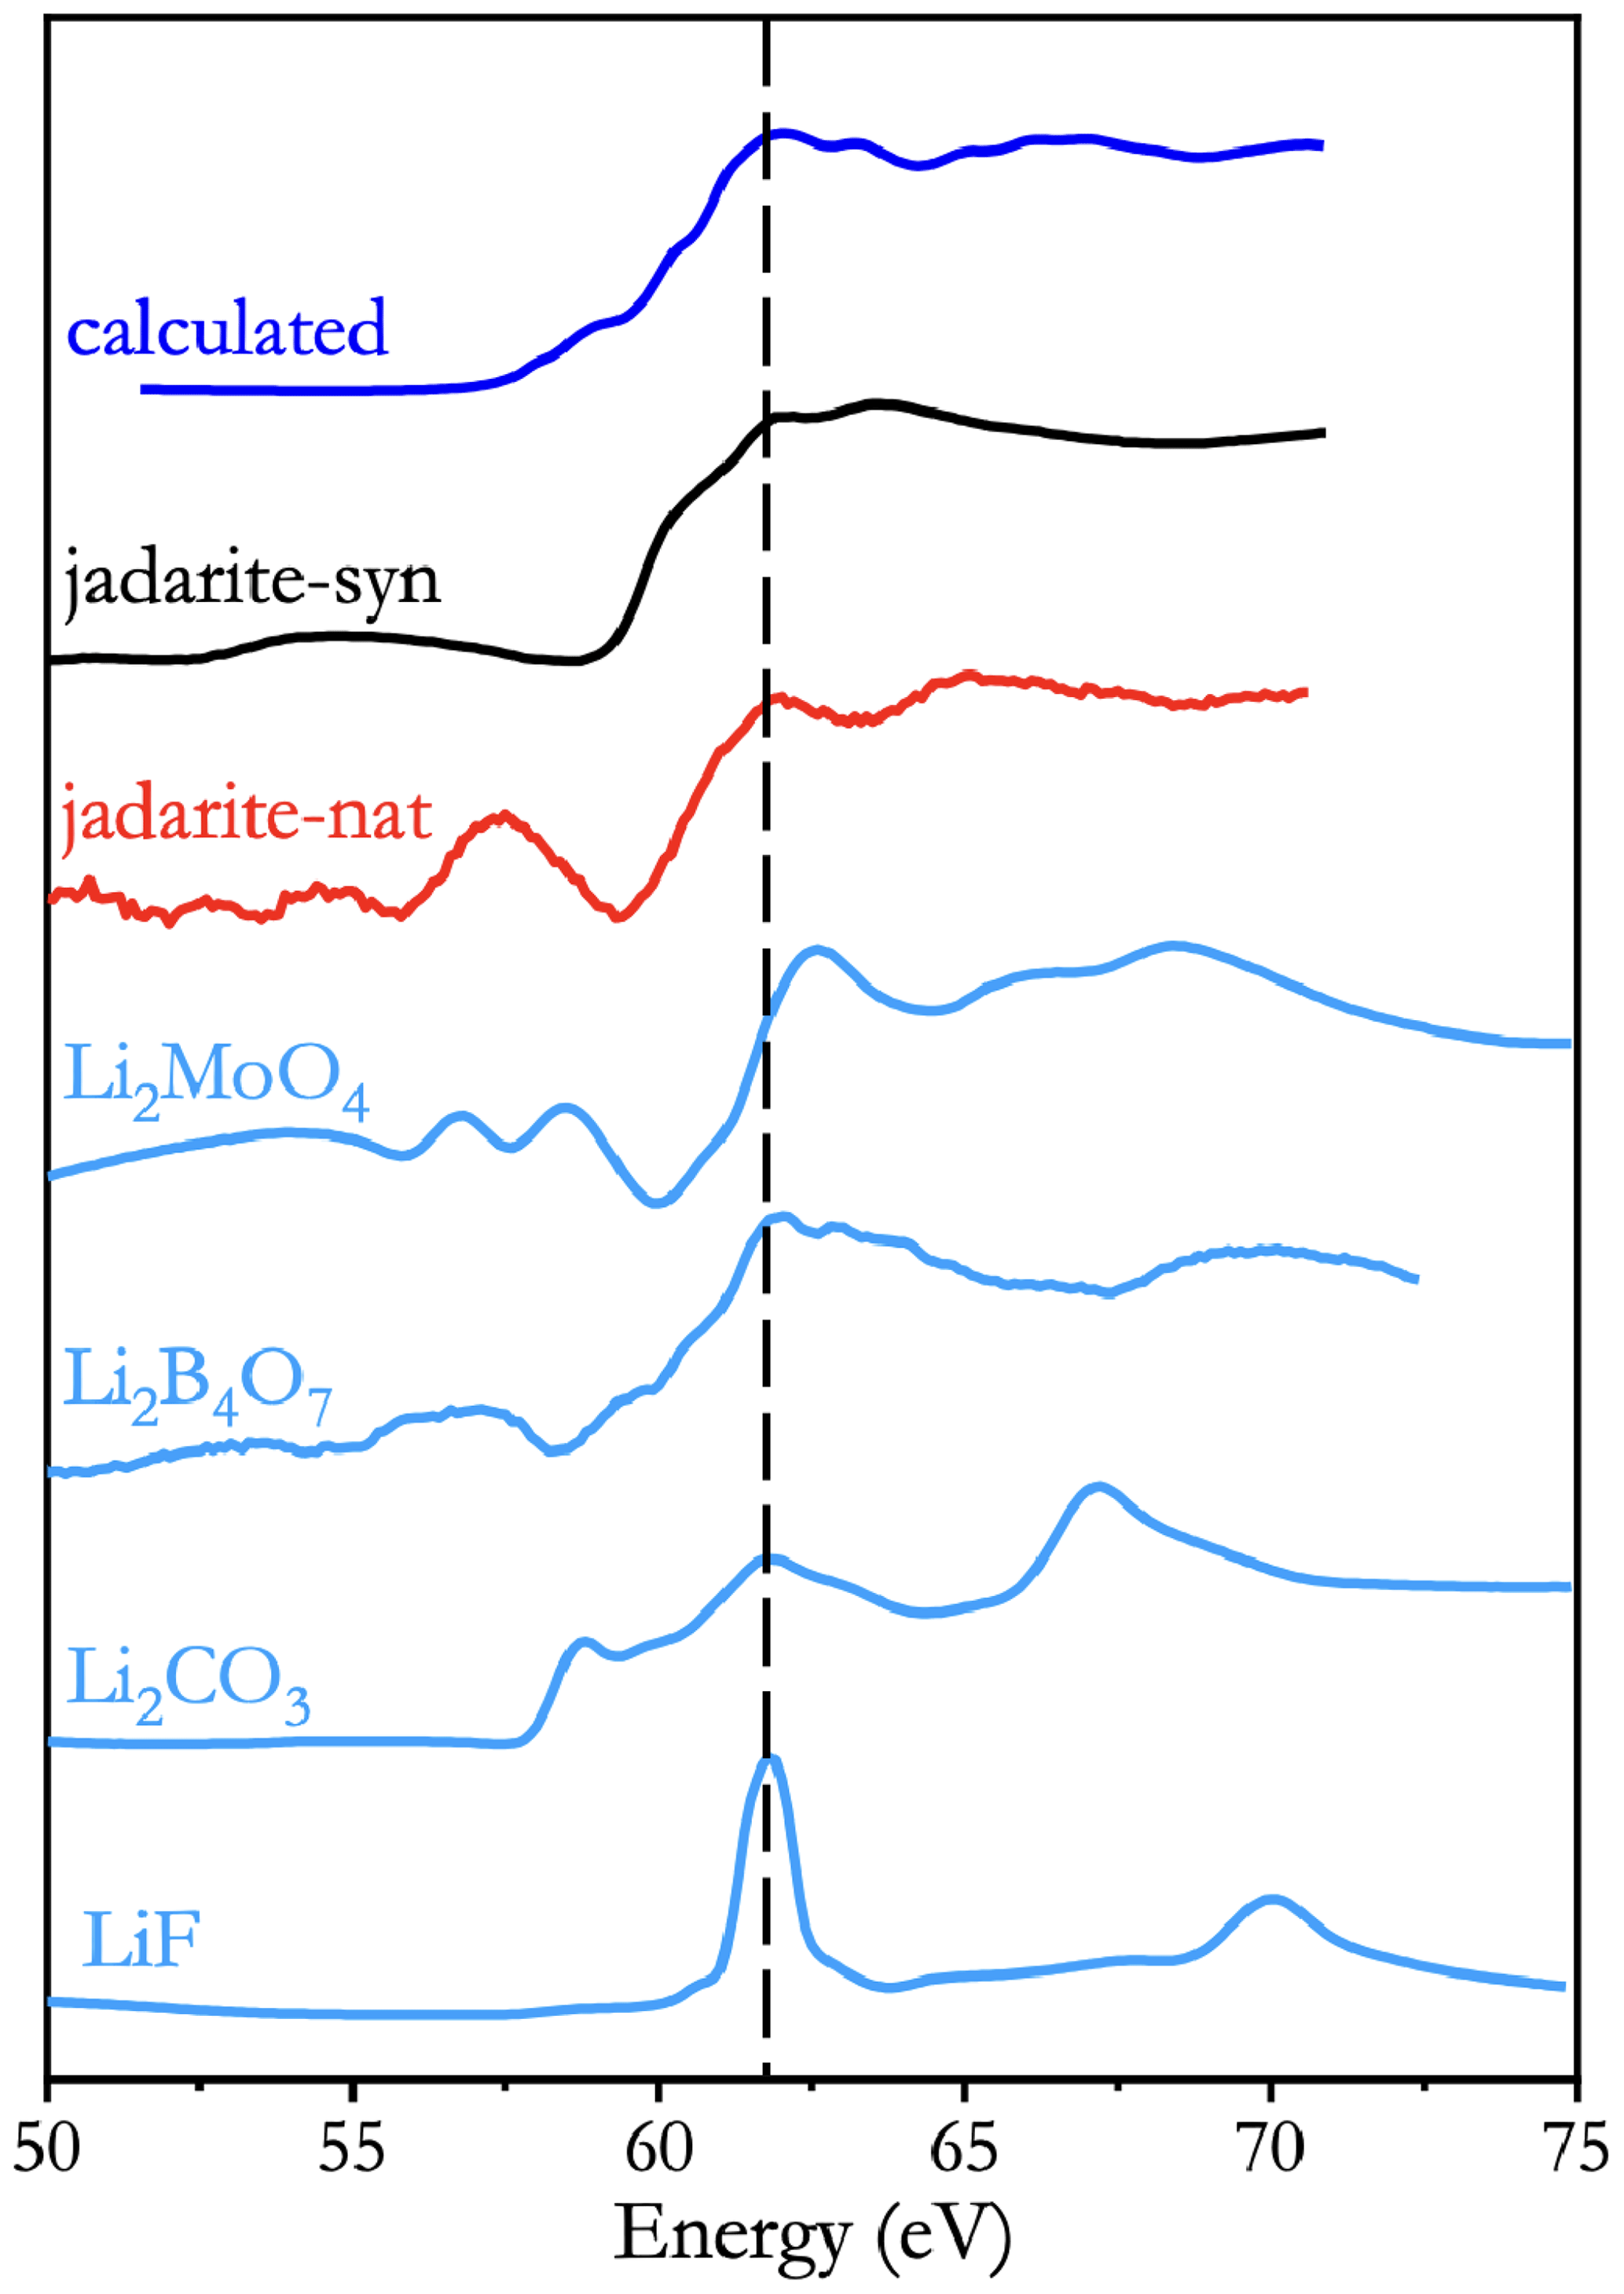
Figure 6Lithium K-edge XANES spectra measured from natural and synthetic jadarite, compared with those of four model compounds (LiF, Li2CO3, Li2B4O7, and Li2MoO4), and the calculated Li K-edge XANES spectrum of jadarite.
Figure 6 shows the Li K-edge XANES spectra of jadarite and model compounds all have pre-edge features of different intensities. The spectrum of LiF has a weak pre-edge feature at 60.6 eV. The spectrum of Li2CO3 has a pre-edge peak at 58.8 eV with a shoulder at 59.8 eV to the main edge (Fig. 6). These two pre-edge features are observed at similar energies in the spectra of Li2B4O7 and Li2MoO4 (Fig. 6). One notable difference in the Li K-edge XANES spectra between natural and synthetic jadarite is the presence of a pronounced bump at ∼ 57.6 eV in the former, which is conspicuously absent in the latter (Fig. 6). It is interesting to note that the calculated spectrum of jadarite is in excellent agreement with that of synthetic jadarite. Therefore, the pronounced bump at 57.6 eV observed only in the spectrum of natural jadarite is probably due to impurity interference (e.g. Fe M2,3-edge) in this sample (O'Shaughnessy et al., 2018). Three post-edge features at 63.3, 65.1, and 67.2 eV in the calculated spectrum of jadarite are also observed at similar energies in the measured spectra of both natural and synthetic jadarite (Fig. 6).
3.6 Implications for the formation of jadarite in sedimentary systems
Our syntheses of jadarite in the Li2O–Na2O–B2O3–SiO2–NaCl–H2O system under the conditions of T = 180–230 ∘C and pH = 6–12 are obviously useful for understanding the formation of jadarite in sedimentary systems. Specifically, the Li2O–Na2O–B2O3–SiO2–NaCl–H2O system investigated in this study is directly relevant to Li-rich alkaline brines that have been suggested for the formation of Li–B deposits in lacustrine basins (Borojević Šoštarić and Brenko, 2023; Kadir et al., 2023). Also, the temperature range and pH values required for the synthesis of jadarite in our experiments suggest its formation in sedimentary environments under high-temperature diagenetic conditions. Therefore, our results may explain the restricted occurrence of jadarite in deep sediments of the Jadar basin (Stanley et al., 2007), which has not been found in other parts in the western Balkan Li–B metallogenic zone (Borojević Šoštarić and Brenko, 2023).
Borojević Šoštarić and Brenko (2023) suggested that the formation of jadarite in the Jadar basin and other Li–B mineralization in Miocene lacustrine basins across the western Balkan Li–B metallogenic zone formed from the circulation of Li–B-enriched hydrothermal fluids. These authors also suggested that Li–B-rich hydrothermal fluids most likely originated from late-stage post-magmatic hydrothermal activity associated with granite emplacement and exhumation. Similarly, Kadir et al. (2023) suggested that Li-enriched sediments associated with borate deposits in western Anatolia (Turkiye), along the extension from the western Balkan Li–B metallogenic zone, formed from the mixing of meteoric water and hydrothermal fluids under depositional and diagenetic conditions in a shallow playa or lacustrine environment.
Another salient feature of jadarite in the Jadar basin is its close association with searlesite (Stanley et al., 2007), which was first discovered in sediments derived from alkaline lakes (Hay and Moiola, 1963; Yang and Rosenberg, 1992). Searlesite has been synthesized in the Na2O–B2O3–SiO2–H2O system at 150 ∘C for 336 h (Fyfe et al., 2001) and 200 ∘C for 3 months (Derkacheva et al., 2017). Thermodynamic calculations by Yang and Rosenberg (1992) showed that the crystallization of searlesite, albeit stable under surficial conditions, is kinetically unfavourable at ambient temperatures. Yang and Rosenberg (1992) noted that searlesite is not known to precipitate directly in modern saline lakes but usually crystallizes in derived sediments at depth under diagenetic conditions of elevated temperatures. Therefore, the association of jadarite and searlesite in the Jadar basin is consistent with their crystallization in deep sediments derived from alkaline lakes under high-temperature diagenetic conditions.
Jadarite has been synthesized in the Li2O–Na2O–B2O3–SiO2–NaCl–H2O system at temperatures from 180 to 230 ∘C and pH values from 6 to 12. Synthetic and natural jadarite shares similar powder X-ray diffraction (PXRD) patterns and Fourier transform infrared (FTIR) spectra to its natural counterpart and has been characterized by Raman and synchrotron Li and B K-edge X-ray absorption near-edge structure (XANES) spectroscopy. First-principles theoretical calculations have reproduced the measured FTIR and Raman spectra and allow definitive assignments of vibration modes. Similarly, the measured B and Li K-edge XANES spectra of jadarite are reasonably reproduced by first-principles theoretical calculations. Our synthesis results, together with its association with searlesite in the Jadar basin, suggest jadarite forms in deep sediments derived from Li-rich alkaline brines under high-temperature diagenetic conditions. This finding has potentially important implications in the search for new lithium deposits in sedimentary basins for the sustainable development of this critical mineral resource.
All data used in the paper are either in the main text or the Supplement.
The supplement related to this article is available online at: https://doi.org/10.5194/ejm-36-139-2024-supplement.
XZX and JXM: data curation; investigation; and writing – original draft preparation. HK and JST: data curation; investigation; and writing – original draft preparation. EW, RD, AT, SP, and LZ: data curation. YP: conceptualization; supervision; and writing – review and editing.
The contact author has declared that none of the authors has any competing interests.
Publisher’s note: Copernicus Publications remains neutral with regard to jurisdictional claims made in the text, published maps, institutional affiliations, or any other geographical representation in this paper. While Copernicus Publications makes every effort to include appropriate place names, the final responsibility lies with the authors.
We thank chief editor Etienne Balan, associate editor Giuseppe Cruciani, and two anonymous reviewers for their constructive comments and helpful suggestions. Part of this research was performed at the Canadian Light Source, a national research facility of the University of Saskatchewan. The Canadian Light Source is supported by the Canada Foundation for Innovation (CFI), the Natural Sciences and Engineering Research Council (NSERC), the National Research Council (NRC), the Canadian Institutes of Health Research (CIHR), the Government of Saskatchewan, and the University of Saskatchewan.
This research has been supported by an NSERC Discovery Grant (RGPIN 04106-2018) and an MITACS Accelerate award (IT3048).
This paper was edited by Etienne Balan and Giuseppe Cruciani, and reviewed by two anonymous referees.
Borojević Šoštarić, S. and Brenko, T.: The Miocene Western Balkan lithium-boron metallogenic zone, Mineral. Deposita, 58, 639–658, https://doi.org/10.1007/s00126-022-01151-x, 2023.
Comboni, D., Battiston, T., Rumsey, M. S., Pagliaro, F., Lotti, P., Hanfland, M., and Gatta, D.: High-pressure behavior and phase transition of jadarite, a promising B and Li mineral commodity, J. Am. Ceram. Soc., 105, 7011–7021, https://doi.org/10.1111/jace.18659, 2022.
Derkacheva, E. S., Krzhizhanovskaya, M. G., and Bubnova, R. S.: Thermal behavior of reedmergnerite NaBSi3O8 and searlesite NaBSi2O5(OH)2, Glass. Phys. Chem., 43, 459–463, https://doi.org/10.1134/S1087659617050030, 2017.
Fleet, M. E. and Liu, X.: Boron K-edge XANES of boron oxides: tetrahedral B–O distances and near-surface alteration, Phys. Chem. Miner., 28, 421–427, https://doi.org/10.1007/s002690100173, 2001.
Fleet, M. E. and Muthupari, S.: Boron K-edge XANES of borate and borosilicate minerals, Am. Mineral., 85, 1009–1021, https://doi.org/10.2138/am-2000-0716, 2000.
Furthmüller, J., Hafner, J., and Kresse, G.: Ab initio calculation of the structural and electronic properties of carbon and boron nitride using ultrasoft pseudopotentials, Phys. Rev. B, 50, 15606–15622, https://doi.org/10.1103/PhysRevB.50.15606, 1994.
Fyfe, C. A., Skibsted, J., and Schwieger, W.: Solid-state NMR characterization of the mineral searlesite and its detection in complex synthesis mixtures, Inorg. Chem., 40, 5906–5912, https://doi.org/10.1021/ic010487s, 2001.
Gilmore, K., Vinson, J., Shirley, E. L., Prendergast, D., Pemmaraju, C. D., Kas, J. J., Vila, F. D., and Rehr, J. J.: Efficient implementation of core-excitation Bethe–Salpeter equation calculations, Comput. Phys. Commun., 197, 109–117, https://doi.org/10.1016/j.cpc.2015.08.014, 2015.
Global Battery Alliance: A vision for a sustainable battery value chain in 2030 unlocking the full potential to power sustainable development and climate change mitigation, https://www3.weforum.org/docs/WEF_A_Vision_for_a_Sustainable_Battery_Value_Chain_in_2030_Report.pdf (last access: 24 January 2024), 2019.
Hay, R. L. and Moiola, R. J.: Authigenic silicate minerals in Searles Lake, California, Sediment, 2, 312–332, https://doi.org/10.1111/j.1365-3091.1963.tb01222.x, 1963.
Hu, Y. F., Zuin, L., Wright, G., Igarashi, R., McKibben, M., Wilson, T., Chen, S. Y., Johnson, T., Maxwell, D., Yates, B. W., Sham, T. K., and Reininger, R.: Commissioning and performance of the variable line spacing plane grating monochromator beamline at the Canadian Light Source, Rev. Sci. Instrum., 78, 083109, https://doi.org/10.1063/1.2778613, 2007.
Kadir, S., Külah, T., Erkoyun, H., Helvacı, C., Eren, M., and Demiral, B.: Mineralogy, geochemistry, and genesis of lithium-bearing argillaceous sediments associated with the Neogene Bigadiç borate deposits, Balıkesir, western Anatolia, Türkiye, Appl. Clay Sci., 242, 107015, https://doi.org/10.1016/j.clay.2023.107015, 2023.
Kresse, G. and Furthmüller, J.: Efficient iterative schemes for ab initio total-energy calculations using a plane-wave basis set, Phys. Rev. B, 54, 11169–11186, https://doi.org/10.1103/PhysRevB.54.11169, 1996.
Kresse, G. and Hafner, J.: Ab initio molecular dynamics for liquid metals, Phys. Rev. B, 47, 558–561, https://doi.org/10.1103/PhysRevB.47.558, 1993.
Kresse, G. and Joubert, D.: From ultrasoft pseudopotentials to the projector augmented-wave method, Phys. Rev. B, 59, 1758–1775, https://doi.org/10.1103/PhysRevB.59.1758, 1999.
Kuang, H.: First-principles Studies on the Structures and Properties of Glasses and Melts under Extreme Conditions, Doctoral dissertation, University of Saskatchewan, https://harvest.usask.ca/handle/10388/14279?show=full (last access: 24 January 2024), 2022.
O'Shaughnessy, C., Henderson, G. S., Moulton, B. J., Zuin, L., and Neuville, D. R.: A Li K-edge XANES study of salts and minerals, J. Synchr. Rad., 25, 543–551, https://doi.org/10.1107/S1600577518000954, 2018.
Perdew, J. P., Burke, K., and Ernzerhof, M.: Generalized gradient approximation made simple, Phys. Rev. Lett., 77, 3865–3868, https://doi.org/10.1103/PhysRevLett.77.3865, 1996.
Søreide, I. and Whitson, C. H.: Peng-Robinson predictions for hydrocarbons, CO2, N2, and H2S with pure water and NaCI brine, Fluid Phase Equil., 77, 217–240, https://doi.org/10.1016/0378-3812(92)85105-H, 1992.
Stanley, C. J., Jones, G. C., Rumsey, M. S., Blake, C., Roberts, A. C., Stirling, J. A. R., Carpenter, G. J. C., Whitfield, P. S., Grice, J. D., and LePage, Y.: Jadarite, LiNaSiB3O7(OH), a new mineral species from the Jadar Basin, Serbia, Eur. J. Mineral., 19, 575–580, 2007.
U.S. Geological Survey Lithium: Mineral Commodity Summaries, https://pubs.usgs.gov/periodicals/mcs2023/mcs2023-lithium.pdf (last access: January 2023), 2022.
Wang, D. and Zuin, L.: Li K-edge X-ray absorption near edge structure spectra for a library of lithium compounds applied in lithium batteries, J. Power Sources, 337, 100–109, https://doi.org/10.1016/j.jpowsour.2016.10.105, 2017.
Wang, Q., Wang, L., Zheng, D.-D., Zhang, B.-B., Abulizi, Z., Pan, S.-L., and Yang, T.: Synthesis, structure and electronic calculation of alkali metals borate Li2Na[B5O8(OH)2], Inorg. Chem. Commun., 79, 104–108, https://doi.org/10.1016/j.inoche.2017.03.032, 2017.
Whitfield, P. S., Le Page, Y., Grice, J. D., Stanley, C. J., Jones, G. C., Rumsey, M. S., Blake, C., Roberts, A. C., Stirling, J. A., and Carpenter, G. J.: LiNaSiB3O7(OH) – novel structure of the new borosilicate mineral jadarite determined from laboratory powder diffraction data, Acta Crystallogr. B, 63, 396–401, https://doi.org/10.1107/S0108768107010130, 2007.
Yang, S., Wang, D., Liang, G., Yiu, Y. M., Wang, J., Liu, L., Sun, X., and Sham, T. K.: Soft X-ray XANES studies of various phases related to LiFePO4 based cathode materials, Energy Environ. Sci., 5, 7007–7016, https://doi.org/10.1039/C2EE03445J, 2012.
Yang, W. and Rosenberg, P. E.: The free energy of formation of searlesite, NaBSi2O5(OH)2, and its implications, Am. Mineral., 77, 1182–1190, https://pubs.geoscienceworld.org/msa/ammin/article-abstract/77/11-12/1182/42631 (last access: 24 January 2024), 1992.
Zhou, B., Michaelis, V. K., Giesbrecht, S. R., Kroeker, S., Sherriff, B. L., Sun, Z., Yao, Y., and Pan, Y.: Correlations between 11B NMR parameters and structural characters in borate and borosilicate minerals investigated by high resolution MAS NMR and ab initio calculations, Phys. Chem. Miner., 39, 363–372, https://doi.org/10.1007/s00269-012-0482-3, 2012.
Zhou, B., Sun, W., Zhao, B.-C., Mi, J.-X., Laskowski, R., Terskikh, V., Zhang, X., Yang, L., Botis, S. M., Sherriff, B. L., and Pan, Y.: 11B MAS NMR and first-principles study of the [OBO3] pyramids in borates, Inorg. Chem., 55, 1970–1977, https://doi.org/10.1021/acs.inorgchem.5b02071, 2016.