the Creative Commons Attribution 4.0 License.
the Creative Commons Attribution 4.0 License.
 | 15 Sep 2023
Genetic model for the color anomalies at the termination of pegmatitic gem tourmaline crystals from the island of Elba, Italy
Alessandra Altieri
Federico Pezzotta
Giovanni B. Andreozzi
Henrik Skogby
Ferdinando Bosi
Tourmaline crystals from the island of Elba commonly display a sharp transition to dark colors at the analogous termination due to the incorporation of Fe and/or Mn during the latest stages of crystallization in pegmatites. The formation of such color anomalies is related to a dramatic physicochemical change in the crystallization environment as a consequence of an opening of the geochemical system. However, mechanisms that may lead to the availability of Fe and/or Mn in the residual cavity fluids have been unclear. On the basis of chemical and spectroscopic investigations, combined with structural and paragenetic observations of the cavities, we propose a general genetic model in which, as a consequence of a pocket rupture event, chemical alteration of Fe- and Mn-rich minerals that formed early in the pegmatitic rock surrounding the cavities occurred through leaching processes, produced by the action of the highly reactive late-stage cavity fluids. Such processes were responsible for the release of Fe and Mn in the geochemical system, allowing the formation of the late-stage dark-colored terminations in the tourmaline crystals. In some cavities, a high availability of Mn and/or Fe determined the evolution of the crystals from an initial elbaite/fluor-elbaite composition to celleriite, foitite or schorl. This compositional evolution trend can be described by the following general chemical substitution: XNa+ + Y(Li1.5 + Al0.5)3+ + WF− ↔ X□ + 2Y(Fe,Mn)2+ + WOH−.
- Article
(14485 KB) - Full-text XML
-
Supplement
(2126 KB) - BibTeX
- EndNote


Tourmaline-supergroup minerals are the most widespread borosilicates in Earth's crust (Grew et al., 2016). They can be found in two main geological occurrences: igneous rocks, specifically in granites and granite pegmatites, and in metamorphic rocks such as schists and marbles. Tourmaline is a durable mineral and can also be found as a detrital phase in sandstones and conglomerates (van Hinsberg et al., 2011a, b; Dutrow and Henry, 2018; Henry and Dutrow, 2018). Tourmalines are complex borosilicates with a significant chemical variability containing both light and heavy elements, from H to Pb, and across multiple valence states. This variability results in a wide range of distinct mineral species. The general chemical formula of tourmaline-supergroup minerals is XY3Z6T6O18(BO3)3V3W, where X = Na+, K+, Ca2+, Pb2+, □ (□ = vacancy); Y = Al3+, Fe3+, Cr3+, V3+, Mg2+, Fe2+, Mn2+, Li+; Z = Al3+, Fe3+, Cr3+, V3+, Mg2+, Fe2+; T = Si4+, Al3+, B3+; B = B3+; V = (OH)−, O2−; and W = (OH)−, F−, O2− (Henry et al., 2011). The non-italicized letters X, Y, Z, T and B represent groups of cations accommodated at the [9]X, [6]Y, [6]Z, [4]T and [3]B crystallographic sites (italicized letters). The letters V and W represent groups of anions accommodated at the [3]O(3) and [3]O(1) crystallographic sites, respectively. The H atoms occupy the H(3) and H(1) sites, which are related to O(3) and O(1), respectively.
According to the dominance of specific ions at one or more sites of the crystal structure, the tourmaline-supergroup minerals can be classified in three primary groups based on the X site occupancy: X site vacant, alkali and calcic (Henry et al., 2011). A further level of classification into subgroups is based on charge arrangements at the Y and Z sites. Tourmalines are also distinguished by the dominant W anion into hydroxy, fluor and oxy species (Henry et al., 2011). In particular, the occupancy of the X and Y site is useful to reconstruct the chemical history of the fluids involved in tourmaline crystallization (van Hinsberg et al., 2011a, b; Dutrow and Henry, 2018; Bosi et al., 2022; Altieri et al., 2022, 2023).
The importance of tourmaline as an efficient geological tool for investigating P–T–X conditions in all crustal settings within the Earth was recognized in the early and mid-20th century. This was a consequence of both new and improved instrumentation available for tourmaline investigation and the understanding of tourmaline's utility as an excellent petrogenetic indicator (Henry and Dutrow, 1996; Dutrow and Henry, 2018). In fact, due to its complex crystal structure, which allows incorporating several major and trace elements (Bosi, 2018; Bačík and Fridrichová, 2021), tourmaline retains the evidence for any chemical variation in the crystallization environment during its growth. This record can be preserved within the tourmaline crystal because of its extensive P–T stability range field and the extremely slow diffusion rates of the chemical constituents in the structure (van Hinsberg et al., 2011a). All these features make tourmaline an important mineralogical tool providing information on the chemical evolution of its complex composition.
Tourmalines from the island of Elba (Italy) gained the interest of mineral connoisseurs during the 19th century for the perfection of their crystal shape and the variety of colors displayed (Pezzotta, 2021). The most noteworthy and famous Elba tourmaline variety is represented by the “black cap” crystals (the so-called “Moor's head” textural types), which are typified by transparent yellow-green, olive-green, pink or colorless prismatic sections with sharp transitions to a black color at the analogous terminations (Pezzotta, 2021). Such terminations show a wide range of morphological characteristics: they may occur as a narrow overgrowth with a sharp and lustrous pedion face terminating the crystal or as a thick overgrowth with rough pyramidal faces characterized by a fibrous texture that, occasionally, can be composed of an aggregate of long parallel needles. Furthermore, all intermediate morphological cases may occur. However, in some pegmatitic veins the tourmaline crystal terminations are not simply black, but they are made up of multiple thin growth zones of bluish, greenish, brownish or even purplish-to-reddish colors (Pezzotta, 2021; Bosi et al., 2022; Altieri et al., 2022, 2023). These dark-colored terminations can be generally described as color anomalies.
It is well known that tourmaline crystals are able to register the physicochemical changes in the crystallization environment during their growth (Bosi, 2018). Therefore, it is reasonable to assume that the color anomalies at the analogous termination observed in tourmaline crystals from the island of Elba likely reflect the processes that occurred during the latest stages of crystallization. The opening of the geochemical system caused by late pocket rupture was suggested by several authors (e.g., Foord, 1976; Aurisicchio et al., 1999; Selway et al., 1999; Černý, 2000; Dutrow and Henry, 2000, 2016, 2018; Novák and Taylor, 2000; London, 2006; Buřival and Novák, 2015; Felch et al., 2016), but the true sequence of events that led to chemical changes in the pocket environment and produced the growth of late-stage tourmalines is still unclear. Some authors proposed that fracturing of the pocket may have allowed the introduction of external fluids coming from other regions of consolidated pegmatite. These fluids infiltrated the host rock and modified the chemical environment (e.g., Foord, 1976; Aurisicchio et al., 1999; Selway, 1999; London, 2006). In addition, Dutrow and Henry (2000, 2016, 2018) suggested that external fluids reacted with the host rock and that, in these conditions, tourmaline crystals were altered, with crystallization of a late-stage tourmaline compositionally influenced by the external fluid signature. In contrast, Novák and Taylor (2000) proposed that an internal source of Fe must be considered to explain the origin of Fe-rich late-stage tourmalines. Similarly, Černý (2000) suggested that the chemical change in the cavity system is the result of extensive corrosion, as well as of hydrothermal alteration (Buřival and Novák, 2015), of the cavity-lining minerals of the pegmatitic rock by late-stage fluids developed in the final stages of pegmatite crystallization. Additionally, Felch et al. (2016) observed corrosion and leaching of cavity-lining spessartine garnet crystals as the result of reactions with late-stage hydrothermal fluids originating from adjacent, highly evolved miarolitic cavities. More recently, Altieri et al. (2023) provided clear evidence that in the pegmatites of the island of Elba the chemical changes responsible for the late-stage tourmaline generation are the result of an opening of the geochemical system related to a pocket rupture event, and they proposed a genetic model.
The goal of the present study is to constrain the formation mechanisms of tourmaline color anomalies. The studied tourmaline crystals were collected in different cavities within four representative pegmatitic veins located in the island of Elba. Each crystal was selected to represent a dark overgrowth with a different color and crystal texture. Chemical and spectroscopic investigations on such tourmaline crystals, combined with structural and paragenetic information of the cavities, are used to refine the general genetic model for the color anomalies of island of Elba tourmaline crystals previously proposed by Bosi et al. (2022) and Altieri et al. (2022, 2023).
2.1 The studied samples
Nine tourmaline samples that represent the variety of the color anomalies at the termination of Elba tourmalines were chosen for the present study (Table 1 and Fig. 1). Although the samples “Rosina 2” and “Violet Cap” were characterized in previously studies (Bosi et al., 2022; Altieri et al., 2023), they are included in this work because they are representative of two typical color and texture types.
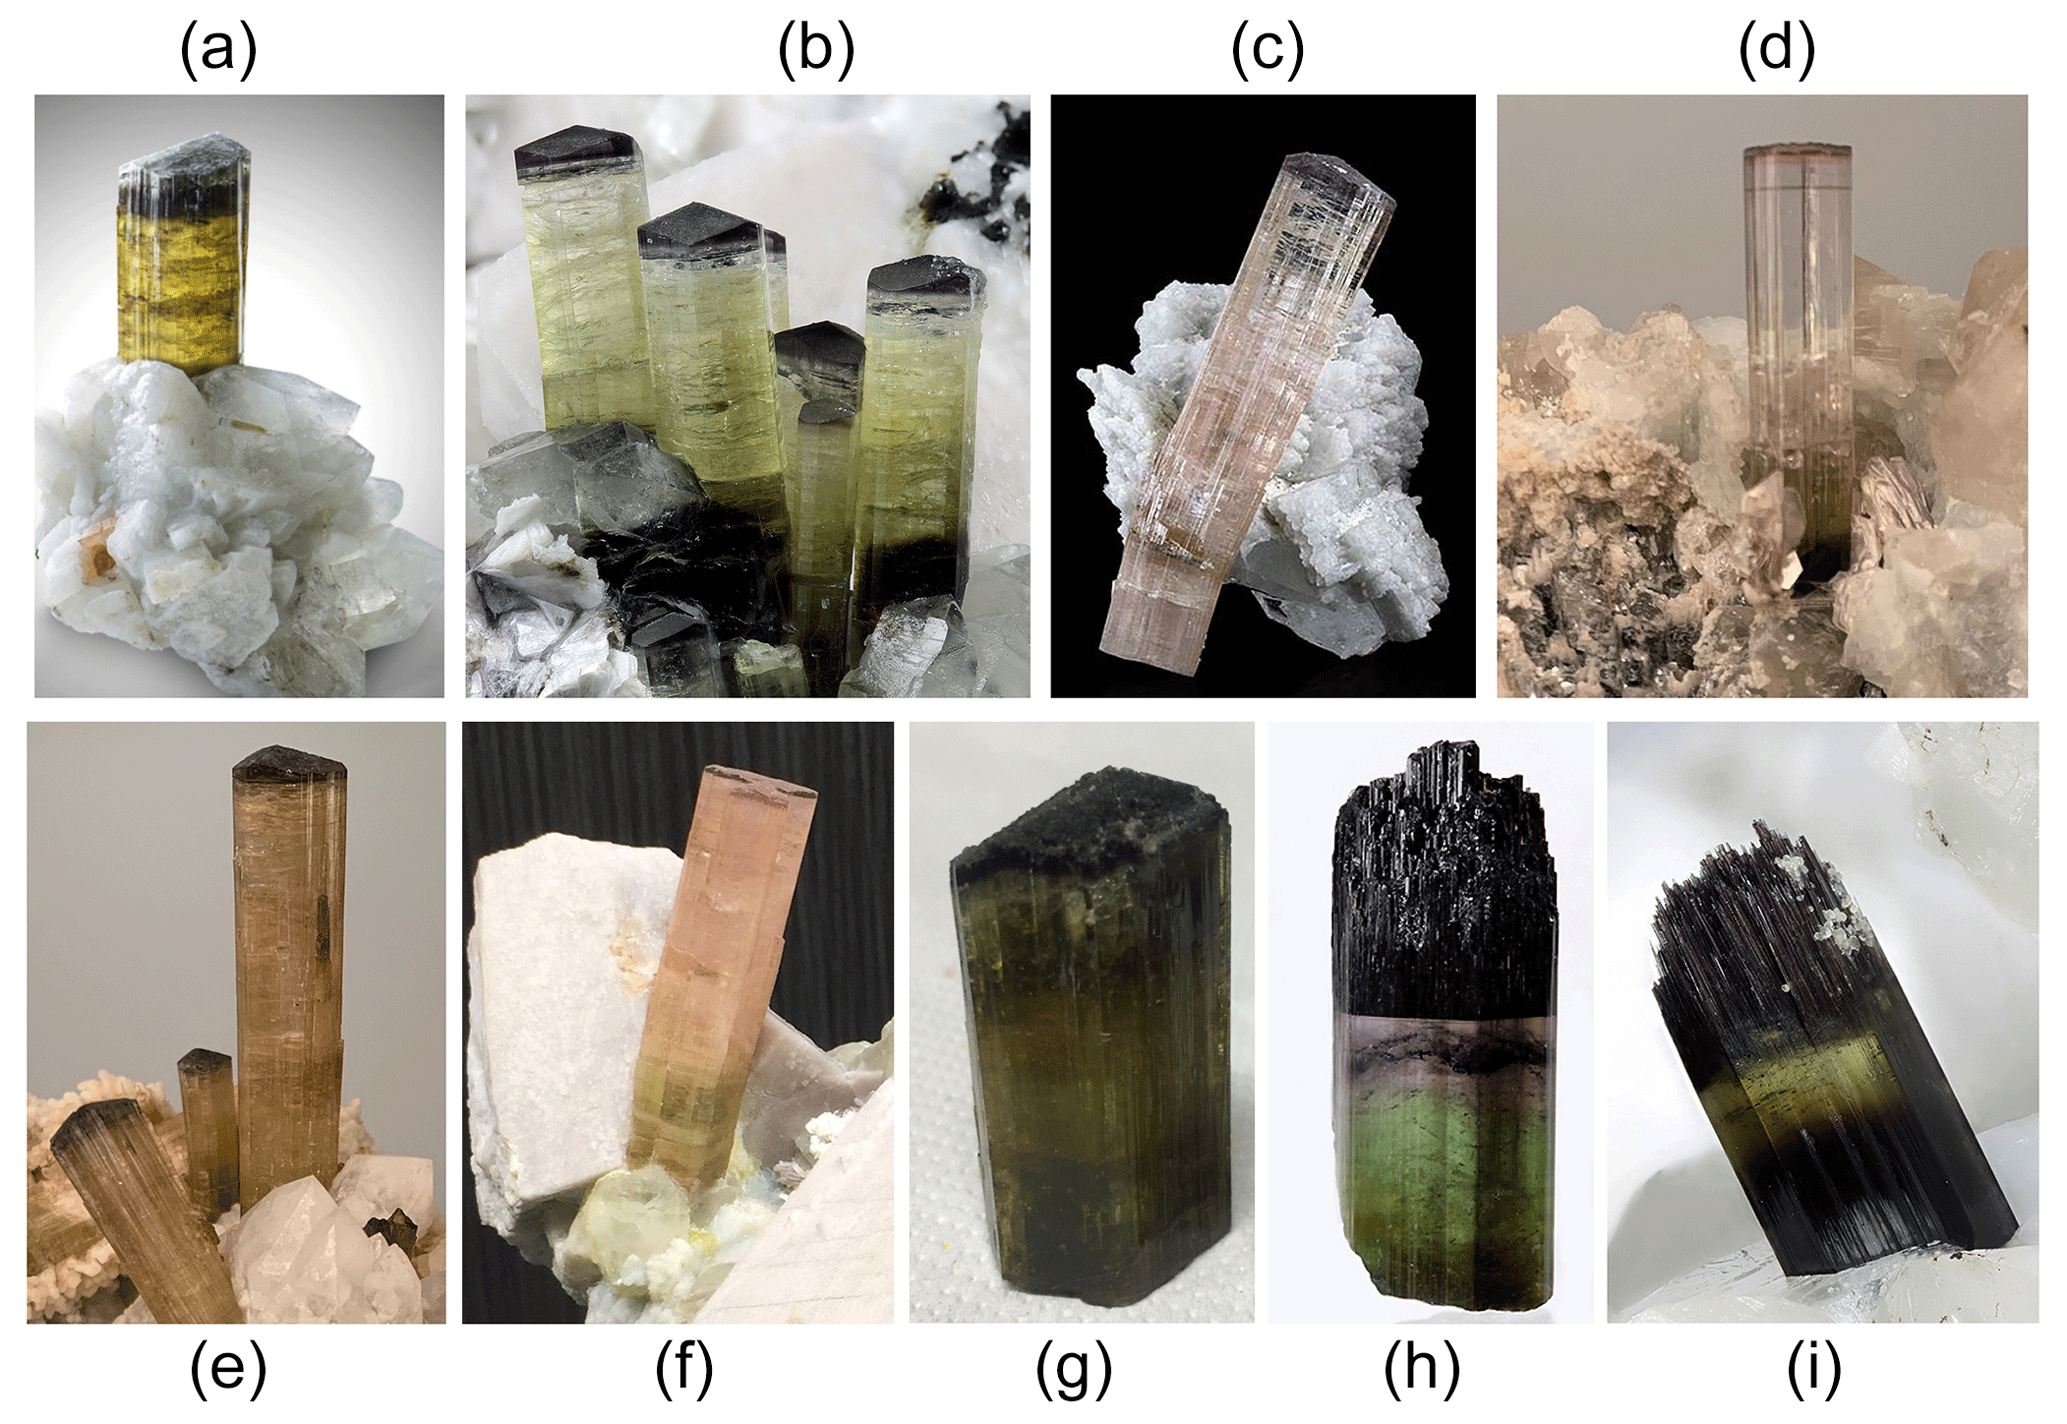
Figure 1The tourmaline samples analyzed for this work. (a) Rosina 2: an olive-green to yellow-green tourmaline crystal characterized by a dark purplish-bluish-gray overgrowth at the analogous pole. Crystal 17 mm tall. Photo by Federico Picciani. (b) Testa Scura: a brownish to light green tourmaline crystal with a thick black overgrowth at the termination. Crystals up to 18 mm. Photo by Matteo Chinellato. (c) Giganti Storti: a pale pink tourmaline crystal with a thin violet termination. Crystal 30 mm across. Photo by Paul Rustemeyer. (d) Testa Rossa: a light green to pink tourmaline crystal characterized by a thin purplish-red overgrowth at the termination. Specimen 90 mm across. Photo by Marco Lorenzoni. (e) Testa Viola: a yellowish brown tourmaline crystal with a thick dark purple termination. Crystal 70 mm across. Photo by Marco Lorenzoni. (f) Violet Cap: a light green to pink tourmaline crystal characterized by a purplish overgrowth at the termination. Specimen 70 mm across. Photo by Federico Pezzotta. (g) San Silvestro: a brownish tourmaline crystal with a thick black termination. Specimen 40 mm across. Photo by Federico Pezzotta. (h) Federico: multi-colored tourmaline crystal from green to light pink with a thick black overgrowth characterized by a fibrous texture. Crystal 30 mm tall. Photo by Matteo Chinellato. (i) Pastori: a brownish to yellow-green tourmaline crystal with a black overgrowth composed of an arrangement of needles. Crystal 12 mm tall. Photo by Matteo Chinellato.
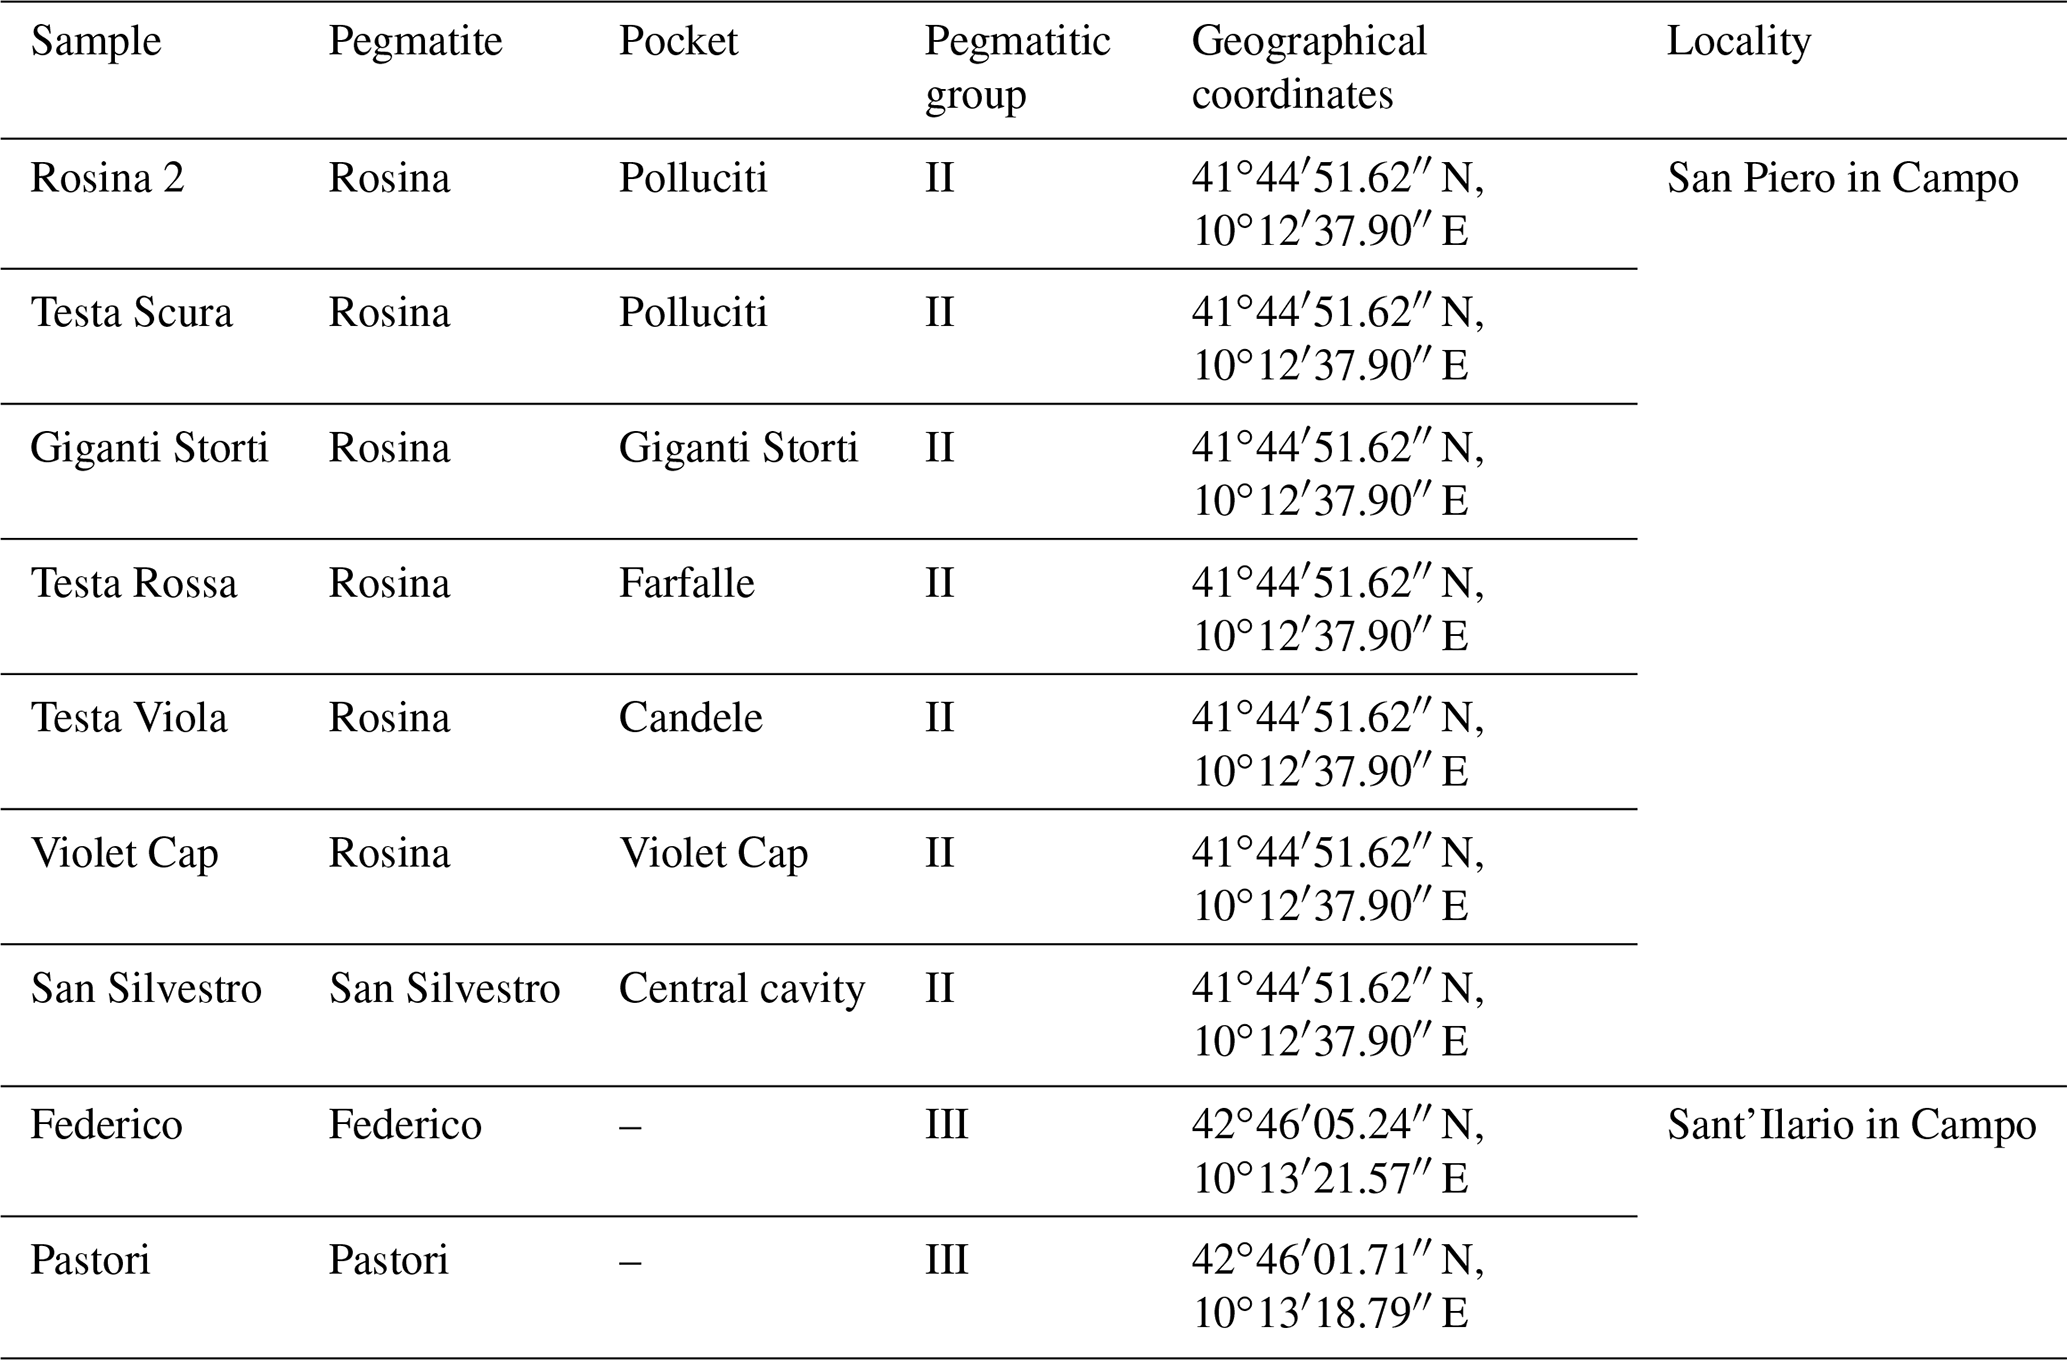
Table 1Occurrence and distribution of the tourmaline samples analyzed for this study (island of Elba, Italy).
2.2 Sample occurrence
The tourmaline crystals analyzed in this work were collected from different miarolitic cavities occurring in the area of the villages of San Piero and Sant'Ilario in Campo within four selected pegmatitic veins distributed along the eastern border of the Monte Capanne pluton (Fig. 2). This pluton, which comprises the western side of the island, is a peraluminous biotite monzogranite intrusion (Dini et al., 2002) formed by the rising of multiple magma pulses (Farina et al., 2010). After the formation of the main pluton, a number of miarolitic Li-bearing aplite–pegmatite dikes were emplaced throughout the intrusion in an area of less than 4 km2 along the eastern side of the Monte Capanne monzogranite pluton (Marinelli, 1959; Pezzotta, 2000).
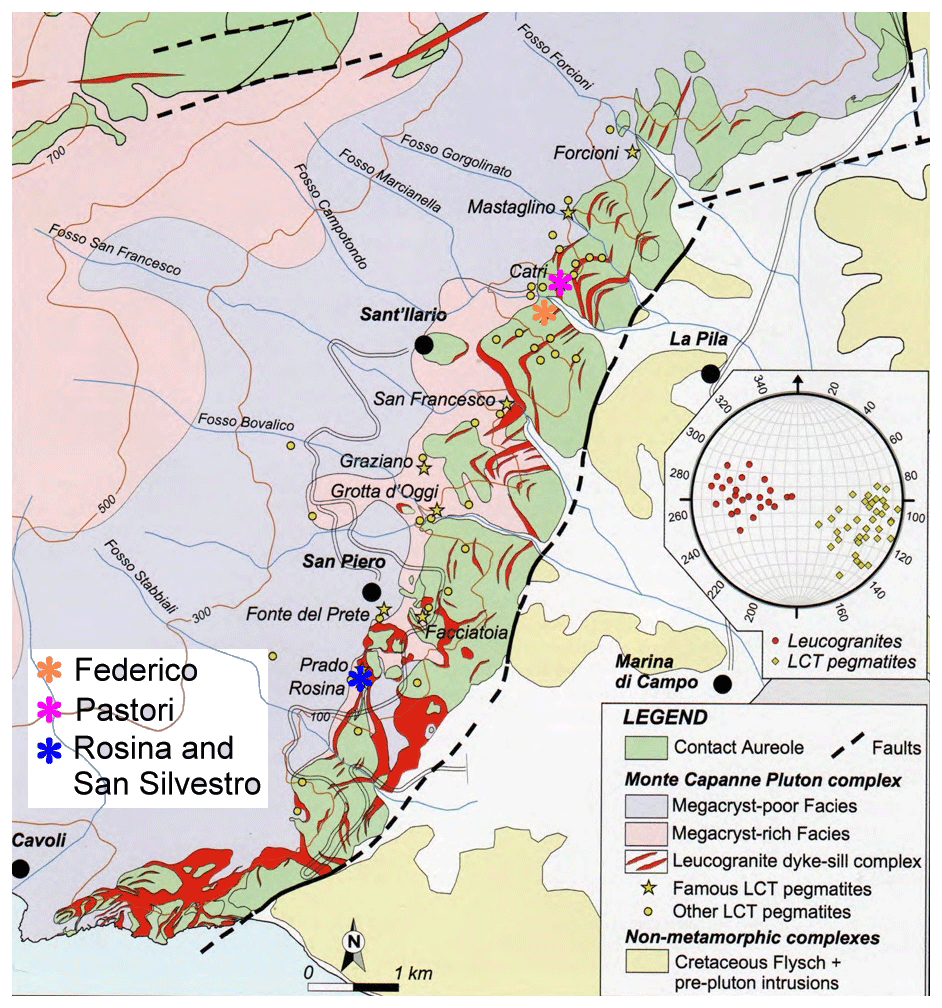
Figure 2Geologic map of the eastern border of Monte Capanne monzogranite pluton. The areas of occurrence of the gem-bearing pegmatites from which the tourmaline samples studied were collected are indicated by the different colored asterisks (modified after Pezzotta, 2021).
The aplitic–pegmatitic veins of Monte Capanne (6.7–6.9 Ma) have been classified in four distinct groups by Pezzotta (2000) based on internal structures, mineralogy and degree of geochemical evolution (Orlandi and Pezzotta, 1996): (I) dikes without Li minerals; (II) Li-mineral-bearing dikes with complex asymmetric textural, mineralogical and geochemical zoning; (III) Li-mineral-bearing dikes with simple asymmetric textural, mineralogical and geochemical zoning; and (IV) irregularly zoned to unzoned Li-mineral-bearing dikes. The degree of geochemical fractionation increases from group I to IV. The less geochemically evolved group I dikes are mostly emplaced within the granitoids of the pluton, and the most evolved group IV dikes are emplaced in the contact metamorphic rocks (metasediments and metaserpentinites) of the aureole.
The studied tourmaline crystals were collected from four pegmatitic veins belonging to group II (Rosina and San Silvestro pegmatites) and III (Federico and Pastori pegmatites).
The Rosina and San Silvestro pegmatites are two parallel aplite–pegmatite veins (approximately 5 m apart), with orientation approximately north–south and a variable dip to the west from 60 to 80∘. Both veins are hosted by monzogranite in the locality of San Piero in Campo and have been extensively mined in the past for mineral specimens (Pezzotta, 2021; Bosi et al., 2022). Of the two bodies, the Rosina pegmatite is by far the larger one. This pegmatite comprises a central section about 10 m long and up to 2 m thick, which has been mined down about 6 m. From this central section, a series of pegmatite strings extend along the emplacement direction in the monzogranite. During the mining activity, the Rosina vein exhibited a large number of elongated or tabular pockets up to ∼ 80 dm3 in volume. The body shows a complex and well-structured internal asymmetric zoning with a mostly aplitic-layered unit at the footwall. The pocket paragenesis ranges from primitive to highly evolved, with euhedral crystals of quartz and feldspars, together with lepidolite, gem tourmaline, beryl, petalite, pollucite and several other accessory minerals (Pezzotta, 2021). The axial core-miarolitic zone divides a medium-grained lower section enriched in albite with minor K-feldspar, quartz, spessartine garnet, and patches of sekaninaite and tourmaline in graphic aggregates with quartz from an upper coarse-grained section enriched in feldspar with minor albite, quartz and graphic to comb-textured tourmaline. Thin radial fractures and features consistent with cavity collapse are evident around the larger pockets. The presence of corroded and altered biotite, sekaninaite, and spessartine garnet in the pegmatitic rock around the cavities, together with albitization of K-feldspar, suggests fluid circulation during the latest stages of evolution of the vein (Orlandi and Pezzotta, 1996; Pezzotta, 2000; Bosi et al., 2022; Altieri et al., 2023).
The San Silvestro pegmatite is very similar to Rosina, but it is smaller, with the central productive section no more than 3.5 m long. In this central section, a large, flat, irregularly oblate pocket of approximately 350 dm3 in volume (2.30 × 0.35 × 0.70 m) was discovered. A “pocket plane” divides the pegmatitic core into a lower and an upper unit, with structures and mineralogy similar to the Rosina pegmatite. Around the “main pocket”, radial microfractures are present, mostly lined with tiny crystals of quartz, albite and dark yellow-green tourmaline. Along such fractures, widespread alteration of biotite crystals and a significant albitization of the K-feldspar are evident (Pezzotta, 2000; Altieri et al., 2022).
The Federico dike and the Pastori dike are both miarolitic and bear Li minerals and are characterized by a simple asymmetric zoning. These dikes strike north and dip about 70 to 80∘ west and are hosted in the porphyritic monzogranite close to the contact with the country rocks of the thermometamorphic aureole in the locality of Sant'Ilario in Campo. Both dikes are 7–8 m long and do not exceed a thickness of 25 cm. Miarolitic cavities are locally abundant. The cavity plane divides the veins in two different units: a mostly medium-grained lower one, rich in albite and typically characterized by tourmaline with comb texture with albite, and a coarse grained upper one, rich in K-feldspar. Mineral assemblages and pocket paragenesis are similar to the highly evolved ones of the group II dikes described above. A remarkable mineral segregation is present in the cavities of such veins, with most of the K-feldspar crystals confined to the roof and most of the albite, together with tourmaline, petalite and pollucite, confined to the base. Two fracturing events can be distinguished in such veins and cavities: a first one, very limited, which is associated with the formation of a dark overgrowth at the termination of the tourmaline crystals, and a second one, more local and dramatic, which is associated with an extensive late-stage corrosion of feldspar and tourmaline and occasionally even quartz (Orlandi and Pezzotta, 1996; Pezzotta, 2000).
2.3 Sample preparation
All tourmaline samples were glued to a glass slide using epoxy resin, with their length parallel to the surface of the slide. A slice of each crystal was cut along the growth direction (crystallographic c axis) and subsequently ground and polished to produce a flat surface with a uniform thickness of 500 µm for chemical microanalysis (Fig. 3).
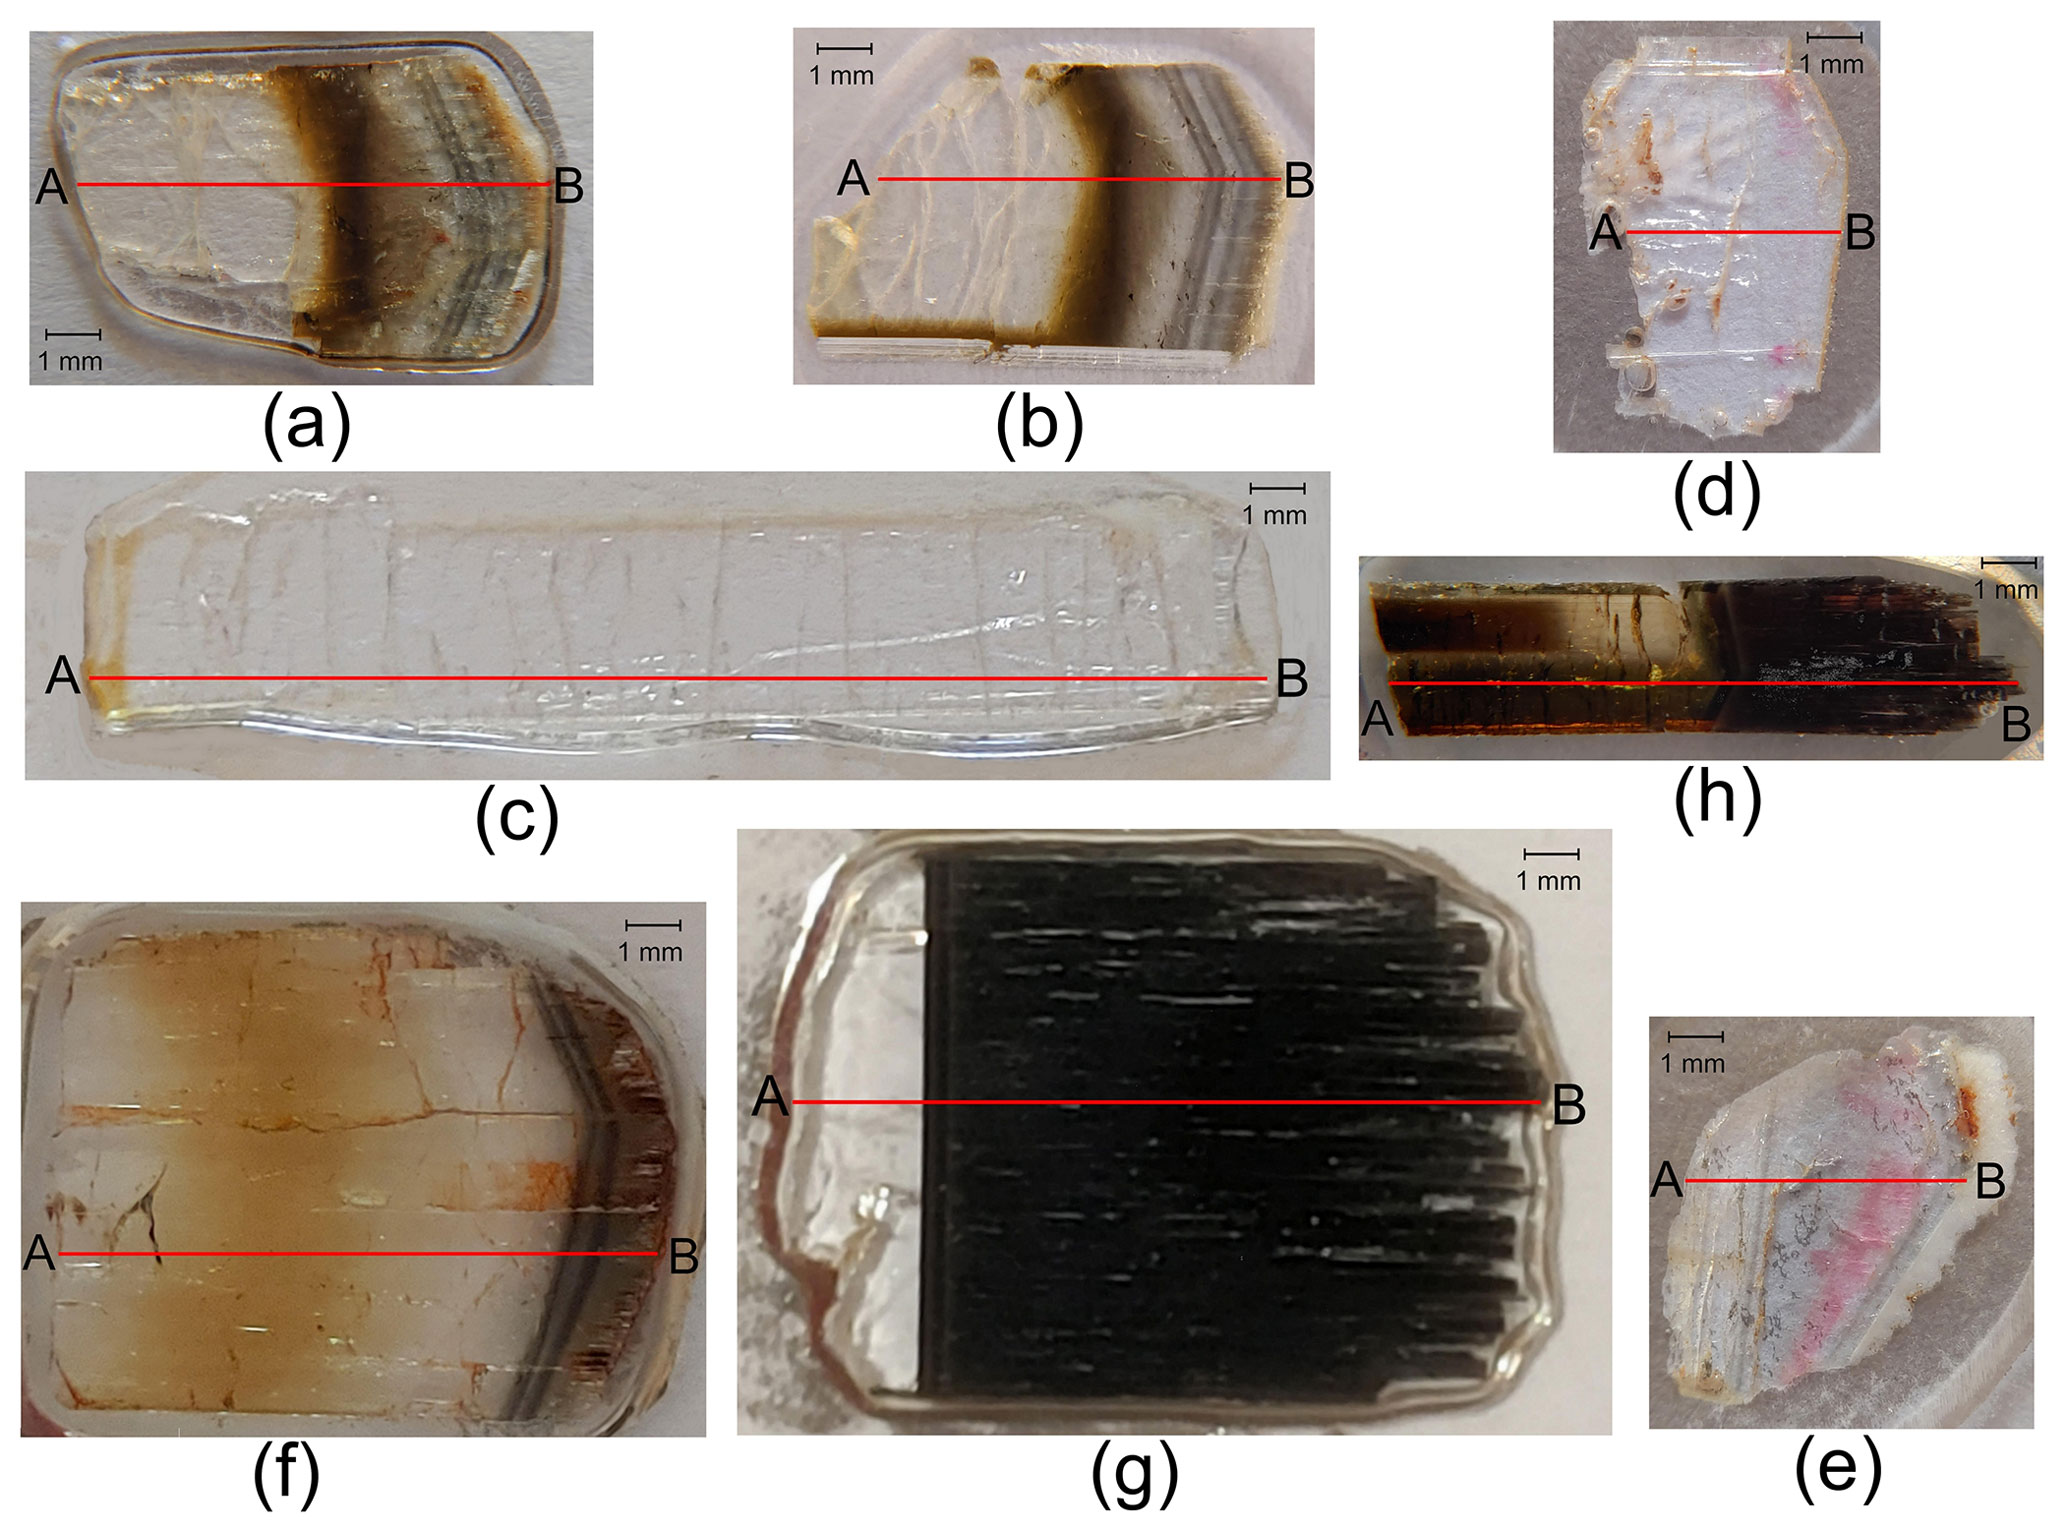
Figure 3Thin sections of the analyzed tourmaline crystals. Compositional data (see Table S1 in the Supplement) were collected along a straight traverse parallel to the c axis from the base to the termination of each crystal (A–B), represented by a solid red line. (a) Rosina 2; (b) Testa Scura; (c) Giganti Storti; (d) Testa Rossa; (e) Testa Viola; (f) San Silvestro; (g) Federico; and (h) Pastori. The thin section of the Violet Cap sample is reported in Altieri et al. (2023).
Based on quantitative chemical data, crystal fragments from zones of the colored overgrowths with significant Fe contents were extracted for Mössbauer spectroscopy analysis. Small amounts (1–2 mg) of the material were finely ground under acetone in an agate mortar, mixed with thermoplastic resin and then shaped to a millimeter-sized cylindrical absorber under mild heating.
2.4 Electron microprobe analysis (EMPA)
Compositional data were collected along a straight traverse parallel to the c axis from the base to the termination of each crystal (Fig. 3) with an average step size of 300 µm, using a CAMECA SX50 electron microprobe (in WDS mode) at the Istituto di Geologia Ambientale e Geoingegneria (Rome, Italy), CNR. EMPA data were acquired operating in wavelength-dispersion mode with an accelerating potential of 15 kV, a sample current of 15 nA and a beam diameter of 10 µm. A total of 334 spot analyses were collected (“Federico”: 24 spots; “Giganti Storti”: 34 spots; “Pastori”: 52 spots; “Rosina 2”: 31 spots; “San Silvestro”: 39 spots; “Testa Rossa”: 19 spots; “Testa Scura”: 30 spots; “Testa Viola”: 22 spots; “Violet Cap”: 87 spots). Minerals and synthetic compounds were used as standards as follows: wollastonite (SiKα, CaKα), magnetite (FeKα), rhodonite (MnKα), rutile (TiKα), corundum (AlKα), karelianite (VKα), fluorphlogopite (FKα), periclase (MgKα), jadeite (NaKα), orthoclase (KKα), sphalerite (ZnKα), and metallic Cr and Cu (CrKα and CuKα). The PAP correction procedure for quantitative electron probe microanalysis was applied (Pouchou and Pichoir, 1991). The relative error in the data was <5 % and detection limits <0.03 wt %.
2.5 Mössbauer spectroscopy (MS)
The 57Fe Mössbauer spectra of the Fe-rich zones of the dark-colored overgrowths in the Federico, Rosina 2 and San Silvestro samples were collected using a conventional spectrometer with a 57Co source of 0.99 GBq (25 mCi) embedded in a Rh matrix at the Earth Sciences Department, Sapienza University of Rome (Italy). The spectra were collected in transmission mode, at room temperature and at velocities between −4 and +4 mm s−1, and recorded in a multichannel analyzer with 512 channels. The velocity was calibrated with a 25 µm thick α-Fe foil. For the Pastori sample, measurements were performed using a conventional spectrometer system equipped with a 10 mCi point source and operated in constant acceleration mode at the Swedish Museum of Natural History (Stockholm, Sweden). The absorber was mounted on strip tape and positioned close (<1 mm) to the tip of the point source. Data were collected at room temperature over the velocity range ±4.2 mm s−1 and recorded in a multichannel analyzer with 1024 channels. The velocity was calibrated with an α-Fe foil. The spectrum obtained from the overgrowth of the Federico, Rosina 2 and San Silvestro samples was fitted to Lorentzian line shapes using the RECOIL 1.04 fitting program (Lagarec and Rancourt, 1998), whereas that of the Pastori sample was fitted using the MossA fitting program (Prescher et al., 2012).
2.6 Determination of site populations
The weight percentage of element oxides determined by EMPA was used to calculate the atomic fractions (atoms per formula unit, apfu). The B content was assumed to be stoichiometric (B = 3.00 apfu). Lithium was calculated in accordance with Pesquera et al. (2016). For the Rosina 2 sample Li content was also determined by μ-LIBS (Bosi et al., 2022), and results obtained are in agreement with the content estimated in the same sector by the procedure of Pesquera et al. (2016). Iron oxidation state in the Fe-rich zones of the dark-colored overgrowths in the Federico, Rosina 2, San Silvestro and Pastori samples was determined by MS. The (OH) content was calculated by charge balance with the assumption of (T + Y + Z) = 15.00 apfu and 31 anions. The site populations and the empirical formulae were calculated following the site allocation of ions recommended by Henry et al. (2011).
3.1 Chemical composition
On the basis of the compositional data and the color displayed, each sample has been divided in compositionally similar zones. For each zone, atoms per formula unit (apfu) were calculated and the relative empirical formula has been determined (Table S2 of the Supplement). Figure 4 displays the pattern of selected elements (as wt % oxides) determined along the considered traverse for each tourmaline sample.
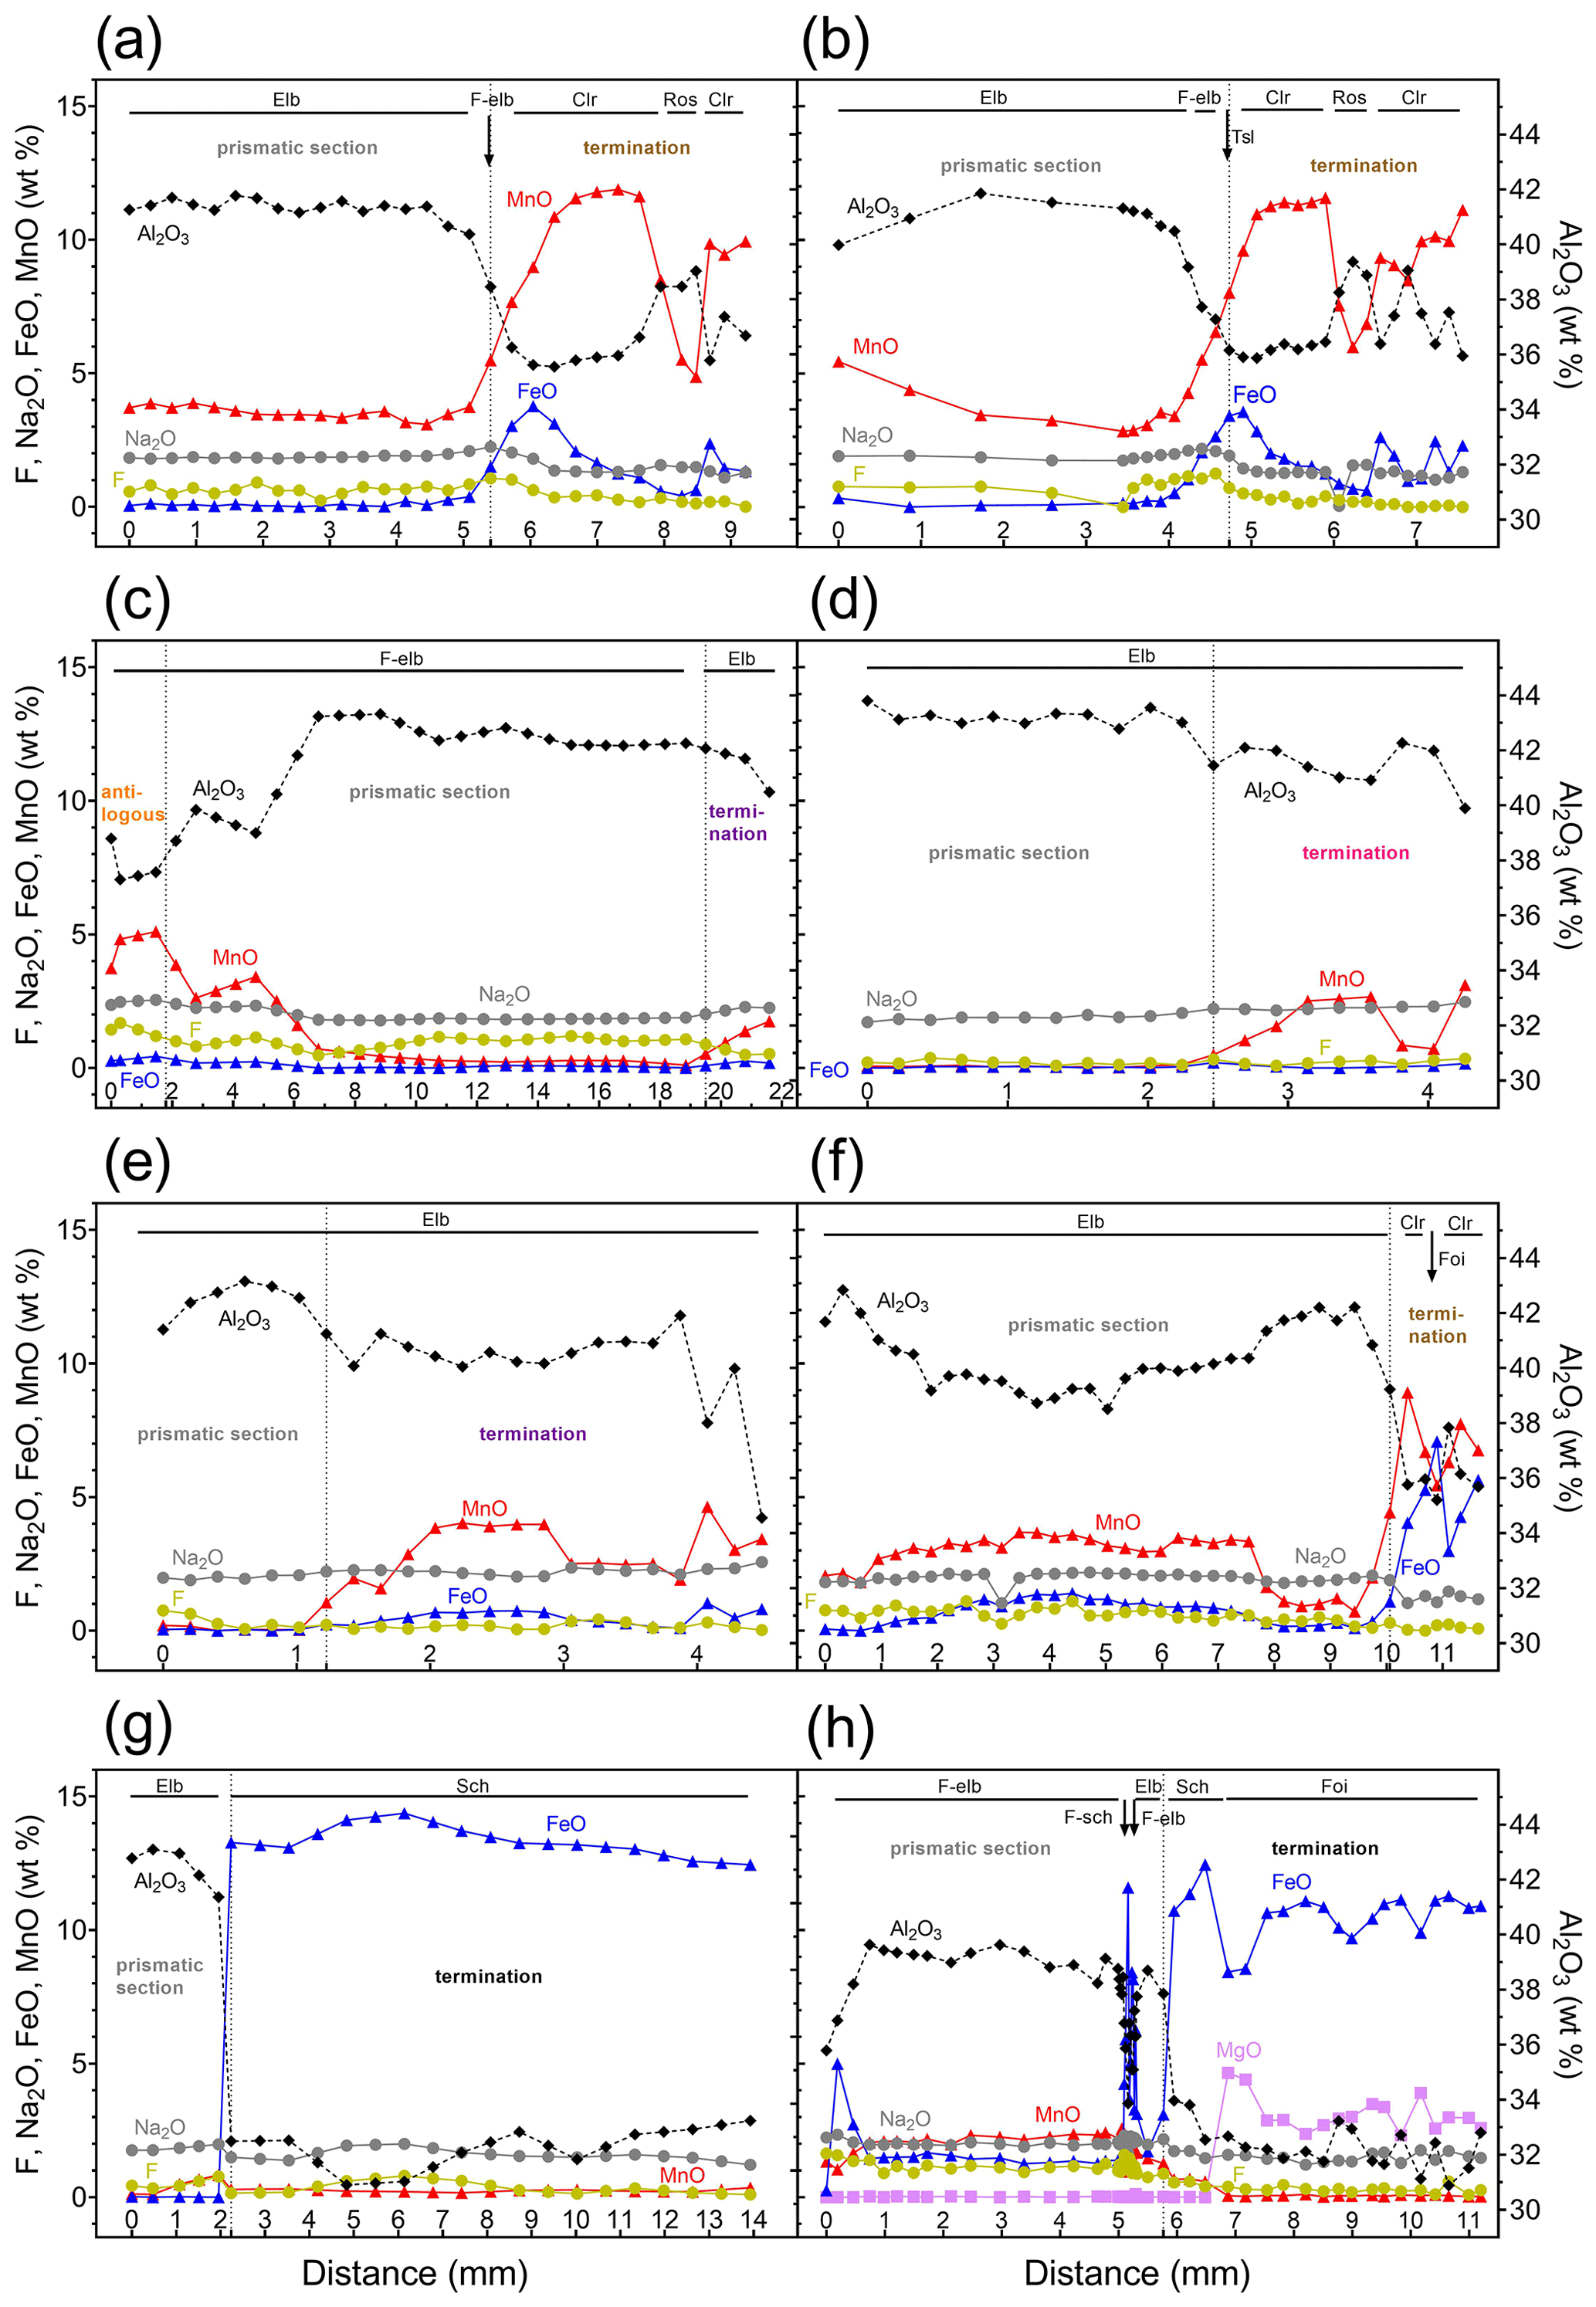
Figure 4Results of compositional analysis of the studied tourmaline samples obtained along a straight traverse parallel to the c axis (only selected oxides are reported). (a) Rosina 2; (b) Testa Scura; (c) Giganti Storti; (d) Testa Rossa; (e) Testa Viola; (f) San Silvestro; (g) Federico; and (h) Pastori. Abbreviations: Elb signifies elbaite, F-elb signifies F-elbaite, Tsl signifies tsilaisite, Clr signifies celleriite, Ros signifies rossmanite, Sch signifies schorl, F-sch signifies F-schorl, and Foi signifies foitite. Compositional analysis of the Violet Cap sample is reported in Altieri et al. (2023). See Table S1 for complete chemistry.
In general, chemical analysis revealed that the termination of each crystal is characterized by a significant increase in Mn and/or Fe that is responsible for the color variation at the analogous pole. As expected, in the tourmaline crystals with the most significant Mn and/or Fe increase at the termination (MnO > 5 wt % and FeO > 2 wt %), the color variation is more enhanced, and the species changes from initial elbaite/fluor-elbaite, Na(Li1.5Al1.5)Al6Si6O18(BO3)3(OH)3(OH,F), to celleriite, foitite or schorl. Such chemical evolution is clearly evident in the Rosina 2, Testa Scura and San Silvestro samples (Fig. 4a, b, f), where the increase in Mn over Fe resulted in the formation of celleriite, □(MnAl)Al6(Si6O18)(BO3)3(OH)3(OH). In contrast, in the Pastori and Federico samples, the increase in Fe over Mn resulted in the formation of foitite, □(FeAl)Al6(Si6O18)(BO3)3(OH)3(OH), and schorl, NaFeAl6(Si6O18)(BO3)3(OH)3(OH), respectively (Fig. 4g, h).
In most of the studied samples, the MnO and FeO content at the dark-colored termination follows a rhythmic behavior, and, in some cases, this oscillatory pattern led to an alternation of either celleriite and rossmanite or celleriite and foitite compositions (Fig. 5). In Fig. 6 all compositional data are summarized that confirm an increase in Mn and/or Fe at the analogous termination, which is more evident in samples in which the chemical environment had evolved.
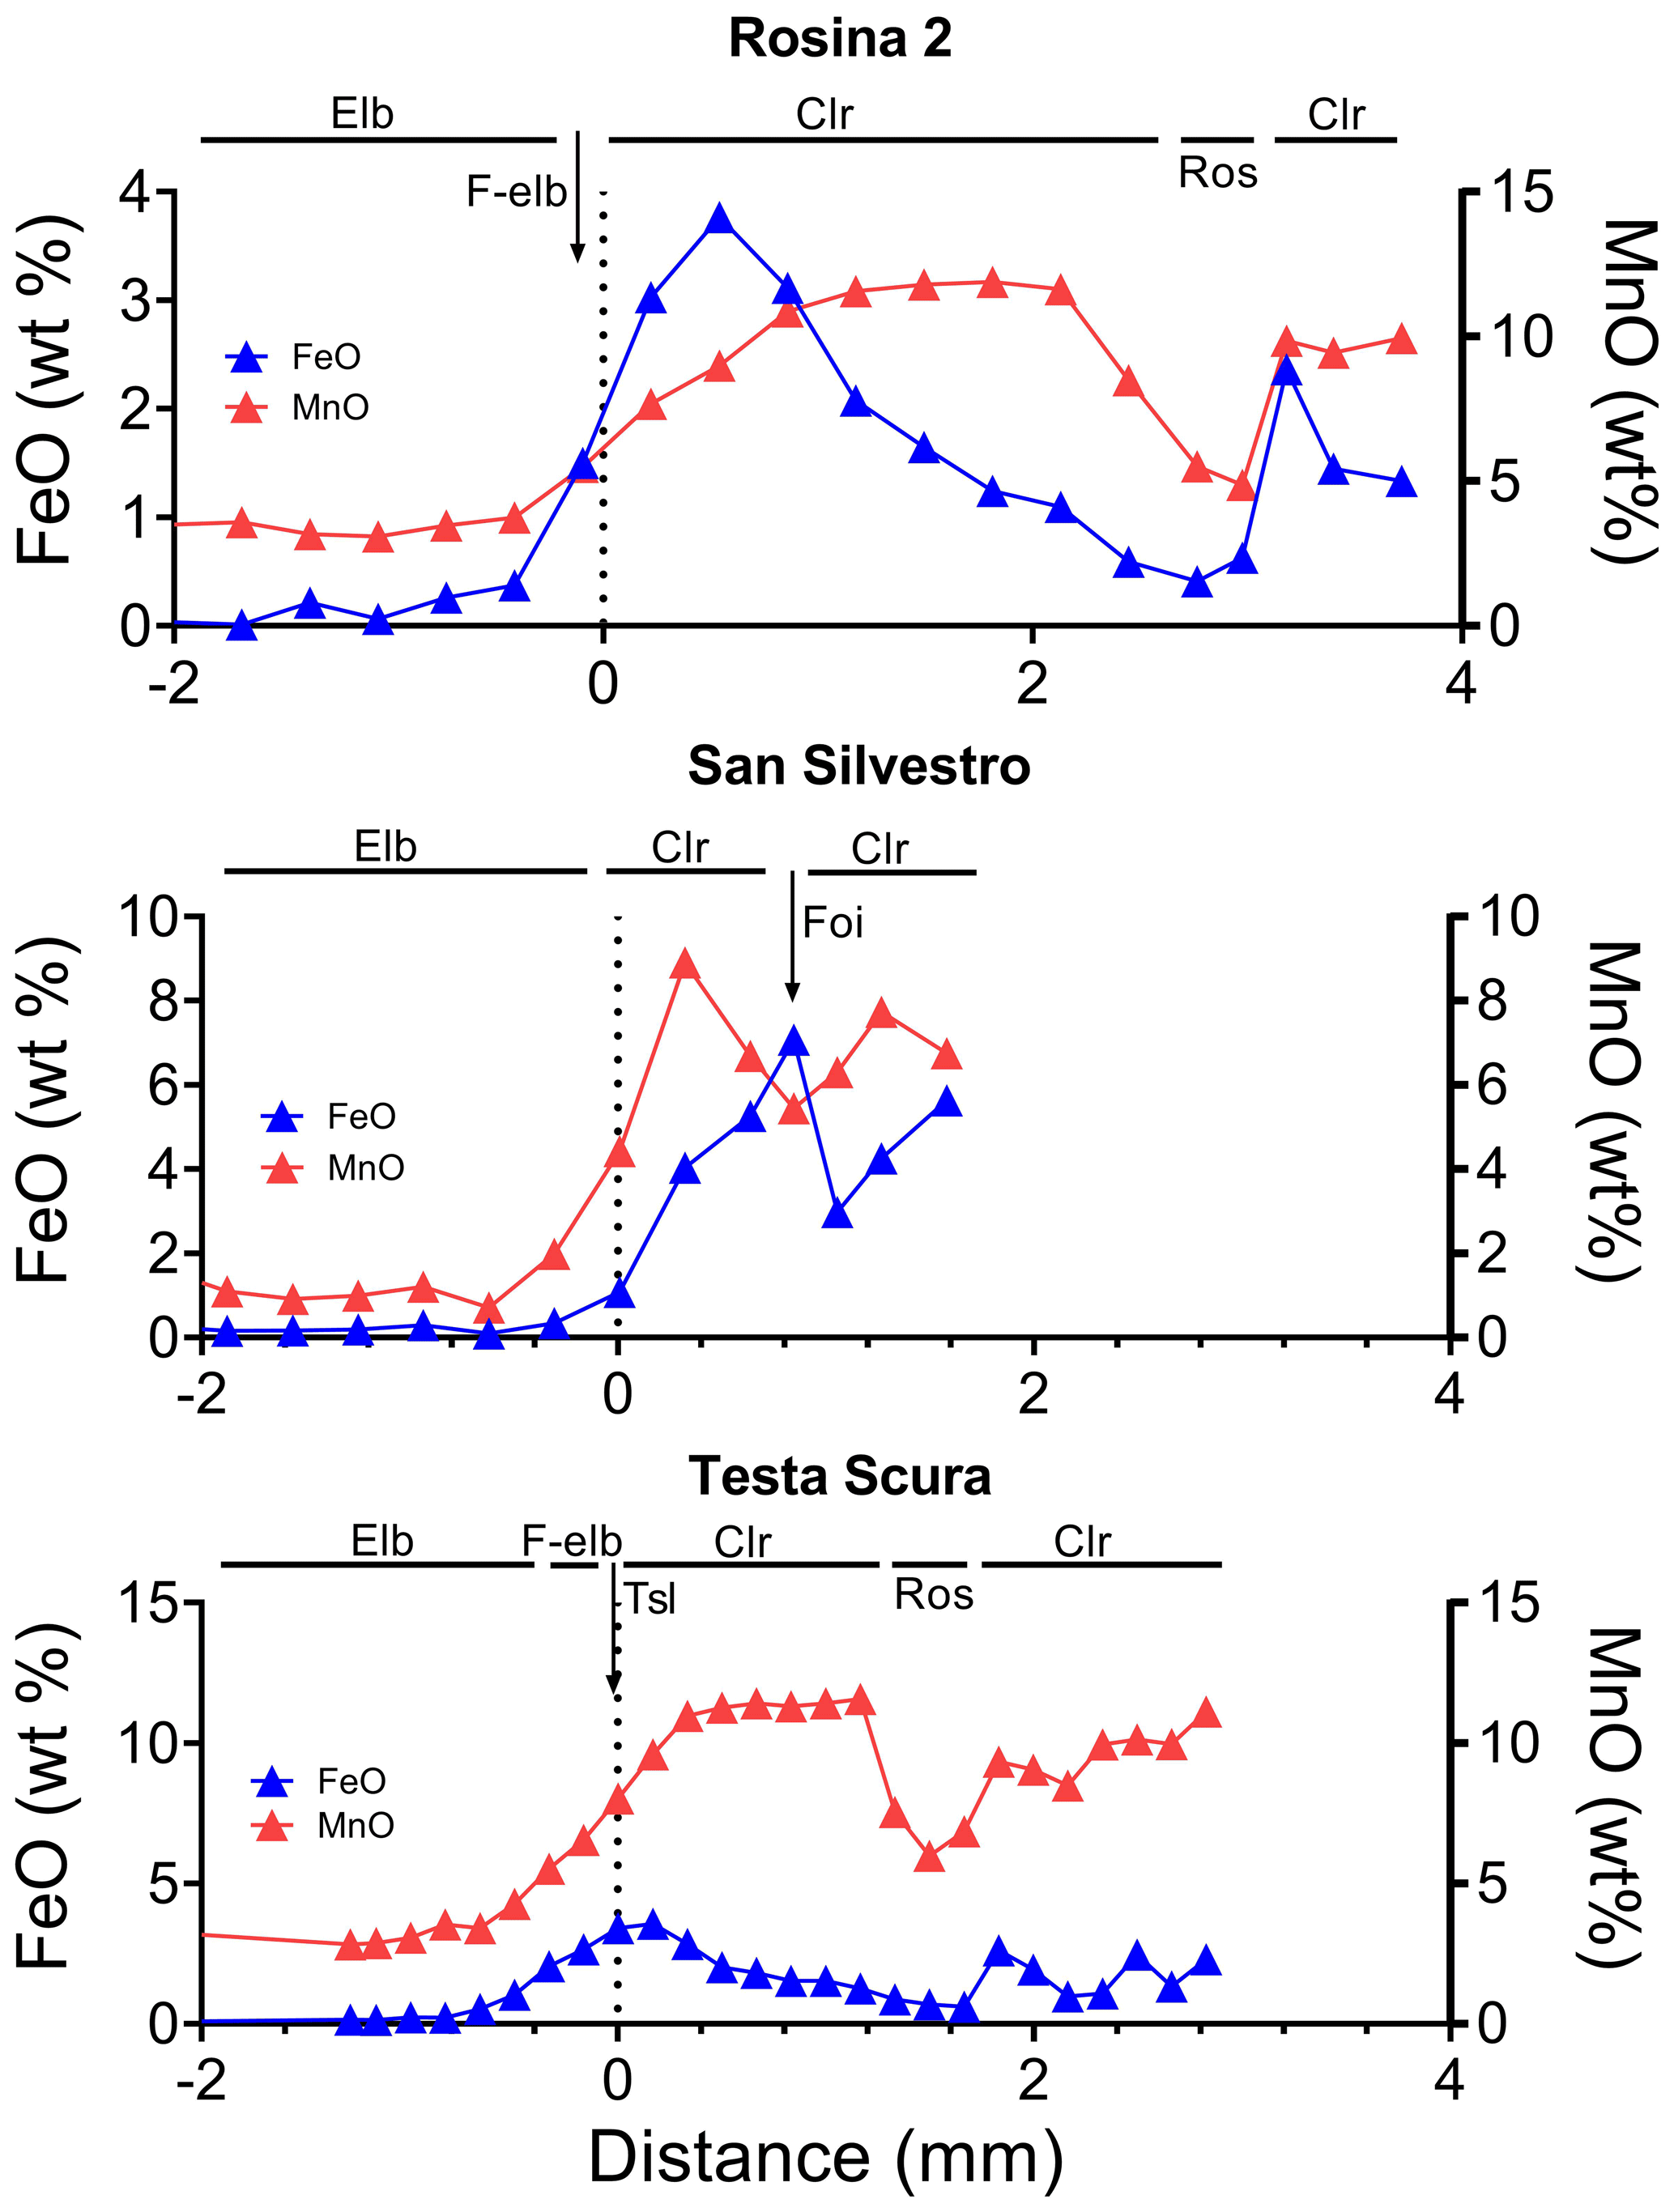
Figure 5Variation in MnO and FeO (wt %) along a straight traverse parallel to the c axis of Rosina 2, San Silvestro and Testa Scura tourmaline crystals from the upper section to the dark termination. The dashed line marks the transition between the upper section and the dark-colored termination of the crystals. Abbreviations: Elb signifies elbaite, F-elb signifies F-elbaite, Tsl signifies tsilaisite, Clr signifies celleriite, Ros signifies rossmanite, and Foi signifies foitite.
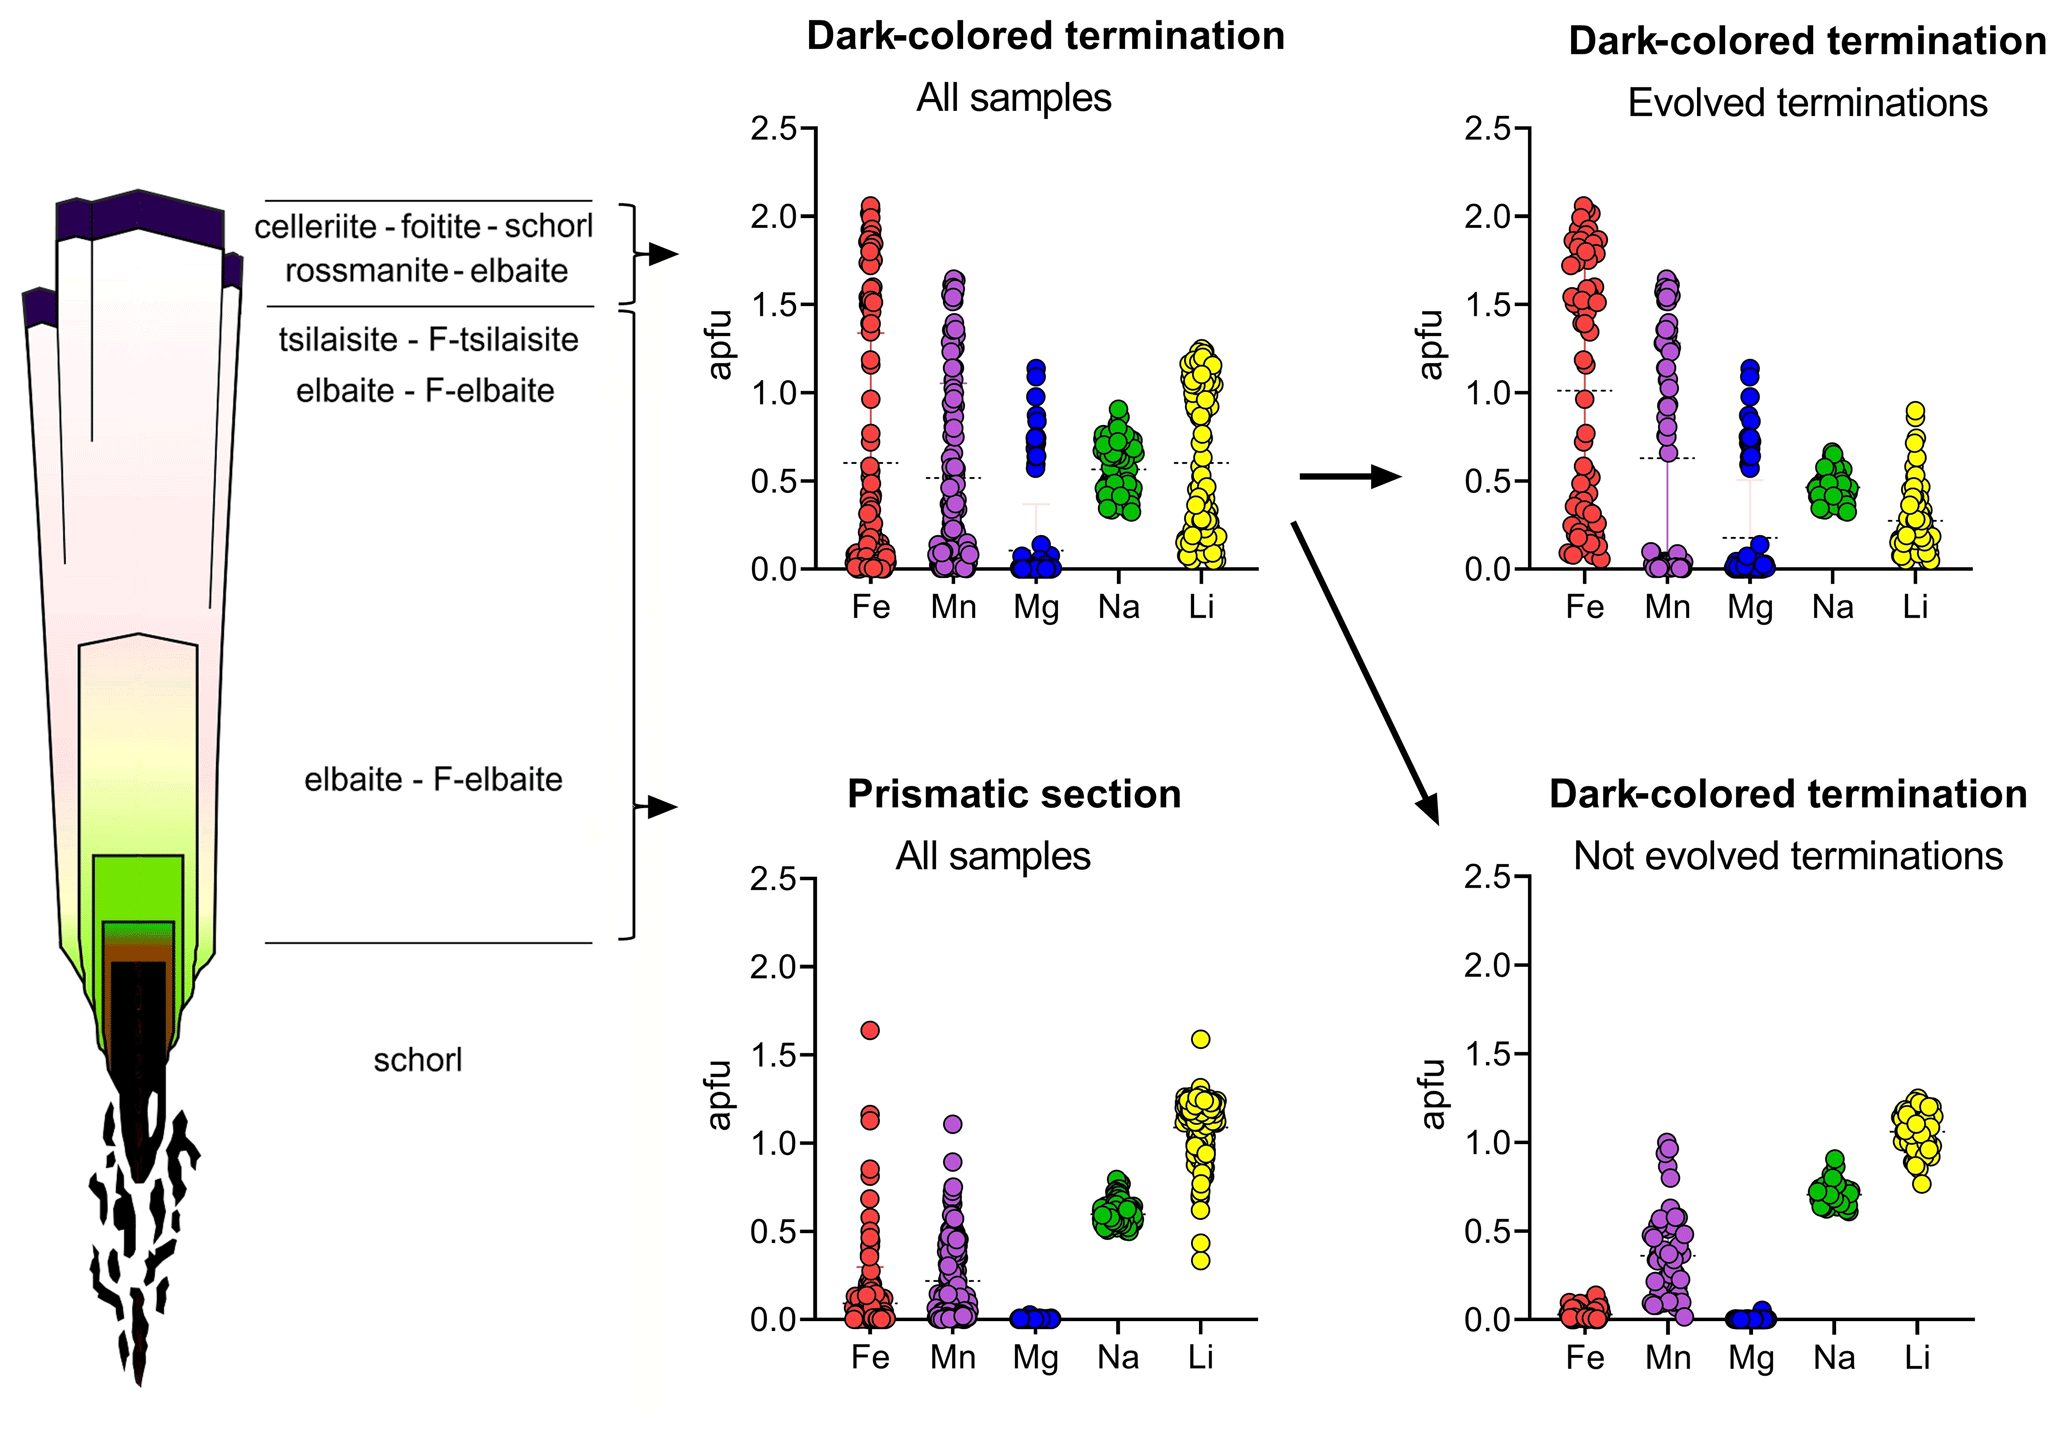
Figure 6Compositional variations in typical tourmaline crystals from Elba pegmatites. The representative abundances of Fe, Mn, Mg, Na and Li (apfu) are reported for the prismatic sections and the dark-colored terminations. Each point represents the result of a spot analysis (about 400 in total). The horizontal dotted line marks the mean value.
The full dataset of chemical data relative to all tourmaline samples analyzed is available in the Supplement (Table S1).
3.2 MS data and iron speciation
Portions of the dark-colored overgrowths of the Federico, Rosina 2, San Silvestro and Pastori samples, characterized by the highest Fe content, were subjected to MS analysis to evaluate the Fe redox state. The obtained spectra were deconvoluted using Lorentzian doublets, and their hyperfine parameters were interpreted according to the model described in Andreozzi et al. (2008). The hyperfine parameters of MS doublets and the relative Fe oxidation state and site assignment for each sample analyzed are summarized in Table 2. The spectrum of the Federico sample has been accurately fitted with three doubles consistent with Fe2+ at the Y site. No indication of absorption due to Fe3+ was observed (Fig. 7a). For the San Silvestro and Pastori samples, a different model with four absorption doublets was adopted. The first three doublets were interpreted as Fe2+ at the Y site (Y1, Y2 and Y3), while the fourth doublet is consistent with Fe3+ (5 % and 4 % of Fetot for the San Silvestro and Pastori samples, respectively) (Fig. 7b, c). For the Rosina 2 sample, the Fe oxidation state and site assignment are similar to the San Silvestro and Pastori samples, with most of Fe2+ at the Y site (87 % of Fetot) and a small amount of Fe3+ assigned to the Y site (4 % of Fetot) (Bosi et al., 2022). However, the Rosina 2 sample is characterized by the presence of Fe2+ at the Z site (9 % of Fetot), which can be explained by the preferential occupation of the Y site by Mn2+ over Fe2+ (e.g., Bosi, 2018). In fact, as reported above by EMPA, the dark-colored Fe-rich portion of the Rosina 2 overgrowth is characterized by the highest Mn concentration (MnO ∼ 9 wt %). Because the ratio in all the tourmaline samples analyzed is ≤ 0.05, very low-oxidizing conditions during the late-stage crystal growth of the Federico, Rosina 2, San Silvestro and Pastori samples can be inferred.
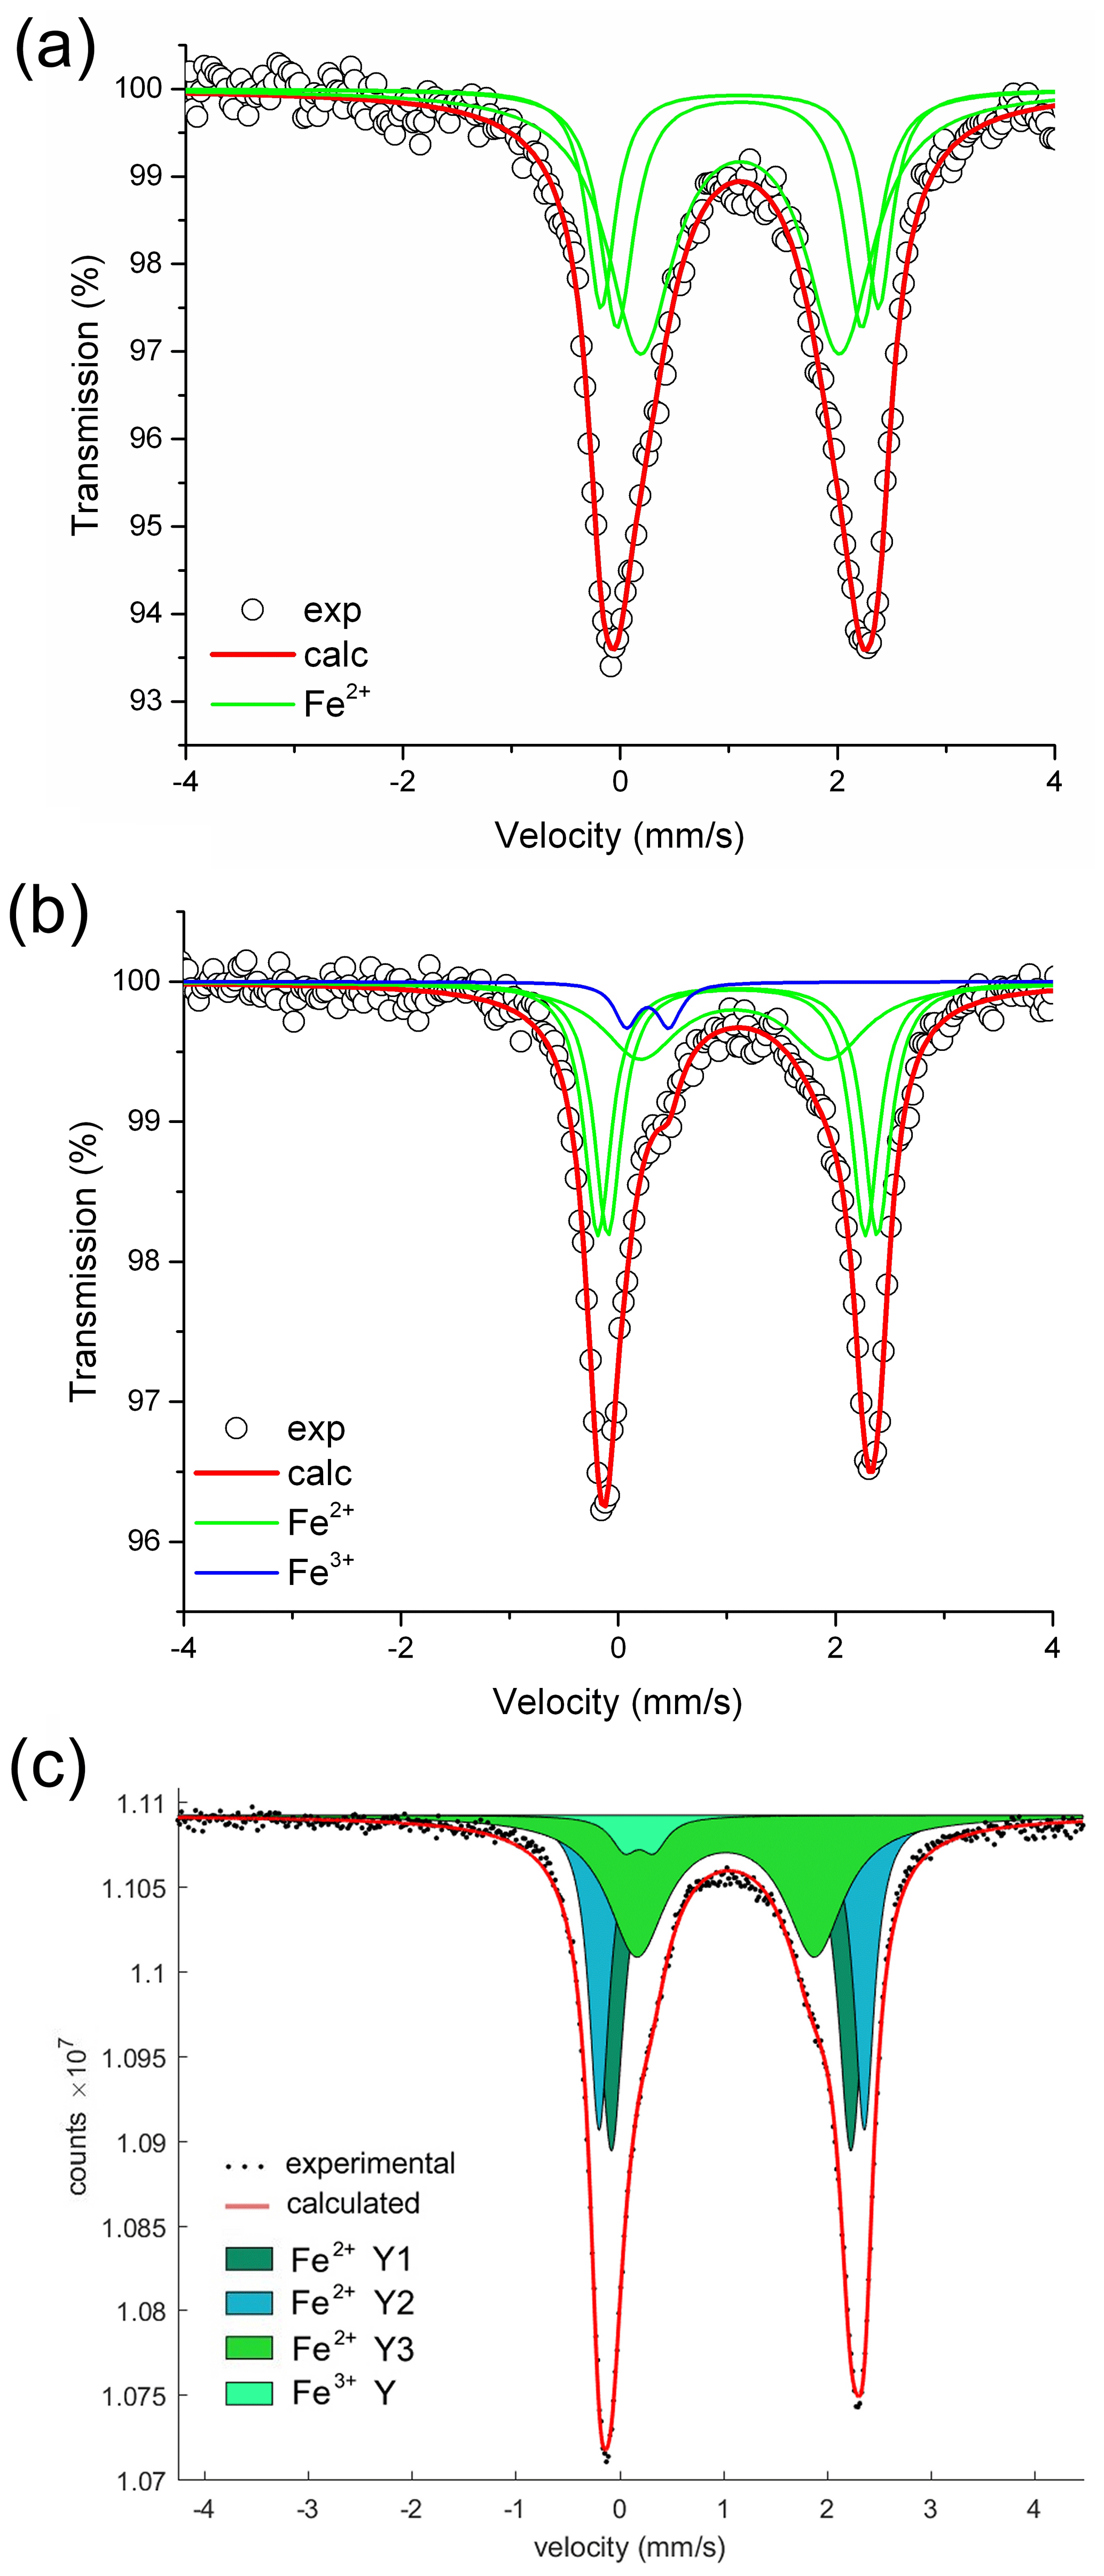
Figure 7Room temperature 57Fe Mössbauer spectra for the dark-colored overgrowths of the Federico, San Silvestro and Pastori samples. For the Federico and San Silvestro samples (a, b), the experimental spectrum (exp) is represented by open circles and the calculated spectrum (calc) by the thick red curve. Lorentzian absorption doublets assigned to [6]Fe2+ are represented by thin green lines, whereas the absorption doublet assigned to [6]Fe3+ is represented by the thin blue line. For the Pastori sample (c), the experimental spectrum (exp) is represented by dots and the calculated spectrum (calc) by the thick red curve. Lorentzian absorption doublets assigned to [6]Fe2+ are represented by dark green, light blue and light green colored areas. The neon-green colored area refers to the assignment of [6]Fe3+.
Table 2Room temperature 57Fe Mössbauer parameters for FeO-rich portions of the dark-colored overgrowths in selected tourmaline samples.
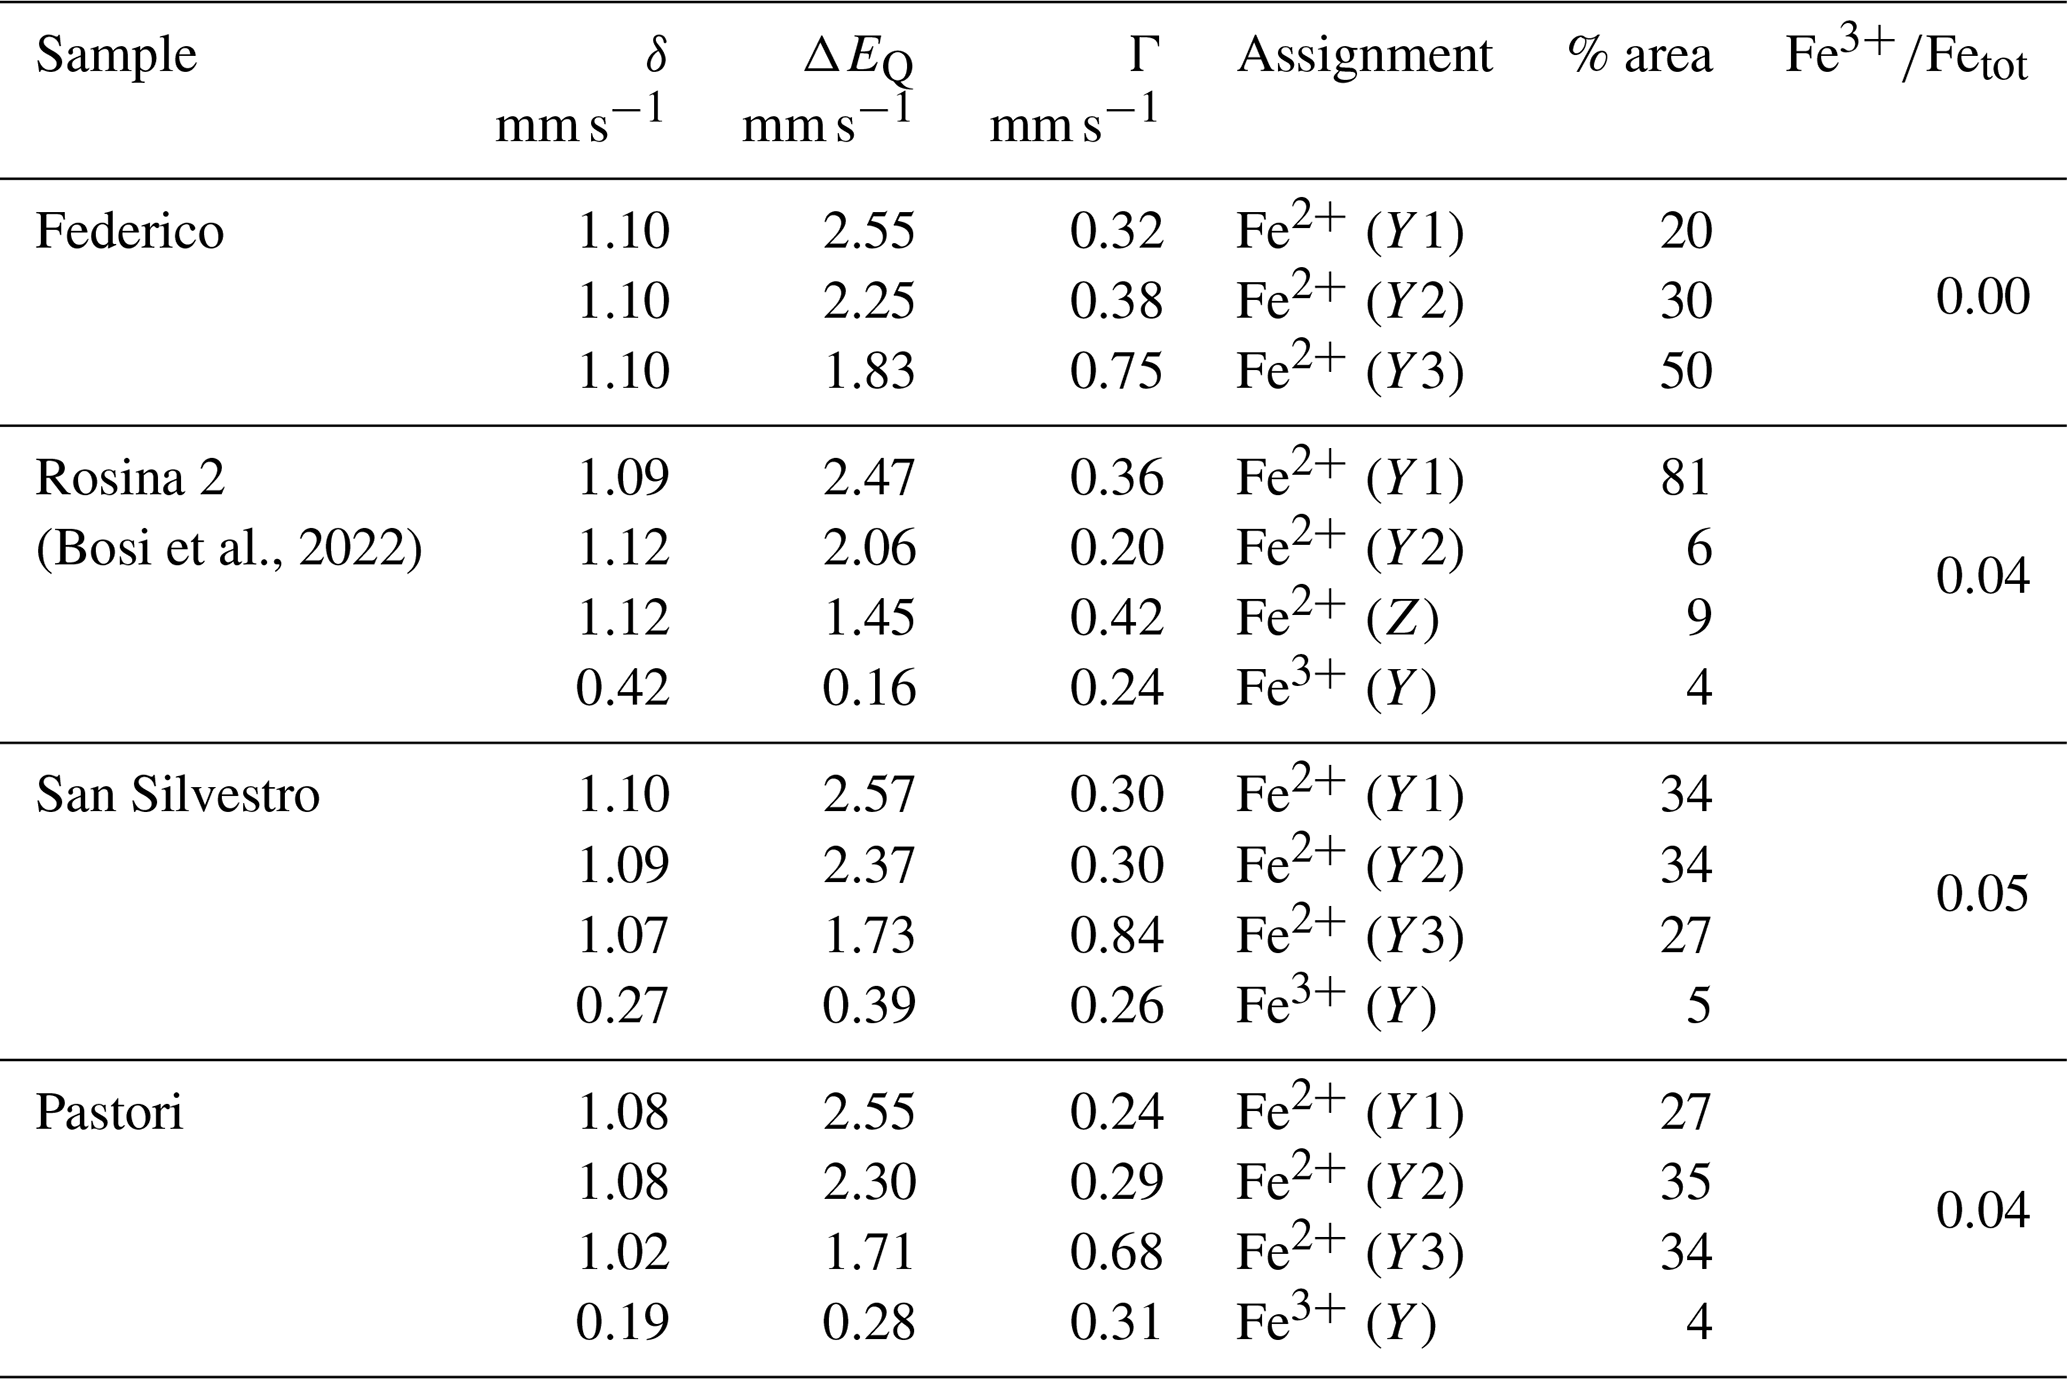
Centroid shift (δ; in mm s−1) relative to α-Fe foil; errors are estimated to be no less than ±0.02 mm s−1 for δ, quadrupole splitting (ΔEQ) and peak width (Γ) and no less than ±3 % for doublet areas. Site assignment is based on Andreozzi et al. (2008).
Overall, EMPA data reveal a dramatic increase in Mn and Fe in the analogous termination of all analyzed tourmaline crystals, in some cases with MnO up to >5 wt % and FeO up to >2 wt %. This increase is responsible for both the color anomalies and the chemical evolution of tourmaline. Such an abrupt increase in Mn and/or Fe suggests that a significant chemical variation in the crystallization environment occurred, with a new supply of Fe and/or Mn during the latest stages of tourmaline growth.
In the studied samples, the increase in Mn and Fe is consistent with the substitution of Li and Al at the Y site. However, this substitution can occur in different ways according to whether Mn and Fe totally or partially replace Li and Al. The total substitution of Li and Al by Mn/Fe is
and the partial substitutions of Li and Al by Mn/Fe are
To gain information about which kind of substitution occurred during the chemical evolution of the samples studied, the content of 2Li vs. (Mn + Fe) at the Y site, calculated for each data point, was plotted. As shown in Fig. 8, the left part of the graph is mainly occupied by data points corresponding to chemically evolved species. Interestingly, compositional data are preferentially distributed along a trend line corresponding to a partial substitution with a total charge variation at the Y site (Eq. 2), indicating that this is the most favored type of substitution in the crystals from the island of Elba. As this substitution determines a total charge variation, it needs to be balanced by the incorporation of cation vacancies replacing Na at the X site:
In support of this simplified mechanism, Na at the X site and WOH calculated for each data point were plotted (Fig. 9). It can be observed that most of the data points corresponding to the evolved termination are characterized by a low content of Na at the X site and a higher content of WOH. In fact, WOH is structurally more compatible with a cation vacancy at the X site for electrostatic reasons (Bosi, 2010, 2018).
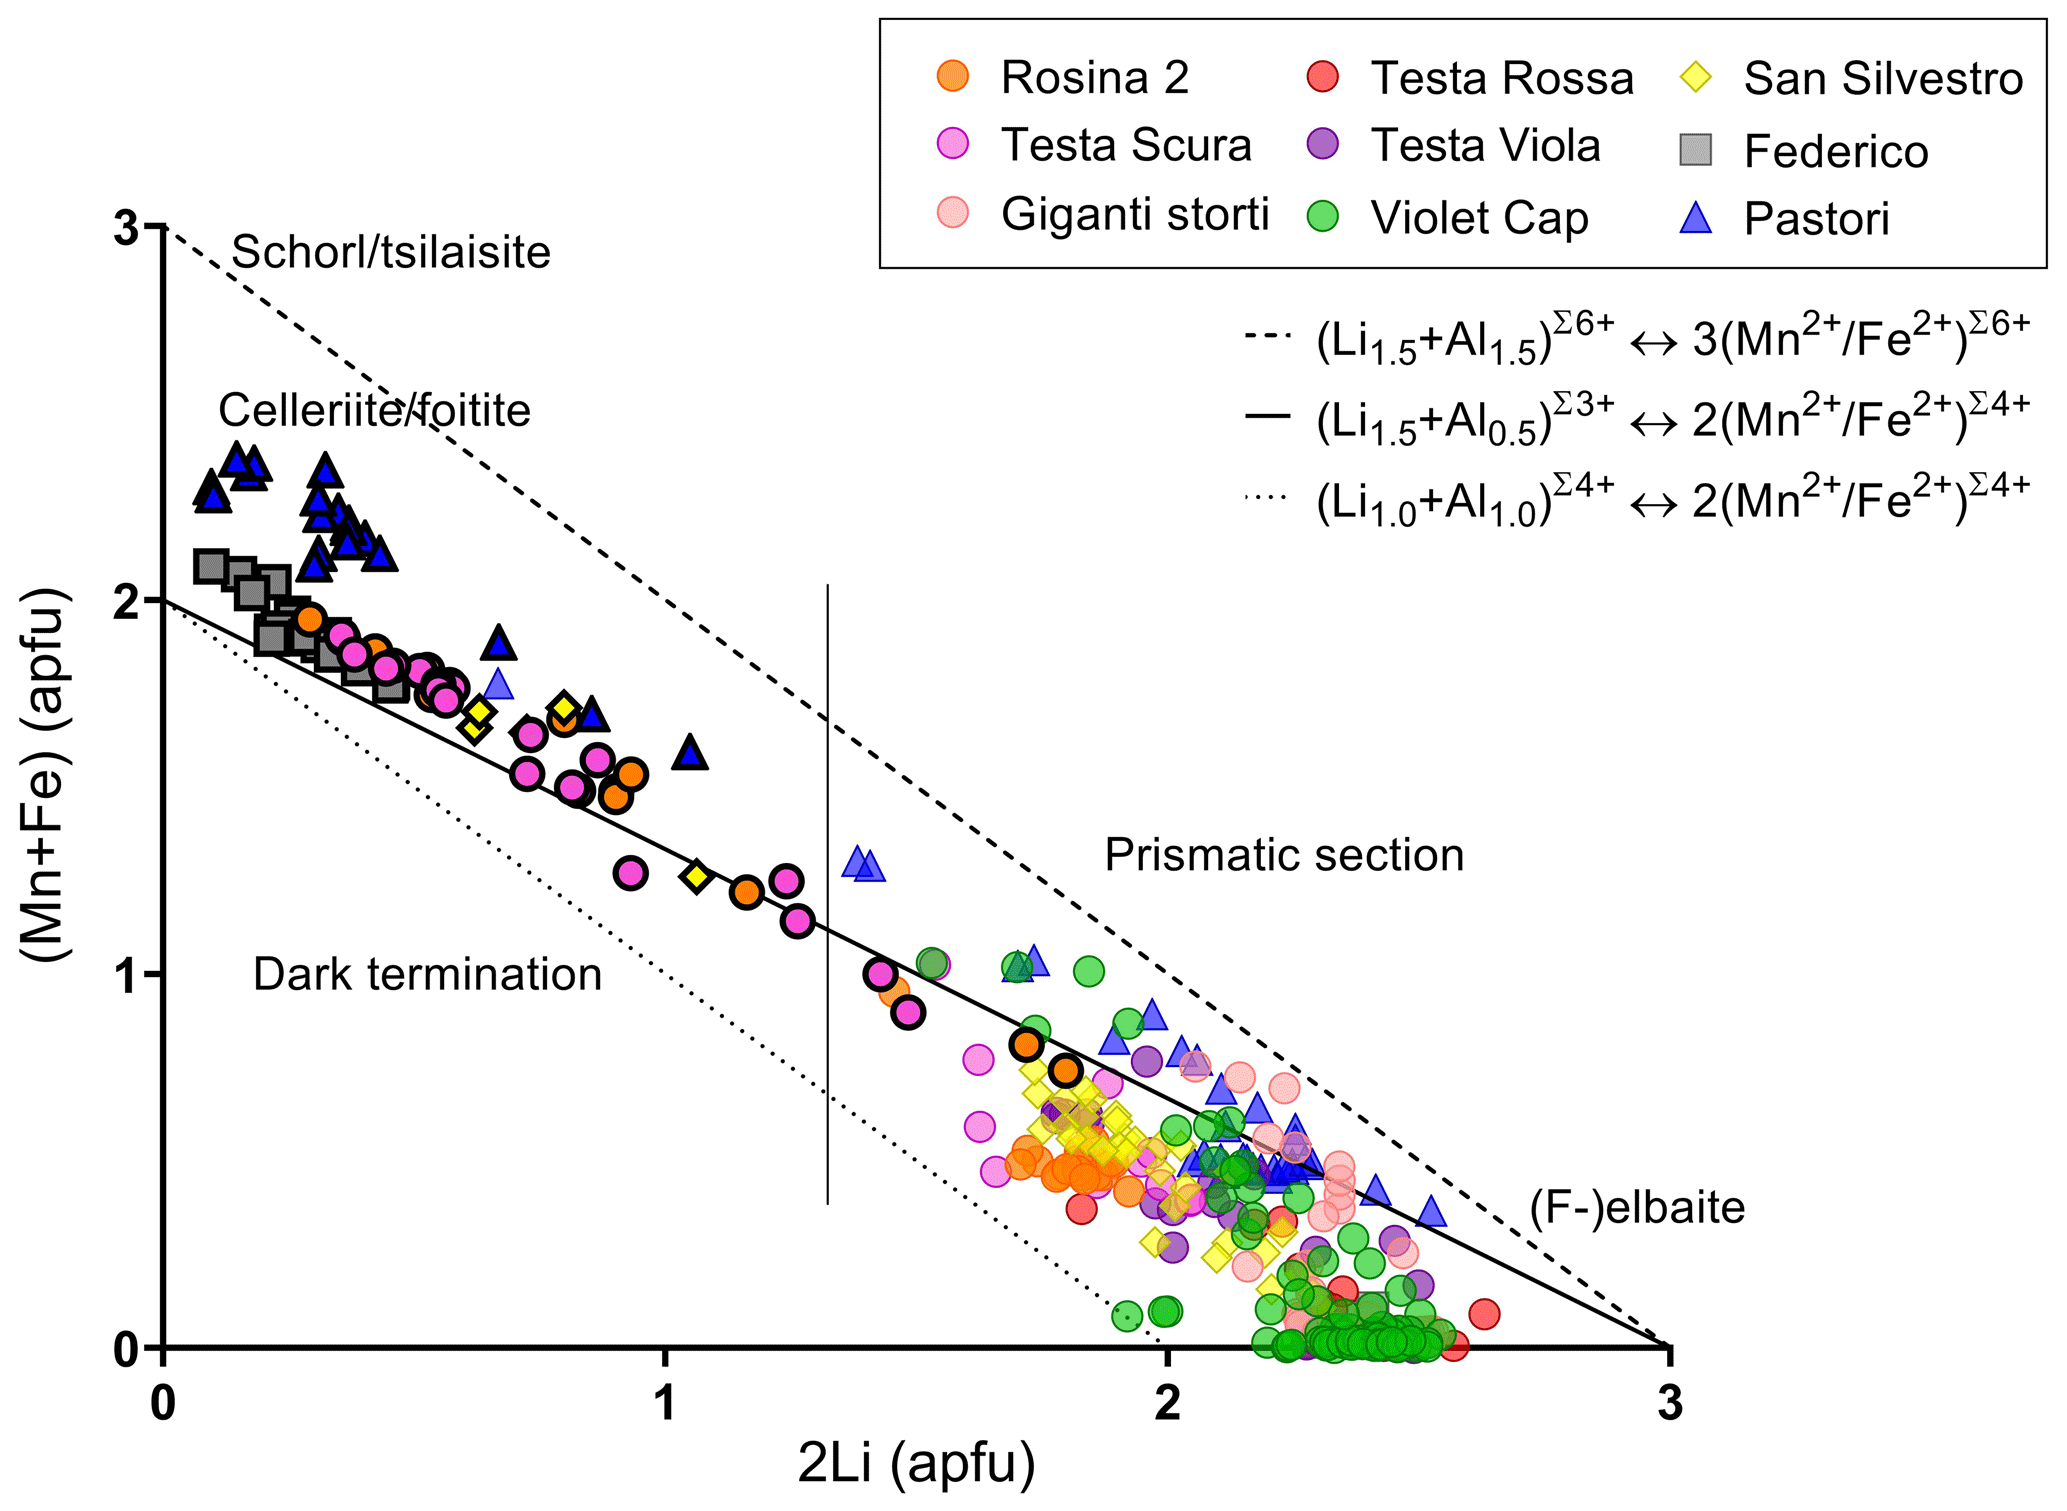
Figure 8Plot of the content of 2Li vs. (Mn + Fe) at the Y site for each spot analysis of the tourmaline samples studied. The three lines (dashed, dotted and full) represent different degrees of substitution. Symbols with black border indicate the compositions relative to the dark terminations of the different samples. For the Pastori sample the Mg content was also considered. The vertical line distinguishes the compositions occurring at the crystal dark terminations (left) from those occurring in the prismatic sections (right).
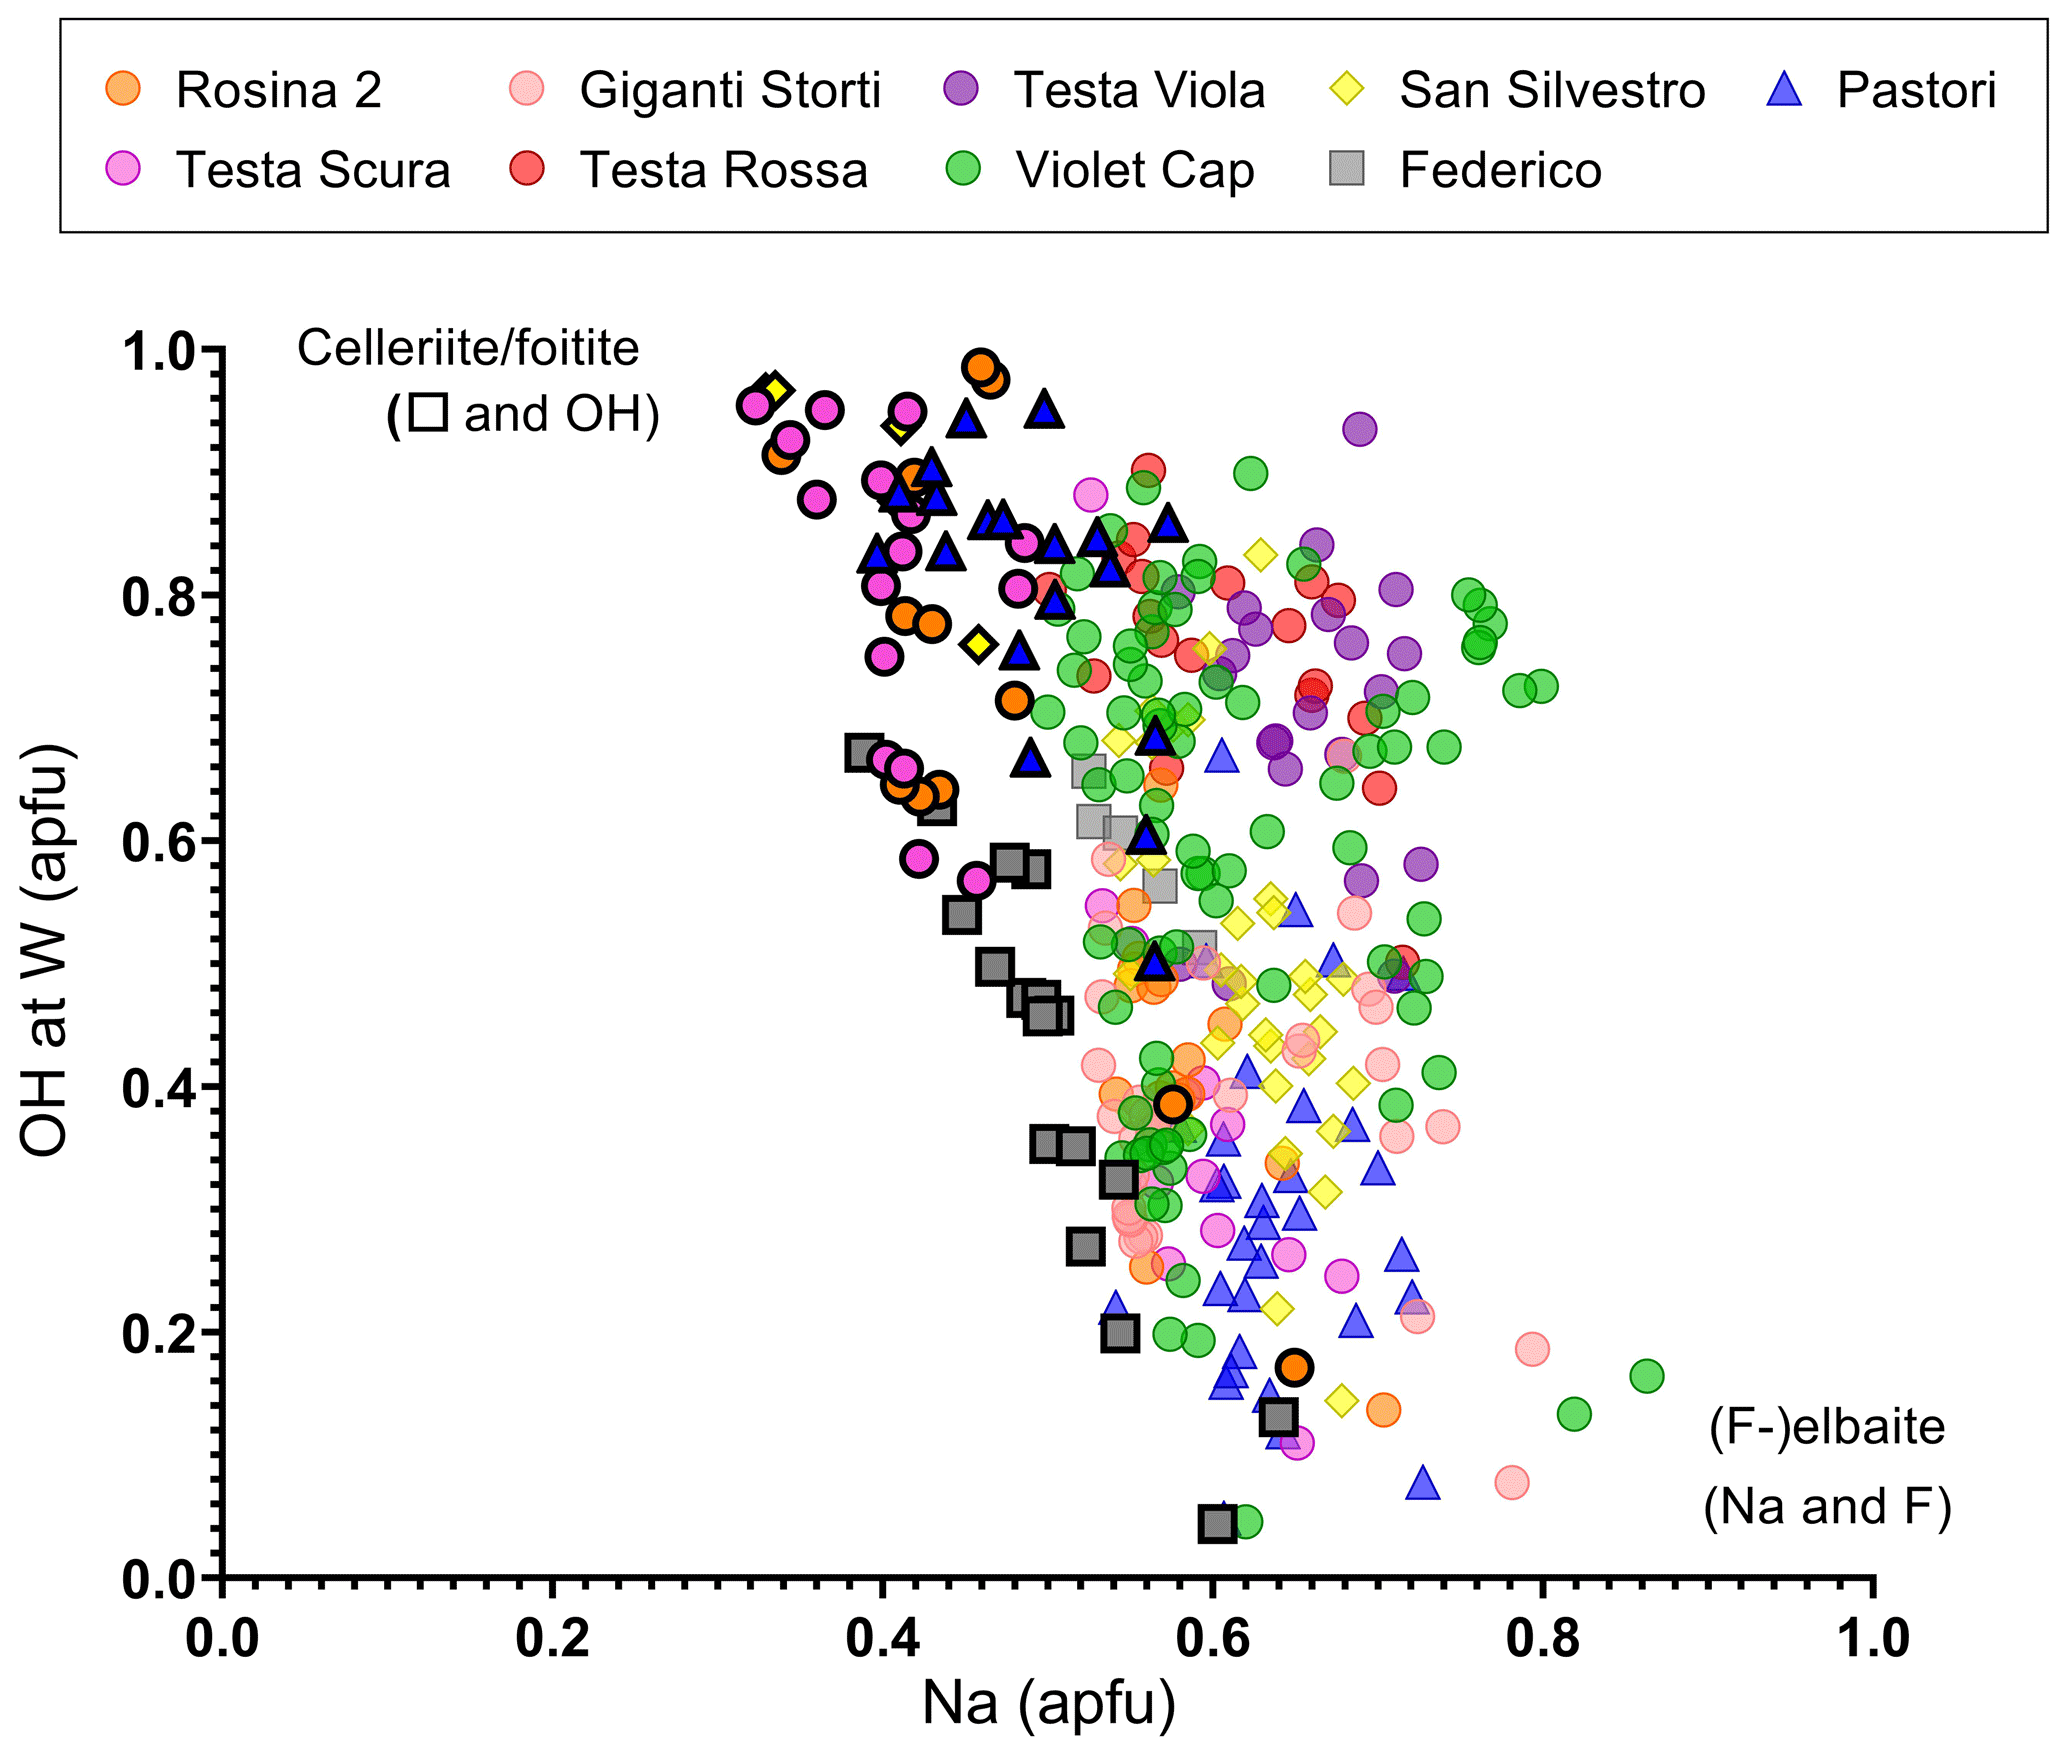
Figure 9Plot of the content of Na vs. WOH for each spot analysis of the tourmaline samples studied. Symbols with a black border indicate the compositions relative to the dark terminations of the different samples.
By plotting the cation occupation of the X and Y sites together with W anions for the studied samples, a clear linear relationship can be observed (Fig. 10). This trend is consistent with the crystal-chemical evolution observed in most of the terminations of the tourmaline crystals analyzed, which follows a transition from an initial elbaite/fluor-elbaite composition to celleriite, foitite and schorl, as described by the following general chemical substitution:
Depending on the relative increase in Mn and Fe, and thus the dominant cation at the Y site, different types of geochemically evolved species can occur at the termination of each sample. The Rosina 2 and Testa Scura samples/crystals are characterized by a consistent Mn enrichment (with respect to Fe) at the analogous pole (MnO up to 12 wt %, FeO <5 wt %), which results in a dark brownish-purplish termination of celleriite composition (Fig. 4a, b). Additionally, a local decrease in Mn at the termination leads to rossmanite alternating with celleriite. The termination of the San Silvestro crystal is enriched in both Mn and Fe, which leads to celleriite when Mn exceeds Fe and foitite when Fe exceeds Mn (Fig. 4f). In contrast, in the Federico and Pastori samples the Fe content is always much higher than the Mn content (FeO >10 wt %), leading to two different mineralogical species (Fig. 4g, h). Indeed, the black termination of the Federico sample is consistent with schorl composition, which generally requires a complete substitution at the Y site (Eq. 1), differently from the substitution observed for all the other samples. However, its empirical chemical formula, X(Na0.51□0.46K0.01Ca0.02)Σ1.00Y(Al0.94Li0.14MnFeTi0.01)Σ3.00ZAl6TSi6.06B3O27V(OH)3W(OH0.39F0.18O0.43)Σ1.00, corresponds to □- and Al-rich schorl. The increase in Fe content at the termination of the Pastori sample leads to a foitite composition. A singular feature of this sample is that the increase in Fe is also accompanied by a significant increase in Mg and simultaneously a lack of Mn. A significant chemical variation, with FeO up to 10 wt %, is concentrated in a small region of the crystal (about 0.4 mm), where a rapid transition from a F-elbaite to F-schorl to F-elbaite/elbaite composition occurs. A further increase in FeO (up to 10 wt %) results in a color change from bright green to black (Fig. 4h). The peculiar characteristic of this termination is the presence of Mg instead of Mn, related to a different chemical environment that led to Mg availability instead of Mn. The increase in Mg is concomitant with the transition from a schorl composition to foitite.
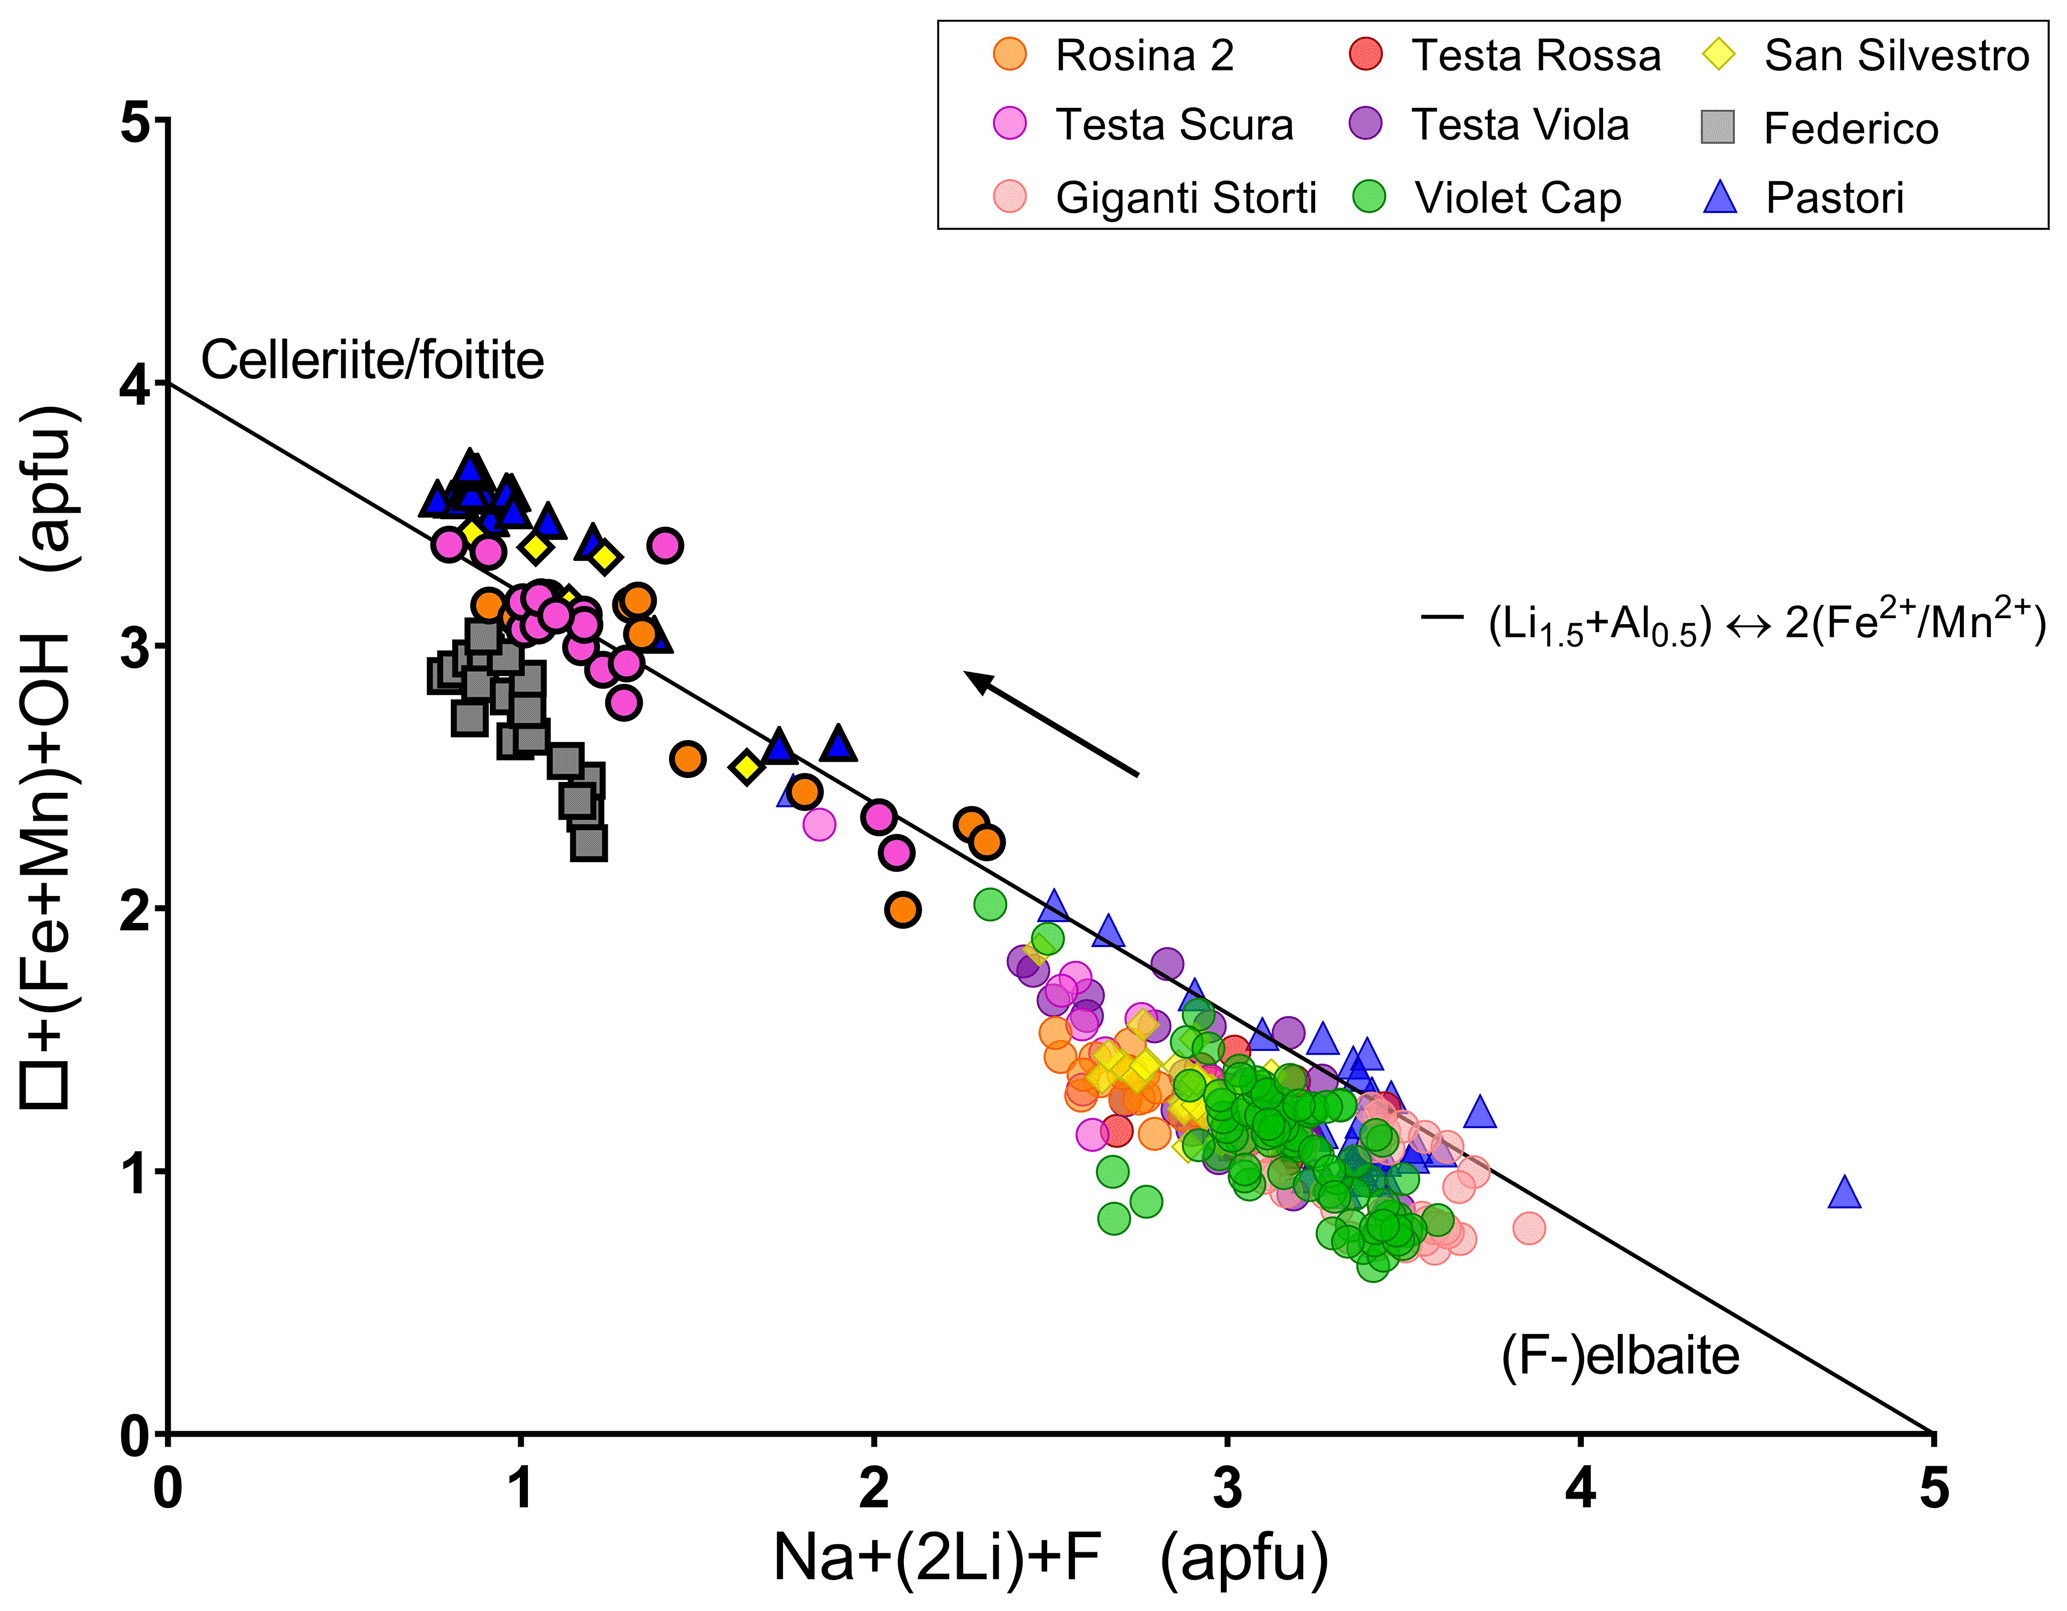
Figure 10Plot of the content of XNa + (2Li) + WF vs. X□ + Y(Mn + Fe) + WOH for each spot analysis of the tourmaline samples studied. Symbols with a black border indicate the compositions relative to the dark terminations of the different samples. For the Pastori sample the Mg content was also considered. The arrow highlights the compositional evolution trend followed by the tourmaline samples investigated.
The compositional variation at the termination of the remaining tourmaline samples (Testa Rossa, Testa Viola and Violet Cap), in spite of the observed increase in Mn (MnO >3 wt %), is not strong enough for a change in tourmaline species and thus remains as elbaite/F-elbaite (Fig. 4d, e).
4.1 Genetic model for the color anomalies in Elba tourmaline crystals
The observed compositional data show that a sharp increase in Mn and/or Fe must have occurred in the latest stage of tourmaline crystal growth, leading to the formation of dark-colored overgrowths generally described as color anomalies. The formation of such color anomalies is related to a significant physicochemical change in the crystallization environment, here considered the consequence of the opening of the geochemical system related to the mechanical destabilization of the pocket environment in which tourmalines grew. Bosi et al. (2022) and Altieri et al. (2022, 2023) previously proposed a genetic model for some dark-colored overgrowths in Elba tourmaline crystals based on a pocket rupture event followed by leaching and corrosion processes of the Fe- and Mn-rich cavity-lining minerals. In agreement with this model, all the pockets from which the tourmaline samples were collected are characterized by thin radial fractures penetrating from the cavity into the enclosing pegmatite, confirming fracturing of the pocket and, in some cases, cavity collapse. Additionally, the occurrence of fractured and corroded primitive Fe- and Mn-rich minerals in proximity to the cavities is particularly evident (Altieri et al., 2023).
In the present case, paragenetic observation of the cavities in which the tourmaline samples were collected revealed abundant petalite, pollucite and lepidolite. The occurrence of such mineral phases indicates that initial steps of crystal growth occurred in pegmatite portions characterized by an advanced degree of fractional crystallization (Pezzotta, 2000, 2021). At this stage, the pegmatitic melt was depleted in Mn and Fe, as such elements were stored in the minerals that crystallized early, such as spessartine and biotite present in the pegmatitic rock surrounding the cavities. Therefore, tourmalines in the cavities initially crystallized as elbaite/F-elbaite. After this stage, compositional analyses revealed a dramatic increase in Fe and/or Mn at the analogous termination leading, in some cases, to the evolution from an initial elbaite/F-elbaite composition to celleriite, foitite or schorl. We ascribe this dramatic chemical change to the pocket rupture event, probably related to a rigid mechanical shock which the cavity experienced, caused, for instance, by a thermal contraction during pegmatite cooling possibly coupled with residual tectonic stress along the border of the granodioritic pluton of Monte Capanne. In this situation, the highly reactive late-stage cavity fluids were allowed to permeate the fractures in the pegmatitic rock surrounding the cavity where the minerals that crystallized early were formed (i.e., spessartine and biotite and in some cases also sekaninaite). The hydrothermal alteration of such minerals through leaching and corrosion processes ascribed to the late-stage fluids connected with the cavities, led to the release of Fe and/or Mn in the pockets. Thus, the incorporation of Mn and Fe during the latest stages of crystallization, coupled with the presence of abundant B, was responsible for both the color anomalies observed at the termination of the tourmaline crystals and their chemical changes. In addition, the late-stage hydrothermal cavity fluids promoted WOH incorporation and the consequent loss of Na at the X site, explaining the partial cation substitution at the Y site observed in the tourmaline samples during the latest stage of crystallization (Fig. 11).
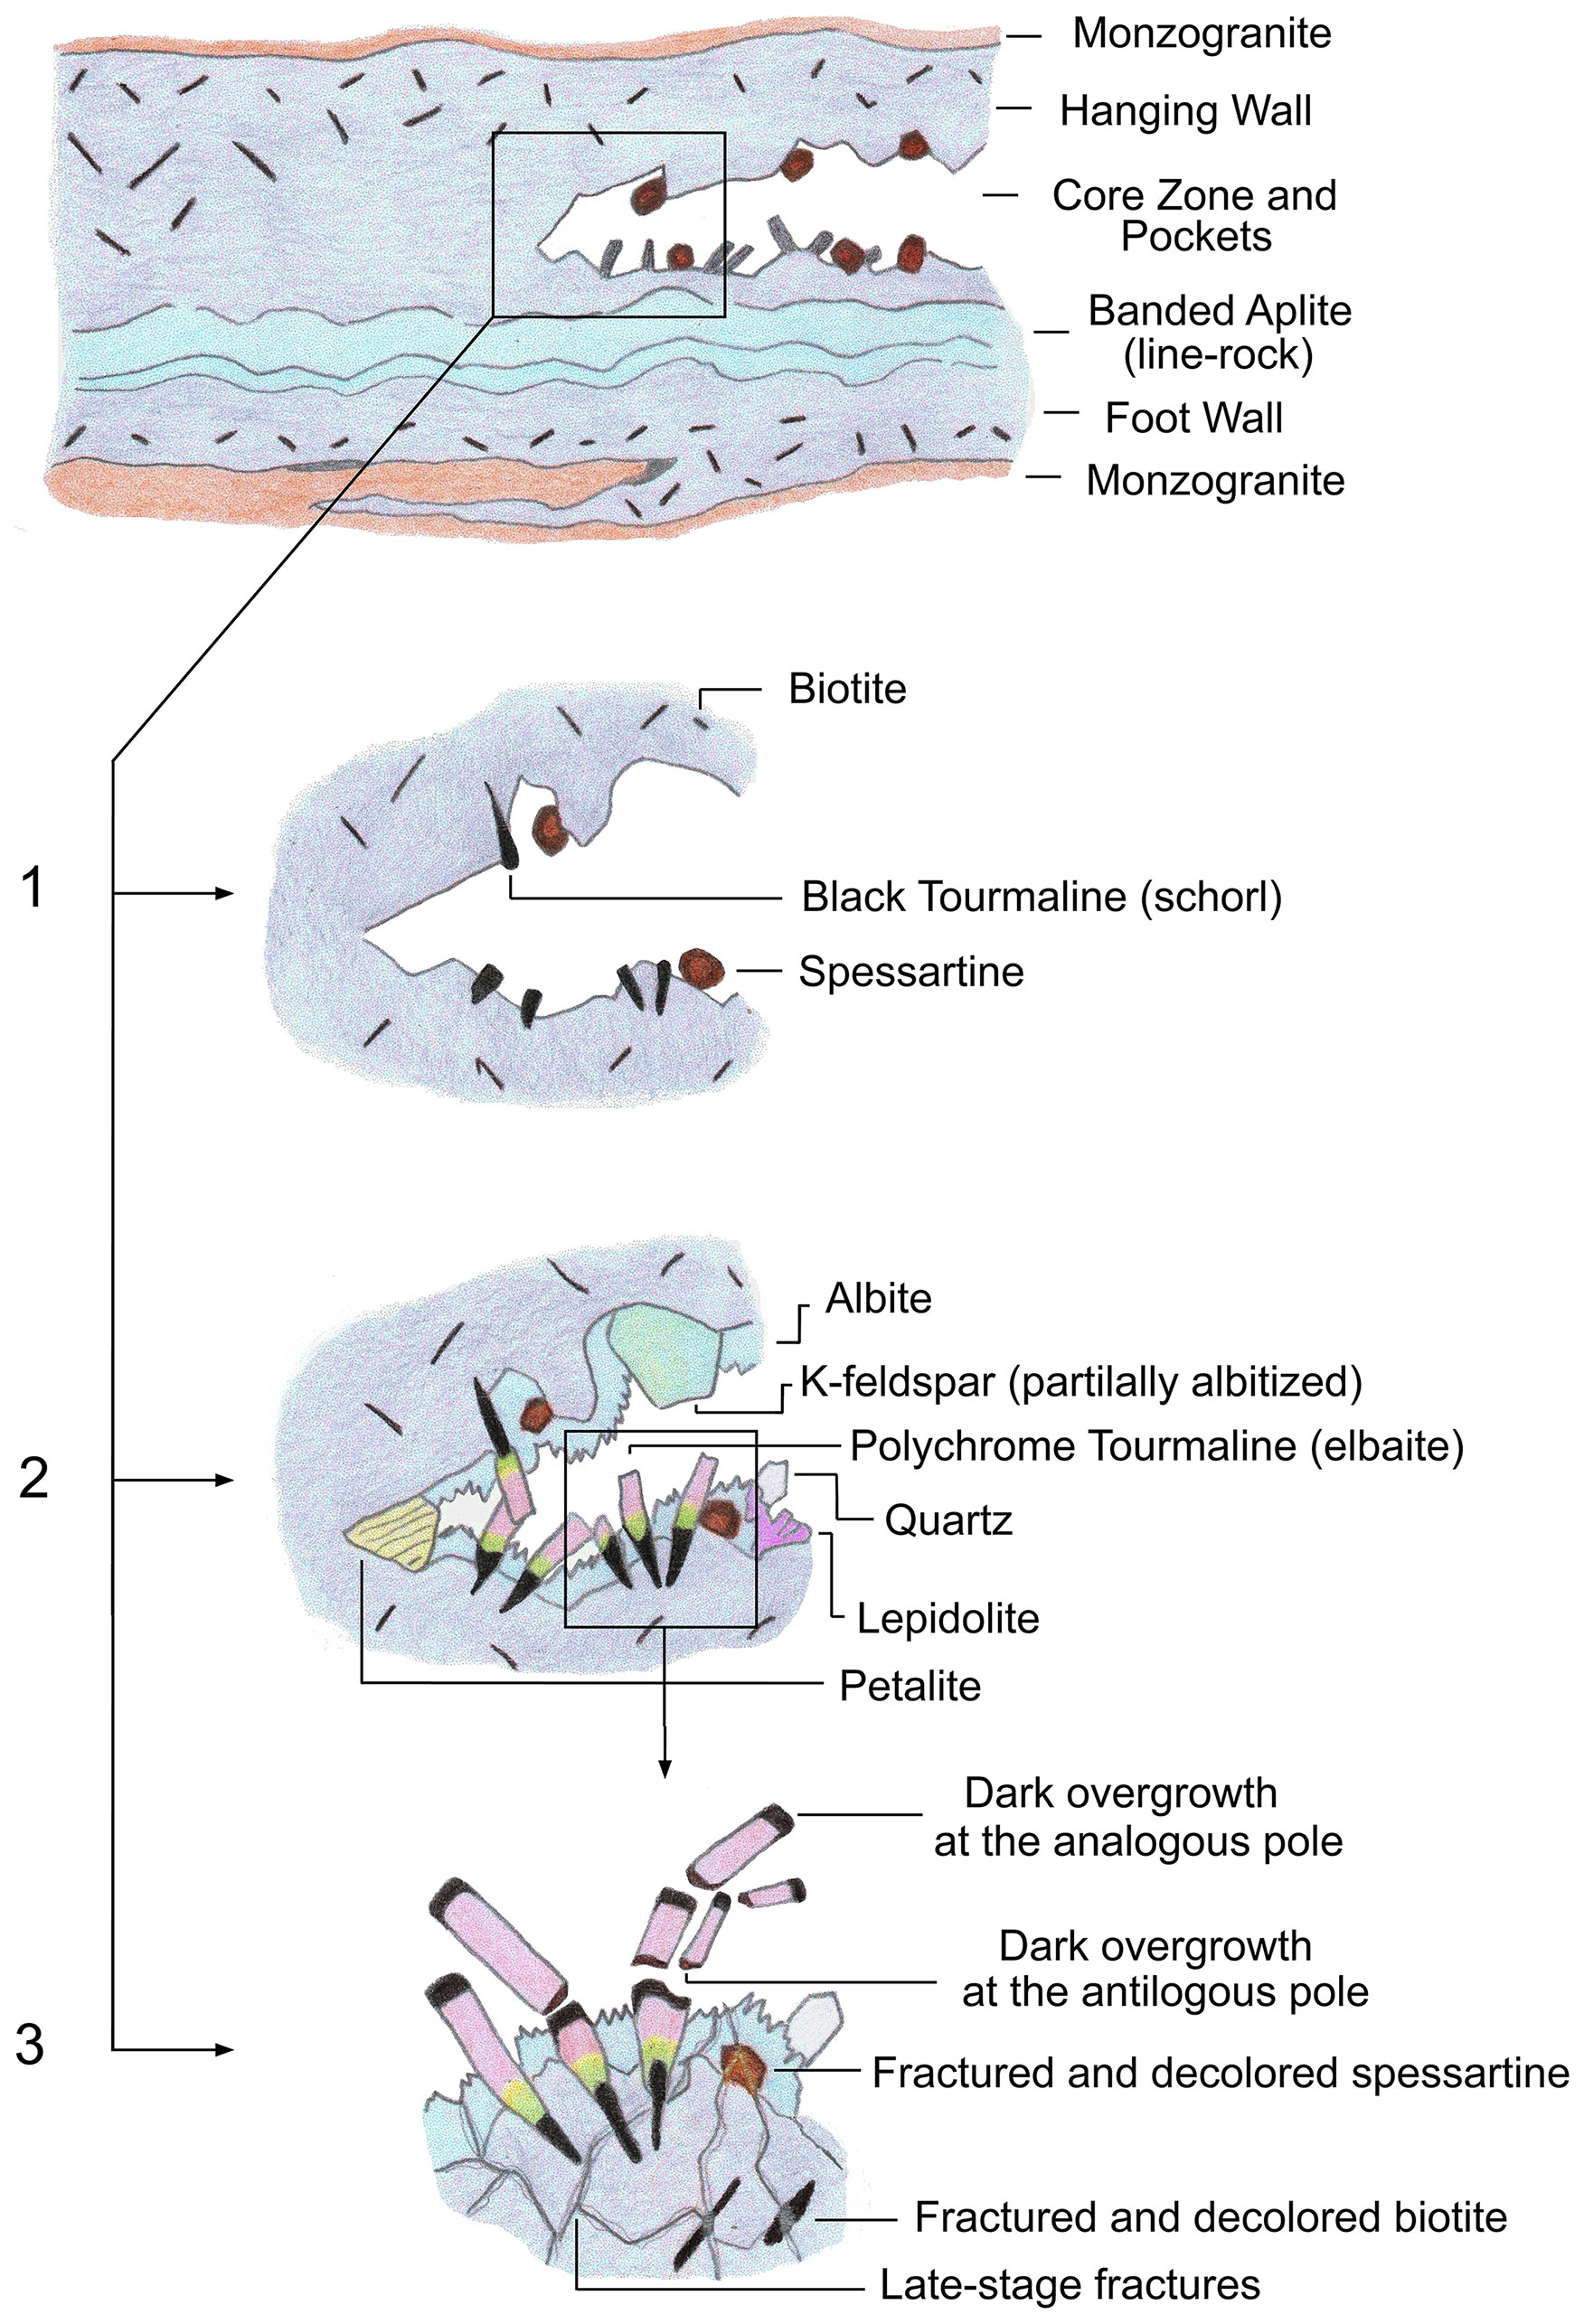
Figure 11Schematic representation of the evolution of a miarolitic cavity in an Elba tourmaline-bearing pegmatite. (1) Early stage of cavity evolution marked by the crystallization of primary schorl and spessartine garnet. (2) Growth of polychrome elbaite crystals with abundant lepidolite and petalite. The occurrence of these latter mineral phases, along with the presence of spessartine garnet that crystallized early, indicates that the initial steps of tourmaline crystal growth occurred in pegmatite portions characterized by an advanced degree of geochemical evolution. (3) Fracturing of the cavity as a consequence of a rigid mechanical shock. At the same time some tourmaline crystals underwent breakage. The pocket rupture event allowed the highly reactive cavity fluids to permeate the fractures in the enclosing pegmatite where the primitive accessory minerals were hosted. Leaching and corrosion of biotite and spessartine caused a dramatic increase in Fe and Mn availability in the pocket environment, as well as the consequent crystallization of the dark-colored overgrowths at the analogous poles and also at the antilogous poles of the broken tourmaline crystals.
The genetic model presented is further supported by the case, previously reported in Altieri et al. (2023), of a tourmaline crystal that was found naturally broken in several fragments within a wide miarolitic cavity in the Rosina pegmatite and was characterized by dark-colored overgrowths at both analogous and antilogous poles, as it demonstrated the strict relationship between the fracturing of the pocket and the crystal breakage to the late-stage tourmaline generation.
Based on the size of the cavity, the extent of the fracturing phenomena and the consequent leaching processes, as well as the relative abundance of different primitive minerals in the enclosing pegmatite (such as biotite and spessartine), the concentration of Fe and Mn in the residual cavity fluids changed, resulting not only in changes in color, but also in a chemical evolution from an initial elbaite/F-elbaite composition to a foitite, celleriite or schorl composition at the termination of the tourmaline crystals.
Considering the variations in Mn and Fe observed at the termination of the analyzed the tourmaline samples and both the pegmatitic veins and the cavities in which tourmalines were originated, some remarks can be made. Tourmaline samples from the Rosina pegmatite, which belong to group II, are characterized by the presence of Mn and low Fe contents at the termination. In contrast, tourmalines from Federico and Pastori pegmatitic veins, which belong to group III, are both characterized by very low Mn contents and a high amount of Fe in the dark termination (Table 3).
Table 3Summary of compositional characteristics of the different dark-colored overgrowths in relation to the primitive accessory minerals occurring close to the pocket in which the tourmaline crystals studied were formed.

+: abundance of the accessory mineral.
In the case of the celleriite-bearing pockets in which the Rosina 2, Testa Scura and San Silvestro samples were formed (such as Polluciti cavity and Central cavity), the abundance of Mn-rich spessartine garnet coupled with a relative scarcity of biotite and other Fe-rich minerals in the pegmatitic rock surrounding the cavities may account for a Mn-rich, Fe-poor source for the late-stage cavity fluids. Extensive fracturing phenomena allowed the release of high amounts of Mn to the residual cavity fluids. Under these conditions, a chemical evolution at the analogous termination of the tourmaline crystals occurred with the formation of brownish-purplish overgrowths with a celleriite composition.
A similar scenario played out in the cavity of the Rosina pegmatite, where the Violet Cap sample was collected (Altieri et al., 2023). This sample is, in fact, characterized by late-stage Mn-rich dark-colored overgrowths, respectively purplish red at the analogous pole (Mn3+ dependent) and yellowish orange at the antilogous one (Mn2+ dependent). In this case, the partial collapse of the cavity caused not only an intense leaching and corrosion of the primitive Mn-rich minerals in enclosing pegmatite, but also the breakage in several fragments of some tourmaline crystals, allowing for the formation of new growth surfaces in the direction of both the analogous and the antilogous poles. Although the Mn increase at the overgrowths confirmed a significant chemical evolution, the mineralogical species remain elbaite/F-elbaite, probably due to the lower amount of spessartine garnet in the enclosing pegmatite. The presence of Mn in both the +3 and +2 redox states suggests that corrosion and alteration phenomena occurred in a relatively oxidizing environment.
In the case of the Giganti Storti, Testa Rossa and Testa Viola samples, the miarolitic cavities in which they originated were subject to minor fracturing phenomena and a less efficient late-stage fluid interaction with the minerals that crystallized early in the surrounding pegmatite. These conditions generated late-stage tourmaline overgrowths characterized by a limited Mn and/or Fe enrichment. As a result, the mineralogical species of these tourmaline samples remains elbaite/F-elbaite even at the purplish-to-reddish overgrowths. A similar scenario was inferred for the “blue-cap” tourmalines described in Altieri et al. (2022), which were found in small cavities within the San Silvestro and Fucili veins. Compositional analyses revealed that the blue coloration of these crystals is related to a slight enrichment in Fe2+. This is consistent with a partial opening of the cavity system associated with minor fracturing phenomena that led to a limited leaching of biotite crystals in the enclosing pegmatite.
The black overgrowths composed of foitite and schorl observed in the Pastori and Federico samples, respectively, were produced by significant Fe enrichment in the geochemical system, caused by the hydrothermal alteration of biotite occurring in the monzogranite hosting the narrow veins. The lack of Mn-rich minerals that crystallized early (spessartine, for instance) in the pegmatitic dikes can explain the very low Mn content in the overgrowths of the Pastori and Federico samples. The termination of the Federico sample is characterized by a sharp transition from colorless to black, with a huge increase in FeO up to 13 wt %. This suggests an intense fracturing of the pocket, which resulted in the breakdown of biotite and release of large amounts of Fe into the system. Conversely, chemical data suggest that the pocket in which the Pastori sample grew has undergone two successive destabilization events, as supported by structural evidence. An early event was responsible for a sudden but limited increase in Fe availability leading to the formation of the narrow F-schorl zone. Successive and more intense fracturing phenomena led to a new increase in the availability of Fe, allowing for the formation of the foitite termination. Additionally, the termination of the Pastori sample is characterized by an increased amount of Mg linked to the hydrothermal alteration of Mg-rich minerals. In this case, i.e., the presence of etched biotite in the Pastori pegmatite, it is possible to suppose that the biotite from the porphyritic monzogranite in which the Pastori vein is hosted is much richer in Mg than the biotite occurring in the Rosina and the San Silvestro pegmatites.
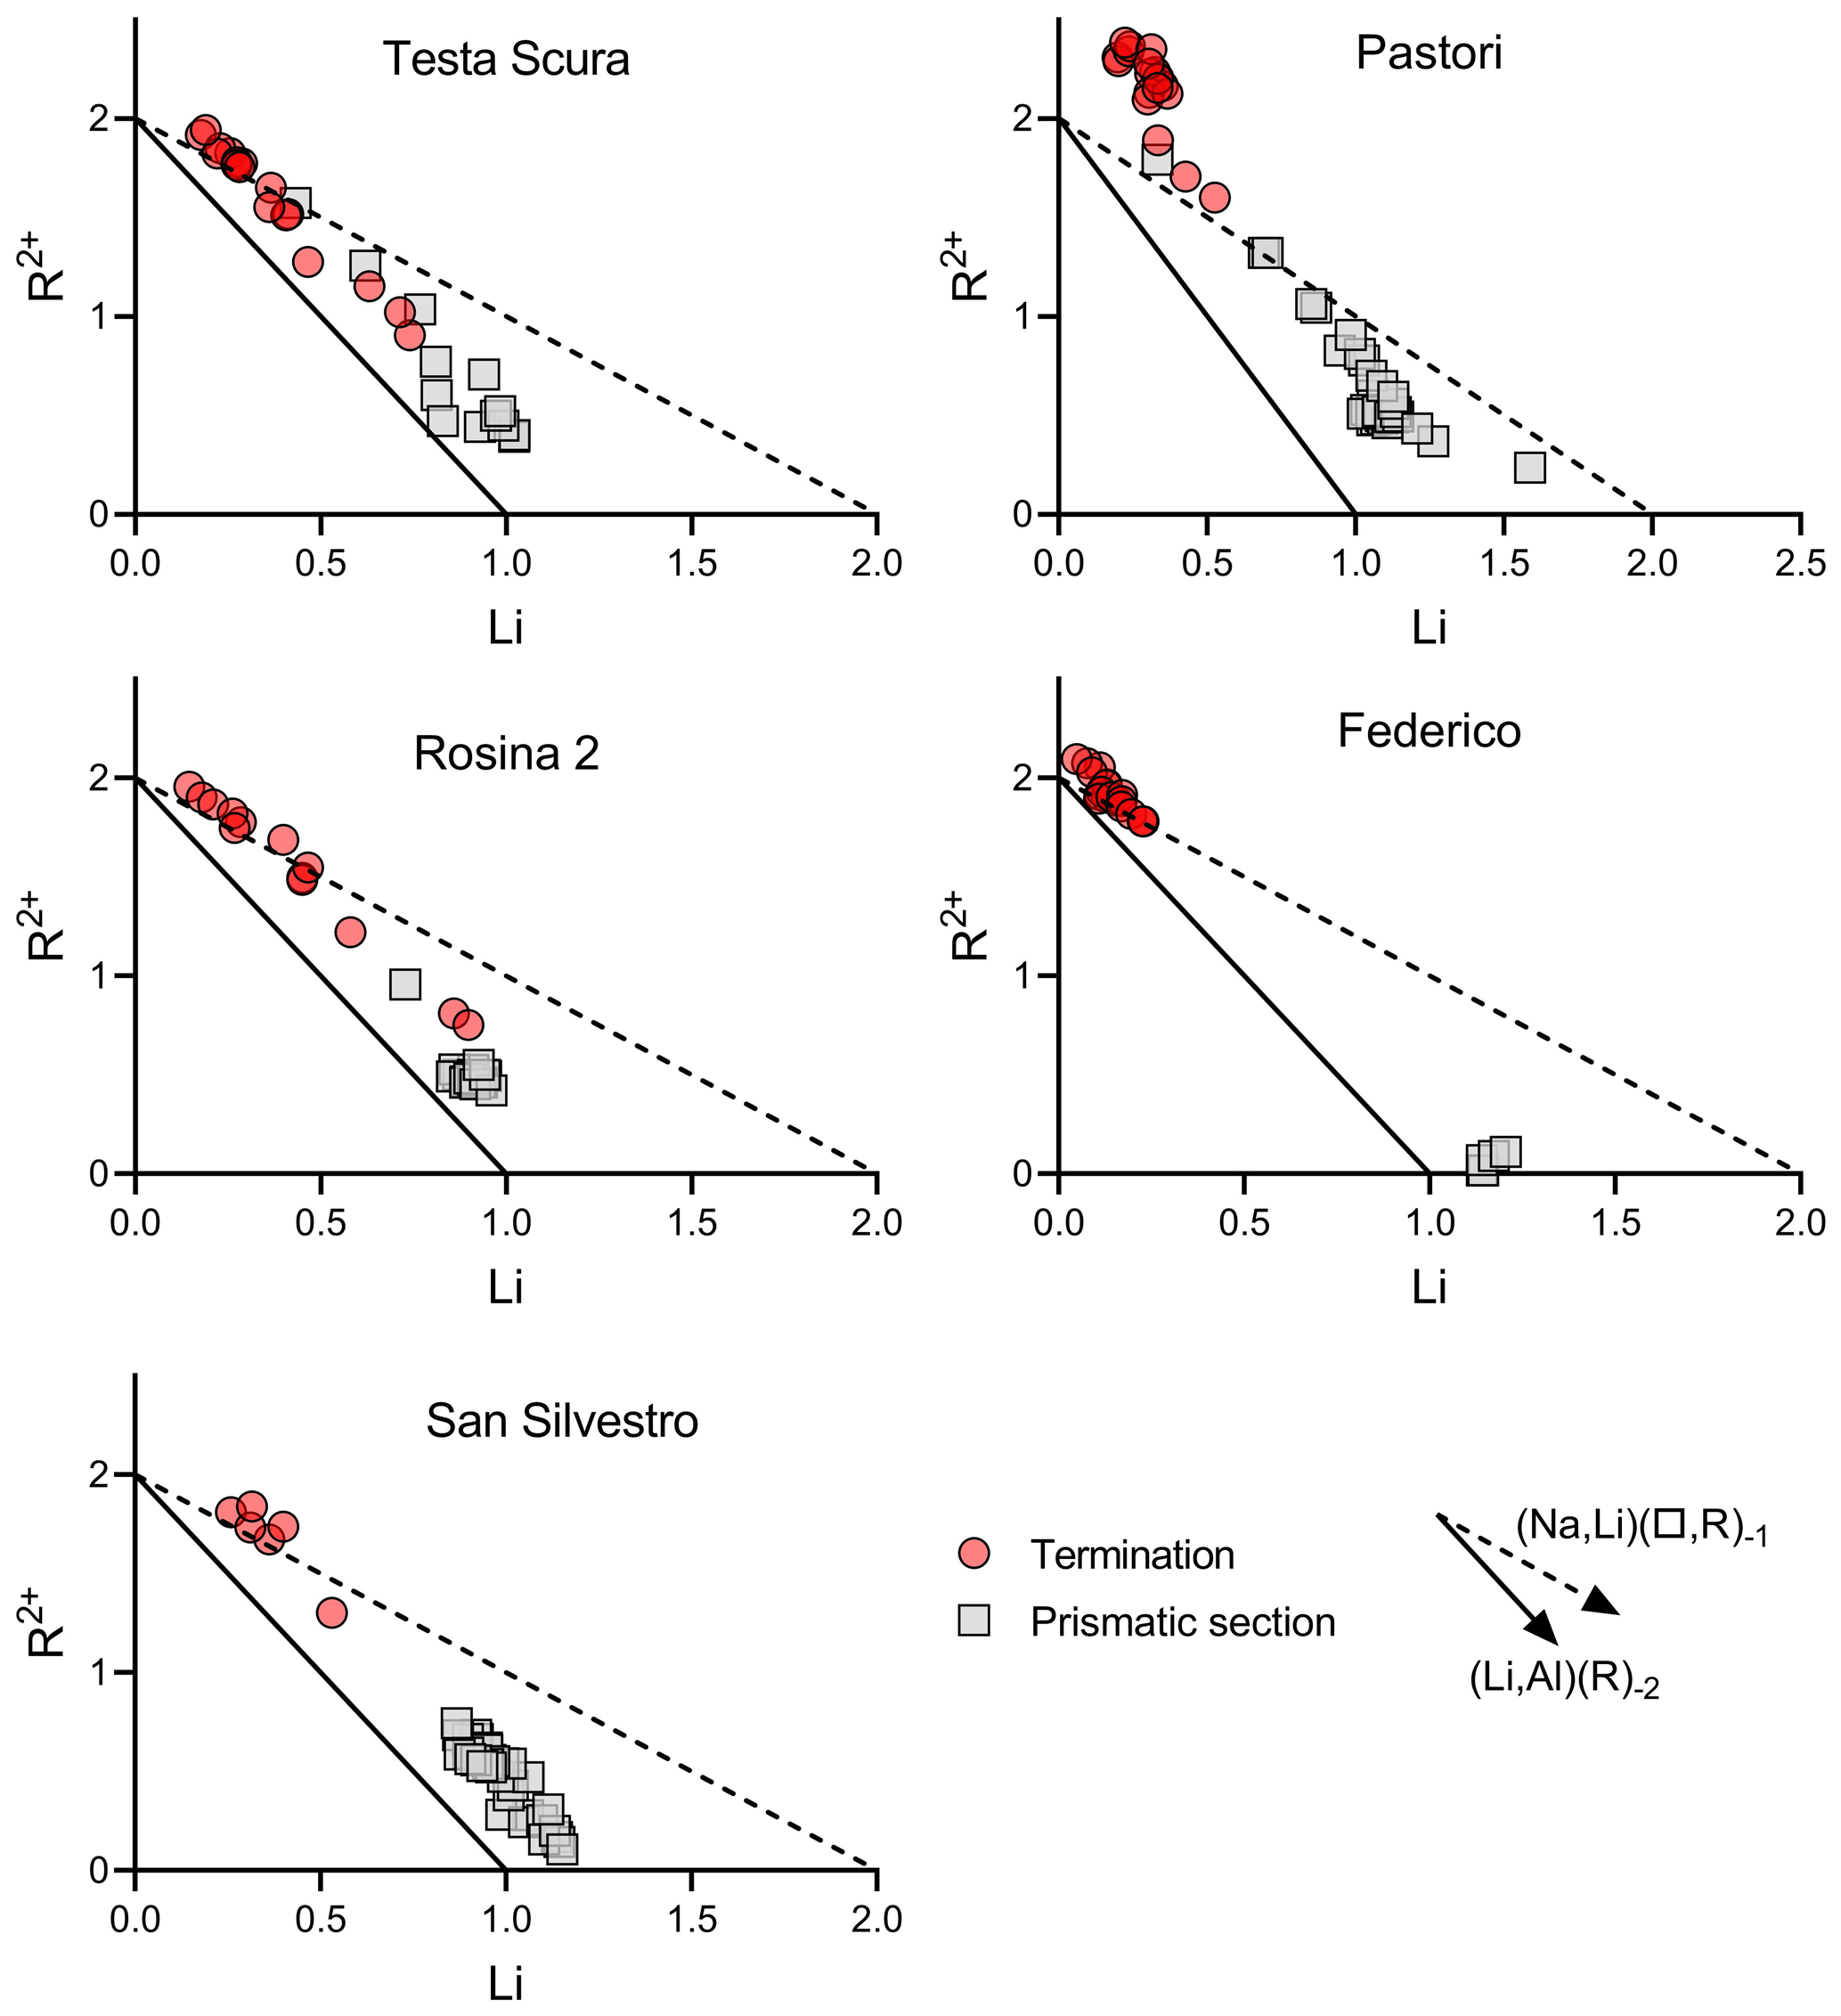
Figure 12Binary plot of Li vs. R2+ of data relative to the prismatic section and termination of tourmaline samples in which a chemical evolution occurred.
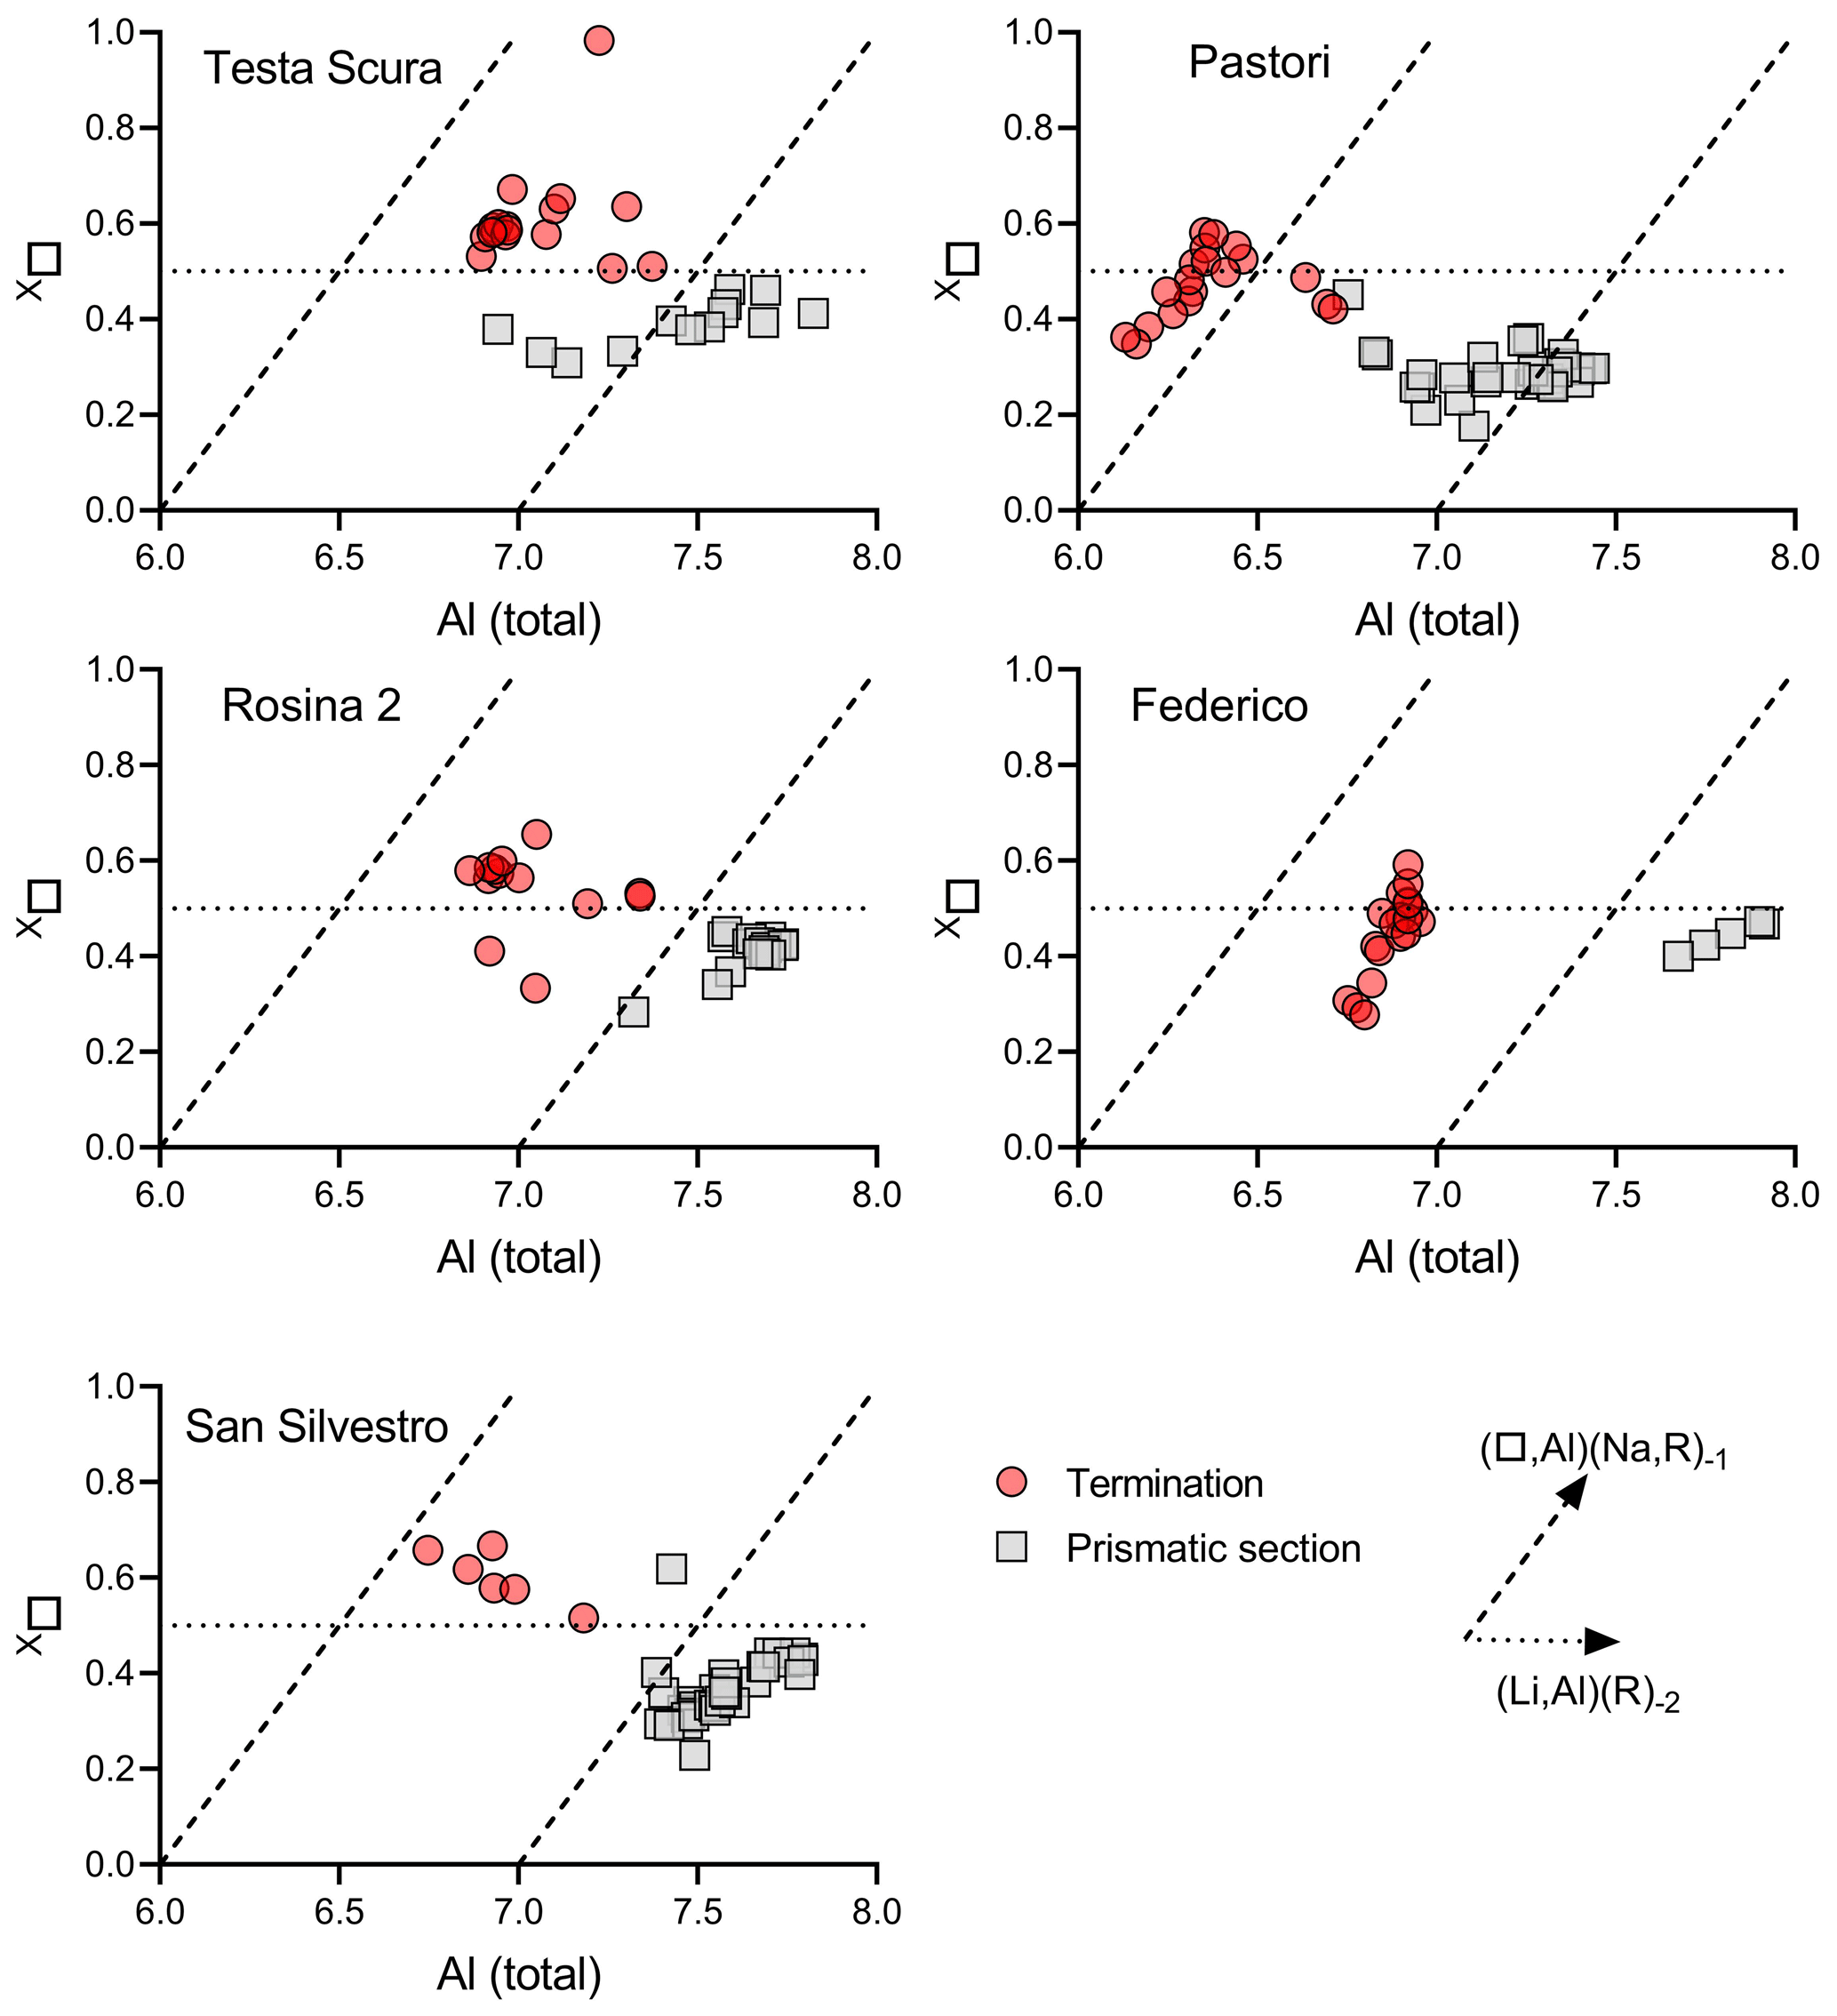
Figure 13Binary plot of Al vs. X□ of data relative to the prismatic section and termination of tourmaline samples in which a chemical evolution occurred.
A comparison of binary plots (Li vs. R2+ and Al vs. X□) of data for the prismatic section and termination of those samples in which a chemical evolution occurred can be used to determine the geochemical environment and the evolutionary compositional trend occurring during the crystal growth (Figs. 12 and 13). The data for the prismatic sections most clearly follow the (LiAl)(R)−2 exchange vector, indicating that is the dominant controlling substitution. This suggests that the geochemical environment of the cavities in which the tourmaline crystals initially grew was quite similar even if cavities belong to different pegmatitic veins. However, data relative to the dark termination follow a different trend, consistent with the destabilization of the system that allowed a change in the chemical environment. Although there are some transitional data, the dominant exchange vector on the termination sectors is (Na,Li)(X□,R)−1. This is consistent with the observation that the most favored type of substitution at the dark termination of the crystals from the island of Elba is a partial substitution with a total charge variation at the Y site. This substitution determines a total charge variation which needs to be balanced by replacing Na at the X site through the incorporation of a cation vacancy. Additionally, the composition of the X site can be used to determine the coexisting fluid composition. The decrease in Na at the X site, generally observed at the dark terminations, can also be associated with a depletion in the Na content in the coexisting fluids during the late stage of tourmaline crystallization. The Al vs. X□ binary plot of data relative to the dark termination shows some differences in the distribution between Testa Scura, Rosina 2 and San Silvestro with respect to Pastori and Federico, with the latter two clearly following the (X□,Al)(Na,R)−1 exchange vector, corresponding to a schorl/dravite–foitite/magnesio–foitite trend. This can be related to the different pegmatite group to which they belong (group III) and the higher availability of Fe-rich paragenetic minerals that allowed a strong Fe enrichment in the cavity fluids during the destabilization event.
As a final remark, it should be pointed out that tourmalines grown in the Rosina and San Silvestro pockets are characterized by a rhythmic behavior of Mn and Fe at the crystal terminations, leading to an alternation of different mineralogical species. Such oscillatory compositional zoning is attributed to variations in composition (X), temperature (T) and pressure (P) of the crystallizing fluid by Lussier and Hawthorne (2011). In the specific case of the Rosina 2, Testa Scura and San Silvestro samples, the apparent non-random distribution of the compositional zone suggests that the variations above could be the result of changes in the diffusion rate of Mn and Fe, released by corrosion and alteration phenomena of the earlier crystallized Mn- and/or Fe-rich minerals, at the crystal–melt interface.
We have added additional evidence for the previously proposed genetic model for the dark-colored overgrowths in Elba tourmaline crystals (Altieri et al., 2023). A pocket fracturing event associated with leaching processes of primitive minerals in the enclosing pegmatite allowed a change in the chemical composition of the residual cavity fluids and the formation of dark-colored overgrowths. The variation in concentration of Fe and Mn is based on the size of the cavity, the extent of the fracturing phenomena and the consequent leaching processes, as well as the relative abundance of the different primitive minerals in the enclosing pegmatite (such as biotite and spessartine). This can result in a simple color change up to a chemical evolution from an initial elbaite/F-elbaite composition to foitite, celleriite or schorl at the termination of the tourmaline crystals.
The results obtained in this work, together with results previously obtained, improved the knowledge on the opening of geochemical systems in which tourmaline crystallized and allowed the definition of a genetic model for the formation of the color anomalies in Elba tourmaline crystals. This model could probably be extended to explain late-stage color and composition anomalies of gem tourmaline crystals in many other gem pegmatite deposits in the world.
Compositional data are available in the Supplement (Tables S1 and S2).
The supplement related to this article is available online at: https://doi.org/10.5194/ejm-35-755-2023-supplement.
AA prepared the manuscript with contributions from all co-authors; AA and FB provided EMPA data; GBA and HS provided MS with data; FP provided the samples. All authors reviewed the manuscript.
The contact author has declared that none of the authors has any competing interests.
Publisher’s note: Copernicus Publications remains neutral with regard to jurisdictional claims in published maps and institutional affiliations.
Sample preparation for chemical and spectroscopic analyses was carried out with the support of Domenico Mannetta, to whom the authors express their gratitude. The authors thank Marcello Serracino for his assistance during chemical analyses. Mineral collectors Klaus Wirth and Marco Lorenzoni are also acknowledged for collaborating in the sampling activity. The authors sincerely thank the associate editor Edward Grew and the reviewers Darrell Henry and Peter Bačík for their constructive comments that helped to improve the manuscript.
This research has been supported by the Sapienza University of Rome (Prog. Università 2020) and the Ministero dell'Istruzione, dell'Università e della Ricerca (MIUR)–PRIN 2020 (ref. 2020WYL4NY) to Giovanni B. Andreozzi and Ferdinando Bosi.
This paper was edited by Edward Grew and reviewed by Peter Bačík and Darrell Henry.
Altieri, A., Pezzotta, F., Skogby, H., Hålenius, U., and Bosi, F.: Blue-growth zones caused by Fe2+ in tourmaline crystals from the San Piero in Campo gem-bearing pegmatites, Elba Island, Italy, Mineral Mag., 86, 910–919, https://doi.org/10.1180/mgm.2022.101, 2022.
Altieri, A., Pezzotta, F., Skogby, H., Hålenius, U., and Bosi, F.: Dark-coloured Mn-rich overgrowths in an elbaitic tourmaline crystal from the Rosina pegmatite, San Piero in Campo, Elba Island, Italy: witness of late-stage opening of the geochemical system, Mineral Mag., 87, 130–142, https://doi.org/10.1180/mgm.2022.125, 2023.
Andreozzi, G. B., Bosi, F., and Longo, M.: Linking Mossbauer and structural parameters in elbaite-schorl-dravite tourmalines, Am. Mineral., 93, 658–666, https://doi.org/10.2138/am.2008.2721, 2008.
Aurisicchio, C., Ottolini, L., and Pezzotta, F.: Electron- and ion-microprobe analyses, and genetic inferences of tourmalines of the foitite–schorl solid solution, Elba Island (Italy), Eur. J. Mineral., 11, 217–225, https://doi.org/10.1127/EJM/11/2/0217, 1999.
Bačík, P. and Fridrichová, G.: Cation partitioning among crystallographic sites based on bond-length constraints in tourmaline-supergroup minerals, Am. Mineral., 106, 851–861, https://doi.org/10.2138/am-2021-7804, 2021.
Bosi, F.: Octahedrally coordinated vacancies in tourmaline: A theoretical approach, Mineral. Mag., 74, 1037–1044, https://doi.org/10.1180/minmag.2010.074.6.1037, 2010.
Bosi, F.: Tourmaline crystal chemistry, Am. Mineral., 103, 298–306, https://doi.org/10.2138/am-2018-6289, 2018.
Bosi, F., Pezzotta, F., Altieri, A., Andreozzi, G. B., Ballirano, P., Tempesta, G., Cempírek, J., Škoda, R., Filip, J., Čopjacová, R., Novák, M., Kampf, A. R., Scribner, E. D., Groat, L. A., and Evans, R. J.: Celleriite, □(MnAl)Al6(Si6O18)(BO3)3(OH)3(OH), a new mineral species of the tourmaline supergroup, Am. Mineral., 107, 31–42, https://doi.org/10.2138/am-2021-7818, 2022.
Buřival, Z. and Novák, M.: Hydrothermal replacement of garnet by tourmaline in elbaite subtype LCT pegmatites, 7th International Symposium on Granitic Pegmatites, PEG 2015 Ksiąz, Poland, 2015.
Černý, P.: Constitution, petrology, affìliations and categories of miarolitic pegmatites, Memorie della Società Italiana di Scienze Naturali e del Museo Civico di Storia Naturale di Milano, 30, 5–12, 2000.
Dini, A., Innocenti, F., Rocchi, S., Tonarini, S., and Westerman, D. S.: Magmatic evolution of the laccolith-pluton-dyke complex of Elba Island, Italy, Geol. Mag., 139, 257–279, 2002.
Dutrow, B. L. and Henry, D. J.: Complexly zoned fibrous tourmaline, Cruzeiro mine, Minas Gerais, Brazil: a record of evolving magmatic and hydrothermal fluids, Can. Mineral., 38, 131–143, https://doi.org/10.2113/gscanmin.38.1.131, 2000.
Dutrow, B. L. and Henry, D. J.: Fibrous tourmaline: a sensitive probe of fluid compositions and petrologic environments, Can. Mineral., 54, 311–335, https://doi.org/10.3749/canmin.1600019, 2016.
Dutrow, B. L. and Henry, D. J.: Tourmaline compositions and textures: reflections of the fluid phase, J. Geosci., 63, 99–110, https://doi.org/10.3190/jgeosci.256, 2018.
Farina, F., Dini, A., Innocenti, F., Rocchi, S., and Westerman, D. S.: Rapid incremental assembly of the Monte Capanne pluton (Elba Island, Tuscany) by downward stacking of magma sheets, GSA Bulletin, 120, 1463–1479, https://doi.org/10.1130/B30112.1, 2010.
Felch, M., Falster, A. U., and Simmons, W. B.: Iron-bearing pollucite and tourmaline replacement of garnet in the garnet line in the Mt. Mica and Havey pegmatites, Western Maine, Can. Mineral., 54, 1071–1086, https://doi.org/10.3749/canmin.1600013, 2016.
Foord, E. E.: Mineralogy and Petrogenesis of Layered Pegmatite–Aplite Dikes in the Mesa Grande District, San Diego County, California, PhD thesis, Stanford University, Stanford, California, 1976.
Grew, E. S., Krivovichev, S. V., Hazen, R. M., and Hystad, G.: Evolution of structural complexity in boron minerals, Can. Mineral., 54, 125–143, https://doi.org/10.3749/canmin.1500072, 2016.
Henry, D. J. and Dutrow, B. L.: Metamorphic tourmaline and its petrologic applications, in: Boron: Mineralogy, Petrology and Geochemistry, edited by: Grew, E. S. and Anovitz, L. M., Mineralogical Society of America Reviews in Mineralogy, 33, 503–557, 1996.
Henry, D. J. and Dutrow, B. L.: Tourmaline studies through time: contributions to scientific advancements, J. Geosci., 63, 77–98, https://doi.org/10.3190/jgeosci.255, 2018.
Henry, D. J., Novák, M., Hawthorne, F. C., Ertl, A., Dutrow, B., Uher, P. and Pezzotta, F.: Nomenclature of the tourmaline supergroup minerals, Am. Mineral., 96, 895–913, https://doi.org/10.2138/am.2011.3636, 2011.
Lagarec, K. and Rancourt, D. G.: RECOIL, Mössbauer spectral analysis software for windows (version 1.0), Department of Physics, University of Ottawa, Canada, 1998.
London, D.: Spessartine from Navegador, Minas Gerais, Brazil: etch or growth features, http://www.minsocam.org/msa/special/pig/pig_articles/etched_spssrtn.pdf (last access: 11 September 2023), 2006.
Lussier, A. J. and Hawthorne, F. C.: Oscillatory zoned liddicoatite from Anjanabonoina, central Madagascar. II. Compositional variation and mechanisms of substitution, Can. Mineral., 49, 89–104, https://doi.org/10.3749/canmin.49.1.63, 2011.
Marinelli, G.: Le intrusioni terziarie dell'Isola d'Elba, Atti Società Toscana, Scienze Naturali, 66, 50–253, 1959.
Novák, M. and Taylor, M. C.: Foitite: formation during late stages of evolution of complex granitic pegmatites at Dobrá Voda, Czech Republic, and Pala, California, U.S.A., Can. Mineral., 38, 1399–1408, https://doi.org/10.2113/gscanmin.38.6.1399, 2000.
Orlandi, P. and Pezzotta, F.: Minerali dell'Isola d'Elba, i minerali dei giacimenti metalliferi dell'Elba orientale e delle pegmatiti del M.te Capanne, Ed. Novecento Grafico, Bergamo, 248 pp., 1996.
Pesquera, A., Gil-Crespo, P. P., Torres-Ruiz, F., Torres-Ruiz, J., and Roda-Robles, E.: A multiple regression method for estimating Li in tourmaline from electron microprobe analyses, Mineral. Mag., 80, 1129–1133, https://doi.org/10.1180/minmag.2016.080.046a, 2016.
Pezzotta, F.: Internal structures, parageneses and classification of the miarolitic Li-bearing complex pegmatites of Elba Island (Italy). Mineralogy and petrology of shallow depth pegmatites, Papers from the First International Workshop, Memorie della Società Italiana di Scienze Naturali e del Museo Civico di Storia Naturale di Milano, 30, 29–43, 2000.
Pezzotta, F.: A history of tourmaline from the Island of Elba, Mineral. Rec., 52, 669–720, 2021.
Pouchou, J. L. and Pichoir, F.: Quantitative analysis of homogeneous or stratified microvolumes applying the model “PAP”, 31–75, in: Electron Probe Quantitation, edited by: Heinrich, K. F. J. and Newbury, D. E., Plenum, New York, https://doi.org/10.1007/978-1-4899-2617-3_4, 1991.
Prescher, C., McCammon, C., and Dubrowinsky, L.: MossA: a program for analyzing energy-domain Mössbauer spectra from conventional and synchrotron sources, J. Appl. Crystallogr., 45, 329–331, https://doi.org/10.1107/S0021889812004979, 2012.
Selway, J. B.: Compositional Evolution of Tourmaline in Granitic Pegmatites, PhD thesis, University Manitoba, Winnipeg, Manitoba, USA, 1999.
van Hinsberg, V. J., Henry, D. J., and Dutrow, B. L.: Tourmaline as a petrologic forensic mineral: A unique recorder of its geologic past, Elements, 7, 327–332, https://doi.org/10.2113/gselements.7.5.327, 2011a.
van Hinsberg, V. J., Henry, D. J., and Marschall, H. R.: Tourmaline: an ideal indicator of its host environment, Can. Mineral., 49, 1–16, https://doi.org/10.3749/canmin.49.1.1, 2011b.