the Creative Commons Attribution 4.0 License.
the Creative Commons Attribution 4.0 License.
 | 02 Aug 2023
H2O degassing triggered by alkali depletion in bimodal magma injection processes – a new experimental approach
Patricia Louisa Marks
Anja Allabar
Marcus Nowak
The injection of mafic magma into a hydrous felsic magma chamber is a potential trigger mechanism for bimodal explosive volcanism. As H2O is the most abundant volatile component in magmas, the interaction and the degassing behavior of mildly peralkaline hydrous rhyolitic melt in contact with hydrous basaltic melt were investigated by decompression experiments. Preparatory hydration experiments and bimodal magma decompression experiments, as well as reference experiments, were carried out in an internally heated argon pressure vessel. Pre-hydrated rhyolite and basalt cylinders were perfectly contacted together in a precious-metal capsule, heated to 1348 K at 210 MPa, and thermally equilibrated for 10 min. The initial sample properties were determined by a bimodal reference experiment, quenched immediately after equilibration. To simulate the magma ascent, three bimodal samples and a decompression experiment with two contacted rhyolite cylinders for testing the experimental setup were decompressed with 0.17 or 1.7 MPa s−1 to the final pressure of 100 MPa and then quenched.
All decompression experiments resulted in vesiculated samples. The H2O vesicles observed in the decompressed sample of the monomodal rhyolite–rhyolite reference experiment are homogeneously distributed throughout the sample. The former interface between the contacted glass cylinders is invisible after decompression and quench. This reference experiment proves that the two-cylinder design does not influence the degassing behavior of the hydrous melt, e.g., an increased formation of vesicles at possible nucleation sites at the contact plane of the cylinders.
The undecompressed bimodal rhyolite–basalt sample shows crystal-free rhyolitic glass, whereas 3 µm sized idiomorphic magnetite crystals coexist with glass in the basaltic part of the sample. Within the 10 min run time, a ∼ 300 µm wide hybrid composition zone developed between the hydrous rhyolitic and basaltic endmembers, caused by diffusion-induced mixing processes.
Decompression and quenching of the bimodal melts resulted in vesiculated glass samples. A ∼ 100 µm wide zone of alkali-depleted rhyolitic glass as part of the ∼ 300–560 µm wide hybrid zone is covered with an enhanced number of H2O vesicles compared to the pristine rhyolitic and basaltic glass volumes. We suggest that this enhanced vesiculated zone forms by a rapid diffusional loss of alkalis from the mildly peralkaline rhyolitic melt into the basaltic melt of the sample. The reduced alkali concentration significantly reduces the H2O solubility of the rhyolitic melt. This process enhances the H2O supersaturation necessary for vesicle formation during decompression.
In summary, the new findings imply that convective magma ascent driven by the injection of hot basaltic magma into a hydrous peralkaline rhyolitic melt reservoir leads to enhanced H2O vesicle formation near the melt interface and thus to efficient degassing. This in turn can accelerate buoyancy-driven magma ascent and mingling and mixing processes that induce further degassing and potentially trigger explosive volcanic eruptions.
- Article
(2441 KB) - Full-text XML
-
Supplement
(58521 KB) - BibTeX
- EndNote


Explosive volcanic eruptions are driven by the formation and growth of volatile vesicles, mainly H2O and subordinate CO2, in hydrous silicic melts. The formation of fluid vesicles requires supersaturation of volatiles dissolved in the silicate melt. Vesicles in hydrous rhyolitic melt form by nucleation (e.g., Sparks, 1978; Navon and Lyakhovsky, 1998; Gonnermann and Manga, 2007; Hajimirza et al., 2019; Gardner et al., 2022) or, as recently suggested for phonolitic Vesuvius melt composition, by spinodal decomposition (Allabar and Nowak, 2018; Allabar et al., 2020; Sahagian and Carley, 2020; Gardner et al., 2022). However, vesicle formation and growth lead to an overpressure that might burst the ceiling of a magma chamber (e.g., Sparks et al., 1977; Sigurdsson and Sparks, 1981; Miller and Wark, 2008; Spera et al., 2016). The resulting sudden pressure (P) drop enhances the further formation and growth of vesicles, which significantly reduces magma density. Accelerated magma ascent and rapid expansion of vesicles lead finally to magma fragmentation. These fundamental mechanisms hold to small explosive silicic eruptions, such as the 1875 eruption of Askja in Iceland, which produced ∼ 0.2 km3 of rhyolitic magma (Sigurdsson and Sparks, 1981) with a volcanic explosive index (VEI) of 4. They also apply for catastrophic explosions, e.g., the 74 ka supereruption of Toba on Sumatra with a VEI of 8, which ejected ∼ 2800 km3 of rhyolitic magma, equivalent to ∼ 8000 km3 of volcanic ash (Rose and Chesner, 1987; Self and Blake, 2008).
Under the pressure and temperature conditions of subvolcanic magma chambers, silicate melts can dissolve several weight percent (wt %) of the main volatile H2O. Several processes to achieve volatile supersaturation and vesicle formation are discussed: (1) decompression by magma ascent (e.g., Sparks et al., 1977), (2) sudden pressure drop by earthquakes rupturing hydrous magma chamber roof rocks, (3) enrichment of volatiles that exceed the saturation limit of silicate melt due to partial crystallization (e.g., Bachmann and Bergantz, 2008; Scaillet and Pichavant, 2003), (4) thermal vesiculation induced by the latent heat of partial crystallization and frictional heating (Lavallee et al., 2015), and (5) the injection of hot mafic magma into differentiated volatile-rich silicic magma accompanied by mechanical mingling and chemical mixing processes (Miller and Wark, 2008; Spera et al., 2016; Murphy et al., 1998; Leonard et al., 2002; Druitt et al., 2012; Perugini et al., 2012; Laumonier et al., 2014; Pichavant et al., 2018), as well as (6) dispersion of partially crystallized mafic fragments acting as heterogeneous vesicle nucleation sites in hydrous silicic melts (Paredes-Marino et al., 2017). While the first points have already been extensively studied (e.g., Martel et al., 2017), experimental approaches to the last points are rare. Therefore, this experimental work focuses solely on the effects of magma degassing triggered by magma injection.
1.1 Geological background of explosive volcanic eruptions triggered by magma injection
Bimodal basaltic–rhyolitic volcanism in Iceland was first described by Bunsen (1851). In recent literature partially crystallized mafic streaks, glass fragments, blebs, and enclaves are described as common features in products of explosive felsic volcanic eruptions (e.g., Sparks et al., 1977; Troll et al., 2004; Miller and Wark, 2008; Arienzo et al., 2010; Druitt et al., 2012; Paredes-Marino et al., 2017; Jarvis et al., 2021).
Injection of hot basaltic magma into a rhyolitic magma chamber may induce local temperature differences of up to 500 K that shift the system out of equilibrium (e.g., Sparks et al., 1977; Snyder, 2000; Miller and Wark, 2008). Accompanied mechanical magma mingling significantly increases the contact surface of the two melts (e.g., Perugini et al., 2012; Jarvis et al., 2021). This enhances the transfer of heat and mixing by chemical diffusion. Two important effects are triggered by heat transfer at the interface: (1) volatile-bearing hot basaltic magma cools down and may partially crystallize. The possible exceedance of the volatile saturation limit by sufficient enrichment in the residual melt can lead to vesicle formation and growth. (2) Volatile-rich silicic magma can be superheated. This may lead to the formation and growth of fluid vesicles as H2O solubility decreases with the temperature at pressures of ≤ 300 MPa (Holtz et al., 1995; Lavallee et al., 2015). In both scenarios, the vesicle formation and growth significantly decrease the magma density, which is controlled by the pressure–volume–temperature (PVT) behavior of H2Ofluid. The decrease in magma density may trigger buoyancy-driven convection and a large-scale overturning of an initially stratified magma chamber within timescales of days or weeks (Sparks et al., 1977; Snyder, 2000; Phillips and Woods, 2002). Further vesicle formation and expansion accelerate magma ascent. The rapid build-up of internal fluid pressure during the growth of bubbles and the increase in melt viscosity induced by H2O loss may cause melt fragmentation, followed by explosive volcanic eruptions.
1.2 Experimental investigation of the interaction of felsic and mafic magmas
Yoder (1973) investigated experimentally the physicochemical interaction of H2O-saturated basaltic and rhyolitic melts. The fusion of mixed fine-grained rock powders and H2O at 100 MPa and 1473 K resulted in complete melt miscibility. In contrast, melting of layered basaltic and rhyolitic rock powders resulted in separated glasses with a narrow diffusion zone with an intermediate (hybrid) composition of ∼ 300 µm across the interface after 2 h of fusion and quench. This indicates that silicate melts of different compositions can be maintained in direct contact at least for a short time. Johnston and Wyllie (1988) confirmed these results with coupled hydrous basaltic and rhyolitic melt reaction experiments at 1 GPa and 1193 K. They demonstrated that alkali diffusion is orders of magnitude faster than the diffusion of divalent cations that is limited by the diffusion of the network formers Si and Al (Watson, 1982).
Experimental mingling of basaltic and silicic melts was successfully conducted by the mechanical torsion of two contacted melt disks at 1483 K and ambient P (Kouchi and Sunagawa, 1985). Laumonier et al. (2015) mingled hydrous basaltic and tonalitic magmas by torsion in a Patterson apparatus at 300 MPa and ≤ 1293 K. The experimental products show entrainment of mafic crystals into the felsic melt, mafic–felsic banding, and enclave formation similar to the textures observed in bimodal volcanic rocks. Perugini et al. (2012) and Morgavi et al. (2013) used a rotating crucible and a rotating inner cylinder based on the so-called journal bearing system (JBS) to mingle granitic and basaltic melts at 1623–1673 K. The observed chaotic mingling by stretching and folding induces a significant increase in the interface of the silicate melts within hours and enhances diffusional exchange between the two melts. Wiesmaier et al. (2015) demonstrated magma mingling of nominally volatile-free rhyolitic and basaltic melts at ambient P and 1723 K without external forces. Air bubbles were intentionally entrapped at the coarsely ground interface of the two glass cylinders stacked on each other. During the experiment, the initial air bubbles ascended from the melt interface into the overlying rhyolitic melt. The bubbles dragged filament-like mafic melt streaks into the rhyolitic melt. Furthermore, numerical simulations of Montagna et al. (2015) show that the mingling of volatile-rich shoshonitic and partially degassed phonolitic magma develops over a short timescale of hours.
Despite these numerous experimental studies on bimodal melts, experiments to simulate degassing processes driven by magma injection are still lacking. Therefore, this study aims to find an experimental approach to investigate H2O degassing processes by simulating the injection of volatile-bearing basaltic melt into an H2O-saturated differentiated felsic melt. The main questions that we try to answer in this study are as follows: how do interdiffusion processes between the rhyolitic and basaltic melt influence the H2O solubility in the developing intermediate melt composition? Would this further affect the vesicle nucleation? Which zone of bulk melts is influenced by the degassing and mixing processes, dependent on time and decompression rate?
2.1 Starting material
Rhyolitic and basaltic glasses similar to the bimodal magma compositions of the Askja volcanic complex (Sparks et al., 1977) were synthesized. A modification was implemented on the rhyolitic composition to obtain a simplified and slightly peralkaline haplogranitic composition (Ab38Or34Qz28, in wt %; Holtz et al., 1992) with a Na2O excess of 2 wt %. The modification was chosen to obtain a nearly bubble-free glass and a distinct interface between the intense, dark brown basaltic glass and the iron-free colorless and transparent rhyolitic glass to best visualize the expected bubble textures and possible mixing effects. The basaltic composition was synthesized according to the analyses of Philpotts and Ague (2009) (Table 1). To receive homogeneous starting glasses of rhyolitic and basaltic composition, the glass syntheses were conducted following the experimental protocol of Marxer et al. (2015) and the improvement described in Allabar and Nowak (2018). This procedure ensured crystal- and tension-free homogeneous glasses that are nearly free of air bubbles. Cylinders up to 13 mm in length and 5 mm in diameter were drilled from the glasses. The sharp edges of each glass cylinder were sanded and rounded to prevent capsule damage during pressurization. The glass compositions were confirmed with electron microprobe analysis (EMPA) (Table 1).
2.2 Hydration experiments
Rhyolitic and basaltic glass cylinders were used as starting material for preparatory hydration experiments. Previous studies indicated that hydration experiments at high P and T (temperature) using glass powder induced the formation of numerous small vesicles in the sample volume due to excess H2O fluid in the case of saturated conditions (e.g., Gardner et al., 1999; Iacono-Marziano et al., 2007) or due to H2O–N2 vesicles in the case of H2O-undersaturated conditions (e.g., Preuss et al., 2016). Annealed and cleaned Au80Pd20 tubes (outer diameter: 5.4 mm; inner diameter: 5.0 mm), with lengths depending on the specific glass cylinder lengths, were closed at the bottom with Au80Pd20 lids while the other side was crimped to a star shape, to stabilize the shape of the capsules at high P and T (Marxer et al., 2015).
To ensure H2O saturation of the melt during the hydration experiments, 6 wt % to 7 wt % water was welded together with the rhyolite or basalt glass cylinders into the capsules (Fig. 1). Under hydration conditions of 200 MPa and 1523 K, calculated H2O solubilities are 5.7 wt % H2O in the mildly peralkaline rhyolitic melt (Allabar et al., 2022) and 4.8 wt % H2O in the basaltic melt (Berndt et al., 2002). Consequently, the excess water added to the capsules ensured complete H2O saturation for both melt compositions. To check for possible leakage, the sample capsules were reweighed after heating to 383 K and after pressurization in a cold seal pressure vessel to 100 MPa at room temperature and again after storing at 393 K at ambient pressure. In the case of constant weight, the capsules were used for hydration experiments.
The hydration experiments were performed in an internally heated argon pressure vessel (IHPV) at 1523 K and 200 MPa for 96 h at an intrinsic oxygen fugacity close to ΔlogQFM (Berndt et al., 2002). After hydration, the melts were quenched isobarically with a moderate quench rate of ∼ 16 K s−1 (NQ; Allabar et al., 2020) to room temperature by switching off the IHPV furnace. This ensured the production of crack-free glass cylinders that were used for the magma injection experiments. The capsules were then punctured and heated at 383 K for at least 24 h to gravimetrically determine the amount of released free water to calculate the H2O content of the glass (Table 2).
2.3 Preparation of hydrated samples
The hydrated glass cylinders were prepared for further decompression experiments and analysis. The cylinders were unwrapped from the capsule material. The 500 µm slices were cut from the middle of the samples perpendicular to the cylinder axis for the preparation of double-sided polished thin sections to be used for sample characterization. The remaining sample halves were ground and polished each on one cylinder face. This procedure enabled an ideal contact surface of two glass cylinders required for the bimodal decompression experiments.
2.4 Bimodal decompression experiments
For each bimodal magma injection (MI) experiment, a hydrated rhyolite cylinder and a hydrated basalt cylinder were inserted into a new Au80Pd20 capsule, oriented as rhyolite on top of basalt or basalt on top of rhyolite (Table 2). The polished faces of both glass cylinders were horizontally aligned to prevent air entrapment between the cylinder faces. Air entrapment could cause the formation of pre-existing vesicles between the two cylinders during the melting process (e.g., Wiesmaier et al., 2015), which may affect the degassing process during subsequent decompression as an experimental artifact. To test this experimental design, a reference sample was prepared where two rhyolite cylinders of one hydrated sample were contacted in a capsule (Fig. 1).
The bimodal experiments were conducted in the IHPV equipped with a rapid quench device (Berndt et al., 2002). Five experiments were performed:
-
one decompression reference experiment (rhyolite–rhyolite Rt–Rt: MI_Rt_1) to validate the new experimental procedure
-
one bimodal reference experiment (rhyolite–basalt Rt–B: MI_5) to determine the initial melt conditions after thermal equilibration and before decompression
-
three bimodal decompression experiments (Rt–B: MI_T_3, MI_6 and MI_7) to study H2O degassing in a bimodal magma system.
All samples were heated isobarically at the initial pressure (Pi) of 210 MPa at 25 K s−1 from room temperature to the run temperature (Tr) of 1348 K or 1403 K (Table 2). The P and T conditions ensured H2O undersaturation to prevent H2O loss during the temperature equilibration of 10 min. Except for experiment MI_5, the hydrous bimodal melt assemblages and the Rt–Rt melt assemblage were decompressed isothermally, using a high-pressure valve optimized for continuous decompression (e.g., Nowak et al., 2011; Allabar and Nowak, 2018). Decompression rates of 0.17 or 1.7 MPa s−1 were applied until the final pressure (Pf) of 100 MPa was reached. To minimize partial crystallization of the basaltic melt, all MI samples were quenched at a medium quench rate (MQ) of ∼ 44 K s−1 (Allabar et al., 2020). Because rhyolitic melt is not as prone to the quench-crystal formation, the Rt–Rt sample was quenched more slowly at ∼ 16 K s−1 to room temperature by switching off the furnace. After re-weighing the capsules to determine possible H2O loss due to leakage, the decompressed samples were cut parallel to their cylinder axes. One-half of each sample was embedded in epoxy resin, ground, polished, and sputtered twice with a 5 nm carbon coating for EMPA and scanning electron microscopy (SEM) analysis, while the other half was used for the preparation of double-sided polished thin sections of ∼ 200 µm thickness (d; measured with a Mitutoyo digital micrometer (± 3 µm); Table 2) for Fourier transform infrared (FTIR) spectroscopy and optical microscopy.
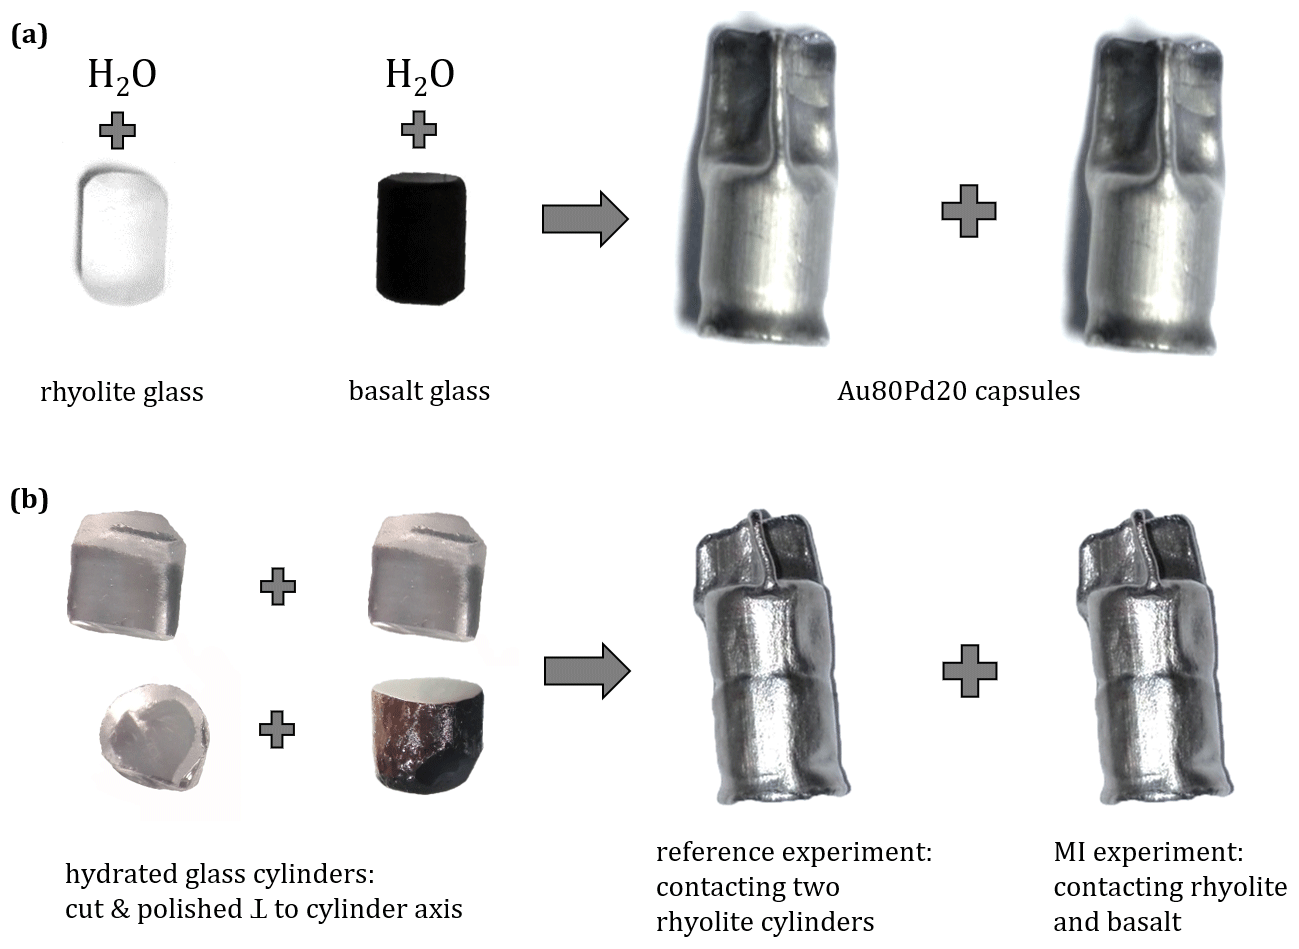
Figure 1(a) Glass cylinders of rhyolite (Rt_5_h) and basalt (B_4_h), each rounded at the edges, are welded separately into an Au80Pd20 tube (outer and inner diameter: 5.4 and 5.0 mm) with 7 wt % or 6 wt % H2O, respectively. Hydration experiments were conducted in the IHPV at 200 MPa and 1523 K and equilibrated for 96–168 h. (b) The quenched glass cylinders were unwrapped, cut perpendicular to the cylinder axis, and ground and polished at one side of each cylinder face. Contact of a pair of hydrated rhyolite cylinders or a hydrated rhyolite and a hydrated basalt glass cylinder in a new Au80Pd20 tube. Decompression experiments were conducted in the IHPV at 1348 and 1403 K with decompression from 210 to 100 MPa and with rates of 0.17 or 1.7 MPa s−1.
Table 1Glass composition of rhyolite and basalt, measured by EMP, similar to the compositions of the 1875 Askja bimodal eruption (Sparks et al., 1977). Averaged magnetite composition of eight crystals measured in the basalt of MI_T_3. Intermediate melt composition of MI_T_3, MI_7, and MI_6 in the region of enhanced vesicle formation in the hybrid zone. The data of all EMP measurements are given in weight percent (wt %).
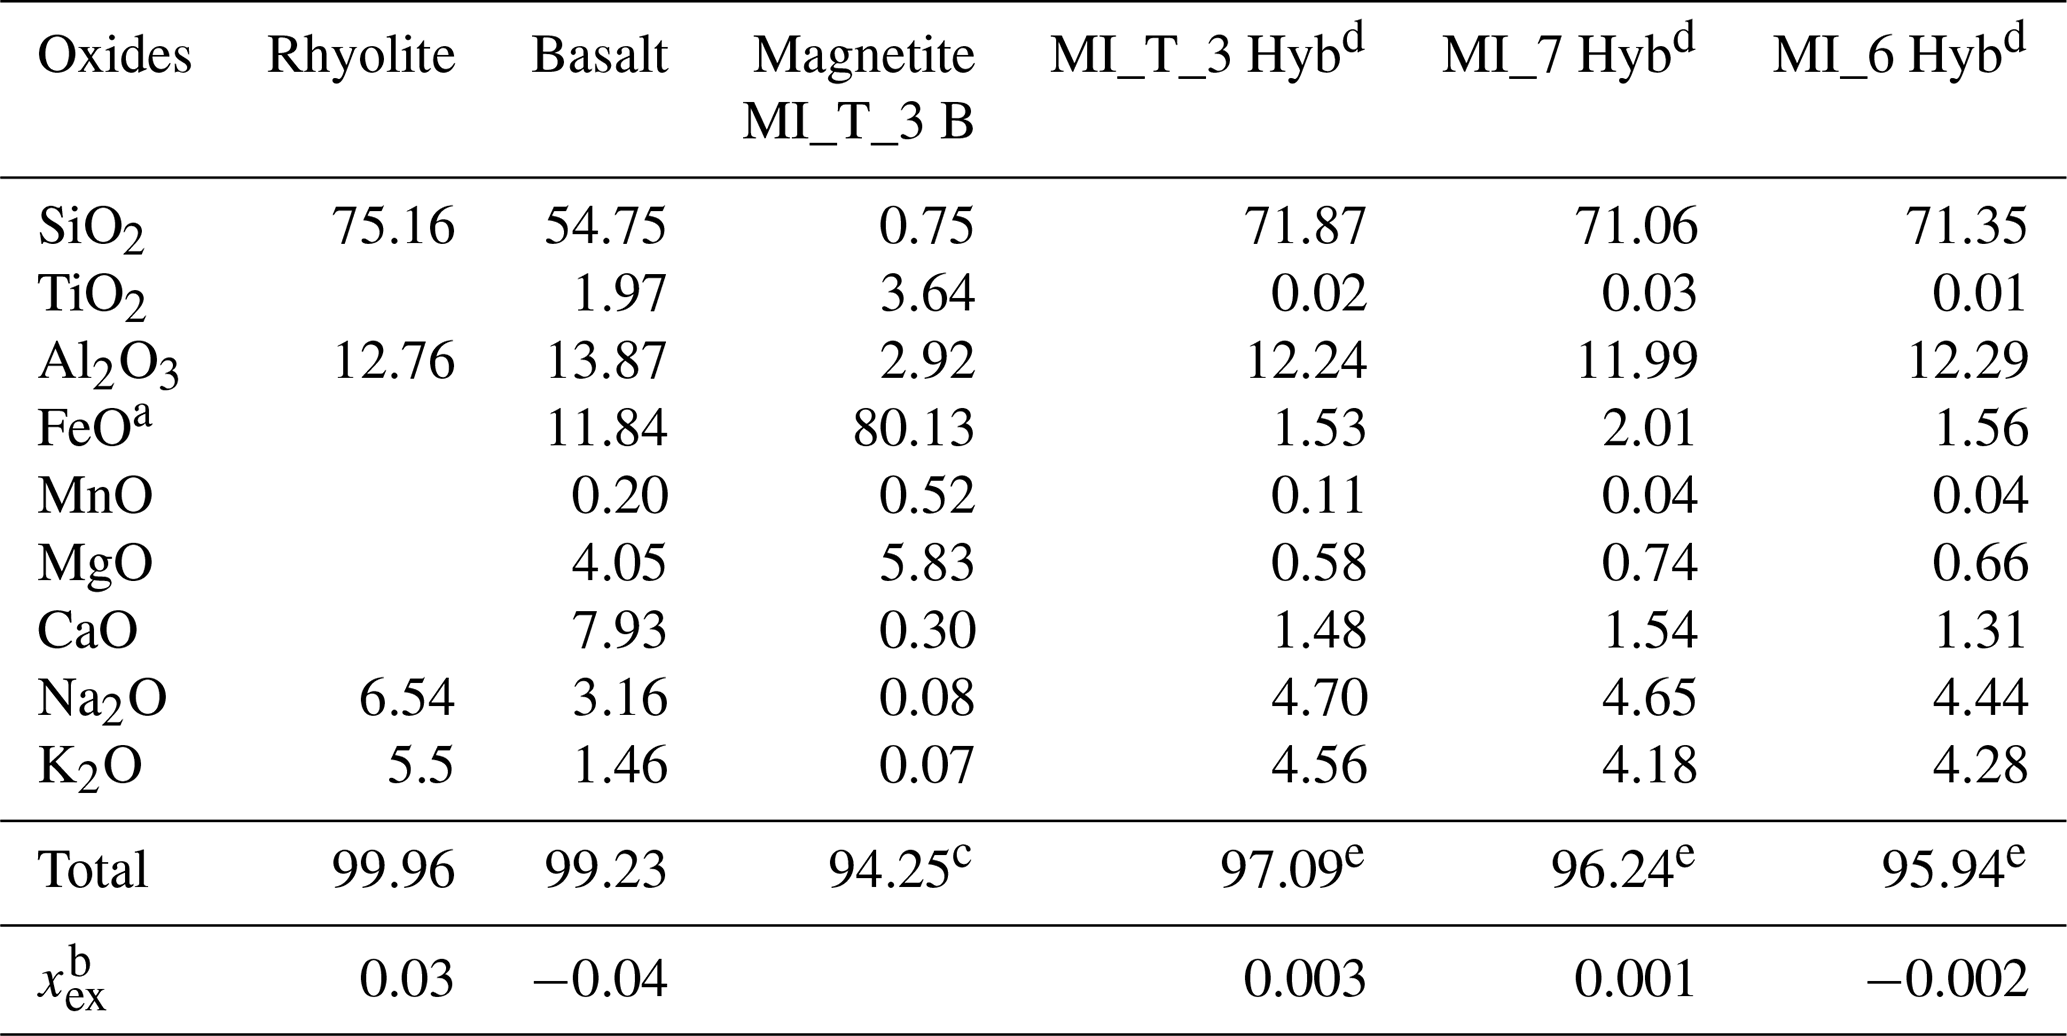
a Total Fe concentration is given as FeO. b xex is the difference between mole fractions of alkalis and those of alumina ((Na2O + K2O–Al2O3) 100) (Allabar et al. 2022). c FeO converted to FeO and Fe2O3 (Carmichael, 1967) gives a total of 100.3 wt % and 100.1 wt % without considering alkali oxides, respectively. d Zone where enhanced vesicle formation is observed. e Total < 100 wt % due to the H2O content of the hydrated glass.
Table 2Experimental conditions for hydration and decompression experiments in the IHPV. H2O solubilities (H2O sol.) at 200 MPa and 1523 K in rhyolitic melt were calculated according to Allabar et al. (2022) and in basaltic melt according to Berndt et al. (2002).
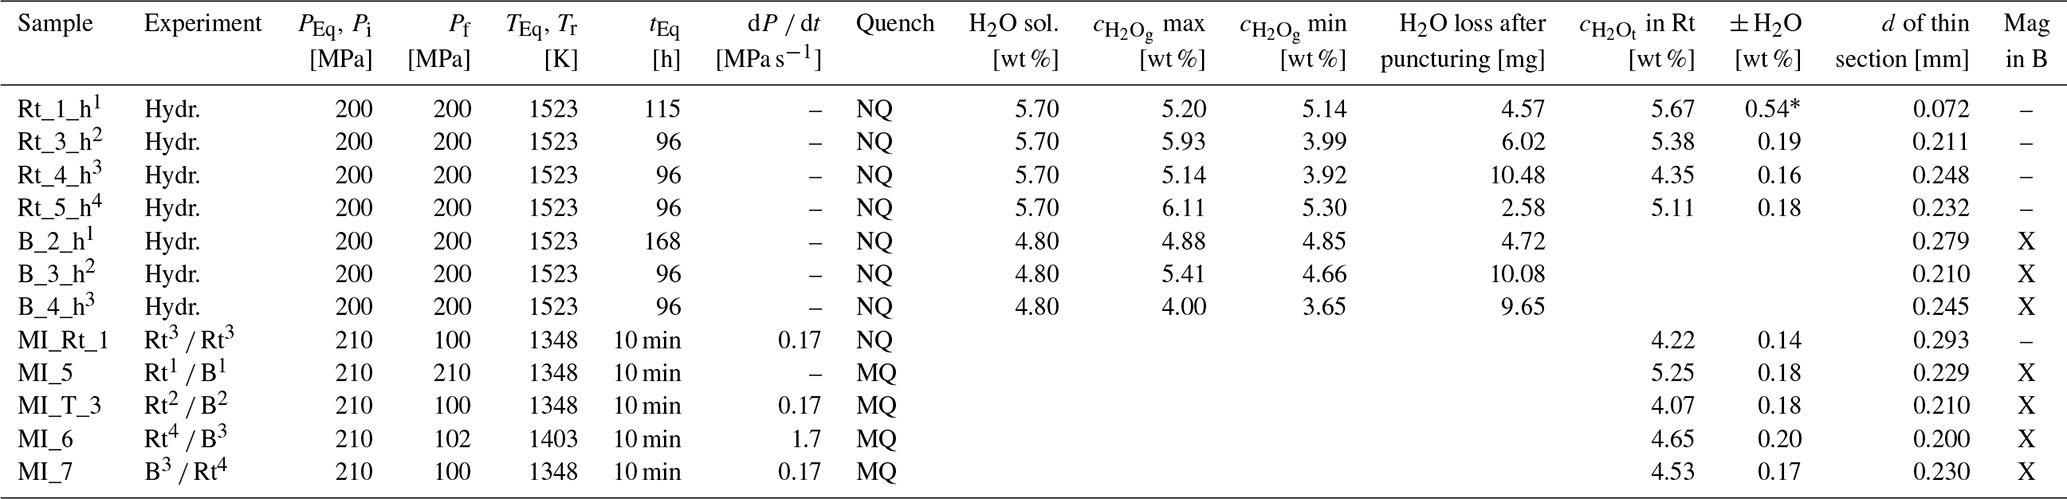
PEq is equilibration/hydration pressure; Pi is initial pressure prior to decompression; Pf is final pressure; TEq is equilibration/hydration temperature; Tr is run temperature during experiment; tEq is equilibration/experiment duration; dP dt is decompression rate; NQ: 16 K s−1; MQ: 44 K s−1; H2O sol. is H2O solubility at 200 MPa and 1523 K; d is thickness; Rt is rhyolite; B is basalt; Mag is magnetite. The max is gravimetrically determined H2O concentration in the melt if all weight loss of the sample during the experiment, and after piercing and drying was H2O → maximum possible H2O concentration in melt. The min is gravimetrically determined H2O concentration in the melt if all weight loss of the sample during welding, during the experiment, and after piercing and drying was H2O → minimum possible H2O concentration in melt. The is total H2O concentration in rhyolite glass, determined by FTIR spectroscopy. Hydr. is hydration experiment (7 wt % H2O added into the capsule for H2O excess during hydration); Rt B is Rt on top of B; B Rt is B on top of Rt; the use of the hydrated samples is assigned by the superscript numbers. * Increased error due to the significantly lower thickness of the thin section of 0.072 mm.
2.5 Analytical methods
2.5.1 Electron microprobe analysis
The bulk compositions of the nominally dry starting glasses were analyzed with a JEOL JXA 8900 R electron microprobe (EMP). Wavelength-dispersive X-ray spectroscopy analyses were conducted by using an acceleration voltage of 15 kV, a beam current of 3 nA, and a defocused beam with a diameter of 20 µm to optimize for Na analysis (e.g., Morgan and London, 2005; Stelling et al., 2008). Beam counting times were 10 s (Na), 16 s (K, Si, Ca, Al, Mg, Fe), and 30 s (Mn, Ti). To test the homogeneity of the glasses and the agreement with the desired glass composition, 15 points were measured across an entire glass cylinder section of each composition. In sample MI_T_3, one concentration profile was measured across the hybrid zone from the lower basalt to the overlying rhyolite. The samples MI_5, MI_6, and MI_7 were analyzed using a JEOL JXA 8230 electron microprobe under the same conditions but with a beam current of 10 nA. Concentration profiles were measured across the samples, from the initial basaltic composition to the initial rhyolitic composition. EMPA data are given in Table S1 in the Supplement.
2.5.2 Scanning electron microscopy
The experimental samples were examined with a Hitachi TM3030plus Tabletop SEM, an electron beam current of 50 nA, and an acceleration voltage of 15 kV. Backscattered electron (BSE) images of the samples were acquired at up to 5000× magnification (Fig. S1). The overview images of the entire samples were generated by adjusting the grey values of individual images and stitching (Fig. 2). BSE images were used to estimate vesicles in the central volume with a number density (VND) using ImageJ and CSD corrections (Higgins, 2000) as described in Marxer et al. (2015) and Preuss et al. (2016).
2.5.3 FTIR spectroscopy
The total H2O concentrations () of the hydrated and decompressed rhyolite glasses were determined by FTIR spectroscopy. The samples were analyzed in the near-infrared range (4000–6000 cm−1) with the Bruker Vertex v80 FTIR spectrometer coupled with the HYPERION 3000 IR microscope by using a tungsten halogen light source, a CaF2 beam splitter, a liquid-N2-cooled InSb single-element detector, a 15× Cassegrain objective, and the OPUS 7 software package. Overview images of the thin sections were recorded, and the positions of the measuring points were programmed and subsequently automatically measured. With a knife-edge aperture set to 50×50 µm, the samples were measured with 50 scans per spectrum in transmission mode at a spectral resolution of 4 cm−1. Air was measured as a reference. Each measurement location was tested to be free of fluid vesicles in the analyzed glass volume by focusing through the thin section. To determine spatial variations in the H2O concentrations throughout the sample, profiles were measured along the longitudinal and transverse cylinder axes. The infrared data are given in Table S1 in the Supplement.
The of the hydrated rhyolite samples was determined by measuring the peak heights of the absorbances (A) of the combination modes of molecular H2O (H2Om) at ∼ 5210 cm−1 and hydroxyl groups (OH) at ∼ 4470 cm−1. A linear-tangential baseline correction (Behrens et al., 1996) was applied by setting points at ∼ 5400 and ∼ 4700 cm−1, ensuring that the straight line is tangential to the spectrum between the absorption bands at 5210 and 4470 cm−1. For evaluation, the linear molar absorption coefficients ( L mol−1 cm−1, εOH=1.59 L mol−1 cm−1) and the density correlation (ρAOQ2 [g L−1] = (2351±2) − (12.3±0.6) ⋅ ) from Allabar et al. (2022) were used. Because near-infrared measurements in transmission mode were impossible for basaltic glasses, the total H2O concentration was determined gravimetrically () (Table 2).
2.5.4 X-ray diffraction
For the identification of crystals of the partially crystallized basaltic hydration and MI samples, a Bruker D8 Discover μ-XRD (X-ray diffraction) with a VÅNTEC 500 2D detector was used together with a cobalt radiation source (λ=1.79 Å), a HOPG primary monochromator, and a 500 µm monocapillary optic. All basaltic samples were measured for 180 s with an acceleration voltage of 30 kV and an electric current intensity of 30 mA. The angle of incidence of the X-ray beam was set to 10∘ and the detector to 25∘. The diffraction patterns of the crystalline phases were evaluated using the Bruker software DIFFRAC.EVA.
2.5.5 Transmitted light microscopy
Vesicles in transparent sample thin sections were quantified using the Zeiss Axio Imager M2M microscope and the software “Trackworks”. Each measurement was performed by focusing through the sample in a predefined area, resulting in an analyzed sample volume that was used to normalize the number of vesicles to 1 mm3 of vesicle-free glass. The errors in the transmitted light microscopy (TLM) analyses were calculated using error propagation, assuming errors of 5 % for vesicle size and vesicle number, as well as ± 3 µm for sample thickness.
3.1 Hydration samples
All quenched capsules were punctured after 96–168 h of hydration. Since all samples showed a weight loss after 24 h in the compartment drier (383 K), water in the punctured capsules evaporated, showing that a free H2O-fluid phase during the entire experiment duration was ensured. The mass of the evaporated excess water was used to calculate by difference the dissolved H2O concentration in the melt under the given experimental conditions (Table 2).
However, during the welding of precious-metal capsules, it may happen that tiny droplets of molten metal form and stick as metal beads to the outside of the welded capsule. At some point, these beads may fall off and cause a weight loss of several milligrams. The associated precious-metal loss cannot be distinguished from any possible water loss during welding. This affects the gravimetric determination of the H2O content dissolved in the melt. To account for this uncertainty, a maximum (-max) and minimum (-min) H2O concentration in the melt was calculated under the respective assumption that the weight loss measured after welding is related to total capsule material or total water, respectively.
The lowest was calculated for the sample Rt_4_h (max: 5.14 wt %; min: 3.92 wt %). FTIR spectroscopic measurements provide a of 4.35 ± 0.16 wt % H2O. FTIR measurements of samples Rt_1_h, Rt_3_h, and Rt_5_h result in of 5.67 ± 0.54 wt %, 5.38 ± 0.19 wt %, and 5.11 ± 0.18 wt % H2O, respectively. The calculated H2O solubility of 5.7 wt % under hydration conditions was not reached in samples Rt_3_h, Rt_4_h, and Rt_5_h. This could be related to the longer hydration time of more than 96 h required for the sample cylinder length of 11 mm compared to 6.5 mm (Preuss et al., 2016; Allabar and Nowak, 2018). Nevertheless, FTIR spectroscopic measurements confirmed that a homogeneous H2O distribution was ensured in the rhyolite glass cylinders (Rt_1/3/4/5_h).
FTIR spectroscopic measurements of basaltic samples were not possible because of the partially crystallized glasses. The samples are opaque to the near-infrared radiation. Even reducing the section thickness of B_3_h to ∼ 50 µm does not allow the infrared radiation to penetrate the sample. However, the calculations of B_2_h with 4.88 wt % (max) and 4.85 wt % (min), as well as sample B_3_h with 5.41 wt % (max) and 4.66 wt % (min), agree sufficiently well with the expected solubility of 4.8 wt % (Berndt et al., 2002). After hydration of sample B_4_h, the capsule had a noticeable weight loss of 9.06 mg, which is attributed to H2O leaking out during the hydration process. Nevertheless, still some H2O escaped after puncturing the capsule and during drying in the compartment drier. A calculated (max–min) of 4.00 wt %–3.65 wt % resulted for this sample. However, the reduced H2O concentration in the undersaturated basalt samples does not significantly affect the degassing mechanism of the bimodal experiments, as explained in the following discussion.
The investigation of the hydrated samples with XRD showed that all rhyolitic samples were crystal-free, while the basaltic samples contain magnetite and pyroxenes. This crystal analysis was confirmed by investigating the basaltic samples with the SEM. The BSE images also confirm that a significant volume of the basalt samples is partially crystallized. Idiomorphic magnetite crystals up to 2 µm in size are surrounded by dendritic pyroxene quench crystals (Fig. S1).
Optical inspection and SEM analysis confirmed that all hydrated samples were vesicle free. Furthermore, all hydrated rhyolitic and basaltic samples had a cylindrical shape and were therefore ideally suited for the subsequent bimodal decompression experiments.
3.2 Reference experiments
3.2.1 Decompression reference experiment
The reference decompression experiment MI_Rt_1 was intended to validate the new experimental procedure of contacting two hydrous glass cylinders without air entrapment in between. Images of the embedded sample halves and the thin section show heterogeneously nucleated fringe vesicles attached to the capsule wall with a vesicle-free drainage zone (Navon and Lyakhovsky, 1998; Iacono-Marziano et al., 2007). Homogeneously distributed vesicles formed in the entire center sample volume (Fig. 2a). The former interface (indicated by a small kink at the capsule wall) between the two hydrous rhyolite cylinders is no longer visible and enhanced vesicle formation at the former interface is not observed. Therefore, the developed experimental design can be used for further magma injection experiments. The sample contains a VND of 1.8×102 mm−3 with a mean diameter of ∼ 75 µm, determined by TLM. The was measured as a vertical profile from the sample top to the sample bottom and results in 4.22 ± 0.14 wt %.
3.2.2 Bimodal reference experiment
The bimodal reference experiment MI_5 shows the initial melt conditions after heating and thermal equilibration for 10 min at 1348 K and 210 MPa before decompression. Due to the fast quench rate of 44 K s−1, glass tensions in the sample induced cracking and only a small piece of initially contacted bimodal composition volume was preserved (Fig. 2a). No vesicles formed during the experiment, neither in the rhyolitic nor in the basaltic part of the sample. The basalt is partially crystallized with 1–3 µm sized magnetites. Quench crystals attached to the magnetites as found in hydration samples quenched at 16 K s−1 (Fig. S1) are not observed. FTIR measurements of the upper rhyolitic glass result in a mean of 5.25 ± 0.18 wt % and are therefore slightly lower than the initial of Rt_1_h with 5.67 ± 0.54 wt %.
The zone between the rhyolitic and basaltic glass that developed during the experiment can be optically characterized by its color transition towards the endmember compositions. While the rhyolitic glass is colorless and transparent, the contact zone turns transparent brownish to nearly black and opaque towards the basaltic part (Figs. 2a, 5). The onset of crystal occurrence corresponds to the black coloration in the optical image. EMP analysis across the sample, parallel to the cylinder axis, shows the development of an intermediate melt composition at the former contact zone of rhyolitic and basaltic melt. The diffusing species are charged ions and complicated multicomponent interdiffusion processes of oxygen and cations with different charges, as well as different concentrations, and mobilities are expected to maintain charge neutrality (e.g., Watson, 1982; Baker, 1992; Johnston and Wyllie, 1988; Zhang et al., 2010). For a simplified illustration of the interdiffusion processes, we refer to the concentration profiles of oxide components. Figure 3 shows concentrations of oxide components normalized to a range between 0 (lowest concentration) to 1 (highest concentration). This highlights the similarities and differences in the concentration–distance profiles for all measured oxides. Na2O, K2O, and SiO2 concentrations decrease from the rhyolitic glass in the direction to the basaltic glass. Al2O3, TiO2, FeO, MgO, and CaO concentrations decrease from the basaltic glass in the direction to the rhyolitic glass. Na2O and K2O show asymmetric concentration profiles and a significantly greater length compared to SiO2, TiO2, FeO, MgO, and CaO. The normalized Al2O3 concentration is characterized by a strong variation over the entire profile, caused by the small difference in the initial concentration of the starting compositions of 1.11 wt % (Table 1). MnO concentrations are close to the detection limit and are not shown in Fig. 3. For a subsequent assessment of all samples, the SiO2 concentration profiles of all samples were evaluated to define the length of the mixed hybrid zone. For the reference sample MI_5, the SiO2 concentration profile extends over 0.3 mm (Table 3, Fig. 3).
To examine a concentration profile across the hybrid zone, the FTIR spectra were baseline-corrected according to Ohlhorst et al. (2001). Straight lines were fitted through the minima on both sides of the NIR combination bands related to H2Om and OH to evaluate the peak heights. As this baseline correction systematically underestimates the OH absorption (Ohlhorst et al., 2001), standard samples of rhyolitic composition (AOQ2, from Allabar et al., 2022) were baseline-corrected according to Behrens et al. (1996) and Ohlhorst et al. (2001) for comparison. The differences in , calculated with the and εOH of both corrections, are within the error in the of each sample, except for sample Std_2_7 with the highest H2O content of 6.9 wt % (Table S1).
Ohlhorst et al. (2001) developed a parabolic equation (Eq. 1) to predict the linear molar absorption coefficients (ε) as a function of the SiO2 content of the glass, valid for compositions from rhyolite to basalt:
ε values are given in liters per mole per centimeter (L mol−1 cm−1), , b=0.000257 (given parameters for the baseline correction used), and is in weight percent (wt %), resulting in rhyolite absorption coefficients of and εOH = 1.32 L mol−1 cm−1. For the initial basaltic composition, and εOH=0.64 L mol−1 cm−1 were calculated. The concentration profile of MI_5 matches with the profile, since the inflection point of the profile coincides with the first measurement in the color transition from brownish to transparent glass (hereafter referred to as the “midpoint”). To calculate the of the FTIR-measured profiles across the hybrid zone, each measurement point was assigned the corresponding SiO2 concentration from the EMP measured profile. For the presented profile of MI_5 (Fig. 4), this corresponds to 73.0 wt % SiO2 for the first measurement in the rhyolitic part to 60.8 wt % SiO2 for the midpoint and 55.8 wt % SiO2 for the last measurement in the basaltic part of the profile (Table S1). Using these concentrations, respectively, absorption coefficients of and L mol−1 cm−1 were calculated with Eq. (1). The same procedure was used for all other measurement points.
The glass density, necessary for the calculation of with the Beer–Lambert law, at the corresponding measurement point was calculated according to the equations of Allabar et al. (2022, Eq. 2), Yamashita (1997, composition no. 43gm, Eq. 3), and Ohlhorst et al. (2001, Eq. 4) for rhyolite, dacite, and basalt, respectively. The equation for the density of dacite was chosen because the hybrid composition at the midpoint is quite similar to the dacite of the Unzen volcano given in Chen et al. (1993):
where ρ is in grams per liter (g L−1) and is in weight percent (wt %). The dependence of the glass density on the H2O content in the glass required an iterative calculation. As the composition changes over the total profile, Eqs. (2)–(4) were only applied for three data points. Equation (3) was applied to the midpoint. Depending on the length of the hybrid zone determined by EMPA, the measurement points in the hybrid composition were iteratively calculated by interpolating the density between the dacite density of the midpoint and the rhyolite density or the basalt density. This whole procedure was also applied to the other MI samples to be able to determine the H2O concentrations across the hybrid zone of the samples.
FTIR measurements with absorbance values greater than 1 were excluded from evaluation because less than 10 % of the light penetrates the samples in these measurements, which may result in a nonlinear behavior where the Beer–Lambert law is no longer valid (Mayerhöfer and Popp, 2019). This is especially relevant in the zone with increasing basaltic influence. Such measurements are still displayed in the profile but marked as open circles (Fig. 4). FTIR measurement points to which no data point was assigned, as in MI_7 and MI_6, did not yield analyzable NIR spectra due to crystals in the basalt glass.
The profile in Fig. 4 across the hybrid zone of the undecompressed sample MI_5 shows an increase towards the basaltic composition. The profile starts with a mean of 5.36 ± 0.20 wt % in the rhyolitic part, followed by a slight decrease in towards the transition to the hybrid zone down to 5.08 ± 0.21 wt % in the middle of the hybrid data points at 0.38 mm. Further on, significantly increases up to 6.15 ± 0.30 wt %. With this data point, an H2O concentration is reached that exceeds the initial H2O content () of the rhyolite melt by 0.5 wt %. If the last data points with excessive absorbance (> 1) were included, up to 6.71 ± 0.37 wt % would be reached, exceeding the initial concentration by 1 wt %. Besides the profile, the hybrid zone is also characterized by the SiO2 concentration profile, marked in grey, scaled on the right y axis. The hybrid zone extends over a length of 0.3 mm.
Table 3The measured by FTIR spectroscopy from rhyolite to hybrid zone to basaltic composition. The values based on measured absorptions (A) > 1 are listed in a separate column. Hyb. signifies hybrid.
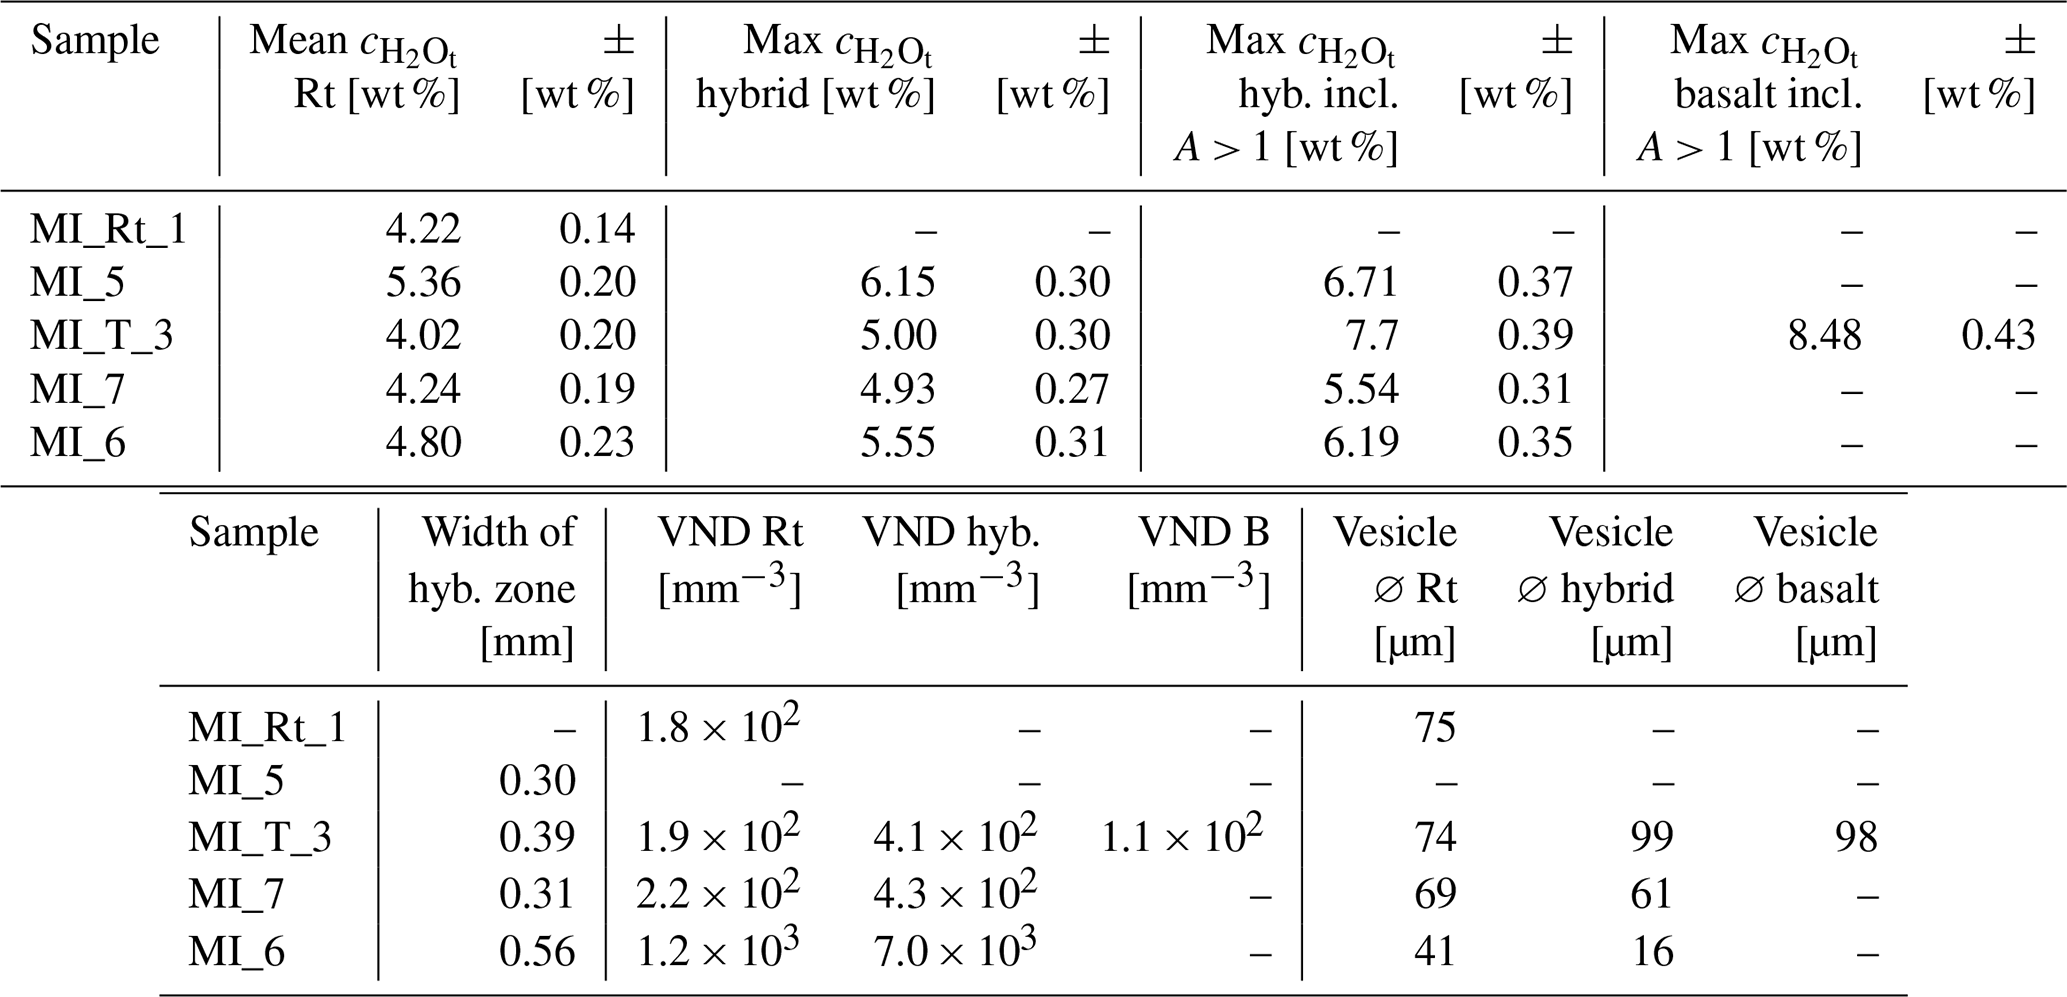
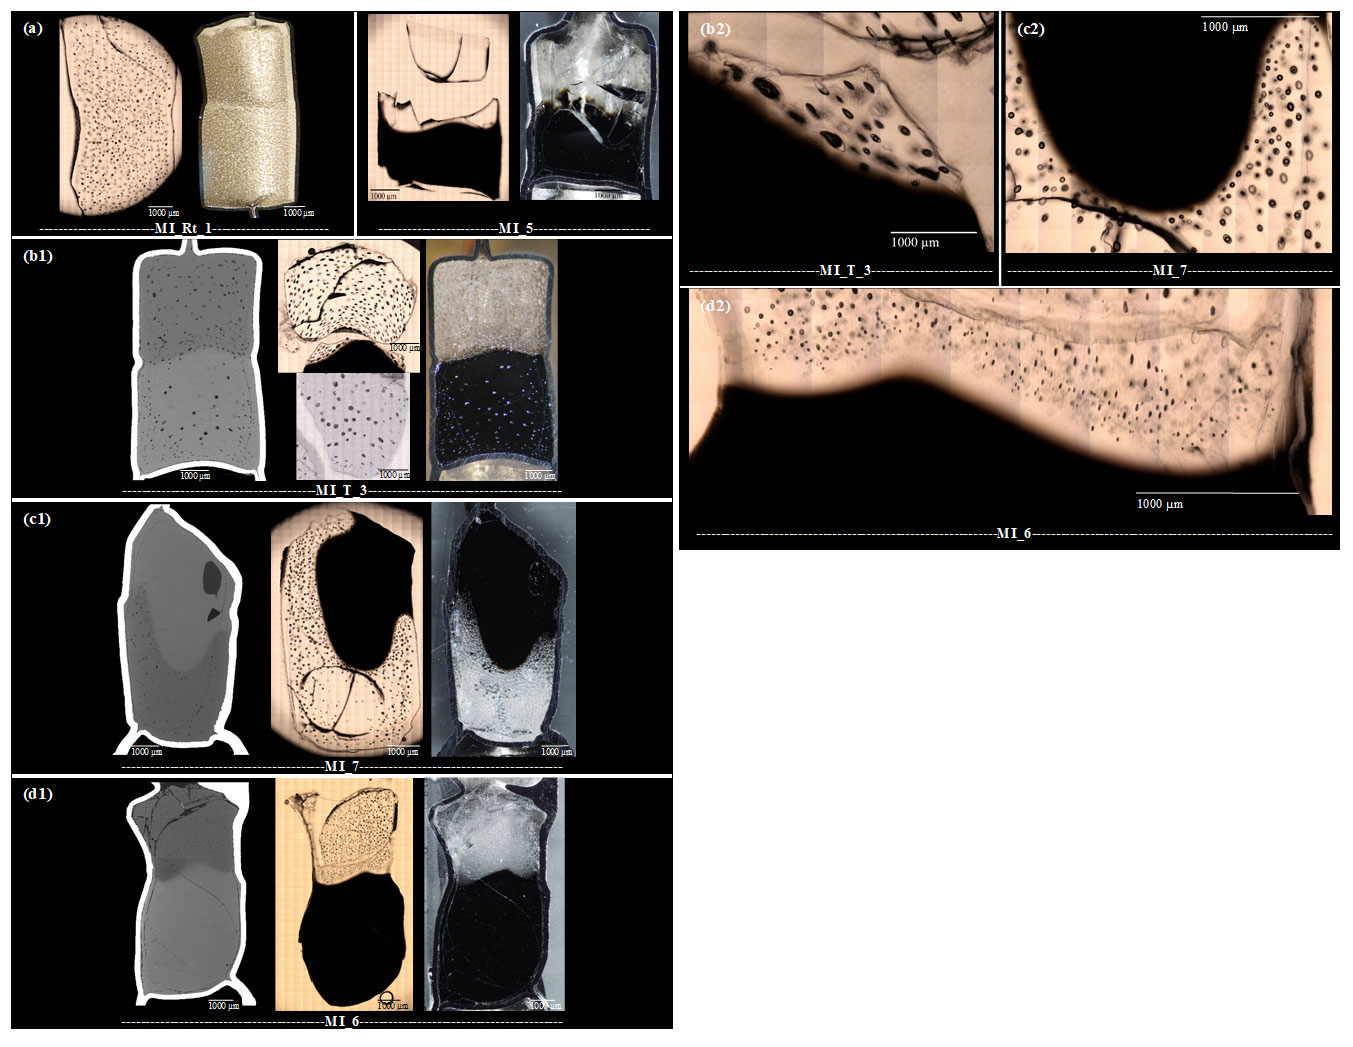
Figure 2Microscope, BSE, and reflected light images of MI samples, cut and polished along the cylinder axis. BSE and reflected light images were captured from the embedded sample halves, while the microscope images show the IR slides in transmission or reflection mode. All basaltic glasses contain magnetite crystals. The hybrid melt zone of the MI experiments developed between the rhyolitic melt and the basaltic melt. (a) The reference experiment MI_Rt_1 with two hydrated rhyolitic glass cylinders was thermally equilibrated at 210 MPa and 1348 K for 10 min and then decompressed with 0.17 MPa s−1 to 100 MPa. Vesicles are homogeneously distributed with mean diameters of ∼ 75 µm. No enhanced vesicle formation occurred at the previous contact plane. The undecompressed reference sample MI_5 was thermally equilibrated at 210 MPa and 1348 K for 10 min and subsequently quenched to room temperature. A narrow hybrid melt zone formed between the endmember compositions (Table 3). (b) The sample MI_T_3 was thermally equilibrated at 210 MPa and 1348 K for 10 min, followed by decompression at 0.17 MPa s−1 to 100 MPa. The upper rhyolitic glass is homogeneously vesiculated (mean vesicle diameter of ∼ 74 µm). The basaltic glass volume contains vesicles with different sizes ranging from 56 to 224 µm, with an average of 98 µm. The hybrid zone is decorated by a series of ∼ 99 µm sized vesicles, elongated along the contact boundary. (c) The sample MI_7 with basalt on top of rhyolite was thermally equilibrated at 210 MPa and 1348 K for 10 min and then decompressed with 0.17 MPa s−1 to 100 MPa. The basalt is nearly vesicle free, while the rhyolite is highly vesiculated (mean vesicle diameter of ∼ 69 µm). Towards the contact zone of rhyolite and basalt, the VND increases, while the vesicle diameter decreases to ∼ 61 µm. (d) The sample MI_6 was thermally equilibrated at 210 MPa and 1403 K for 10 min and then decompressed with 1.7 MPa s−1 to 102 MPa. The rhyolite glass is homogeneously vesiculated with vesicle diameters of ∼ 41 µm. The basalt is nearly vesicle free. The images show an increased VND in the hybrid zone, while the vesicle diameter decreases to ∼ 16 µm.
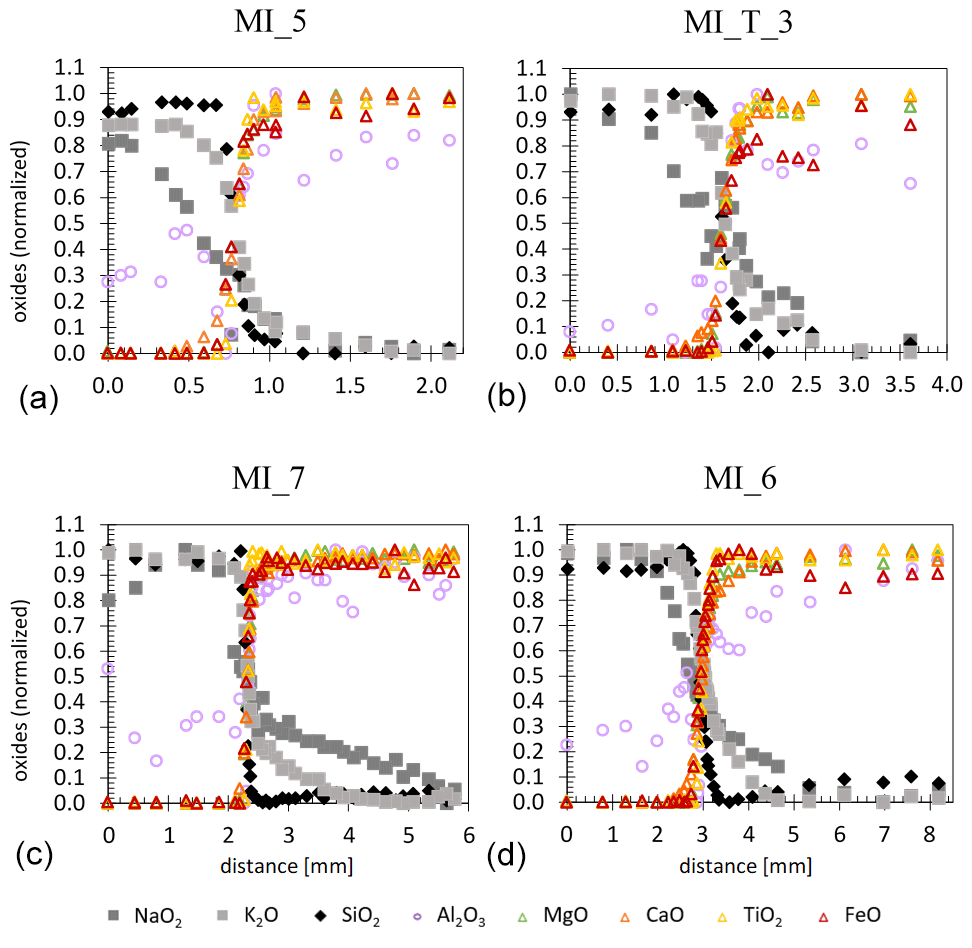
Figure 3EMPA-measured concentration–distance profiles of oxide components between initial rhyolitic composition (left) and initial basaltic composition (right) of MI_5, MI_T_3, MI_7, and MI_6. The concentrations of the individual oxides were normalized to a range from 0 to 1.
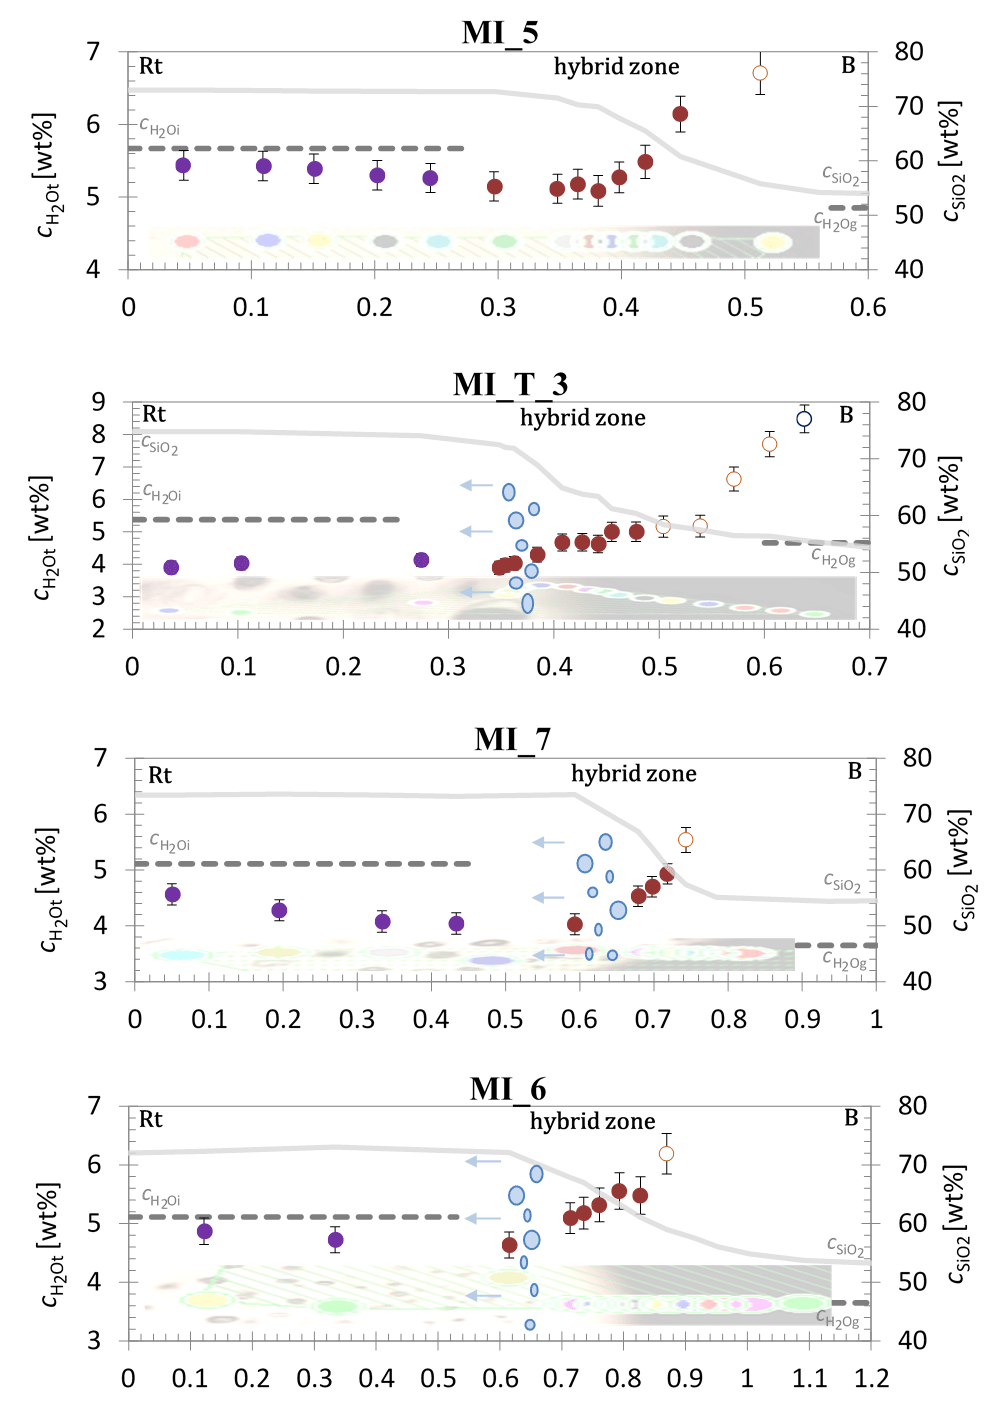
Figure 4C–distance profile from rhyolite to basalt through the hybrid melt zone of bimodal samples MI_5 (undecompressed), MI_T_3, MI_7, and MI_6. The in rhyolite is colored in violet, measurements in the hybrid melt zone are in red, and in basalt is shown in blue. Open circles illustrate based on NIR measurements with absorbances > 1 that were excluded from evaluation. Data points of the concentration–distance profile are visualized in the shaded transmission microscope images of the samples at the bottom of each plot. The initial H2O concentrations of the hydrated rhyolite (; determined by NIR) and the hydrated basalt (; determined gravimetrically) are displayed by the dashed lines (see Table 2). The hybrid zone is also characterized by the SiO2 concentration profile (), marked by grey solid lines, scaled on the right y axis. Illustrated by blue ellipsoids is the beginning of the enhanced vesiculated zone of the rhyolite-dominated part of the sample.
3.3 Bimodal decompression experiments
In samples MI_T_3 and MI_6, a slight indentation of the basalt into the overlying rhyolite can be seen in the central sample area. A gravitationally induced convective movement of the melts is preserved in sample MI_7. The basalt overlying the rhyolite sank into the rhyolite melt, squeezing the rhyolitic melt into the upper part of the capsule. This effect is visually enhanced by cutting the thin section slightly inclined from the cylinder axis (Fig. 2).
The decompressed MI samples (Fig. 2b, c, d) contain in the rhyolitic part heterogeneously nucleated fringe vesicles attached to the capsule walls with a vesicle-free drainage zone (Navon and Lyakhovsky, 1998; Iacono-Marziano et al., 2007) and a homogeneously vesiculated center volume. Vesicles close to the drainage zone are mostly deformed or elliptically shaped, whereas vesicles in the rhyolitic sample center are spheres. The basaltic parts of the samples MI_7 and MI_6 are not vesiculated. The sample MI_T_3 (Fig. 2b) contains vesicles distributed over the whole basaltic part. The vesicles near the capsule wall have small diameters of ∼ 25 µm and increase in size towards the center of the sample up to ∼ 250 µm, whereas the number of vesicles decreases towards the center. Opposite to the rhyolitic glass part, no vesicles nucleated heterogeneously at the capsule wall in the basaltic part of the sample.
The VND and the mean vesicle diameter of the sectioned vesicles in MI_T_3 were determined using the BSE image as described by Marxer et al. (2015) and Preuss et al. (2016). As the thin section was polished down to 53 µm thickness, each vesicle in the sample was cut and therefore not measurable under uncut conditions with TLM. The VND results in 1.9×102 mm−3 and ∼ 74 µm diameter in the rhyolitic glass and 1.1×102 mm−3 and ∼ 98 µm in the basaltic glass. VNDs and vesicle diameters of MI_7 and MI_6 were determined with TLM. The VND in the rhyolitic part of the samples MI_7 and MI_6 are 2.2 × 10² and 1.2 × 103 mm−3, respectively. The mean diameter of uncut vesicles in MI_7 is ∼ 69 µm and in MI_6 ∼ 41 µm (Table 3).
FTIR spectroscopic analysis of the central rhyolitic parts results in of 4.07 ± 0.18 wt % for MI_T_3, 4.53 ± 0.17 wt % for MI_7, and 4.65 ± 0.2 wt % for MI_6 (Tables 2 and S1). Measurements in the basaltic sample parts were not successful.
Minerals detected by X-ray diffraction in the partially crystallized basaltic glasses are magnetites, supported by EMPA. The crystals have sizes of 1–5 µm. Small dendritic quench crystals have grown around the magnetite crystals during quench (Fig. 6). EMP measurements of eight idiomorphic magnetite crystals in MI_T_3 (Table 1) result in a mean concentration of 80.13 wt % FeO* (*total Fe), 5.83 wt % MgO, 3.64 wt % TiO2, 2.92 wt % Al2O3, 0.75 wt % SiO2, and 0.52 wt % MnO. Very low concentrations of 0.3 wt % CaO, 0.08 wt % Na2O, and 0.07 wt % K2O were measured. The total sum of oxides is 94.25 wt %. Calculation of FeO and Fe2O3 from FeO* according to Carmichael (1967) results in an oxide sum of 100.3 wt % or 100.1 wt % without the alkali oxides. Based on the main oxide components of the composition, the crystals can be assigned to spinel and are hereafter referred to as magnetite. The quench crystals attached to the magnetite crystals are probably pyroxenes due to the dendritic texture and the depletion of SiO2 in the residual glass composition. These quench crystals could not be measured with the EMP as they are too small for analysis due to the fast cooling rate of 44 K s−1 and are present in concentrations that are too low for XRD analysis.
Hybrid zone
A compositional hybrid zone developed during the experiments between the rhyolitic and basaltic melts (Figs. 2, 3). All decompressed MI samples show an increase in VND or vesicle size near the contact zone of the two compositions. In the upper rhyolitic part of the contact zone of MI_T_3, the still transparent glass is indicated by a series of large vesicles with a mean diameter of ∼ 99 µm and a VND of 4.1 × 102 mm−3, elongated along the contact boundary (Fig. 6). The situation is different for samples MI_7 and MI_6, where a ∼ 0.2 mm wide vesicle-free zone is observed in MI_7 and a ∼ 0.3 mm wide vesicle-free zone is visible in MI_6 at the former contact zone (Fig. 7). In MI_7 and MI_6 the mean vesicle diameter near the contact zone decreases down to ∼ 61 and ∼ 16 µm, respectively. The VND in MI_7 increases from 2.2 × 102 mm−3 in the rhyolite volume to 4.3 × 102 mm−3 in the hybrid zone. The VND in MI_6 increases from 1.2 × 103 mm−3 in the rhyolite volume to 7.0 × 103 mm−3 in the hybrid zone (Table 3). Strikingly, the zone with the enhanced VND occurs in all bimodal decompressed samples in the rhyolite-dominated region of the hybrid zone (Fig. 4).
A color change from nearly opaquely black to semitransparent brownish to transparent colorless shows the development of intermediate melt compositions at the former contact zone of rhyolite and basalt, exemplarily shown for sample MI_7 in Fig. 5. The width of the hybrid zone related to from the initial rhyolitic to the initial basaltic composition is 0.39 mm for MI_T_3, 0.31 mm for MI_7, and 0.56 mm for MI_6 (Fig. 3, Table 3).
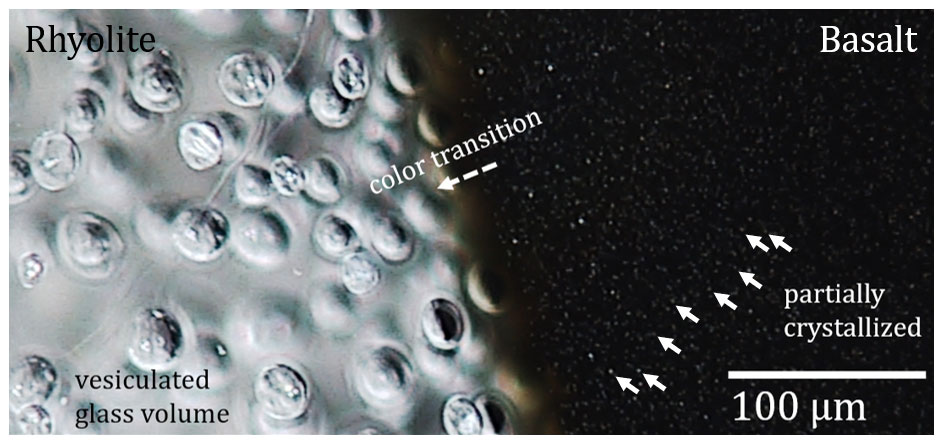
Figure 5Microscope image of sample MI_7. Alignment of the image is identical to the capsule during the experiment. The basaltic glass is partially crystallized by magnetite (arrows). The hybrid zone is characterized by a color transition from opaquely black (basalt) to semitransparent brownish to transparent colorless (rhyolite).
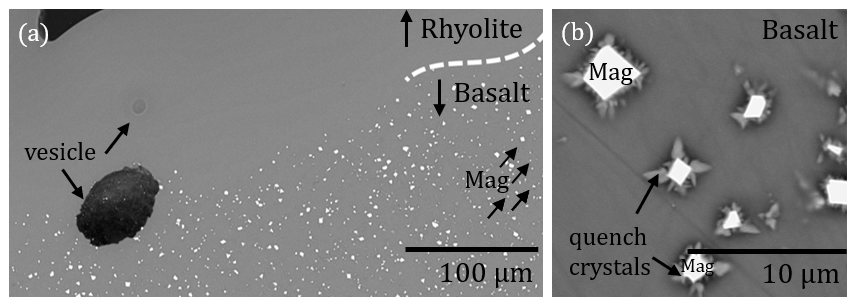
Figure 6(a) Hybrid zone of MI_T_3 with a sharp boundary of the magnetite crystals (Mag) in the basaltic-dominated volume towards the rhyolitic-dominated glass. (b) BSE image of dendritic growth of quench crystals on idiomorphic magnetite (Mag).
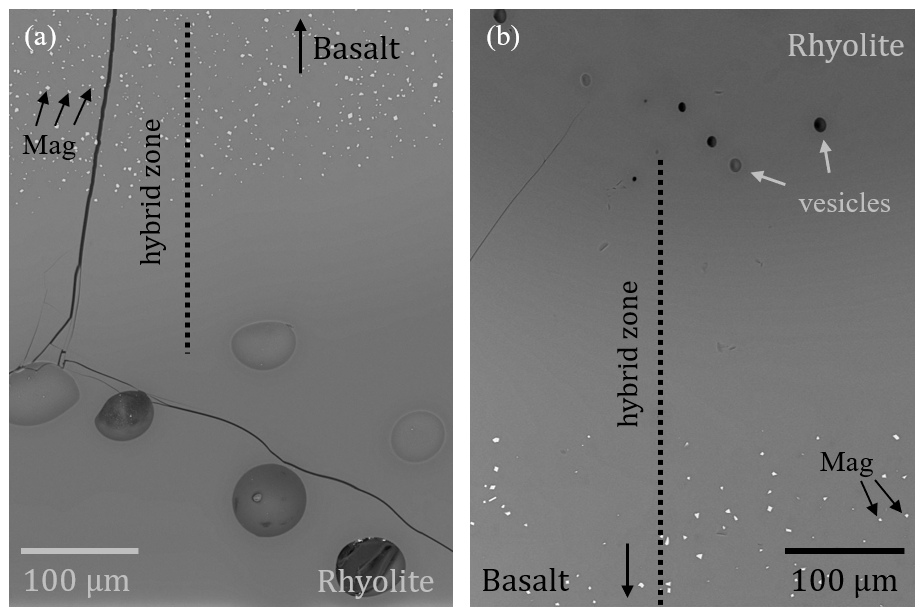
Figure 7BSE images of the hybrid zones of MI_7 (a) and MI_6 (b). A ∼ 200 µm wide vesicle-free zone developed in MI_7 and a ∼ 300 µm wide vesicle-free zone developed in MI_6 as part of the hybrid zone (marked by the dotted line). In the rhyolitic-dominated part, vesicles of ∼ 61 µm in MI_7 and vesicles of ∼ 16 µm in MI_6 formed.
The profiles over the hybrid zone of MI_T_3, MI_7, and MI_6 show an increase in in the transition from the rhyolitic- to the basaltic-dominated composition. Sample MI_T_3 has a mean of 4.02 ± 0.20 wt % in the rhyolitic part. The in the hybrid zone starts at 3.89 ± 0.21 wt % and increases up to 5.00 ± 0.30 wt %. The last NIR measurements in the direction of the basaltic composition result in absorptions > 1. An evaluation of the data points with absorbances > 1 provides up to 7.70 ± 0.39 wt % in the hybrid zone and even a of 8.48 ± 0.43 wt % in the basaltic-related composition (Table 3). Therefore, the last five measurements are not reliable and were discarded from further discussion. The appearance of the enhanced VND starts at the ∼ 0.37 mm position in the profile, which corresponds to the onset of the decrease in SiO2 concentration (Fig. 4).
In sample MI_7, the data points in the rhyolitic composition yield an average of 4.24 ± 0.19 wt %, while the concentration decreases towards the hybrid zone (Fig. 4). The minimum of the hybrid zone is 4.03 ± 0.18 wt % and increases up to 4.93 ± 0.27 wt % towards the basaltic part. One data point representing 5.54 ± 0.31 wt % was discarded from further discussion due to an absorption > 1. Two further spectra, one in the hybrid and one in the basaltic composition, were not evaluable because of the magnetite content in the glass. The enhanced vesiculated zone in the sample starts at the 0.64 mm position of the profile, which corresponds to the first third of the SiO2 concentration profile.
The profile of sample MI_6 starts with a mean of 4.80 ± 0.23 wt % in the rhyolitic part and decreases at the beginning of the hybrid zone to 4.63 ± 0.22 wt %. An increase of up to 5.55 ± 0.31 wt % is observed over the hybrid zone towards the basaltic composition. The last measurement (6.19 ± 0.35 wt %) in the hybrid zone was excluded because of the NIR absorption measurements > 1. The zone with the enhanced VND in MI_6 starts at the 0.64 mm position in the profile, which corresponds to the onset of the decrease in (Fig. 4).
4.1 Initial sample material
The pre-hydrated sample material was examined to evaluate the starting conditions just before decompression. For the evaluation of decompression experiments, the homogeneity and the initial glass porosity are important properties for the degassing and nucleation processes, as shown in Preuss et al. (2016). Using glass cylinders with porosities below the critical value of 6 % (Preuss et al., 2016) excludes the effect of growing pre-existing hydration bubbles by the uptake of H2O during decompression (Iacono-Marziano et al., 2007). Macroscopic and microscopic examinations of thin sections of hydrated rhyolitic and basaltic glasses yield vesicle-free glasses. This ensures melts without pre-existing vesicles prior to decompression.
While the rhyolitic glasses are crystal free, and the hydrated basaltic glasses quenched at 16 K s−1 contain magnetite and pyroxene crystals, the basaltic MI samples show only magnetite crystals after quenching at 44 K s−1. A comparison of the crystal phases in the hydration samples and the MI experiments provides a dissolution of pyroxene during the reheating and the 10 min thermal equilibration of the melt. This suggests that pyroxene crystallized during quench at the normal quenching rate of ∼ 16 K s−1 and was therefore not present in the melt before and during decompression. This observation is confirmed by calculations of the phase relations under experimental conditions using the software “Easymelts v.1.2.0”. The phase relations of basalt at 210 and 100 MPa, 1550–1050 K, and total H2O content in the system (H2Osys) from 0 wt % to 6 wt % are presented in Fig. 8. Calculated but not shown is the phase diagram of basalt at 200 MPa, relevant for the preparatory hydration experiments, since the equilibrium curves of the crystal phases overlap except for a few Kelvin. Under hydration conditions of 200 MPa and 1523 K, spinel (spl) is the only crystal phase that coexists with melt, corresponding to the idiomorphic magnetites observed in all hydrated basaltic samples (Fig. S1). At H2O concentrations > 5.4 wt %, H2O would be present in the system as a fluid phase, along with hydrous melt and spinel. This calculated value is above the H2O solubility of 4.8 wt % given by Berndt et al. (2002), which can be explained by a slightly different melt composition. Thus, it can be concluded that the dendritic pyroxenes in the hydration samples crystallized during the cooling process. This is unavoidable due to the melt composition and the cooling rate of 16 K s−1 since an intact sample cylinder is essential for the subsequent contact with a rhyolitic glass cylinder for the MI experiments.
From the phase diagram in Fig. 8, H2Osys can be confined under decompression starting conditions of 1348 K and 210 MPa to a range of 2.65 wt %–5.2 wt %, since neither pyroxene nor H2O fluid coexisted with hydrous basaltic melt and spinel. This accounts for the reference sample MI_5. For sample MI_T_3 it can be inferred from Fig. 8 that at least 3.2 wt % H2O was dissolved in the basaltic melt system (B_3_h), since a significant number of H2O vesicles formed during decompression to 100 MPa. This is consistent with the equilibrium degassing of basaltic melt experimentally demonstrated by Le Gall and Pichavant (2016). As in sample MI_7, only a few vesicles formed near the drainage zone, and in MI_6 only one vesicle is present in the decompressed glass, so the range of possible H2O content in the basalt cylinder (B_4_h) can be assigned less clearly. At least 2.25 wt % H2O was dissolved in the melts, as neither pyroxene nor feldspar crystallized. Possibly the H2Osys was at a maximum of 3.2 wt % so that a free fluid phase could not develop, as the equilibrium H2O content of 3.3 wt % at 100 MPa final pressure, corresponding to Berndt et al. (2002), is higher than the actual dissolved H2O content of the basaltic melt. Hence, the basaltic melts of MI_6 and MI_7 were not supersaturated with H2O during decompression, and thus no vesicles formed in the basaltic melt volume.
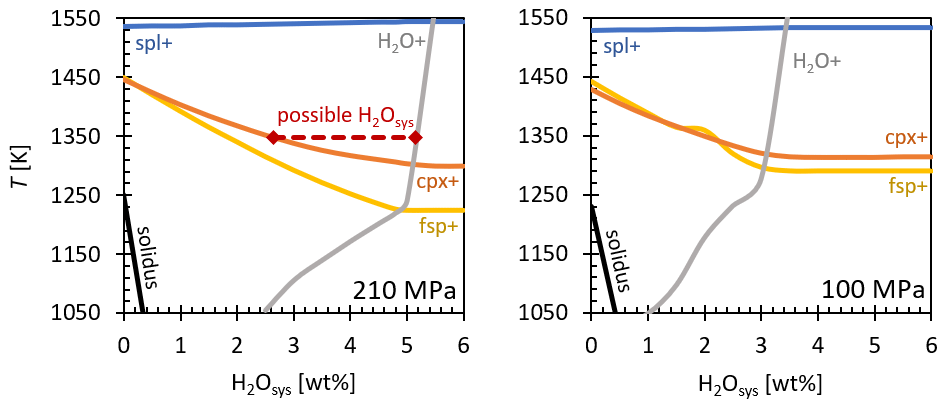
Figure 8Phase relations of basalt at 210 and 100 MPa as a function of T and H2Osys, calculated using the software Easymelts v.1.2.0. spl+, cpx+, fsp+, and H2O+ are the spinel, clinopyroxene, feldspar, and H2O in curves. The oxygen fugacity was set to log QFM + 3, corresponding to the intrinsic conditions in the IHPV (Berndt et al., 2002). Further phases occurring at lower temperatures were excluded.
4.2 MI decompression experiments
4.2.1 Vesicle formation
The images of the decompressed samples (Fig. 2) show similar textures of the vesicles. The sample volumes can be divided into four different zones: (1) the peripheral zone containing vesicles at the contact of the capsule wall with rhyolite, referred to as fringe vesicles (Navon and Lyakhovsky, 1998; Iacono-Marziano et al., 2007); (2) partially crystallized basaltic glass with vesicles in the central volume; (3) rhyolite glass with vesicles in the central volume (Navon and Lyakhovsky, 1998); and (4) the hybrid zone with an increased VND compared to the rhyolite volume (Table 3), with a smaller or larger vesicle diameter, depending on the of the pre-hydrated rhyolitic and basaltic glasses (Table 2).
Based on classical nucleation theory (e.g., Navon et al., 1998), vesicles nucleate from H2O-supersaturated melt by exceeding the critical size of molecular clusters and grow into vesicles. Diffusion of additional H2O molecules into the existing vesicles reduces the energy of the entire system, which further drives the diffusion process during decompression (Hurwitz and Navon, 1994). Diffusion-driven H2O transfer from the H2O-supersaturated melt volumes through the depleted melt–vesicle interface into the vesicles leads to an increase in vesicle size. The four vesiculated zones may have been the result of different nucleation mechanisms.
Numerous fringe vesicles in the rhyolitic melt form heterogeneously at the interface between the capsule and the melt due to a low wettability of hydrous rhyolitic melt. This reduces the required energy to form vesicles at a low degree of supersaturation during decompression (e.g., Mangan and Sisson, 2000; Iacono-Marziano et al., 2007). Due to the diffusion of H2O from the melt into the fringe vesicles, homogeneously nucleated vesicles can no longer form in the H2O-depleted melt zone, which is referred to as the drainage zone (Mangan and Sisson, 2000). The observation that only a few vesicles nucleated at the capsule wall in the basaltic part of sample MI_T_3 may be due to good wettability of Au80Pd20 capsule material with hydrous basaltic melt. In this case, energy required to nucleate vesicles is not reduced (e.g., Gualda and Ghiorso, 2007; Edmonds et al., 2015).
Images of sample MI_T_3 show magnetite crystals in direct contact with vesicles in the basaltic part of the sample (Fig. 6). During hydration, magnetite crystals formed in the basaltic melt. This suggests that, during reheating followed by decompression within the stability field of magnetite, these crystals served as nucleation sites for the formation of the H2O vesicles in the melt. The reduction in energy required for heterogeneous vesicle nucleation on magnetites was observed in hydrous rhyolitic melt (Hurwitz and Navon, 1994; Mangan and Sisson, 2000, 2005; Gardner and Denis, 2004; Gardner, 2007; Gardner and Ketcham, 2011), as well as in andesitic and basaltic melts (Edmonds et al., 2015).
Vesicle nucleation in the basaltic part was not observed in the samples MI_7 and MI_6 due to the initially H2O-undersaturated basaltic melts (Table 2). Despite the magnetite nucleation seeds, the supersaturation pressure was not yet reached for the lower H2O contents during the decompression to final pressure of 100 MPa.
As the rhyolite melts in the experiments of this study were free of pre-existing crystals or inhomogeneities, homogeneous vesicle nucleation has occurred in the central volume of the rhyolitic melts. According to nucleation theory, the VND increases strongly with the decompression rate dP dt (Toramaru, 2006). This is confirmed by the MI samples where the rhyolitic part of MI_6 at the fastest decompression rate of 1.7 MPa s−1 has the highest VND of 1.2 × 103 cm−3 compared to MI_T_3 and MI_7 decompressed with 0.17 MPa s−1 and having similar VNDs of 1.9 × 10² and 2.2 × 102 cm−3, respectively (Table 3).
All decompressed MI samples differ in their vesicle textures and VNDs in the hybrid zone from the initial rhyolitic central melt volume. It can be excluded that vesicles, nucleated heterogeneously at magnetite crystals, have ascended from the basalt into the hybrid zone. This is proven by experiment MI_7, where the basalt was placed on top of the rhyolite. Due to the difference in density, the basalt has sunk into the rhyolite, but the zone with the enhanced VND is clearly contained in the lower rhyolite-dominated region of the hybrid zone and is therefore positioned below the partially crystallized basalt.
The position and the size of vesicles in the hybrid zone may depend on the initial conditions. In the hybrid zone of MI_T_3, the vesicles of ∼ 99 µm are bigger than in the rhyolitic melt center (Table 3) but positioned in the vicinity of the previous contact plane of the two cylinders. This can be attributed to H2O-saturated rhyolitic and basaltic melt conditions before decompression. This was different for MI_6 and MI_7. Since the basalt of both samples was H2O-undersaturated, H2O diffused from the rhyolitic melt via the developing hybrid melt into the basaltic region of the sample. This H2O depletion resulted in an extended vesicle-free zone in the hybrid region of samples MI_6 and MI_7, as shown in Fig. 7. Compared to MI_T_3, however, a higher ΔP (reduced pressure during decompression) was required to form vesicles, related to the lower in the melt. This resulted in a smaller vesicle size observed in the hybrid zone compared to the rhyolitic melt volumes. The later onset of the vesicle nucleation process during decompression did not allow the vesicles to grow as much as in MI_T_3, which explains the reduced vesicle size in MI_7 of ∼ 61 µm. The vesicle size of MI_6 with a decompression rate of 1.7 MPa s−1 may not be directly comparable to that of MI_T_3 and MI_7 with decompression rates of 0.17 MPa s−1 due to the higher VND related to the faster decompression rate in the case of nucleation (Toramaru, 2006).
4.2.2 Concentration profiles of melt components
The melt between rhyolite and basalt developed as an intermediate composition through multicomponent interdiffusion processes of ions, depending on their concentrations, charges, specific diffusion coefficients, and the requirement to maintain charge neutrality over the sample. The alkalis Na+ and K+ diffuse orders of magnitudes faster than other network-modifying cations like Ca2+, Mg2+, Fe2+, Fe3+, and Ti4+ and network formers with the lowest mobility like Si4+ and Al3+ coupled to O2− diffusion (e.g., Watson, 1982; Baker, 1992; Johnston and Wyllie, 1988; Zhang et al., 2010). In particular, the cations Na+ and K+ diffused much faster than Si4+ in the direction of the basalt, resulting in a significant depletion of Na2O and K2O components in the rhyolite-dominated hybrid area. Counter flux Ca2+, Mg2+, Ti4+, Fe2+, Fe3+, and Al3+ diffused towards the rhyolitic composition. The asymmetric concentration profile of Na2O with a greater length on the rhyolitic profile side is suggested to be caused by different Na+ diffusion coefficients in basalt and rhyolite melt, as Na+ has a higher diffusivity in rhyolitic composition (Zhang et al., 2010). This effect is enhanced by the higher H2O content in the rhyolite, since the mobility increases with increasing H2O content in the melt (Watson, 1981). Except for the alkalis, the other oxide components show concentration profiles with a symmetric pattern in the hybrid zone (Fig. 3).
The SiO2 concentration profiles were evaluated for their length to compare the hybrid zones of the different samples. The differences in the length of the hybrid zones are striking when comparing samples MI_T_3 and MI_7 with sample MI_6. The higher temperature of ∼ 50 K during thermal equilibration and decompression of MI_6 caused an increase in diffusivities of components (Zhang et al., 2010). Based on experiments on the self-diffusion of Si4+ in dry dacitic melts, Tinker and Lesher (2001) show that the diffusion coefficient of Si doubles at 1 GPa between 1628 and 1683 K, from 1.45 × 10⁻¹⁴ ± 0.45 to 3.75 ± 1.13 × 10⁻¹⁴ m2 s−1. This corresponds to the T difference of 50 K between MI_T_3 and MI_7 and that of MI_6. The linear trend of lnD with the reciprocal of T provides a first estimate of the differences in the Si4+ diffusion coefficients for the experiments shown here, via extrapolation of the data of Tinker and Lesher (2001) with the equation of Zhang et al. (2010, Eq. 37 therein). Despite the longer diffusion time of MI_T_3 and MI_7 (1247 s) compared to MI_6 (665 s) related to the slower decompression rate, the higher T of MI_6 of 1403 K results in a slightly higher diffusion coefficient of 2.5(+0.9/−0.6) × 10−17 m2 s−1 compared to 5.5(+1.9/−1.4) × 10−18 in MI_T_3 and MI_7 at 1348 K. These calculations demonstrate that the 50 K temperature difference did indeed result in a longer diffusion distance. However, this corresponds only to the assumption of dry melts. Due to the influence of H2O on the Si4+ diffusion coefficient (up to a factor of 10; Baker and Bossanyi, 1994) and the multidimensional behavior of the interacting melt components, further decomposition of the temperature dependence of the diffusion of Si4+ cannot be presented within the scope of this project.
4.2.3 The profiles
The H2O concentrations measured between the vesicles of the zone with high VNDs are generally slightly higher than the calculated equilibrium solubility at final pressure. Due to increasing H2O solubility with decreasing T at P<300 MPa (Holtz et al., 1995), part of the H2O fluid diffused from vesicles back into the melt during quench, causing vesicle shrinkage (McIntosh et al., 2014; Allabar et al., 2020). As a result, resorption halos formed with increased H2O concentrations in the melt surrounding the vesicles, recorded in the glasses (McIntosh et al., 2014; Allabar et al., 2020). Vesicle shrinkage is reinforced by the decrease in the molar volume of H2O fluid during the isobaric quench (Marxer et al., 2015; Allabar et al., 2020). The size of the halos around the vesicles depends on the cooling rate and is therefore comparable in all bimodal decompression samples. A high VND favors fast H2O resorption during cooling due to the high number of H2O fluid sources per melt volume. Due to an increased VND in the hybrid melt zone within a decompressed sample, it can be assumed that H2O resorption was most efficient in the hybrid melt zones.
Resorption of H2O from vesicles back to the melt might also be an explanation for the high in the hybrid area with dacitic composition. It could be possible that vesicles also nucleated in the basaltic-dominated hybrid zone during decompression. Assuming similar temperature dependence of H2O solubility in dacite, already formed vesicles in the basaltic-dominated hybrid region might have dissolved again during cooling due to resorption of H2O from vesicles into the melt. Therefore, hybrid melt that resorbed H2O indicates a much higher in the glass than in the rhyolite-dominated vesiculated hybrid regions (Fig. 4). Based on the EMPA data, the hybrid melt evolved to a dacitic composition, comparable to that of the Unzen dacite (Chen et al., 1993). Sato et al. (1999) showed experimentally that 5.7 wt % H2O is soluble at 98 MPa and 1303 K, which is quite similar to our final experimental conditions of 100 MPa and 1348 K. Therefore, at Pf the solubility of H2O in dacitic melt is much higher than in rhyolitic or basaltic melt, with 3.8 wt % and 3.3 wt %, respectively (Allabar et al., 2022; Berndt et al., 2002). This may explain the increase of ∼ 1 wt % H2O in each hybrid profile.
However, the evaluation of is prone to errors. A crucial point is the use of Eq. (1) of Ohlhorst et al. (2001) for the determination of the absorption coefficients. The composition and the structure of the glasses are decisive factors for the application of the calibration. Liu et al. (2004) found that Eq. (1) given by Ohlhorst et al. (2001) is only applicable to the rhyolitic, dacitic, andesitic, and basaltic compositions that were also used for calibration due to the Fe2+ Fe3+ ratio on the calibration. In our case, the bulk compositions of the individual measurement points differ from those used by Ohlhorst et al. (2001). The bimodal compositions are in the compositional range between the rhyolite and dacite of Ohlhorst et al. (2001). Nevertheless, due to the continuous change in composition, the method of Ohlhorst (2001) is appropriate for calculating approximations of the actual H2O content. Gaussian background correction was also tested to evaluate the spectra, as described in Ohlhorst et al. (2001), Yamashita et al. (1997), and in Liu et al. (2004). However, the required punctual overlap of the spectrum with the Gaussian curve between ∼ 4500 and ∼ 5200 cm−1 is not possible for all NIR spectra collected along the hybrid zone. Due to the changing bulk composition, the slope of the spectra changes (Supplement Fig. S2). For the rhyolitic composition, it is not possible to tangent the minimum between 4500 and 5200 cm−1. Similarly, in the dacite zone, the minimum between 4500 and 5200 cm−1 cannot be reached. Only for spectra with significant basaltic influence is it possible to tangent to the minimum and thus to perform the Gaussian background correction as proposed by Ohlhorst et al. (2001) and Yamashita et al. (1997). Since the same background correction must be applied for the use of absorption coefficients like for the determination of absorption coefficients, they cannot be used if the Gaussian correction cannot be applied on the spectra. Thus, the background correction according to Ohlhorst et al. (2001) with the straight lines under the bands of 4500 and 5200 cm−1 is useful to determine the absorptions of OH and H2Om, even if the Fe2+ Fe3+ ratio of the bimodal decompressed samples does not exactly match the calibration.
Another problem is that the error in the absorption coefficients calculated according to Ohlhorst et al. (2001) increases with (Table S1). The slight decrease in between the rhyolite and the hybrid region is probably caused by the density interpolation between the two compositions, as the density changes more than the SiO2-dependent absorption coefficients along the rhyolite-dominated region. However, since there is no -dependent density formula for hydrous rhyolitic to basaltic glasses, the interpolation of density between two known compositions is the simplest way to evaluate trends.
For a first check of the validity of the profiles calculated by the NIR absorption spectra, an uncalibrated “by-difference” method was performed on the EMPA bulk concentration profiles (Devine et al., 1995). The difference in the sum of the oxides to 100 wt % was considered H2O content. Although this is a semiquantitative method for determining the H2O content in the glasses, the data show a systematic increase in in the hybrid zone towards the basaltic compositions (Table S1). Data of the mean, minimum, and maximum of each sample in rhyolite, hybrid composition, and basalt data correlate remarkably well with the H2O contents determined from the absorption spectra. The maximum in dacitic composition, measured by FTIR spectroscopy and EMPA, differs by 3 % (MI_5), 34 % (MI_T_3), and 6 % each for MI_7 and MI_6.
Despite the errors in determining H2O contents with both methods, the increase in the H2O contents across the hybrid zone towards basalt may be possible. However, H2O contents up to ∼ 6 wt % in the zone with dacitic composition are surprising and need further investigation. An improvement for the determination of H2O contents with NIR spectroscopy would be the synthesis of hydrous glass standards with intermediate compositions in several mixing steps between rhyolite and basalt that match bulk compositions of the hybrid zone. However, this procedure is very time-consuming and considerably beyond the scope of this paper. The H2O contents in the hybrid range shown here can therefore be regarded as a first approximation of the actual values.
4.2.4 Alkali depletion as the crucial factor for enhanced vesicle nucleation in the hybrid zone
The enhanced VND occurs in all decompressed bimodal samples in the rhyolite-dominated region of the hybrid zones, as presented in Figs. 2 and 4. As a new approach to vesicle nucleation investigated for the first time, alkali diffusion and the accompanying alkali depletion in the rhyolite-dominated region of the evolving hybrid zone between rhyolite and injected basalt are now discussed. We suggest that the enhanced vesiculated zone forms due to rapid diffusive loss of alkalis, from the mildly peralkaline rhyolitic part into the basaltic part of the sample (Fig. 3). The decreased Na2O concentration significantly reduces the H2O solubility of the rhyolite and promotes H2O supersaturation in the alkali-depleted rhyolitic melt near the contact zone during decompression. Dingwell et al. (1997) showed that H2O solubility depends on alkali excess (xex= (Na2O + K2O–Al2O3) 100), which is the difference between mole fractions of alkalis and those of alumina. The effect of the peralkalinity on the H2O solubility in silicate melts was recently confirmed and refined by Allabar et al. (2022). They found a linear increase in the H2O solubility with increasing Na2O excess or, in general, for alkali excess. Based on the provided calculation tool by Allabar et al. (2022), the alkali excess was calculated for the melt composition of the hybrid zone in the bimodal samples with enhanced VND. The glass composition of each sample in the region of enhanced vesicle formation is presented in Table 1. While the initial xex content in mildly peralkaline rhyolite was 0.03, xex decreased during the decompression experiments by more than 90 % close to the H2O solubility minimum at xex=0. This reduced the H2O solubility of the melt by ∼ 0.4 wt % so that a lower ΔP was required to induce vesicle formation in the contact region of the developing hybrid melt compared to the pristine rhyolite. Further decompression allowed these vesicles to grow, whereas in the pristine rhyolitic melt the vesicles formed and grew at a higher ΔP (Fig. 9), resulting in VNDs about half the size of those in the hybrid melt zones (Table 3). From this, it can be concluded that besides P and T, also the alkali concentration is a decisive factor for the H2O solubility and thus for the vesicle nucleation in silicate melts.
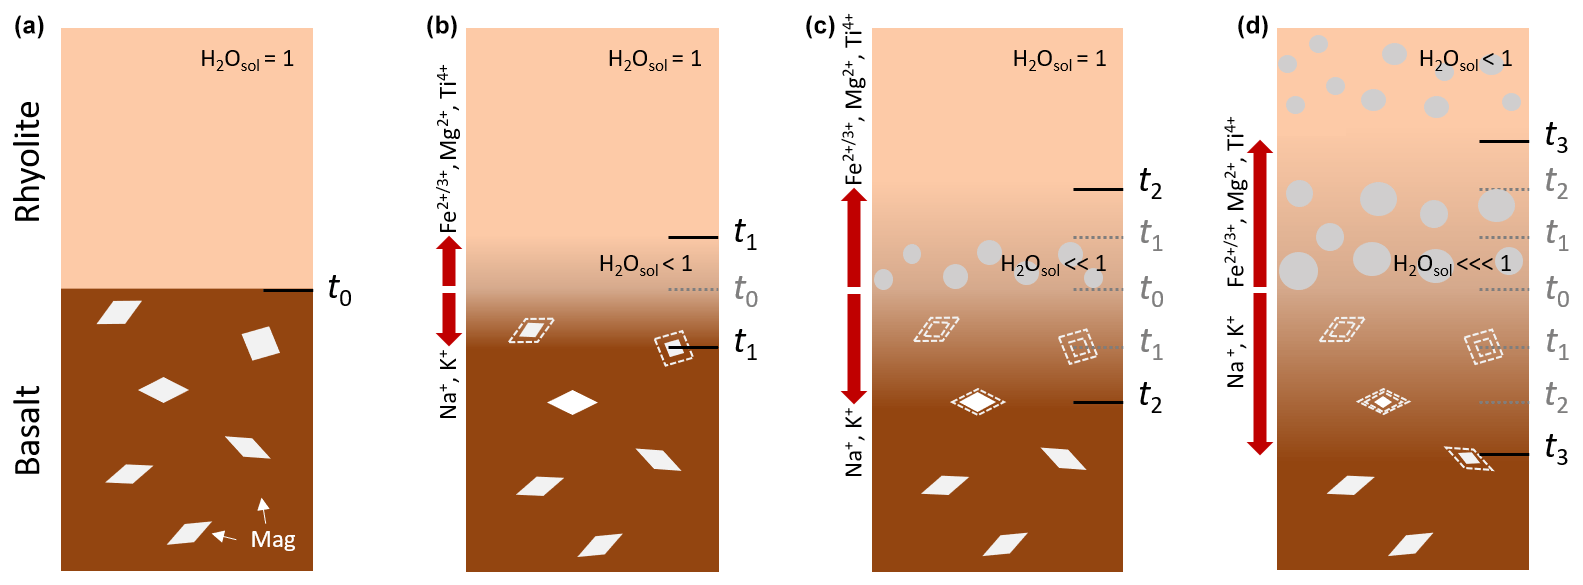
Figure 9Schematic illustration of the development at the contact surface of the melts during magma injection. (a) (t0): intrusion of a partially crystallized basaltic melt into a peralkaline rhyolitic magma chamber. The rhyolitic melt is saturated in H2O. (b) (t1): interdiffusion processes start. A hybrid melt forms at the contact area. The rhyolitic melt becomes rapidly depleted in alkalis (Na+ and K+ diffuse into basalt), while cations such as Mg2+, Ca2+, Fe2+, Fe3+, and Ti4+ diffuse slowly from the basalt into the rhyolite melt, leading to an incipient dissolution of magnetite crystals (Mag) in the basalt. H2O solubility decreases in the alkali-depleted zone. (c) (t2): during magma-ascent-induced decompression vesicles form in the rhyolite-dominated region of the hybrid melt because the solubility of H2O is significantly reduced due to alkali depletion. The dissolution of magnetite in the basaltic-dominated melt is progressing. (d) (t3): vesicles in the hybrid zone grow and accelerate buoyancy-driven magma ascent and mingling and mixing processes that induce further vesicle nucleation.
The injection of a mafic melt into a hydrous rhyolitic magma chamber cannot be directly observed in nature at the time of its occurrence. However, experiments can give insight into such processes. This experimental study is based on the basic melt compositions of the Askja volcano in Iceland (Sparks et al., 1977), considering the composition of basalt enclaves and a slightly simplified rhyolite composition. To relate these results to other natural alkaline volcanic systems, further natural bimodal compositions were analyzed for their alkali content using the method of Allabar et al. (2022) to calculate xex, as well as the classical molar alkali oxides (Na2O + K2O) to alumina oxide (Al2O3) ratio. Nine further natural bimodal systems of rhyolitic and basaltic to andesitic compositions were analyzed – De Rosa et al. (2002) (Salina Island: rhyolite and andesite); Smithies et al. (2015) (Mount Palgrave: rhyolite (187 077, 195 670) and basalt (194 662, 195 640)); Sparks et al. (1977) (Askja: rhyolite and basalt); Saito et al. (2002) (Satsuma-Iwojima: rhyolite (S-1–S-4) and basalt to basalt–andesite (SM-1b, SM-2, SM-3)); Leat et al. (1986) (Parys Mountain: rhyolite (P5) and basalt (P2)); Lacasse et al. (2007) (Katla Caldera: rhyolite (KAT02-18) and basalt (KAT02-17)); Pritchard et al. (2013) (Yellowstone: rhyolite (GR-1-R) and basalt (GR-1-B)); Jahn et al. (2009) (eastern Central Asian Orogenic Belt: basalt and rhyolite); and Ngounouno et al. (2000) (Kapski plateau: rhyolite and basalt) (Table S1) – all resulting in higher xex and alkali alumina ratios of the rhyolitic composition compared to the more mafic compositions (xex ratio Rt B: 0–0.8; alkali alumina ratio Rt B: 1.3–3.6). Although, according to the model of Allabar et al. (2022), the peralkalinity of the melts is not ensured, as xex<0, we suspect from the distinct ratio of alkalis in rhyolite and basalt in each natural example that, in the case of injection of mafic melt, alkalis will diffuse from the felsic toward the mafic melt. It has been shown that the depletion of alkalis in the rhyolitic region of the contact zone reduces the solubility of H2O. Moreover, this concept is not limited to peralkaline rhyolitic compositions only. Other bimodal volcanic systems with compositions of rhyodacite, dacite, and andesite – e.g., Gertisser et al. (2009) (Santorini: rhyodacite and basalt); Di Muro et al. (2008) (Mount Pinatubo: dacite and andesite); and Sigmundsson et al. (2010) (Eyjafjallajökull; trachyandesite and basalt) (Table S1) – show a ratio of xex, as well as the alkali to alumina ratio, on the felsic magma composition side (xex ratio Rt B: 0.4–0.8; alkali alumina ratio Rt B: 1.3–1.7). It can therefore be assumed that in these cases, the alkalis also diffuse from the felsic melt into the mafic melt and thus lead to rapid depletion in the felsic part of the contact zone. The depleted melts become supersaturated in H2O because the H2O solubility decreases strongly with the decreasing alkali concentration of the melt (Dingwell et al., 1997; Allabar et al., 2022). Vesicles form in the hybrid zone at an early stage during the injection of mafic melt, leading to an increased contrast in density and viscosity compared to the pristine rhyolitic magma. The density contrast and the viscosity contrast between rhyolitic and basaltic melt are crucial for magma mingling and therefore enlarge the contact zone and thus the chemical magma mixing processes (Huppert et al., 1982). The resulting vesicle formation in the contact zone can accelerate buoyancy-driven magma ascent and mingling as shown by Wiesmaier et al. (2015). Extensive magma mingling could increase the possibility of mafic crystals being entrained into the felsic melt (e.g., Laumonier et al., 2015; Paredes-Marino et al., 2017), which would then act as nucleation sites and trigger further heterogeneous vesicle nucleation processes. Therefore, it can be generally considered that injection of a mafic melt into a felsic magma chamber can trigger explosive volcanic eruptions. The experimental results presented here and their compatibility with natural bimodal volcanic systems demonstrate the importance of alkali diffusion for H2O solubility and the resulting H2O supersaturation of melts in the contact region. Consideration of this aspect could open new perspectives on degassing behavior in such complicated volcanic systems.
All data derived from this research are presented in the enclosed tables, figures, and the Supplement.
The supplement related to this article is available online at: https://doi.org/10.5194/ejm-35-613-2023-supplement.
PLM: sample preparation, experiments, analysis and evaluation, visualization, writing of the original draft; AA: supervision, validation, software; MN: conceptualization, supervision.
The contact author has declared that none of the authors has any competing interests.
Publisher’s note: Copernicus Publications remains neutral with regard to jurisdictional claims in published maps and institutional affiliations.
This article is part of the special issue “Probing the Earth: magma and fluids, a tribute to the career of Michel Pichavant”. It is a result of the Magma & Fluids workshop, Orléans, France, 4–6 July 2022.
We acknowledge the support of the Open Access Publishing Fund of the University of Tübingen. We thank Monika Rusiecka and one anonymous reviewer for their very helpful comments on the manuscript. We thank the DFG for financial support for the acquisition of the electron microprobe (grant: INST 37/1026-1 FUGG) and Thomas Wenzel and Sebastian Staude for their support during the sample measurements. We thank Barbara Maier and Annette Flicker for technical support and maintenance of the IHPV and the FTIR spectrometer, as well as Simone Schafflick for the high-quality sample preparation.
This open-access publication was funded by the University of Tübingen.
This paper was edited by Francois Holtz and reviewed by Monika Rusiecka and one anonymous referee.
Allabar, A. and Nowak, M.: Message in a bottle: Spontaneous phase separation of hydrous Vesuvius melt even at low decompression rates, Earth Planet. Sc. Lett., 501, 192–201, https://doi.org/10.1016/j.epsl.2018.08.047, 2018.
Allabar, A., Dobson, K. J., Bauer, C. C., and Nowak, M.: Vesicle shrinkage in hydrous phonolitic melt during cooling, Contrib. Mineral. Petr. 175, 21, https://doi.org/10.1007/s00410-020-1658-3, 2020.
Allabar, A., Petri, P. L., Eul, D., and Nowak, M.: An empirical H2O solubility model for peralkaline rhyolitic melts, Contrib. Mineral. Petr., 177, 52, https://doi.org/10.1007/s00410-022-01915-8, 2022.
Arienzo, I., Moretti, R., Civetta, L., Orsi, G., and Papale, P.: The feeding system of Agnano–Monte Spina eruption (Campi Flegrei, Italy): Dragging the past into present activity and future scenarios, Chem. Geol., 270, 135–147, https://doi.org/10.1016/j.chemgeo.2009.11.012, 2010.
Bachmann, O. and Bergantz, G.: The Magma Reservoirs That Feed Supereruptions, Elements, 4, 17–21, https://doi.org/10.2113/GSELEMENTS.4.1.17, 2008.
Baker, D. R.: Estimation of diffusion coefficients during interdiffusion of geologic melts: Application of transition state theory, Chem. Geol., 98, 11–21, https://doi.org/10.1016/0009-2541(92)90089-N, 1992.
Baker, D. R. and Bossanyi, H.: The combined effect of F and H2O on interdiffusion between peralkaline dacitic and rhyolitic melts, Contrib. Mineral. Petr., 117, 203–214, https://doi.org/10.2138/rmg.2010.72.8, 1994.
Behrens, H., Romano, C., Nowak, M., Holtz, F., and Dingwell, D. B.: Near-infrared spectroscopic determination of water species in glasses of the system MAlSi3O8 (M = Li, Na, K): an interlaboratory study, Chem. Geol., 128, 41–63, https://doi.org/10.1016/0009-2541(95)00162-X, 1996.
Berndt, J., Liebske, C., Holtz, F., Freise, M., Nowak, M., Ziegenbein, D., Hurkuck, W., and Koepke, J.: A combined rapid-quench and H2-membrane setup for internally heated pressure vessels: Description and application for water solubility in basaltic melts, Am. Mineral., 87, 1717–1726, https://doi.org/10.2138/am-2002-11-1222, 2002.
Bunse, R. W.: Ueber die Processe der vulkanischen Gesteinsbildung Islands, Annu. Rev. Phys. Chem., 83, 197–272, https://doi.org/10.1002/andp.18511590602, 1851.
Carmichael, I. S. E. and Nicholls, J.: Iron-Titanium Oxides and Oxygen Fugacities in Volcanic Rocks, J. Geophys. Res., 72, 4665–4687, https://doi.org/10.1029/JZ072i018p04665, 1967.
Chen, C. H., DePaolo, D. J., Nakada, S., and Shieh, Y. N.: Relationship between eruption volume and neodymium isotopic composition at Unzen volcano, Nature, 362, 831–834, https://doi.org/10.1016/j.jvolgeores.2008.03.042, 1993.
De Rosa, R., Donato, P., and Ventura, G.: Fractal analysis of mingled/mixed magmas: an example from the Upper Pollara eruption (Salina Island, southern Tyrrhenian Sea, Italy), Lithos, 65, 299–311, https://doi.org/10.1016/S0024-4937(02)00197-4, 2002.
Devine, J. D., Gardener, J. E., Brack, H. P., Layne, G. D., and Rutherford, M. J.: Comparison of microanalytical methods for estimating H2O contents of silicic volcanic glasses, Am. Mineral., 80, 319–328, https://doi.org/10.2138/am-1995-3-413, 1995.
Di Muro, A., Pallister, J., Villemant, B., Newhall, C., Semet, M., Martinez, M., and Mariet, C.: Pre-1991 sulfur transfer between mafic injections and dacite magma in the Mt. Pinatubo reservoir, J. Volcanol. Geoth. Res., 175, 517–540, https://doi.org/10.1016/j.jvolgeores.2008.02.025, 2008.
Dingwell, D. B., Holtz, F., and Behrens, H.: The solubility of H2O in peralkaline and peraluminous granitic melts, Am. Mineral., 82, 434–437, https://doi.org/10.2138/AM-1997-3-421, 1997.
Druitt, T. H., Costa, F., Deloule, E., Dungan, M., and Scaillet, B.: Decadal to monthly timescales of magma transfer and reservoir growth at a caldera volcano, Nature, 482, 77–97, https://doi.org/10.1038/nature10706, 2012.
Edmonds, M., Brett, A., Herd, R. A., Humphreys, M. C. S., and Woods, A.: Magnetite-bubble aggregated at mixing interfaces in andesite magma bodies, in: The Role of Volatiles in the Genesis, Evolution and Eruption of Arc Magmas, Geol. Soc. Sp., 410, 95, https://doi.org/10.1144/SP410.7, 2015.
Gardner, J. E., Hilton, M., and Carroll, M. R.: Experimental constraints on degassing of magma: isothermal bubble growth during continuous decompression from high pressure, Earth Planet. Sc. Lett., 168, 201–218, https://doi.org/10.1016/S0012-821X(99)00051-5, 1999.
Gardner, J. E. and Denis, M.-H.: Heterogeneous bubble nucleation on Fe-Ti oxide crystals in high-silicia rhyolitic melt, Geochim. Cosmochim. Ac., 68, 3587–3597, https://doi.org/10.1016/j.gca.2004.02.021, 2004.
Gardner, J. E.: Heterogeneous bubble nucleation in highly viscous silicate melts during instantaneous decompression from high pressure, Chem. Geol., 236, 1–12, https://doi.org/10.1016/j.chemgeo.2006.08.006, 2007.
Gardner, J. E. and Ketcham, R. A.: Bubble nucleation in rhyolite and dacite melts: temperature dependence of surface tension, Contrib. Mineral. Petr., 162, 929–943, https://doi.org/10.1007/s00410-011-0632-5, 2011.
Gardner, J. E., Wadsworth, F. B., Carley, T. L., Llewellin, E. W., Kusumaatmaja, H., and Sahagian, D.: Bubble Formation in Magma, Annu. Rev. Earth Pl. Sc., 51, 131–154, https://doi.org/10.1146/annurev-earth-031621-080308, 2022.
Gertisser, R., Preece, K., and Keller, J.: The Plinian Lower Pumice 2 eruption, Santorini, Greece: Magma evolution and volatile behavior, J. Volcanol. Geoth. Res., 186, 387–406, https://doi.org/10.1016/j.jvolgeores.2009.07.015, 2009.
Gonnermann, H. M. and Manga, M.: The Fluid Mechanics Inside a Volcano, Annu. Rev. Fluid Mech., 39, 321–356, https://doi.org/10.1146/annurev.fluid.39.050905.110207, 2007.
Gualda, G. A. R. and Ghiorso, M. S.: Magnetite scavenging and the buoyancy of bubbles in magmas, Part 2: Energetics of crystal-bubbles attachment in magmas, Contrib. Mineral. Petr., 154, 479–490, https://doi.org/10.1007/s00410-007-0206-8, 2007.
Hajimirza, S., Gonnermann, H. M., Gardner, J. E., and Giachetti, T.: Predicting homogeneous bubble nucleation in rhyolite, J. Geophys. Res.-Sol. Ea., 124, 2395–2416, https://doi.org/10.1029/2018JB015891, 2019.
Higgins, M. D.: Measurement of crystal size distributions, Am. Mineral., 85, 1105–1116, https://doi.org/10.2138/am-2000-8-901, 2000.
Holtz, F., Behrens, H., Dingwell, D. B., and Taylor, R. P.: Water solubility in aluminosilicate melts of haplogranite composition at 2 kbar, Chem. Geol., 96, 289–302, https://doi.org/10.1016/0009-2541(92)90060-I, 1992.
Holtz, F., Behrens, H., Dingwell, D. B., and Johannes, W.: H2O Solubility in Haplogranitic Melts – Compositional, Pressure, and Temperature-Dependence, Am. Mineral., 80, 94–108, https://doi.org/10.2138/am-1995-1-210, 1995.
Huppert, H. E., Sparks, R. S. J., and Turner, J. S.: Effects of volatiles on mixing in calc-alkaline magma systems, Nature, 297, 554–557, https://doi.org/10.1038/297554a0, 1982.
Hurwitz, S. and Navon, O.: Bubble Nucleation in Rhyolitic Melts – Experiments at High-Pressure, Temperature, and Water-Content, Earth Planet. Sc. Lett., 122, 151–164, https://doi.org/10.1016/0012-821X(94)90001-9, 1994.
Iacono-Marziano, G., Schmidt, B. C., and Dolfi, D.: Equilibrium and disequilibrium degassing of a phonolitic melt (Vesuvius AD 79 “white pumice”) simulated by decompression experiments, J. Volcanol. Geoth. Res., 161, 151–164, https://doi.org/10.1016/j.jvolgeores.2006.12.001, 2007.
Jahn, B. M., Litvinovsky, B. A., Zanvilevich, A. N., and Reichow, M.: Peralkaline granitoid magmatism in the Mongolian–Transbaikalian Belt: Evolution, petrogenesis and tectonic significance, Lithos, 113, 521–539, https://doi.org/10.1016/j.lithos.2009.06.015, 2009.
Jarvis, P. A., Pistone, M., Secretan, A., Blundy, J. D., Cashman, K. V., Mader, H. M., and Baumgartner, L. P.: Crystal and Volatile Controls on the Mixing and Mingling of Magmas, Geoph. Monog. Ser., 264, 125–150, https://doi.org/10.1002/9781119564485.ch6, 2021.
Johnston, A. D. and Wyllie, P. J.: Interaction of granitic and basic magmas: experimental observations on contamination processes at 10 kbar with H2O, Contrib. Mineral. Petr., 98, 352–362, https://doi.org/10.1007/BF00375185, 1988.
Kouchi, A. and Sunagawa, I.: A Model for mixing basaltic and dacitic magmas as deduced from experimental data, Contrib. Mineral. Petr., 89, 17–23, https://doi.org/10.1007/BF01177586, 1985.
Lacasse, C., Sigurdsson, H., Carey, S. N., Johannesson, H., Thomas, L. E., and Rogers, N. W.: Bimodal volcanism at the Katla subglacial caldera, Iceland: insight into the geochemistry and petrogenesis of rhyolitic magmas, Bull. Volcanol., 69, 373–399, https://doi.org/10.1007/s00445-006-0082-5, 2007.
Laumonier, M., Scaillet, B., Pichavant, M., Champallier, R., Andujar, J., and Arbaret, L.: On the conditions of magma mixing and its bearing on andesite production in the crust, Nat. Commun., 5, 5607, https://doi.org/10.1038/ncomms6607, 2014.
Laumonier, M., Scaillet, B., Arbaret, L., Andujar, J., and Champallier, R.: Experimental mixing of hydrous magmas, Chem. Geol., 418, 158–170, https://doi.org/10.1016/j.chemgeo.2015.10.031, 2015.
Lavallée, Y., Dingwell, D. B., Johnson, J. B., Cimarelli, C., Hornby, A.J., Kendrick, J. E., von Aulock, F. W., Kennedy, B. M., Andrews, B. J., Wadsworth, F. B., Rhodes, E., and Chigna, G.: Thermal vesiculation during volcanic eruptions, Nature, 528, 544–547, https://doi.org/10.1038/nature16153, 2015.
Leat, P. T., Jackson, S. E., Thorpe, R. S., and Stillman, C. J.: Geochemistry of bimodal basalt-subalkaline/peralkaline rhyolite provinces within the Southern British Caledonides, J. Geol. Soc. Lond., 143, 259–273, https://doi.org/10.1144/gsjgs.143.2.0259, 1986.
Le Gall, N. and Pichavant, M.: Homogeneous bubble nucleation in H2O- and H2O-CO2-bearing basaltic melts: Results of high temperature decompression experiments, J. Volcanol. Geoth. Res., 327, 604–621, https://doi.org/10.1016/j.jvolgeores.2016.10.004, 2016.
Leonard, G. S., Cole, J. W., Nairn, I. A., and Self, S.: Basalt triggering of the c. AD 1305 Kaharoa rhyolite eruption, Tarawera Volcanic Complex, New Zealand, J. Volcanol. Geoth. Res., 115, 461–486, https://doi.org/10.1016/S0377-0273(01)00326-2, 2002.
Liu, Y., Behrens, H., and Zhang, Y.: The speciation of dissolved H2O in dacitic melt, Am. Mineral., 89, 277–284, https://doi.org/10.2138/am-2004-2-304, 2004.
Mangan, M. and Sisson, T.: Delayed, disequilibrium degassing in rhyolite magma: decompression experiments and implications for explosive volcanism, Earth Planet. Sc. Lett., 183, 441–455, https://doi.org/10.1016/S0012-821X(00)00299-5, 2000.
Mangan, M. and Sisson, T.: Evolution of melt-vapor surface tension in silicic volcanic systems: Experiments with hydrous melts, J. Geophys. Res., 110, B01202, https://doi.org/10.1029/2004JB003215, 2005.
Martel, C., Brooker, R. A., Andújar, J., Pichavant, M., Scaillet, B., and Blundy, J. D.: Experimental Simulations of Magma Storage and Ascent, in: Volcanic Unrest, edited by: Gottsmann, J., Neuberg, J., and Scheu, B., Adv. Volcanol., 101–110, https://doi.org/10.1007/11157_2017_20, 2017.
Marxer, H., Bellucci, P., and Nowak, M.: Degassing of H2O in a phonolitic melt: A closer look at decompression experiments, J. Volcanol. Geoth. Res, 297, 109–124, https://doi.org/10.1016/j.jvolgeores.2014.11.017, 2015.
Mayerhöfer, T. G. and Popp, J.: Beer's Law – Why Absorbance Depends (Almost) Linearly on Concentration, Chemphyschem, 20, 511–515, https://doi.org/10.1002/cphc.201900103, 2019.
McIntosh, I. M., Llewellin, E. W., Humphreys, M. C. S., Nichols, A. R. L., Burgisser, A., Schipper, C. I., and Larsen, J. F.: Distribution of dissolved water in magmatic glass records growth and resorption of bubbles, Earth Planet. Sc. Lett., 401, 1–11, https://doi.org/10.1016/j.epsl.2014.05.037, 2014.
Miller, C. F. and Wark, D. A.: Supervolcanoes and their explosive supereruptions, Elements, 4, 11–15, https://doi.org/10.2113/GSELEMENTS.4.1.11, 2008.
Montagna, C. P., Papale, P., and Longo, A.: Timescales of mingling in shallow magmatic reservoirs, Geol. Soc. Lond. Spec. Publ., 422, 131–140, https://doi.org/10.1144/SP422.6, 2015.
Morgan, G. and London, D.: Effect of current density on the electron microprobe analysis of alkali aluminosilicate glasses, Am. Mineral., 90, 1131–1138, https://doi.org/10.2138/am.2005.1769, 2005.
Morgavi, D., Perugini, D., De Campos, C. P., Ertel-Ingrisch, W., and Dingwell, D. B.: Time evolution of chemical exchanges during mixing of rhyolitic and basaltic melts, Contrib. Mineral. Petr., 166, 615–638, https://doi.org/10.1007/s00410-013-0894-1, 2013.
Murphy, M. D., Sparks, R. S. J., Barclay, J., Carroll, M. R., Lejeune, A.-M., Brewer, T. S., Macdonald, R., Black, S., and Young, S.: The role of magma mixing in triggering the current eruption at the Soufriere Hills Volcano, Montserrat, West Indies, Geophys. Res. Lett., 25, 3433–3436, https://doi.org/10.1029/98GL00713, 1998.
Navon, O. and Lyakhovsky, V.: Vesiculation processes in silicic magmas, Geol. Soc. Spec. Publ., 145, 27–50, https://doi.org/10.1144/GSL.SP.1996.145.01.03, 1998.
Navon, O., Chekhmir, A., and Lyakhovsky, V.: Bubble growth in highly viscous melts: theory, experiments, and autoexplosivity of dome lavas, Earth Planet. Sc. Lett., 160, 763–776, https://doi.org/10.1016/S0012-821X(98)00126-5, 1998.
Ngounounoa, I., Déruelle, B., and Demaiffe, D.: Petrology of the bimodal Cenozoic volcanism of the Kapsiki plateau (northernmost Cameroon, Central Africa), J. Volcanol. Geoth. Res., 102, 21–44, https://doi.org/10.1016/S0377-0273(00)00180-3, 2000.
Nowak, M., Cichy, S. B., Botcharnikov, R. E., Walker, N., and Hurkuck, W.: A new type of high pressure low-flow metering valve for continuous decompression: First 86 experimental results on degassing of rhyodacitic melts, Am. Mineral., 96, 1373–1380, https://doi.org/10.2138/am.2011.3786, 2011.
Ohlhorst, S., Behrens, H., and Holtz, F.: Compositional dependence of molar absorptivities of near-infrared OH- and H2O bands in rhyolitic to basaltic glasses, Chem. Geol., 174, 5–20, https://doi.org/10.1016/S0009-2541(00)00303-X, 2001.
Paredes-Marino, J., Dobson, K. J., Ortenzi, G., Kueppers, U., Morgavi, D., Petrelli, M., Hess, K.-U., Laeger, K., Porreca, M., Pimentel, A., and Perugini, D.: Enhancement of eruption explosivity by heterogeneous bubble nucleation triggered by magma mingling, Sci. Rep.-UK, 7, 16897, https://doi.org/10.1038/s41598-017-17098-3, 2017.
Perugini, D. and Poli, G.: The mixing of magmas in plutonic and volcanic environments: analogies and differences, Lithos, 153, 261–277, https://doi.org/10.1016/j.lithos.2012.02.002, 2012.
Perugini, D., De Campos, C. P., Ertel-Ingrisch, W., and Dingwell, D. B.: The space and time complexity of chaotic mixing of silicate melts: Implications for igneous petrology, Lithos, 155, 326–340, https://doi.org/10.1016/j.lithos.2012.09.010, 2012.
Phillips, J. C. and Woods, A. W.: Suppression of large-scale magma mixing by melt-volatile separation, Earth Planet. Sc. Lett., 204, 47–60, https://doi.org/10.1016/S0012-821X(02)00978-0, 2002.
Philpotts, A. R. and Ague, J. J.: Principles of Igneous and Metamorphic Petrology, Cambridge University Press, 700 pp., https://doi.org/10.1017/9781108631419, 2009.
Pichavant, M., Poussineau, S., Lesne, P., Solaro, C., and Bourdier, J. L.: Experimental Parametrization of Magma Mixing: Application to the AD 1530 Eruption of La Soufrière, Guadeloupe (Lesser Antilles), J. Petrol., 2, 257–282, https://doi.org/10.1093/petrology/egy030, 2018.
Preuss, O., Marxer, H., Ulmer, S., Wolf, J., and Nowak, M.: Degassing of hydrous trachytic Campi Flegrei and phonolitic Vesuvius melts: Experimental limitations and chances to study homogeneous bubble nucleation, Am. Mineral., 101, 859–875, https://doi.org/10.2138/am-2016-5480, 2016.
Pritchard, C. J., Larson, P. B., Spell, T. L., and Tarbert, K. D.: Eruption-triggered mixing of extra-caldera basalt and rhyolite complexes along the East Gallatin–Washburn fault zone, Yellowstone National Park, WY, USA, Lithos, 175/176, 163–177, https://doi.org/10.1016/j.lithos.2013.04.022, 2013.
Rose, W. I. and Chesner, C. A. : Dispersal of ash in the great Toba eruption, 7 KA, Geology, 15, 913–917, https://doi.org/10.1130/0091-7613(1987)15<913:DOAITG>2.0.CO;2, 1987.
Sahagian, D. and Carley, T. L.: Explosive Volcanic Eruptions and Spinodal Decomposition: A different Approach to Deciphering the Tiny Bubble Paraox, Geochem. Geophy. Geosy., 21, 6, https://doi.org/10.1029/2019GC008898, 2020.
Saito, G., Stimac, J. A., Kawanabe, Y., and Goff, F.: Mafic-felsic magma interaction at Satsuma-Iwojima volcano, Japan: Evidence from mafic inclusions in rhyolites, Earth Planet. Space, 54, 303–325, https://doi.org/10.1186/BF03353030, 2002.
Sato, H., Nakada, S., Fujii, T., Nakamura, M., and Suzuki-Kamata, K.: Groundmass pargasite in the 1991–1995 dacite of Unzen volcano: phase stability experiments and volcanological implications, J. Volcanol. Geoth. Res., 89, 197–212, https://doi.org/10.1016/S0377-0273(98)00132-2, 1999.
Scaillet, B. and Pichavant, M.: Experimental constraints on volatile abundances in arc magmas and their implications for degassing processes, in: Volcanic degassing, edited by: Oppenheimer, C., Pyle, D., and Barclay, J., Geol. Soc. Lond. Spec. Publ., 213, 23–52, https://doi.org/10.1144/GSL.SP.2003.213.01.03, 2003.
Self, S. and Blake, S.: Consequences of explosive supereruptions, Elements, 4, 41–46, https://doi.org/10.2113/GSELEMENTS.4.1.41, 2008.
Sigmundsson, F., Hreinsdóttir, S., Hooper, A., Árnadóttir, T., Pedersen, R., Roberts, M. J., Óskarsson, N., Auriac, A., Decriem, J., Einarsson, P., Geirsson, H., Hensch, M., Ófeigsson, B. G., Sturkell, E., Sveinbjörnsson, H., and Feigl, K. L.: Intrusion triggering of the 2010 Eyjafjallajökull explosive eruption, Nature, 468, 426–430, https://doi.org/10.1038/nature09558, 2010.
Sigurdsson, H. and Sparks, R. S. J.: Petrology of rhyolitic and mixed magma ejecta from the 1875 eruption of Askja, Iceland, J. Petrol., 22, 41–84, https://doi.org/10.1093/petrology/22.1.41, 1981.
Smithies, R. H., Howard, H. M., Kirkland, C. L., Korhonen, F. J., Medlin, C. C., Maier, W. D., Quentin de Gromard, R., and Wingate, M. T. D.: Piggy-back Supervolcanoes – Long-Lived, Voluminous, Juvenile Rhyolite Volcanism in Mesoproterozoic Central Australia, J. Petrol., 56, 735–763, https://doi.org/10.1093/petrology/egv015, 2015.
Snyder, D.: Thermal effects of the intrusion of basaltic magma into a more silicic magma chamber and implications for eruption triggering, Earth Planet. Sc. Lett., 175, 257–273, https://doi.org/10.1016/S0012-821X(99)00301-5, 2000.
Sparks, R. S. J.: The dynamics of bubble formation and growth in magmas: a review and analysis, J. Volcanol. Geoth. Res., 3, 1–37, https://doi.org/10.1016/0377-0273(78)90002-1, 1978.
Sparks, R. S. J., Sigurdsson, H., and Wilson, L.: Magma mixing: a mechanism for triggering acid explosive eruptions, Nature, 267, 315–318, https://doi.org/10.1038/267315a0, 1977.
Spera, F. J., Schmidt, J. S., Bohrson, W. A., and Brown, G. A.: Dynamics and thermodynamics of magma mixing: Insights from a simple exploratory model, Am. Mineral., 101, 627–643, https://doi.org/10.2138/am-2016-5305, 2016.
Stelling, J., Botcharnikov, R. E., Beermann, O., and Nowak, M.: Solubility of H2O- and chlorine -bearing fluids in basaltic melt of Mount Etna at T = 1050–1250 ∘C and P = 200 MPa, Chem. Geol., 256, 102–110, https://doi.org/10.1016/j.chemgeo.2008.04.009, 2008.
Tinker, D. and Lesher, C. E.: Self diffusion of Si and O in dacitic liquid at high pressures, Am. Mineral., 86, 1–13, https://doi.org/10.2138/am-2001-0101, 2001.
Toramaru, A.: BND (bubble number density) decompression rate meter for explosive volcanic eruptions, J. Volcanol. Geoth. Res., 154, 303–316, https://doi.org/10.1016/j.jvolgeores.2006.03.027, 2006.
Troll, V. R., Donaldson, C. H., and Emeleus, C. H.: Pre-eruptive magma mixing in ash-flow deposits of the Tertiary Rum Igneous Centre, Scotland, Contrib. Mineral. Petr., 147, 722–739, https://doi.org/10.1007/s00410-004-0584-0, 2004.
Watson, B.: Basalt Contamination by Continental Crust: Some Experiments and Models, Contrib. Mineral. Petr., 80, 73–87, https://doi.org/10.1007/BF00376736, 1982.
Wiesmaier, S., Morgavi, D., Renggli, C. J., Perugini, D., De Campos, C. P., Hess, K.-U., Ertel-Ingrisch, W., Lavallée, Y., and Dingwell, D. B.: Magma mixing enhanced by bubble segregation, Solid Earth, 6, 1007–1023, https://doi.org/10.5194/se-6-1007-2015, 2015.
Yamashita, S., Kitamura, T., and Kusakabe, M.: Infrared spectroscopy of hydrous glasses of arc magma compositions, Geochem. J., 31, 169–174, https://doi.org/10.2343/geochemj.31.169, 1997.
Yoder, H. S.: Contemporaneous basaltic and rhyolitic magmas, Am. Mineral., 58, 153–171, 1973.
Zhang, Y., Ni, H., and Chen, Y: Diffusion Data in Silicate Melts, Rev. Mineral. Geochem., 72, 311–408, https://doi.org/10.2138/rmg.2010.72.8, 2010.
- Abstract
- Introduction
- Experimental and analytical methods
- Results
- Discussion
- Implications and examples for natural bimodal volcanism
- Data availability
- Author contributions
- Competing interests
- Disclaimer
- Special issue statement
- Acknowledgements
- Financial support
- Review statement
- References
- Supplement