the Creative Commons Attribution 4.0 License.
the Creative Commons Attribution 4.0 License.
 | 31 Jul 2023
Effect of oxygen fugacity on the storage of water in wadsleyite and olivine in H and H–C fluids and implications for melting atop the transition zone
Nathalie Bolfan-Casanova
Loïs Martinek
Geeth Manthilake
Maximilien Verdier-Paoletti
Paul Chauvigne
This study aims to experimentally constrain the water storage capacities of olivine and wadsleyite at a depth near 410 km (12–14 GPa) under water-saturated conditions, as a function of temperature, oxygen fugacity, and the presence of carbon (molar H C of 2). Experiments have been conducted in the multi-anvil press, with sealed double capsules to preserve fluids, at 1200 to 1400 ∘C and three different oxygen fugacities fixed at the rhenium–rhenium oxide buffer (RRO), nickel–nickel oxide buffer (NNO), and iron-wüstite (IW) for oxidizing, intermediate, and reducing conditions, respectively. The water contents of minerals were measured by Raman spectroscopy that allows a very small beam size to be used and were cross-checked on a few samples with NanoSIMS analyses.
We observe an effect, although slight, of on the water storage capacity of both wadsleyite and olivine and also on their solidus temperatures. At 1200 ∘C, the storage capacity of the nominally anhydrous minerals (NAMS) increases with increasing oxygen fugacity (from the IW to the RRO buffer) from 1 wt % to 1.5 wt % H2O in wadsleyite and from 0.1 wt % to 0.2 wt % in olivine, owing to the increase in H2O H2 speciation in the fluid, whereas at 1400 ∘C the storage capacity decreases from 1 wt % to 0.75 wt % H2O in wadsleyite and down to 0.03 wt % for olivine. At high temperature, the water storage capacity is lowered due to melting, and the more oxidized the conditions are the more the solidus is depressed. Still, at 1400 ∘C and IW, wadsleyite can store substantial amounts of water: 0.8 wt % to 1 wt % H2O. The effect of carbon is to decrease water storage capacity in both wadsleyite and olivine by an average factor 2 at 1300–1400 ∘C. The trends in water storage as a function of and C presence are confirmed by NanoSIMS measurements. The solidus at IW without C is located between 1300 and 1400 ∘C in the wadsleyite stability field and drops to temperatures below 1300 ∘C in the olivine stability field. With the addition of C, the solidus is found between 1200 and 1300 ∘C in both olivine and wadsleyite stability fields.
- Article
(9224 KB) - Full-text XML
- BibTeX
- EndNote


While the high-pressure polymorphs of olivine, wadsleyite, and ringwoodite are capable of incorporating 2 to 3 wt % of H2O (Inoue, 1994; Ohtani et al., 2000; Demouchy et al., 2005; Pearson et al., 2014; Bolfan-Casanova et al., 2018), it is at the moment impossible to predict what is the water storage capacity of these nominally anhydrous minerals (NAMs) under the prevailing conditions of the transition zone, comprised between 410 and 660 km depth within the Earth's mantle. Pressure enhances water incorporation in NAMs (Kohlstedt et al., 1996; Mosenfelder et al., 2006) under water-saturated conditions and below the wet solidus temperature (around below 1100 ∘C). On the other hand, the effect of temperature at high pressure has been shown to have the opposite effect (Withers and Hirschmann, 2007; Bali et al., 2008; Tenner et al., 2012; Férot and Bolfan-Casanova, 2012), and high temperatures lead to a decrease in water storage in NAMs due to enhanced dissolution of the silicates into high-pressure supercritical water (Bureau and Keppler, 1999; Mibe et al., 2007). Also, as pressure favors the incorporation of ferric component in silicate minerals such as garnet and clinopyroxene, the resulting oxygen fugacity of the mantle might decrease with increasing depth (Woodland et al., 2006; Frost and McCammon, 2008), down to equilibrium with iron metal (IW). As a consequence, the speciation of fluids should change, with the proportion of reduced species such as H2 and CH4 increasing with respect to H2O and CO2 as decreases (Woodland et al., 2006; Goncharov et al., 2012). However, measuring the speciation of fluids at high pressure has remained extremely challenging due to small fluid volumes available but also due to the possibility that the fluids revert their properties during quenching and decompression (Matveev et al., 1997; Sokol et al., 2009). While the storage capacity of water in olivine has been shown to increase with oxygen fugacity (Yang, 2016), its storage capacity is decreased by a factor of 2 to 7 if carbon is present in the system (Yang et al., 2014; Yang, 2015; Sokol et al., 2013). Recent data point out to a negligible effect of on water storage in wadsleyite (Druzhbin et al., 2021), but the effect of carbon is still unknown. In this paper we present new measurements showing the effect of oxygen fugacity and carbon content on the incorporation of water in olivine and wadsleyite at conditions relevant of the 410 km depth.
2.1 Multi-anvil experiments
All the experiments were conducted at the Laboratoire Magmas et Volcans (Clermont-Ferrand, France) on a Voggenreiter Mavo-press LP 1500–1000 t multi-anvil press equipped with a Kawai-type module. Heating was performed and monitored using a Pacific 140-AMX AC power source. Secondary anvils were tungsten carbide cubes of 32 mm edge with 8 and 6 mm truncation edge length (TEL) and were used at pressures of 700 and 640 t, respectively. Except for the innermost part of the experimental assembly, the assembly design is the same for all the syntheses (see Appendix A1) and is composed of a 14 mm edge Cr-doped MgO octahedron insulated from the LaCrO3 furnace by a ZrO2 sleeve. The sample is surrounded by MgO or hexagonal BN in the case of the most reducing experiments conducted at the IW buffer in order to improve the impermeability of the capsule. Indeed, BN has been shown to help in minimizing H loss (see Truckenbrodt et al., 1997). Thus, we used it under very reducing conditions where the production of H2 should be the highest.
The outer capsule is a gold palladium alloy (80 %–20 %) welded on both sides by arc welding under argon stream. Inner capsules, made from a folded rhenium foil, avoid the loss of iron into AuPd. Two Re capsules were placed within the AuPd capsule: one containing the sample and one containing the oxygen fugacity buffer. In order to favor grain growth, the sample is composed of two layers: the majorite part (∼ 40 % of the mass) is placed first and then topped with the olivine powder (see Appendix A2). For the olivine or wadsleyite part of all the experiments, the starting material is a crushed San Carlos olivine single crystal. The majorite composition slightly modified from Litasov et al. (2014) is a mixture of oxides, except for magnesium and silicon, added as pure enstatite powder (MgSiO3), completed with SiO2 to reach the desired composition (see Appendix B1). The dry part of the mixture, excluding FeO, is heated at 1000 ∘C during 2 h, mixed with FeO, heated at 300 ∘C for the same duration, and then mixed with the fluid source. For the experiments with pure water, aluminum oxide is replaced by gibbsite (Al(OH)3) used as water source. This hydroxide is more stable than brucite (Mg(OH)2), which absorbs atmospheric carbon dioxide in large amounts rapidly. The carbon-bearing experiments include powder of oxalic acid as the fluid source in addition of gibbsite. This molecule is a stable compound at room temperature, allowing a good control of the fluid composition, especially the hydrogen over carbon ratio (HOOC–COOH). Its decomposition occurs quickly around 160 ∘C at room pressure, ensuring that all of it will react during the experiment (McCubbin et al., 2014). Using this procedure, the bulk water contents (of the olivine + majorite layers) obtained with such a procedure are 3.3 wt % and 2.8 wt % H2O for the C-free and C-bearing starting material, respectively. As monitored with an elemental analyzer (Flash 2000 CHNS, Thermo Scientific) the resulting H C ratio is 2. The detection limit of this instrument is 2 ppb for both C and H, and the uncertainty on the measurement of H and C contents is of 2 % and 4 %, respectively, as determined on standards.
The oxygen fugacity buffers used in this study are iron-wüstite, nickel–nickel oxide, and rhenium–rhenium dioxide. Calculated fO2 for these equilibria under the condition of the experiments are shown in Table 1. Calculations use the thermodynamic data provided by Campbell et al. (2009) for iron and nickel and Jacob et al. (2000) for rhenium. Fe-FeO and Ni-NiO are used as a mixture of metal and oxide, and ReO2 is used alone, as the capsules containing the buffers and samples are pure rhenium. The presence of both metal and oxide is verified using SEM after each experiment to ensure the oxygen fugacity was efficiently controlled.
Table 1Experimental conditions and resulting water contents as measured with Raman spectroscopy. N means number of grains analyzed; Acq T is the type of Raman measurement performed: 1 for single analysis and 2 for the average of two-orthogonal measurements (see Martinek and Bolfan-Casanova, 2021).
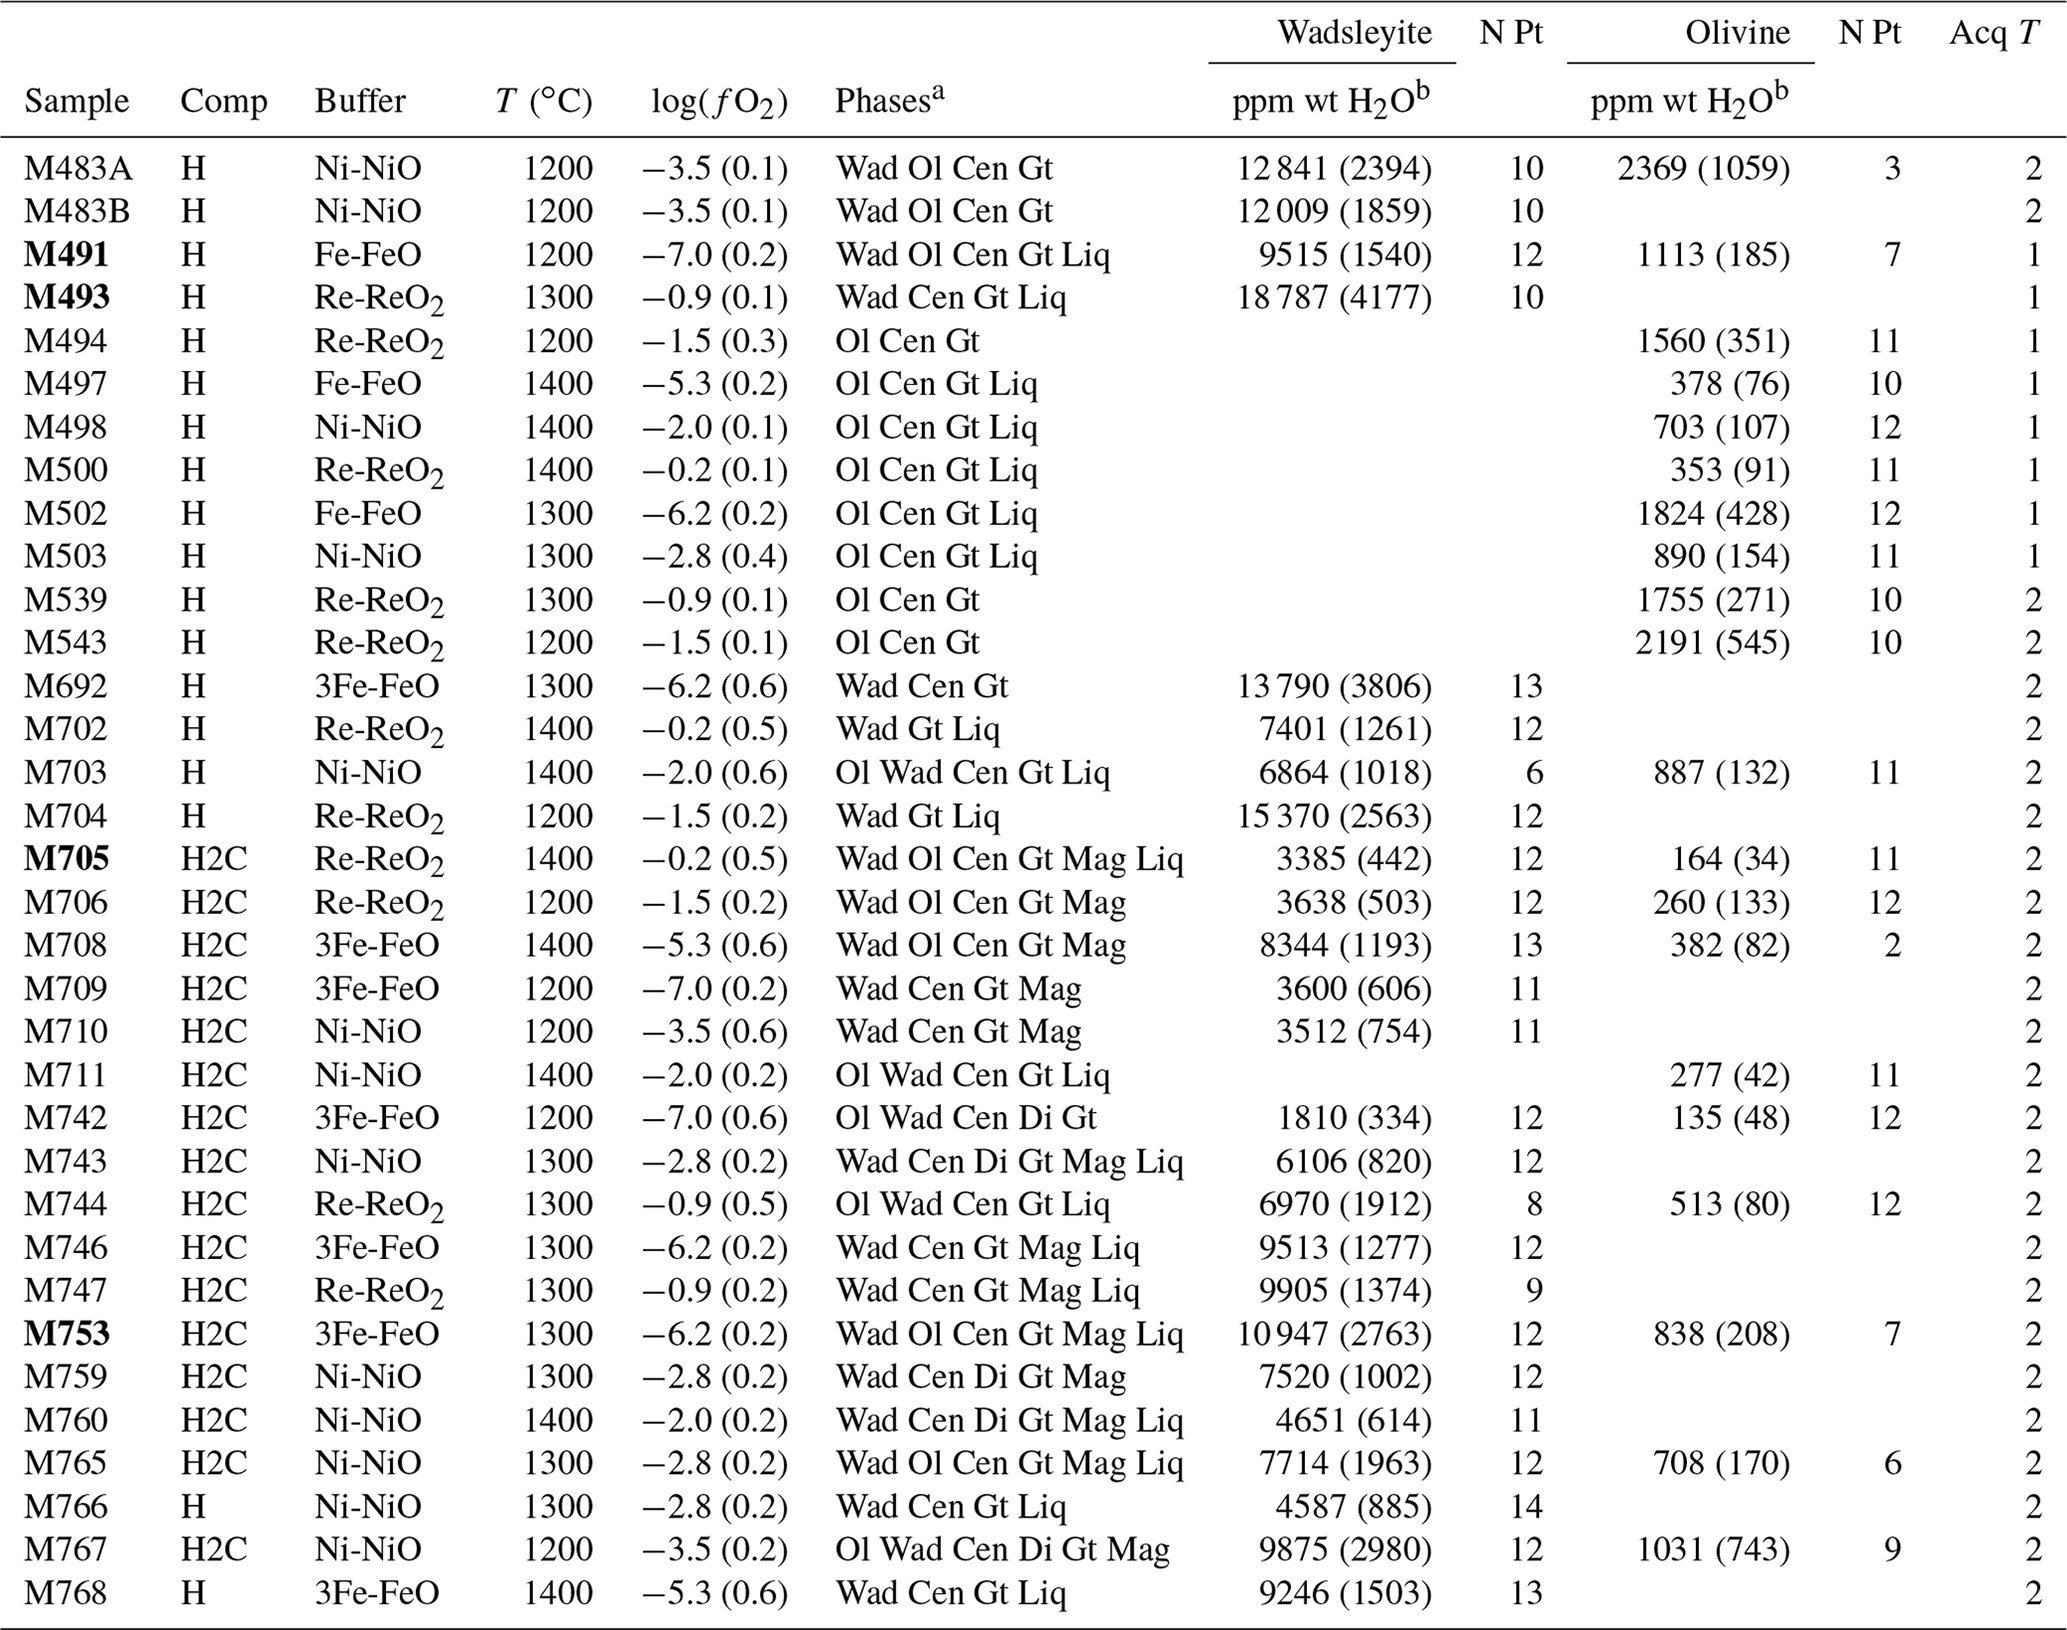
a Wad: wadsleyite; Ol: olivine; Cen: clinoenstatite; Gt: majoritic garnet; Liq: liquid or melt; Di: diopside; Mag: magnesite. b The numbers in parentheses correspond to the associated uncertainty, in parts per million by weight (ppm wt).
Experiments were conducted between 12 and 14 GPa and heated at 1200, 1300, and 1400 ∘C during 4 h, except for the IW buffer, where the duration was 2 h in order to avoid complete loss of H2. We used different truncation sizes to improve pressure efficiency, and the press load was adapted to get olivine, which means 12 GPa, and then get wadsleyite, which means 14 GPa, according to Perplex software (Connolly, 2009). Pressure uncertainty is estimated to 0.5 GPa. Temperature uncertainty is 20 to 30 ∘C. Details of the experimental parameters are summarized in Table 1. After decompression, sample capsules are extracted from the assembly, put in photo-polymerizable dental paste, and opened by polishing on coarse-grained sandpaper. Immediately after opening, the capsule is placed in a liquid (usually ethanol) to observe if bubbles escape from the capsule. This indicates that fluid entrapment worked throughout all the experiment and thus that minerals have experienced fluid saturation. The criterion of fluid saturation is very important in order to demonstrate that the water content that we are measuring in NAMs is the maximum storage possible, in other words the storage capacity. After this, the capsule is polished approximately down to its center according to a plane parallel to its elongation axis.
2.2 Chemical analysis
The different analyses follow the same order: ideally SEM, electron microprobe, and Raman spectroscopy. In doing so, the carbon coating necessary for the two electronic microscopy methods is applied only once and then removed before the Raman analysis with a light polishing with 0.25 µm diamond suspension. This order allows us to first perform a chemical map of the sample, which is used to easily locate the different phases and estimate mineral proportions.
2.3 SEM procedure and image treatment
The chemical mapping of the samples was obtained using energy dispersive X-ray spectroscopy (EDS) using a JEOL JSM-5910LV scanning electron microscope (SEM) under high vacuum with a 15 kV current, 55 µm spot size, ×100 to ×180 magnification (depending on the sample size), and at a working distance of 17 to 19 mm. Analyzed elements were Si, Mg, Fe, Al, Ca, Na, and Ti for the sample and Re, Pd, Au, Fe, and Ni for the buffers and capsule material. For all samples, a phase map was constructed, consisting in a composite image of four elements. To distinguish olivine from wadsleyite, another type of map (Mg-Fe map) was used. A phase map was then drawn from the composite maps in order to estimate the relative abundances of all phases (see Fig. 1).
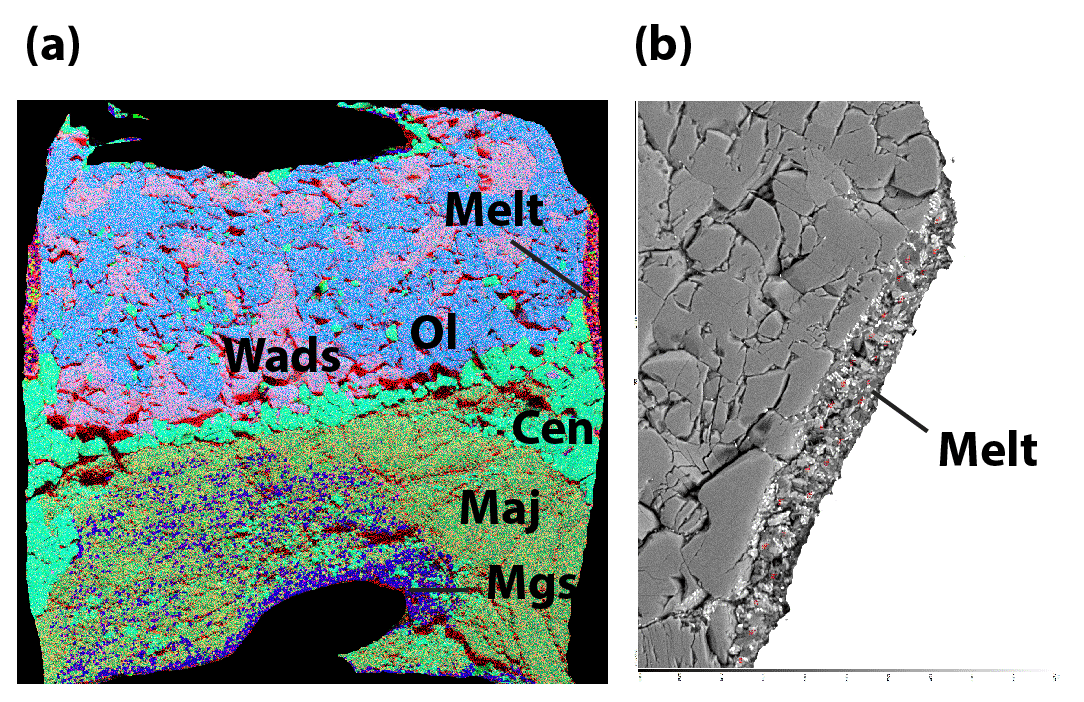
Figure 1(a) X-ray mapping of sample M705 synthesized in the H–C–silicate system; Ol: olivine, Wads: wadsleyite, Maj: majorite, Cen: clinoenstatite, Mgs: magnesite. (b) EPMA picture showing the melt zone analyzed (the white background is the metallic capsule).
2.4 Electron microprobe
Precise chemical compositions of the solid phases are then obtained from electron microprobe analysis (EPMA) using a Cameca SX100 analysis using a point beam size, an accelerating voltage of 15 kV, and intensity of 15 nA (except for magnesite which required 4 nA). High-pressure melts are rarely quenched into glasses and often recrystallize (see Fig. 1b). These were thus analyzed using a defocused beam size of 10 to 20 µm. After having removed the carbon coating, Raman spectroscopy was used to confirm the phases obtained but most importantly for water quantification. All the analyses were conducted at the Laboratoire Magmas et Volcans (Clermont-Ferrand, France).
2.5 Water quantification by Raman spectroscopy
Water quantification with Raman spectroscopy was performed on olivine and wadsleyite using the ratio of the integrated intensities of the OH Si band regions. The relationship of the OH Si ratio with water concentration was established on standards of olivine and wadsleyite characterized by either FTIR or ERDA (see Martinek and Bolfan-Casanova, 2021). All spectra were acquired with polarized light without an analyzer, and the sample was rotated under the beam to change the polarization angle and, in this way, obtain measurements along two perpendicular polarization angles. In general the number of points measured on average is 11.5 (minimum 9, maximum 14) for each phase analyzed. The measuring conditions used are the same as those described for the olivine and wadsleyite standards (see Martinek et Bolfan-Casanova, 2021). All the spectra were acquired at the same magnification (×100): in the silicate vibration zone, on the same window centered on 720 cm−1 (from 61 to 1318 cm−1) for 2×5 s; and in the OH vibration zone on another window centered on 3400 cm−1 (from 2978 to 3784 cm−1) for 5×60 s. The power used for wadsleyite is about 8 to 9 mW, and it is 65 to 71 mW for olivine. For the baseline correction we used cubic spline and polynomial functions for the OH regions of olivine and wadsleyite, respectively.
2.6 Water quantification by NanoSIMS
Some samples were analyzed with the Cameca NanoSIMS 50 at the Muséum National d'Histoire Naturelle. The samples were embedded in indium and loaded in the NanoSIMS' airlock at Torr 2 d before the beginning of the analysis in order to avoid water contamination on the surface. The measurements of water concentration were calibrated on two samples of olivine synthesized at high pressure and containing 115 and 370 ppm wt H2O as determined using polarized infrared spectroscopy (Bali et al., 2008) after correction using the new extinction coefficient by Withers et al. (2012) and on three samples of wadsleyite containing 0.15 wt %, 1.0 wt %, and 2.7 wt % H2O as determined using elastic recoil detection analysis (Bolfan-Casanova et al., 2018, and unpublished results). To remove surface contamination and reach a static state of ions emission, samples were first pre-sputtered over a 5×5 µm area for 2 min with a 200 pA Cs+ primary beam (∼ 1 µm in diameter). The samples were then rastered with a 20 pA primary beam (∼ 200–300 nm in diameter) over a 3×3 µm area for 2 min. To limit contributions from the potential re-deposition of residual contaminants, we used a numerical blank limiting the analyzed region to the innermost 1×1 µm. Species, i.e., 12C, 16O1H−, 28Si, 32S, and 27Al 56Fe, were analyzed in multi-collection with electron multipliers (EMs). Data were corrected for the EMs dead time of 44 ns. Slit and diaphragms were set to reach a high enough mass-resolving power to discriminate 17O from 16O1H. The linear regression gives a high-quality calibration (R2 of 0.9999) for the quantification of water concentration in olivine and wadsleyite (see Appendix A3). On average, the standard errors on the water content of olivine and wadsleyite are of 10 % and 1 %, respectively.
3.1 Stability of the phases
The mineral paragenesis typical of peridotite in the 12–14 GPa pressure range and 1200 to 1400 ∘C is observed after sample recovery. The phases observed are shown in Fig. 2 as a function of temperature and of the experiment as well as in Table 1. In experiments using the starting material containing only H2O, we observe olivine and/or wadsleyite + garnet ± clinoenstatite in all experiments. In experiments carried out with the starting material containing (H2O + CO2), magnesite formed almost systematically. Also, minute amounts of diopside are observed, without showing any coherence between its presence and the experimental conditions, except its systematic absence in the experiments carried out at the Re-ReO2 buffer conditions (the most oxidized), probably due to the fact that Ca-pyroxene is among the first phases to melt. Finally, 20 of the 34 experiments performed contain zones made of very fine-grained crystallites, generally rich in calcium and iron, interpreted as remnants of an unquenchable melt, whose estimated mass fraction varies between 0 % and 30 % (Fig. 1b).
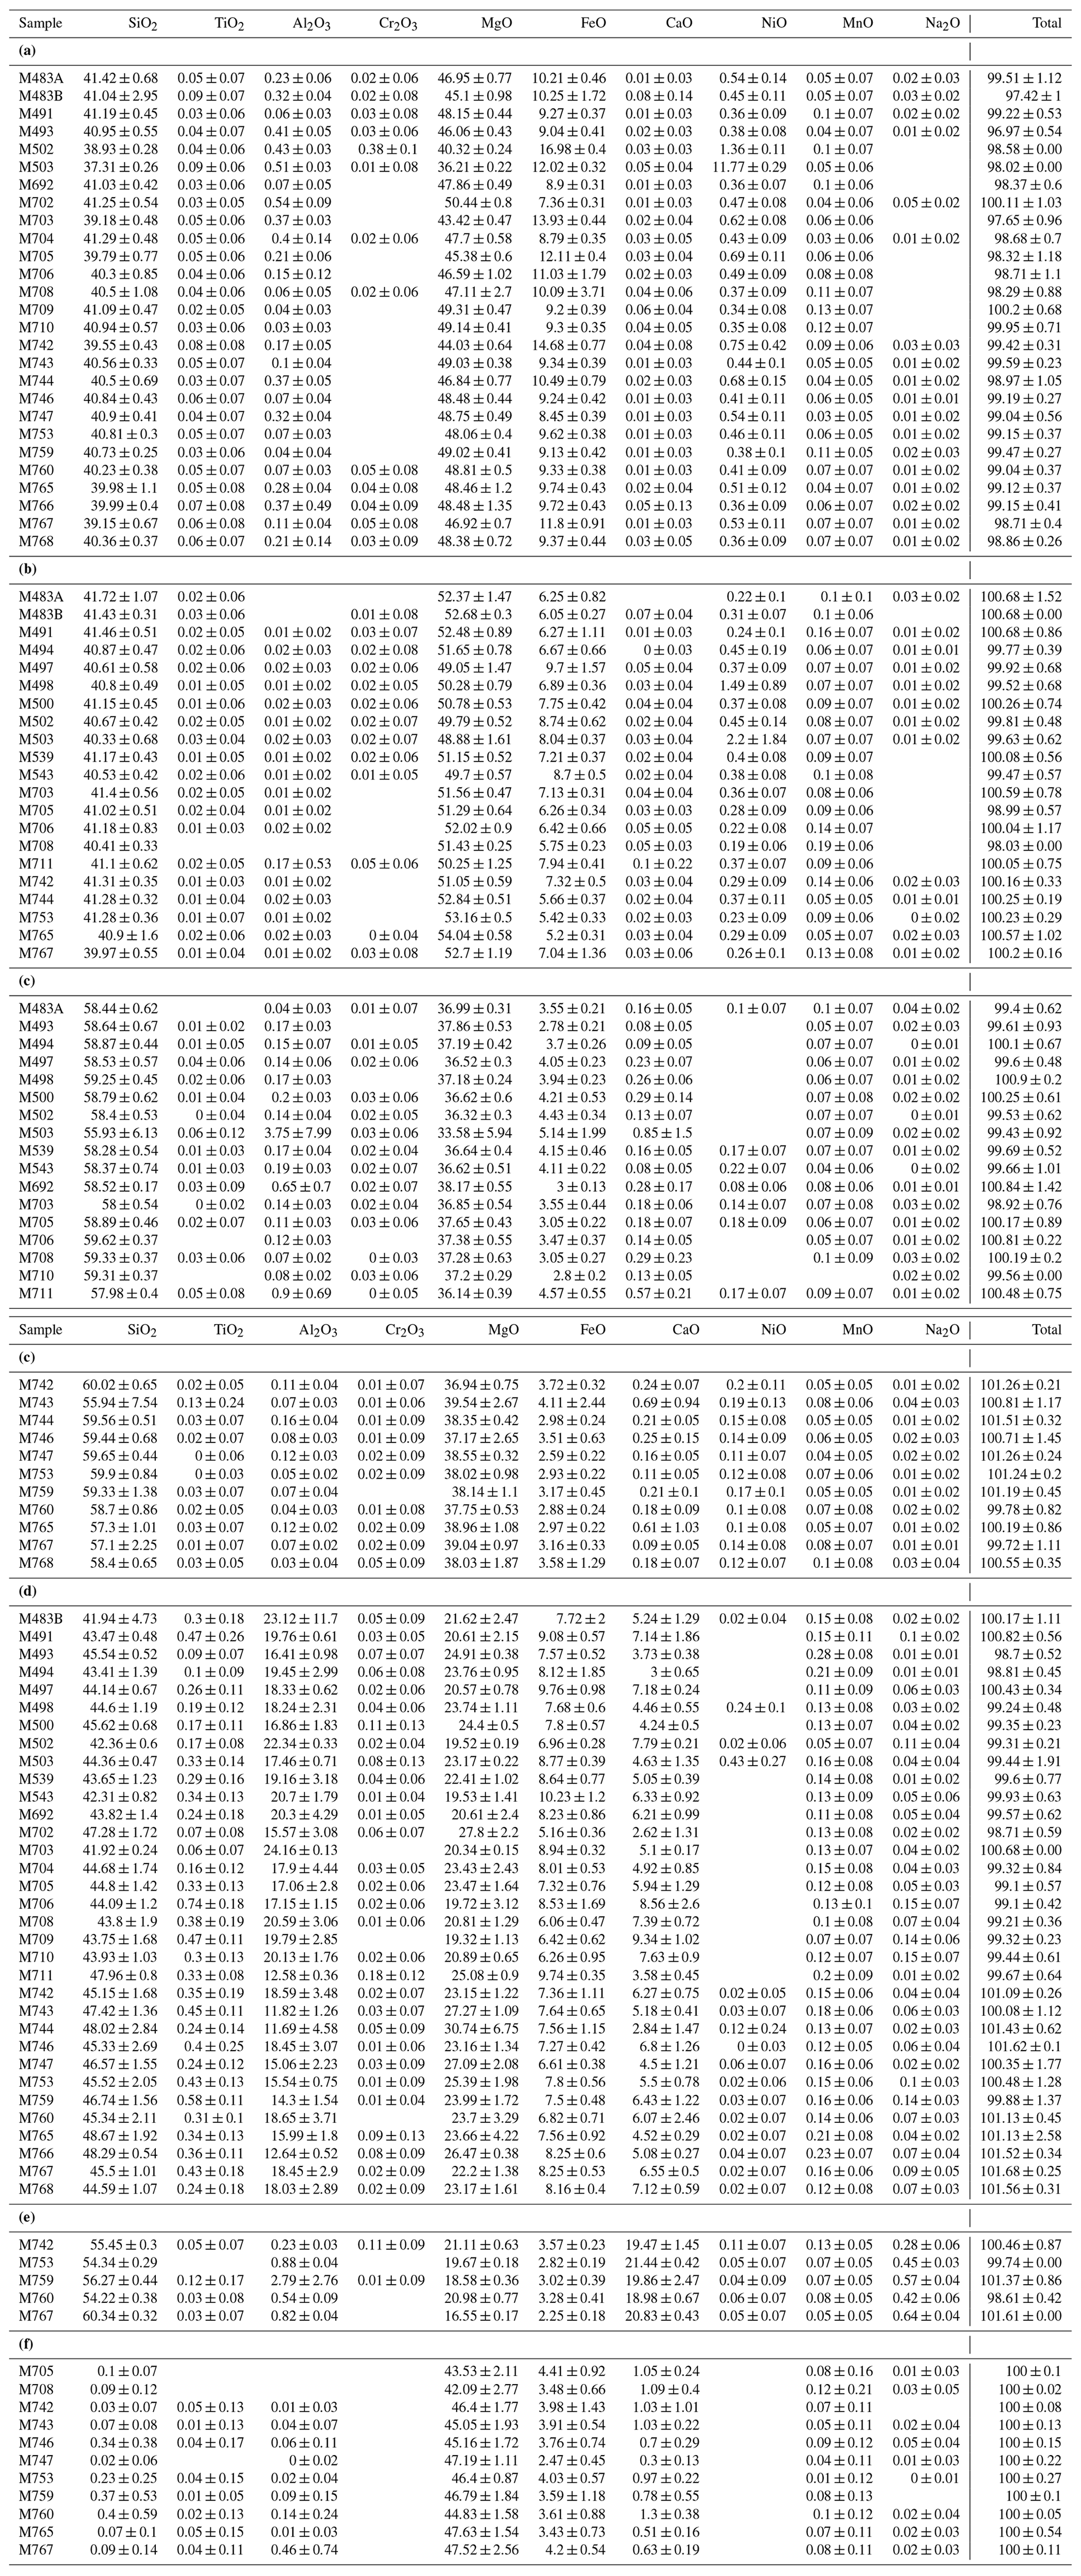
Table 2Composition of the solid phases: (a) wadsleyite, (b) olivine, (c) clinoenstatite, (d) majorite, (e) diopside, and (f) magnesite.
3.2 Chemical compositions of the different phases
3.2.1 Olivine and wadsleyite
The measured compositions (see Table 2 for all phases) show that most of the olivines are chemically homogeneous, as well as the wadsleyites. The Mg# (calculated here as the ratio Mg (Mg + Fe + Ni), expressed in moles) of the olivines varies from 0.89 to 0.94. In the case of wadsleyite it varies from 0.73 to 0.92. The iron content of olivine and wadsleyite seems to be impacted only by the relative abundance of olivine and wadsleyite when both phases coexist within the two-phase loop, so the main force driving their composition is the pressure and temperature of the phase transition (see Katsura et al., 2004; Frost and Dolejs, 2007). Due to carbide fatigue it is difficult to control pressure better than ± 0.5 GPa (Frost and Dolejš 2007). No net or reproducible effect of temperature, , or initial composition on Mg# could be observed. Concerning aluminum, the difference between olivine and wadsleyite is clearly visible, with an average of 0.22 ± 0.16 wt % Al2O3 in wadsleyite and 0.023 ± 0.037 wt % in olivine. Thus, in general, wadsleyite can hold 10 times more Al than olivine. This difference evidences that the phases reached chemical equilibrium. It has also been shown that hydrous fluids and carbonatitic fluids display very low wetting angles at high pressures, thus enhancing material transport efficiency even under conditions of low melt fractions (Yoshino et al., 2007).
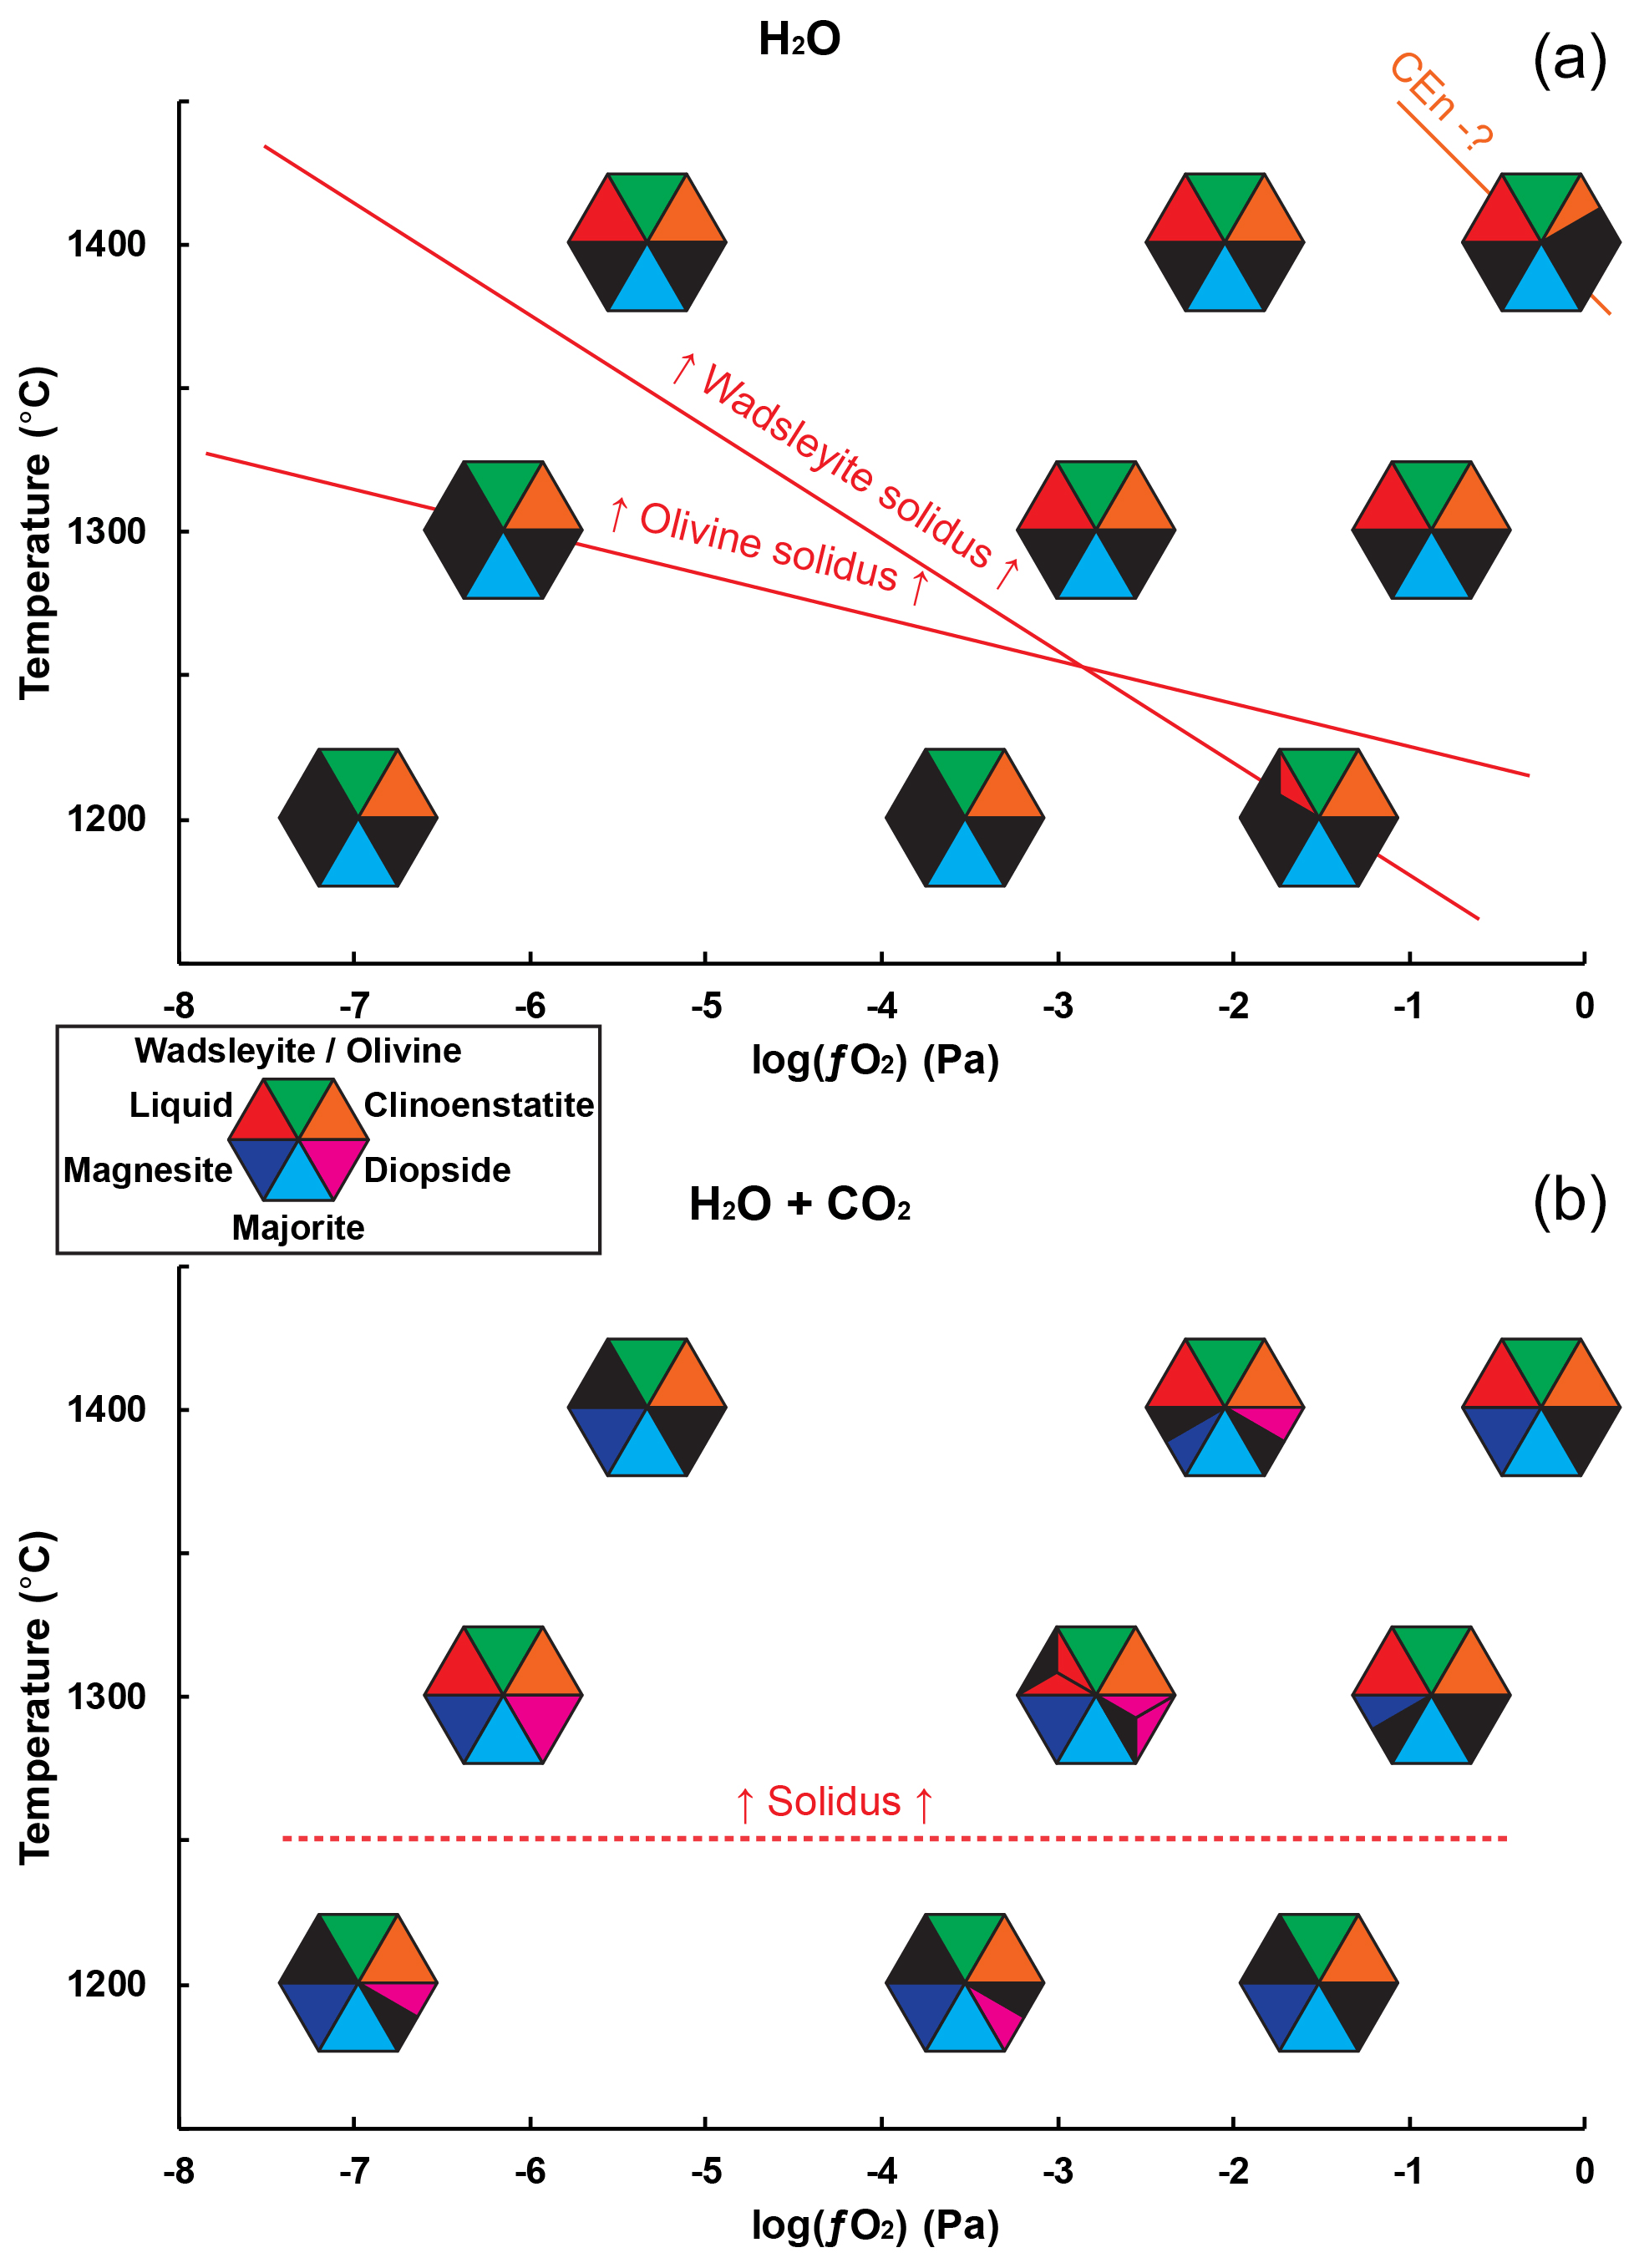
Figure 2Distribution of the observed phases as a function of temperature and , for the two starting compositions used: (a) with only H2O and (b) with H2O and CO2. The polymorphs olivine and wadsleyite have been grouped together in the same symbol, with their presence being primarily controlled by pressure and/or temperature. When several experiments have been carried out under the same conditions and have given different results, the triangle of the corresponding phase is split into several parts. The red line at the top indicates the observed limits of the fusion conditions, and the orange line indicates the probable onset of destabilization of clinoenstatite.
3.2.2 Clinoenstatite
Clinoenstatite often forms at the boundary between olivine/wadsleyite and majorite layers. Its composition is very close to the pure magnesian pole (MgSiO3), with an average Mg# of 0.94 ± 0.01 (only two samples are outside the 0.93–0.96 range of Mg#).
3.2.3 Diopside
A few carbon-bearing experiments contain a small amount of diopside in the form of micrometer-sized crystals. Its composition is very close to the pure pole CaMgSi2O6, with a maximum of 3.6 wt % FeO measured and an average Mg# of 0.54 ± 0.03 calculated as Mg (Mg + Fe + Ca).
3.2.4 Majorite
The garnets present in all samples (except two) have an excess of silicon on average of 0.18 ± 0.11 Si atoms per formula unit (apfu) above 3, reaching 0.42 Si apfu above 3. Majorite displays a much greater variability in composition compared to the other major phases, and its composition is more dependent on the melt fraction. In particular, its concentration in incompatible elements, such as CaO and Na2O, decreases in the presence of fusion at increasing oxygen fugacities (see Fig. 3). Similar trends can be observed by comparing the concentration of certain elements according to , but since high melting rates are generally correlated with oxidizing conditions, causality is only indirect (see discussion).
3.2.5 Magnesite
Of the 16 samples made in the carbon-bearing system 14 contain magnesite. Its presence is easily detectable thanks to the chemical maps (see Fig. 1a), despite a very small crystal size of often less than 1 µm. Its chemical composition is very close to the pure magnesian end-member, with an average Mg# of 0.94 ± 0.01 and with only 3.71 ± 0.52 wt % FeO and 0.85 ± 0.30 wt % CaO with Ca# varying between 0.5 and 2.0 similar to the study of Ghosh et al. (2009) (see Table 2). Magnesite is usually the high-pressure form of carbonate above 3–4 GPa because dolomite + enstatite reacts to form magnesite + diopside (Dalton and Wood, 1993; White and Wyllie, 1992). Magnesite is stable above the solidus of H–C-bearing peridotite and has been reported in carbonated peridotite up to 1500 ∘C (Ghosh et al., 2009) and carbonated eclogite (Hammouda, 2003).
3.2.6 Melt
High-pressure volatile-rich melts do not vitrify upon quenching temperature, and the porosity, thought to have been once filled up with volatiles, leads to low EPMA totals. The melts totals, in the range of 65 ± 7 wt % to 86 ± 3 wt %, increase with increasing temperature, concomitantly to an increase in the melt fraction. This behavior is interpreted as a decrease in the volatile content of the melt with increasing temperature, as expected for incompatible elements (see Table 3). Totals are lower in the C-bearing system, obviously due to the addition of CO2 to the H2O-bearing melt. The SiO2 contents of the melts increase with increasing temperature or increasing MgO content (see Fig. 4) – a normal behavior for a compatible compound – and increase with increasing . The (Mg + Fe) Si ratio of melts increases with increasing temperature and with increasing oxygen fugacity (see Fig. 4). This can be explained by the fact that melt fractions are larger at higher for the same temperature. The (Mg + Fe) Si ratio of melts is substantially larger in the C-bearing system (from 2.2 to 3.1) compared to the C-free system (1.5 to 2.3). This is due to the lower silica content of the carbonaceous melts (from 18 wt %–34 wt % and 18 wt %–24 wt % SiO2 in the C-free and C-bearing systems, respectively).
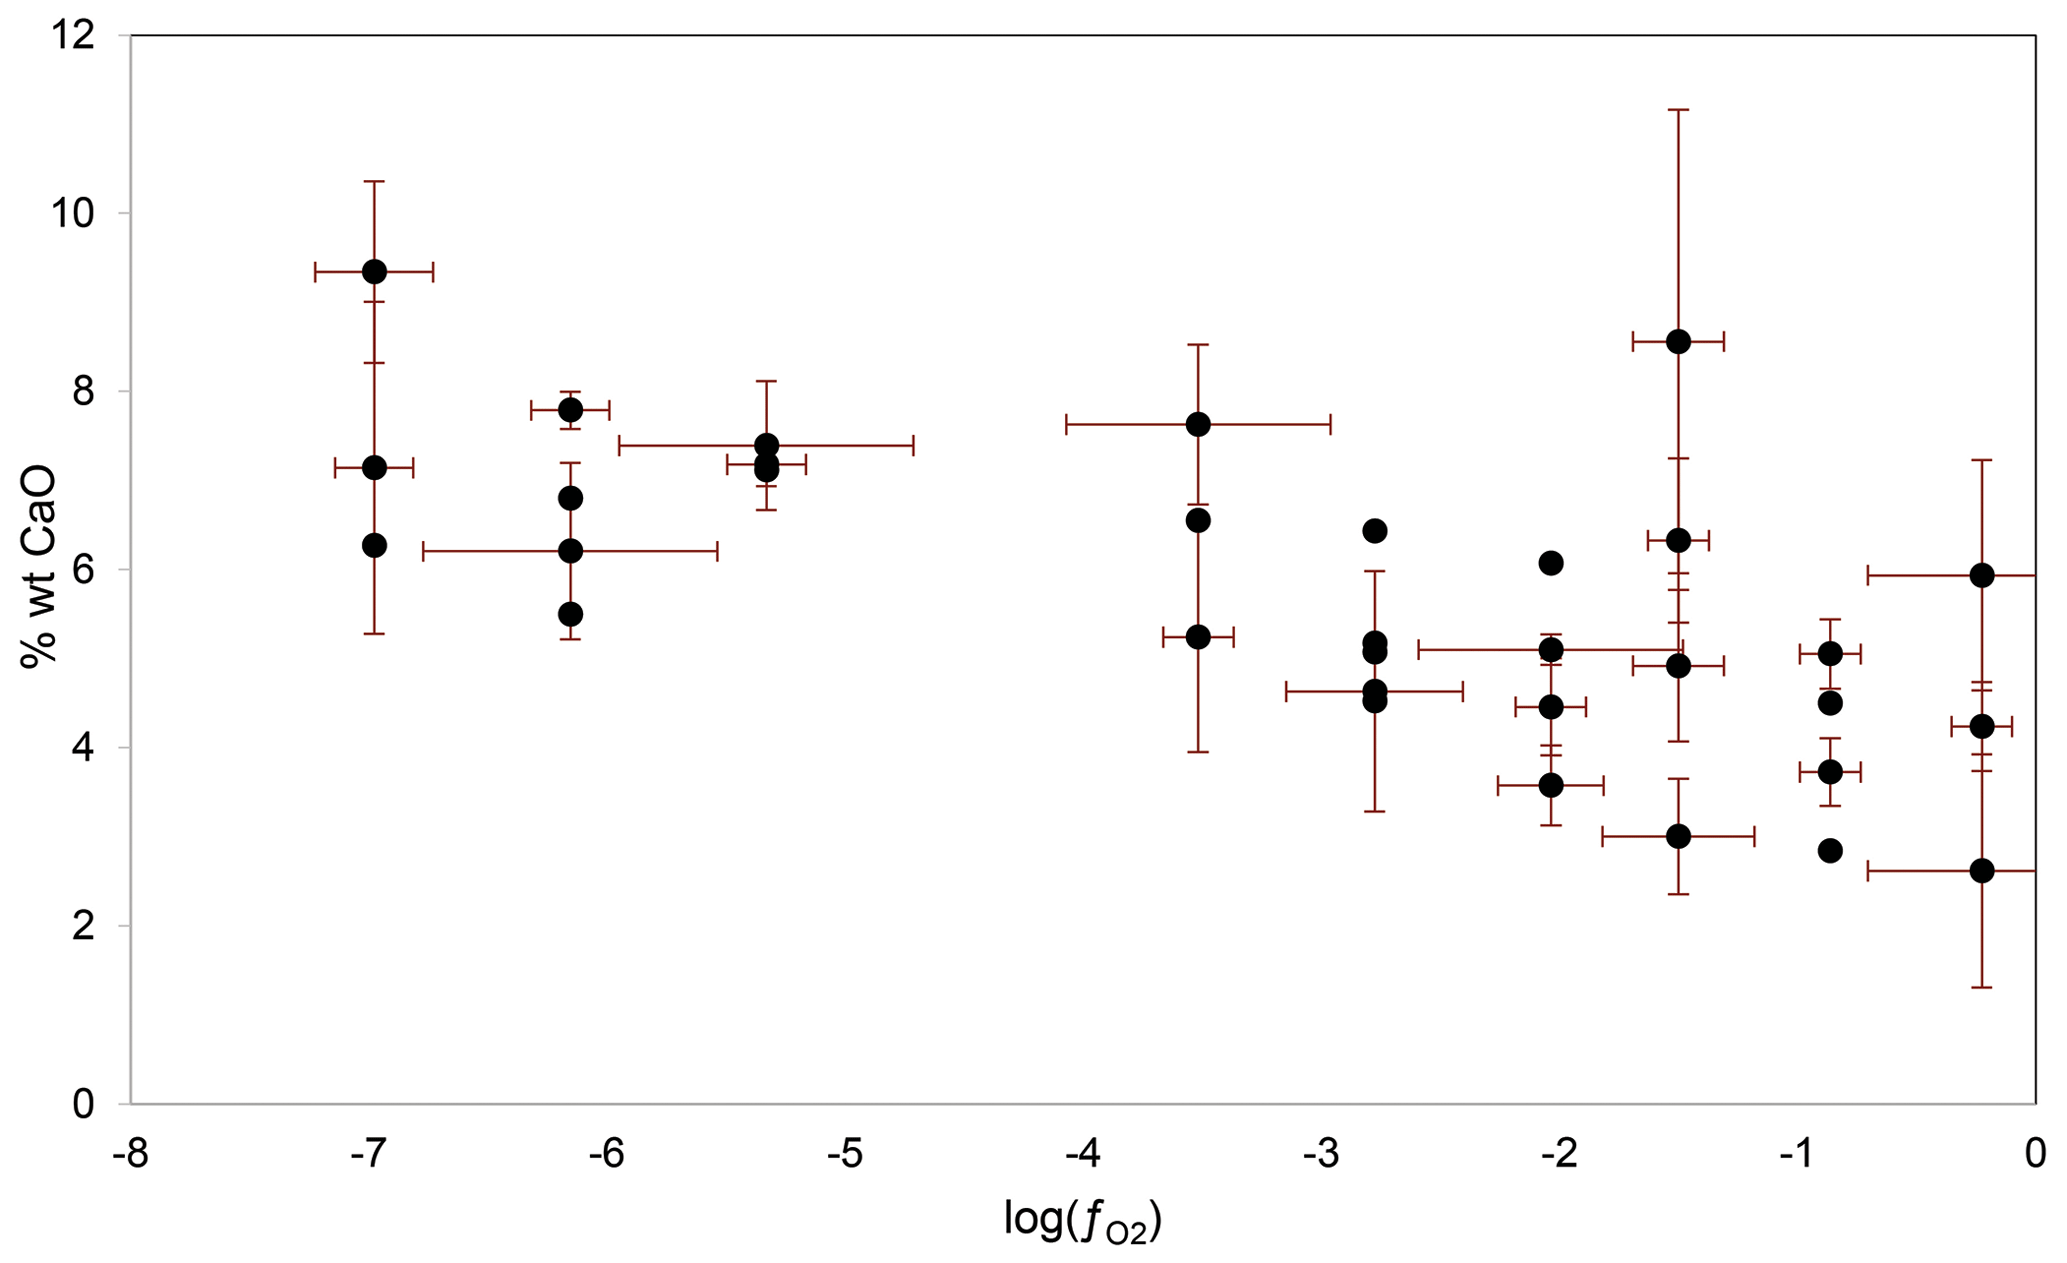
Figure 3Variations in incompatible element content, here CaO, in majorite as a function of experimental oxygen fugacity.
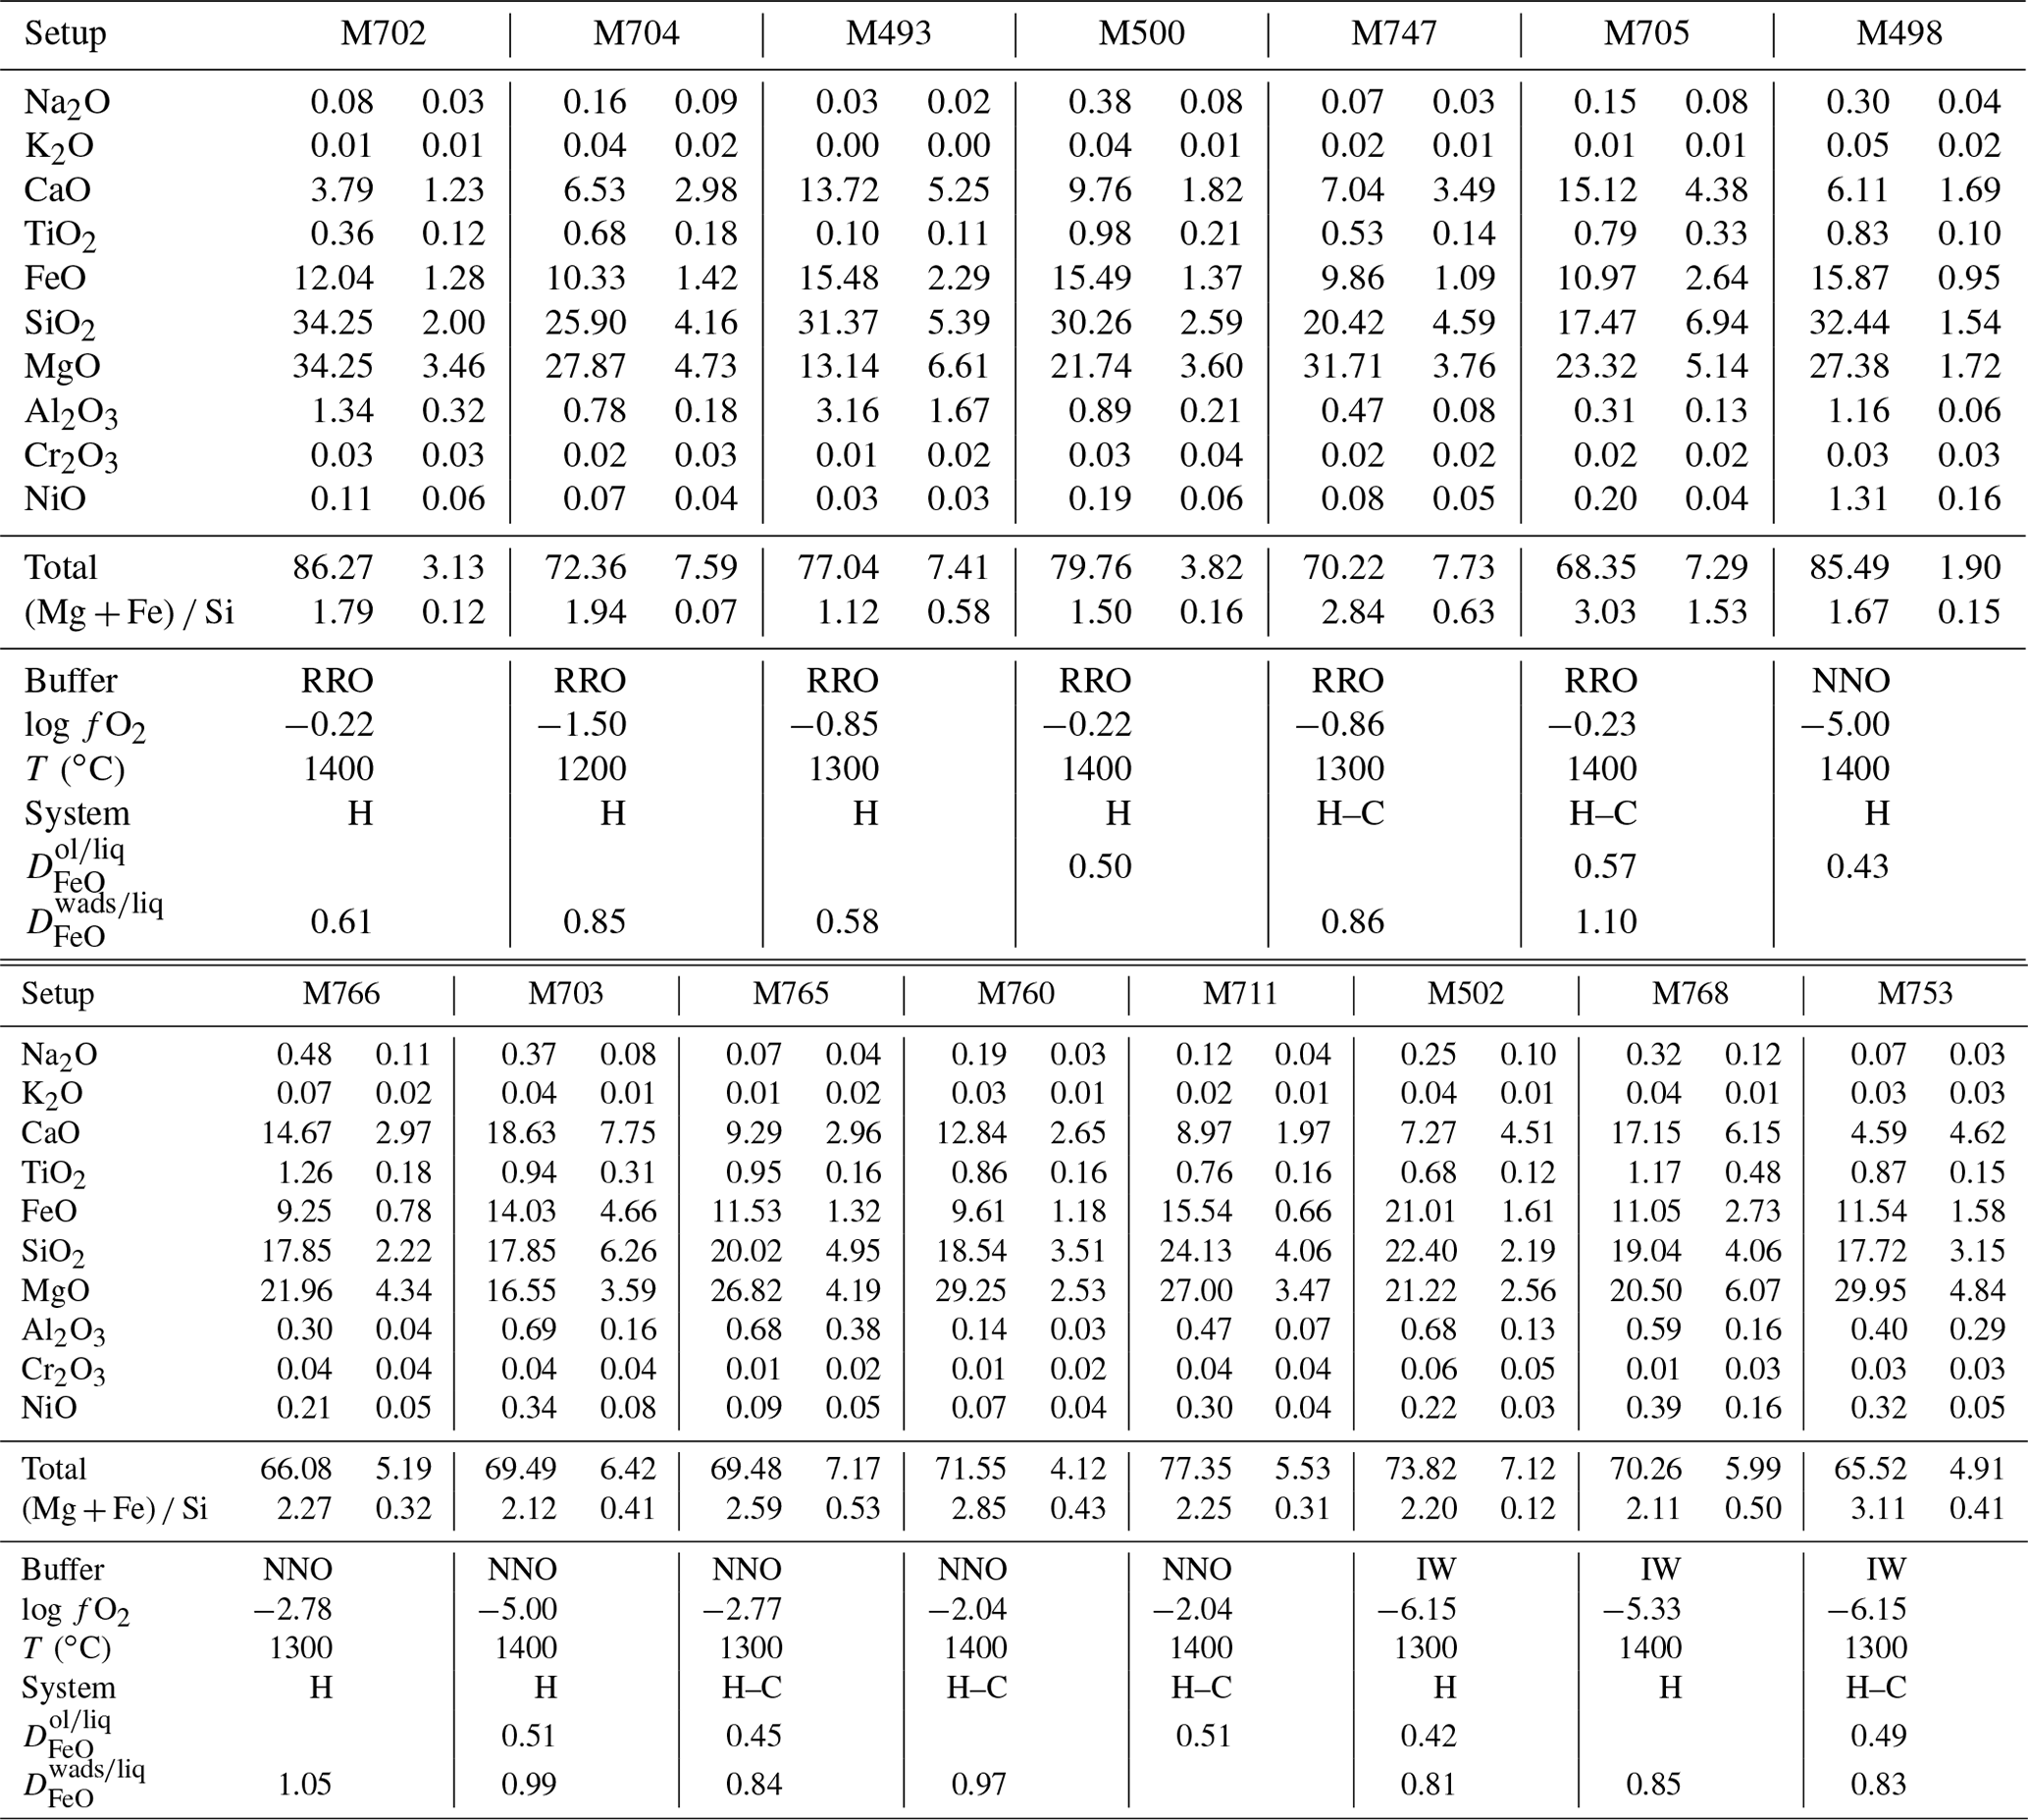
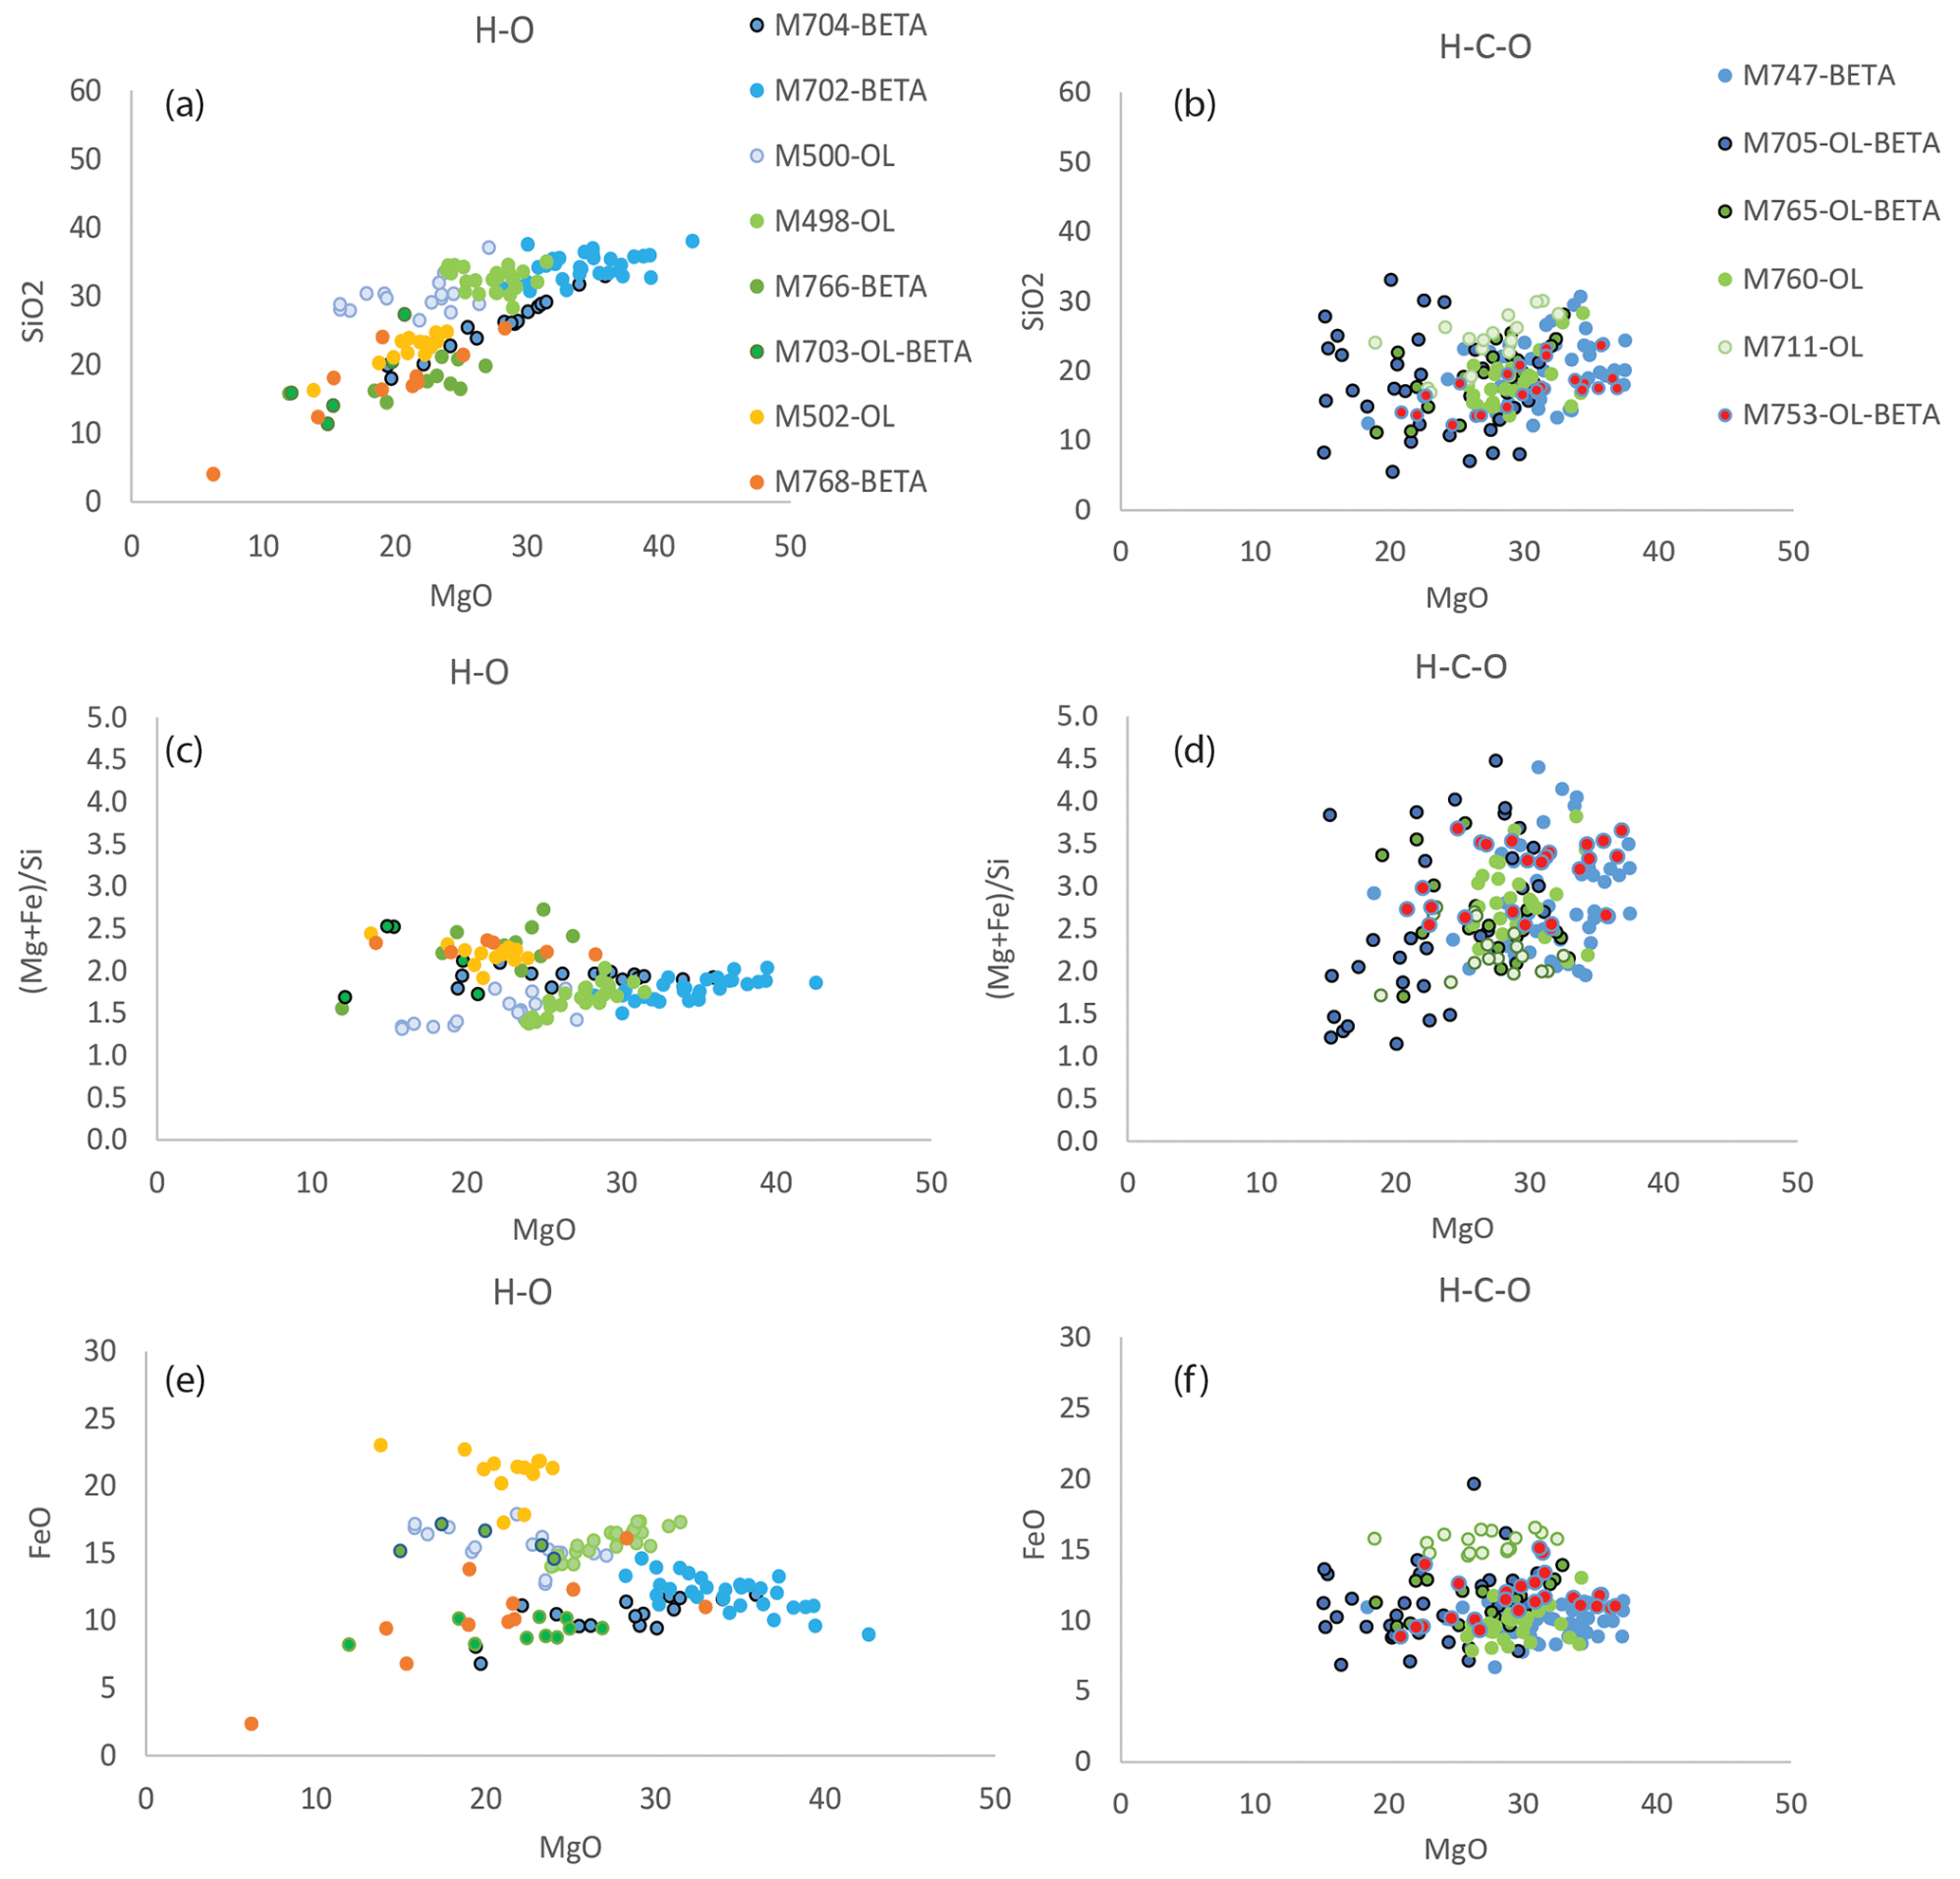
Figure 4Composition of the experimental melts in the H–O fluid system (a, c, e) and H–C fluid system (b, d, f) as a function of MgO content of the melts (with MgO being correlated with temperature). The blue, green, and orange or red symbols correspond to the RRO, NNO, and IW buffers, respectively.
The behavior of FeO is more complex but in general seems to behave like an incompatible element, with concentration in the melt decreasing with increasing temperature or increasing melt fraction (see Fig. 4). FeO contents normalized for the dry composition range from 14 ± 2 wt % to 29 ± 4 wt % FeO in the C-free system and 13 ± 1 wt % to 20 ± 1 wt % in the C-bearing system (errors in general are within 20 %). The highest FeO content is measured for the most reduced melt that could be analyzed: under IW conditions and 1300 ∘C, without C and in coexistence with olivine. The partitioning of FeO between olivine and melt (DFe) ranges between 0.4 and 0.6 as previously observed by Mibe et al. (2006) at 5 GPa. The partitioning of FeO between wadsleyite and melt is more variable with values between 0.6 and 1.1, and it is higher than observed previously by Mibe et al. (2006), who reported two values in the range of 0.41–0.45 for samples synthesized at 1600 ∘C in the peridotite–H2O system. Since some of our experiments are located in the binary loop where olivine and wadsleyite coexist, some wadsleyites are very iron-rich with 12 wt % to 17 wt % FeO and associated DFe of 0.8 to 1.1. In olivine-free samples, wadsleyite FeO content varies between 8.4 wt % and 9.7 wt % with associated DFe between 0.6 and 0.8 depending on the melt fraction. Since the present samples were synthesized at lower temperatures than those of Mibe et al. (2006), hence closer to the solidus, iron is more compatible in this study. Indeed, at RRO we observe that the decreases from 0.8 at 1200 ∘C to 0.6 at 1300–1400 ∘C where melt fraction is higher.
3.3 Water contents
3.3.1 Raman spectra
The mean Raman spectra of olivines and wadsleyites are presented in Figs. 5 and 6, respectively, as a function of their calculated water content, showing the clearly visible dependence of the OH bands on the water content. Concerning the OH absorption area of wadsleyite (Fig. 5), the positions of the peaks located around 3475 and 3580 cm−1 do not seem to vary, and they increase overall as the water content increases. However, the main band of the spectrum, around 3350–3360 cm−1, shows a more complex behavior. This band is the result of the combination of several bands already described (Jacobsen et al., 2004), located around 3317, 3326, and 3360 cm−1 as observed by FTIR. The band at 3317 cm−1 is difficult to identify here, because of the intensity and width of its neighbors. The two others are found at 3330 and 3370 cm−1 here. No correlation between the relative intensity of the OH bands could be observed here, whether with water, iron or aluminum content, the presence of carbon, the , or temperature. Concerning olivine (see Fig. 6) the positions of the OH bands at 3612 cm−1 (very weak), 3580, 3566, and 3545 cm−1 (strong) and at 3479 + 3459 cm−1 (weak) do not vary significantly, and their intensities increase proportionally to the measured water content. Note that these bands are very close to those already observed by Bolfan-Casanova et al. (2014) with Raman spectroscopy for hydrothermally annealed forsterite and theoretically expected by Balan et al. (2017). Even if it is OH that is observed, in the following we will refer to it as water.
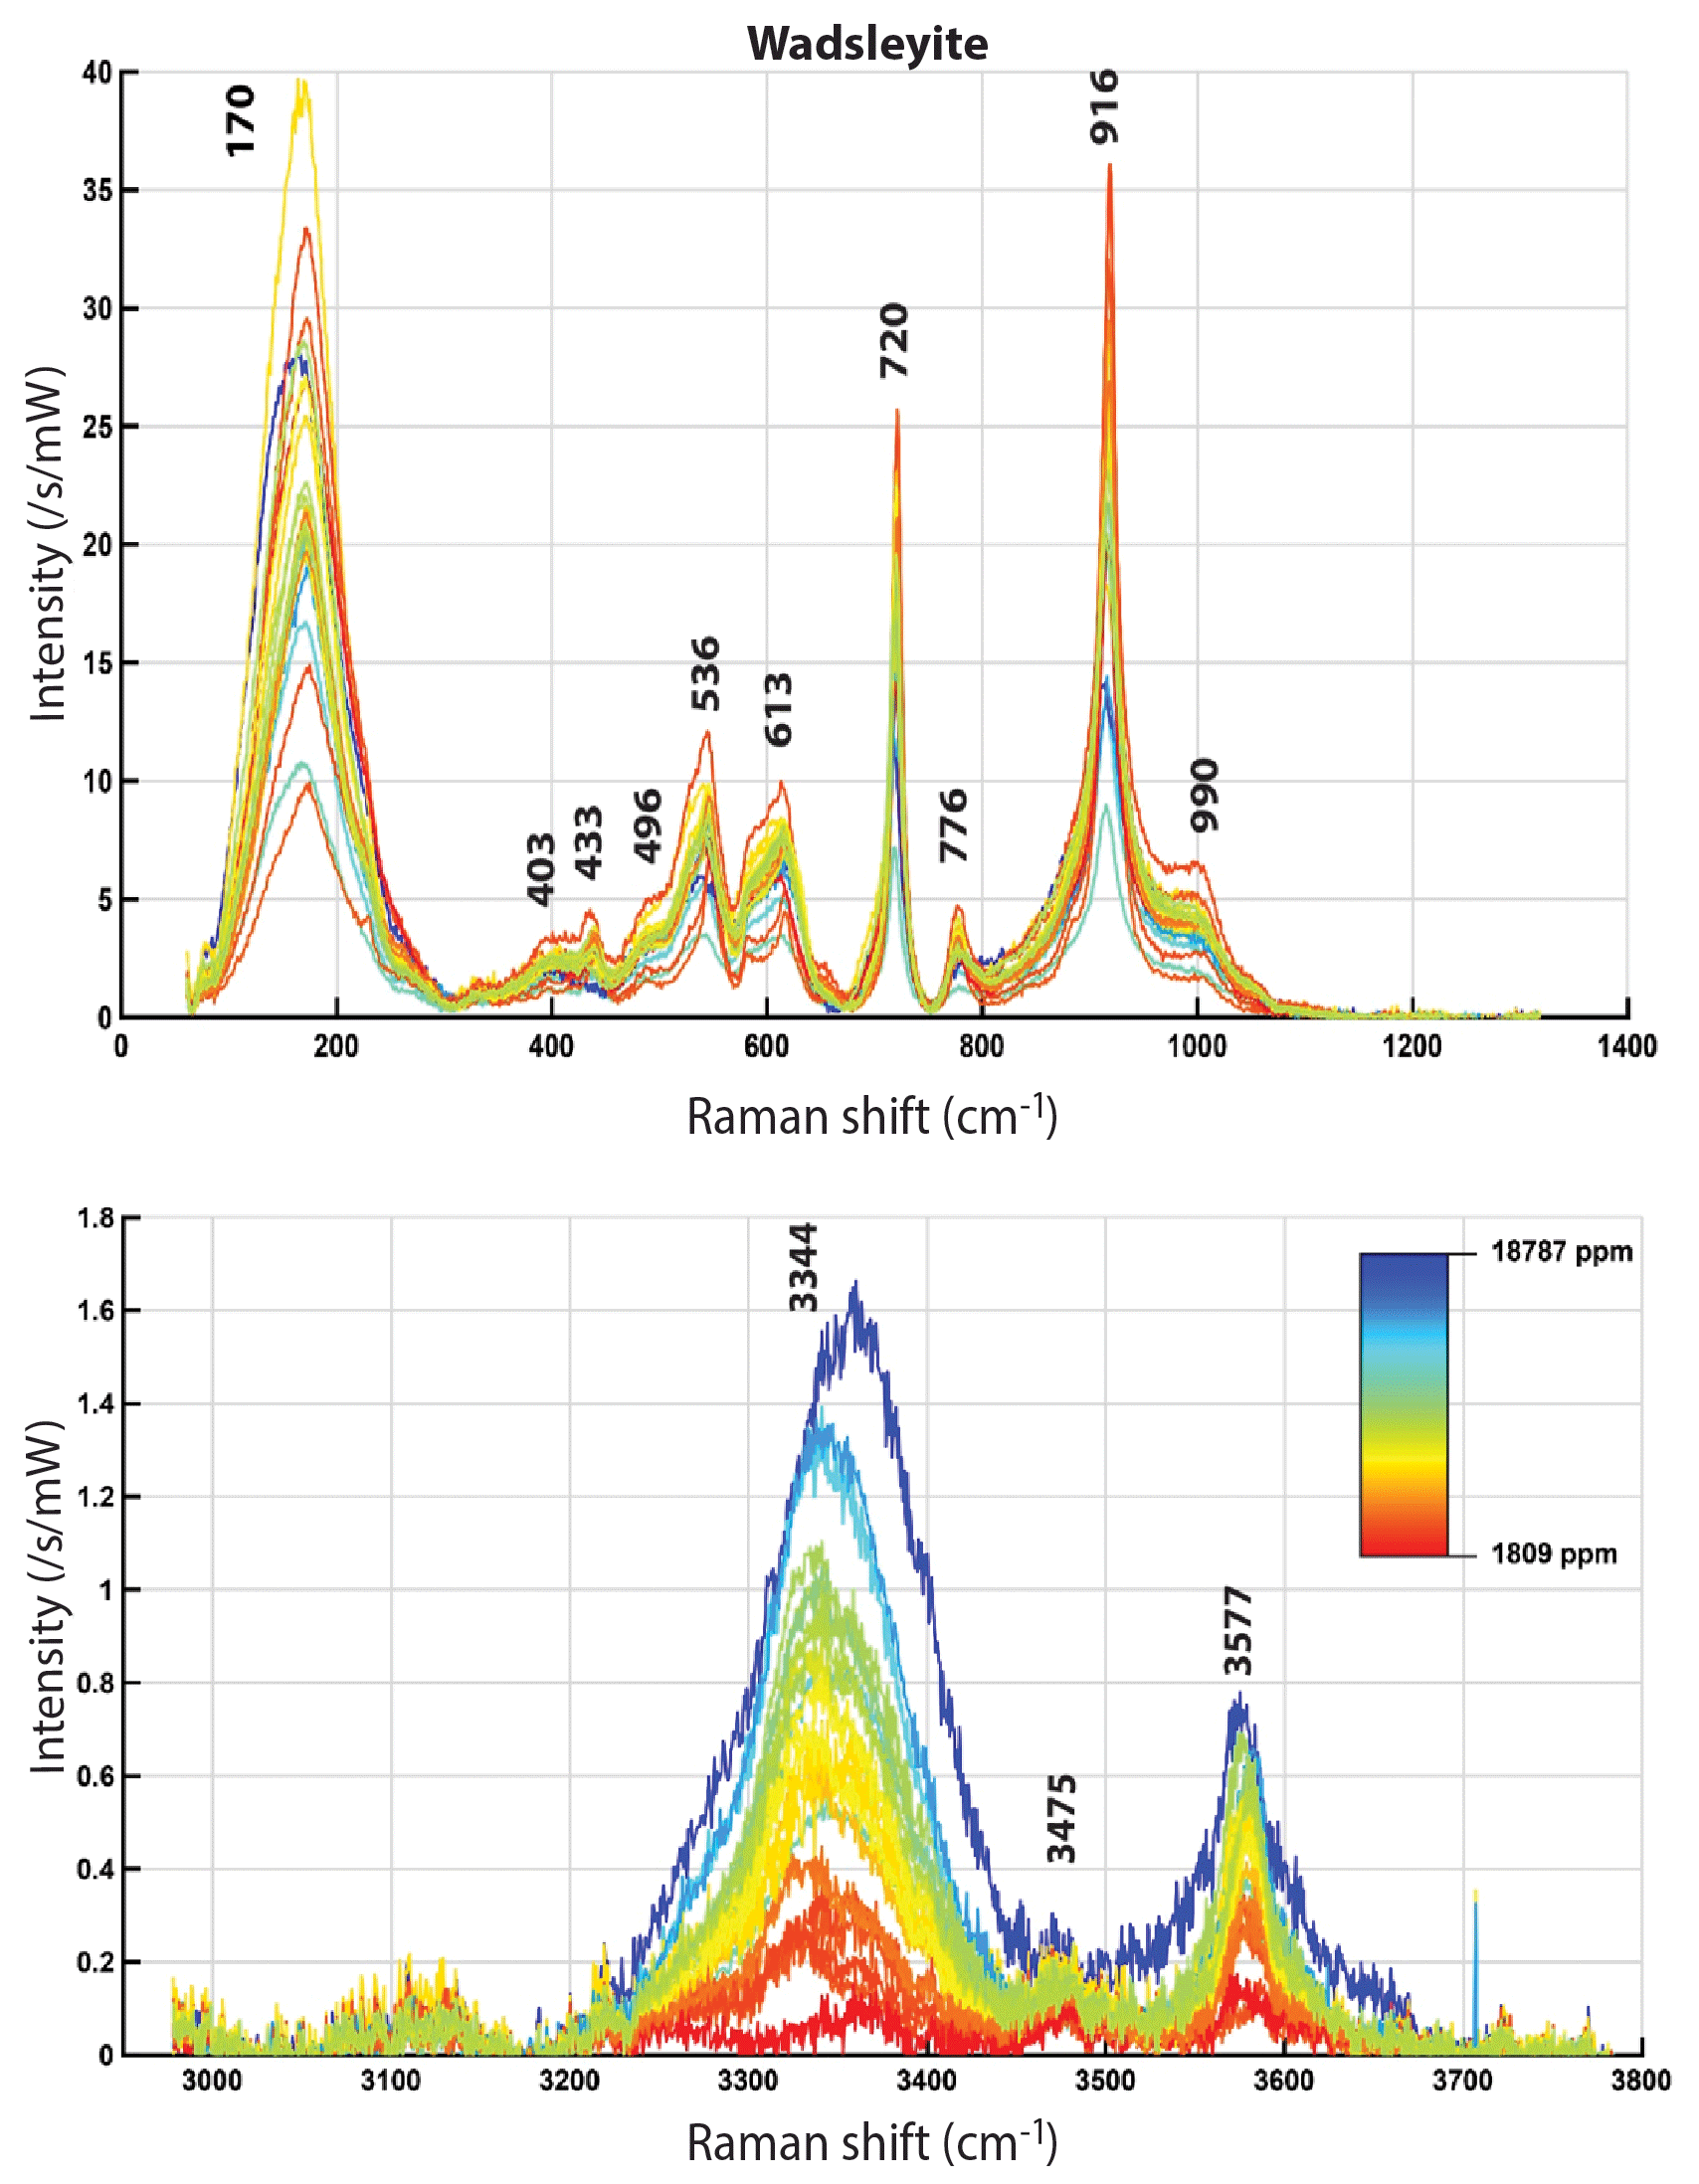
Figure 5Averaged Raman spectra of wadsleyite normalized to a laser power of 1 mW and an acquisition time of 1 s, after correction for daily variations. The color corresponds to the measured water content (varying linearly between the extreme values, according to the indicated scale). Top: silicate vibration region, bottom: OH vibration region.
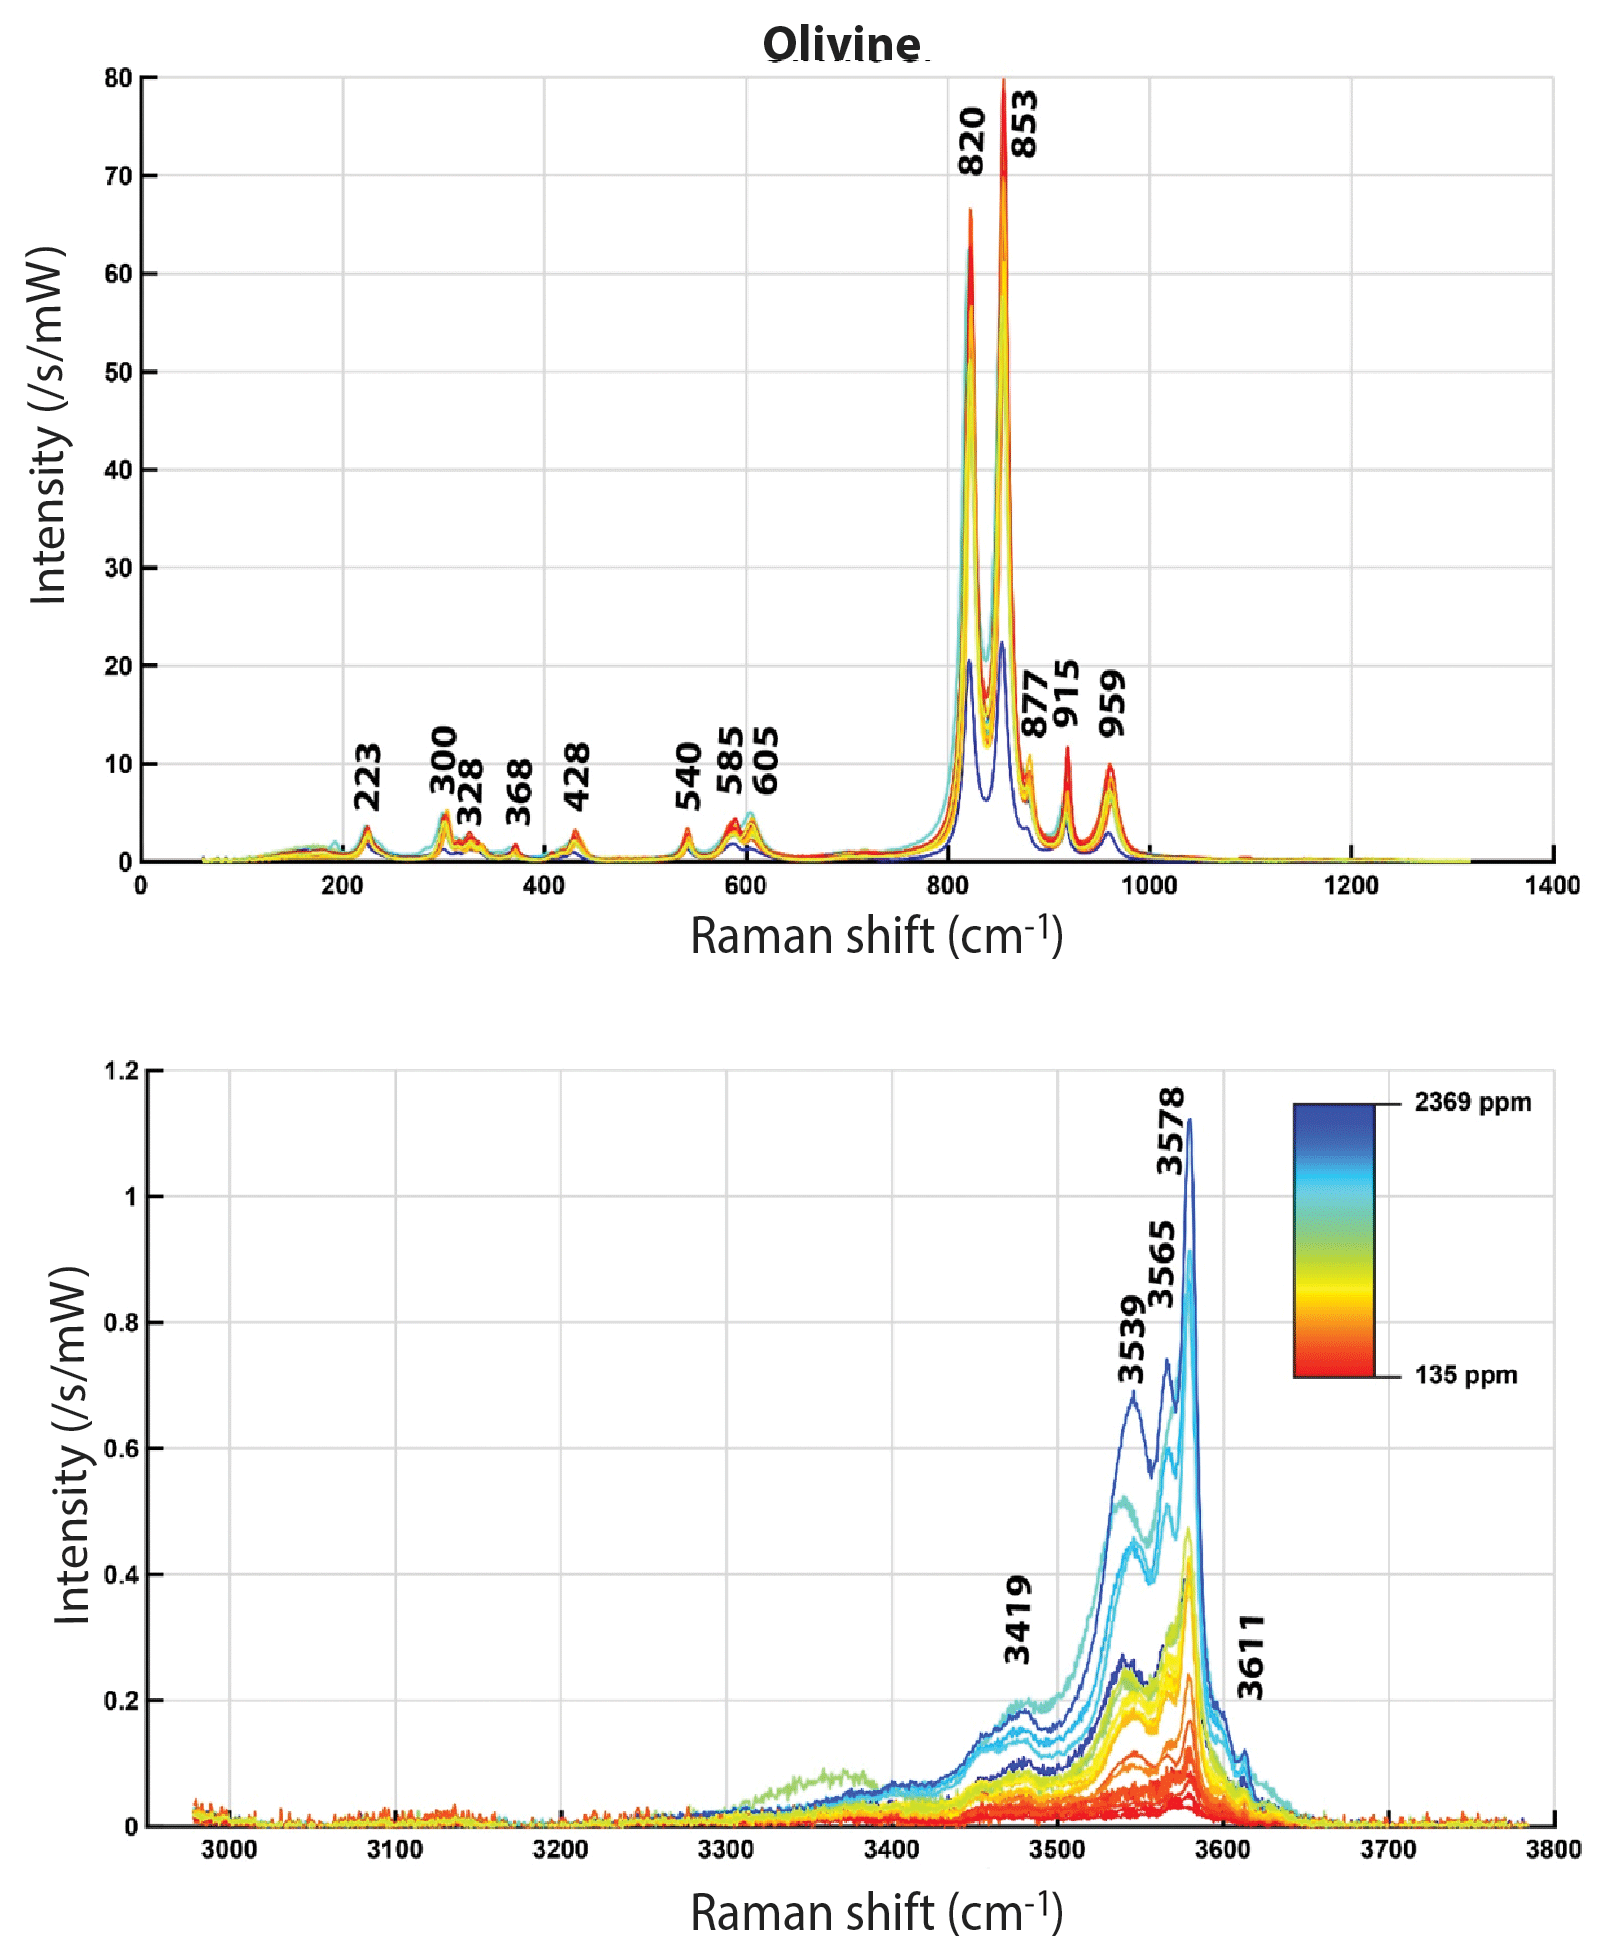
Figure 6Averaged Raman spectra of olivine normalized to a laser power of 1 mW and an acquisition time of 1 s, after correction for daily variations. The color corresponds to the measured water content (varying linearly between the extreme values, according to the indicated scale). Top: silicate vibration region, bottom: OH vibration region.
3.3.2 Effect of temperature and on water contents in carbon-free experiments
The results of the quantification of water in wadsleyite and olivine in the C-free and C-bearing experiments (summarized in Table 1) are presented in Figs. 7 and 8, respectively. By limiting the observation of water concentration trends to , we observed a positive correlation at 1200 ∘C for wadsleyite with the increase in water content with increasing . However at 1400 ∘C, the water storage in wadsleyite decreases with increasing , defining a weak negative correlation. Similar to wadsleyite, the water storage of olivine at 1200 ∘C increases as a function of . At 1400 ∘C the water storage in olivine increases between IW and NNO and then decreases between NNO and RRO. The data at 1300 ∘C show a decrease in water concentration between IW and NNO and then an increase between NNO and RRO for both olivine and wadsleyite.
3.3.3 Effect of carbon on water storage
The change in the water storage of wadsleyite and olivine with in the carbon-bearing system shows the same negative dependency as in the carbon-free system, except that the absolute values of water storage are much lower (see Fig. 8). The ratios of water concentration between carbon-free and carbon-bearing experiments (defined as CH CH+C) vary between 1 and 8 for olivine and between 1 and 4 for wadsleyite (plotted as a function of temperature and in Fig. 9). This drop in the water storage of olivine upon CO2 addition to the system is in agreement with previous studies such as that of Yang et al. (2014) that reported a factor of 2 observed at 1.5 GPa and 1100 ∘C and that of Sokol et al. (2013) that observed a factor of up to 7 and 6.3 GPa. As observed in Fig. 9, the largest difference between C-free and C-bearing fluids is observed at lower temperature, that is, near the solidus. This can be explained by the fact that in the C-free experiments the system is close to subsolidus conditions, while in the C-beating system it is already above the solidus because C stabilizes melt at lower temperature compared to the C-free system. The melt acts to dilute the activity of water causing a drop in water solubility in olivine and wadsleyite compared to the sub-solidus C-free system.
Under each buffer condition, the general tendency for water storage in both fluid systems (H2O and H2O+CO2) is an increase between 1200 and 1300 ∘C and then a decrease between 1300 and 1400 ∘C (except at NNO where the storage decreases between 1200 and 1400 ∘C).
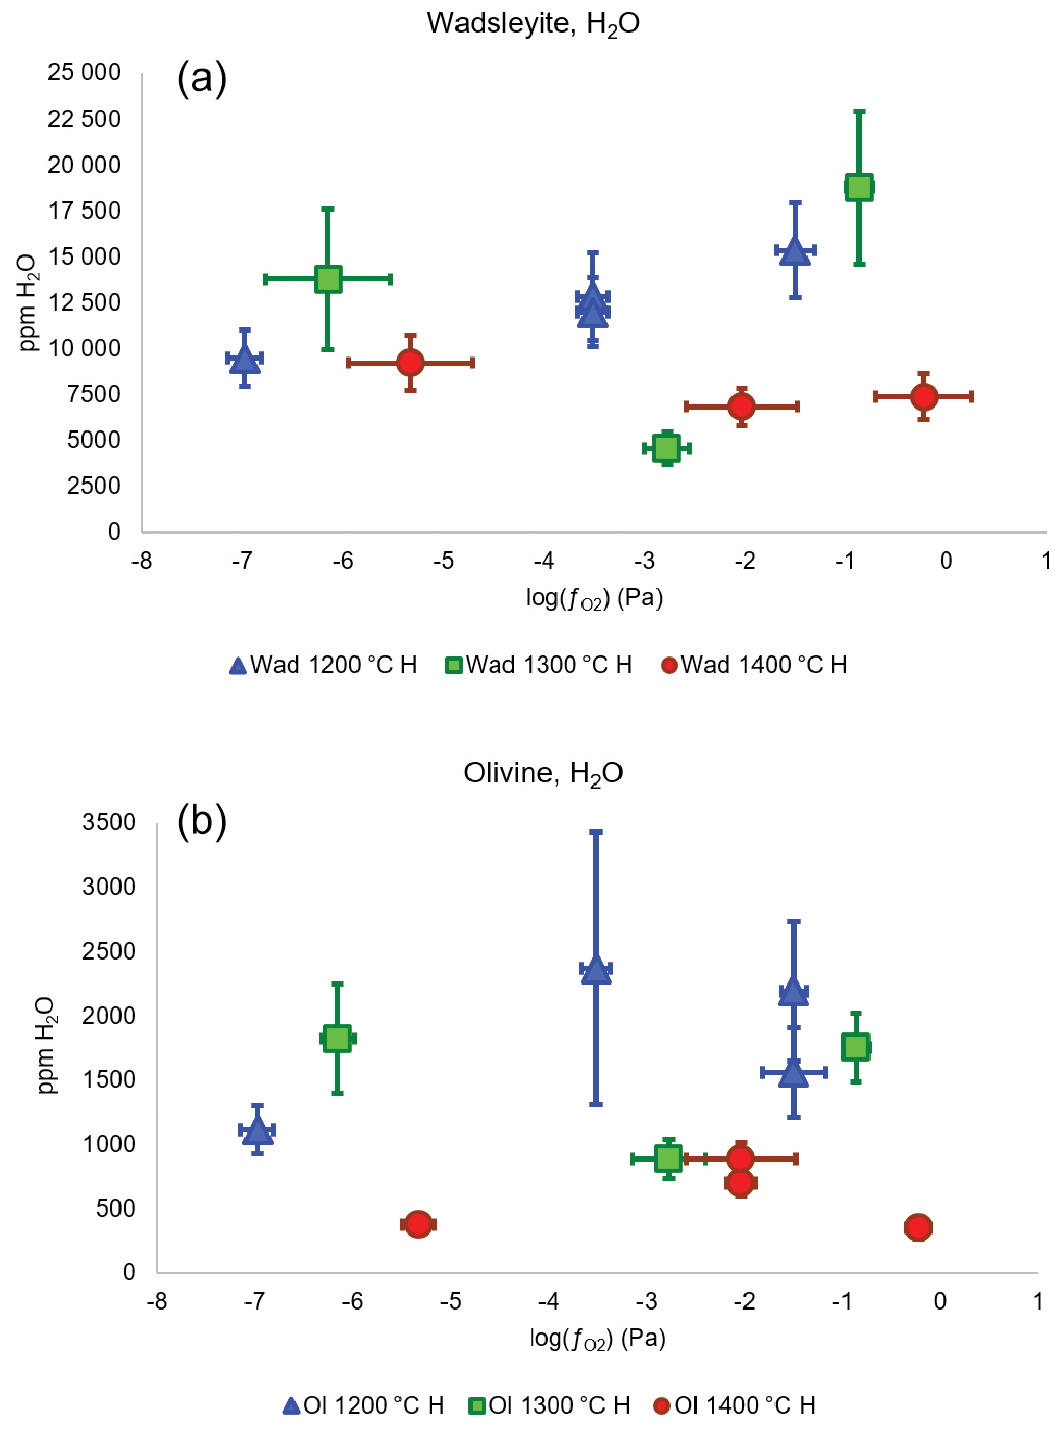
Figure 7Water concentration (in ppm wt) in wadsleyite (a) and olivine (b) as a function of fO2 and temperature in the system without carbon. The three lowest values correspond to the Fe-FeO buffer, the three intermediate values correspond to the Ni-NiO buffer, and the three highest values are those of the Re-ReO2 buffer.
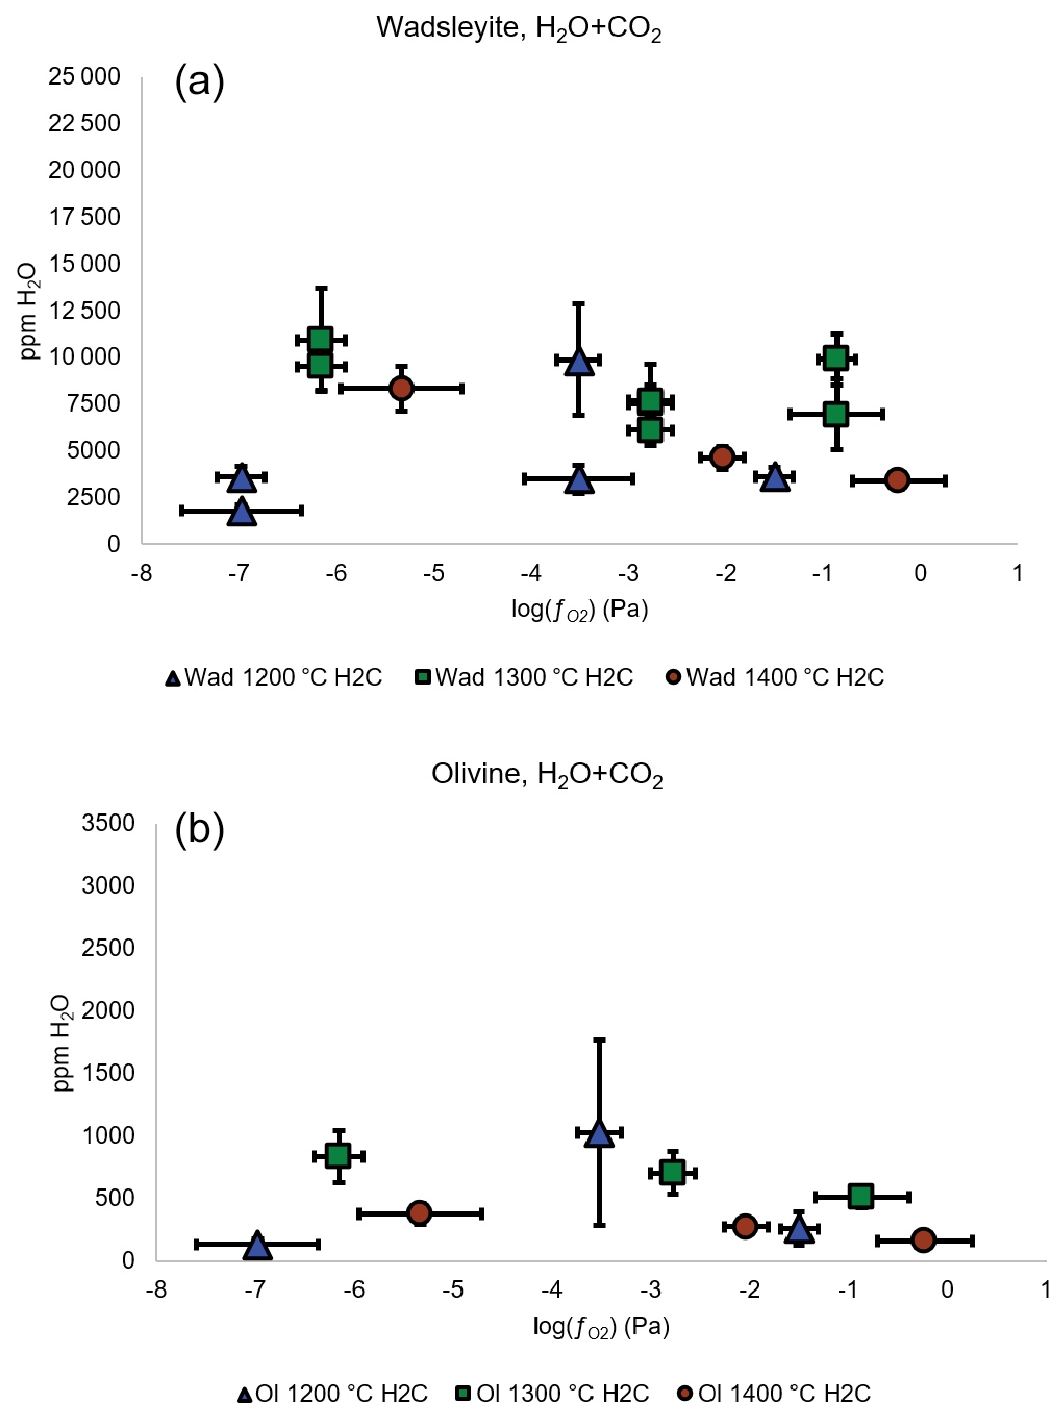
Figure 8Water concentration (in ppm wt) in wadsleyite (a) and olivine (b) as a function of fO2 and temperature in the system with carbon. The three lowest values correspond to the Fe-FeO buffer, the three intermediate values correspond to the Ni-NiO buffer, and the three highest values are those of the Re-ReO2 buffer.
3.3.4 Comparison between water contents measured by Raman spectroscopy and by NanoSIMS
Water contents measured with NanoSIMS on some of the samples are shown in Table 4. There is a good agreement between water contents determined with NanoSIMS and with Raman spectroscopy for both olivine and wadsleyite phases (see Fig. 10). On average, the water storage measured by Raman spectroscopy is 20 % lower than that measured by NanoSIMS for olivine, while it is 20 % higher for wadsleyite. The Raman analyses display large error bars due to the anisotropy of absorption (between 18 % and 26 % on average for wadsleyite and olivine, respectively). In comparison the NanoSIMS analyses suffer less uncertainty (between 1 % and 10 % on average for wadsleyite and olivine, respectively). The tendencies of water storage observed by Raman spectroscopy as a function of temperature or are confirmed by the NanoSIMS analyses (see Appendices A4 and A5).
Table 4NanoSIMS results. n is the number of points of measurement, and SE is the standard error.
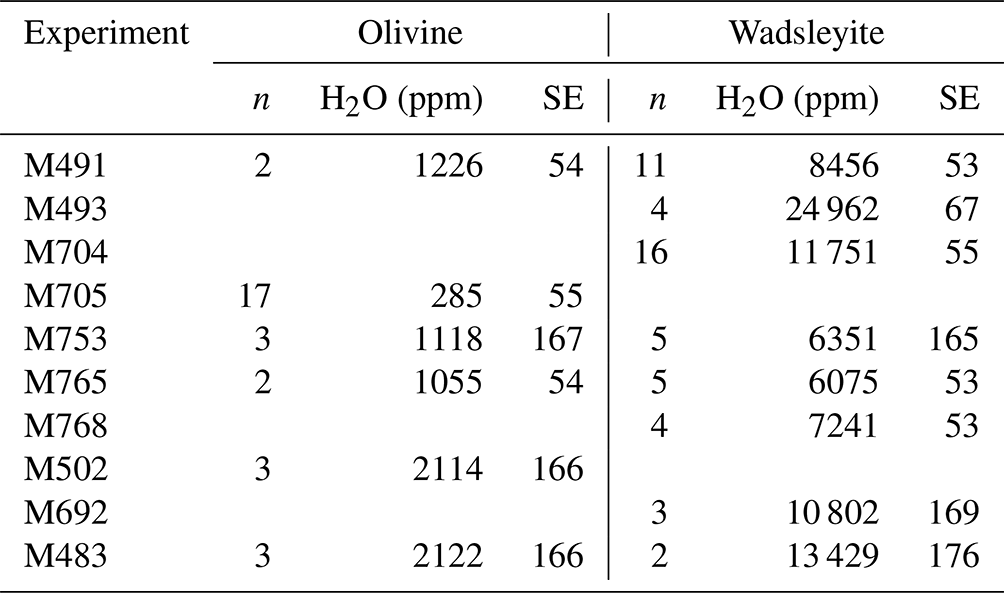
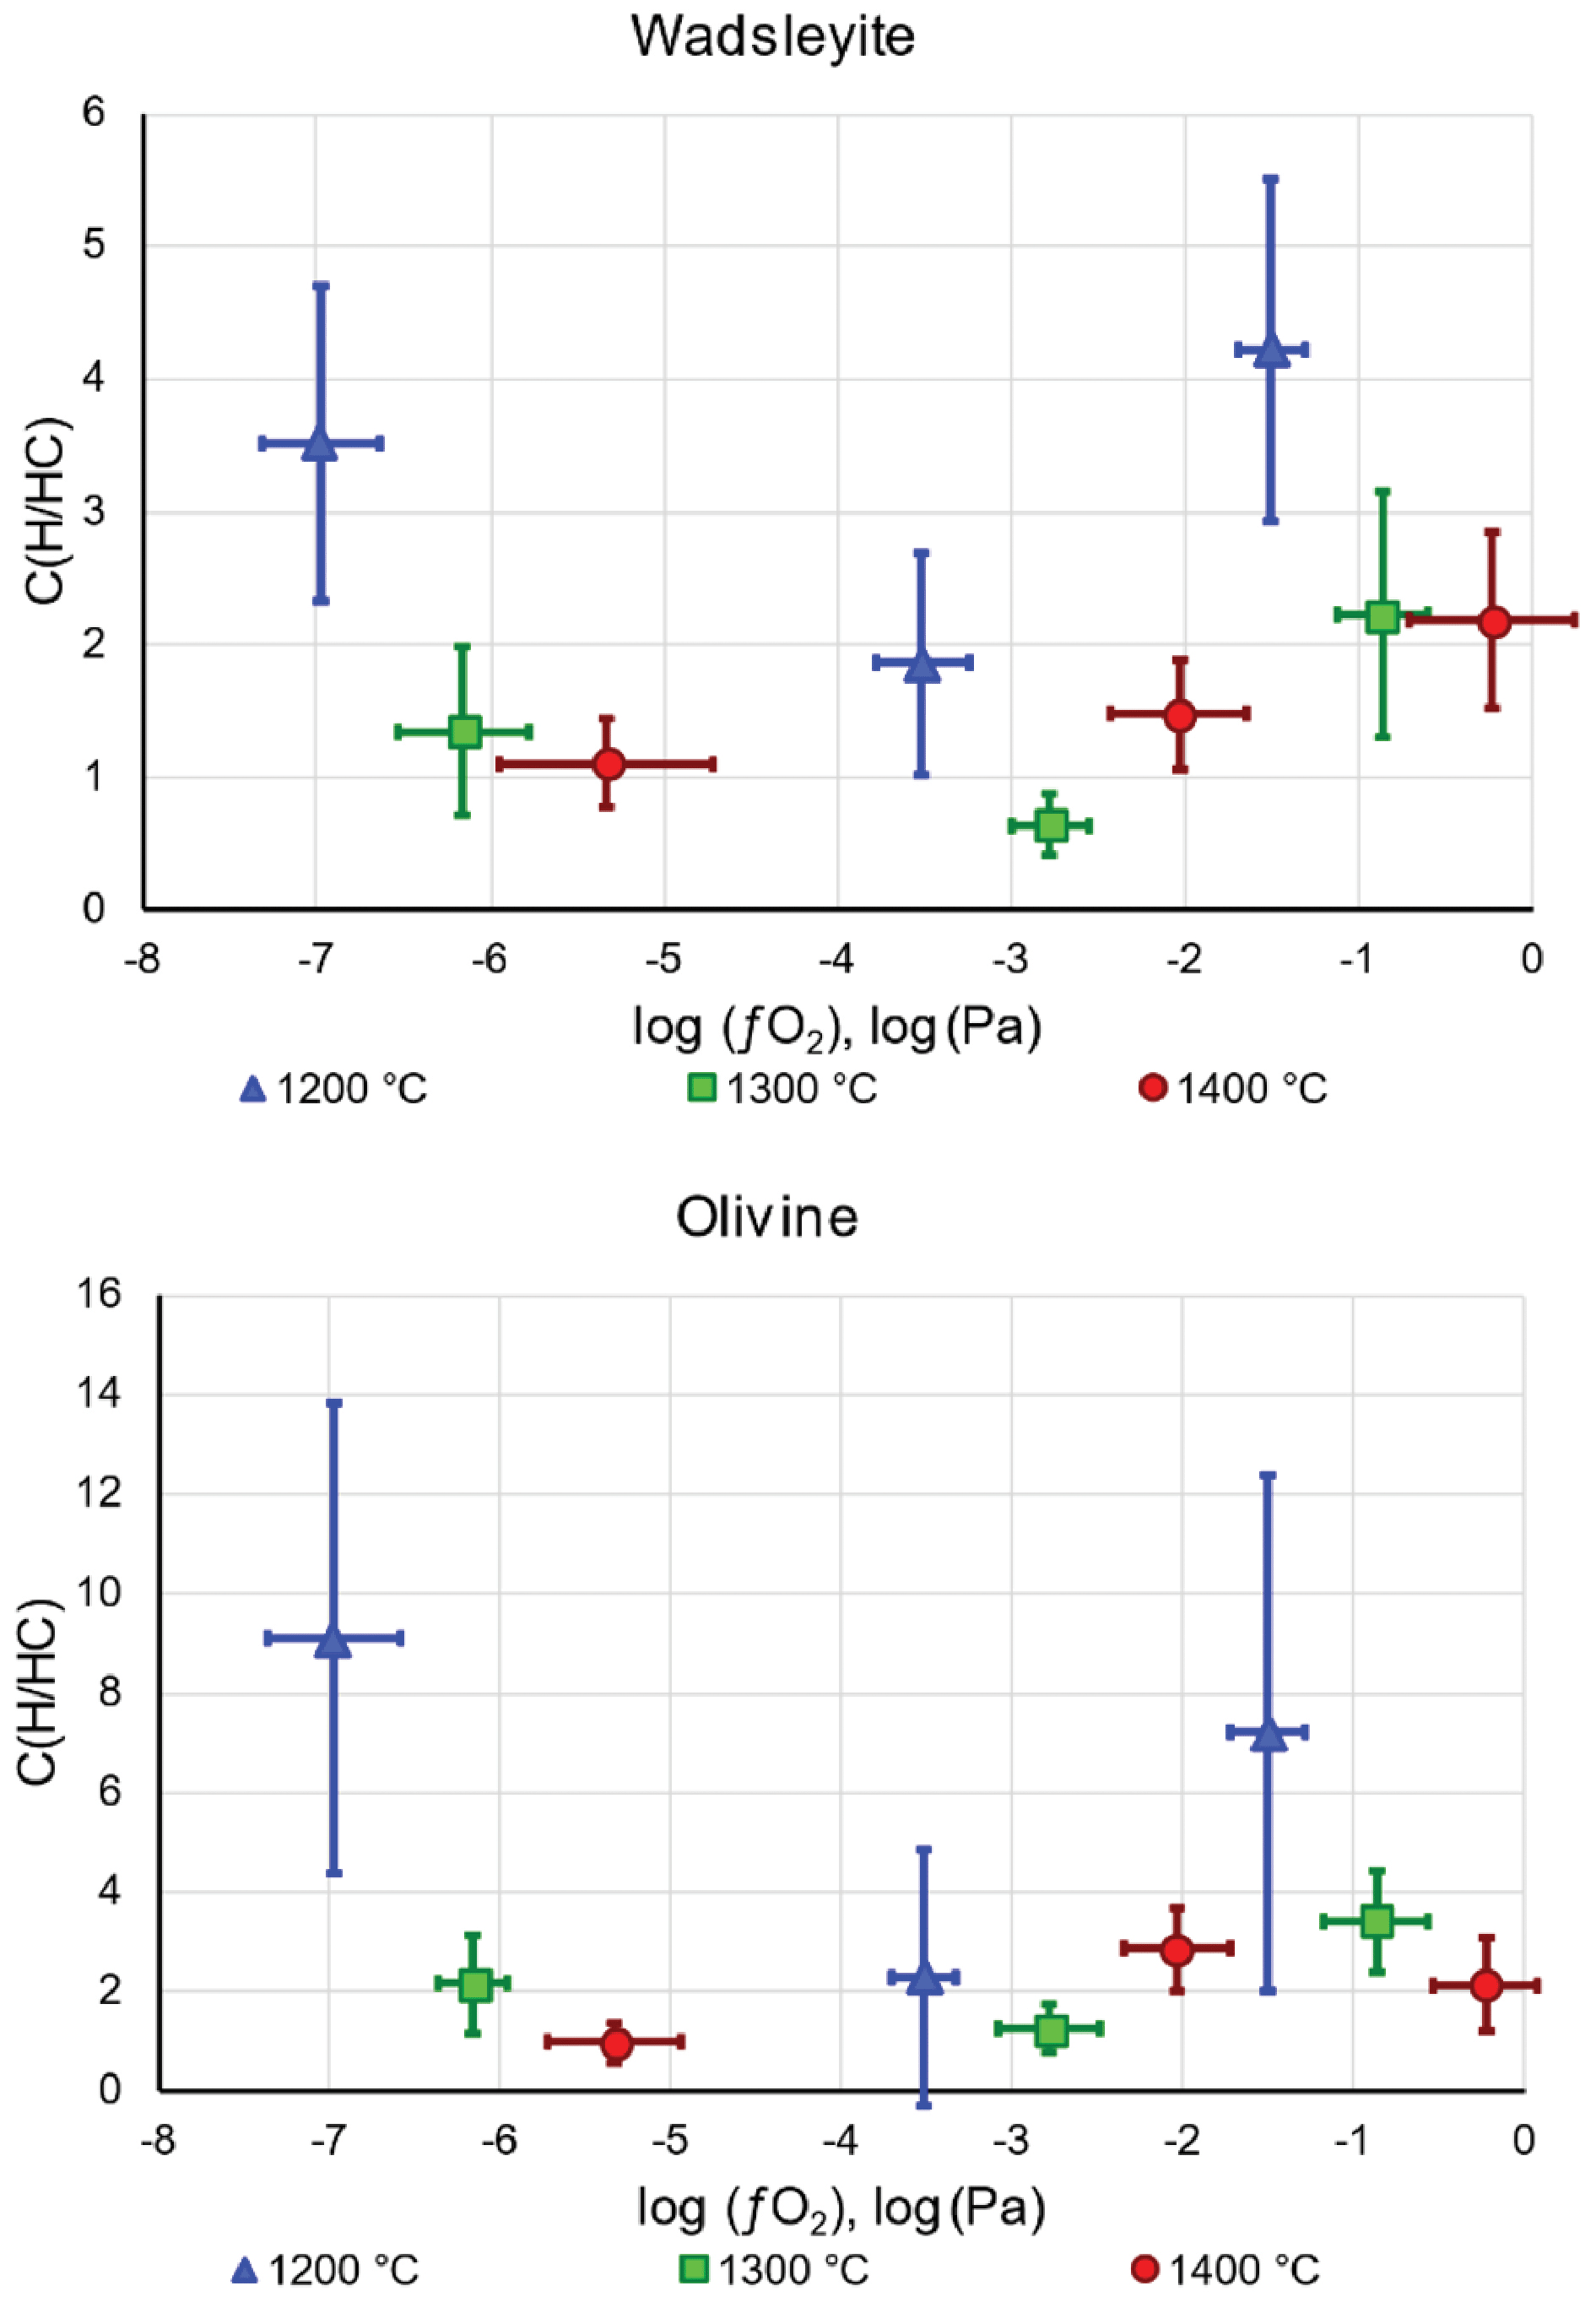
Figure 9CH CH+C ratio from averages of measured concentrations at each temperature and fO2 condition for wadsleyite and olivine.
3.3.5 Water partitioning between wadsleyite and olivine
Among the experiments performed without carbon, three contain both olivine and wadsleyite that could be characterized for their water contents, offering the possibility of directly measuring a partition coefficient of water between these two phases (see Table 1). The values measured using Raman spectroscopy range between 5 and 8 (mean 7.2 ± 1.2), with no visible effect of temperature or . The values measured using NanoSIMS vary between 5 and 6 (only four direct measurements, mean 5.9 ± 0.5) and also do not show much change with temperature, , or C content. The partition coefficient of water between wadsleyite and olivine measured here with NanoSIMS agrees better with those of the literature that report also directly measured partition coefficients (between 4 and 5 at 1200–1300 ∘C; Chen et al., 2002; Deon et al., 2011; Férot et Bolfan-Casanova, 2012).
4.1 On the effect of oxygen fugacity on the speciation of the fluid at high pressures
Figures 7 and 8 show the dependence of water storage capacity in both wadsleyite and olivine on oxygen fugacity, which is particularly clear at 1200 ∘C. Indeed, with increasing , the amount of H2O in the fluid should increase following the reaction H2 + O2= H2O,
The increase in water storage capacity in both wadsleyite and olivine with increasing at 1200 ∘C is a direct effect of the change in H speciation, or H2O H2 ratio, in the fluid. Such an increase signifies that under the explored conditions, the fluid must be relatively pure, because if there were significant dissolution of silicate, the water solubility should decrease with increasing . At 1400 ∘C, the water solubility in both wadsleyite and olivine decreases slightly with increasing , due to a dilution of the H2O component by melting, as already observed before (Bali et al., 2008; Withers and Hirschmann, 2008). Also, we find here lower values of water storage in wadsleyite than measured by Druzhbin et al. (2021) in the Mg2SiO4-H2O system at 1400 ∘C (around 1.0 wt %–1.2 wt % H2O), probably because, since we are in a peridotitic system, the fact of having more incompatible elements drives the solidus to lower temperatures and leads to more dilution of H2O compared to the previous study.
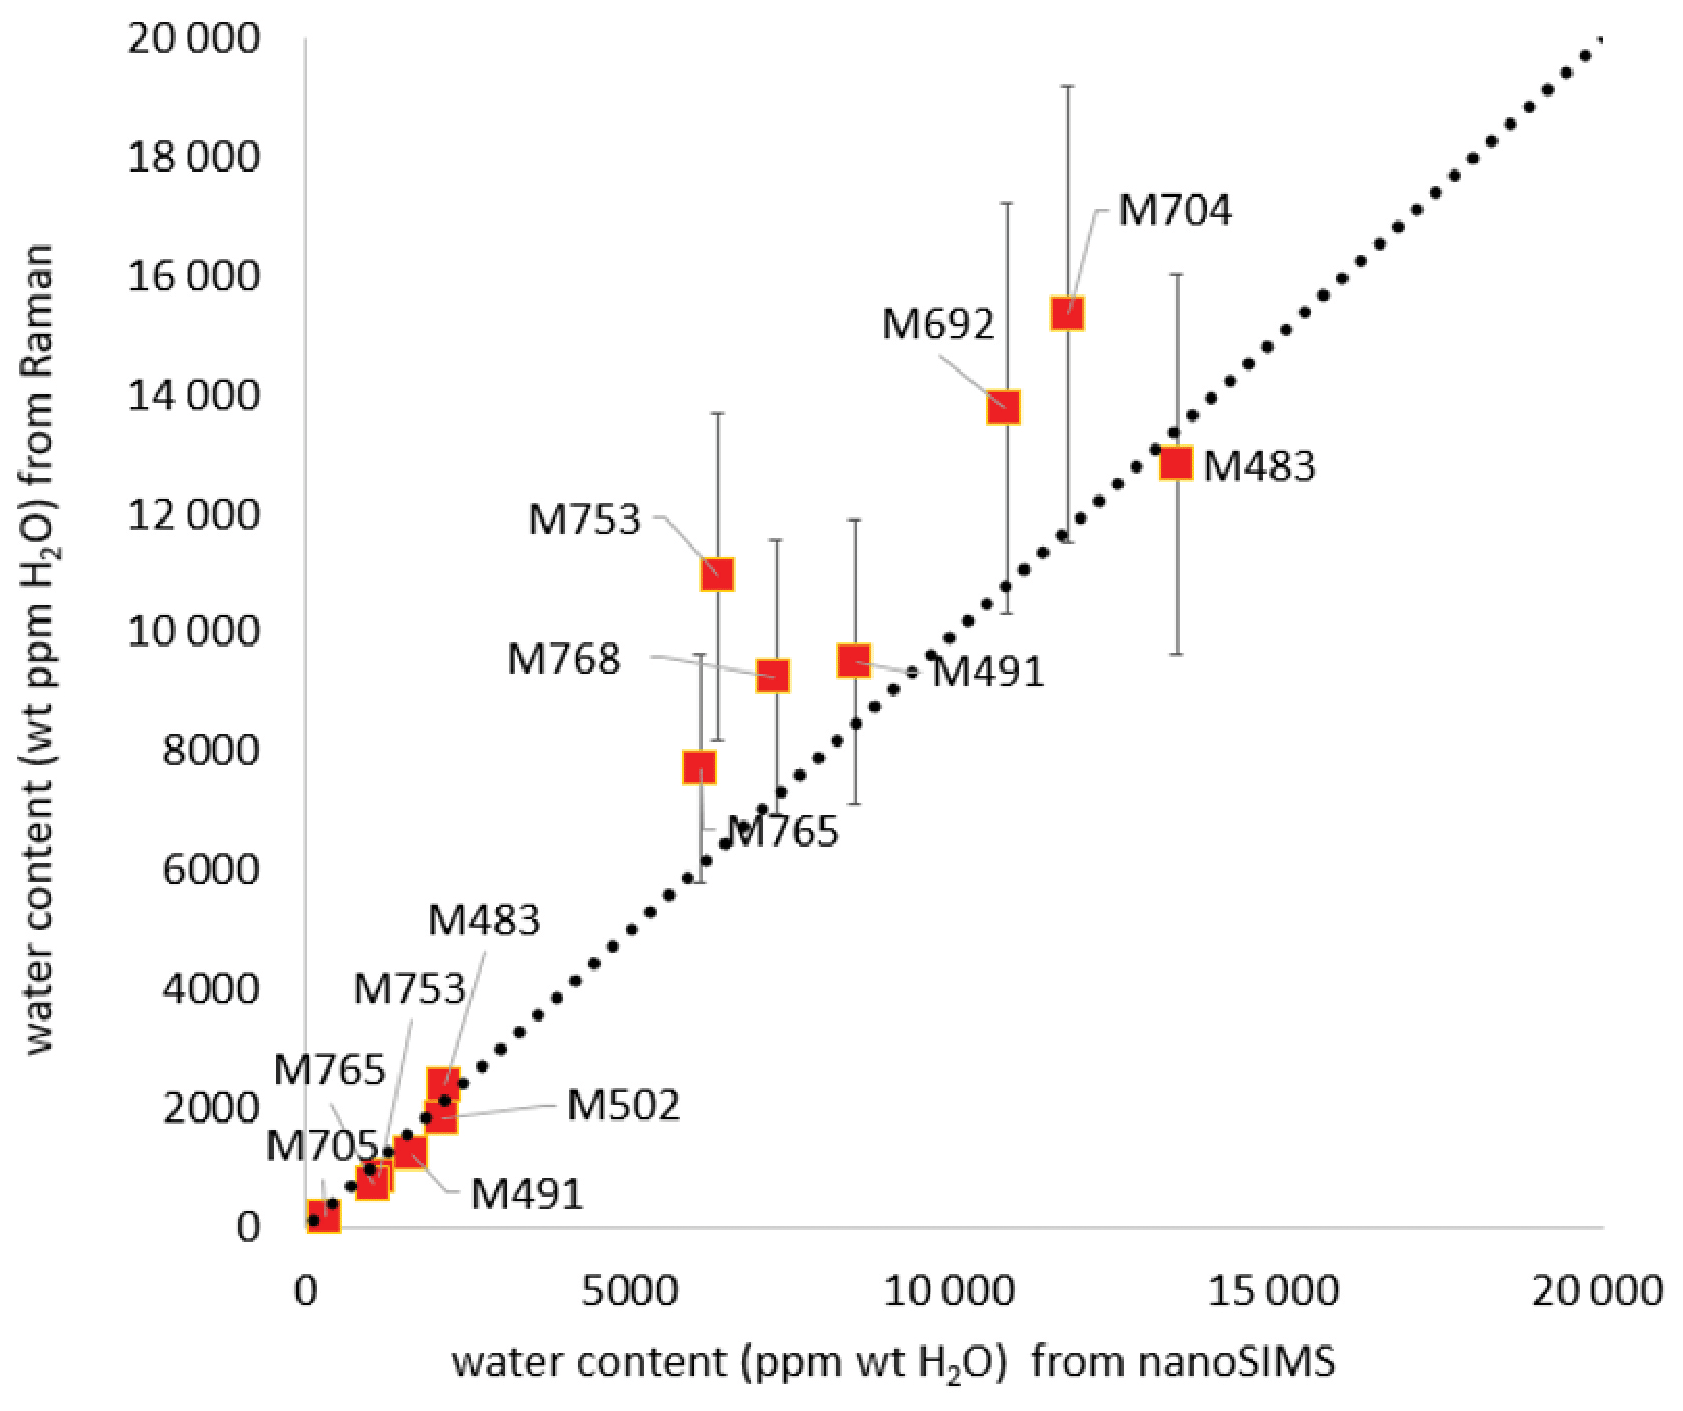
Figure 10Comparison between Raman and NanoSIMS measurements of water content in wadsleyite and olivine.
4.2 Solidus temperature of hydrous peridotite as a function of and carbon
In the H–O-bearing system, we observe that the samples synthesized at 1200 ∘C are melt-free, except in the wadsleyite stability field at RRO (see Fig. 2). At 1300 ∘C, melt is observed at all conditions in the olivine stability field but not in the wadsleyite stability field at IW. At 1400 ∘C, melting is observed at all conditions. Thus, the solidi of peridotite in the olivine and wadsleyite stability fields cross each other as a function of oxygen fugacity. In particular, at 1300 ∘C we see an effect of the solid phase assemblage on the solidus of peridotite, under reducing conditions, with the olivine-peridotite solidus being lower than that of wadsleyite peridotite.
In the C–H–O system, melt is systematically observed in experiments performed at 1300 ∘C. Also, above the solidus, a loss of diopside is generally observed. Compared to previous studies we observe some differences. The present solidus of C–H–O-bearing peridotite is lower than for previously reported carbonated peridotite, located between 1400 and 1500 ∘C in the study of Ghosh et al. (2009) and between 1400 and 1600 ∘C in that of Litasov et al. (2014). We ascribe this difference to the water content in our study compared to previous studies that contained little (0.2 wt %) or no water (Ghosh et al., 2009), or less water (2 wt % H2O) (Litasov et al., 2014), which translates into their bulk composition being below the maximum water storage capacity of wadsleyite. Also, compared to the melts produced previously in the carbonated peridotite system, our melts produced in the C–H–O system have similar FeO, Al2O3, CaO, and TiO2 (see Ghosh et al., 2009); however, they are richer in SiO2, since previous melts synthesized in the CO2-bearing peridotite at 10 to 20 GPa contained from 1 wt % to 6 wt % SiO2 (Ghosh et al., 2009). Such a difference in silica content can be attributed, again, to the difference in water contents between the two studies (0.2 wt % H2O compared to the 3.5 wt % H2O in the starting material of the current study). That is, in the experiments of Ghosh et al. (2009) the melts are carbonatites while in our study they are kimberlites, as controlled by the H2O CO2 ratio of the initial fluid.
4.3 Implications for melting atop the transition zone
As shown in this study, under the reducing conditions of the deep upper mantle, melting in hydrous peridotite occurs more readily in the olivine stability field than in the wadsleyite stability field, in relation with their different water storage capacities. This difference is the basis for the dehydration melting mechanism (Andrault and Bolfan-Casanova, 2022; Bercovi and Karato, 2003), which has long been invoked to interpret the low-velocity layer atop the transition zone (Revenaugh and Sipkin, 1994; Tauzin et al., 2010). If the 2 %–5 % reduction in shear wave velocity is ascribed to 0.5 wt %–1 wt % partial melting of an upwelling peridotitic mantle from a hydrous transition zone (Xiao et al., 2020), then the drop in seismic velocity can be correlated with 0.2 wt % H2O in the mantle transition zone (Freitas et al., 2017) in agreement with electrical conductivity measurements (Huang et al., 2005).
Still, carbon is another important volatile that has been shown to be present at transition zone depths, at least in the form of diamond (Pearson et al., 2005). Carbon does not enter in silicate mineral structures (maximum solubility of 12 ppm in olivine at 11 GPa; Shcheka et al., 2006); it is rather stored in carbonates, or diamond, or methane. Thus, silicate decarbonation, in particular related to the mineralogical transformation of wadsleyite into olivine, cannot be invoked to cause melting atop the 410 km discontinuity, and since diamond and carbonates are stable at temperatures of the mantle geotherm in the transition zone, water seems to be the necessary ingredient to decrease the melting temperature of the deep upper mantle. Indeed, as seen above, most studies show that solidi for carbonated peridotite are around the mantle adiabat or higher, but we observe here that in the presence of water the solidus of mantle peridotite can be largely depressed between 1200 and 1300 ∘C.
Also, in terms of density, hydrous-bearing melts can be expected to be denser than purely carbonatitic melts for several reasons. First, since purely carbonatitic melts contain very little silica, their mean atomic mass is much lower than that of hydrous melts. Secondly, the compressibility of water is greater than that of CO2 as shown by Sakamaki et al. (2011), and thus for equivalent molar concentration CO2-bearing melts will be less dense than H2O-bearing melts. Finally, the lower DFe between olivine and liquid compared to that between wadsleyite and liquid confirms that melts generated above the 410 km discontinuity have more chances to be denser than the surrounding mantle. While a strictly carbonatitic liquid (water-free) has lower SiO2 content than a hydrous silicate melt, a kimberlitic-type melt with both water and carbonate dissolved in it contains intermediate levels of silica and still substantial amounts of FeO to induce high densities in order to explain the low-velocity layer around 350 km depth.
Since we show in this study that wadsleyite can still incorporate substantial amounts of water even under reducing conditions, this implies that dehydration melting atop the 410 km discontinuity is unaffected by the prevailing oxygen fugacity of the mantle but rather controlled by the solidus temperature of volatile-bearing peridotite.
The incorporation scheme of OH in wadsleyite and olivine is independent of and temperature as shown by the unchanged bands in the Raman spectra. Thus, changes in the water storage in wadsleyite and olivine as a function of f principally arise from a change in water fugacity in the fluid. The data show that the incorporation of water (as OH) in wadsleyite and olivine increases with increasing oxygen fugacity at 1200 ∘C but decreases with increasing oxygen fugacity at 1400 ∘C. The reason for the increase in water incorporation with oxygen fugacity at 1200 ∘C is the increase in the H2O H2 ratio in the fluid and is confirmed by NanoSIMS measurements. Our interpretation of the H speciation in the fluid based on water storage capacity is confirmed by the observation of the solidus temperature which is observed to decrease with increasing oxygen fugacity, as already observed at lower pressures (Sokol et al., 2010). The reason for the decrease in water incorporation with oxygen fugacity at high temperature is the melting of the silicates that induces a dilution of the water fugacity as already demonstrated before. The reduced component of the fluid, H2, is expected to be less soluble in silicate melts than the oxidized components, H2O and OH, and as such does not favor a depression of the solidus that would lead to dilution of the H2O component.
The water storage capacity at conditions of the 410 km discontinuity remains important even at low since wadsleyite can still store 0.8 wt %–1 wt % H2O. The effect of C is to decrease water storage by a factor of 2 at most at 1300–1400 ∘C. The water-saturated solidus at IW without C is located between 1300 and 1400 ∘C in the wadsleyite stability field and drops to 1200–1300 ∘C in the olivine stability field. In the presence of C, the water-saturated solidus in both the wadsleyite and olivine stability field drops and is located between 1200 and 1300 ∘C.
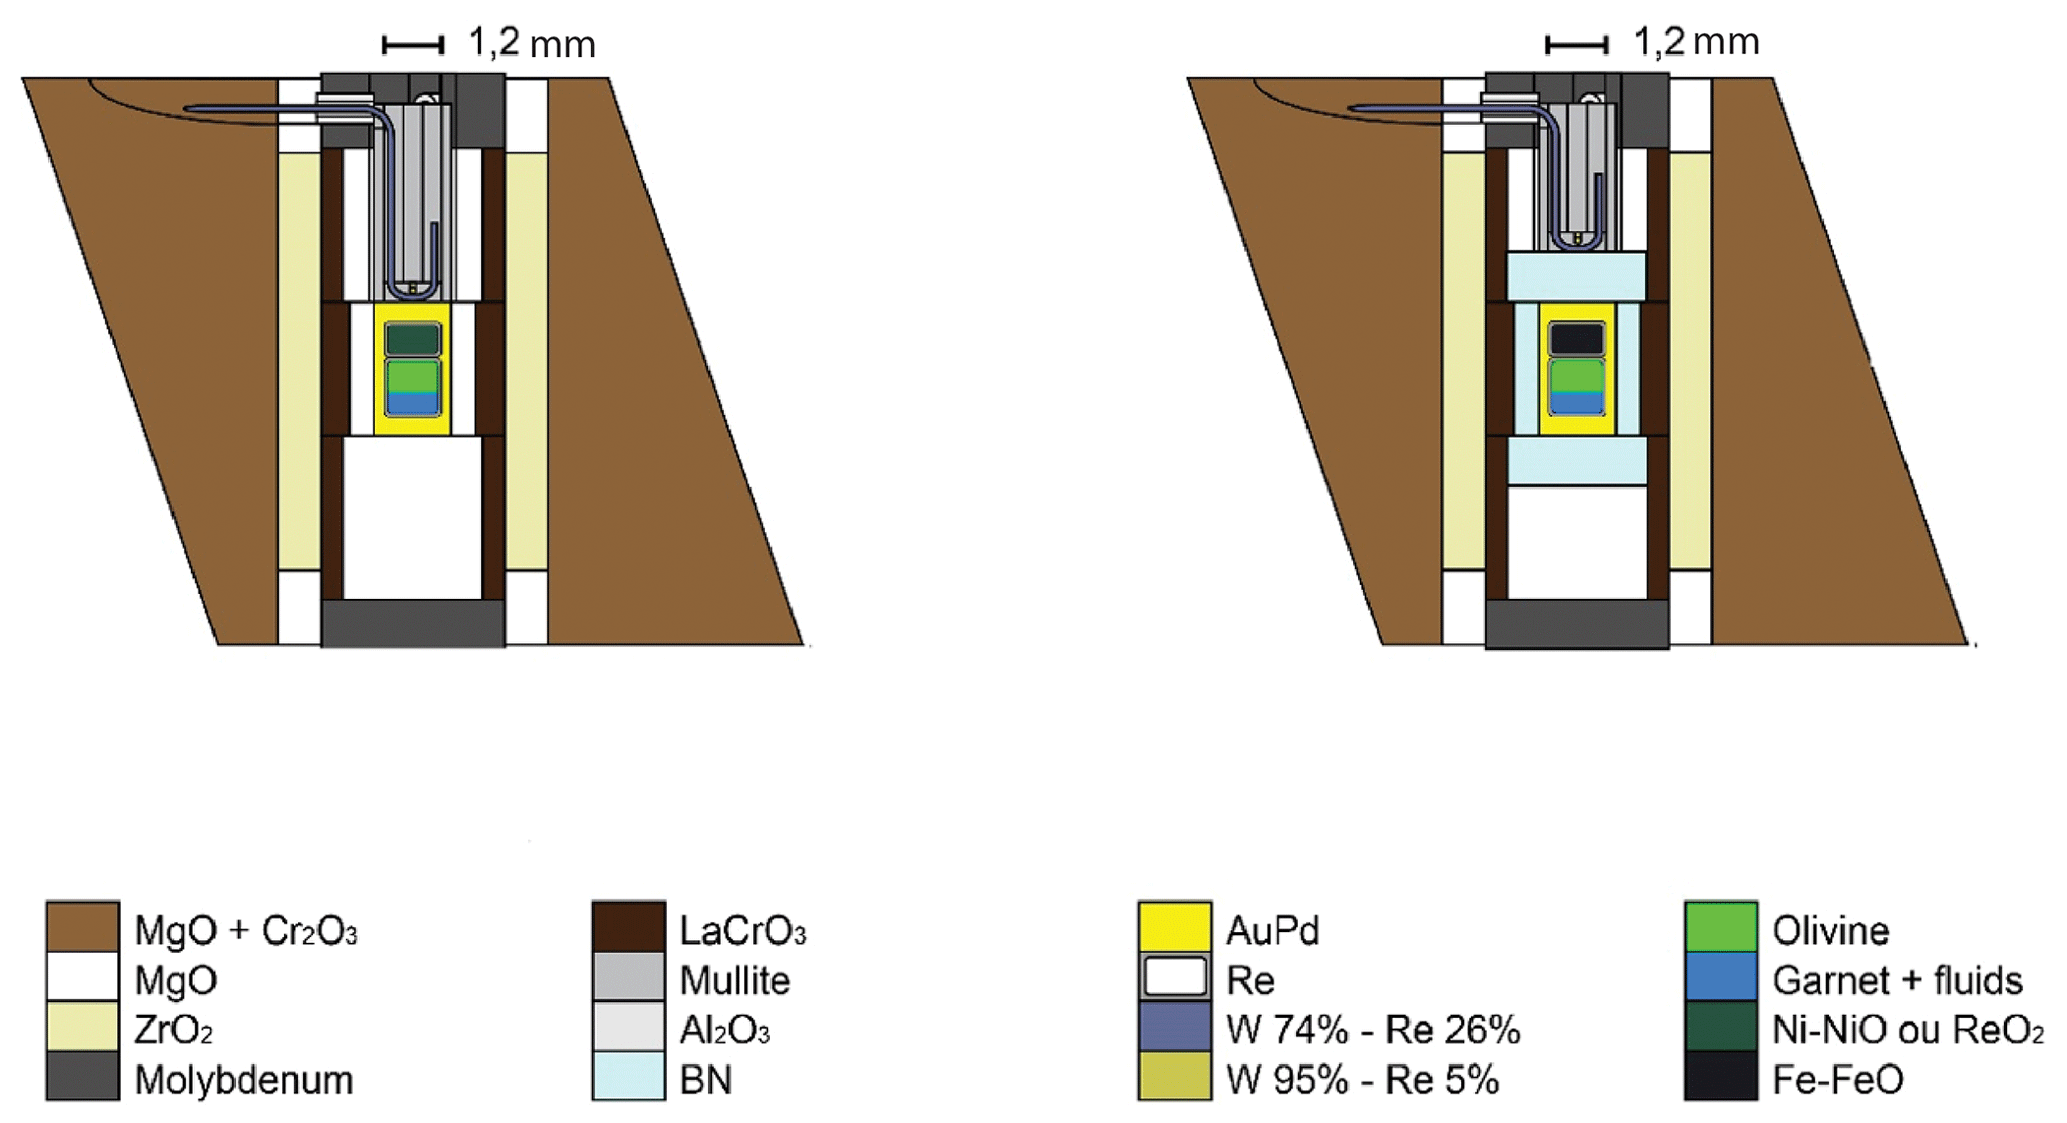
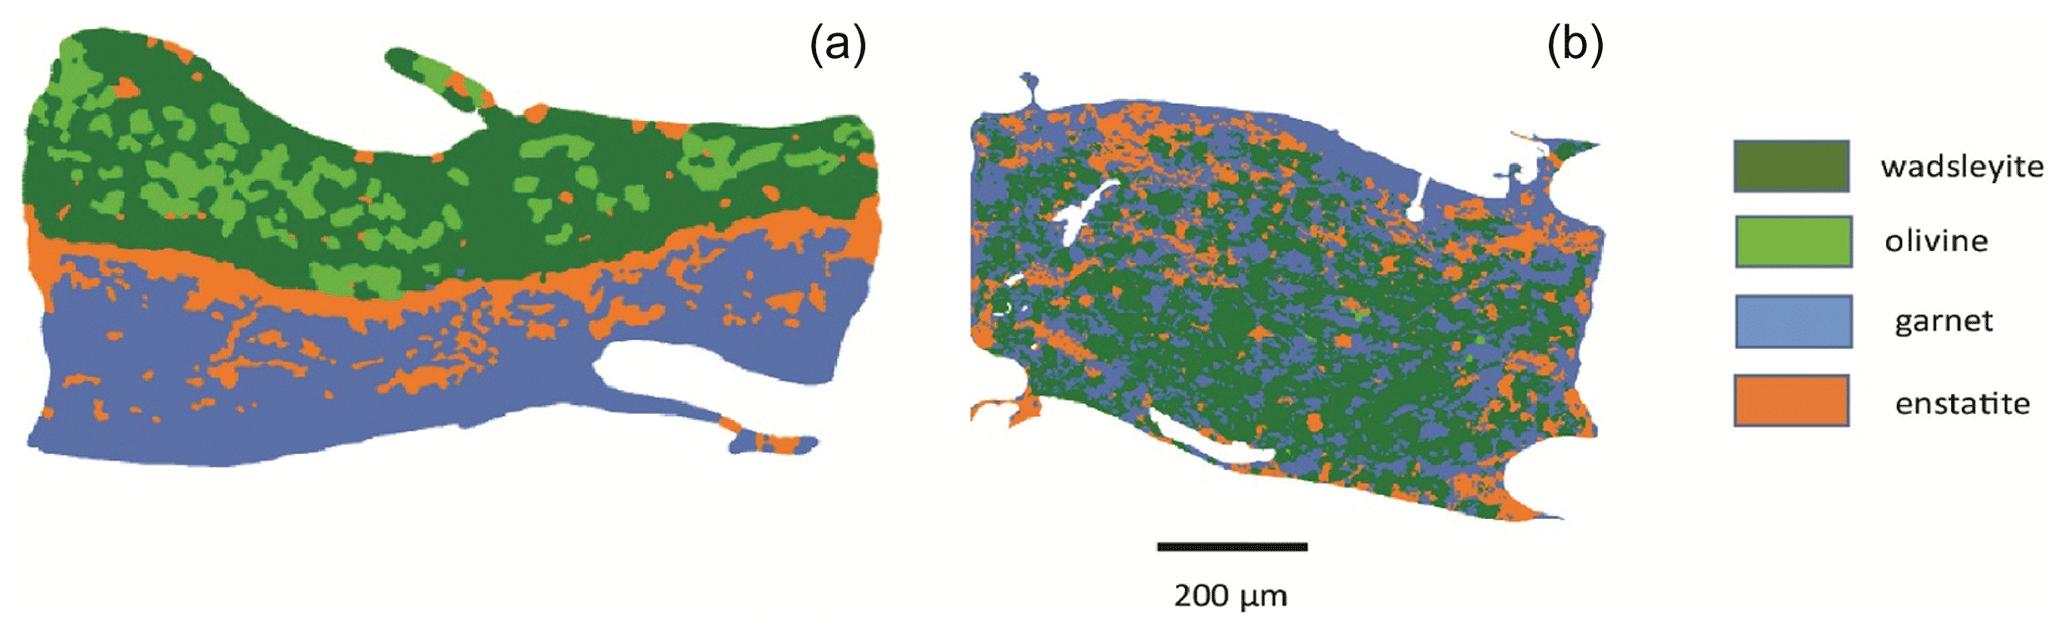
Figure A2Illustration showing how the sandwich experiment, shown in panel (a) (where olivine and majorite garnet are inserted as layers), allows for a larger grain size compared to an homogeneous mixture of both phases, shown in panel (b). In this sample the original layer of olivine has transformed into a mixture of olivine and wadsleyite. Enstatite has formed as a product of the reaction between olivine and the original majorite composition. The capsule material, here in white color, is not visible.
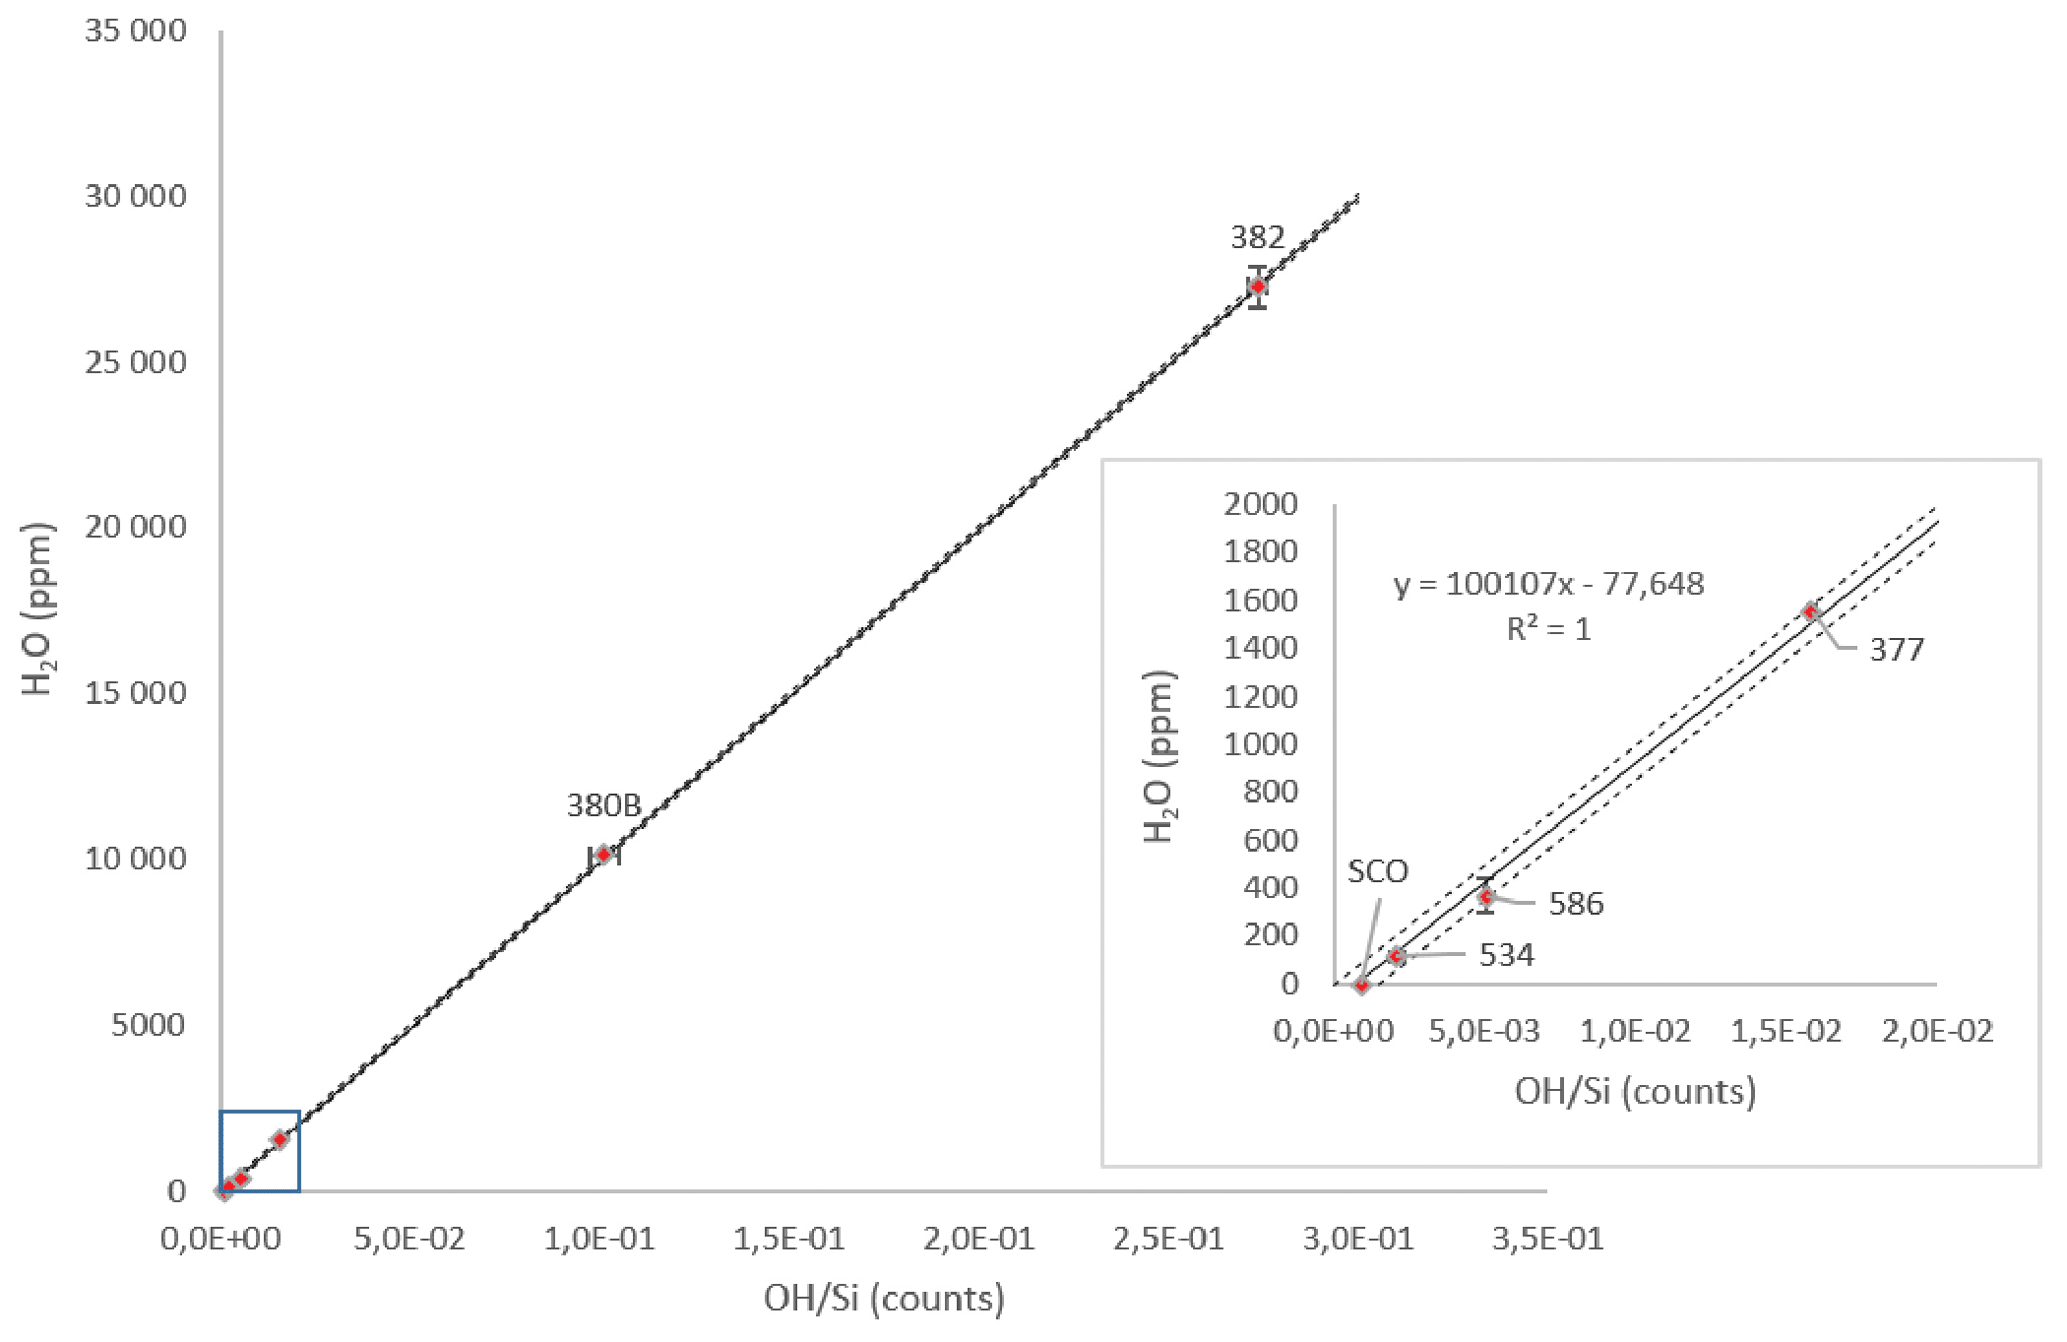
Figure A3Calibration of the OH Si counts measured with NanoSIMS as a function of the H2O content of standards of olivine (SCO represents San Carlos olivine; #534 and #586 represent the olivines from Bali et al., 2008) and wadsleyite (#377, #380B, and #382 represent the olivines from Bolfan-Casanova et al., 2018, and unpublished results). The insert is a zoom of the results for the standards with low water concentration. The dashed lines mark the 90 % prediction interval.
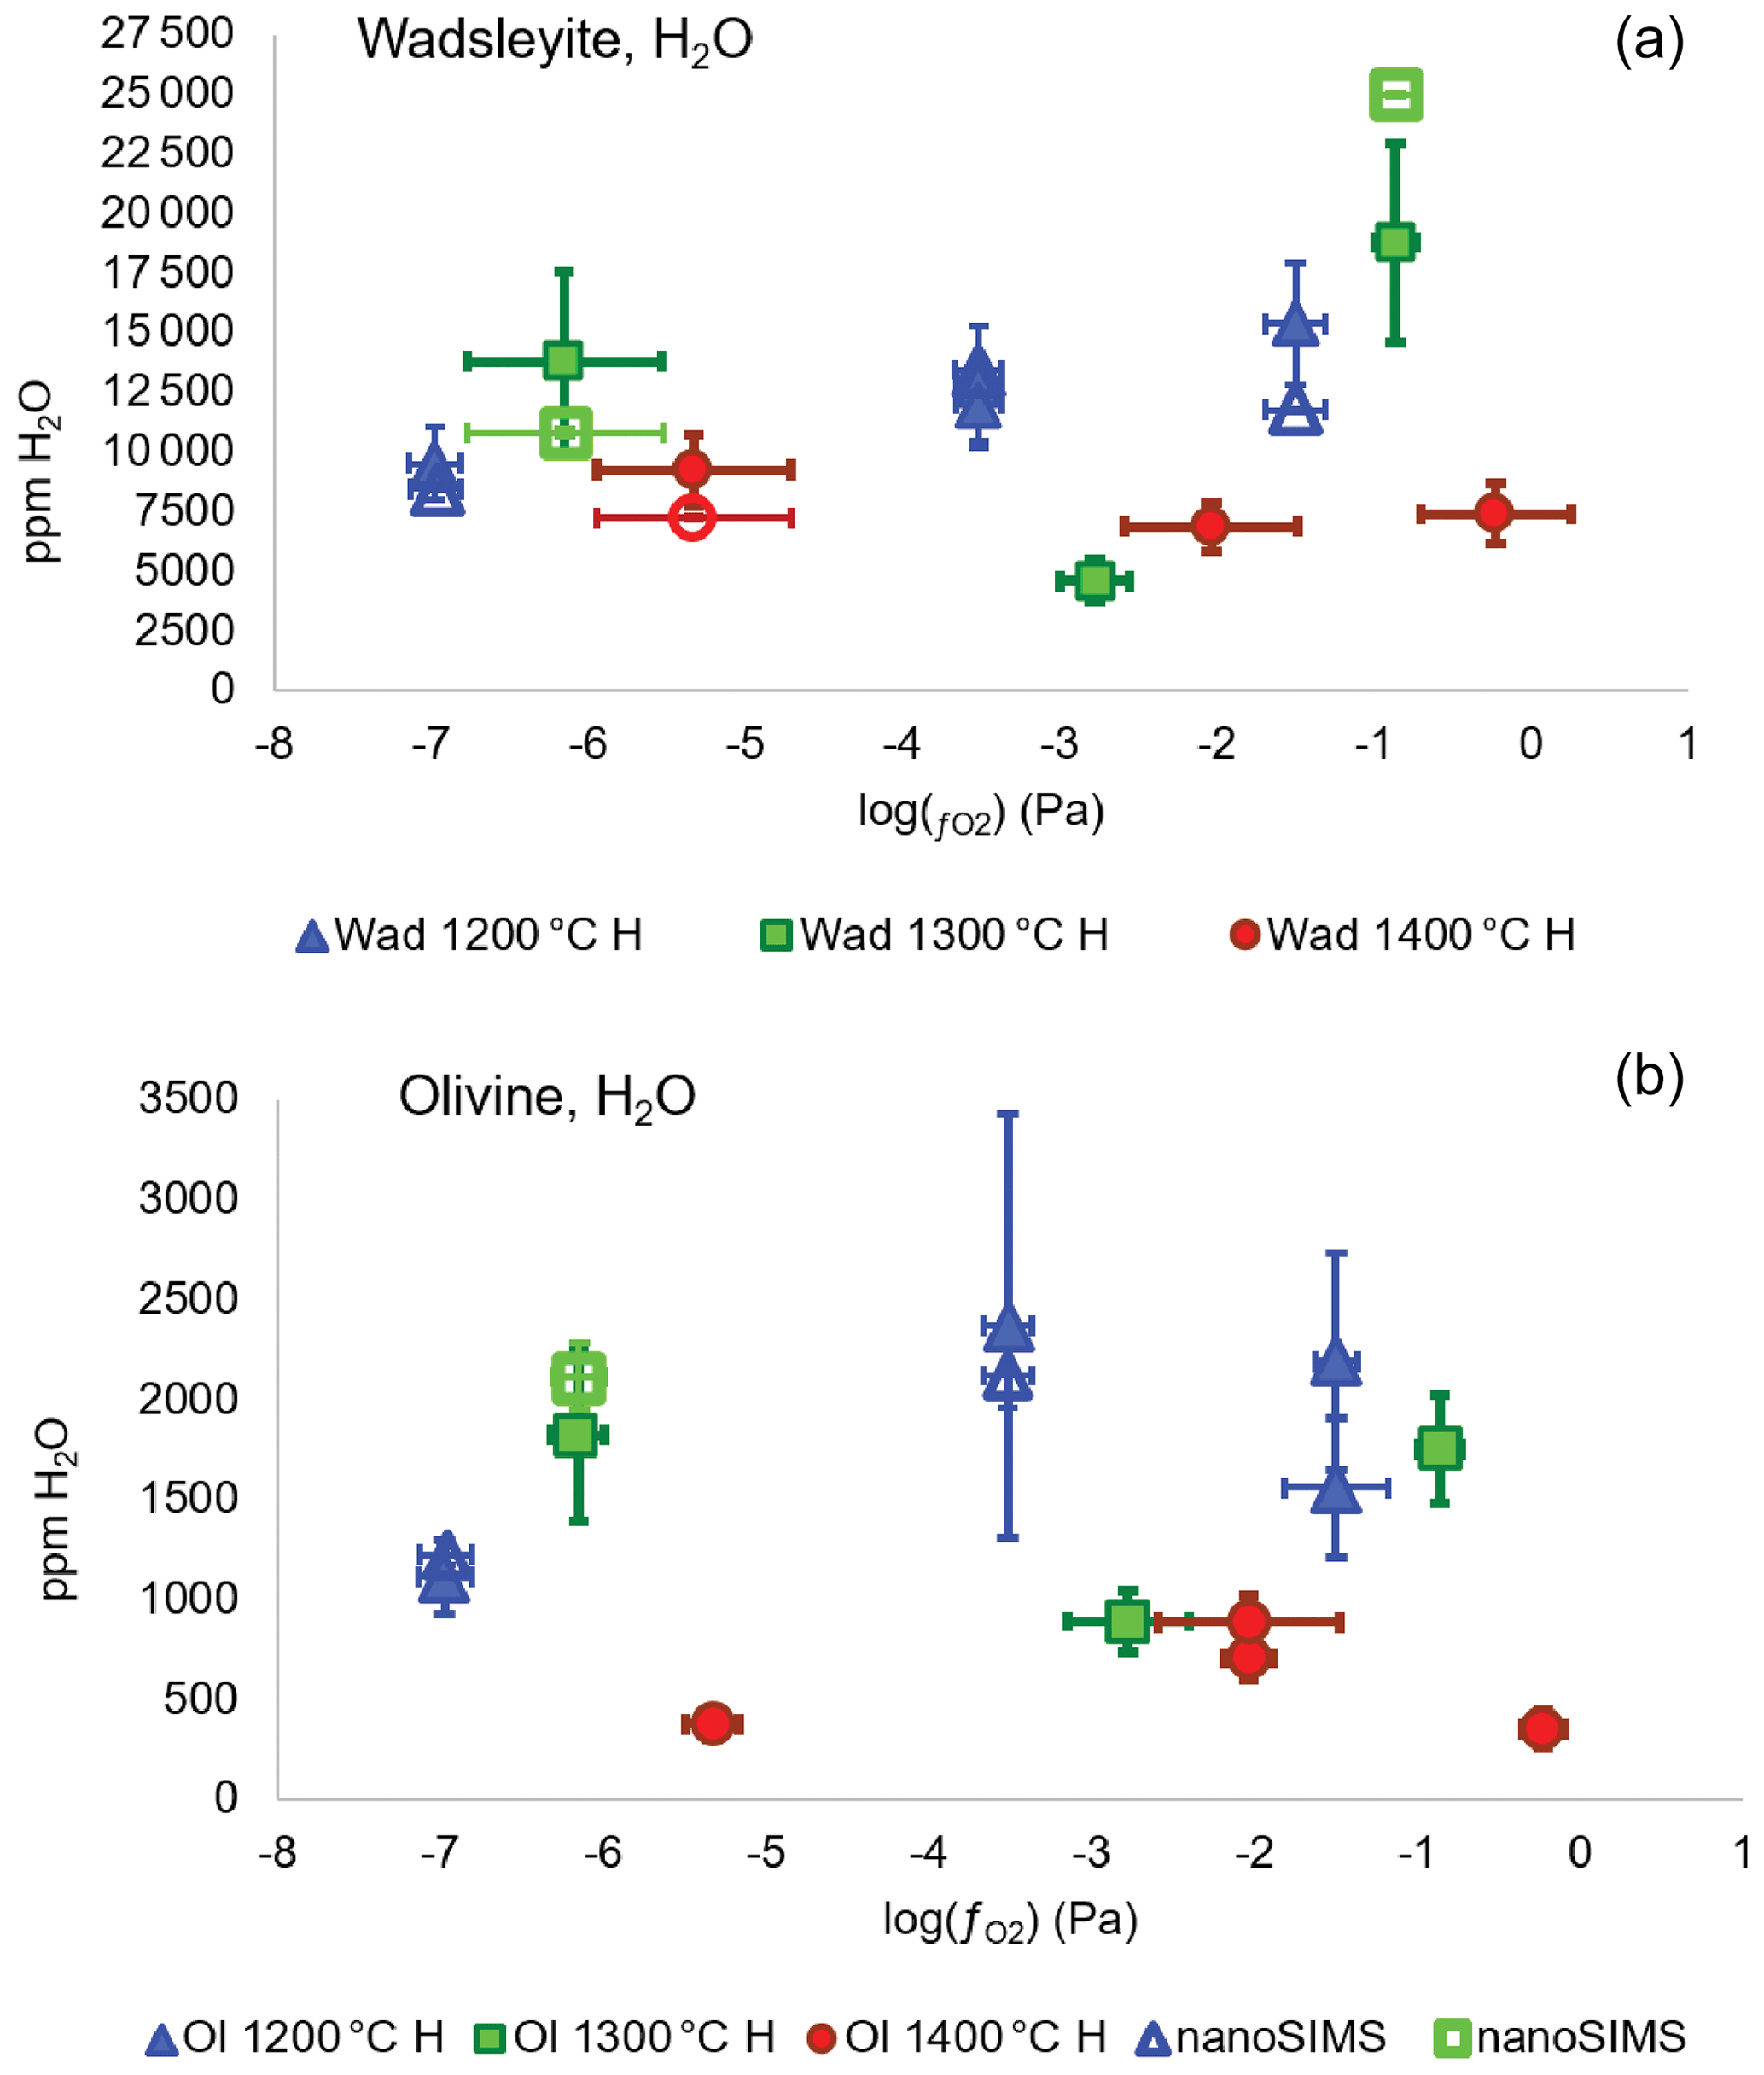
Figure A4Water concentration (in ppm wt) in wadsleyite (a) and olivine (b) as a function of fO2 and temperature in the system without carbon. The three lowest values correspond to the Fe-FeO buffer, the three intermediate values correspond to the Ni-NiO buffer, and the three highest values are those of the Re-ReO2 buffer. The full symbols correspond to the measurements performed by Raman spectroscopy and the empty symbols to the measurements performed using the NanoSIMS.
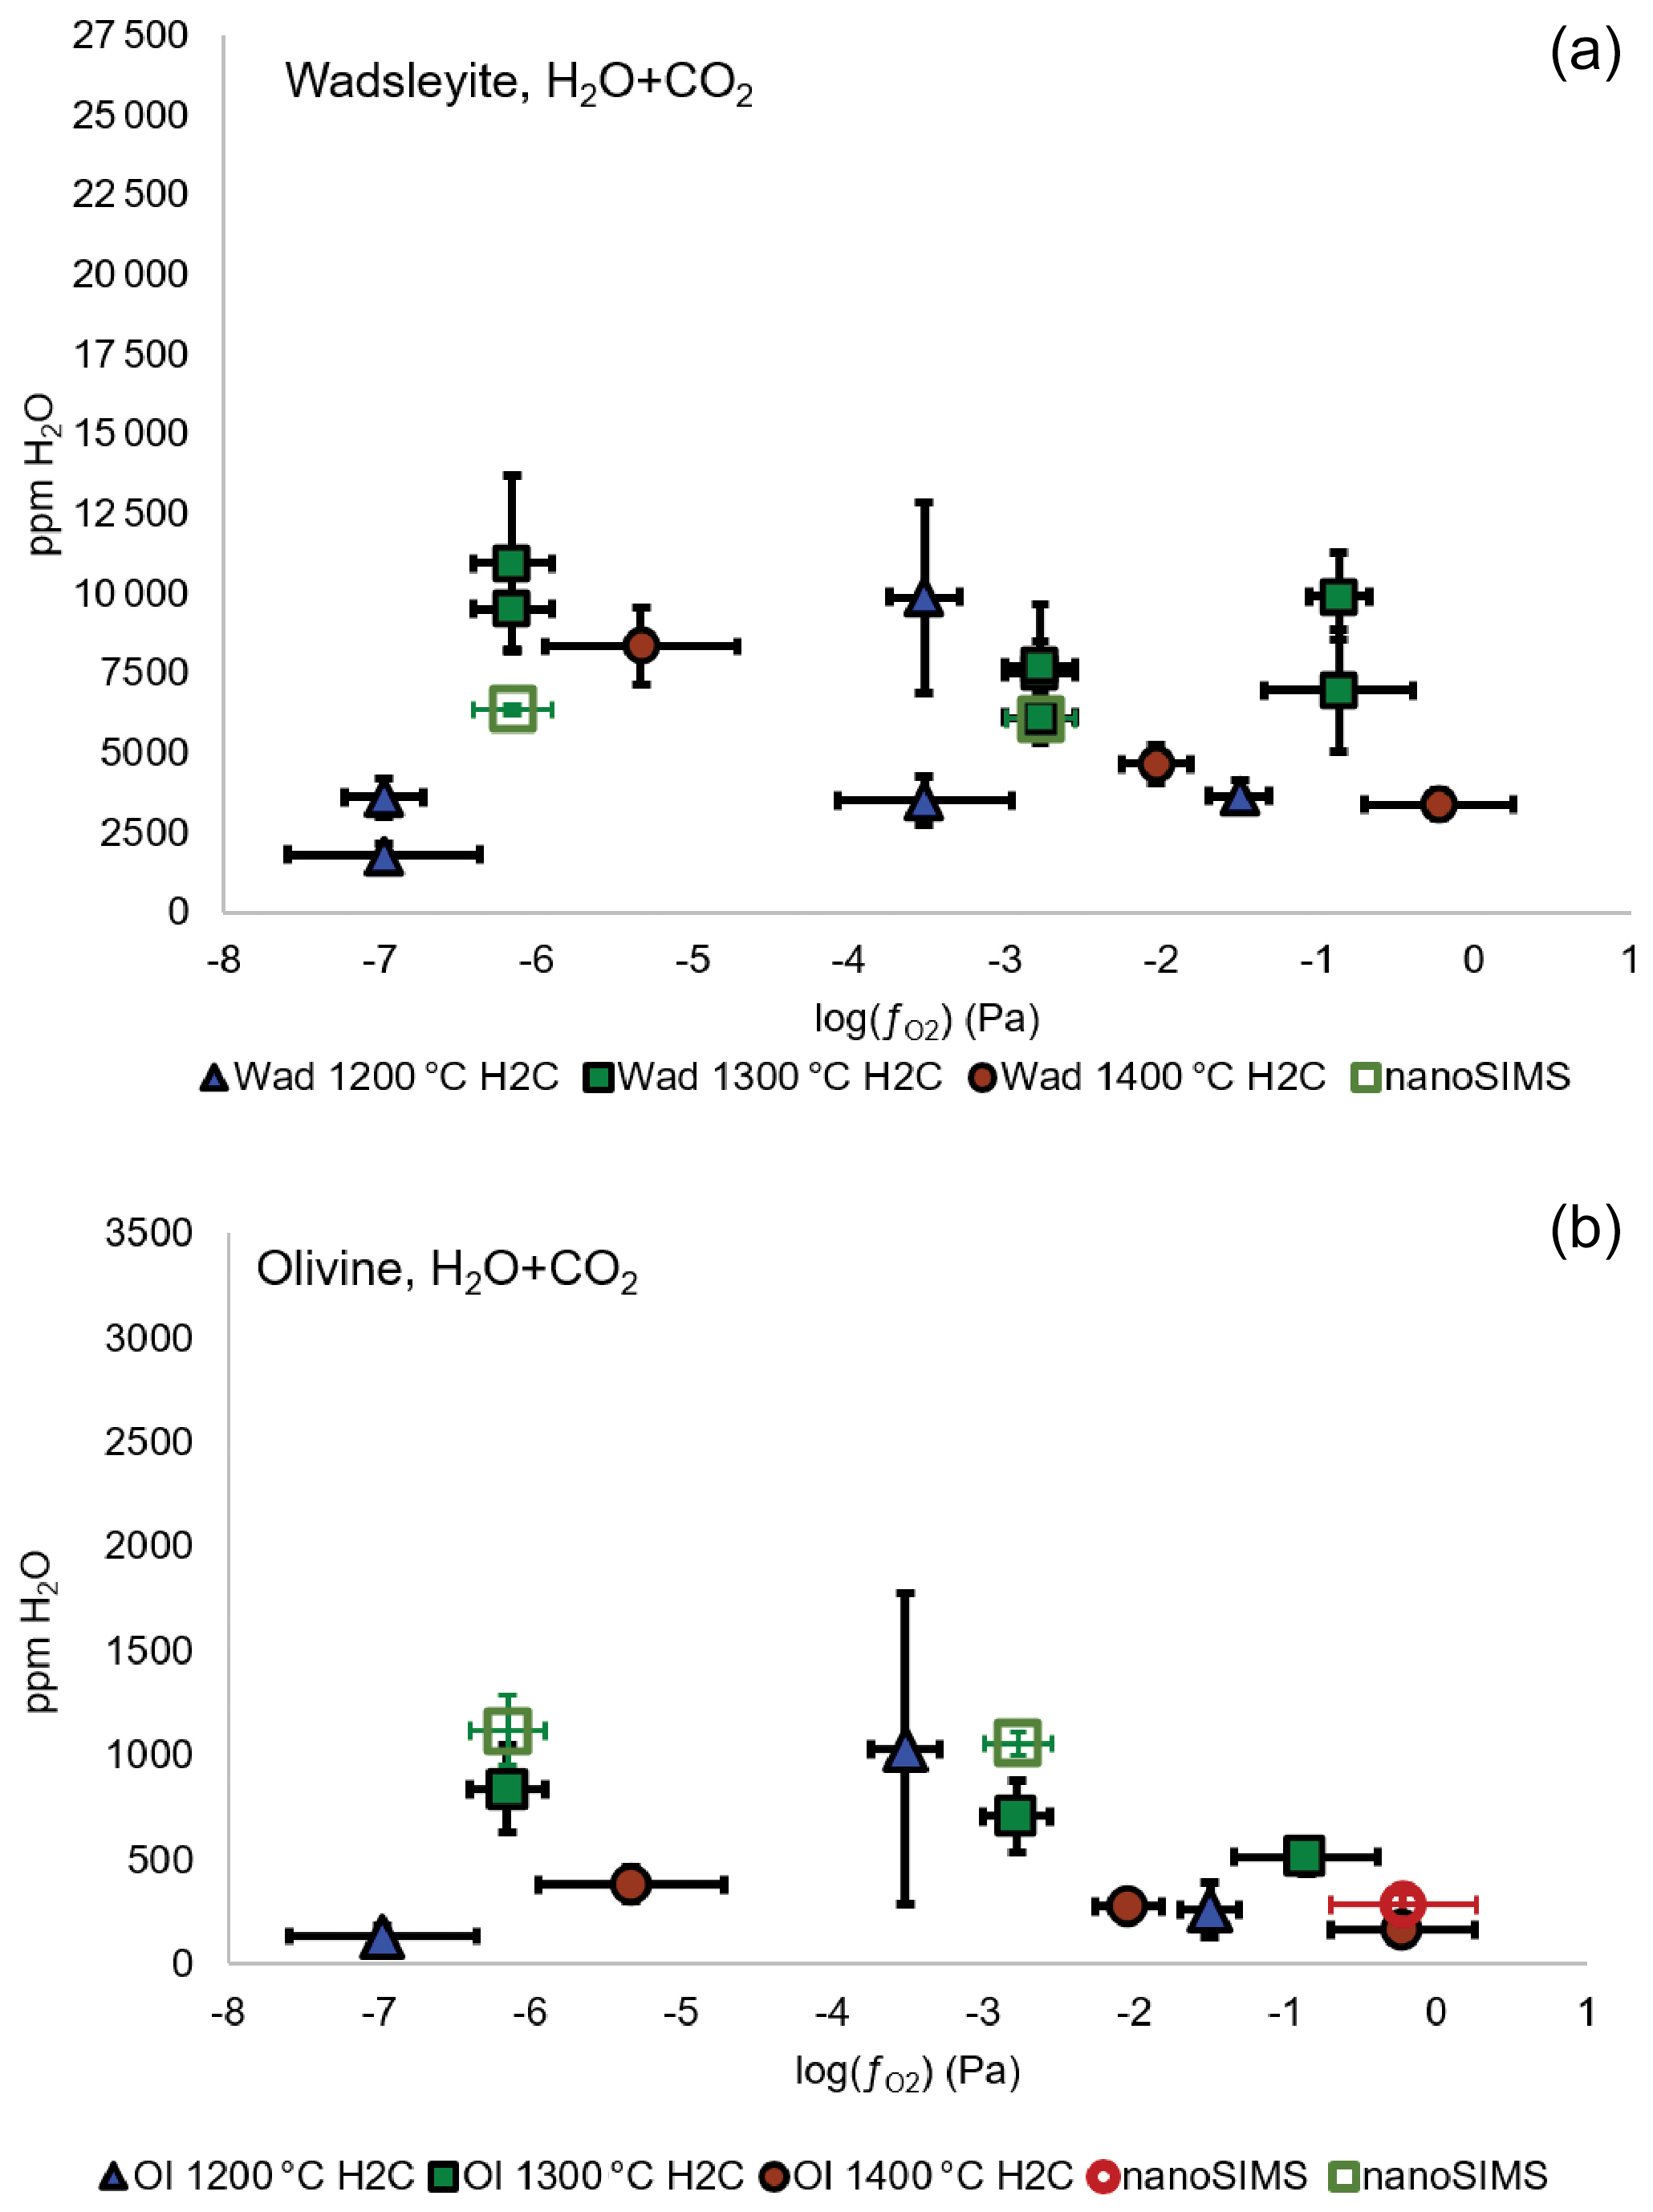
Figure A5Water concentration (in ppm wt) in wadsleyite (a) and olivine (b) as a function of fO2 and temperature in the system with carbon. The three lowest values correspond to the Fe-FeO buffer, the three intermediate values correspond to the Ni-NiO buffer, and the three highest values are those of the Re-ReO2 buffer. The full symbols correspond to the measurements performed by Raman spectroscopy and the empty symbols to the measurements performed using the NanoSIMS.
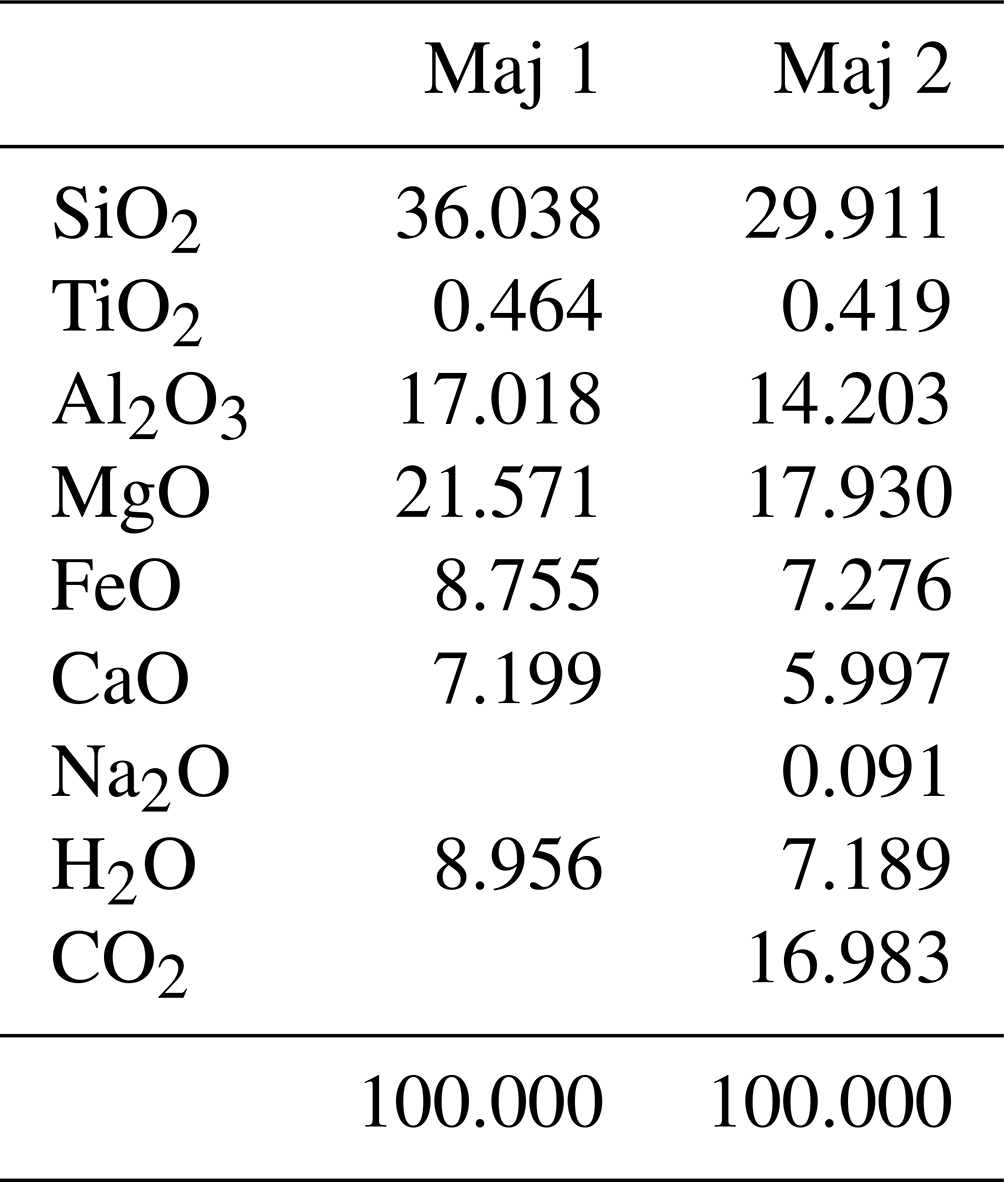
Table B1Starting composition of the majorites that were used in the experiments. Maj 1 was used in the experiments with only H in the fluid, and Maj 2 was used in the experiments with H and C in the fluid. The oxides were introduced as SiO2 and MgSiO3 for SiO2 and MgO, as CaSiO3 for CaO and SiO2, as Na2CO3 for Na2O and CO2, as Al2O3 and Al(OH)3 for Al and H in Maj 1, and as Al(OH)3 and oxalic acid (C2H2O4) for H and C in Maj 2.
The data of this study are provided in the paper.
BCN designed the experiments, analyzed the melts, made figures, and wrote the manuscript. ML performed the experiments, analyzed the samples, and made most of the figures. MG performed the calibration of the multi-anvil assemblies and participated in the writing of the manuscript. CP performed the NanoSIMS measurements together with BCN. MVP supervised the NanoSIMS measurements.
The contact author has declared that none of the authors has any competing interests.
Publisher’s note: Copernicus Publications remains neutral with regard to jurisdictional claims in published maps and institutional affiliations.
We thank Jean-Luc Devidal for his assistance during microprobe analysis, Jean-Marc Hénot and Emmy Voyer for assistance with the SEM, Jean-Louis Fruquière and Cyril Guillot for machining the multi-anvil parts, and Claire Fonquernie for measuring the volatile contents using the elemental analyzer.
This is contribution no. 592 of the ClerVolc program of the International Research Center for Disaster Sciences and Sustainable Development of the University of Clermont Auvergne, supported by the Agence Nationale de la Recherche.
This paper was edited by Stefano Poli and reviewed by two anonymous referees.
Andrault, D. and Bolfan-Casanova, N.: Mantle rain toward the Earth's surface: A model for the internal cycle of water, Phys. Earth Planet. Int., 322, 106815, https://doi.org/10.1016/j.pepi.2021.106815, 2022.
Balan, E., Blanchard, M., Lazzeri, M., and Ingrin, J.: Theoretical Raman spectrum and anharmonicity of tetrahedral OH defects in hydrous forsterite, Eur. J. Miner., 29, 201–212, 2017.
Bali, E., Bolfan-Casanova, N., and Koga, K. T.: Pressure and temperature dependence of H solubility in forsterite: An implication to water activity in the Earth interior, Earth Planet. Sc. Lett., 268, 354–363, 2008.
Bercovi, D. and Karato, S.: Whole mantle convection and the transition-zone water filter, Nature, 425, 39–44, 2003.
Bolfan-Casanova, N., Montagnac, G., and Reynard, B.: Measurement of water contents in olivine using Raman spectroscopy, Am. Mineral., 99, 149–156, 2014.
Bolfan-Casanova, N., Schiavi, F., Novella, D., Bureau, H., Raepsaet, C., Khodja, H., and Demouchy, S.: Examination of Water Quantification and Incorporation in Transition Zone Minerals: Wadsleyite, Ringwoodite and Phase D Using ERDA (Elastic Recoil Detection Analysis), Front. Earth Sc., 6, 75, https://doi.org/10.3389/feart.2018.00075, 2018.
Bureau, H. and Keppler, H.: Complete miscibility between silicate melts and hydrous fluids in the upper mantle: experimental evidence and geochemical implications, Earth Planet. Sc. Lett., 165, 187–196, 1999.
Campbell, A. J., Danielson, L., Righter, K., Seagle, C. T., Wang, Y. B., and Prakapenka, V. B.: High pressure effects on the iron-iron oxide and nickel-nickel oxide oxygen fugacity buffers, Earth Planet. Sc. Lett., 286, 556–564, 2009.
Chen, J. H., Inoue, T., Yurimoto, H., and Weidner, D. J.: Effect of water on olivine-wadsleyite phase boundary in the (Mg, Fe)2SiO4 system, Geophys. Res. Lett., 29, 1875, https://doi.org/10.1029/2001GL014429, 2002.
Connolly, J. A. D.: The geodynamic equation of state: What and how, Geochemy. Geophy. Geosy., 10, Q10014, https://doi.org/10.1029/2009GC002540, 2009.
Dalton, J. A. and Wood, B. J.: The compositions of primary carbonate melts and their evolution through Wallrock reaction in the mantle, Earth Planet. Sc. Lett., 119, 511–525, 1993.
Demouchy, S., Deloule, E., Frost, D. J., and Keppler, H.: Pressure and temperature-dependence of water solubility in Fe-free wadsleyite, Am. Mineral., 90, 1084–1091, 2005.
Deon, F., Koch-Müller, M., Rhede, D., and Wirth, R.: Water and iron effect on the P-T-x coordinates of the 410-km discontinuity in the Earth's upper mantle, Contrib. Miner. Petrol., 161, 653–666, https://doi.org/10.10007/s00410-010-0555-6, 2011.
Druzhbin, D., Fei, H. Z., and Katsura, T.: Independent hydrogen incorporation in wadsleyite from oxygen fugacity and non-dissociation of H2O in the reducing mantle transition zone, Earth Planet. Sc. Lett., 557, 116755, https://doi.org/10.1016/j.epsl.2021.116755, 2021.
Férot, A. and Bolfan-Casanova, N.: Water storage capacity in olivine and pyroxene to 14 GPa: Implications for the water content of the Earth's upper mantle and nature of seismic discontinuities, Earth Planet. Sc. Lett., 349/350, 218–230, 2012.
Freitas, D., Manthilake, G., Schiavi, F., Chantel, J., Bolfan-Casanova, N., Bouhifd, M. A., and Andrault, D.: Experimental evidence supporting a global melt layer at the base of the Earth's upper mantle, Nat. Commun., 8, 2186, https://doi.org/10.1038/s41467-017-02275-9, 2017.
Frost, D. J. and Dolejs, D.: Experimental determination of the effect of H2O on the 410-km seismic discontinuity, Earth Planet. Sc. Lett., 256, 182–195, 2007.
Frost, D. J. and McCammon, C. A.: The redox state of Earth's mantle, Ann. Rev. Earth Planet. Sci., 36, 389–420, 2008.
Ghosh, S., Ohtani, E., Litasov, K. D., and Terasaki, H.: Solidus of carbonated peridotite from 10 to 20 GPa and origin of magnesiocarbonatite melt in the Earth's deep mantle, Chem. Geol., 262, 17–28, 2009.
Goncharov, A. G., Ionov, D. A., Doucet, L. S., and Pokhilenko, L. N.: Thermal state, oxygen fugacity and C-O-H fluid speciation in cratonic lithospheric mantle: New data on peridotite xenoliths from the Udachnaya kimberlite, Siberia, Earth Planet. Sc. Lett., 357, 99–110, 2012.
Hammouda, T.: High-pressure melting of carbonated eclogite and experimental constraints on carbon recycling and storage in the mantle, Earth Planet. Sc. Lett., 214, 357–368, 2003.
Huang, X., Xu, Y., and Karato, S. I.: Water content in the transition zone from electrical conductivity of wadsleyite and ringwoodite, Nature, 434, 746–749, 2005.
Inoue, T.: Effect of water on melting phase relations and melt composition in the system Mg2SiO4-MgSiO3-H2O up to 15 GPa, Phys. Earth Planet. Int., 85, 237–263, 1994.
Jacob, K. T., Mishra, S., and Waseda, Y.: Refinement of thermodynamic properties of ReO2, Thermochim. Acta, 348, 61–68, 2000.
Jacobsen, S. D., Demouchy, S., Frost, D. J .B. B. T., and Kung, J.: A systematic study of OH in hydrous wadsleyite from polarized infrared spectroscopy and single-crystal X-ray diffraction, Am. Mineral., 143/144, 47–56, 2004.
Katsura, T., Yamada, H., Nishikawa, O., Song, M., Kubo, A., Shinmei, T., Yokoshi, S., Aizawa, Y., Yoshino, T., Walter, M. J., Ito, E., and Funakoshi, K.: Olivine-wadsleyite transition in the system (Mg,Fe)2SiO4, J. Geophys. Res., 109, B02209, https://doi.org/10.1029/2003JB002438, 2004.
Kohlstedt, D. L., Keppler, H., and Rubie, D. C.: Solubility of water in the a, β and γ phases of (Mg,Fe)2SiO4, Contrib. Miner. Petrol., 123, 345–357, 1996.
Litasov, K. D., Shatskiy, A., and Ohtani, E.: Melting and subsolidus phase relations in peridotite and eclogite systems with reduced C-O-H fluid at 3–16 GPa, Earth Planet. Sc. Lett., 391, 87–99, 2014.
Martinek, L. and Bolfan-Casanova, N.: Water quantification in olivine and wadsleyite by Raman spectroscopy and study of errors and uncertainties, Am. Mineral., 106, 570–580, 2021.
Matveev, S., Ballhaus, C., Fricke, K., Truckenbrodt, J., and Ziegenbein, D.: Volatiles in the Earth's mantle, 1. Synthesis of CHO fluids at 1273 K and 2.4 GPa, Geochim. Cosmochim. Ac., 61, 3081–3088, 1997.
McCubbin, F. M., Sverjensky, D. A., Steele, A., and Mysen, B. O.: In-situ characterization of oxalic acid breakdown at elevated P and T: Implications for organic C-O-H fluid sources in petrologic experiments, Am. Mineral., 99, 2258–2271, 2014.
Mibe, K., Kanzaki, M., Kawamoto, T., Kyoko, M. N., Fei, Y., and Ono, S.: Second critical endpoint in the peridotite–H2O system, J. Geophys. Res., 112, B03201, https://doi.org/10.1029/2005JB004125, 2007.
Mibe, K., Orihashi, Y., Nakai, S., and Fujii, T.: Element partitioning between transition-zone minerals and ultramafic melt under hydrous conditions, Geoph. Res. Lett., 33, L16307, https://doi.org/10.1029/2006GL026999, 2006.
Mosenfelder, J. L., Deligne, L. I., Asimow, P. D., and Rossman, G. R.: Hydrogen incorporation in olivine from 2–12 GPa, Am. Mineral., 91, 285–294, 2006.
Ohtani, E., Mizobata, H., and Yurimoto, H.: Stability of dense hydrous magnesium silicate phases in the systems Mg2SiO4-H2O and MgSiO3-H2O at pressures up to 27 GPa, Phys. Chem. Mineral., 27, 533–544, 2000.
Pearson, D. G., Brenker, F. E., Nestola, F., McNeill, J., Nasdala, L., Hutchison, M. T., Matveev, S., Mather, K., Silversmit, G., Schmitz, S., Vekemans, B., and Vincze, L.: Hydrous mantle transition zone indicated by ringwoodite included within diamond, Nature, 507, 221–224, 2014.
Revenaugh, J. and Sipkin, S. A.: Seismic Evidence for Silicate Melt Atop the 410 km Mantle Discontinuity, Nature, 369, 474–476, 1994.
Sakamaki, T., Ohtani, E., Urakawa, S., Terasaki, H., and Katayama, Y.: Density of carbonated peridotite magma at high pressure using an X-ray absorption method, Am. Mineral., 96, 553–557, 2011.
Shcheka, S. S., Wiedenbeck, M., Frost, D. J., and Keppler, H.: Carbon solubility in mantle minerals, Earth Planet. Sc. Lett., 245, 730–742, 2006.
Sokol, A. G., Palyanova, G. A., Palyanov, Y. N., Tomilenko, A. A., and Melenevsky, V. N.: Fluid regime and diamond formation in the reduced mantle: Experimental constraints, Geochim. Cosmochim. Ac., 73, 5820–5834, 2009.
Sokol, A. G., Palyanov, Y. N., Kupriyanov, I. N., Litasov, K. D., and Polovinka, M. P.: Effect of oxygen fugacity on the H2O storage capacity of forsterite in the carbon-saturated systems, Geochim. Cosmochim. Ac., 74, 4793–4806, 2010.
Sokol, A. G., Kupriyanov, I. N., and Palyanov, Y. N.: Partitioning of H2O between olivine and carbonate-silicate melts at 6.3 GPa and 1400 ∘C: Implications for kimberlite formation, Earth Planet. Sc. Lett., 383, 58–67, 2013.
Tauzin, B., Debayle, E., and Wittlinger, G.: Seismic evidence for a global low-velocity layer within the Earth's upper mantle, Nat. Geosci., 3, 718–721, 2010.
Tenner, T. J., Hirschmann, M. M., Withers, A. C., and Ardia, P.: H2O storage capacity of olivine and low-Ca pyroxene from 10 to 13 GPa: consequences for dehydration melting above the transition zone, Contrib. Miner. Petrol., 163, 297–316, 2012.
Truckenbrodt, J., Ziegenbein, D., and Johannes, W.: Redox conditions in piston-cylinder apparatus: The different behavior of boron nitride and unfired pyrophyllite assemblies, Am. Mineral., 82, 337–344, 1997.
White, B. S. and Wyllie, P. J.: Solidus reactions in synthetic lherzolite-H2O-CO2 from 23–30 kbar, with application to melting and metasomatism, J. Volcan. Geoth. Res., 50, 117–130, 1992.
Withers, A. C. and Hirschmann, M. M.: H2O storage capacity of MgSiO3 clinoenstatite at 8–13 GPa, 1,100–1,400 ∘C, Contrib. Miner. Petrol., 154, 663–674, 2007.
Withers, A. C. and Hirschmann, M. M.: Influence of temperature, composition, silica activity and oxygen fugacity on the H2O storage capacity of olivine at 8 GPa, Contrib. Miner. Petrol., 156, 595–605, 2008.
Withers, A. C., Bureau, H., Raepsaet, C., and Hirschmann, M. M.: Calibration of infrared spectroscopy by elastic recoil detection analysis of H in synthetic olivine, Chem. Geol., 334, 92–98, 2012.
Woodland, A. B., Kornprobst, J., and Tabit, A.: Ferric iron in orogenic lherzolite massifs and controls of oxygen fugacity in the upper mantle, Lithos, 89, 222–241, 2006.
Xiao, J., Hier-Majumder, S., Tauzin, B., and Waltham, D.: An inversion approach for analysing the physical properties of a seismic low-velocity layer in the upper mantle, Phys. Earth Planet. Int., 304, 106502, https://doi.org/10.1016/j.pepi.2020.106502, 2020.
Yang, X. Z.: OH solubility in olivine in the peridotite-COH system under reducing conditions and implications for water storage and hydrous melting in the reducing upper mantle, Earth Planet. Sc. Lett., 432, 199–209, 2015.
Yang, X. Z.: Effect of oxygen fugacity on OH dissolution in olivine under peridotite-saturated conditions: An experimental study at 1.5–7 GPa and 1100–1300 ∘C, Geochim. Cosmochim. Ac., 173, 319–336, 2016.
Yang, X. Z., Liu, D. D., and Xia, Q. K.: CO2-induced small water solubility in olivine and implications for properties of the shallow mantle, Earth Planet. Sc. Lett., 403, 37–47, 2014.
Yoshino, T., Nishihara, Y., and Karato, S. I.: Complete wetting of olivine grain boundaries by a hydrous melt near the mantle transition zone, Earth Planet. Sc. Lett., 256, 466–472, 2007.