the Creative Commons Attribution 4.0 License.
the Creative Commons Attribution 4.0 License.
 | 17 Jan 2023
Shear properties of MgO inferred using neural networks
Laura Cobden
Jeannot Trampert
Hauke Marquardt
Jennifer M. Jackson
Shear properties of mantle minerals are vital for interpreting seismic shear wave speeds and therefore inferring the composition and dynamics of a planetary interior. Shear wave speed and elastic tensor components, from which the shear modulus can be computed, are usually measured in the laboratory mimicking the Earth's (or a planet's) internal pressure and temperature conditions. A functional form that relates the shear modulus to pressure (and temperature) is fitted to the measurements and used to interpolate within and extrapolate beyond the range covered by the data. Assuming a functional form provides prior information, and the constraints on the predicted shear modulus and its uncertainties might depend largely on the assumed prior rather than the data. In the present study, we propose a data-driven approach in which we train a neural network to learn the relationship between the pressure, temperature and shear modulus from the experimental data without prescribing a functional form a priori. We present an application to MgO, but the same approach works for any other mineral if there are sufficient data to train a neural network. At low pressures, the shear modulus of MgO is well-constrained by the data. However, our results show that different experimental results are inconsistent even at room temperature, seen as multiple peaks and diverging trends in probability density functions predicted by the network. Furthermore, although an explicit finite-strain equation mostly agrees with the likelihood predicted by the neural network, there are regions where it diverges from the range given by the networks. In those regions, it is the prior assumption of the form of the equation that provides constraints on the shear modulus regardless of how the Earth behaves (or data behave). In situations where realistic uncertainties are not reported, one can become overconfident when interpreting seismic models based on those defined equations of state. In contrast, the trained neural network provides a reasonable approximation to experimental data and quantifies the uncertainty from experimental errors, interpolation uncertainty, data sparsity and inconsistencies from different experiments.
- Article
(3347 KB) - Full-text XML
- BibTeX
- EndNote


A comparison of seismic observables with mineral seismic properties predicted by experimental or theoretical methods allows us to infer the structure and composition of the Earth's (or a planetary) interior (e.g. Jackson, 1998; Trampert et al., 2001; Deschamps and Trampert, 2004; Wentzcovitch et al., 2004; Mattern et al., 2005; Cammarano et al., 2005; Matas et al., 2007; Khan et al., 2008; Cobden et al., 2009, 2012; Jackson and Thomas, 2021; Khan et al., 2021). To decipher the thermo-chemical structure of the Earth's interior, it is crucial to understand the shear properties, such as the shear modulus and shear wave speed, of mantle minerals.
Seismic properties of minerals and sensitivities of wave speeds to temperature and composition are usually derived from equation-of-state (EOS) modelling. While the volumetric properties are calculated from thermodynamic principles and EOSs (e.g. Birch–Murnaghan or Vinet with Grüneisen models), the shear modulus lacks a thermodynamic expression. Nevertheless, the shear modulus may be cast in a functional form similar to the bulk modulus (e.g. Davies and Dziewonski, 1975; Stacey, 1995; Stixrude and Lithgow-Bertelloni, 2005; Kennett, 2017). Recently, Kennett (2020) provided explicit expressions of the shear counterpart to a variety of existing volumetric EOS forms (e.g. third-order finite strain, Vinet). This approach relates the bulk modulus information to the shear modulus assuming that the uncertainties in the latter are related to and can be derived from the former, but the relation is semi-empirical. In addition to the assumptions about uncertainties, this relationship also implies that the scaling of the actual value of the shear modulus would be the same for different minerals.
In Rijal et al. (2021), we demonstrated the use of the mixture density network (Bishop, 1995) for inferring the relationship between pressure, temperature and volume and thus bulk modulus and thermal expansivity. In this neural-network-based approach, the inferred properties are learned from the available experimental data, rather than prescribing a priori a functional form to explain the data. Our study showed that fixing a functional form provides a priori information to the inversion of experimental data which can bias the uncertainty quantification. In the present study, we apply a similar approach to infer the shear properties, in particular the shear modulus and wave speed, of MgO with uncertainties, using experimental shear modulus data collated from various studies. Hence, the inferred pressure–temperature–shear modulus (P–T–G) relationship (as well as its uncertainties) is entirely data driven without any prior assumption about the functional form to describe the dependence of the shear modulus on pressure and temperature.
Experimental shear modulus data for MgO are available from various measurement techniques. In this study, we collate data (Fig. 1) with uncertainties from Brillouin scattering (BS), ultrasonic interferometry (US), rectangular parallelepiped resonance (RPR), inelastic X-ray scattering (IXS) and inelastic neutron scattering (INS) methods. A list of experimental methods from which we collected data is given in Appendix A. Readers are referred to Marquardt and Thomson (2020) for a technical review of BS, US and IXS and to Sumino et al. (1976) and Ohno (1976) for RPR techniques. Nevertheless, it is important to mention that BS and US (on polycrystalline materials) provide a sample's aggregate shear wave speed (Vs) that can be used to extract the shear modulus if the density (ρ) of the same sample is known. However, not all data considered in this study provide Vs and ρ information for the same MgO sample. For example, Murakami et al. (2012) use density and velocity at 300 K from their previous study (Murakami et al., 2009) on polycrystalline samples, and Zha et al. (2000) use single-crystal (SC) data for velocity and polycrystalline (PC) samples for density. Although the densities measured on polycrystalline samples by these two different studies agree with each other, the shear modulus values are inconsistent (Appendix B).
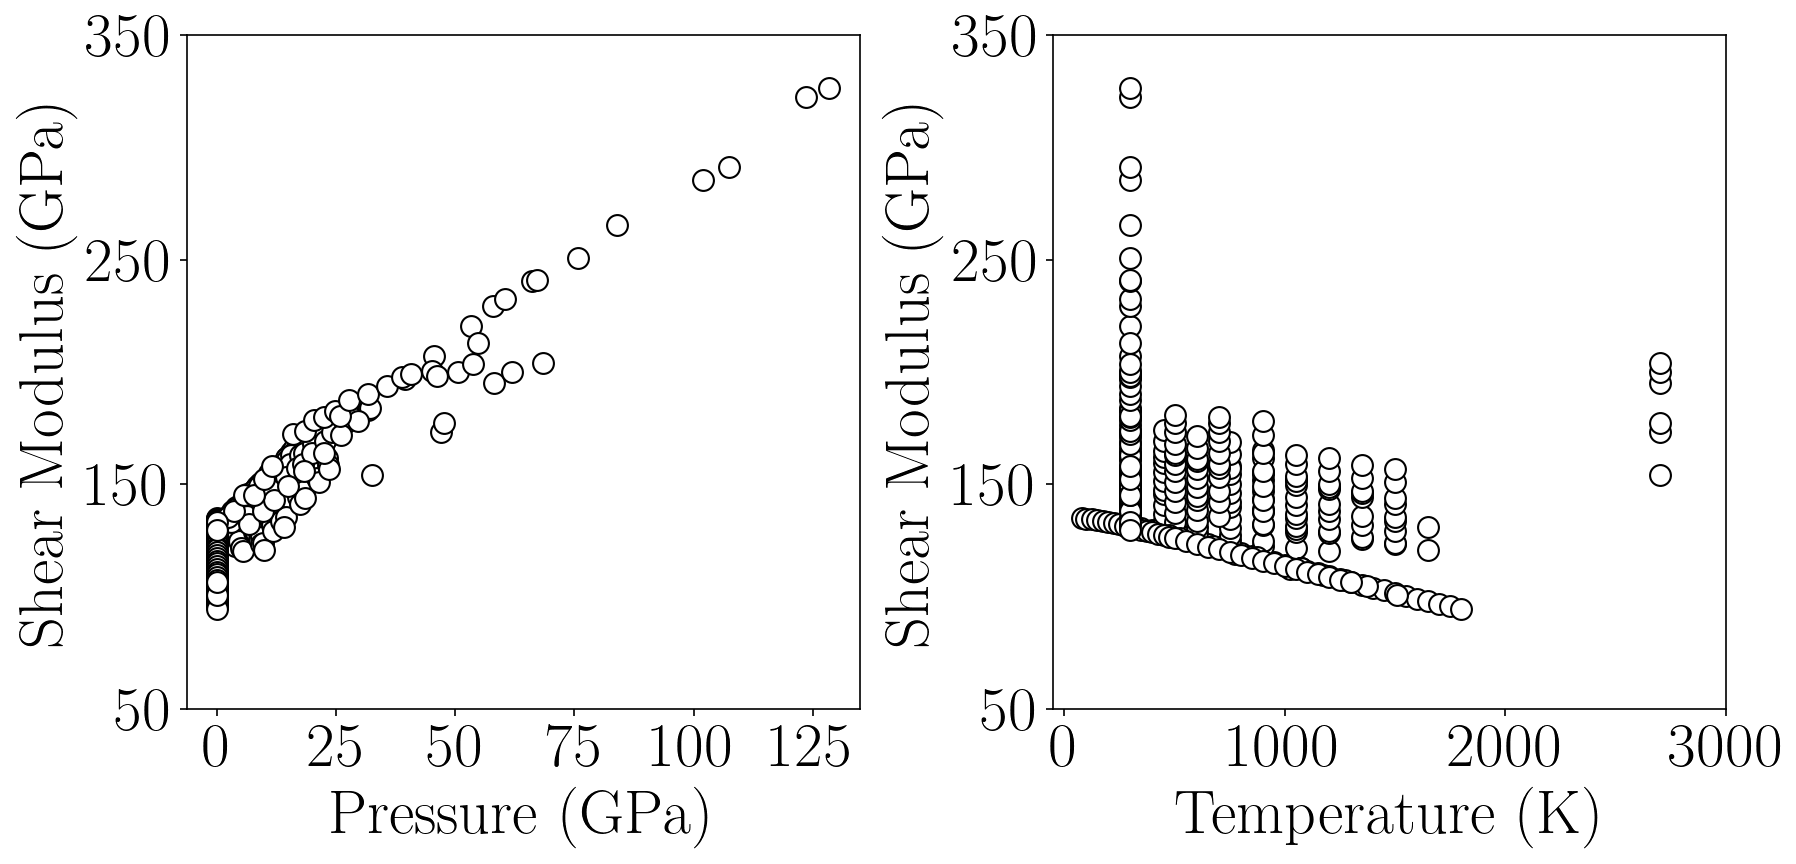
Figure 1Experimental MgO P–G–T data used in this study are collected from Sangster et al. (1970), Sumino et al. (1983), Isaak et al. (1989), Sinogeikin et al. (2000), Sinogeikin and Bass (2000), Zha et al. (2000), Jacobsen et al. (2002), Li et al. (2006), Fukui et al. (2008), Murakami et al. (2009), Kono et al. (2010), Murakami et al. (2012), Finkelstein et al. (2018), and Fan et al. (2019). Note uncertainties in collected experimental data are not plotted because most of them are smaller than the size of the plotting symbol. There are 311 data points in total, and we generate a dataset to train the neural networks by sampling from the uncertainty ranges of these data.
With RPR and BS in a single crystal, it is also possible to determine the elastic tensor of a sample (e.g. Sinogeikin and Bass, 2000; Isaak et al., 1989; Sinogeikin et al., 2000). The elastic tensor components can be used to compute the shear modulus using an averaging scheme, such as Reuss or Voigt. We collected the shear modulus of MgO given by Isaak et al. (1989) (RPR, Hashin–Shtrikman average), Sumino et al. (1983) (RPR, Voigt–Reuss–Hill average), Sinogeikin et al. (2000) (BS SC, Voigt–Reuss–Hill average), and Sinogeikin and Bass (2000) (BS SC, Voigt–Reuss–Hill average). The shear moduli of MgO based on measurements of its acoustic phonon dispersion curves using high-energy-resolution inelastic X-ray scattering (Fukui et al., 2008; Finkelstein et al., 2018) and inelastic neutron scattering (Sangster et al., 1970) are also included in this study.
As shown in Fig. 1, most experimental data come from measurements where the temperature is below 1800 K. Although the maximum temperature in the dataset is 2700 K, there are only a few measurements on a polycrystalline sample at that temperature (Murakami et al., 2012), and there exists a central temperature gap of around 900 K in which there are no data. Along the pressure axis, most measurements fall below approximately 30 GPa. There are some data up to 128 GPa but only at ambient temperature on a polycrystalline sample (Murakami et al., 2009). The total data shown in Fig. 1 come from various experimental techniques which probe elastic properties at different frequencies. One can train a separate neural network using data from each type of experiment if sufficient data are available covering the P–T conditions of the lower mantle. This would be helpful to compare, for example, shear properties measured by ultrasonic techniques at megahertz frequencies with Brillouin measurements at gigahertz and IXS data at terahertz frequencies. In addition, one can also separate SC data from PC samples. But currently, even when combining datasets from different experiments and sample types, we do not have sufficient P–T coverage for the whole lower mantle. For this reason, in this study we shall use all the data shown in Fig. 1 to infer the complete uncertainty estimate of the shear modulus.
P, T and G measurement errors – which may include systematic errors due to instrument calibrations, different averaging schemes and inconsistent samples for measuring velocity are the sources of uncertainties in experimental P–T–G data. In addition, inconsistencies between different studies have been highlighted in earlier papers, which further contribute to the uncertainty (e.g. Li et al., 2006; Kono et al., 2010; Fan et al., 2019). Hence, we work within a probabilistic setting to infer the P–T–G relationship, which allows us to answer the following question: what is the full range of shear modulus uncertainty at a given pressure and temperature, based on the available experimental data? We use a neural-network-based approach, specifically a mixture density network (MDN) (Bishop, 1995), to solve the probabilistic inverse problem. A detailed description of the MDN approach to estimate material properties of minerals of the lower mantle is given in Rijal et al. (2021). Briefly, a solution to the probabilistic inverse problem of finding the P–T–G relationship is given by a posterior probability density function (pdf) for G at a given P and T. The pdf can be approximated using an MDN as shown in Appendix C. To address the non-uniqueness of the regression problem, we train a number of independent MDNs (103) and combine their predicted pdf's (see details in Rijal et al., 2021). The number of hidden nodes and number of Gaussian kernels of each MDN are drawn randomly from 12–24 and 3–5, respectively.

Figure 2Prediction performance of the trained MDN as a function of pressure using the test set. The mean of the posterior pdf's on the shear modulus predicted by the MDN is subtracted from the actual shear modulus values of the test set (i.e. target values) to compute the variation in the shear modulus. The mean variation is shown as circles, and the size of uncertainty (1 standard deviation) is given by grey error bars. One could also represent the same information by using the log-likelihood function given by the MDN instead. The dashed cyan line refers to a perfectly resolved shear modulus. Hence, the closer the data plot to the line, the better the resolving power of the neural network. The differences between target and predicted shear modulus values are mostly located close to the cyan line, although intermediate- and high-pressure predictions are more uncertain and are located away from it. The range of temperature of the test data is given by the colour bar on the right. Note some error bars are smaller than or comparable to the plotting symbol.
We follow a standard approach of training neural networks, whereby training, monitoring and test sets are randomly generated from the total dataset. These sub-sets have similar pressure and temperature distributions. Although the total data contain similar numbers of SC and PC measurements, not all the referenced studies (in Fig. 1) equally contribute to the three sub-sets because of limited data. Training (≈70 %) and monitoring (≈20 %) sets are used to train the MDN and restrict the overfitting of the trained MDN, respectively. The MDN is constructed and trained using TensorFlow 1.13.1 (Abadi et al., 2015). The test set (≈10 %), which is not seen by the network during training, is used to test the prediction performance of the trained MDN. The monitoring set is used to monitor the overfitting. We compute the error in the monitoring set after each training iteration and stop the training if this error starts to increase. This technique is known as early stopping. In addition, we standardize these datasets to bring all three variables (i.e. P, T and G) to a common scale. The training time of each MDN depends on its architecture. To give an estimate, an MDN with 22 hidden nodes and 3 Gaussian kernels trained for 16 120 iterations (until the early stopping kicks in) took about 40 min in a CPU with two cores and 250 GB memory. However, there are some networks which took less than 3 min to train.
The mean and the variance (or the standard deviation) of the posterior pdf (Bishop, 1994) for the shear modulus predicted by the MDN are used to evaluate the prediction performance. These moments (i.e. mean and standard deviation) for each input of the test set are compared with the actual shear modulus from the test set. Although this approach ignores the information provided by a complete posterior pdf, it is a practical way to evaluate the network performance (e.g. de Wit et al., 2013). Figure 2 shows the resolving power of the trained MDN for various P and T conditions. Shear moduli that fall along or close to the dashed cyan line in the figure are well-resolved predictions. The MDN resolves the shear modulus better in the region of low P (below ≈30 GPa) than at intermediate and high P. This is in line with the sparse data (cf. Fig. 1) and increased experimental uncertainty towards high P. Furthermore, for measurements conducted at 300 K, constraints on the MgO shear modulus above 30 GPa are entirely due to the experimental data of Zha et al. (2000) and Murakami et al. (2009). At pressures around 50 GPa, however, these two datasets suggest two distinct trends (Appendix B and Fig. 3a). Due to these different trends, the standard deviation of the posterior pdf shows increasing uncertainties with pressures (Fig. 2). Moreover, because of this inconsistency, the targets are not aligned with the mean of the posterior pdf, demonstrating the shear modulus is only moderately constrained at pressures greater than 50 GPa (large uncertainties).
Figure 3 shows the pdf's for the shear modulus predicted by the trained MDN as a continuous function of pressure along a 300 K isotherm. The plot also compares the pdf's with the shear modulus given by the finite-strain equation of Stixrude and Lithgow-Bertelloni (2005, 2011) and ab initio calculations of Wentzcovitch et al. (2010b), denoted as SLB0511 and W10, respectively. Whilst SLB0511 use fitting parameters (G0 and ) given by Sinogeikin and Bass (2000), which are based on experiments up to a pressure of 18.6 GPa, W10 use theoretical calculation of the elastic tensor by Karki et al. (1999). For the 300 K isotherm, the width of pdf increases, i.e. uncertainty increases, with increasing pressure. This is because the experimental data become sparse, and the experimental measurements are more uncertain in the high-pressure region. Predictions by SLB0511 and W10 are consistent with each other up to approximately 75 GPa. They start to diverge as pressure increases because the predictions from SLB0511 are based on fitting low-pressure experimental data and the W10 study is based on ab initio calculations at high pressure.
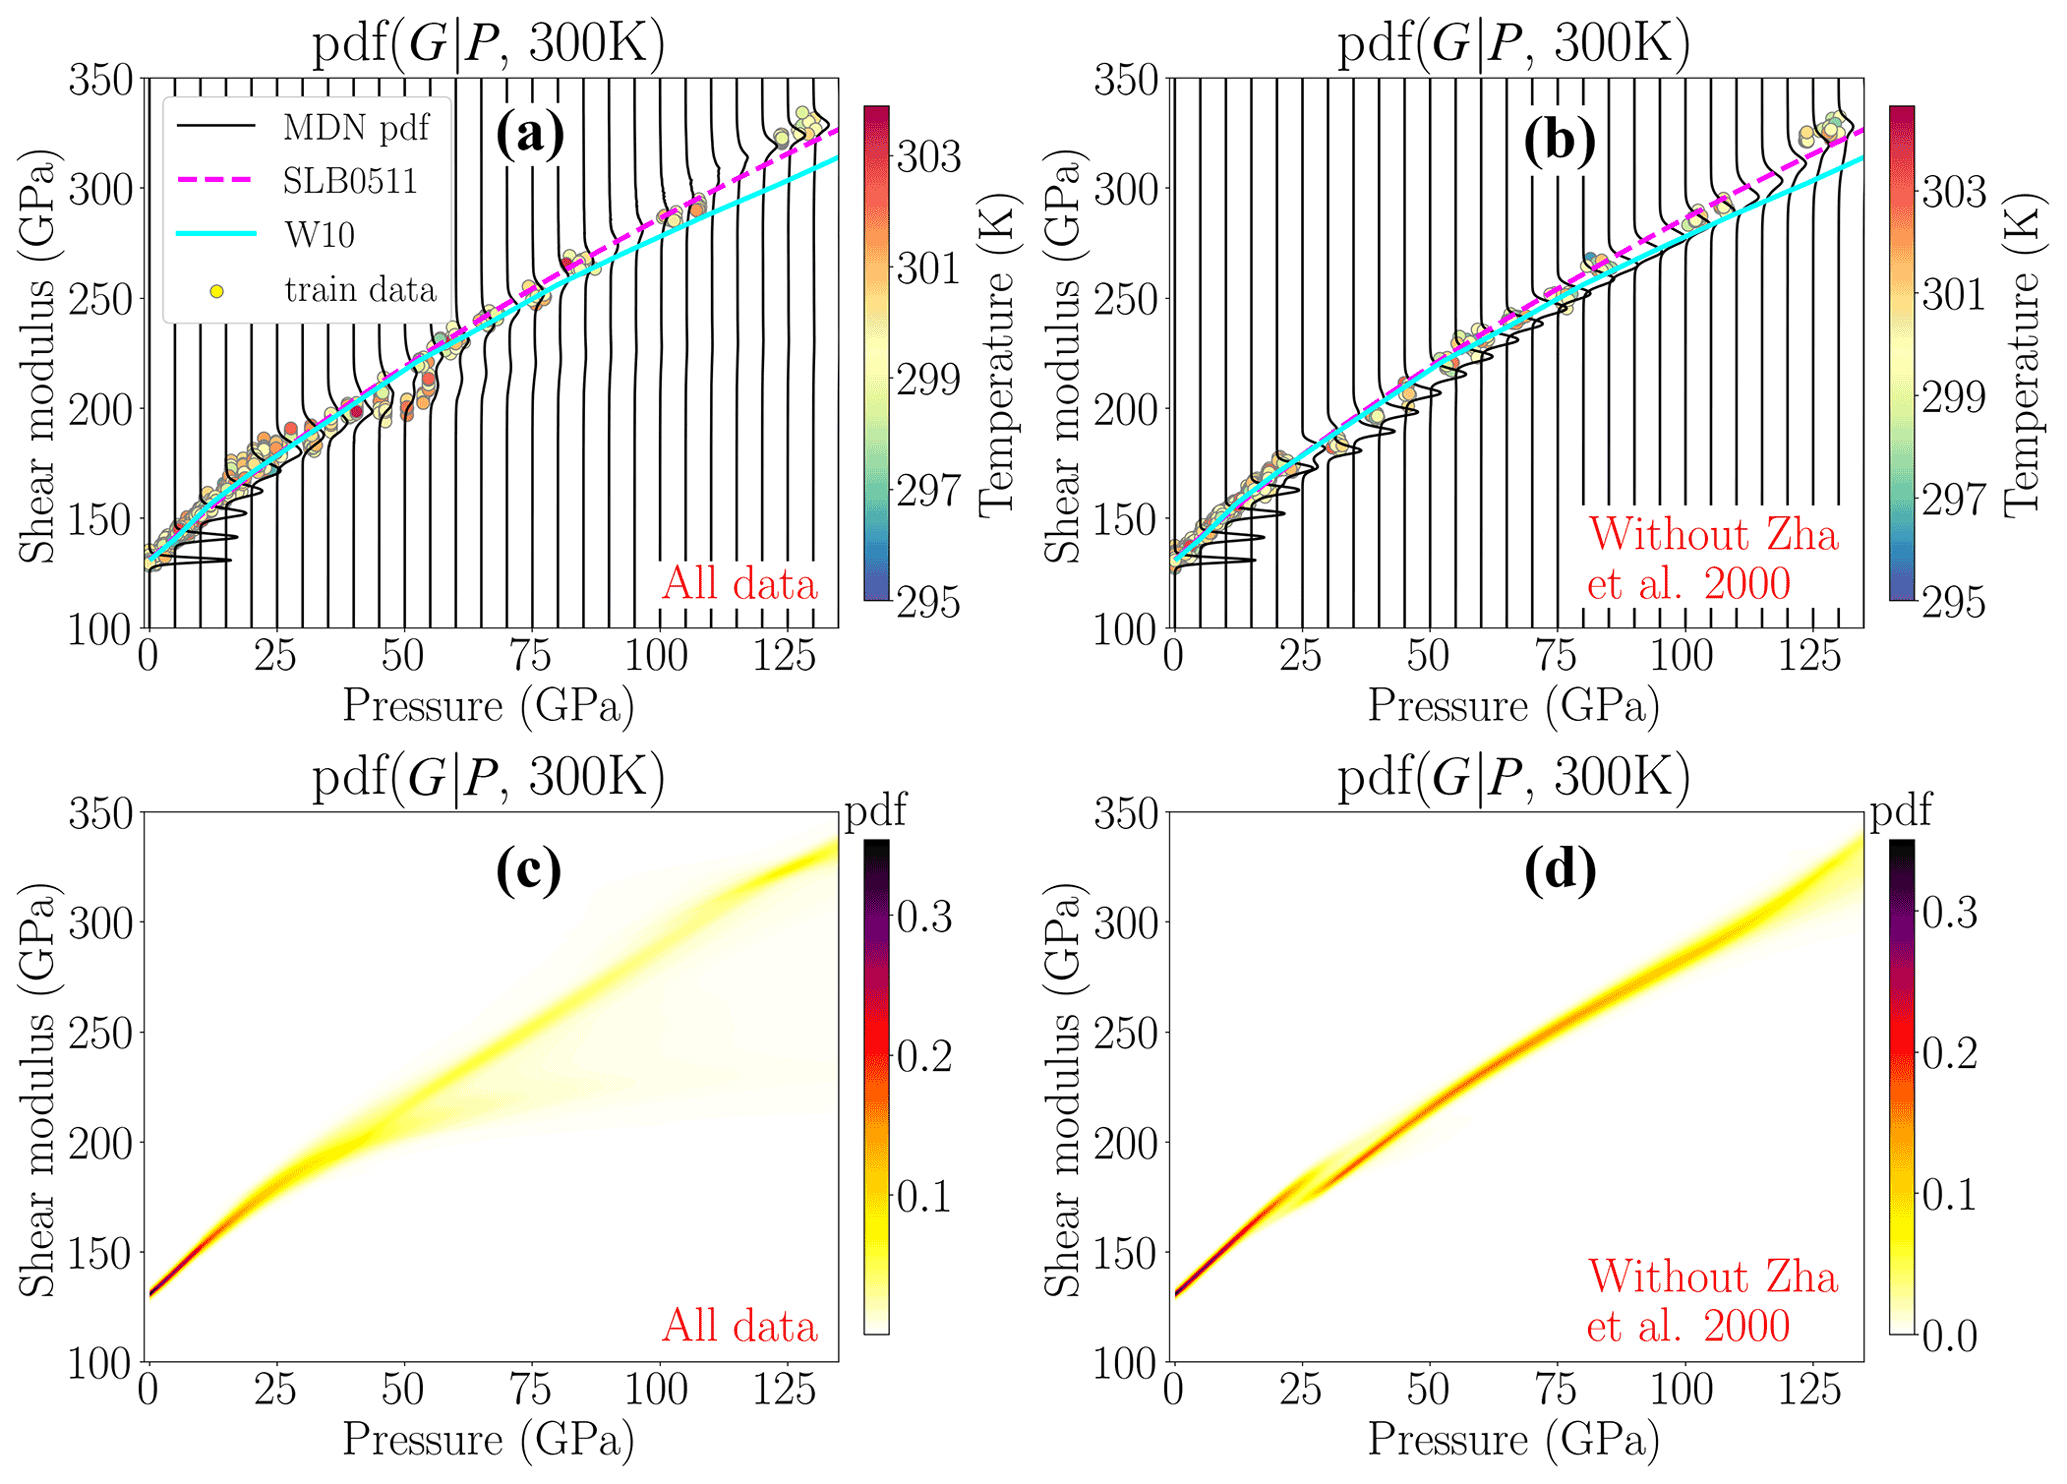
Figure 3MDN-predicted pdf's for the shear modulus of MgO at every 5 GPa interval (a, b) and as a continuous function of pressure (c, d). A sub-set of the total data, namely those data from the 295 to 305 K (see colour bars) interval, are also shown as circles. Whilst (a) and (c) show predictions from the MDN trained with all data considered in this study, (b) and (d) are from the MDN trained without Zha et al. (2000). For comparison we show EOSs of Stixrude and Lithgow-Bertelloni (2005, 2011) and Wentzcovitch et al. (2010b), denoted as SLB0511 and W10, respectively. Experimental data from Murakami et al. (2009) largely control the MDN predictions in the high-pressure region, although a different trend of Zha et al. (2000) makes the posterior uncertainties larger around 50 GPa. The effect of Zha et al. (2000) decreases as the pressure increases.
For 300 K and above approximately 50 GPa (Fig. 3a), the trained MDN shows a peak in probability density functions favouring the Murakami et al. (2009) data because these are the only high-pressure measurements. However, the MDN still assigns some probability towards smaller values of the shear modulus, resulting in broader pdf's (Fig. 3a, c). The widening of the pdf's is due to different data trends from Murakami et al. (2009) and Zha et al. (2000) around 50 GPa pressure, leading to bimodal pdf's. However, the effect of experimental data of Zha et al. (2000), which have a maximum pressure of 55 GPa, decreases towards high pressures as shown by a smaller probability mass associated with them. The effect is more clearly understood when comparing panels (a) and (c) with (b) and (d) in Fig. 3. The latter panels show the pdf's predicted by another MDN trained without the data of Zha et al. (2000).1 Now, at 50 GPa, the width of the pdf is smaller and unimodal, suggesting significant reduction in uncertainty. However, after removing Zha et al. (2000), two different shear modulus trends appear around 25 GPa, leading to a discontinuity (in Fig. 3d). The discontinuity or “softening” of the shear modulus shows that the high-pressure Brillouin-scattering experimental data in polycrystalline material (Murakami et al., 2009) are not compatible with the remaining low-pressure data from Brillouin and ultrasonic measurements on single crystals and polycrystalline samples, respectively.
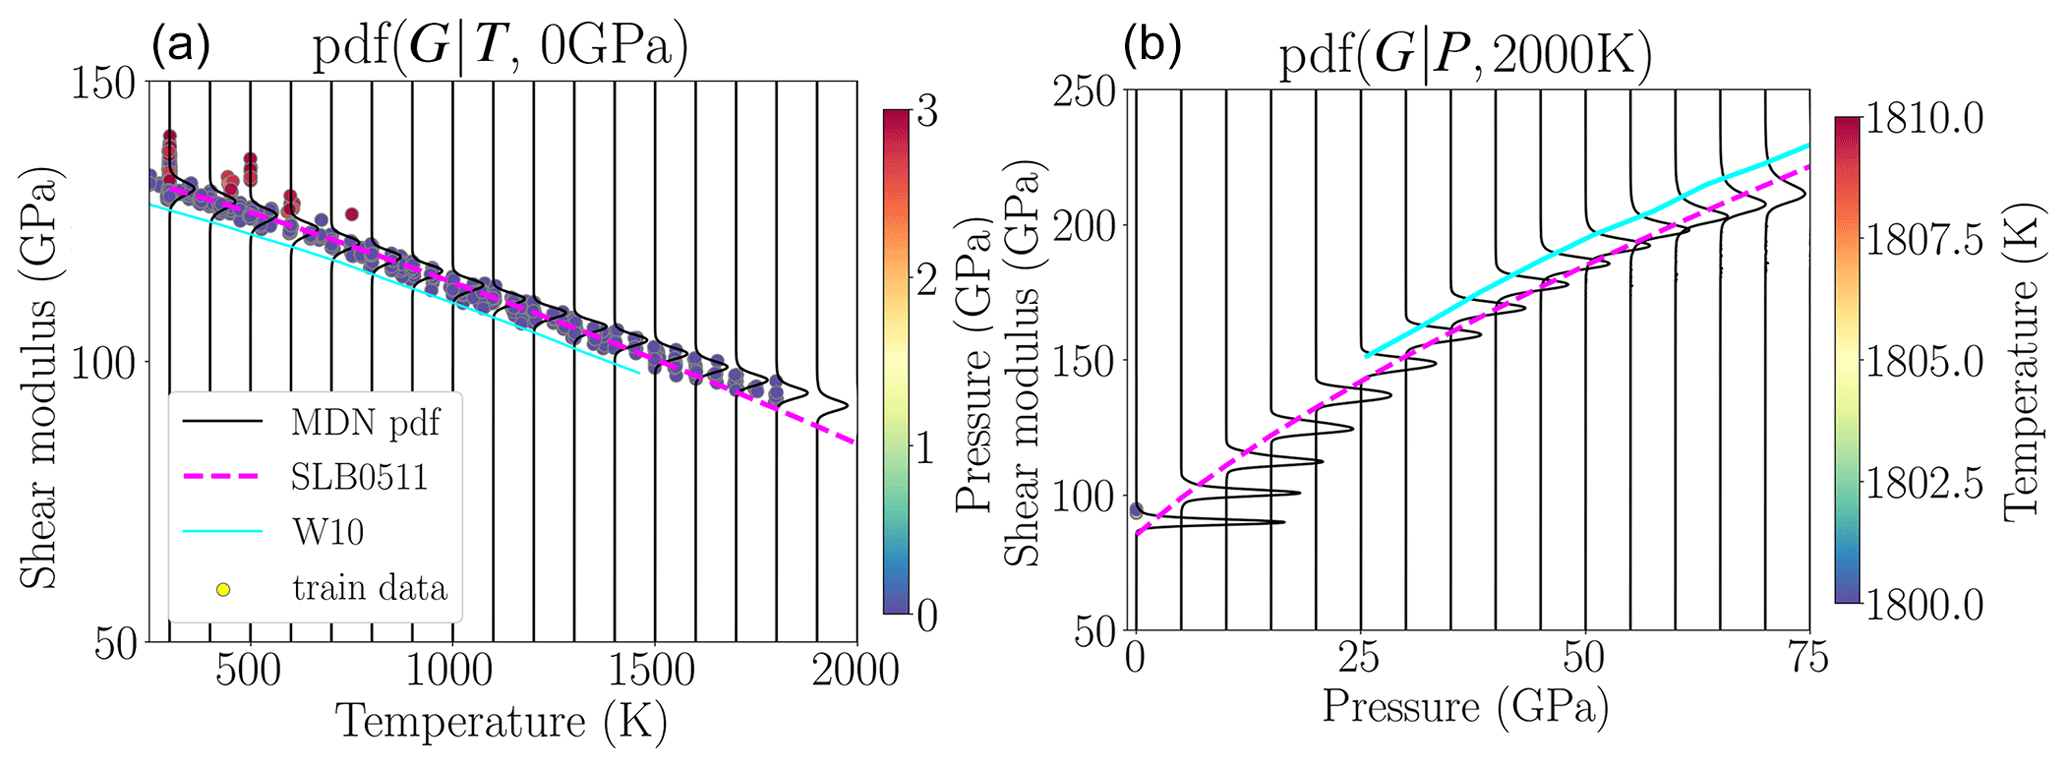
Figure 4Probability density functions for the shear modulus of MgO along a 0 GPa isobar (a) and a 2000 K isotherm (b) compared with Stixrude and Lithgow-Bertelloni (2005, 2011) and Wentzcovitch et al. (2010b). While the former study closely follows the maximum likelihood predicted by neural networks along the isobar, the latter study falls outside the experimental uncertainty range. The predictions from W10 are shown only for pressures and temperatures where the quasiharmonic approximation is valid (Wentzcovitch et al., 2010a). Circles represent a sub-set of the total data whose pressure (or temperature) falls within the range shown in the colour bar on the side panel. Along the 2000 K isotherm, the neural network predictions go beyond the range of the experimental data at high pressure, as reflected in the widening of pdf's when the pressure increases.
Besides ambient temperature, we plot (Fig. 4) one isotherm (2000 K) and an isobar (0 GPa) where comparison with theoretical data of W10 is possible. More isotherms and isobars are shown in Appendix D. The 0 GPa isobar in Fig. 4 shows that the pdf's for the shear modulus are tightly constrained by experimental data at this pressure. The EOS of SLB0511 at low temperature follows the maximum likelihood given by the pdf's. However, at high temperature, it is mostly located on the lower bound of our pdf's. The EOS of W10 falls on the edge or outside of our pdf's, suggesting the theoretical calculations are not fully consistent with experimental measurements. Near 2000 K temperature, there are only a few experimental measurements at low pressure. Thus, our pdf's show increasing uncertainty as the pressure increases. In that region, the MDN is not constrained by currently available experimental data and is forced to extrapolate, which is not advisable. In this study, we plot the shear modulus from W10 only in the region where the quasiharmonic approximation is valid according to Wentzcovitch et al. (2010a). However, more recent studies have shown a complex picture of the limit of quasiharmonic approximation (e.g. Giura et al., 2019; Calandrini et al., 2021), and a detailed discussion on the limit is out of the scope of this study.
We take the density with uncertainties from our previous study on the volumetric properties of MgO (Rijal et al., 2021) to compute shear wave speed from the shear modulus (using uncertainty propagation). In particular, the mean and 1 standard deviation of the shear modulus pdf's of the present study are considered together with those from density pdf's of the previous study. We are aware that one can also directly train a network with P–T–Vs data from different experiments by excluding elastic tensor component measurements which require density to compute shear wave speed. However, excluding these data reduces the available experimental data by about 26 %. Standard deviations of the shear modulus and Vs are shown along different isotherms and an isobar in Fig. 5 together with those of SLB0511 and W10 for comparison. Excluding Zha et al. (2000) (Fig. 5b, d) removes the probability mass associated with smaller shear modulus values, which ultimately decreases the standard deviation at high pressures. The inconsistent shear modulus values between Murakami et al. (2009) and other studies, as mentioned in Sect. 4 and shown in Fig. 3d, affect the shear wave speed as shown by its softening around 25 GPa along the 300 K isotherm in Fig. 5d. Along the 0 GPa isobar, the Vs given by SLB0511 largely agrees with the mean value predicted by neural networks. However, at high temperatures, it falls outside the standard deviation range given by the MDN. The Vs values along other isotherms and isobars are shown in Appendix E.
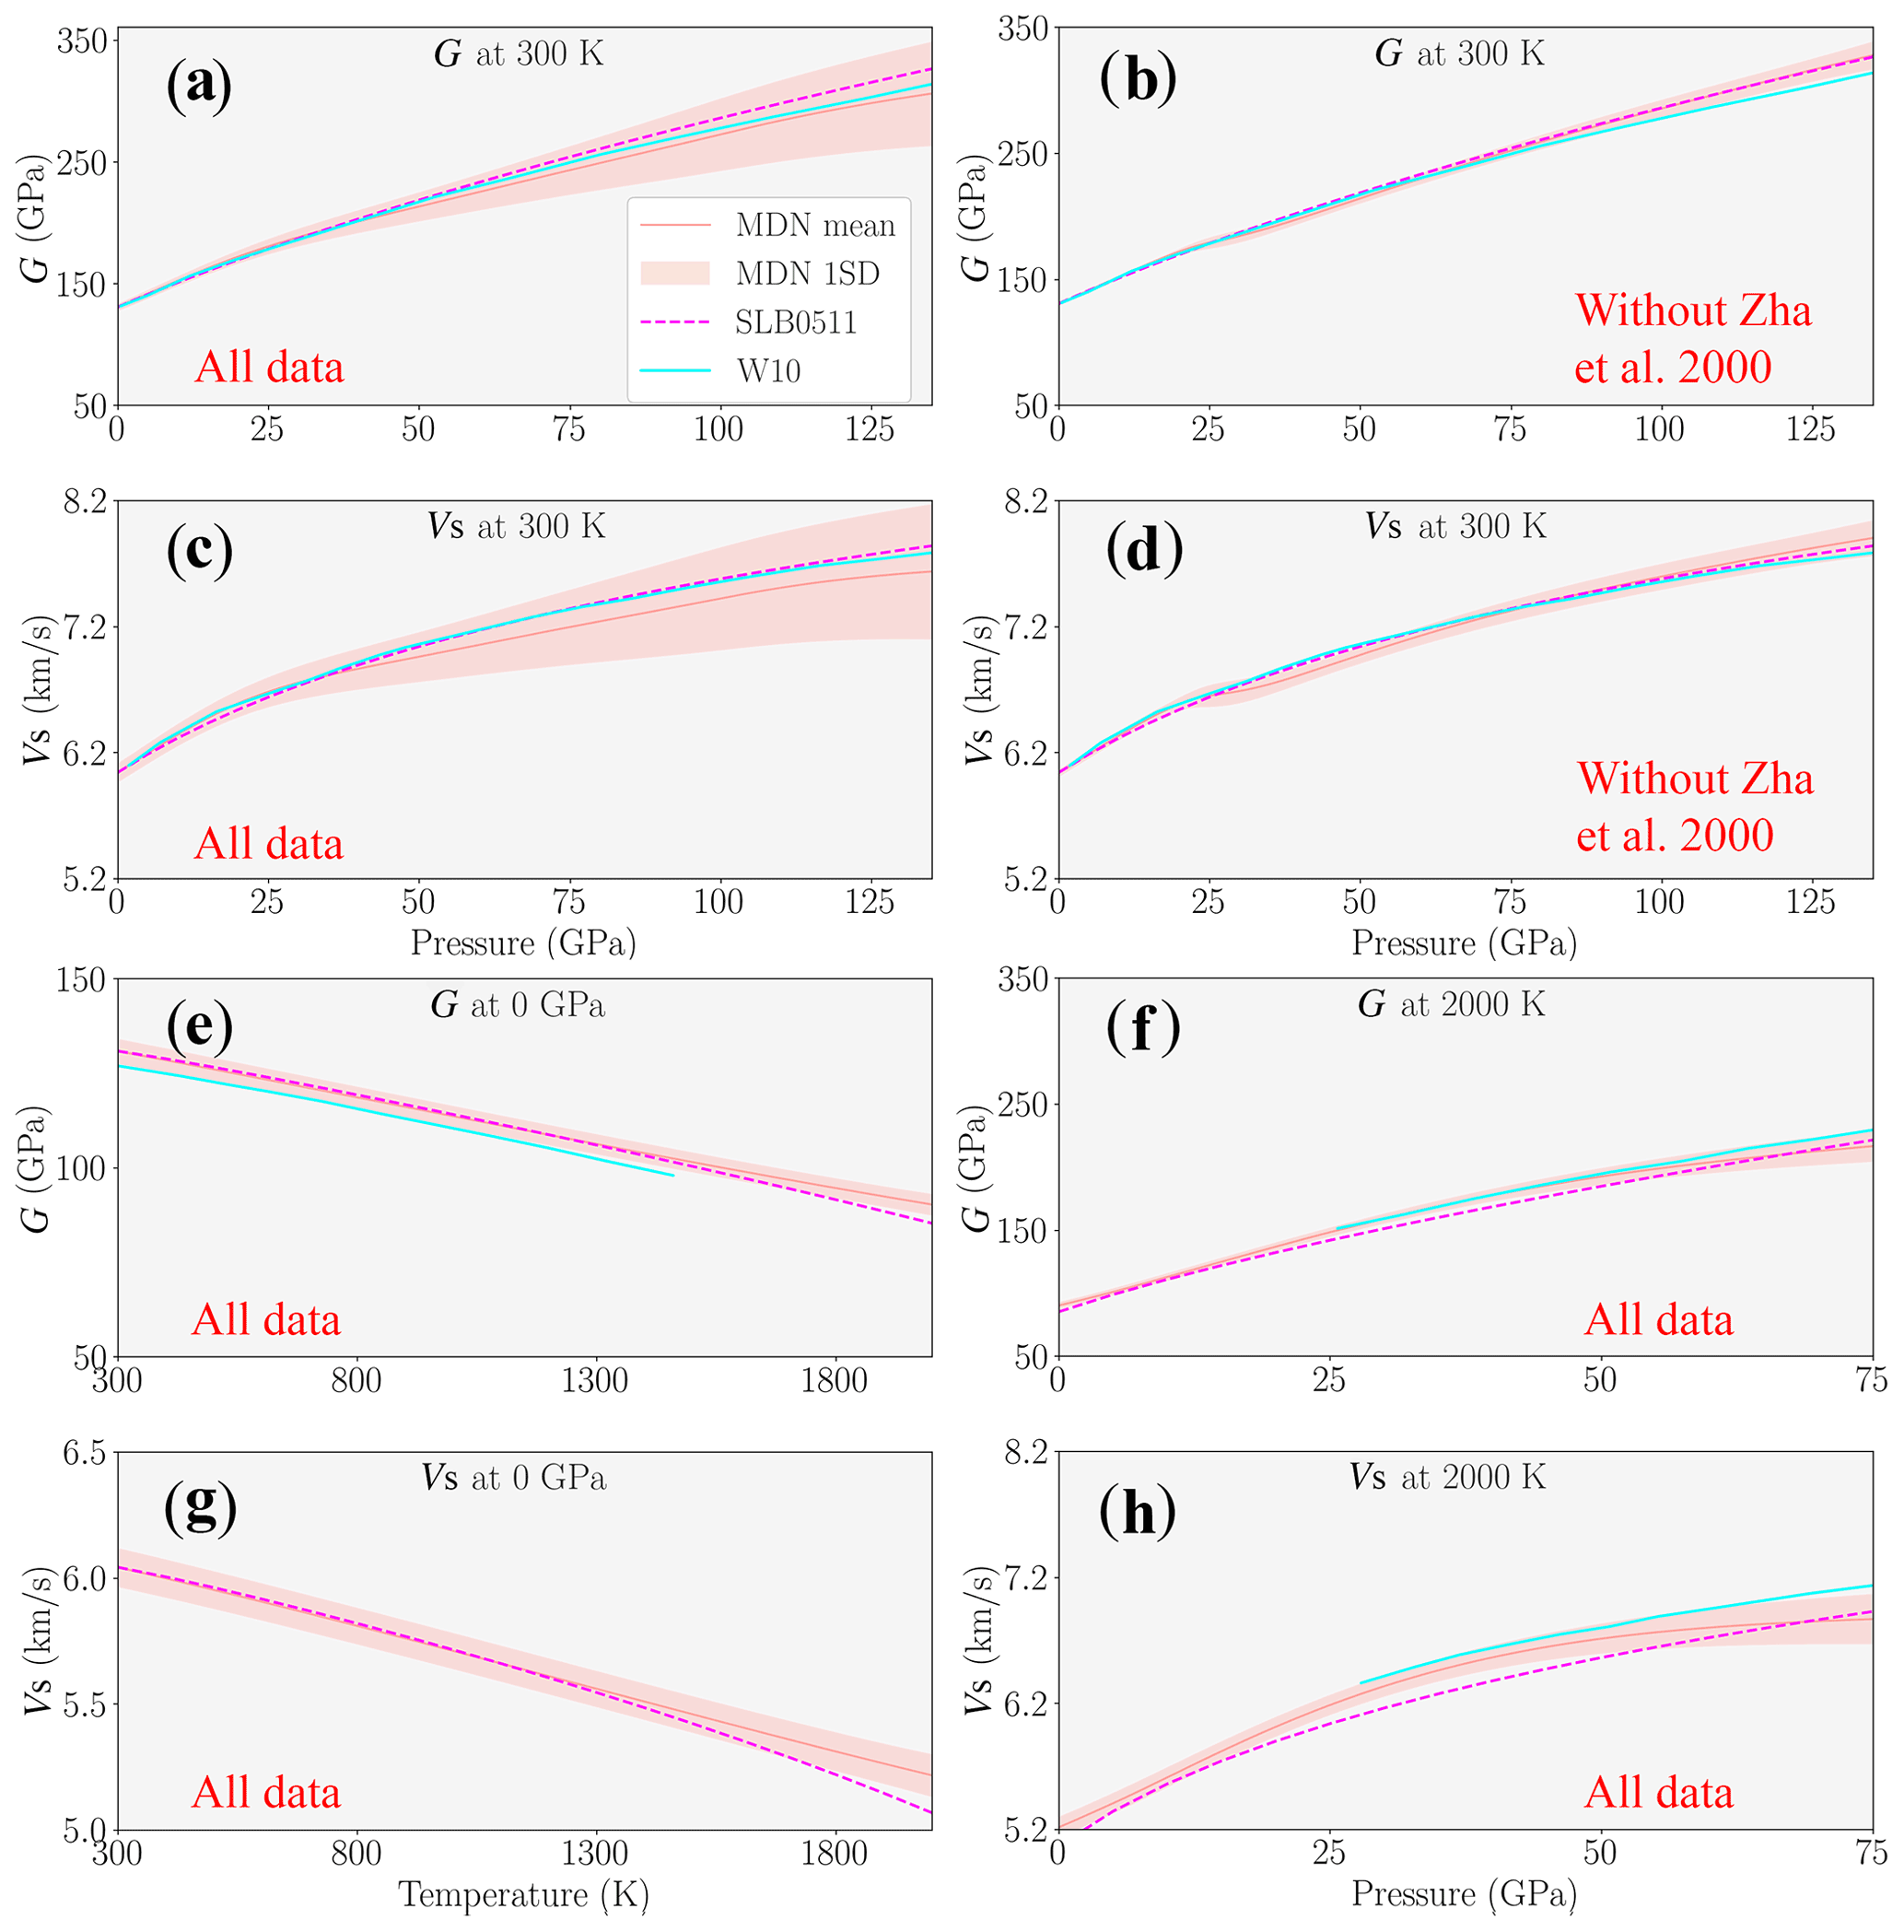
Figure 5Mean and standard deviation (1 SD) of the shear modulus and wave speeds of MgO along 300 and 2000 K isotherms and a 0 GPa isobar. Only (b) and (d) are from the MDN trained without Zha et al. (2000). W10 data are shown only up to the limit where quasiharmonic approximation is valid (Wentzcovitch et al., 2010a). At 300 K, the uncertainties at high pressures are entirely due to Murakami et al. (2009) when excluding Zha et al. (2000). The sudden change in the velocity curvature near 25 GPa is due to inconsistency between data from Murakami et al. (2009) and other studies.
Theoretical computations provide mineral elastic properties across the lower mantle's pressure and temperature conditions (e.g. Karki et al., 1999; Matsui et al., 2000; Wentzcovitch et al., 2010b). However, computations usually report uncertainties to be within a few percent, if reported at all, and accurate experimental measurements are required to benchmark these calculations (Marquardt and Thomson, 2020). On the experimental side, measurements are largely reported at low pressures, mostly below 30 GPa. A finite-strain equation that controls the functional form is thus generally used to handle the extrapolation away from the measured shear moduli. In the absence of further knowledge, it is reasonable to assume a functional form based on, for example, an elasticity theory. But if the MgO's true elastic behaviour is not compatible with this assumption, then we make inadequate predictions about its properties.
The finite-strain equation of Stixrude and Lithgow-Bertelloni (2005, 2011), whose G0 and are constrained by experimental measurements at low pressures, is mostly consistent with the posterior mode given by our MDN. However, it deviates from the maximum likelihood of the pdf's at the pressure range 30 to 65 GPa (Fig. 3b), as well as at pressures larger than 110 GPa (Fig. 3a) along 300 K isotherms. It also diverges at temperatures greater than 1500 K along a 0 GPa isobar (Fig. 4). While the EOS of SLB0511 falls within the pdf predicted by our MDN, the MDN gives a more complete picture of the level of certainty based directly on the data consistency. This in turn enables us to assess the level of confidence we can place on interpretations of seismic data. A more robust comparison of our results with SLB0511 and W10 would require quantification of uncertainties in their predicted shear properties. For that, correlations between fitting parameters are needed, which are not provided in SLB0511. In addition, the residual standard deviation for such an explicit equation would depend on the choice of its mathematical form. Therefore, we proposed a data-driven approach for both approximating functional forms between variables (i.e. equations of state) and quantifying their uncertainties. Theoretical calculations by Karki et al. (1999) report qualitative uncertainties in their calculation that are within a few percent. Taking that into account, W10 would still show a lot of confidence in the low-probability region of the pdf predicted by neural networks, for example along a 0 GPa isobar, along a 300 K isotherm at pressures approaching the core–mantle boundary.
Experiments that are performed on polycrystalline materials (e.g. Murakami et al., 2009) provide an average sample velocity. However, the interpretation of “the average” can be difficult (Marquardt and Thomson, 2020). This is not a problem as far as the bulk modulus of MgO is concerned because for cubic crystals, the common assumptions of uniform stress (i.e. Reuss scheme) and uniform strain (i.e. Voigt scheme) are equivalent. However, this is not the case for the shear modulus. Moreover, the velocity measured in a polycrystalline material is sensitive to grain size, shape and orientation (e.g. Yeheskel et al., 2005; Marquardt et al., 2011; Marquardt and Thomson, 2020). Along a 300 K isotherm, once the data from Zha et al. (2000) are removed, there are only polycrystalline measurements at pressures larger than 25 GPa (Murakami et al., 2009). These measurements clearly show a different trend (Fig. 3d) when compared with the shear modulus determined from other single- and polycrystalline studies at pressure below 25 GPa. Furthermore, including data from Zha et al. (2000) provides a larger standard deviation in the shear modulus which ultimately translates into larger uncertainties in the shear wave speed. For example, at 300 K and at 135 GPa, 1 standard deviation in the shear modulus is approximately ±14 %. Together with about ±1 % density uncertainty (Rijal et al., 2021), the shear wave speed uncertainty is approximately ±7 % under those conditions. This is larger than the shear wave speed variations reported in seismic tomographic models of the lower mantle, although they only capture the long-wavelength structures (e.g. Ishii and Tromp, 1999; Trampert et al., 2004; Simmons et al., 2010; Moulik and Ekström, 2014; French and Romanowicz, 2014; Koelemeijer et al., 2015; Lei et al., 2020). Hence, even at room temperature, current experimental constraints on shear properties of MgO are uncertain at high pressures. However, when data from Zha et al. (2000) are removed, the shear wave speed uncertainty reduces by a factor of approximately 3.5 under the same conditions. This is the case for MgO, which is arguably the best-studied mantle mineral, and it would be worth evaluating the uncertainties for other minerals.
To quantify the uncertainties in shear wave speeds from the MDN-predicted pdf's of the shear modulus and density, we chose a pragmatic approach. We simply extracted the mean and standard deviation from the pdf's. However, one can also take the most probable Gaussian kernel, i.e. the kernel with the largest weight (in Fig. C1). Additionally, similarly to the mean and standard deviation, other moments (Bishop, 1994) of probability density functions can be easily extracted if desired. Besides that, as discussed in Rijal et al. (2021), neural networks show increasing uncertainty if we need to extrapolate substantially outside the prior data range (i.e. training data). SLB0511 and W10 results closely follow the MDN extrapolation (Fig. 4, right panel). However, all the extrapolated pdf's might be heavily dependent on the network architecture, and we therefore advise against extrapolation at pressures above approximately 65 GPa at all temperatures apart from 300 K.
With the MDN approach, we quantify uncertainties in the shear modulus (in Figs. 3 and 4 and Appendix D) with the help of posterior probability density functions. The MDN predicts complete uncertainties from the data with which it is trained – in the sense that it accounts for all experimental errors and uncertainties, interpolation uncertainties including data sparsity and inconsistency, and uncertainties in the inverse problem itself. One can in principle add theoretically computed shear modulus data to the existing experimental data. This would provide additional constraints on the shear properties of MgO, especially in the regions where the experimental measurements are not yet feasible. However, there are regions (Figs. 3, 4 and 5) where the shear modulus uncertainty based on the combined data would likely be larger than those uncertainties based on experiments alone. This is because current theoretical studies fall on the edge or outside of the pdf's from experimental data.
Furthermore, the MDN-based approach can be extended to model material properties that have more complicated dependencies on pressure and temperature, such as the transition from a high- to low-spin state of iron in (Fe,Mg)O ferropericlase. A reduction in the bulk modulus of ferropericlase on transition from the high-spin to low-spin state has been reported by various studies (e.g. Lin et al., 2006; Speziale et al., 2007; Crowhurst et al., 2008; Marquardt et al., 2009; Wentzcovitch et al., 2009). A single finite-strain equation cannot model the high- and low-spin states simultaneously. As a result, some studies (e.g. Fei et al., 2007) have used two such EOSs to fit the high- and the low-spin data of ferropericlase separately, which may not capture its properties in the mixed-spin region. Others have considered the electronic contribution, in addition to the elastic contribution, to the total free energy of a material (Sturhahn et al., 2005; Chen et al., 2012). Although the pressure range of the spin transition is a function of temperature and iron content (e.g. Sturhahn et al., 2005; Lin et al., 2007; Solomatova et al., 2016), it varies between studies (Marquardt et al., 2018). Our neural-network-based approach has an advantage that it does not require a predetermined functional form or a solid solution model to capture material properties across iron spin transition in ferropericlase. By simply appending composition (e.g. mol % Fe) as an extra dimension in the input data, it is in principle straightforward to model such properties, which otherwise would be difficult to represent with finite-strain equations.
-
The shear modulus of MgO is constrained by experiments at low-P and low-T conditions.
-
In general, at low pressures, shear moduli based on an explicit finite-strain equation whose fitting parameters (i.e. G0 and ) are constrained by the same experimental measurements are consistent with the maximum likelihood given by neural networks. However, there are several regions where the finite-strain equation diverges from the pdf predicted by experimental data, mainly under P–T conditions not used to constrain it. In such regions and under P–T conditions where extrapolation is necessary, constraints on the shear modulus are largely based on the functional form of the EOS and not the measurements.
-
Comparisons with MDN-predicted pdf's show that an explicit finite-strain equation represents one possible solution within the range of uncertainties, which is sometimes, although not always, the most likely value of the pdf's.
-
Data-driven approaches identify inconsistent data. Brillouin-scattering experiments on polycrystalline MgO are currently the only available measurement type that span the lower mantle's temperature and pressure conditions. However, these measurements follow a different trend from the remaining low-pressure experimental data from Brillouin scattering on single crystals and ultrasonic measurements on polycrystals. Even at ambient temperature, these different experimental datasets are inconsistent.
-
From a purely data-driven point of view, our pdf's show a large uncertainty in the shear properties of MgO, especially for pressures larger than about 30 GPa.
-
There are P–T regions in the mantle in which shear properties of MgO are constrained neither by training data nor by the test dataset. Hence, we would not recommend extrapolating the shear modulus using MDNs in such regions outside of the prior experimental data.
-
The MDN approach provides realistic estimates of the uncertainties in the pressure–temperature range where measurements have been taken, which should be considered a lower bound if one extrapolates shear elastic properties outside of this region using, for example, a finite-strain formalism. Although the formalism will appear better-constrained, it could potentially be biased as some of our examples have shown in this study.
-
Currently, MgO is the mineral with the most data in the lower mantle. Therefore, one can expect larger uncertainties for other minerals.
Table A1Overview of experimental methods.
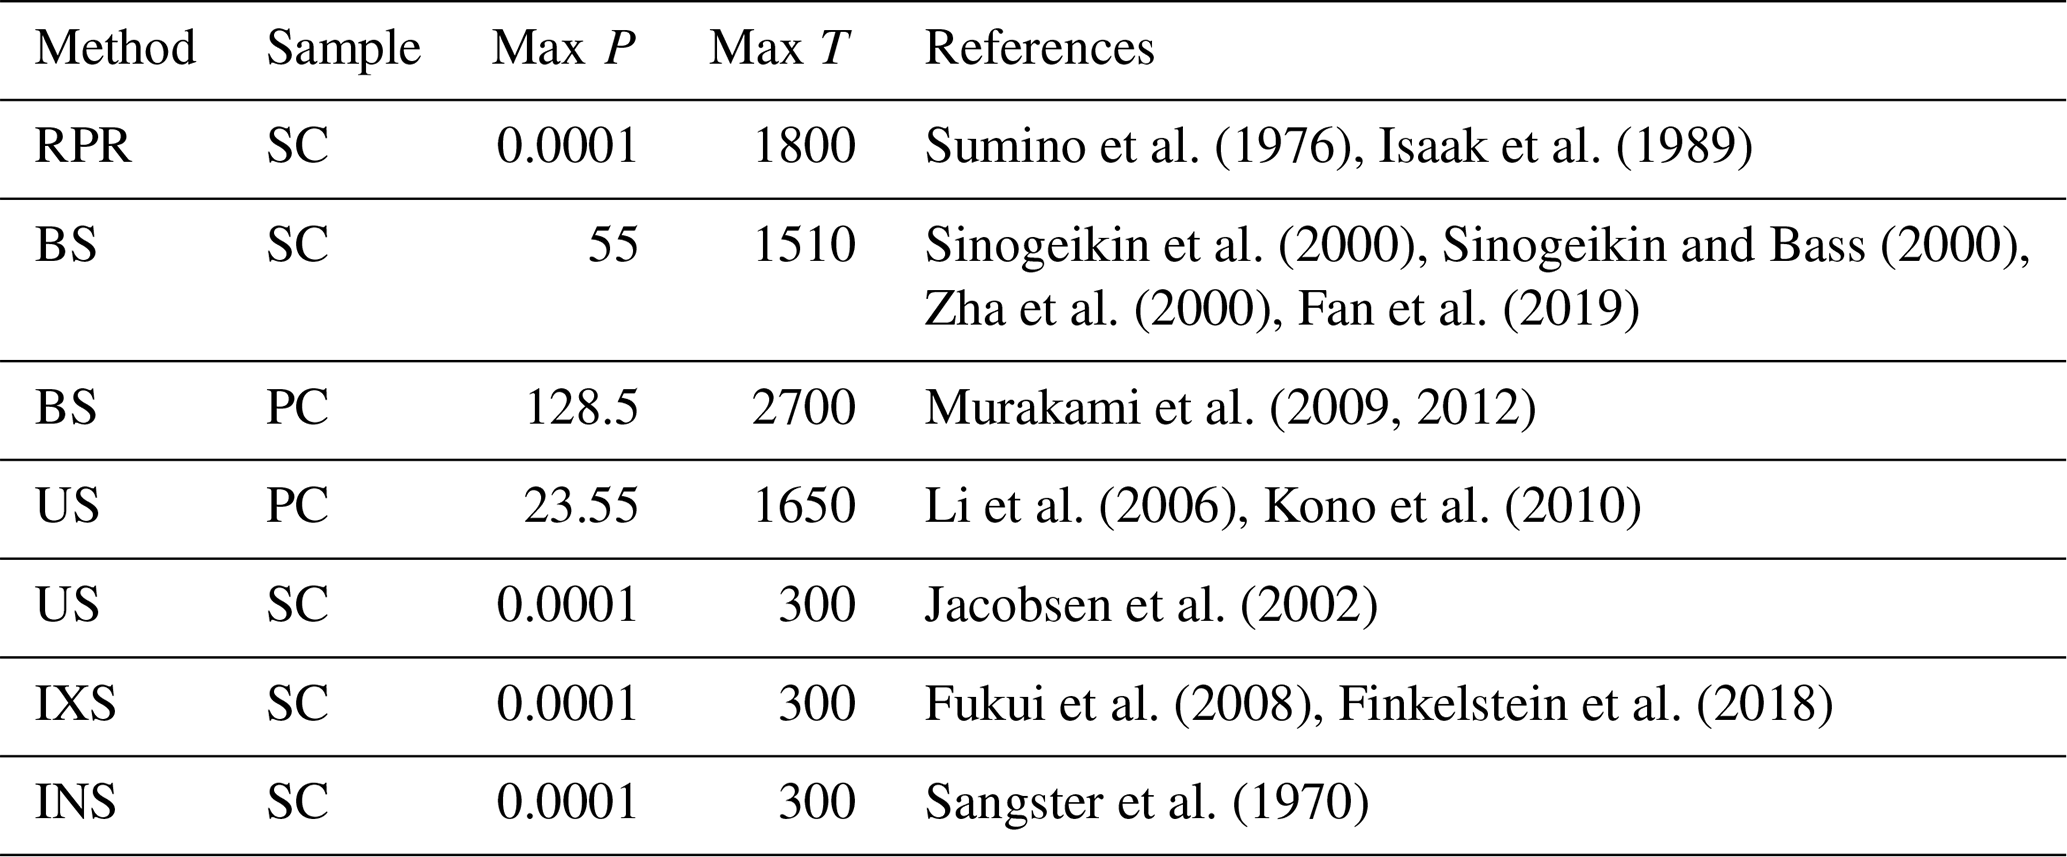
RPR, rectangular parallelepiped resonance; BS, Brillouin scattering; US, ultrasonic spectroscopy; IXS, inelastic X-ray scattering; INS, inelastic neutron scattering; SC, single crystal; PC, polycrystalline; T, temperature (K); P, pressure (GPa).
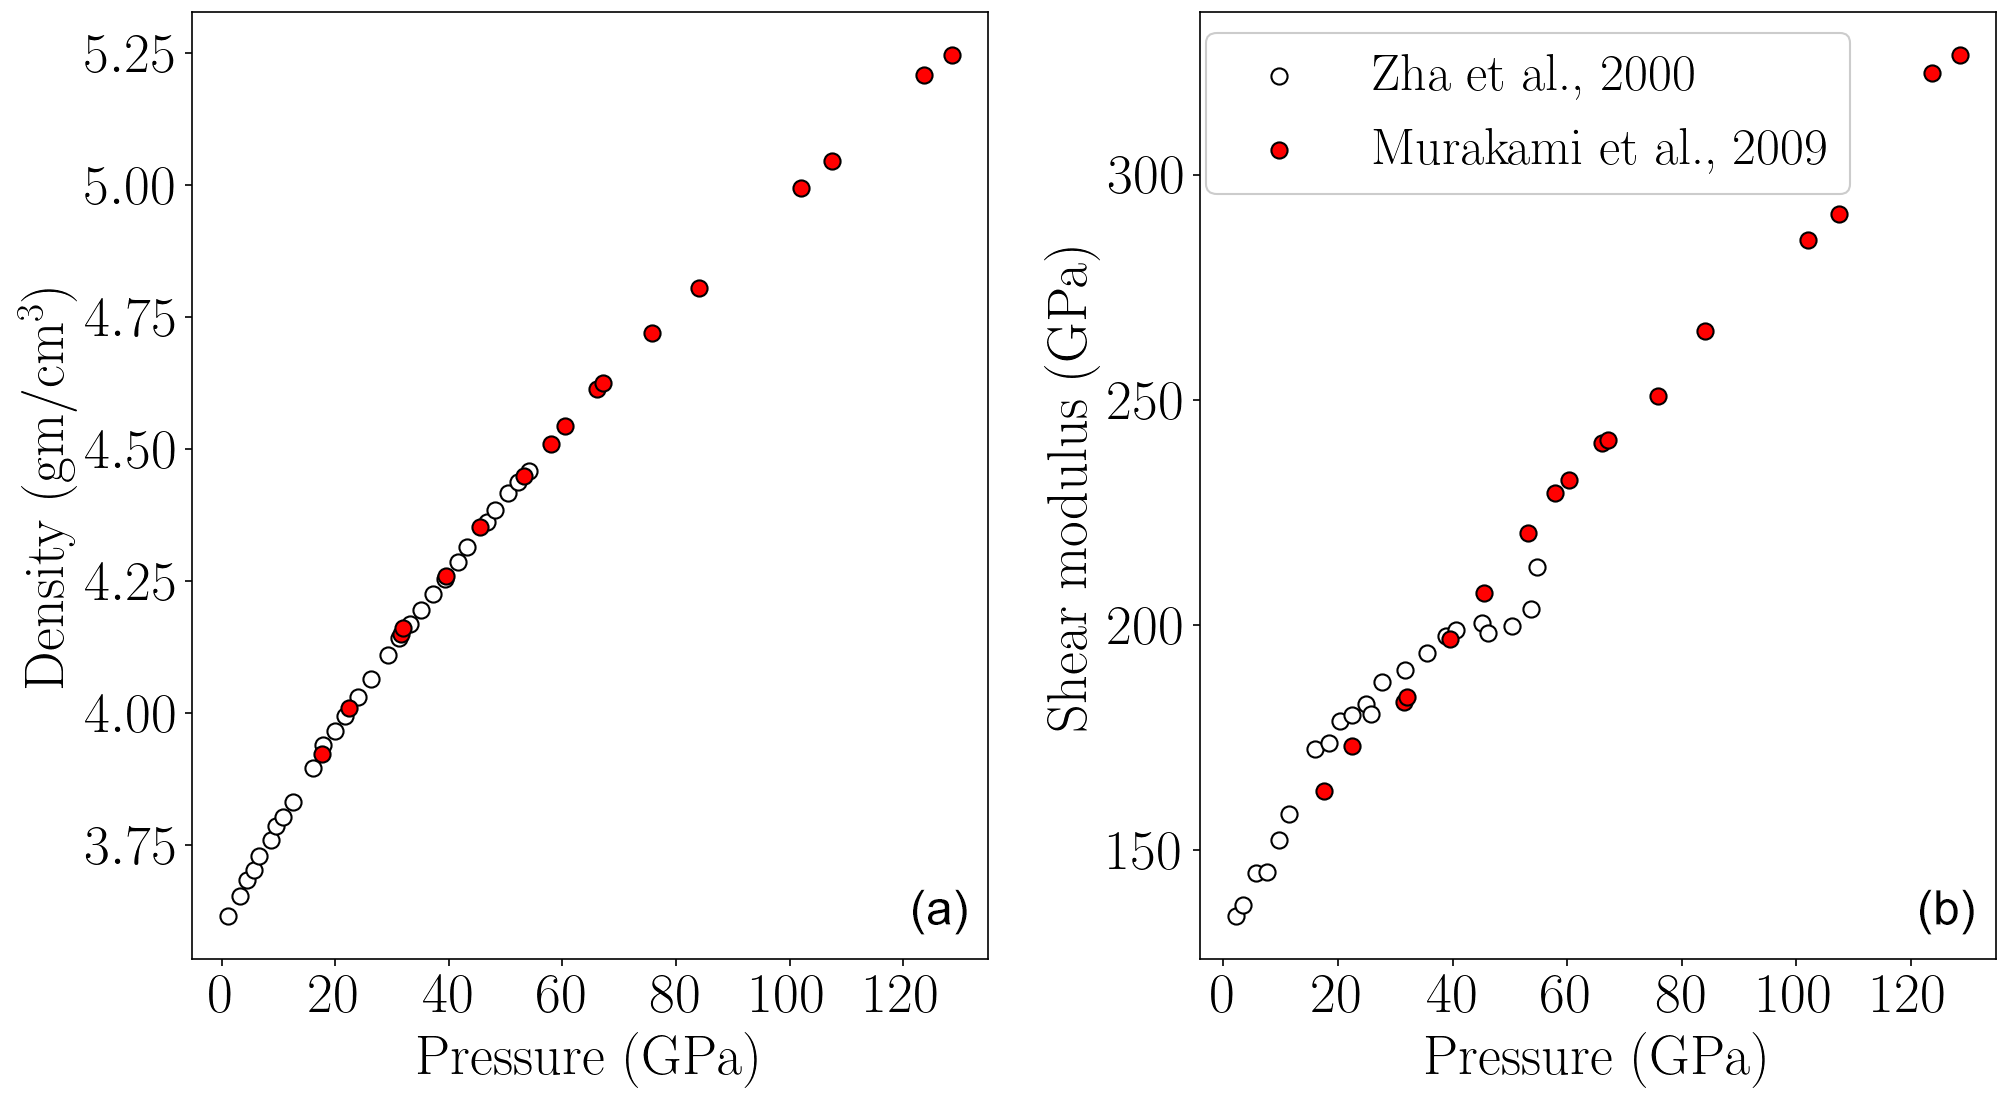
Figure B1(a) Density of MgO. Red circles show density computed using Vs and G measured by Murakami et al. (2009) on polycrystalline samples. White circles show density measured on a polycrystalline sample by Zha et al. (2000). (b) The shear moduli of MgO reported by Murakami et al. (2009) are from velocity measurements on polycrystalline samples, and those given by Zha et al. (2000) are based on single crystals. Whilst the densities between these two studies agree, the shear modulus values are inconsistent.

Figure C1A mixture density network (figure modified after Bishop, 1994; Rijal et al., 2021) to approximate the (c) posterior probability density function for G at a given P and T (inputs). The posterior is approximated using a combination of (a) a conventional two-layer feed-forward neural network and (b) a Gaussian mixture model (GMM) that consists of Gaussian functions. α represents weights and biases of the feed-forward network. hj and yk represent hidden nodes and the outputs of the feed-forward network, respectively. The mean, standard deviation and weight of each Gaussian kernel are computed from yk. Then, a weighted sum of these Gaussians in the GMM approximates an arbitrary posterior probability density function.
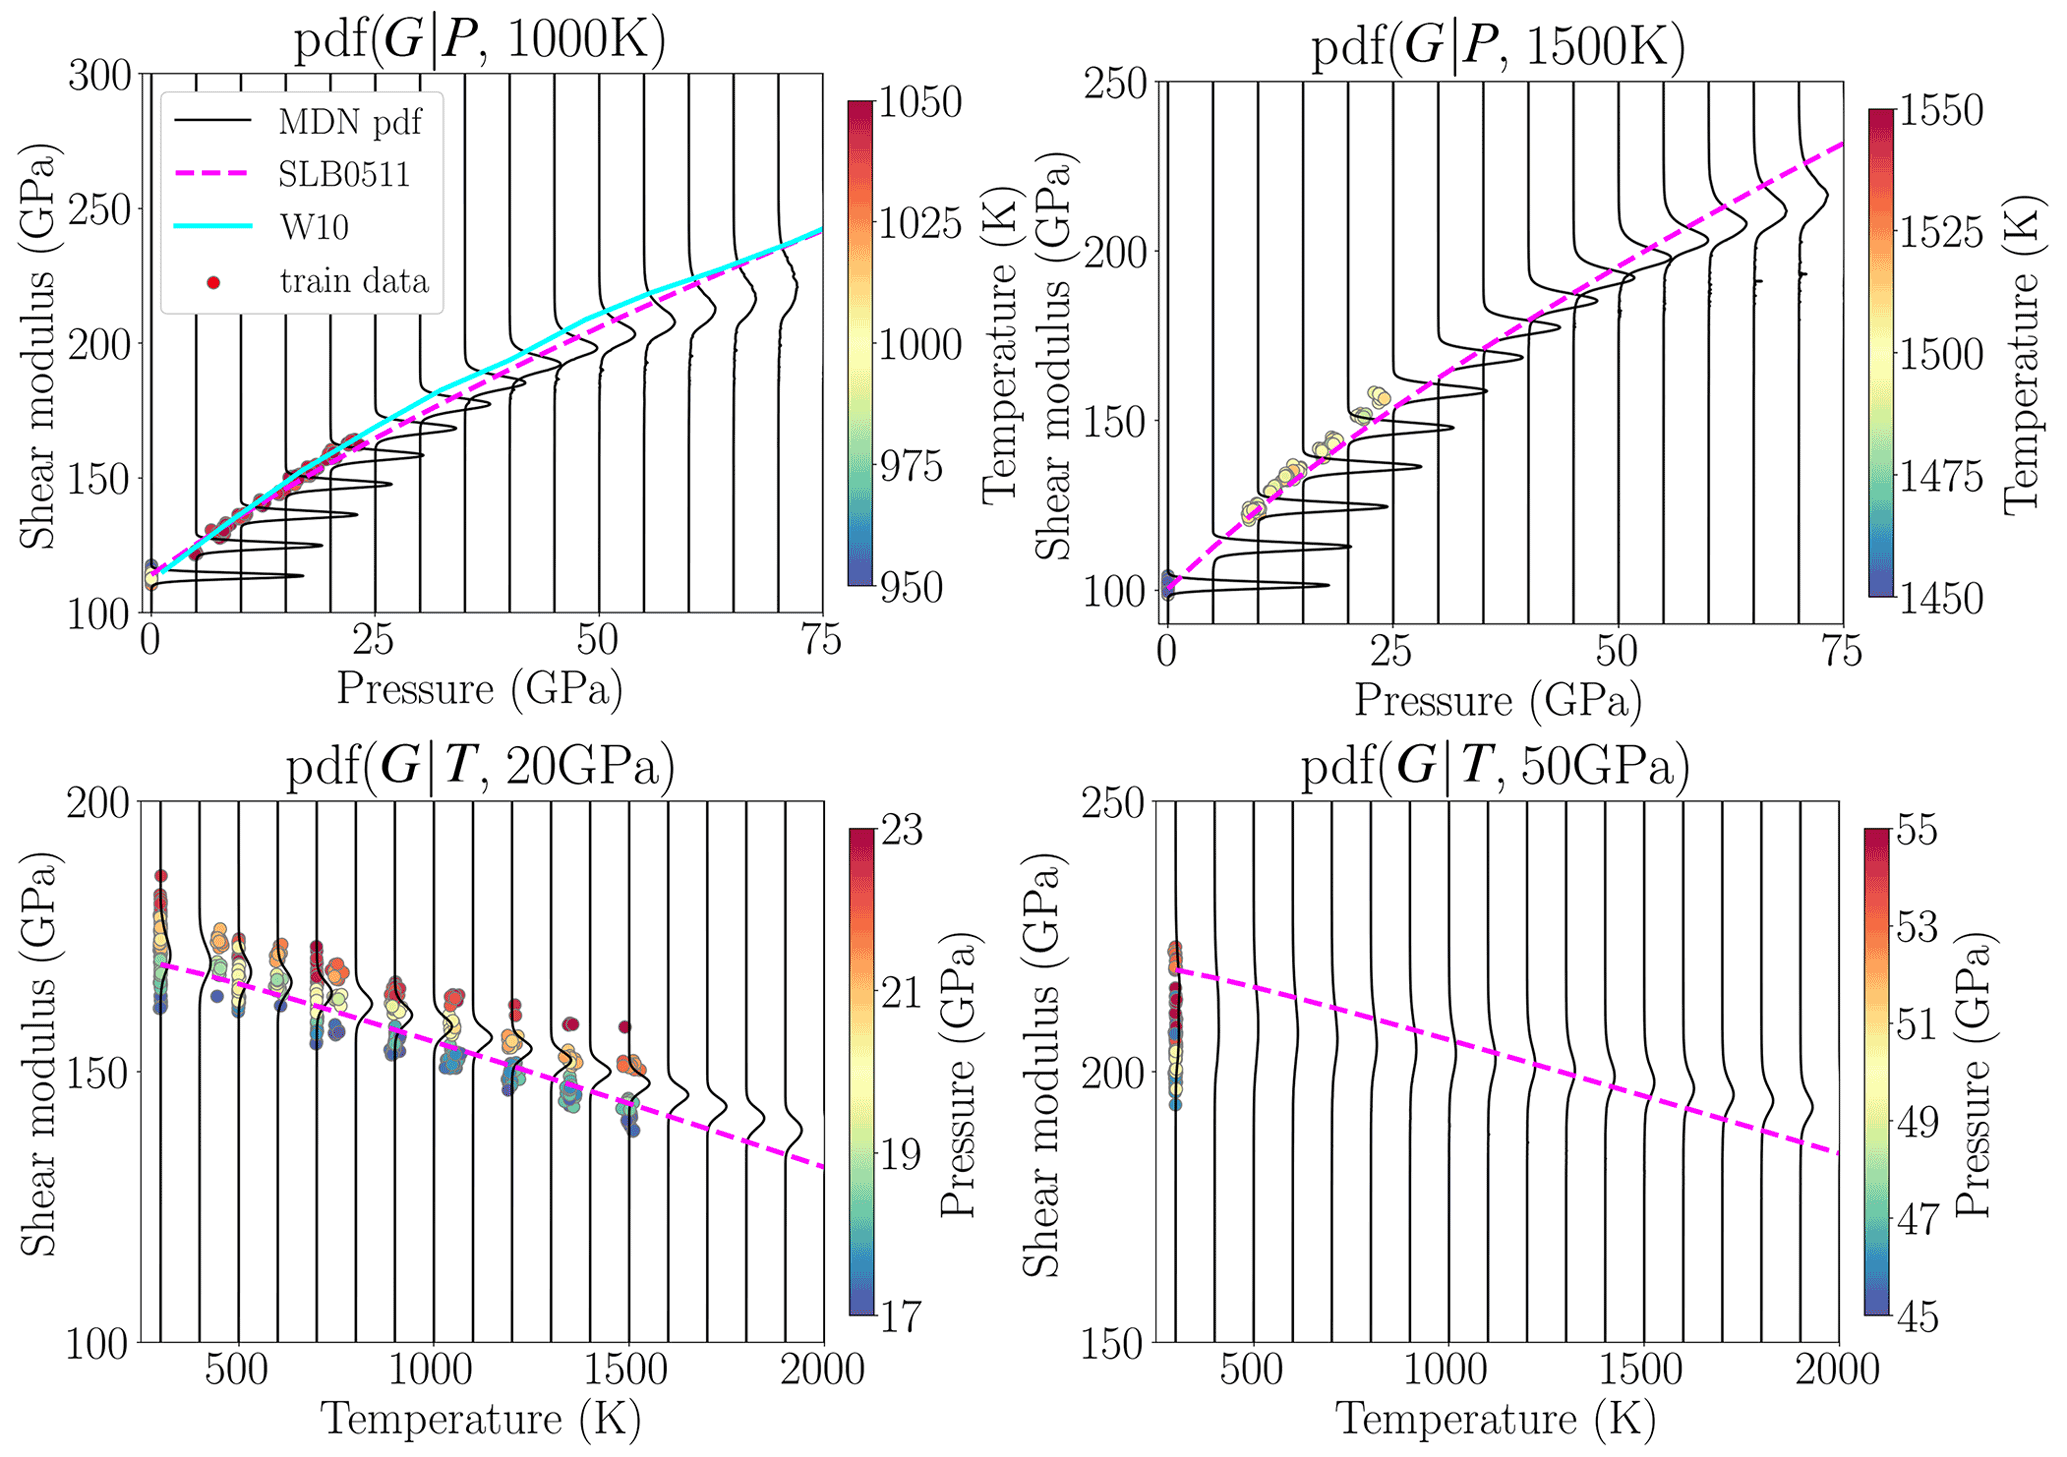
Figure D1P–T–G relationship of MgO predicted by neural networks along 1000 and 1500 K isotherms and 20 and 50 GPa isobars. Previously published studies (Stixrude and Lithgow-Bertelloni, 2005, 2011; Wentzcovitch et al., 2010b) are also shown for comparison. Circles are the data that belong to temperature and pressure ranges shown by colour bars in each panel.
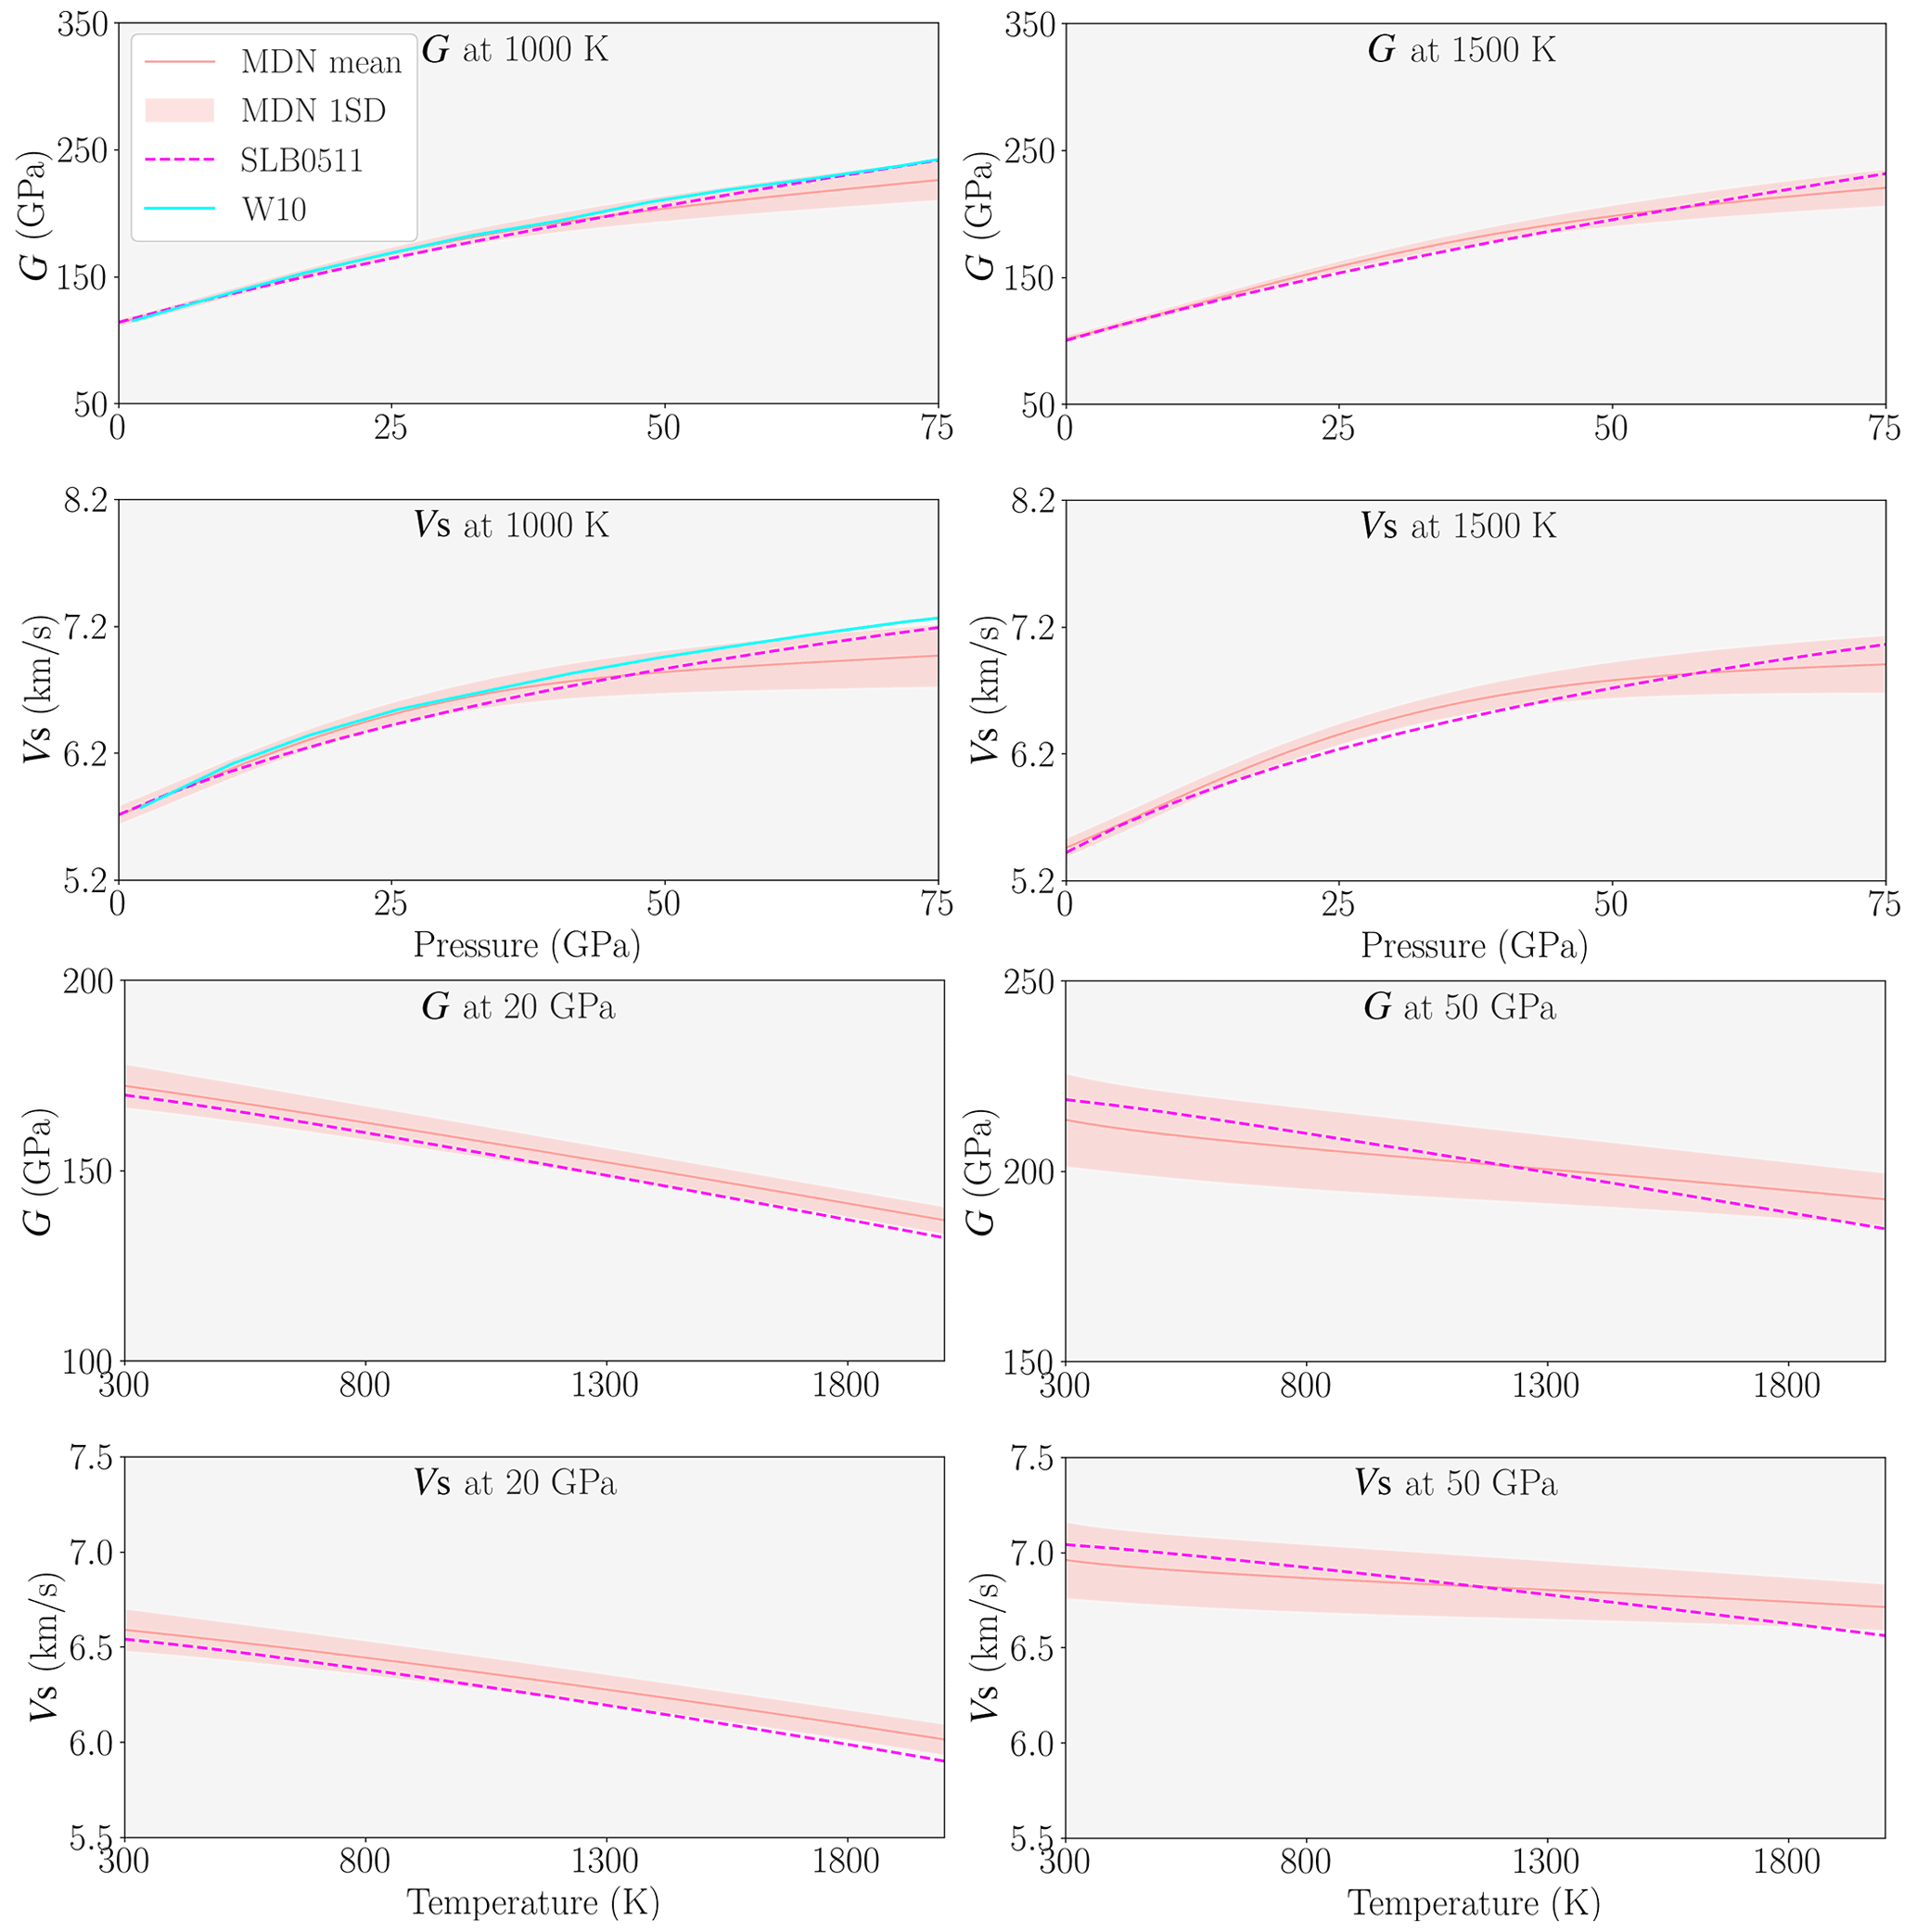
Figure E1P–T–Vs relationship of MgO predicted by neural networks along 1000 and 1500 K isotherms and 20 and 50 GPa isobars. Previously published studies (Stixrude and Lithgow-Bertelloni, 2005, 2011; Wentzcovitch et al., 2010b) are also shown for comparison.
The code used in this paper is freely available by contacting the corresponding author.
The data used in this paper were collected from already published literature which is referenced in the caption of Fig. 1. Nevertheless, the dataset is also available by contacting the corresponding author.
AR contributed in terms of data curation, methodology, software, validation, visualization, formal analysis, investigation, visualization and writing – original draft. LC contributed in terms of conceptualization, supervision, funding acquisition, and writing – review and editing. JT contributed in terms of supervision and writing – review and editing. HM and JMJ contributed in terms of writing – review and editing.
The contact author has declared that none of the authors has any competing interests.
Publisher’s note: Copernicus Publications remains neutral with regard to jurisdictional claims in published maps and institutional affiliations.
We would like to thank the two anonymous reviewers for constructive comments which improved the manuscript. Ashim Rijal and Laura Cobden received funding from the Dutch Research Council (NWO) under grant number 016.Vidi.171.022. Hauke Marquardt acknowledges the support provided through the European Union's Horizon 2020 research and innovation programme (ERC grant 864877). Jennifer M. Jackson is thankful for support of this research by the National Science Foundation's Collaborative Studies of the Earth's Deep Interior (EAR-2009735).
This research has been supported by the Nederlandse Organisatie voor Wetenschappelijk Onderzoek (grant no. 016.Vidi.171.022), Horizon 2020 (DEEP-MAPS (grant no. 864877)) and the National Science Foundation (grant no. EAR-2009735).
This paper was edited by Etienne Balan and Carmen Sanchez-Valle and reviewed by two anonymous referees.
Abadi, M., Agarwal, A., Barham, P., Brevdo, E., Chen, Z., Citro, C., Corrado, G. S., Davis, A., Dean, J., Devin, M., Ghemawat, S., Goodfellow, I., Harp, A., Irving, G., Isard, M., Jia, Y., Jozefowicz, R., Kaiser, L., Kudlur, M., Levenberg, J., Mané, D., Monga, R., Moore, S., Murray, D., Olah, C., Schuster, M., Shlens, J., Steiner, B., Sutskever, I., Talwar, K., Tucker, P., Vanhoucke, V., Vasudevan, V., Viégas, F., Vinyals, O., Warden, P., Wattenberg, M., Wicke, M., Yu, Y., and Zheng, X.: TensorFlow: Large-Scale Machine Learning on Heterogeneous Systems, https://www.tensorflow.org/ (last access: 20 December 2022), 2015. a
Bishop, C. M.: Mixture density networks, Tech. rep., Aston University, Birmingham, https://publications.aston.ac.uk/id/eprint/373/1/NCRG_94_004.pdf (last access: 20 December 2022), 1994. a, b, c
Bishop, C.: Neural Networks for Pattern Recognition, Oxford University Press, 1995. a, b
Calandrini, E., Paulatto, L., Antonangeli, D., He, F., Lobo, R. P. S. M., Capitani, F., Brubach, J.-B., Roy, P., Vincent, L., and Giura, P.: Limits of the quasiharmonic approximation in MgO: Volume dependence of optical modes investigated by infrared reflectivity and ab initio calculations, Phys. Rev. B, 103, 054302, https://doi.org/10.1103/PhysRevB.103.054302, 2021. a
Cammarano, F., Deuss, A., Goes, S., and Giardini, D.: One-dimensional physical reference models for the upper mantle and transition zone: Combining seismic and mineral physics constraints, J. Geophys. Res.-Sol. Ea., 110, B01306, https://doi.org/10.1029/2004JB003272, 2005. a
Chen, B., Jackson, J., Sturhahn, W., Zhang, D., Zhao, J., Wicks, J., and Murphy, C.: Spin crossover equation of state and sound velocities of (Mg0.65Fe0.35)O ferropericlase to 140 GPa, J. Geophys. Res.-Sol. Ea., 117, 8208, https://doi.org/10.1029/2012JB009162, 2012. a
Cobden, L., Goes, S., Ravenna, M., Styles, E., Cammarano, F., Gallagher, K., and Connolly, J. A. D.: Thermochemical interpretation of 1-D seismic data for the lower mantle: The significance of nonadiabatic thermal gradients and compositional heterogeneity, J. Geophys.-Res.-Sol. Ea., 114, B11309, https://doi.org/10.1029/2008JB006262, 2009. a
Cobden, L., Mosca, I., Trampert, J., and Ritsema, J.: On the likelihood of post-perovskite near the core–mantle boundary: A statistical interpretation of seismic observations, Physics of the Earth and Planetary Interiors, 210–211, 21–35, https://doi.org/10.1016/j.pepi.2012.08.007, 2012. a
Crowhurst, J. C., Brown, J. M., Goncharov, A. F., and Jacobsen, S. D.: Elasticity of (Mg,Fe)O Through the Spin Transition of Iron in the Lower Mantle, Science, 319, 451–453, https://doi.org/10.1126/science.1149606, 2008. a
Davies, G. and Dziewonski, A.: Homogeneity and constitution of the earth's lower mantle and outer core, Phys. Earth Planet. In., 10, 336–343, https://doi.org/10.1016/0031-9201(75)90060-6, 1975. a
Deschamps, F. and Trampert, J.: Towards a lower mantle reference temperature and composition, Earth Planet Sc. Lett., 222, 161–175, https://doi.org/10.1016/j.epsl.2004.02.024, 2004. a
de Wit, R. W. L., Valentine, A. P., and Trampert, J.: Bayesian inference of Earth's radial seismic structure from body-wave traveltimes using neural networks, Geophys. J. Int., 195, 408–422, https://doi.org/10.1093/gji/ggt220, 2013. a
Fan, D., Fu, S., Yang, J., Tkachev, S., Prakapenka, V., and Lin, J.-F.: Elasticity of single-crystal periclase at high pressure and temperature: The effect of iron on the elasticity and seismic parameters of ferropericlase in the lower mantle, Am. Mineral., 104, 262–275, https://doi.org/10.2138/am-2019-6656, 2019. a, b, c
Fei, Y., Zhang, L., Corgne, A., Watson, H., Ricolleau, A., Meng, Y., and Prakapenka, V.: Spin transition and equations of state of (Mg, Fe)O solid solutions, Geophys. Res. Lett., 34, L17307, https://doi.org/10.1029/2007GL030712, 2007. a
Finkelstein, G. J., Jackson, J. M., Said, A., Alatas, A., Leu, B. M., Sturhahn, W., and Toellner, T. S.: Strongly Anisotropic Magnesiowüstite in Earth's Lower Mantle, J. Geophys. Res.-Sol. Ea., 123, 4740–4750, https://doi.org/10.1029/2017JB015349, 2018. a, b, c
French, S. W. and Romanowicz, B. A.: Whole-mantle radially anisotropic shear velocity structure from spectral-element waveform tomography, Geophys. J. Int., 199, 1303–1327, https://doi.org/10.1093/gji/ggu334, 2014. a
Fukui, H., Katsura, T., Kuribayashi, T., Matsuzaki, T., Yoneda, A., Ito, E., Kudoh, Y., Tsutsui, S., and Baron, A. Q. R.: Precise determination of elastic constants by high-resolution inelastic X-ray scattering, J. Synchrotron Radiat., 15, 618–623, https://doi.org/10.1107/S0909049508023248, 2008. a, b, c
Giura, P., Paulatto, L., He, F., Lobo, R. P. S. M., Bosak, A., Calandrini, E., Paolasini, L., and Antonangeli, D.: Multiphonon anharmonicity of MgO, Phys. Rev. B, 99, 220304, https://doi.org/10.1103/PhysRevB.99.220304, 2019. a
Isaak, D. G., L., A. O., and Goto, T.: Measured elastic moduli of single-crystal MgO up to 1800 K, Phys. Chem. Miner., 16, 704–713, https://doi.org/10.1007/BF00223321, 1989. a, b, c, d
Ishii, M. and Tromp, J.: Normal-Mode and Free-Air Gravity Constraints on Lateral Variations in Velocity and Density of Earth's Mantle, Science, 285, 1231–1236, https://doi.org/10.1126/science.285.5431.1231, 1999. a
Jackson, I.: Elasticity, composition and temperature of the Earth’s lower mantle: a reappraisal, Geophys. J. Int., 134, 291–311, https://doi.org/10.1046/j.1365-246x.1998.00560.x, 1998. a
Jackson, J. M. and Thomas, C.: Seismic and Mineral Physics Constraints on the D′′ Layer, chap. 8, 193–227, American Geophysical Union (AGU), https://doi.org/10.1002/9781119528609.ch8, 2021. a
Jacobsen, S. D., Reichmann, H.-J., Spetzler, H. A., Mackwell, S. J., Smyth, J. R., Angel, R. J., and McCammon, C. A.: Structure and elasticity of single-crystal (Mg,Fe)O and a new method of generating shear waves for gigahertz ultrasonic interferometry, J. Geophys. Res.-Sol. Ea., 107, ECV 4-1–ECV 4-14, https://doi.org/10.1029/2001JB000490, 2002. a, b
Karki, B. B., Wentzcovitch, R. M., de Gironcoli, S., and Baroni, S.: First-Principles Determination of Elastic Anisotropy and Wave Velocities of MgO at Lower Mantle Conditions, Science, 286, 1705–1707, https://doi.org/10.1126/science.286.5445.1705, 1999. a, b, c
Kennett, B.: Towards constitutive equations for the deep Earth, Phys. Earth Planet. In., 270, 40–45, https://doi.org/10.1016/j.pepi.2017.06.012, 2017. a
Kennett, B.: Towards constitutive equations for the deep Earth II: Shear properties under pressure, Phys. Earth Planet. In., 307, 106558, https://doi.org/10.1016/j.pepi.2020.106558, 2020. a
Khan, A., Connolly, J. A. D., and Taylor, S. R.: Inversion of seismic and geodetic data for the major element chemistry and temperature of the Earth's mantle, J. Geophys. Res.-Sol. Ea., 113, B09308, https://doi.org/10.1029/2007JB005239, 2008. a
Khan, A., Ceylan, S., Driel, M., Giardini, D., Lognonné, P., Samuel, H., Schmerr, N., Stähler, S., Duran, A., Huang, Q., Kim, D., Broquet, A., Charalambous, C., Clinton, J., Davis, P., Drilleau, M., Karakostas, F., Lekic, V., McLennan, S., and Banerdt, W.: Upper mantle structure of Mars from InSight seismic data, Science, 373, 434–438, https://doi.org/10.1126/science.abf2966, 2021. a
Koelemeijer, P., Ritsema, J., Deuss, A., and van Heijst, H.-J.: SP12RTS: a degree-12 model of shear- and compressional-wave velocity for Earth's mantle, Geophys. J. Int., 204, 1024–1039, https://doi.org/10.1093/gji/ggv481, 2015. a
Kono, Y., Irifune, T., Higo, Y., Inoue, T., and Barnhoorn, A.: P-V-T relation of MgO derived by simultaneous elastic wave velocity and in situ X-ray measurements: A new pressure scale for the mantle transition region, Phys. Earth Planet. In., 183, 196–211, https://doi.org/10.1016/j.pepi.2010.03.010, 2010. a, b, c
Lei, W., Ruan, Y., Bozdağ, E., Peter, D., Lefebvre, M., Komatitsch, D., Tromp, J., Hill, J., Podhorszki, N., and Pugmire, D.: Global adjoint tomography—model GLAD-M25, Geophys. J. Int., 223, 1–21, https://doi.org/10.1093/gji/ggaa253, 2020. a
Li, B., Woody, K., and Kung, J.: Elasticity of MgO to 11 GPa with an independent absolute pressure scale: Implications for pressure calibration, J. Geophys. Res.-Sol. Ea., 111, B11206, https://doi.org/10.1029/2005JB004251, 2006. a, b, c
Lin, J.-F., Jacobsen, S. D., Sturhahn, W., Jackson, J. M., Zhao, J., and Yoo, C.-S.: Sound velocities of ferropericlase in the Earth's lower mantle, Geophys. Res. Lett., 33, L22304, https://doi.org/10.1029/2006GL028099, 2006. a
Lin, J.-F., Vankó, G., Jacobsen, S. D., Iota, V., Struzhkin, V. V., Prakapenka, V. B., Kuznetsov, A., and Yoo, C.-S.: Spin Transition Zone in Earth's Lower Mantle, Science, 317, 1740–1743, https://doi.org/10.1126/science.1144997, 2007. a
Marquardt, H. and Thomson, A. R.: Experimental elasticity of Earth’s deep mantle, Nat. Rev. Earth Environ., 1, 455–469, https://doi.org/10.1038/s43017-020-0077-3, 2020. a, b, c, d
Marquardt, H., Speziale, S., Reichmann, H. J., Frost, D. J., and Schilling, F. R.: Single-crystal elasticity of (Mg0.9Fe0.1)O to 81 GPa, Earth Planet. Sc. Lett., 287, 345–352, https://doi.org/10.1016/j.epsl.2009.08.017, 2009. a
Marquardt, H., Gleason, A., Marquardt, K., Speziale, S., Miyagi, L., Neusser, G., Wenk, H.-R., and Jeanloz, R.: Elastic properties of MgO nanocrystals and grain boundaries at high pressures by Brillouin scattering, Phys. Rev. B, 84, 064131, https://doi.org/10.1103/PhysRevB.84.064131, 2011. a
Marquardt, H., Buchen, J., Mendez, A. S. J., Kurnosov, A., Wendt, M., Rothkirch, A., Pennicard, D., and Liermann, H.-P.: Elastic Softening of (Mg0.8Fe0.2)O Ferropericlase Across the Iron Spin Crossover Measured at Seismic Frequencies, Geophys. Res. Lett., 45, 6862–6868, https://doi.org/10.1029/2018GL077982, 2018. a
Matas, J., Bass, J., Ricard, Y., Mattern, E., and Bukowinski, M. S. T.: On the bulk composition of the lower mantle: predictions and limitations from generalized inversion of radial seismic profiles, Geophys. J. Int., 170, 764–780, https://doi.org/10.1111/j.1365-246X.2007.03454.x, 2007. a
Matsui, M., Parker, S. C., and Leslie, M.: The MD simulation of the equation of state of MgO: Application as a pressure calibration standard at high temperature and high pressure, Am. Mineral., 85, 312–316, https://doi.org/10.2138/am-2000-2-308, 2000. a
Mattern, E., Matas, J., Ricard, Y., and Bass, J.: Lower mantle composition and temperature from mineral physics and thermodynamic modelling, Geophys. J. Int., 160, 973–990, https://doi.org/10.1111/j.1365-246X.2004.02549.x, 2005. a
Moulik, P. and Ekström, G.: An anisotropic shear velocity model of the Earth's mantle using normal modes, body waves, surface waves and long-period waveforms, Geophys. J. Int., 199, 1713–1738, https://doi.org/10.1093/gji/ggu356, 2014. a
Murakami, M., Ohishi, Y., Hirao, N., and Hirose, K.: Elasticity of MgO to 130 GPa: Implications for lower mantle mineralogy, Earth Planet. Sc. Lett., 277, 123–129, https://doi.org/10.1016/j.epsl.2008.10.010, 2009. a, b, c, d, e, f, g, h, i, j, k, l, m, n, o, p
Murakami, M., Ohishi, Y., Hirao, N., and Hirose, K.: A perovskitic lower mantle inferred from high-pressure, high-temperature sound velocity data, Nature, 485, 90–94, https://doi.org/10.1038/nature11004, 2012. a, b, c, d
Ohno, I.: FREE VIBRATION OF A RECTANGULAR PARALLELEPIPED CRYSTAL AND ITS APPLICATION TO DETERMINATION OF ELASTIC CONSTANTS OF ORTHORHOMBIC CRYSTALS, J. Phys. Earth, 24, 355–379, https://doi.org/10.4294/jpe1952.24.355, 1976. a
Rijal, A., Cobden, L., Trampert, J., Jackson, J. M., and Valentine, A.: Inferring material properties of the lower mantle minerals using Mixture Density Networks, Phys. Earth Planet. In., 319, 106784, https://doi.org/10.1016/j.pepi.2021.106784, 2021. a, b, c, d, e, f, g
Sangster, M. J. L., Peckham, G., and Saunderson, D. H.: Lattice dynamics of magnesium oxide, J. Phys. C, 3, 1026–1036, https://doi.org/10.1088/0022-3719/3/5/017, 1970. a, b, c
Simmons, N. A., Forte, A. M., Boschi, L., and Grand, S. P.: GyPSuM: A joint tomographic model of mantle density and seismic wave speeds, J. Geophys. Res.-Sol. Ea., 115, B12310, https://doi.org/10.1029/2010JB007631, 2010. a
Sinogeikin, S. V. and Bass, J. D.: Single-crystal elasticity of pyrope and MgO to 20 GPa by Brillouin scattering in the diamond cell, Phys. Earth Planet. In., 120, 43–62, https://doi.org/10.1016/S0031-9201(00)00143-6, 2000. a, b, c, d, e
Sinogeikin, S. V., Jackson, J. M., O'Neill, B., Palko, J. W., and Bass, J. D.: Compact high-temperature cell for Brillouin scattering measurements, Rev. Sci. Instrum., 71, 201–206, https://doi.org/10.1063/1.1150183, 2000. a, b, c, d
Solomatova, N., Jackson, J., Sturhahn, W., Wicks, J., Zhao, J., Toellner, T., Kalkan, B., and Steinhardt, W.: Equation of state and spin crossover of (Mg,Fe)O at high pressure, with implications for explaining topographic relief at the core-mantle boundary, Am. Mineral., 101, 1084–1093, https://doi.org/10.2138/am-2016-5510, 2016. a
Speziale, S., Lee, V. E., Clark, S. M., Lin, J. F., Pasternak, M. P., and Jeanloz, R.: Effects of Fe spin transition on the elasticity of (Mg, Fe)O magnesiowüstites and implications for the seismological properties of the Earth's lower mantle, J. Geophys. Res.-Sol. Ea., 112, B10212, https://doi.org/10.1029/2006JB004730, 2007. a
Stacey, F. D.: Theory of thermal and elastic properties of the lower mantle and core, Phys. Earth Planet. In., 89, 219–245, https://doi.org/10.1016/0031-9201(94)03005-4, 1995. a
Stixrude, L. and Lithgow-Bertelloni, C.: Thermodynamics of mantle minerals – I. Physical properties, Geophys. J. Int., 162, 610–632, https://doi.org/10.1111/j.1365-246X.2005.02642.x, 2005. a, b, c, d, e, f, g
Stixrude, L. and Lithgow-Bertelloni, C.: Thermodynamics of mantle minerals – II. Phase equilibria, Geophys. J. Int., 184, 1180–1213, https://doi.org/10.1111/j.1365-246X.2010.04890.x, 2011. a, b, c, d, e, f
Sturhahn, W., Jackson, J. M., and Lin, J.-F.: The spin state of iron in minerals of Earth's lower mantle, Geophys. Res. Lett., 32, https://doi.org/10.1029/2005GL022802, 2005. a, b
Sumino, Y., Ohno, I., Goto, T., and Kumazawa, M.: MEASUREMENT OF ELASTIC CONSTANTS AND INTERNAL FRICTIONS ON SINGLE-CRYSTAL MgO BY RECTANGULAR PARALLELEPIPED RESONANCE, J. Phys. Earth, 24, 263–273, https://doi.org/10.4294/jpe1952.24.263, 1976. a, b
Sumino, Y., Anderson, O. L., and Suzuki, I.: Temperature coefficients of elastic constants of single crystal MgO between 80 and 1,300 K, Phys. Chem. Miner., 9, 38–47, https://doi.org/10.1007/BF00309468, 1983. a, b
Trampert, J., Vacher, P., and Vlaar, N.: Sensitivities of seismic velocities to temperature, pressure and composition in the lower mantle, Phys. Earth Planet. In., 124, 255–267, https://doi.org/10.1016/S0031-9201(01)00201-1, 2001. a
Trampert, J., Deschamps, F., Resovsky, J., and Yuen, D.: Probabilistic Tomography Maps Chemical Heterogeneities Throughout the Lower Mantle, Science, 306, 853–856, https://doi.org/10.1126/science.1101996, 2004. a
Wentzcovitch, R. M., Karki, B. B., Cococcioni, M., and de Gironcoli, S.: Thermoelastic Properties of MgSiO3-Perovskite: Insights on the Nature of the Earth's Lower Mantle, Phys. Rev. Lett., 92, 018501, https://doi.org/10.1103/PhysRevLett.92.018501, 2004. a
Wentzcovitch, R. M., Justo, J. F., Wu, Z., da Silva, C. R. S., Yuen, D. A., and Kohlstedt, D.: Anomalous compressibility of ferropericlase throughout the iron spin cross-over, P. Natl. Acad. Sci. USA, 106, 8447–8452, https://doi.org/10.1073/pnas.0812150106, 2009. a
Wentzcovitch, R., Yu, Y., and Wu, Z.: Thermodynamic Properties and Phase Relations in Mantle Minerals Investigated by First Principles Quasiharmonic Theory, Rev. Mineral. Geochem., 71, 59–98, https://doi.org/10.2138/rmg.2010.71.4, 2010a. a, b, c
Wentzcovitch, R. M., Wu, Z., and Carrier, P.: First Principles Quasiharmonic Thermoelasticity of Mantle Minerals, Rev. Mineral. Geochem., 71, 99–128, https://doi.org/10.2138/rmg.2010.71.5, 2010b. a, b, c, d, e, f
Yeheskel, O., Chaim, R., Shen, Z., and Nygren, M.: Elastic moduli of grain boundaries in nanocrystalline MgO ceramics, J. Mater. Res., 20, 719–725, https://doi.org/10.1557/JMR.2005.0094, 2005. a
Zha, C.-S., Mao, H.-K., and Hemley, R. J.: Elasticity of MgO and a primary pressure scale to 55 GPa, P. Natl. Acad. Sci. USA, 97, 13494–13499, https://doi.org/10.1073/pnas.240466697, 2000. a, b, c, d, e, f, g, h, i, j, k, l, m, n, o, p, q, r, s, t
Note that unless explicitly mentioned, to prepare the plots shown in this paper, we use the network trained with all data (i.e. including Zha et al., 2000).
- Abstract
- Introduction
- MgO shear modulus data
- Methodology
- P–T–G relationship
- P–T–Vs relationship
- Discussion
- Conclusions
- Appendix A
- Appendix B: Density and shear modulus of polycrystalline MgO
- Appendix C: Architecture of the mixture density network
- Appendix D: P–T–G
- Appendix E: P–T–Vs
- Code availability
- Data availability
- Author contributions
- Competing interests
- Disclaimer
- Acknowledgements
- Financial support
- Review statement
- References