the Creative Commons Attribution 4.0 License.
the Creative Commons Attribution 4.0 License.
 | 06 Apr 2023
Optimal Raman-scattering signal for estimating the Fe3+ content on the clinozoisite–epidote join
Mariko Nagashima
Boriana Mihailova
To provide a tool for fast estimation of the Fe3+ content in Ca2(Al, Fe3+)3Si3O12(OH) epidote grains, including in thin sections and crude-rock samples, we applied Raman spectroscopy to 33 areas from 15 natural samples with Fe3+ ranging from 0.22 to 1.13 atoms per formula unit (apfu), the chemistry of which was independently determined by wavelength-dispersive electron microprobe analysis (WD-EPMA). The Raman spectra were collected from the very areas subjected to WD-EPMA. We have analysed both the OH-stretching region (3215–3615 cm−1) and the spectral range generated by the framework vibrations (15–1215 cm−1). Similarly to the IR spectra, the Raman peaks in the OH-stretching region shift toward higher wavenumbers with increasing Fe. However, the quantification of Fe3+ based on OH-stretching Raman peaks can be hindered by the multicomponent overlapping and significant intensity variations with the crystal orientation. Among the Raman signals generated by framework vibrations, the position of four peaks (near 250, 570, 600, and 1090 cm−1) exhibit a steady linear regression with the increase in Fe content (in apfu). However, the peak near 250 cm−1 attributed to MO6 vibrations also depends on the crystal orientation and therefore is not always well resolved, which worsens the accuracy in Fe-content determination based on its position. The peaks near 570, 600, and 1090 cm−1 arise from Si2O7 vibrational modes, and although their intensities also vary with the crystal orientation, all three signals are well resolved in a random orientation. However, among the three Si2O7-related signals, the 570 cm−1 peak is the sharpest (peak width <10 cm−1) and is easily recognized as a separate peak. Hence, we propose to use the position of this peak as a highly reliable parameter to estimate the Fe content, via the linear trend given as , where ω is the wavenumber (cm−1) and x is Fe content (apfu), with accuracy ± 0.04 Fe3+ apfu. The peaks near 600 and 1090 cm−1 may be complementarily used for the Fe estimate, based on the following relations: and . Analyses of the effect of Sr as a substitution for Ca and Cr at the octahedral sites indicate that contents of Sr <0.12 apfu do not interfere with the quantification of Fe via the ω570 (x) relation, whereas Cr >0.16 apfu leads to overestimation of Fe; Cr presence can be recognized however by the broadening of the peaks near 95 and 250 cm−1.
- Article
(11390 KB) - Full-text XML
-
Supplement
(1052 KB) - BibTeX
- EndNote


Epidote-supergroup minerals are soro-/nesosilicates, having monoclinic symmetry (P21/m) and the structural formula A1A2M1M2M3[Si2O7][SiO4](O,F)(OH,O) (Fig. 1), with M2 entirely occupied by Al and A1 by Ca. Based on the cationic-site occupancies, this supergroup is divided into three major groups: the epidote, allanite, and dollaseite groups (Armbruster et al., 2006; Mills et al., 2009). The epidote group is the most abundant one. It differs from the other two groups by having divalent cations at the A2 site (most commonly Ca) and trivalent cations, such as Al, Fe3+, and Mn3+, at the M1 and M3 sites. Since among the three octahedrally coordinate sites M1, M2, and M3, the M3O6 octahedron is the largest in volume and most distorted (Fig. 1), trivalent transition elements, such as Fe3+, preferentially occupy M3, although they may partially substitute for M1Al even before entirely filling M3 (e.g. Dollase, 1969, 1971, 1973; Giuli et al., 1999; Langer et al., 2002; Nagashima and Akasaka, 2004, 2010; Nagashima et al., 2009, 2019).
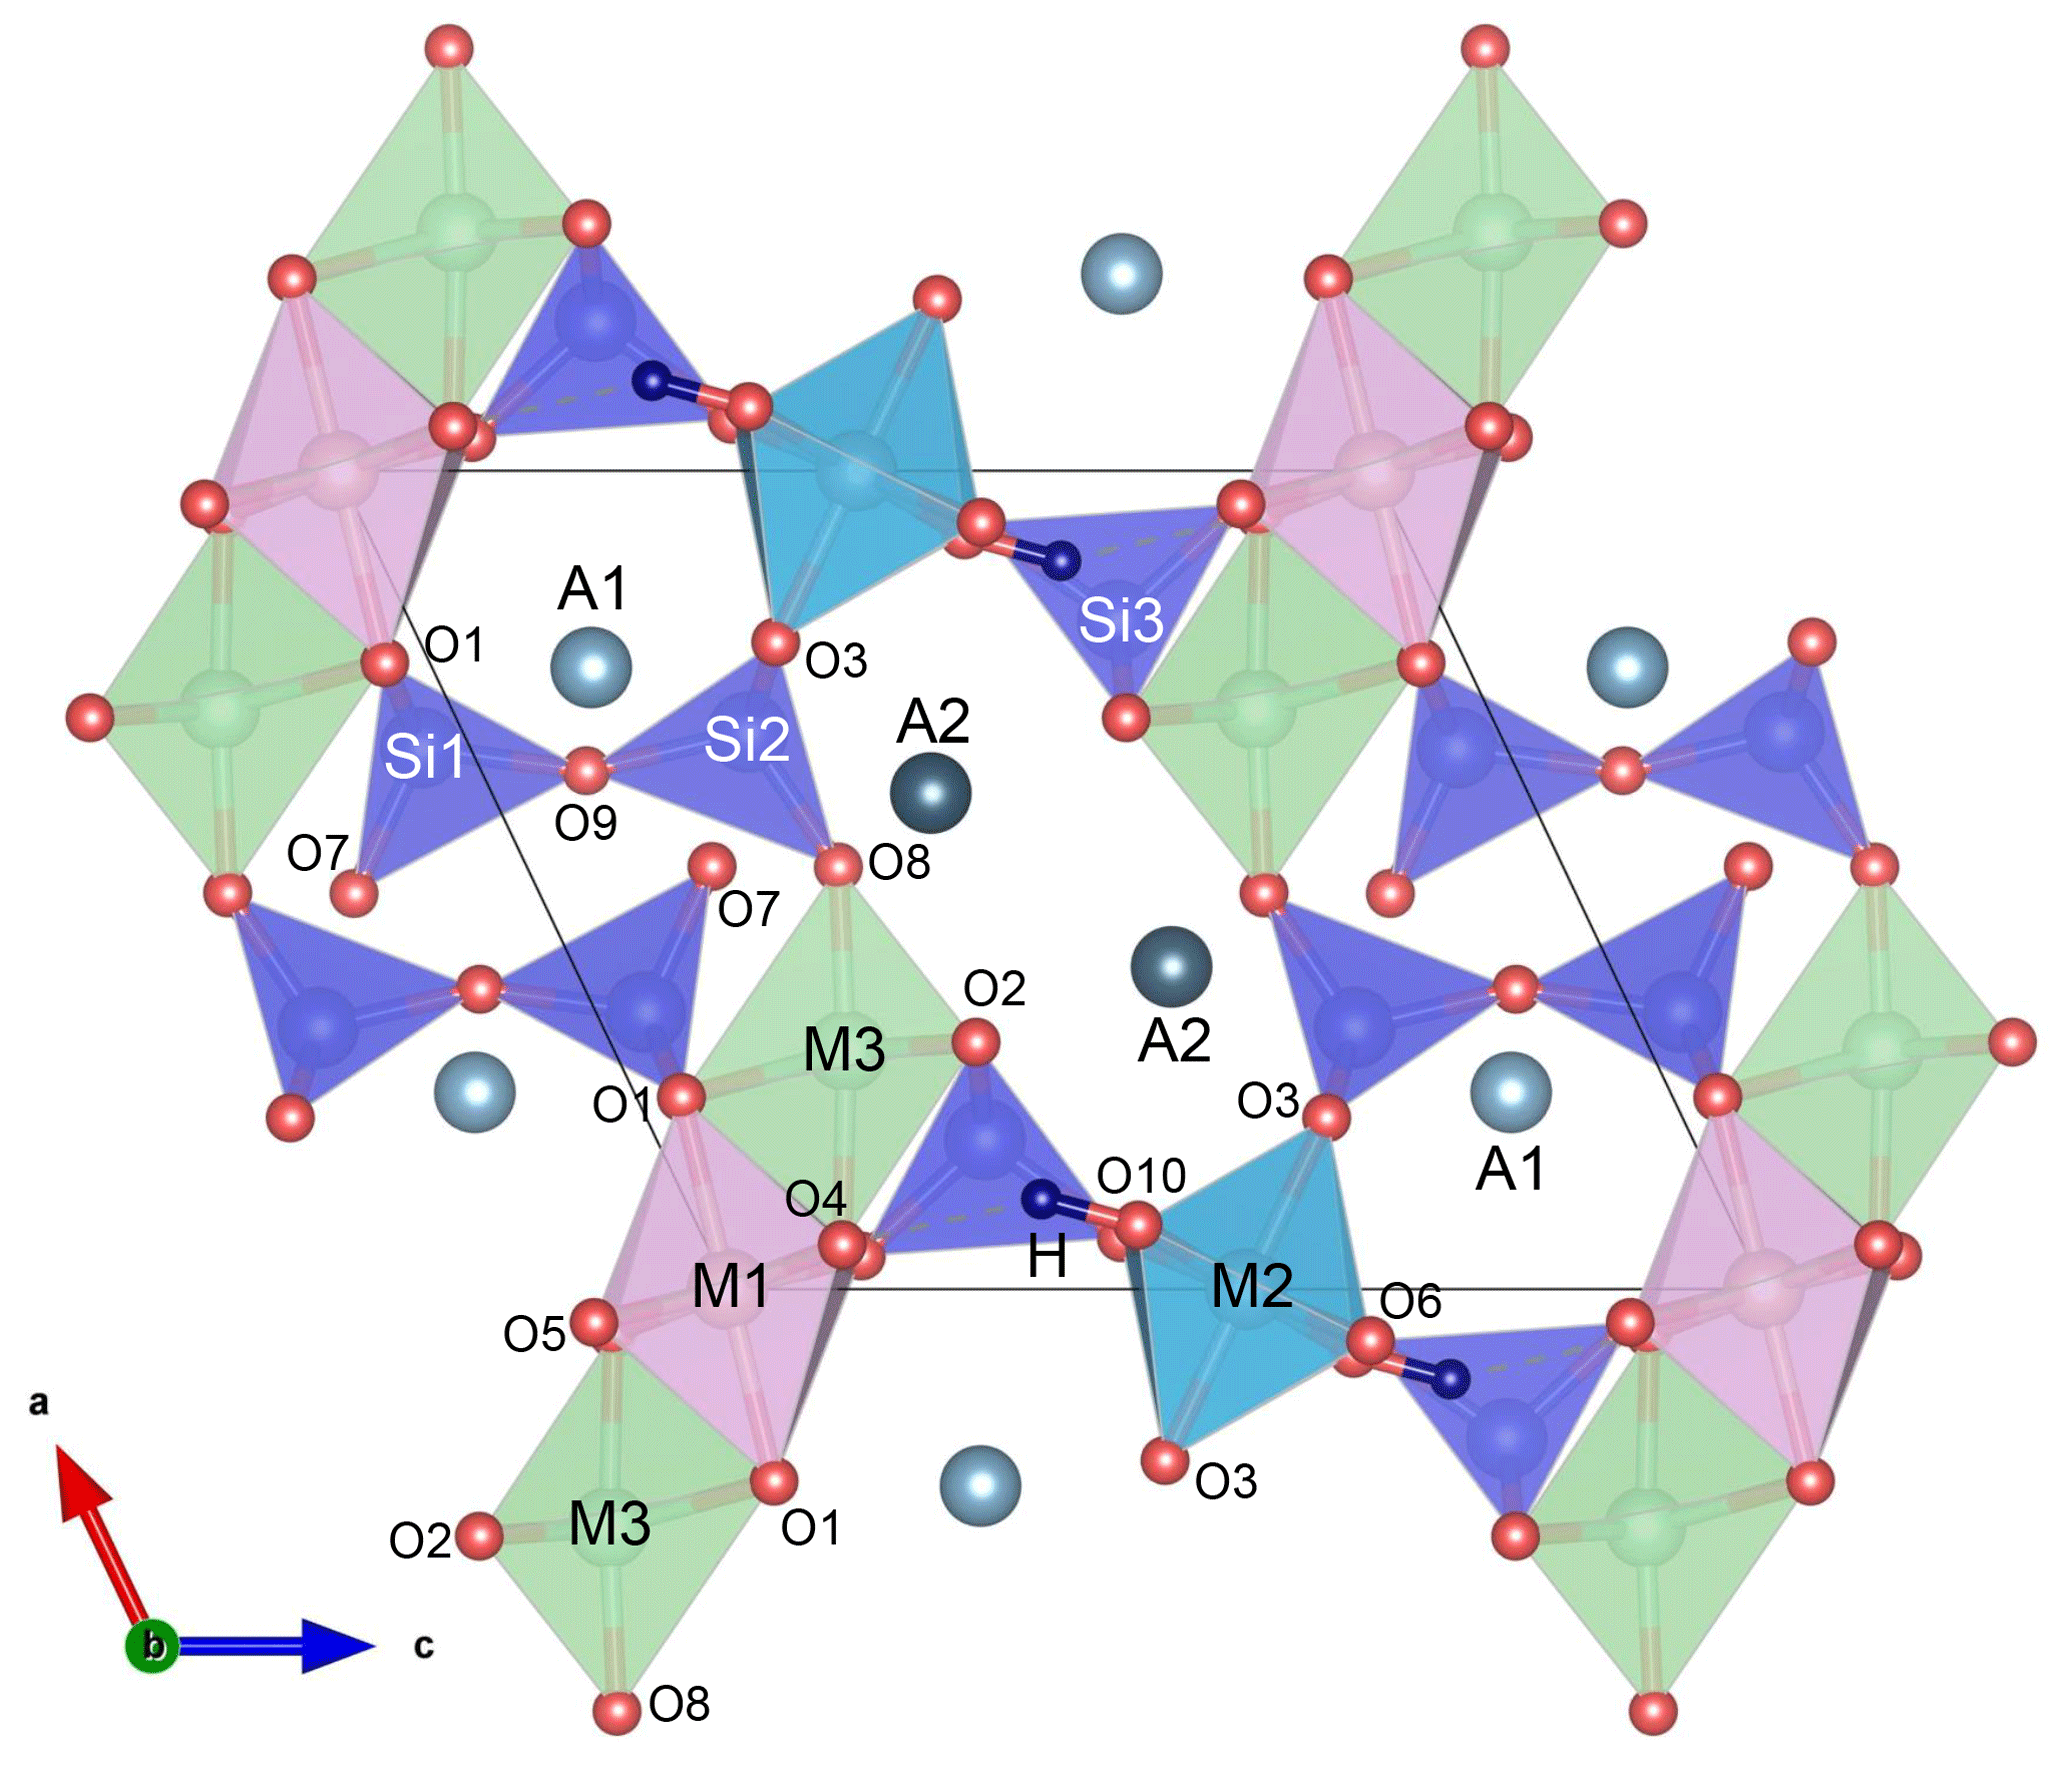
Figure 1Epidote crystal structure projected along the b axis; the MO6 octahedral volume increases in order M2 < M1 < M3; A1 and A2 are 9- and 10-coordinated, respectively; O10 is occupied by hydroxyl groups, which are almost parallel to the c axis. The figure was prepared using VESTA 3 (Momma and Izumi, 2011).
Due to their large compositional diversity, epidote-supergroup minerals are stable over an extremely wide range of pressures and temperatures. They occur as typical metamorphic minerals but are also observed in igneous rocks, hydrothermally altered rocks, low-temperature veins, and join fillings (e.g. Deer et al., 1997; Franz and Liebscher, 2004) as well as in ore deposits and in sedimentary rocks derived from orogenic settings (Garzanti and Andò, 2007; Huber and Bahlburg, 2021). Thus, understanding of the composition–paragenesis relation for epidote-supergroup minerals is critical for petrological and geochemical interpretations of a wide variety of rocks. Certainly, the best way to obtain high-precision compositional data is to use wavelength-dispersive electron microprobe analysis (WD-EPMA). However, over the past few decades, Raman spectroscopy has become more and more popular not only for preparation-free mineral identification using spectral databases, e.g. the RRUFF™ database (Lafuente et al., 2015), but also for a fast quantitative estimation of the crystal chemistry of complex silicates (Aspiotis et al., 2022; Bendel and Schmidt, 2008; Bersani et al., 2009, 2018, 2019; Huang et al., 2000; Kuebler et al., 2006; Leissner et al., 2015; Waeselmann et al., 2020; Watenphul et al., 2016a, b).
The compositional effects on the atomic dynamics of epidote-type minerals have been analysed mainly by Fourier-transform infrared (FTIR) spectroscopy, focusing on the OH-stretching vibrations (e.g. Langer and Raith, 1974; Liebscher, 2004). A summary of the observed IR peaks and their assignment in previous studies are listed in Table S1 in the Supplement. It has been proposed to estimate the Fe3+ content x (in atoms per formula unit, apfu) in a clinozoisite–epidote solid solution through the position of the sole OH-stretching infrared peak ωOH, using the relation , with accuracy in Fe3+ content 0.04 apfu (Langer and Raith, 1974). For piemontite, a Mn3+ analogue of epidote, splitting of the OH-stretching peak due to the Jahn–Teller effect of octahedrally coordinated Mn3+ was observed and the additional, higher-wavenumber component was assigned to the M2Al2–O10–H ⋯ O4–M1(Al, Fe)Mn3+ configuration based on an increase in H ⋯ O4 distance due to the shorter M3–O4 bond length in piemontite compared to that in the Al–Fe3+ series of epidote (Della Ventura et al., 1996). Moreover, two types of behaviour of the ν(OH) peak in the epidote group were indicated (Della Ventura et al., 1996): (i) “one-mode behaviour” (i.e. a continuous shift of a single peak), related to the Al–Fe3+ substitution, and (ii) “two-mode behaviour” related to the (Al, Fe3+)–Mn3+ distribution. Two-mode behaviour due to different octahedral configurations, namely M2Al2–O10–H ⋯ O4–M1AlAl and M2Al2–O10–H ⋯ O4–M1AlFe3+, was also suggested for Fe3+-bearing zoisite (Liebscher, 2004). Multiple OH-stretching IR peaks (3357, 3397, 3461, 3660, and 3762 cm−1) have also been reported for epidote (Su et al., 2019), although detailed peak assignment has not been provided. In the range of framework vibrations below about 1200 cm−1, 34 IR peaks have been identified (Langer and Raith, 1974), as some peaks have shifted toward lower wavenumbers with increasing Fe3+ content.
One of the advantages of Raman spectroscopy over FTIR spectroscopy is that it can reach a lateral resolution of ∼1 µm, which is of an order of magnitude better than that of FTIR microspectroscopy. This is especially beneficial for minerals with chemical zonation, like epidotes. Yet, Raman-scattering analyses on mineral series from the epidote supergroup are relatively scarce. The main characteristic Raman peaks of epidote generated by the framework vibrations appear near ∼400–420, ∼550, ∼910, and ∼1080 cm−1, while the O–H stretching modes give rise to Raman scattering in the range 3340–3380 cm−1 (Liebscher, 2004; Makreski et al., 2007; Enami, 2009; Roache et al., 2011; White et al., 2017; Andò and Garzanti, 2014; Su et al., 2019; Nagashima et al., 2021; Kozáková et al., 2022; Zheira et al., 2022). The assignment of the observed Raman peaks proposed by different authors is listed in Table 1. Moreover, Raman spectroscopy has been applied to examine the structural breakdown of clinozoisite and epidote under high-temperature and low-pressure conditions (Kozáková et al., 2022) as well as to analyse the chemically induced structural changes in Cr+V-containing clinozoisite (Nagashima et al., 2021). Raman spectroscopy has also been used to identify tanzanite, a V-containing variety of zoisite of gemological importance (Coccato et al., 2021).
Table 1Previously reported Raman peak positions and the peak assignment of Raman spectra of the Al–Fe3+ series of epidote, Ep, and clinozoisite, Czo.
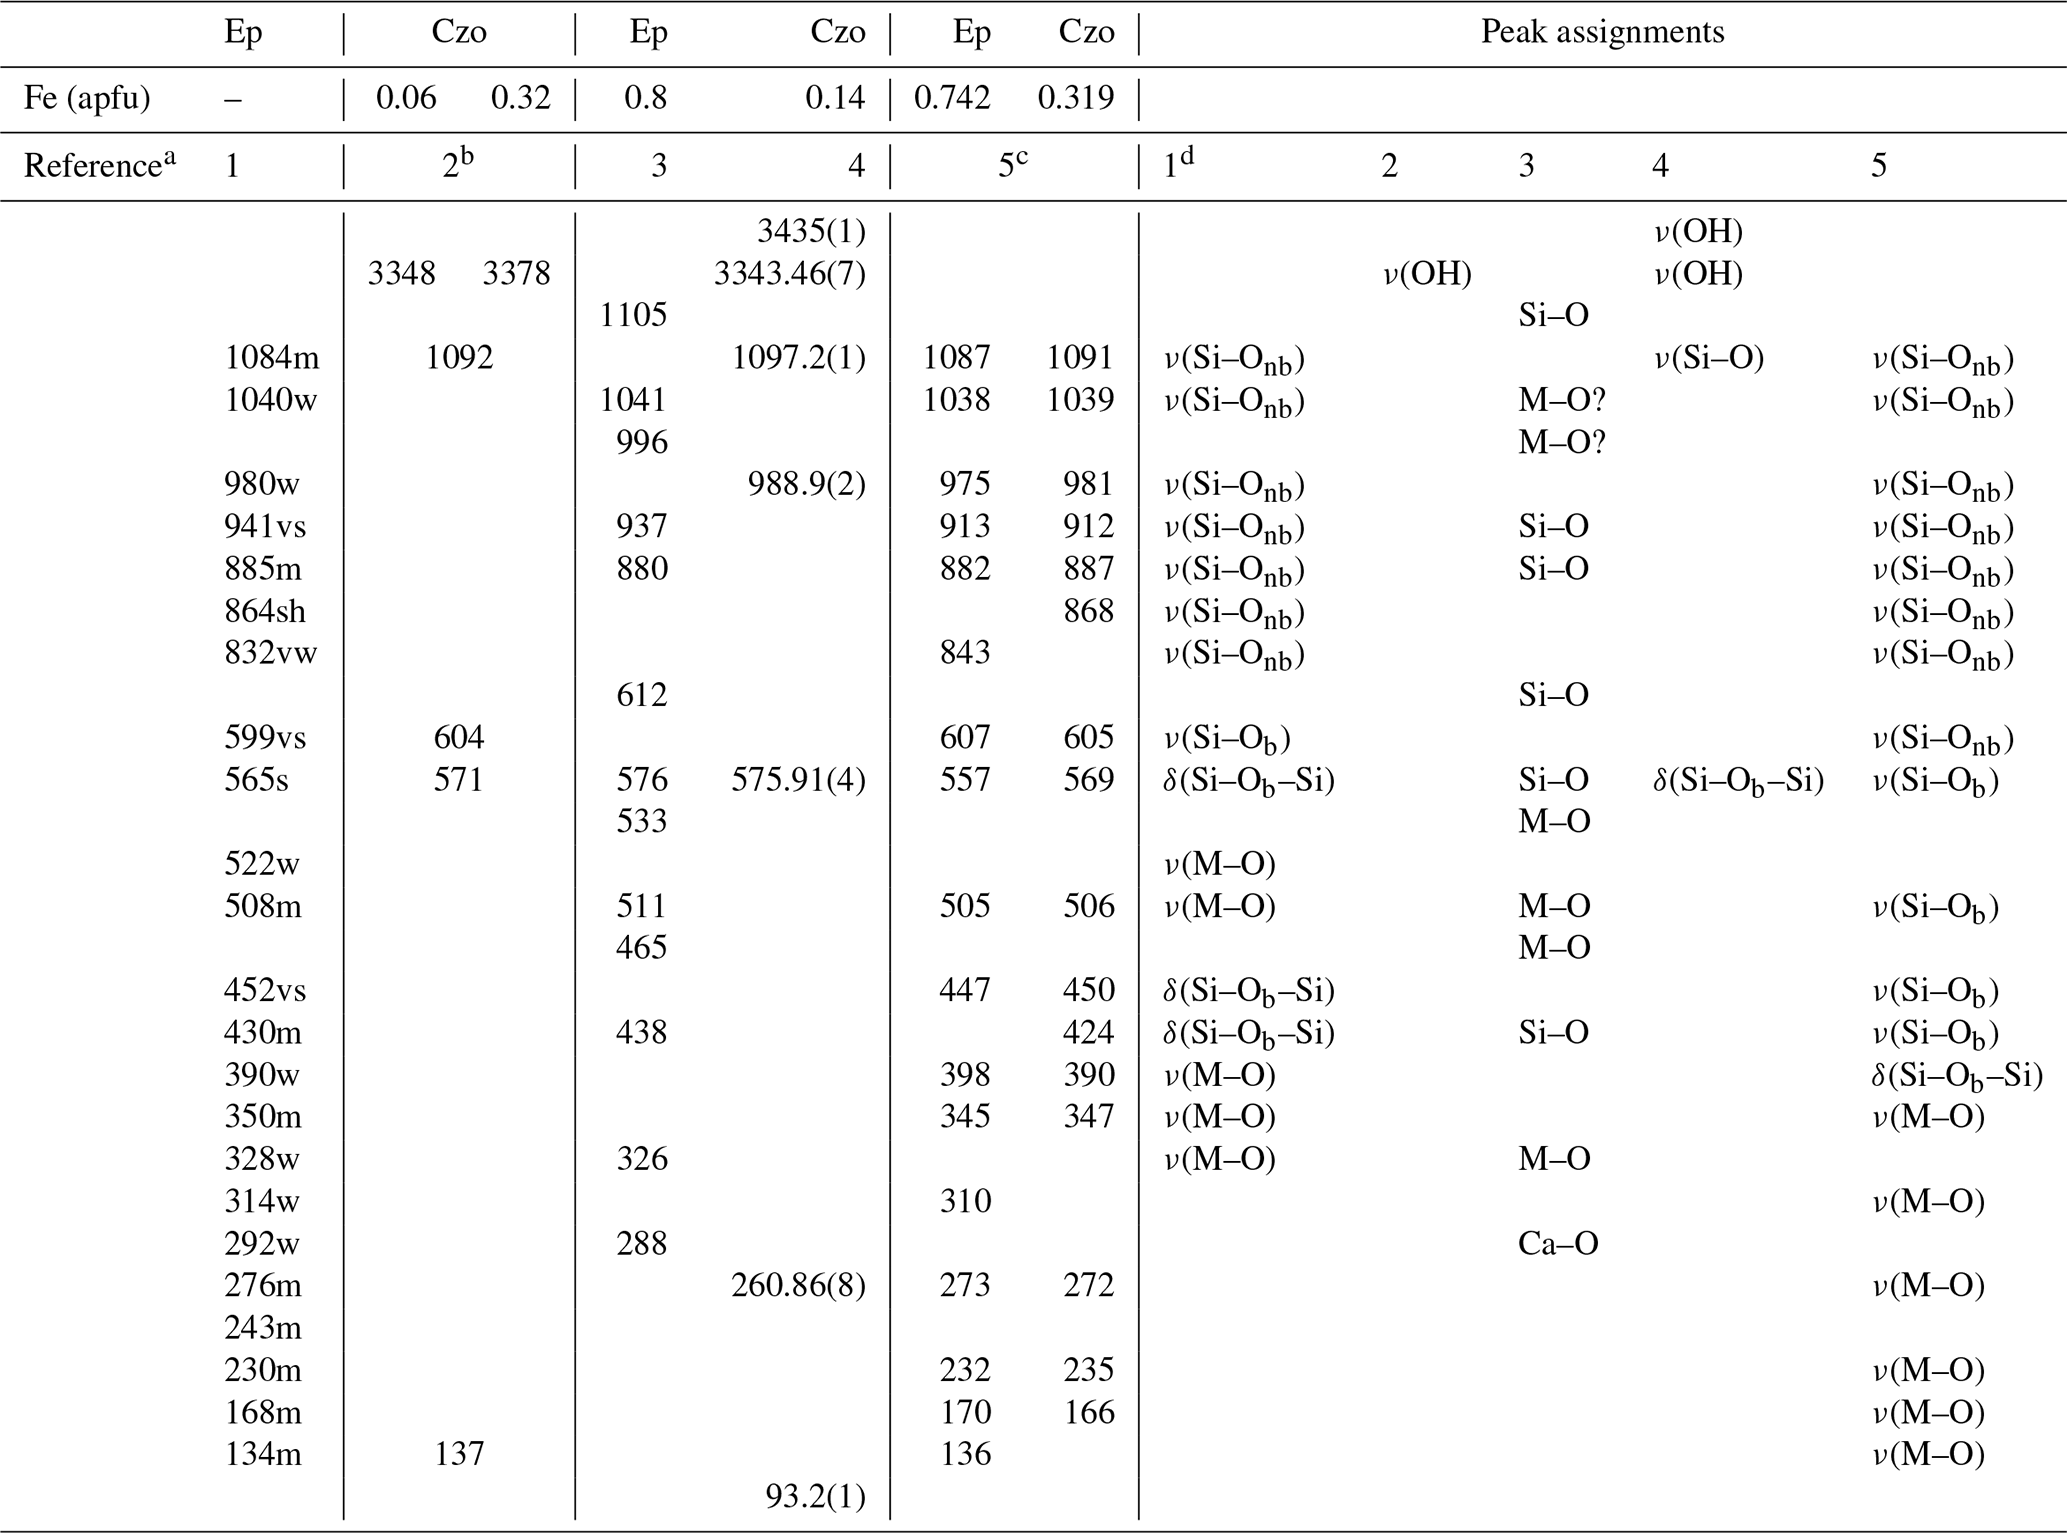
a References are as follows: (1) Makreski et al. (2007), (2) Enami (2009), (3) Su et al. (2019), (4) Nagashima et al. (2021), (5) Kozáková et al. (2022). b The wavenumbers of the framework vibration were derived from a linear trend of peak positions for clinozoisite with Fe = 0.06 and 0.32 apfu for a composition corresponding to Fe = 0.15 apfu. c Raman spectra were collected from the samples annealed at 900 ∘C. d As the tentative assignments (Makreski et al., 2007). s: strong, w: weak, m: medium, sh: shoulder, v: very, nb: non-bridging, b: bridging.
A qualitative trend between the content of Fe3+ and the positions of the Raman peaks near 137, 571, 604, and 1092 cm−1 (Enami, 2009) as well as of the O–H stretching Raman scattering (Nagashima et al., 2021) has been already reported. Just recently Raman spectroscopy has been proposed to be used for Fe3+-content quantification in clinozoisite with Fe3+ ranging between 0.10 and 0.32 apfu (Limonta et al., 2022), on the basis of the peaks near 560, 980, 1090, and 3350 cm−1. However, a comprehensive study of the Fe3+ Al compositional effect on the Raman spectra of calcium epidotes exceeding the clinozoisite compositional range is still required.
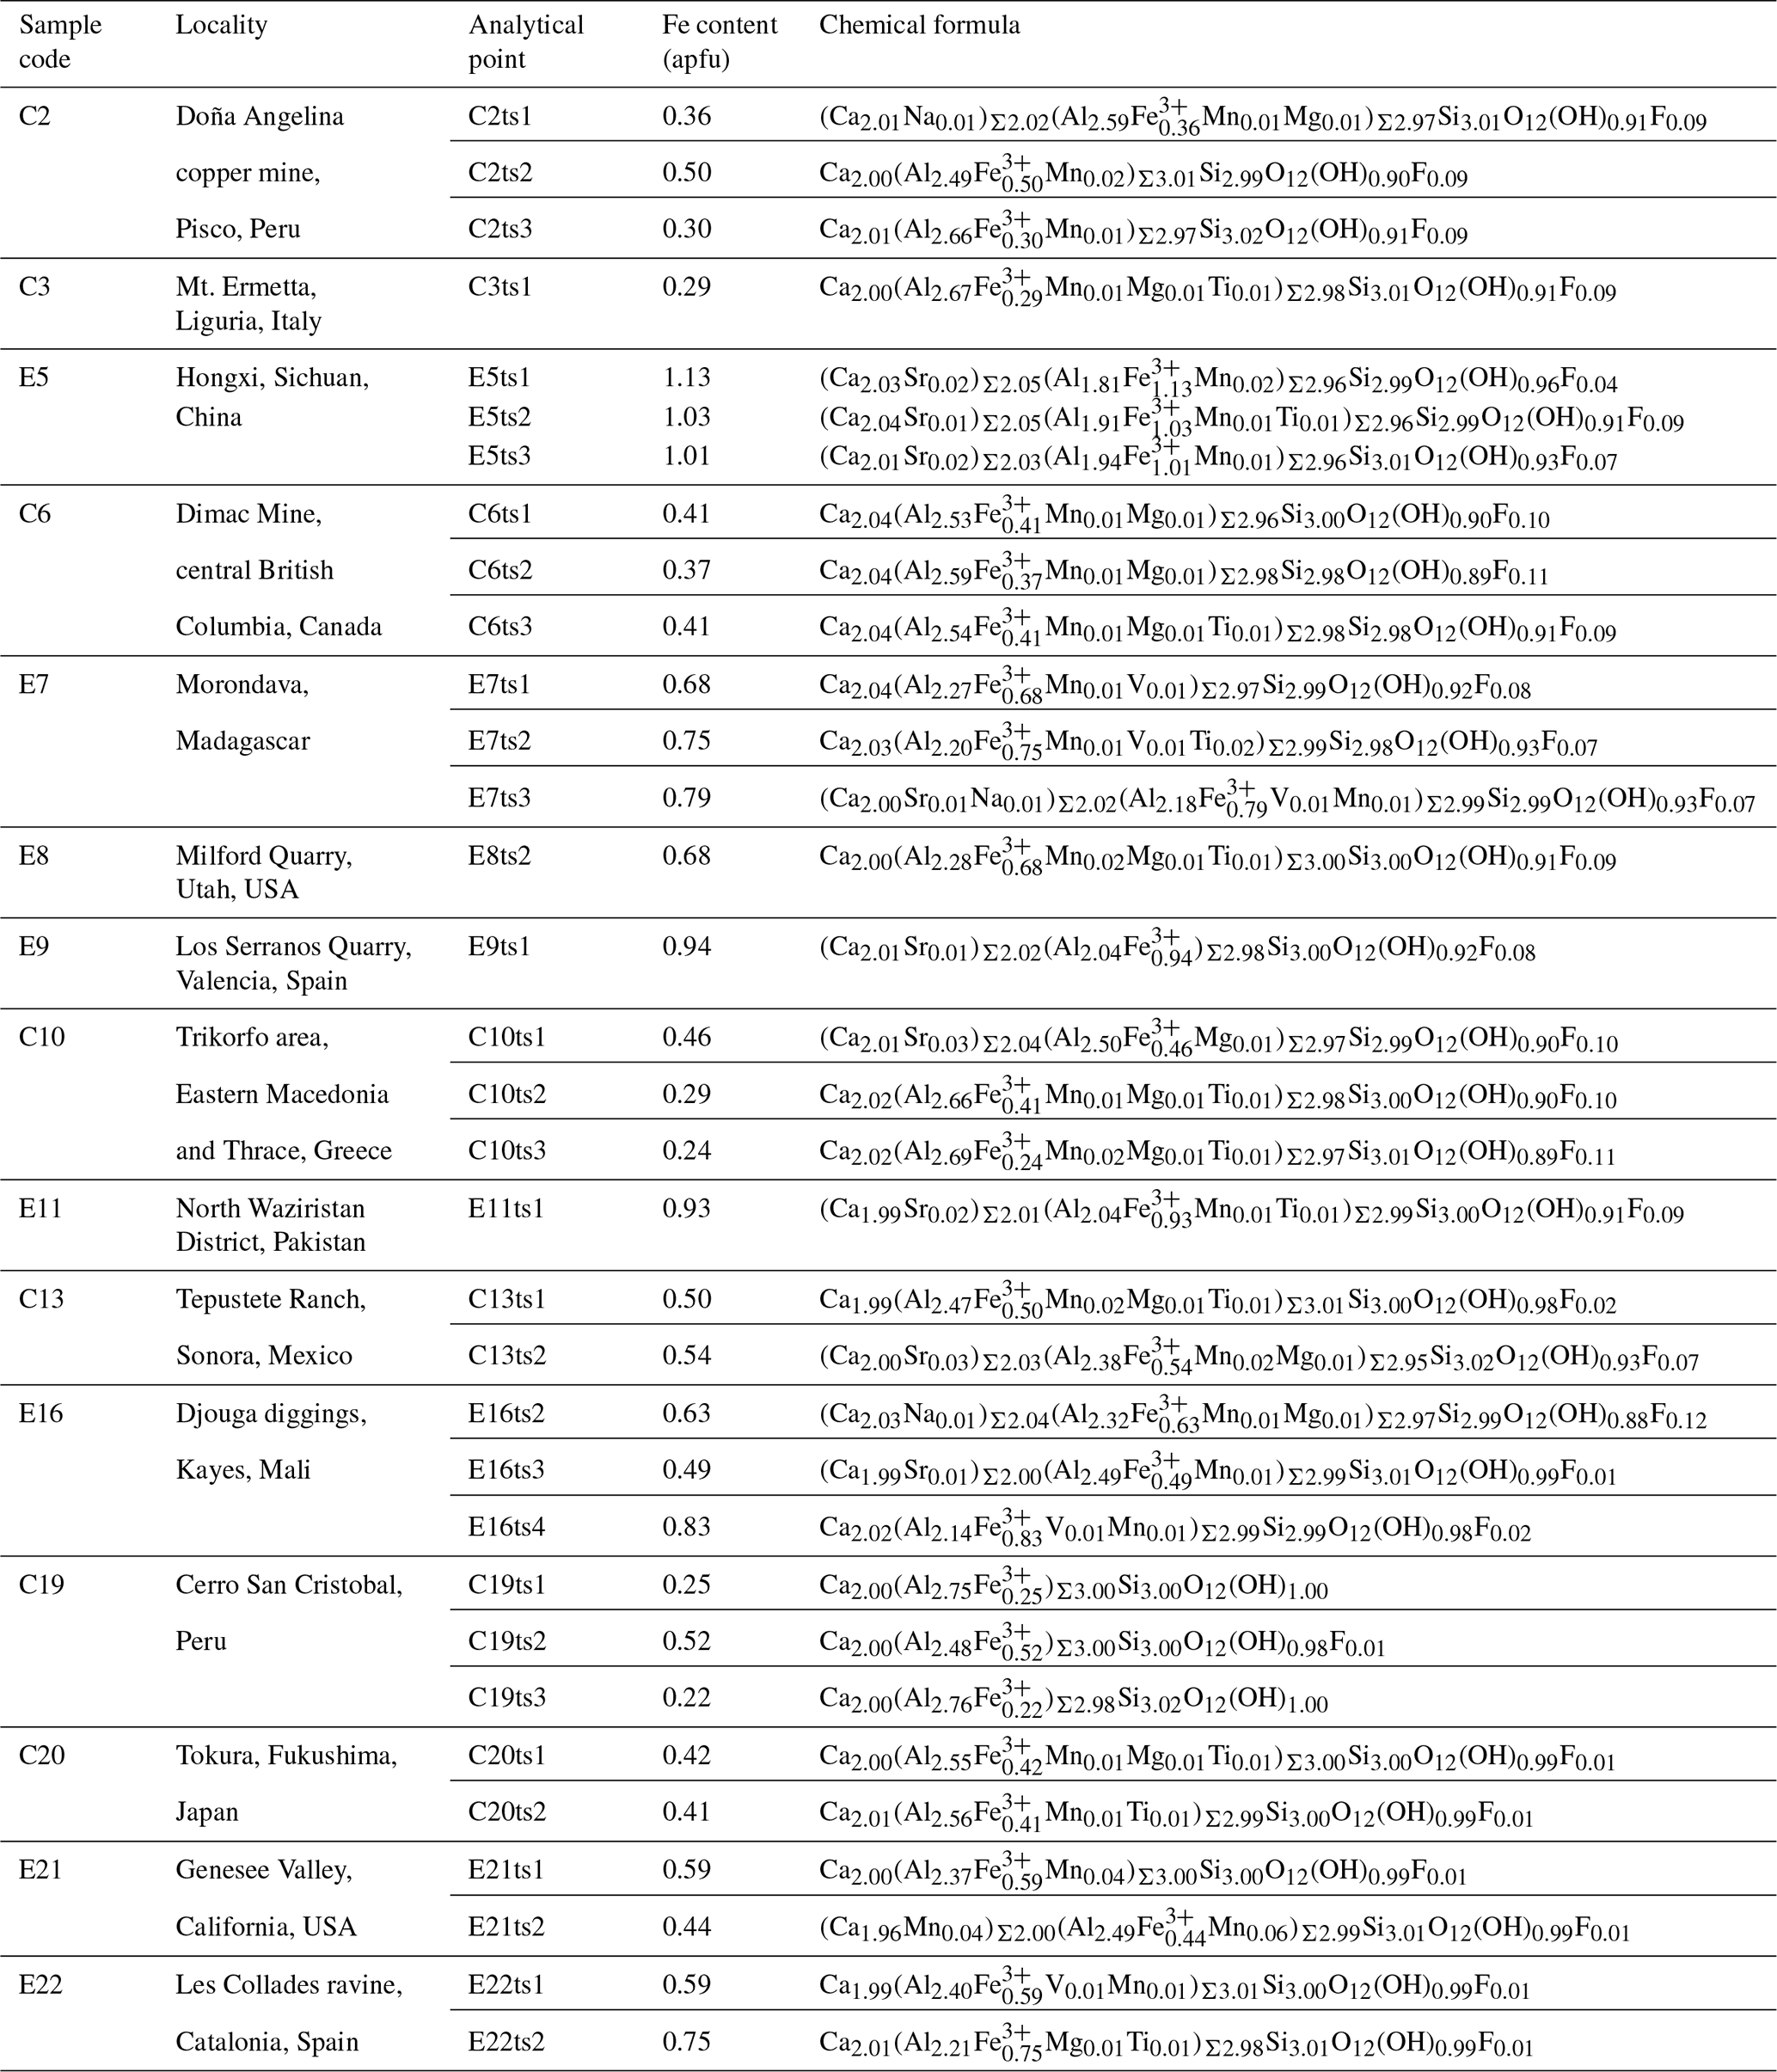
Table 2Sample localities and chemical formulae of each analytical point.
Here, we report our Raman spectroscopic results on a series of natural samples along the clinozoisite–epidote join, whose chemical composition was determined by WD-EPMA. The thorough Raman-scattering analysis of 33 areas from the 15 natural clinozoisite and epidote specimens, selected to be compositionally close to Ca2(Al, Fe)3Si3O12(OH) (Table 2), allowed us to establish a quantitative correlation between Fe3+ content and the Raman signals. Our results provide a tool to determine Fe3+ content in epidote-group minerals with accuracy as good as that derived from FTIR spectra but with a spatial resolution the same as that of WD-EPMA and without the necessity of any sample preparation.
Natural epidote samples in Al–Fe3+ solid solution from 15 localities were investigated in this study (Table 2). Samples C19 and E21 were provided by the Mineralogical Museum, Universität Hamburg (catalogue numbers VFMM-2107/17 and 6362, respectively).
The chemical compositions of natural epidote in Al–Fe3+ solid solution in the thin sections were derived from WD-EPMA data. The analytical points probed by WD-EPMA and Raman spectroscopy are identical. Chemical analyses for samples C3, E5, C6, E7, E8, E9, C10, E11, C13, and E16 were performed with a Cameca SX100 SEM system using a wavelength-dispersive detector installed at the Institute of Mineralogy and Petrology, Universität Hamburg. The energy of the electron beam was 15 kV, and the beam current was 20 nA, with a beam diameter of 10 µm. The abundances of Si, Ti, Al, Cr, V, Fe, Mn, Mg, Ca, Sr, Ba, Na, K, Ni, Pb, P, F, and Cl were measured. The probe standards for the measured elements are as follows: wollastonite (Si, Ca), MnTiO3 (Ti, Mn), Al2O3 (Al), Cr2O3 (Cr), vanadinite (V, Cl), andradite (Fe, Ca), MgO (Mg), SrTiO3 (Sr), Ba-containing glass (Ba), albite (Na), orthoclase (K), NiO (Ni), apatite (P), Pb-containing glass (Pb), and LiF (F). The acquisition times were 120 s for F; 60 s for Na, Mg, P, Cl, K, Sr, Ba, and Pb; 30 s for Ti, V, Cr, Mn, Fe, and Ni; and 20 s for Al, Si, and Ca. Measurements were performed on three points for each analytical point. The ZAF correction was applied to all elements. The chemical compositions for C2, C19, C20, E21, E22, and CrE14 were determined using a JEOL JXA-8230 electron microprobe analyser installed at the Center for Instrumental Analysis, Yamaguchi University. Operating conditions were an accelerating voltage of 15 kV, a beam current of 20 nA, with a beam diameter of 1–10 µm. Wavelength-dispersion spectra were collected with LiF, PET and TAP monochromator crystals to identify interfering elements and locate the best wavelengths for background measurements. The abundances of Si, Ti, Al, Cr, V, Fe, Mn, Mg, Ca, Sr, Ba, Na, K, Ni, Zn, Pb, P, F, and Cl were measured. The probe standards for the measured elements are as follows: wollastonite (Si, Ca), rutile (Ti), corundum (Al), eskolaite (Cr), Ca3(VO4)2 (V), hematite (Fe), manganosite (Mn), periclase (Mg), SrBaNb4O12 (Sr, Ba), albite (Na), orthoclase (K), NiO (Ni), ZnO (Zn), PbVGe oxide (Pb), KTiOPO4 (P), fluorite (F), and halite (Cl). The acquisition times were 30 s for all elements. The ZAF correction was applied to all elements. Several elements, which are not shown in Tables S2 and S3, are below the detection limit. The difference between the analytical total and 100 wt % was assumed to represent the H2O content. The formula was normalized on Σ cations = 8. All analytical points of the Al–Fe3+ series of epidotes are shown in Fig. 2.
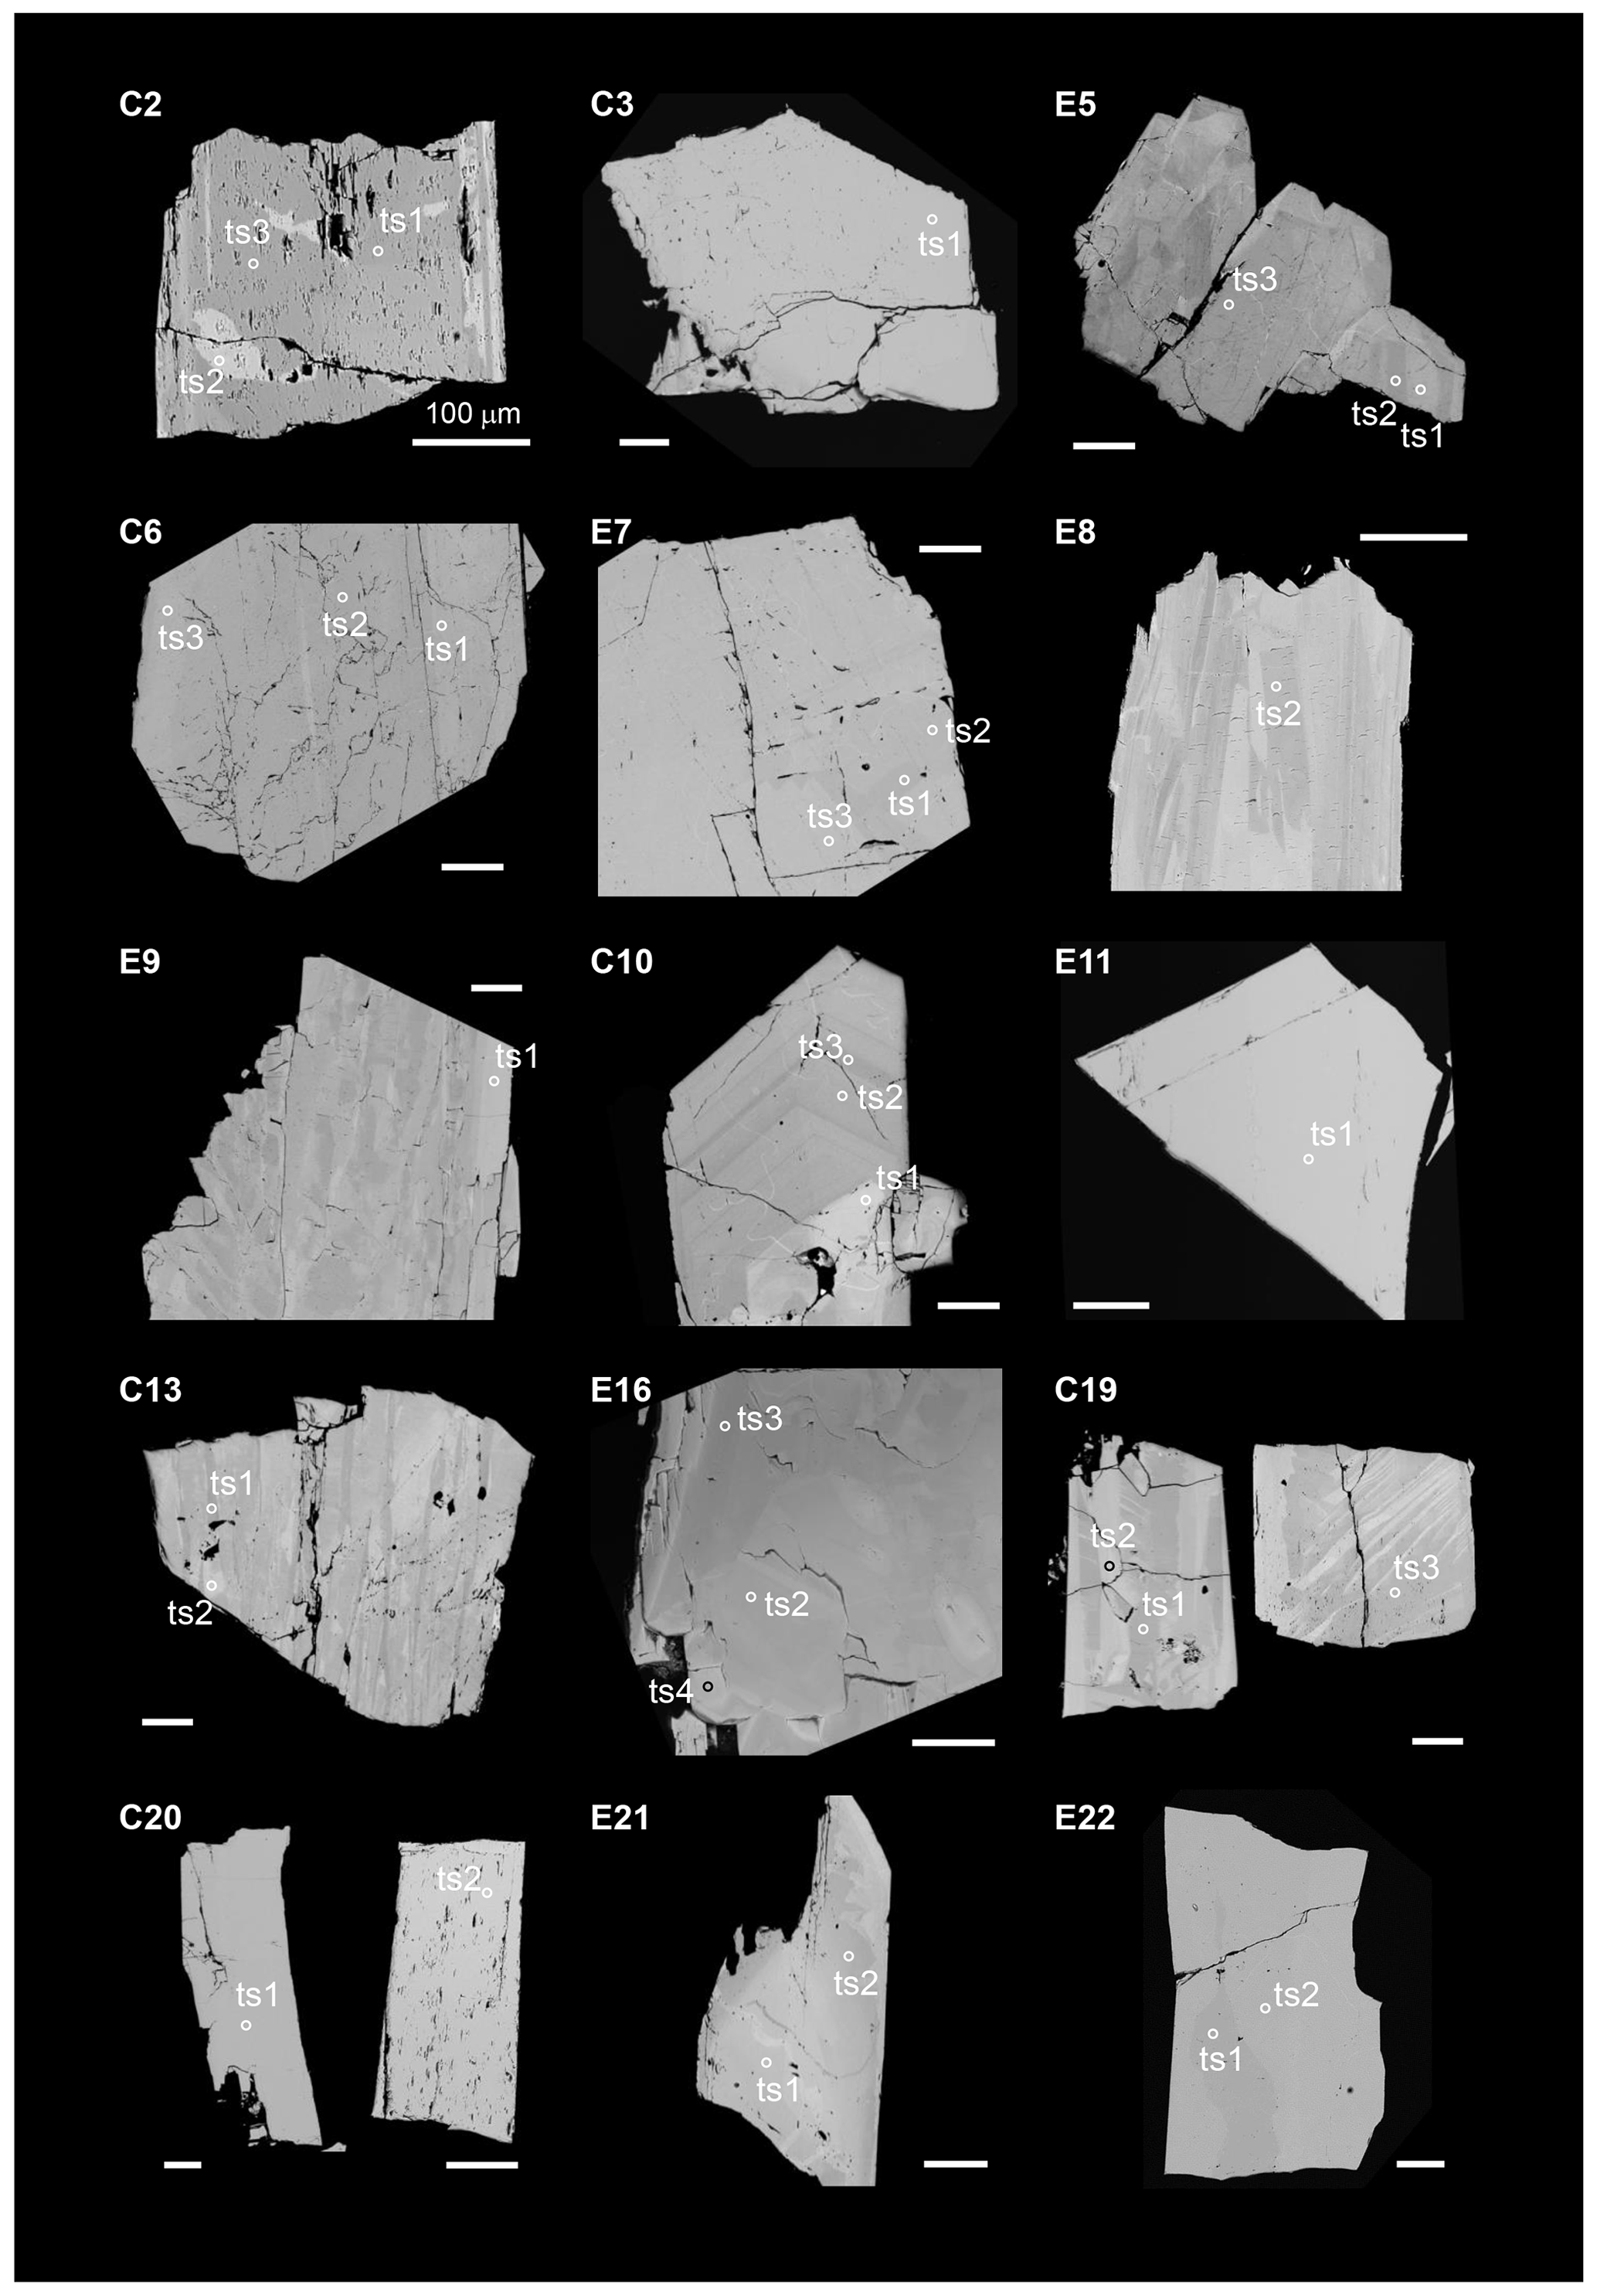
Figure 2Backscattered electron (BSE) images of the studied specimens. Circles mark the areas analysed by EPMA and Raman spectroscopy; note that for better visualization the diameter of the circles is considerably larger than the true size of the corresponding analytical point. The sample orientation is the same as the orientation in which the Raman spectrum was collected. Scale bars are 100 µm.
Raman spectroscopic experiments were conducted in backscattering geometry with a Horiba Jobin Yvon S.A.S. T64000 triple-monochromator spectrometer (holographic 1800 grooves mm−1 gratings) equipped with an Olympus BX41 confocal microscope (Olympus LM Plan FLN 50× objective with a numerical aperture of 0.5) and a Symphony liquid-N2-cooled charge-coupled device (CCD) detector installed at the Institute of Mineralogy and Petrology, Universität Hamburg. The spectrometer was calibrated to the T2g mode at 520.5 cm−1 of a Si wafer. The achieved spectral resolution was ∼2 cm−1, and the accuracy in determining the peak positions was ∼0.35 cm−1. The spectra of the Al–Fe3+ series of epidote-group minerals were collected using the green line of an Ar+ laser with λ=514.532 nm. The laser power on the sample surface was ∼8 mW, while the diameter of the laser spot was ∼2 µm. Spectra were collected in the ranges 15–1215 and 3215–3615 cm−1. To check the orientational dependence of the Raman peak intensities, polarized spectra from a euhedral single crystal (sample C20) were collected from six different scattering geometries with parallel-polarized spectra (the polarization of incident light Ei is parallel to the polarization of scattered light Es) and cross-polarized spectra (Ei⊥Es). In Porto's notation (Porto and Scott 1967), the scattering geometries were (xx)y, (yy)z, (zz)x, (xz)y, (xy)z, and (yz)x, where y is parallel to the b axis, while x and z are two mutually perpendicular directions in the (010) plane. The orientation of the crystallographic axes for the epidote grains in thin sections was random, and only parallel-polarized spectra (E were collected, keeping the orientation of the thin sections unchanged for all examined spatial points within the same thin section. The OriginPro® 2022 software package was used for data evaluation. The collected spectra were baseline corrected for the continuous luminescence background and temperature reduced to account for the Bose–Einstein distribution function: , , with ω being the phonon frequency (in s−1), ℏ the reduced Planck's constant, k the Boltzmann constant, and T the temperature in kelvins (Kuzmany, 2009). Peak positions, full widths at half maximum (FWHMs), and integrated intensities were determined from fits with pseudo-Voigt functions (PV = (1−q) × Lorentz + q × Gauss, where q is a refined weight coefficient). The criterion for the maximum number of fitted peaks was , with I and ΔI being the calculated magnitude and uncertainty of each peak intensity.
3.1 Chemical compositions of the Al–Fe3+ series of epidotes
The backscattered electron (BSE) images of the studied Al–Fe3+ series of epidote samples (Fig. 2) reveal chemical zoning typical of epidote. The chemical formulae and compositions derived from all analytical points, as labelled in Fig. 2, are listed in Tables 2 and S2, respectively. The main chemical variation is the substitution of Fe3+ for Al, as revealed by the linear regression between Fe3+ in Al contents in atoms per formula units (apfu) shown in Fig. 3. Among the studied samples, the Fe2O3 content varies from 3.8 wt % to 18.4 wt % (Table S2), corresponding to a Fe content of 0.22–1.13 apfu (Table 2 and Fig. 3). Small amounts of Mn and Sr were typically contained, whereas trivalent rare earth elements (REEs), such as Ce3+ and La3+, were not detected in our studied specimens (Tables 2 and S2). Among the 33 analytical points, the highest amount of SrO was ∼0.55 wt % for C13ts2, resulting in Sr of 0.03 apfu (Table 1). The Mn2O3 content attains up to 1.69 wt % in E21ts2, corresponding to Mn of 0.10 apfu. Based on the deficiency of Ca, 1.96 apfu in E21ts2, and lack of Sr or REEs, partial Mn is assumed to be in a divalent state, occupying the A1 site. Thus, the Mn content at the octahedral sites in E21ts2 is expected to be ∼0.06 apfu.

Figure 3Variation in Al and Fe content (apfu); the line is a linear fit to the data points with R2=0.99.
3.2 Raman spectra
The application of site symmetry group-theoretical analysis (Kroumova et al., 2003) to the clinozoisite structure of space group P21/m yields 37Ag + 23Bg Raman-active modes (Table 3). The Raman polarizability tensors are α(Ag) = and α(Bg) = . The intensity of the (yy)z spectra is determined by the αyy component of the polarizability tensor, while (zz)x spectra result predominantly from the αzz component with a small contribution of the αxz component, which depends on the orientation of the natural crystal surface from which spectra were collected. Consequently, the Raman spectra shown strong orientation and polarization dependence (Fig. 4). Therefore, in the spectra show in Fig. 4, the Ag modes are dominant in (xx)y, (yy)z, (zz)x, and (xz)y, whereas the Bg modes are dominant in (xy)z and (yz)x. A more detailed study of the polarized Raman spectra of epidote-group mineral grains with different habitus will be presented in a follow-up paper. It is worth noting that the M1- and M2-site cations at the M1 and M2 sites do not participate in Raman-active modes; i.e. among the octahedrally coordinated cations only M3-site cations are expected to participate in Raman-active modes (Table 3). The hydrogen cations at the 2e Wyckoff position generate 2Ag + Bg Raman-active phonon modes. Symmetry considerations of the atomic vector displacements using the online tools of the Bilbao crystallographic server (Kroumova et al., 2003) indicate that one Ag mode consists of the O–H bond stretching, whereas one Ag + Bg modes consist of OH libration modes. In the epidote structure, the orientation of the O–H bond is almost along the c axis. Thus, the O–H bond stretching mode should generate a single strong peak in the range 3000–4000 cm−1 of the (zz)x Raman spectrum (Fig. 4).
Table 3Symmetry types of Brillouin-zone phonon modes for epidote-supergroup minerals.
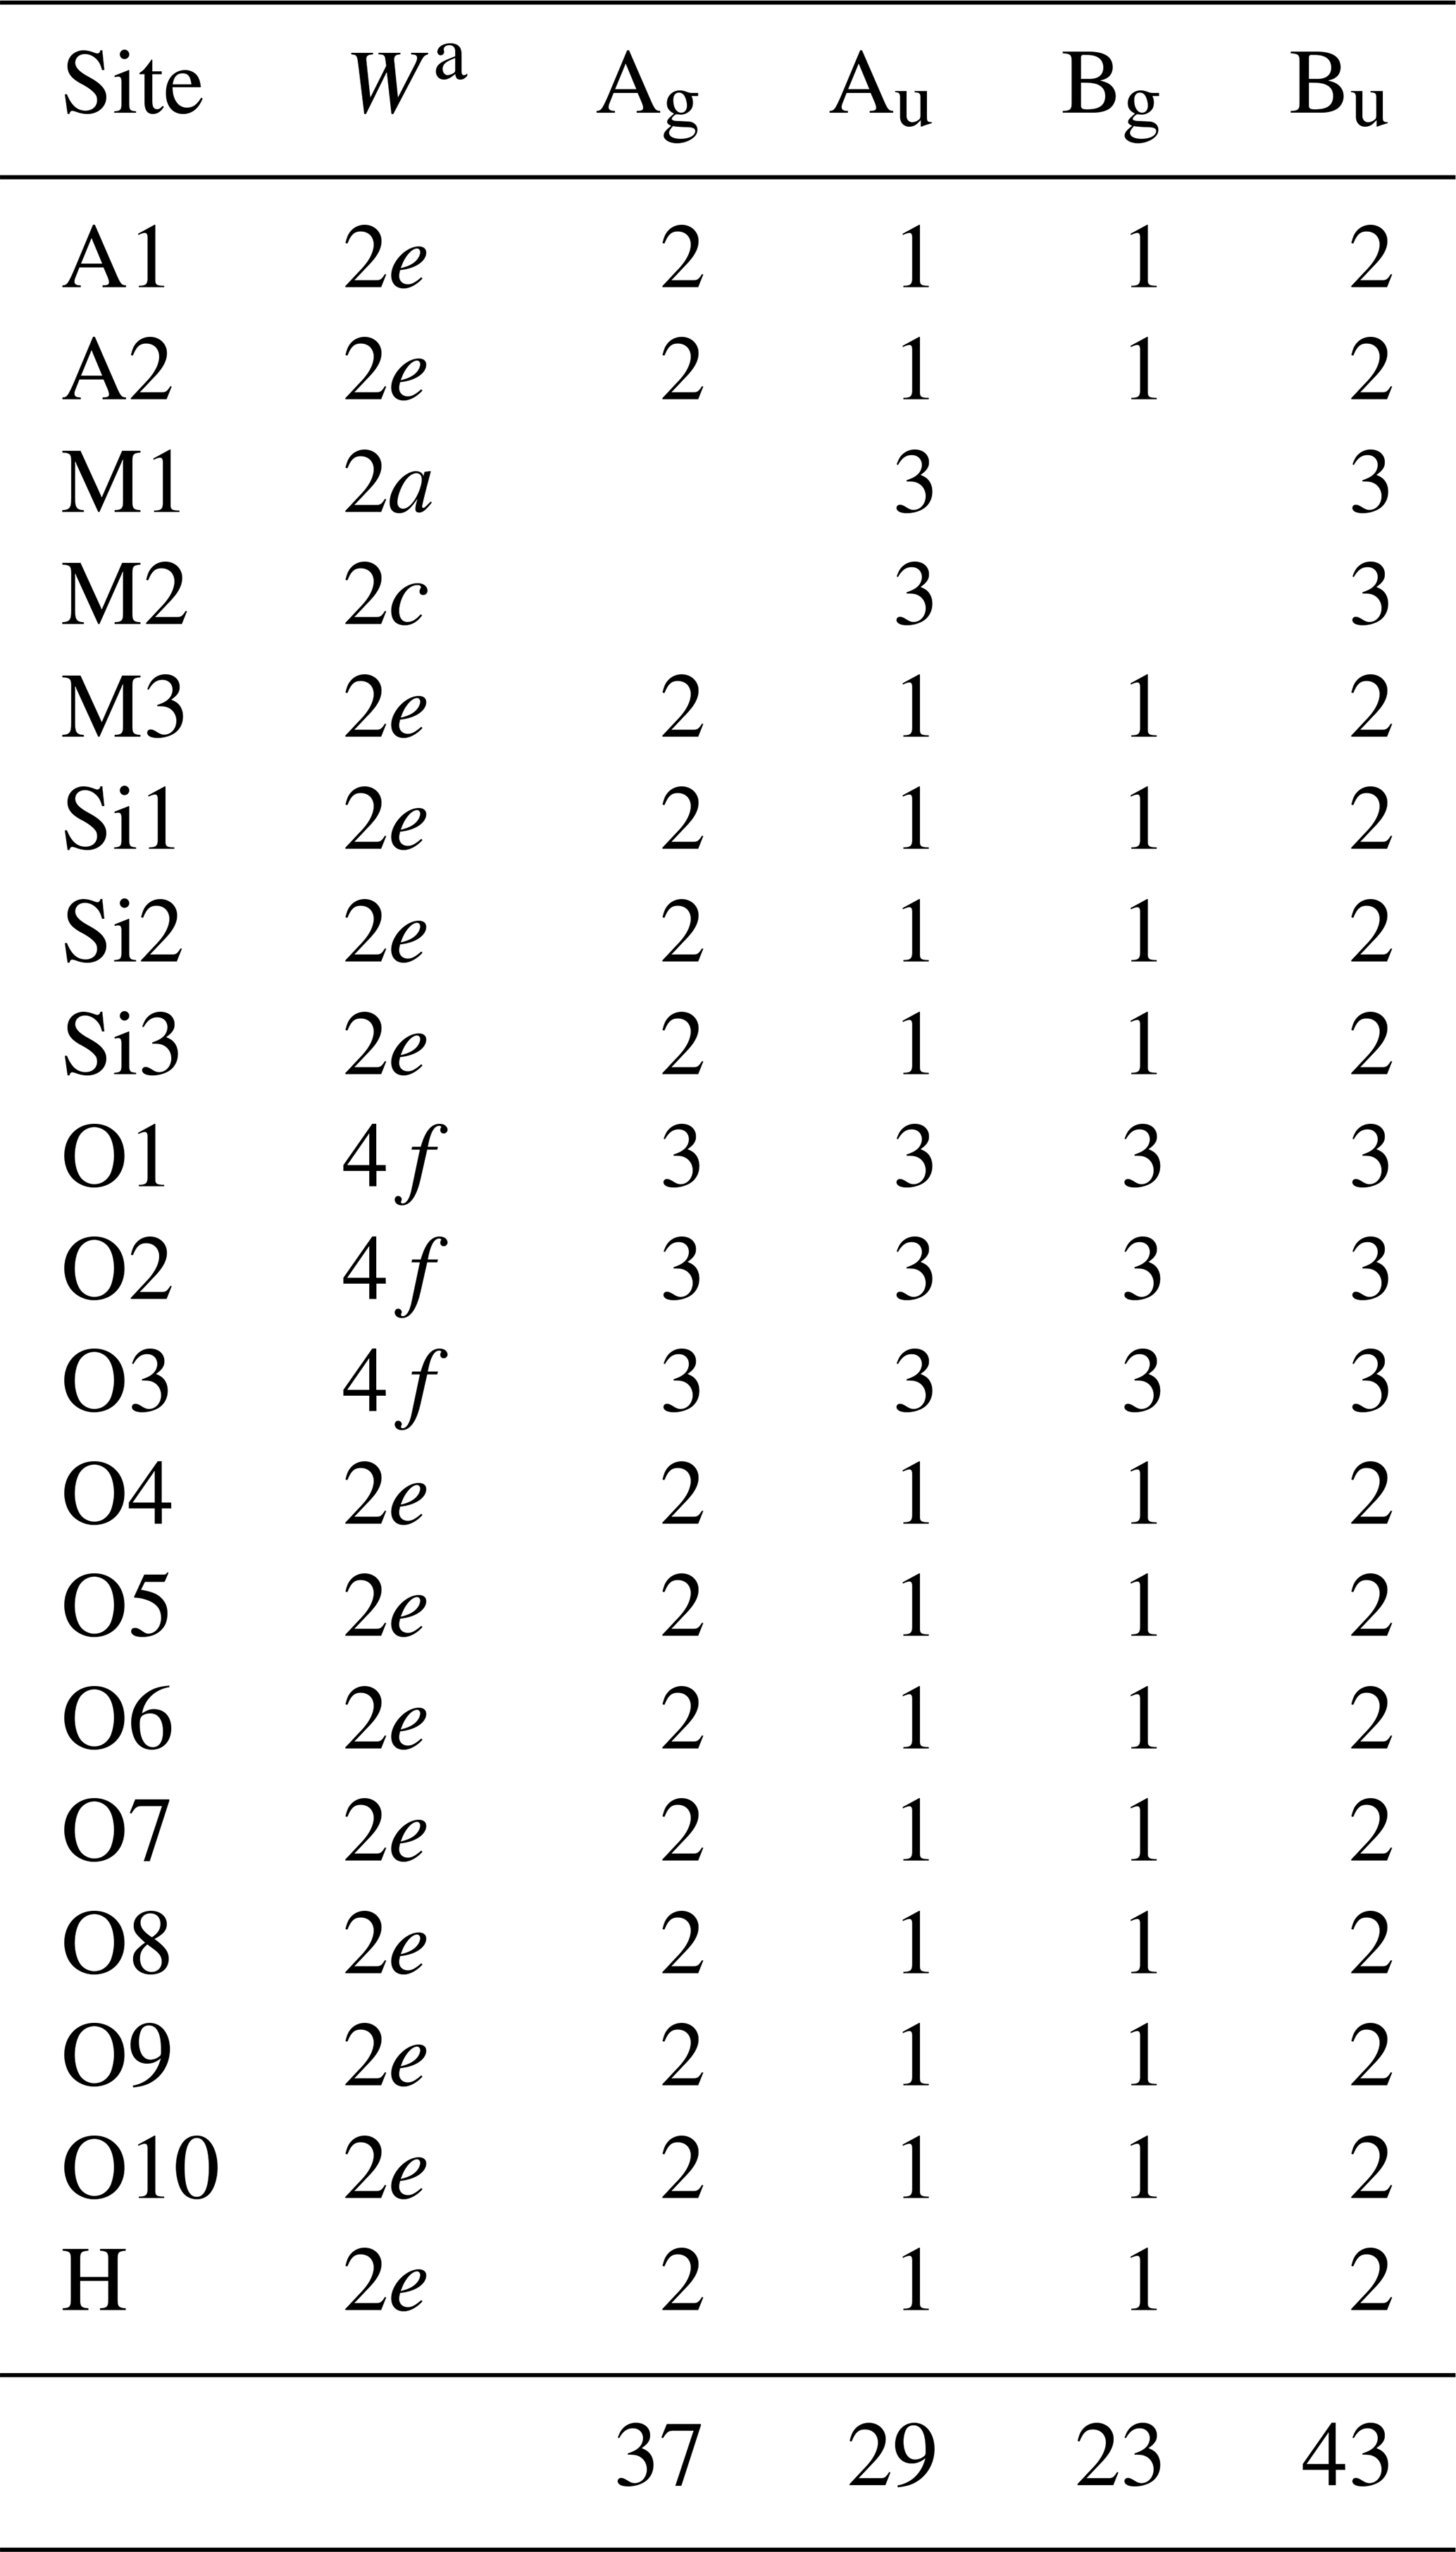
aW is the Wyckoff notation of the point position with multiplicity.
Γtotal = 37Ag + 29Au + 23Ag + 43Bu;
Γacoustic = Au + 2Bu;
ΓRaman = 37Ag + 23Ag;
Γinfrared = 28Au + 41Bu.
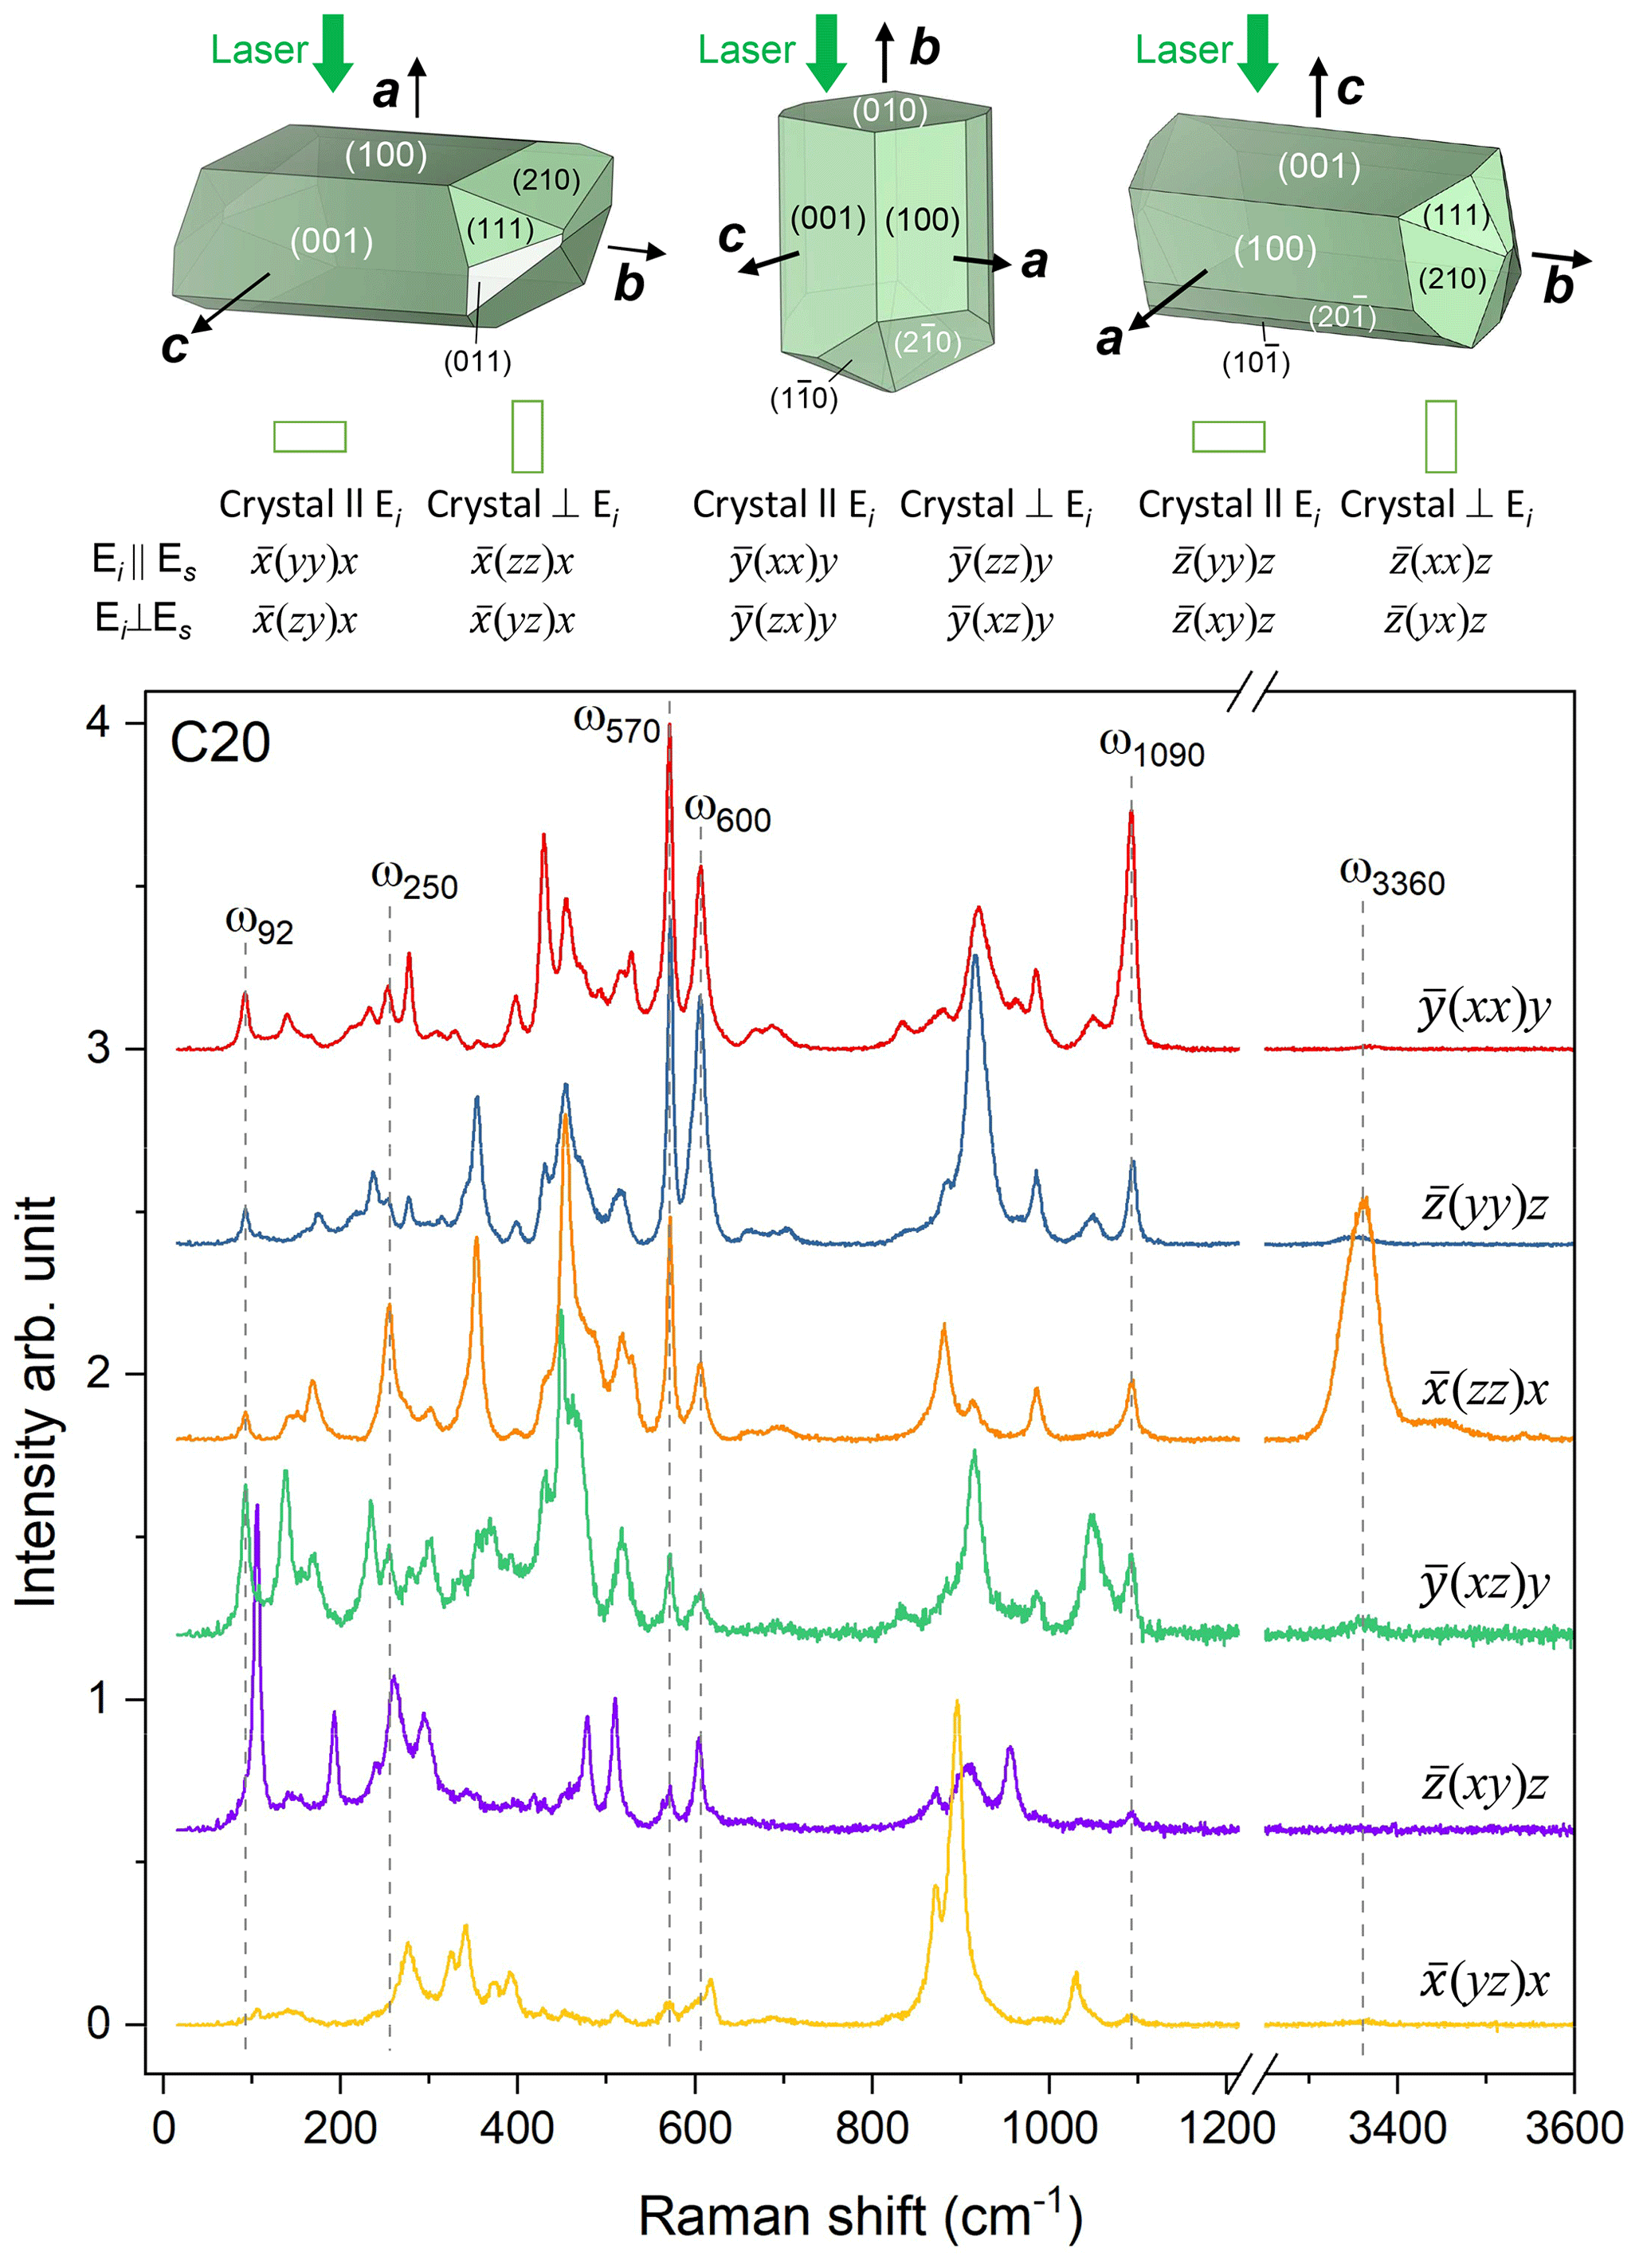
Figure 4Polarized Raman spectra collected in six different geometries from euhedral single crystals of sample C20, along with crystal habits typical of epidote-group minerals as well as the relationship between the crystal orientation and the scattering geometry. Peaks further discussed in the paper are marked by dashed lines. Crystal shapes were drawn with VESTA 3 (Momma and Izumi, 2011).
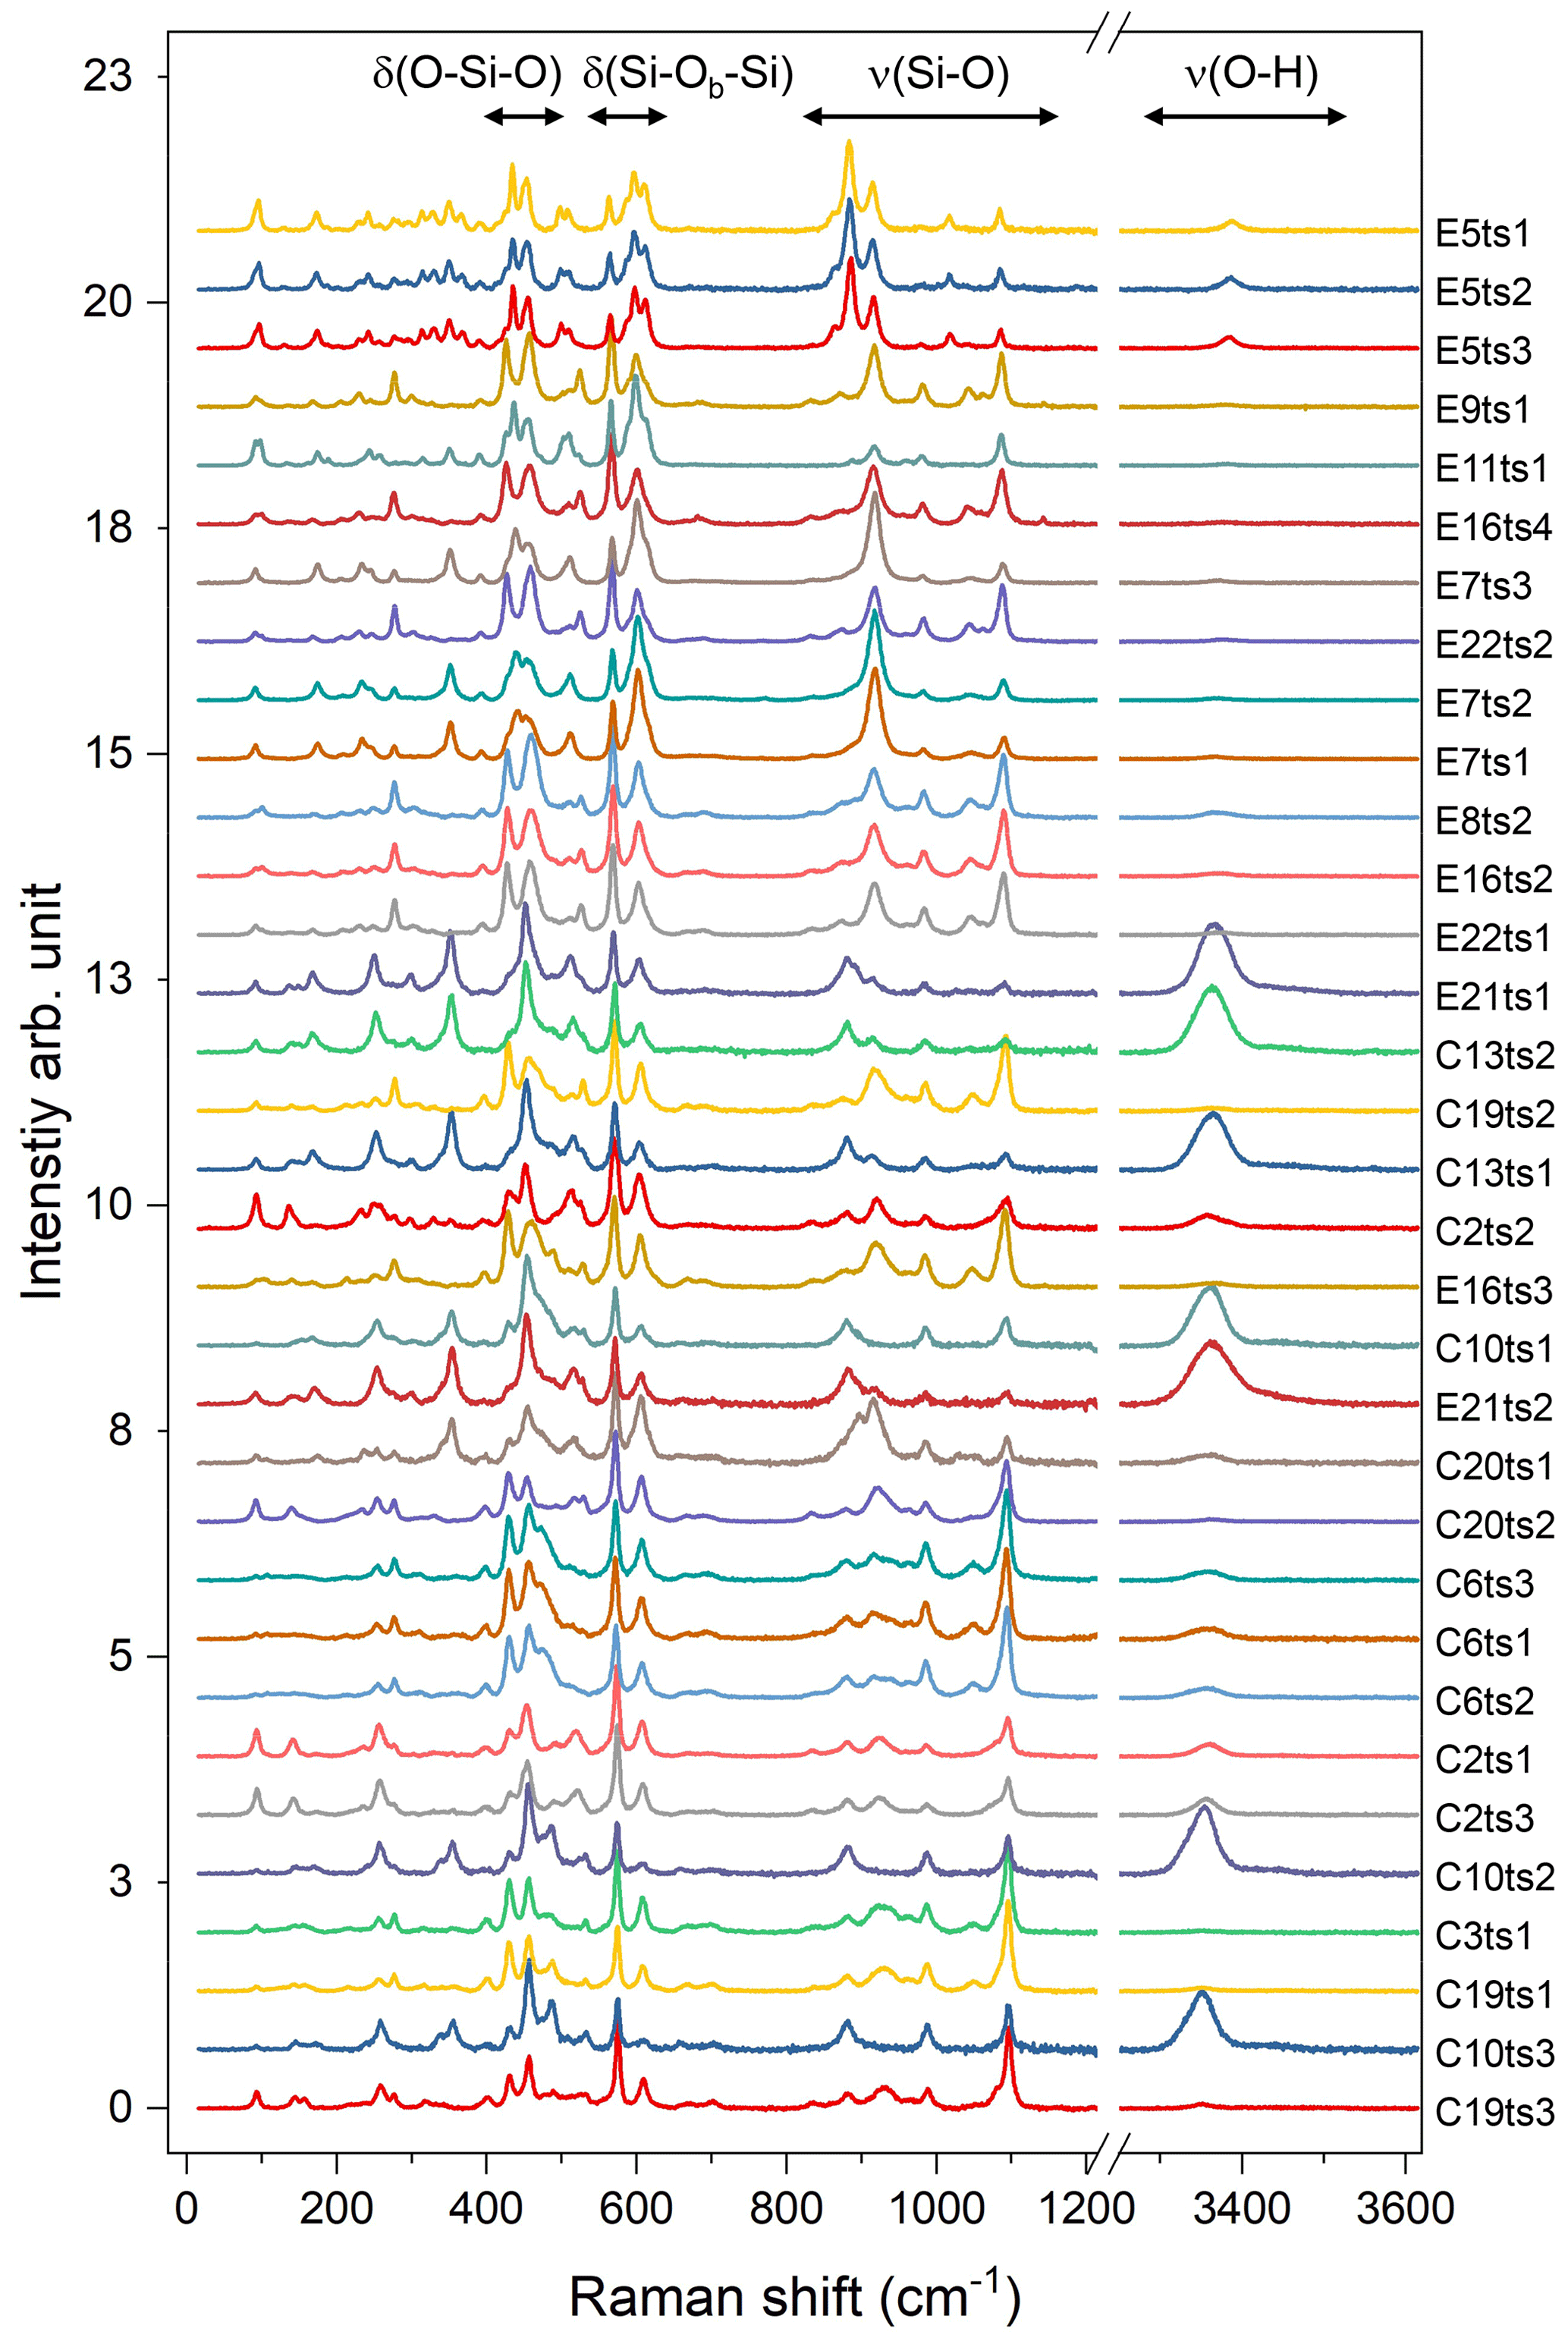
Figure 5Raman spectra of the studied Al–Fe3+ series of epidote-group minerals. The Fe content increases from the bottom to the top; the orientation of the grains is random. For better comparison, the spectra were normalized to the height of the strongest peak and vertically offset. Spectra labelling corresponds to the analytical points listed in Table 2 and indicated in Fig. 2.
The 33 parallel-polarized Raman spectra of the studied Al–Fe3+ series of epidote-group minerals collected from the 15 specimens are shown in Fig. 5. The orientation of their crystallographic axes with respect to the scattering geometry is unknown. The peaks arising from the O–H bond stretching are in the range of 3323–3463 cm−1, and they vary from sample to sample, depending on the crystal orientation, as mentioned above (Fig. 5).
4.1 Estimation of Fe content in the Al–Fe3+ series of epidotes
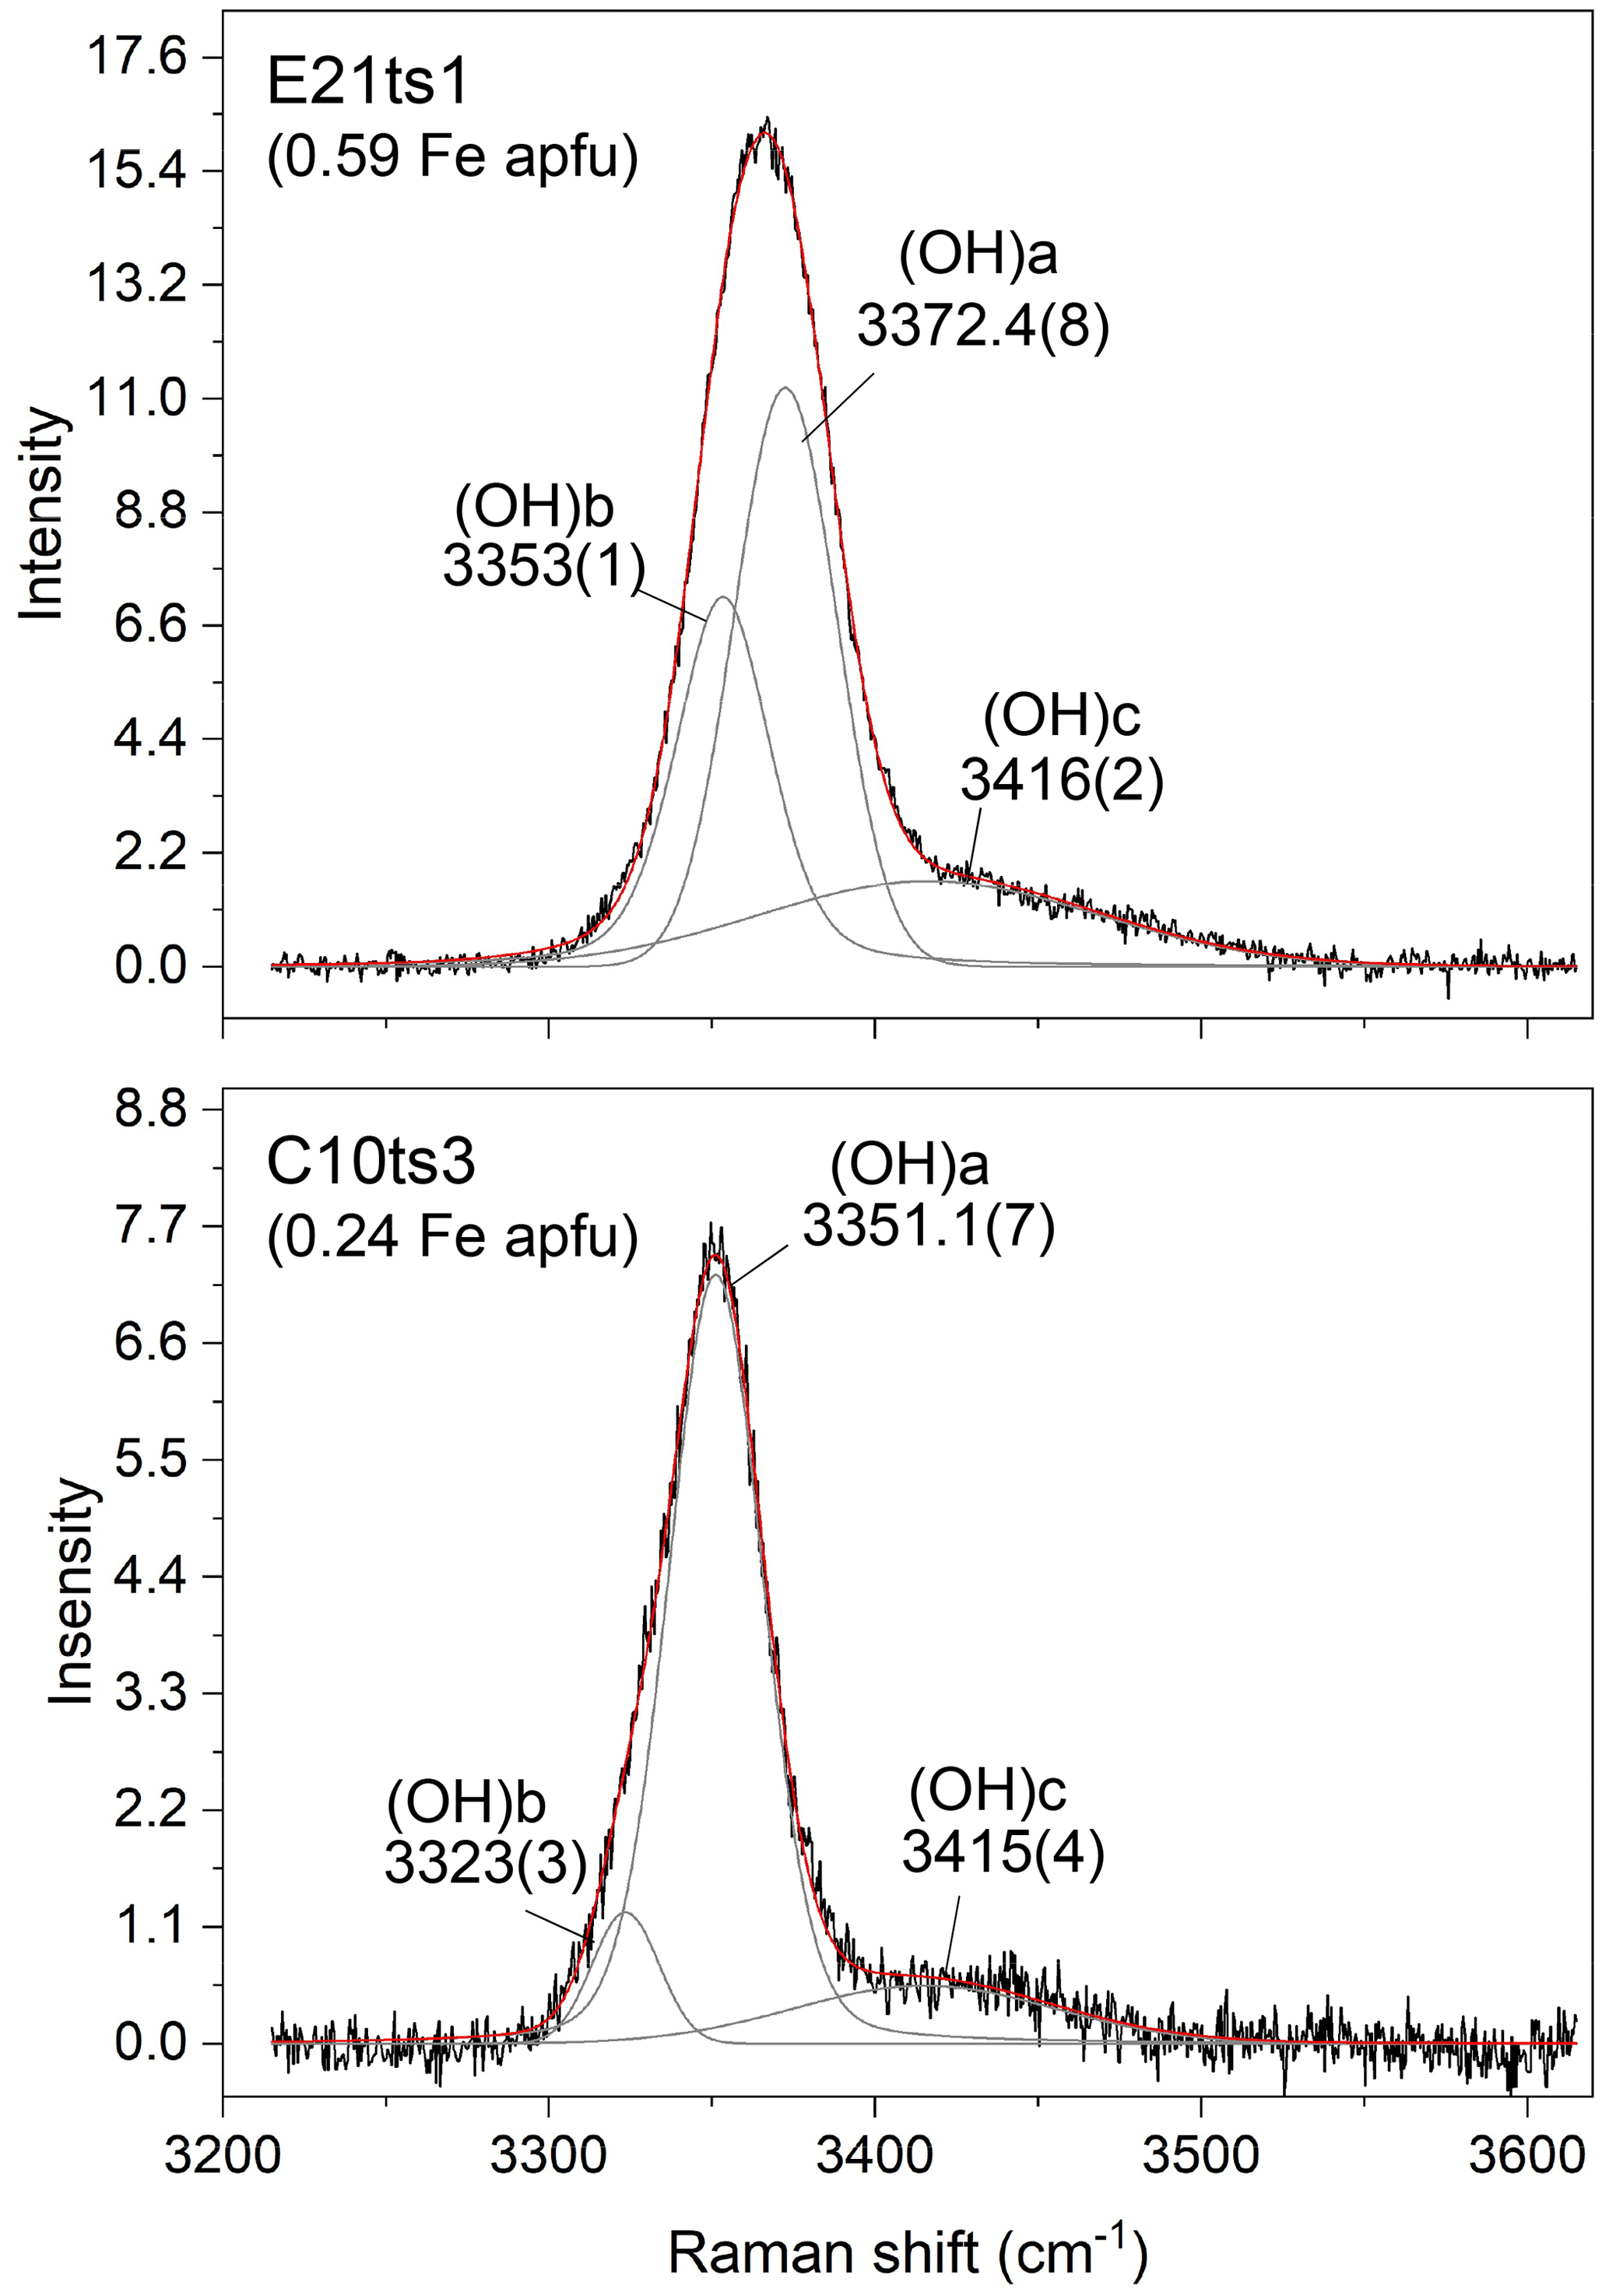
With the increase in Fe content, the peaks in the framework-vibration region (<1200 cm−1) shift toward lower wavenumbers. This is most probably due to the unit-cell enlargement with increasing Fe content (e.g. Franz and Liebscher, 2004; Giuli et al., 1999), i.e. an overall increase in the interatomic distances and, consequently, a decrease in the strength of chemical bonds. On the other hand, the peaks in the OH-stretching region shift toward higher wavenumbers with the increase in Fe content. Similarly to the FTIR spectra, multiple O–H bond stretching Raman peaks can appear due to the diversity of the chemical environments around the OH group, i.e. the substitution of trivalent transition elements, such as Fe3+, Mn3+, Cr3+, and V3+, replacing Al at octahedral sites. The shift of the O–H bond stretching to higher wavenumbers with Fe3+ content is due to the lengthening of O10 ⋯ O4 distance and consequent weakening of the H bonding, also seen by FTIR spectroscopy (Langer and Raith, 1974). The OH-stretching peaks are much broader than those in the framework-vibration region (Table 4). In fact, the OH-stretching Raman scattering consists of three overlapping components, (OH)a, (OH)b, and (OH)c, as exemplified with E21ts1 and C10ts3 in Fig. 6, due to different local chemical surroundings of the acceptor oxygen anion. Thus, the (OH)a, (OH)b, and (OH)c peaks can be assigned to O10–H ⋯ O4M1M1M3(AlAlAl), O10–H ⋯ O4M1M1M3(AlAlFe), and O10–H ⋯ O2, respectively. Similar two-mode behaviour (Chang and Mitra, 1971) of the OH-stretching peaks was also observed for other complex hydrous silicates (Leissner et al., 2015; Watenphul et al., 2016a). The possibility of O10–H ⋯ O4M1M1M3(AlFeFe) is excluded in both E21ts1 and C10ts3 in terms of their Fe content and the distribution coefficient between M3 and M1 of Fe in natural epidotes (e.g. Franz and Liebscher, 2004). It is expected that in both analytical points, Fe3+ occupies only M3. The higher-energy Raman signal is assigned to O10–H ⋯ O2 linkages (Nagashima et al., 2021) caused by hydrogen disorder (Gatta et al., 2012). The relative Raman intensities of the OH-stretching components can vary with the crystal orientation, which, along with the peak overlapping, impedes the accurate determination of the position of the OH-stretching peak. The latter in turn may hinder the correct estimate of the Fe content in the Al–Fe3+ epidote series based exclusively on the OH stretching, which requires a comprehensive analysis of the framework-vibration Raman peaks below 1200 cm−1.
Table 4The peak positions, ω (cm−1), and FWHM, Γ (cm−1), of the selected Raman peaks.
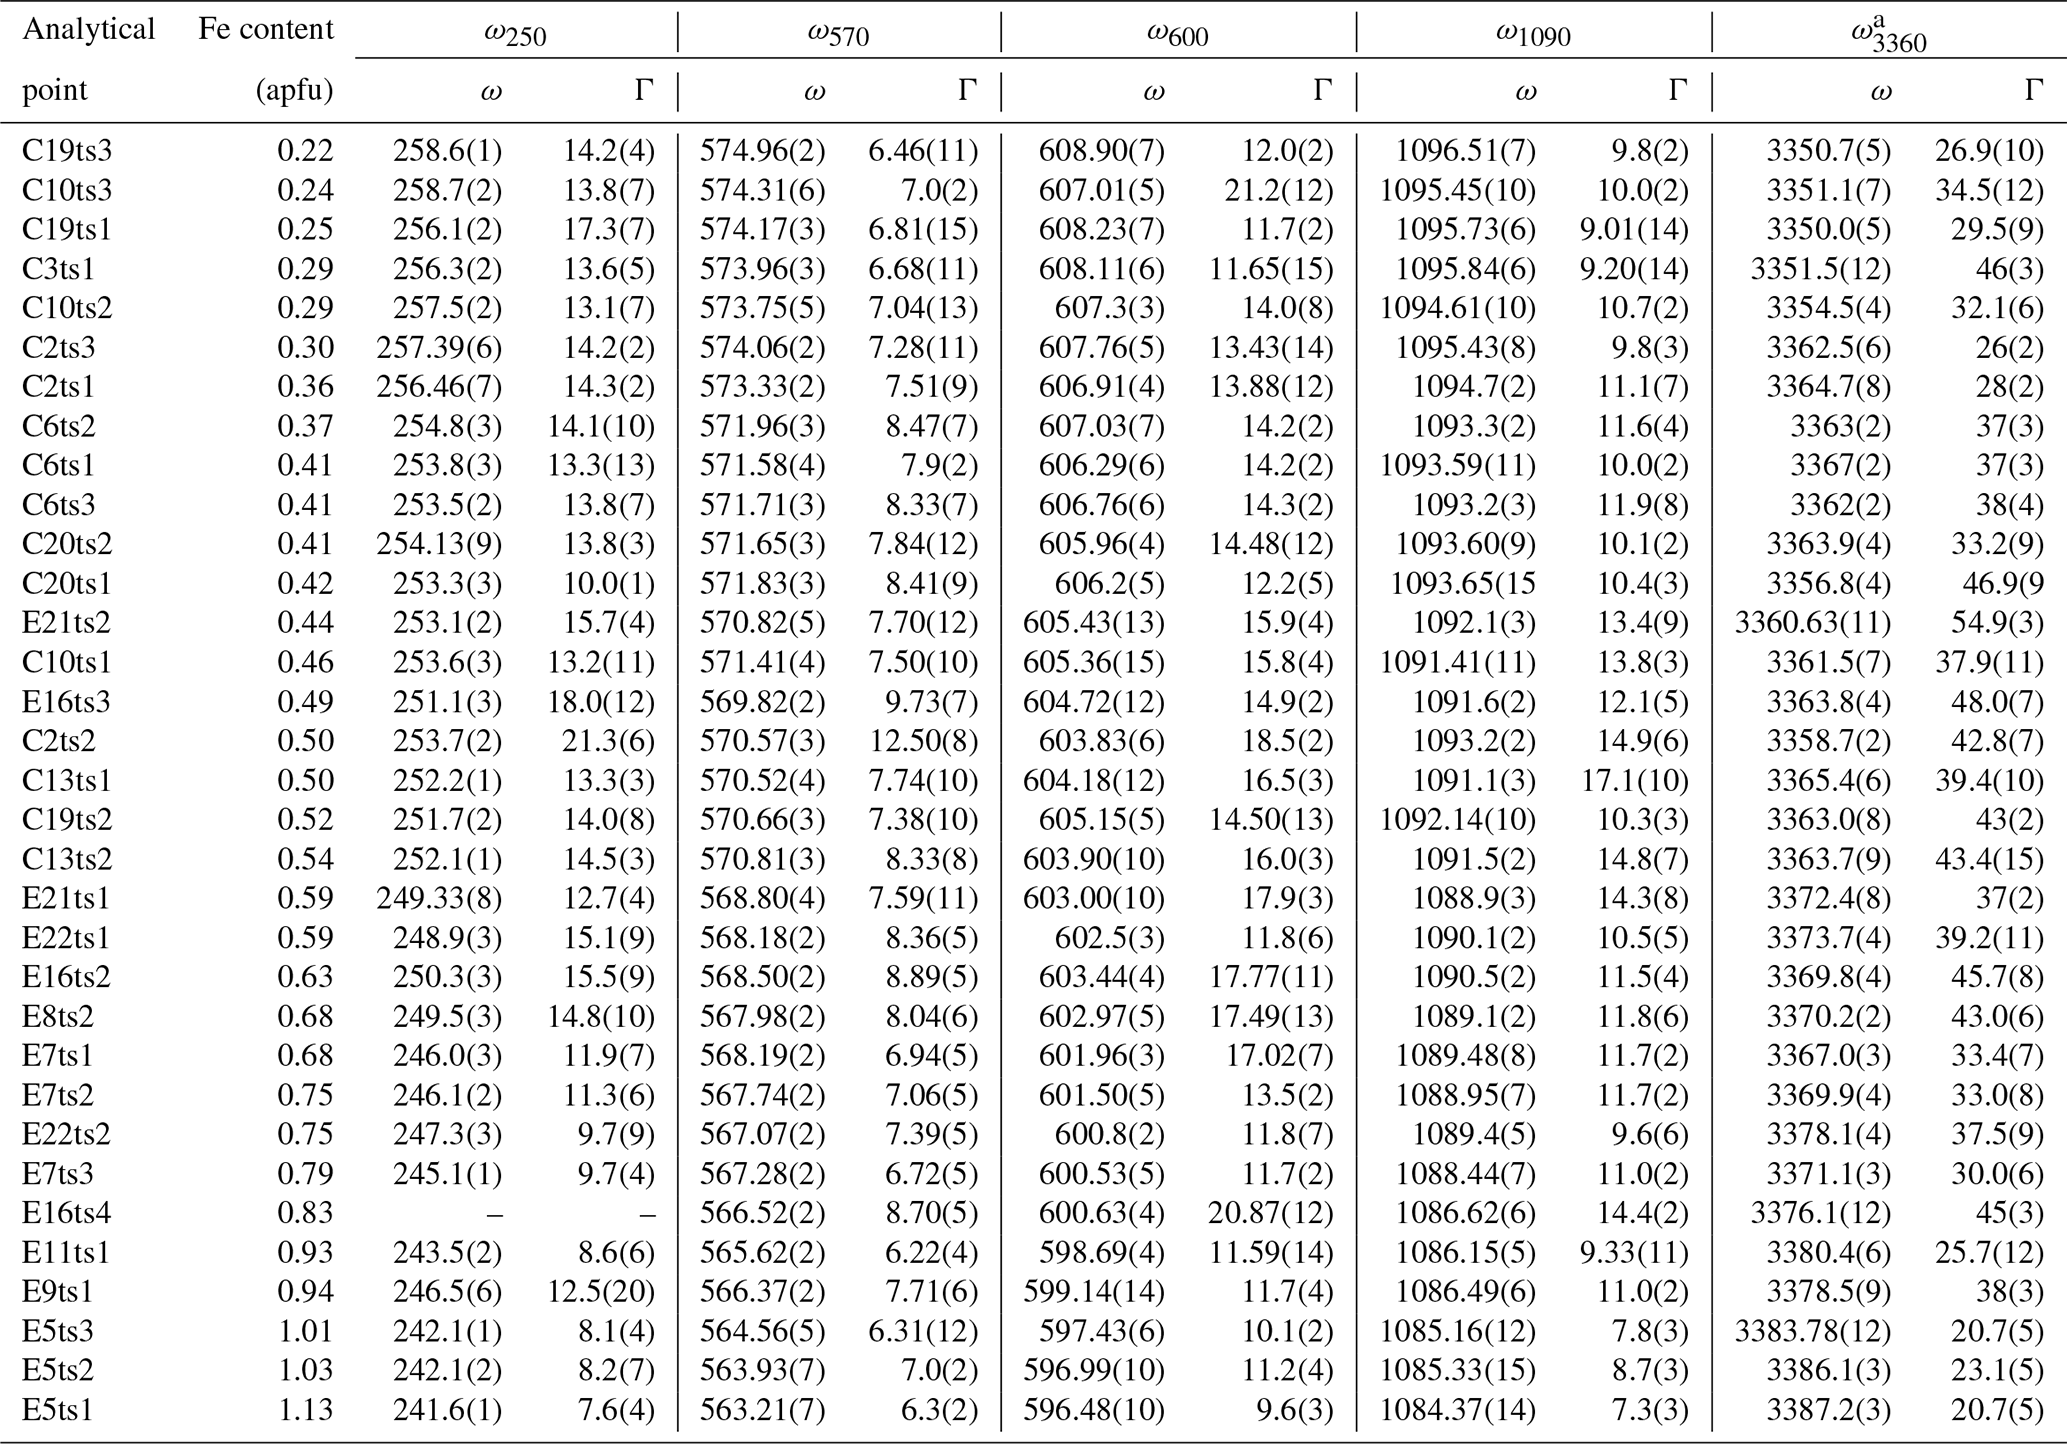
a Only the strongest signal is given if there is peak overlap.
Indeed, a compositional dependence of the framework vibrations (<1200 cm−1) is expected because the Fe substitution at the octahedral sites varies the geometry of octahedra as well as influences the geometry of SiO4 and Si2O7 entities (e.g. Franz and Liebscher, 2004). The thorough analysis of all peaks below 1200 cm−1 revealed that four peaks – near 250, 570, 600, and 1090 cm−1 – gradually decrease in wavenumber with the Fe-content increase (Figs. 7 and 8; Table 4).
The Raman peaks in the range 1000–1150 cm−1 are commonly ascribed to Si–O bond stretching (Table 1), but OH libration modes may also contribute to this spectra range (Winkler et al., 2008). FTIR spectroscopy on deuterated epidote samples indicates that the IR-active OH libration (i.e. Al–OH deformation) is at ∼1045 cm−1 (Petrusenko et al., 1992). Given that the IR-active and Raman-active OH-stretching modes are at nearly the same wavenumber (Tables 2 and S2), we can safely assume that the Raman-active OH librations should also be near 1045 cm−1. Hence, we attribute the Raman peak near 1090 cm−1 to Si–O bond stretching, and the high wavenumber of this peak indicates that it is generated by Si–O bond stretching of Si2O7 dimers, which exhibit shorter average Si–O bond lengths than the isolated SiO4 tetrahedra (e.g. Franz and Liebscher, 2004). Moreover, the 1090 cm−1 peak is strongest in the spectrum (Fig. 4), implying Si–O bond stretching along the a axis. Inspection of the structure (Fig. 1) suggests that the corresponding crystal phonon mode involves motions of O8, which is shared between M3O6 and Si2O7. The strong well-resolved peak near 570 cm−1 has been unambiguously assigned to Si–Obr–Si bending of the silicate dimer (Table 1), whereas the peak near 600 cm−1 has been controversially attributed to Si–Obr or Si–Onon bond stretching (Obr and Onon stand for the bridging and non-bringing oxygen atom). However, lattice-dynamics calculations (Dowty, 1987) as well as DFT modelling (Winkler et al., 2008) indicate that the Si–O bond stretchings are above 800 cm−1. Hence, we attribute the 600 cm−1 peak to O–Si–O bending/Si–O–Si rocking modes of the Si2O7 dimer. The peak near 250 cm−1 is most probably related to MO6 modes (Kozáková et al., 2022).
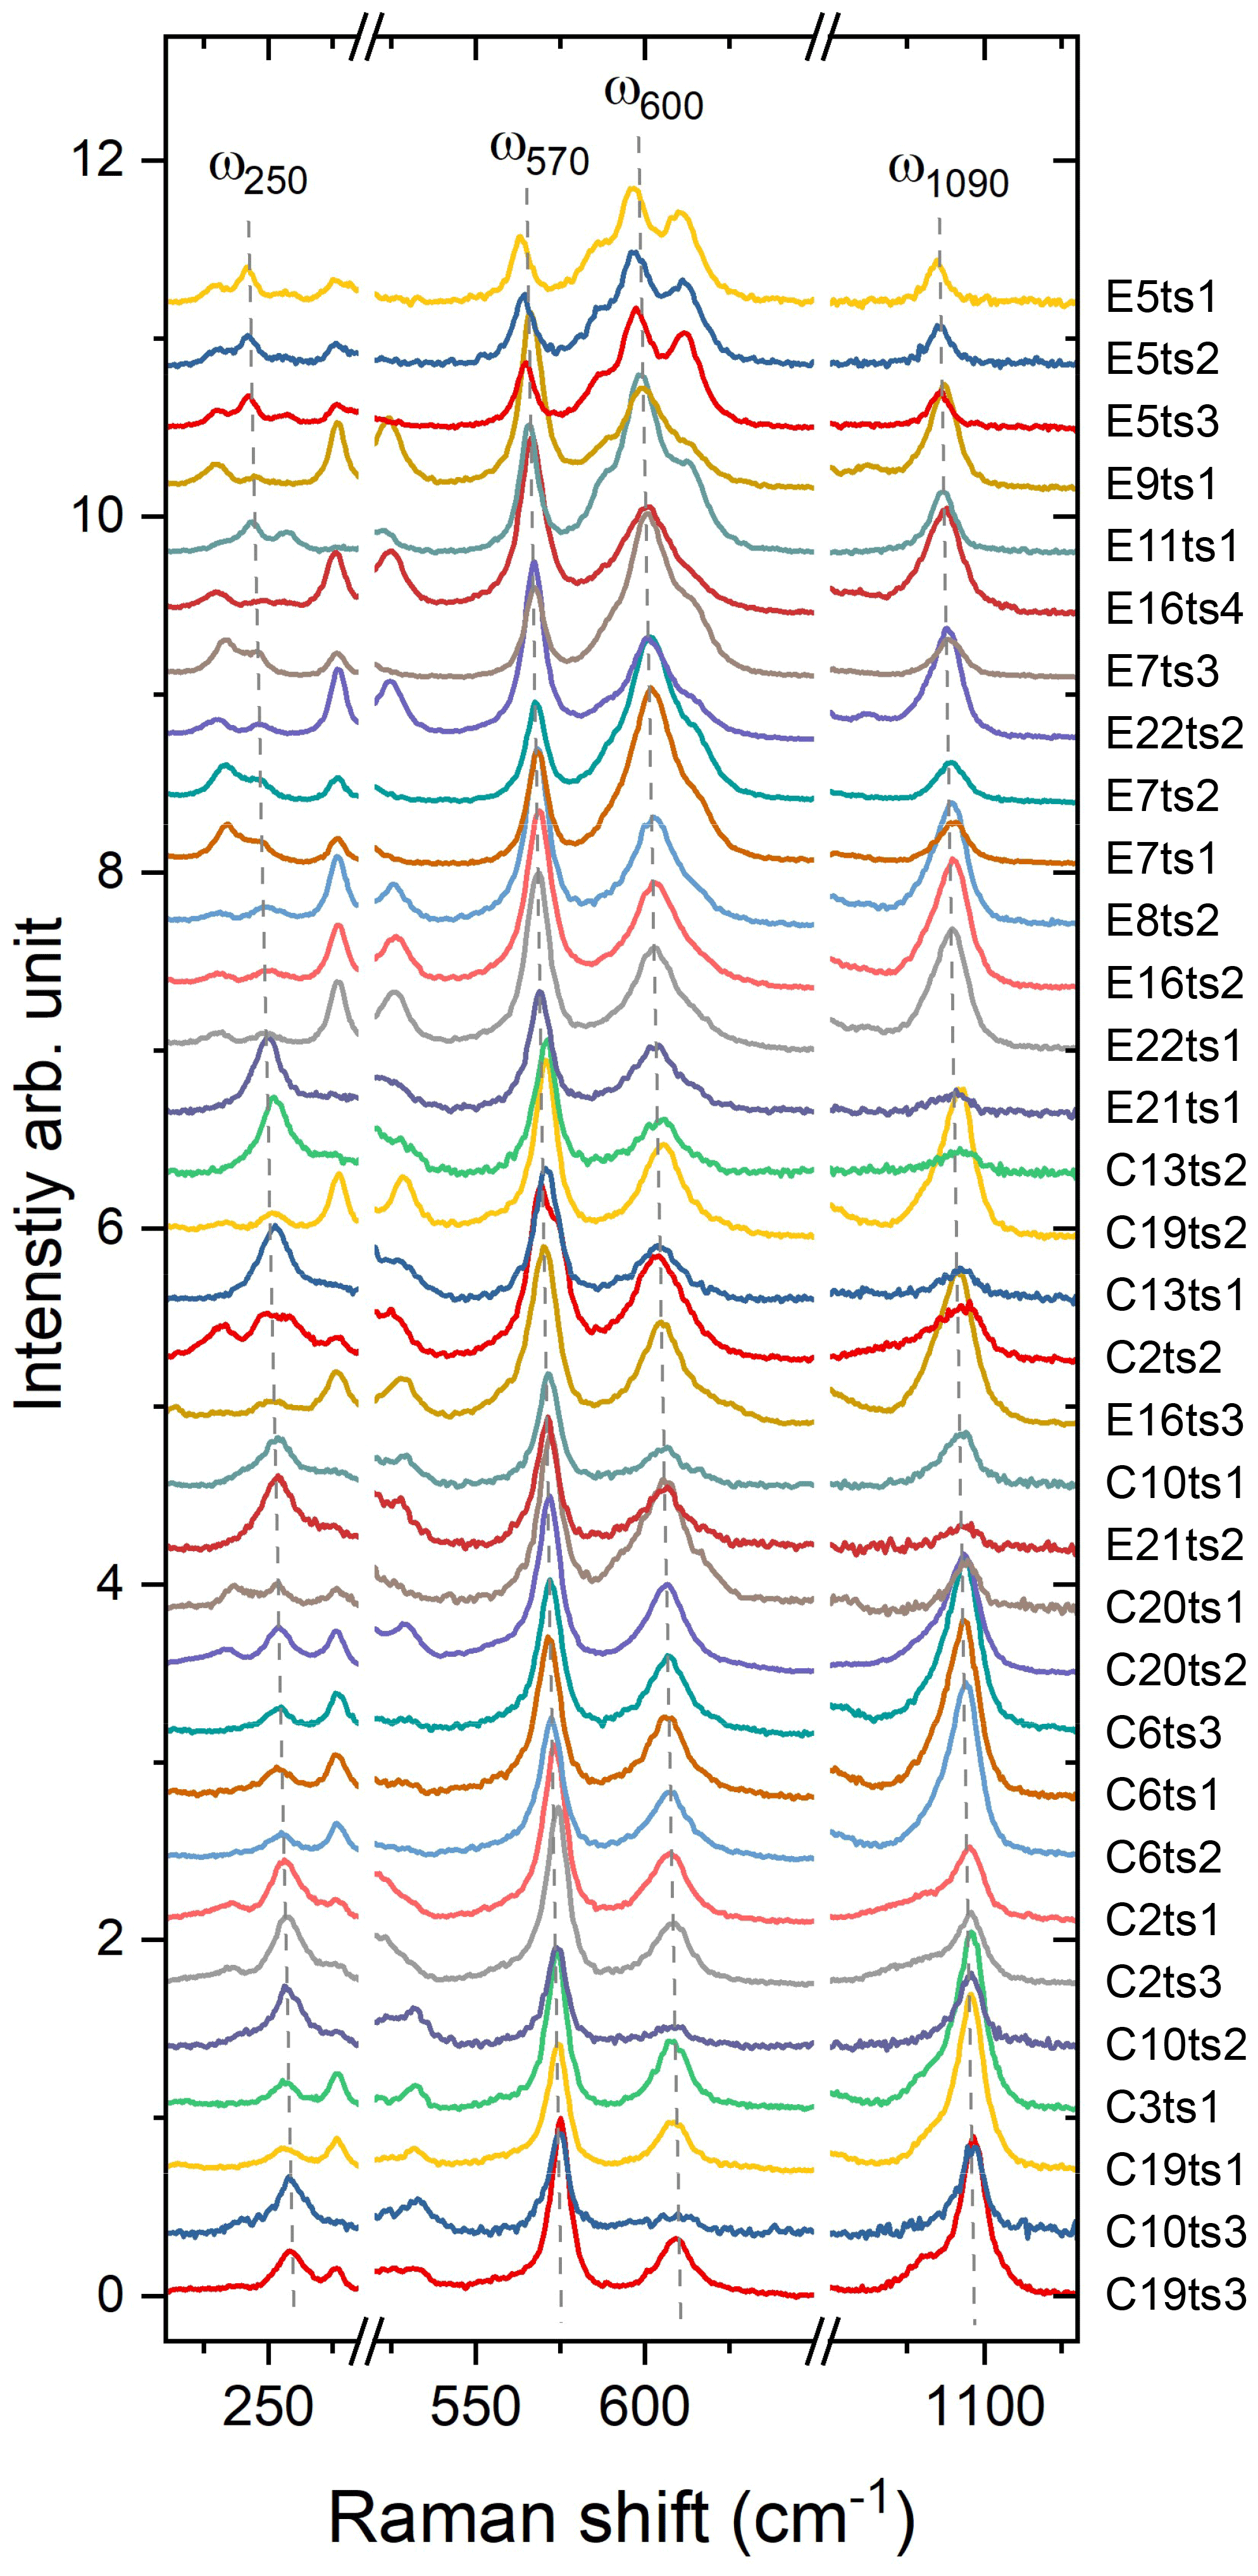
Figure 7Raman spectra showing on an enlarged scale the peaks ω250, ω570, ω600, and ω1090. The Fe content increases from the bottom to the top. For better comparison, the spectra were normalized to the height of the strongest peak and vertically offset.
The Fe3+ substitution for Al at M3 directly reflects on the position of the 250 cm−1 peak, ω250, because the cations at M1 and M2 in the epidote structure do not participate in the Raman-active mode. The increase in Fe leads to the elongation of M3–Oi distances and gives isotropic expansion of the M3 octahedra (e.g. Franz and Liebscher, 2004). In the present study, ω250 varies from 258.7(2) to 241.6(1) cm−1 when Fe increases from 0.22 to 1.13 apfu. However, this peak is not always strong and well resolved; for E16ts4 it is even absent (Fig. 7 and Table 4). Besides, the peak may be overlapped by neighbouring Raman signals related to other MO6 vibrational modes, which interfere with the proper peak distinction as reflected by the variation in FWHM from 7.6(4) to 21.3(6) cm−1 (Table 4). Although there is good linear correlation between the Fe content x (in apfu) and ω250, (Fig. 8a), it would be better to avoid using this peak for estimating the Fe content. Only ancillary use may be tolerated if this peak is separable from the adjacent peaks and observed with sufficient intensity.
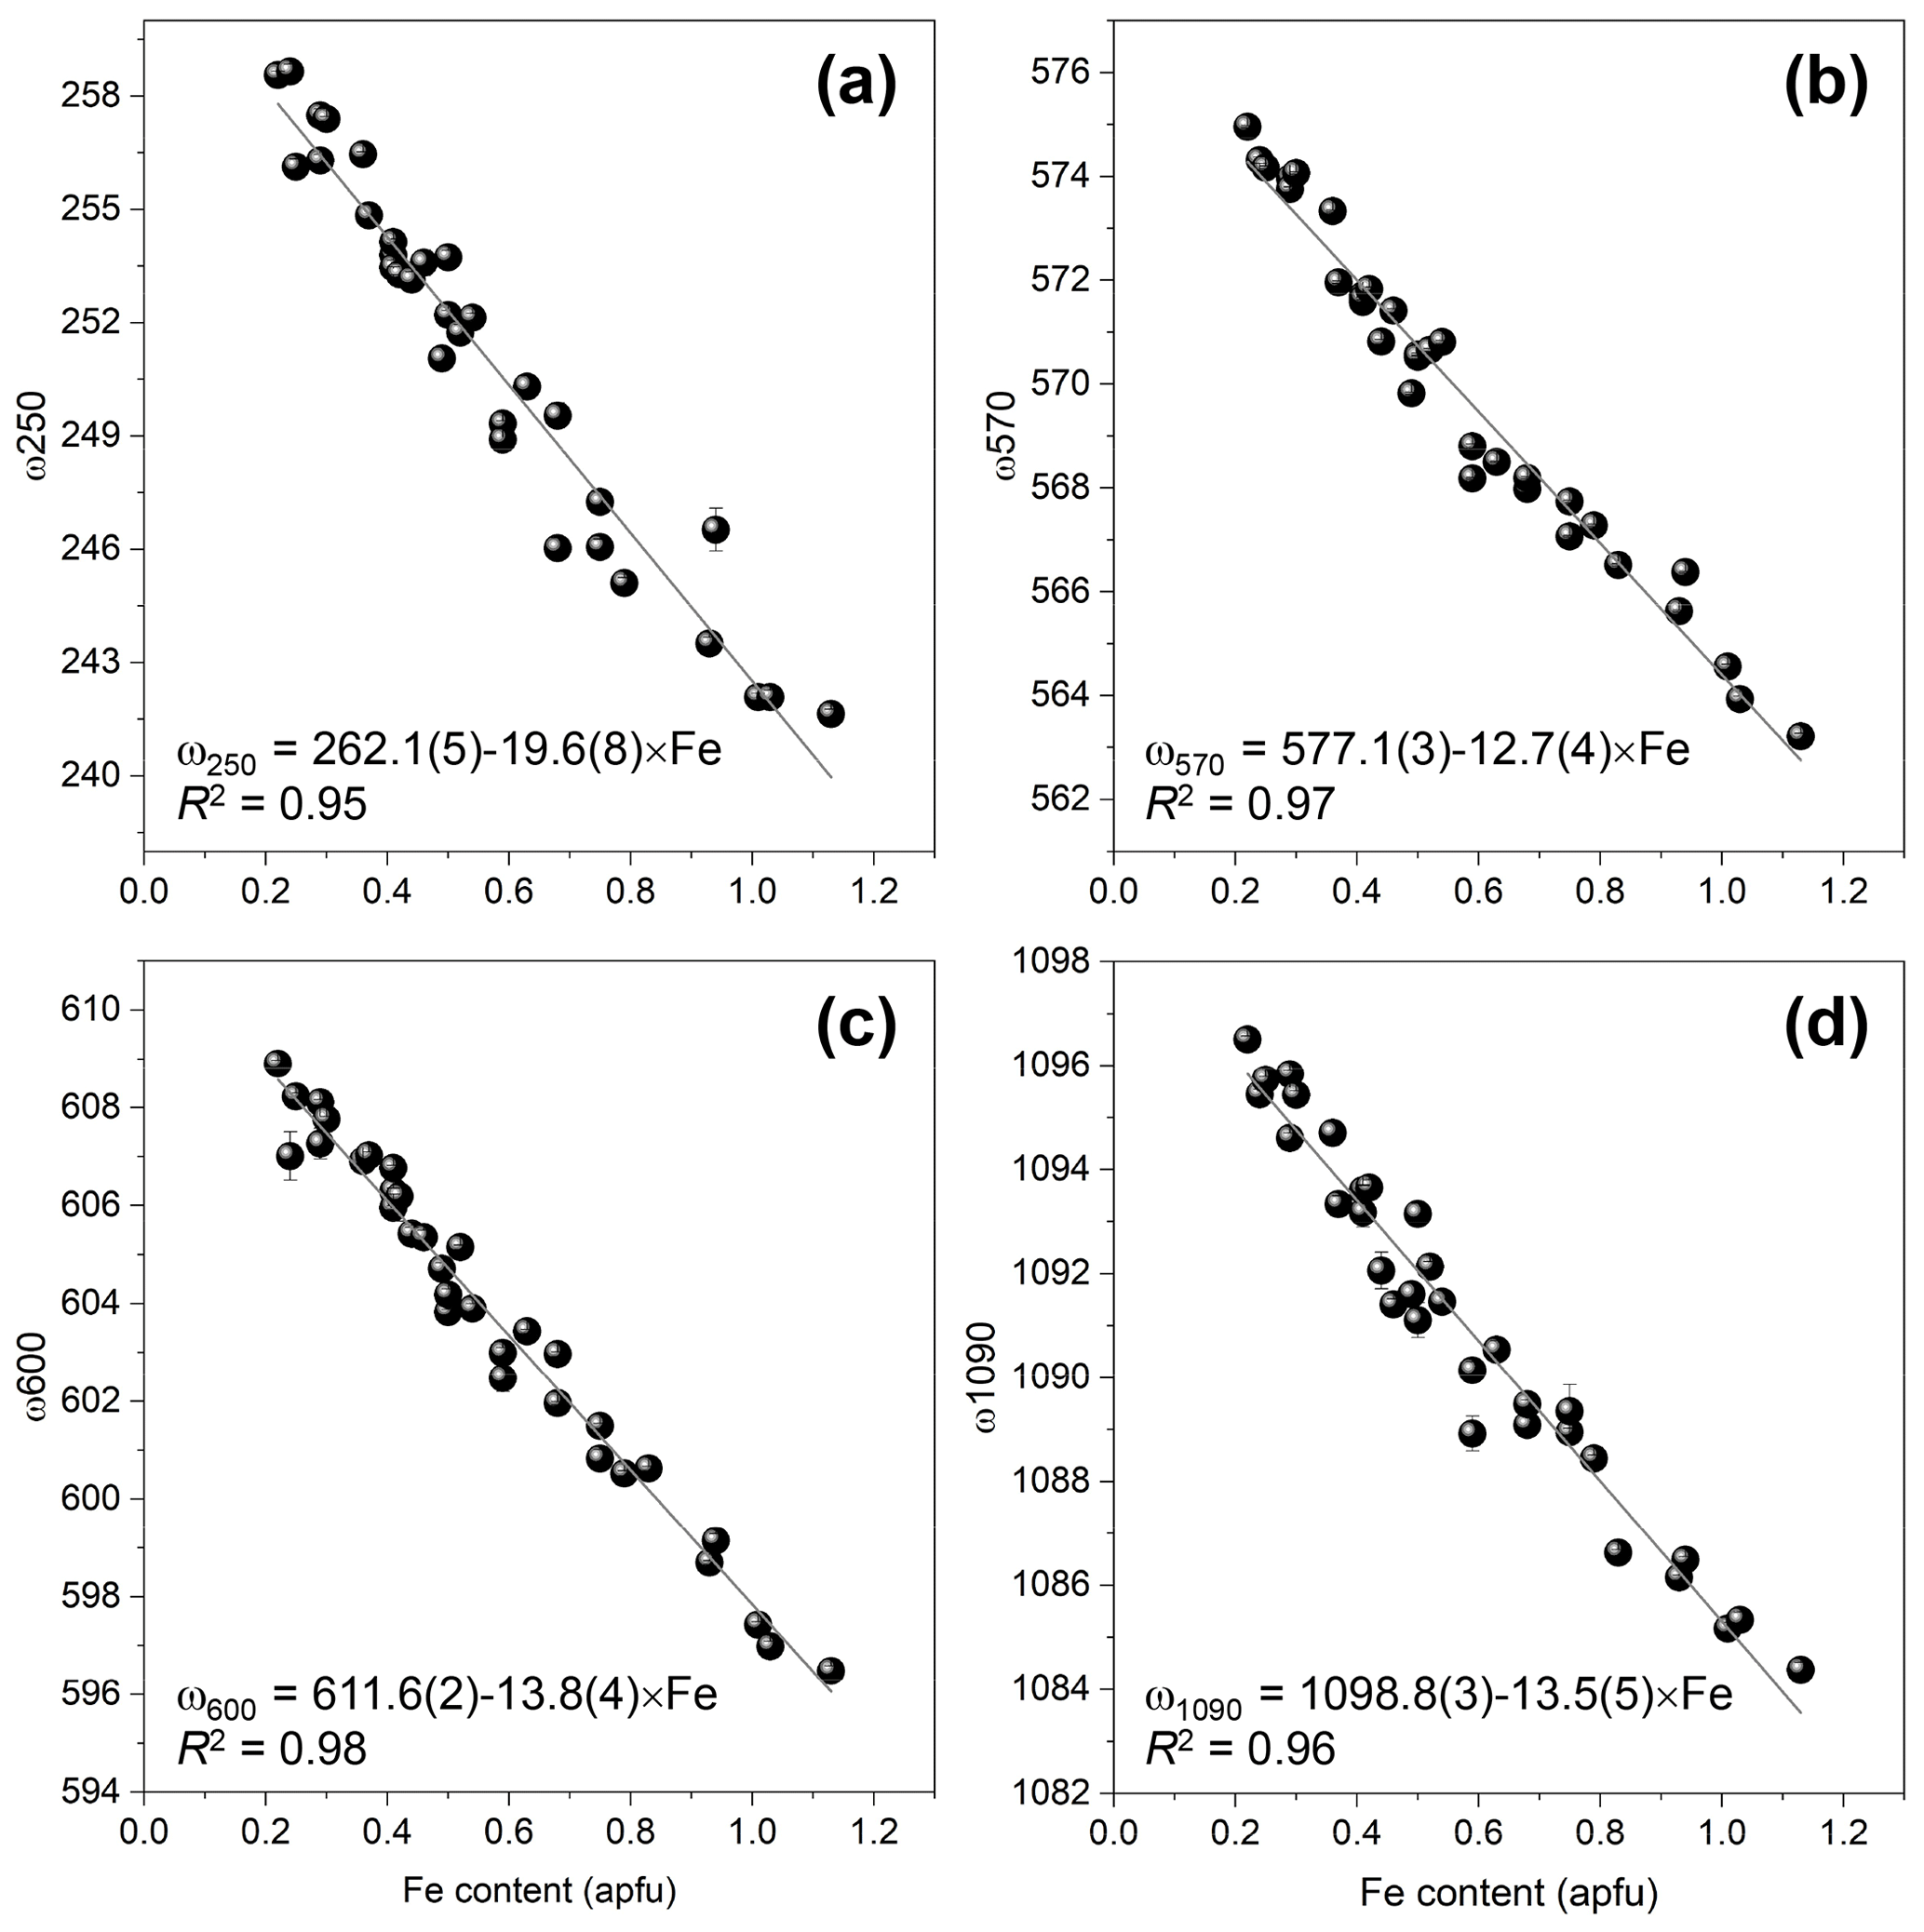
Figure 8The correlations between Fe content (apfu) and frequencies of ω250 (a), ω570 (b), ω600 (c), and ω1090 (d) determined the data listed in Table 4.
The 570 cm−1 peak, assigned to δ(Si–Obr–Si), is well resolved (Figs. 7 and 9) in all orientations. Moreover, it usually has a relatively small FWHM, <10 cm−1 (Table 4). The peak position varies from 574.96(2) to 563.21(7) cm−1 over the studied range of Fe content (Table 4). The peak reflects the compositional dependence of the Si1–O9–Si2 bridge in the epidote structure. It is known that the Si1–O9–Si2 angle shows a systematic decrease with increasing the Fe content in the Al–Fe3+ series of epidote, and it varies from 164.3∘ with 0.03 Fe apfu to 152.7∘ with 1.14 Fe apfu (Dollase, 1968; Bonazzi and Menchetti, 1995). Such systematic change in the angle with Fe content is attributed to the systematic variation in ω570, in addition to the expansion of the whole unit cell. The experimental wavenumber–Fe content (ω–x) data points match the linear trend (Fig. 8b). In terms of peak characteristics, we believe that the 570 cm−1 peak has high reliability in estimating Fe content in epidotes, using the relation with accuracy ± 0.04 Fe apfu.
In general, the peaks near 600 and 1090 cm−1 are also promising for use in Fe-content estimation, because it is not difficult to identify them (Fig. 9). The corresponding ω(x) linear trends are (Fig. 8c) and (Fig. 8d).
In summary, the equation of ω570(x) should be used with the highest priority for a quantitative determination of the Fe3+ content in Al–Fe3+ series epidotes, whereas the equations of ω600 and ω1090 can also be applied if the peaks are confidently separated from the adjacent peaks.
The proposed linear trends for the peaks around 570 and 1090 cm−1 by Limonta et al. (2022) are corresponding to and corresponding to , which are steeper than ours. This may be caused by the different range of Fe content in the studied specimens.
4.2 Effect of strontium
The substitution of Sr for Ca is known as one of the common chemical varieties in epidote-group minerals, and the Sr content attains up to 1 apfu (e.g. Akasaka et al., 2000; Armbruster et al., 2002). Commonly, Al–Fe3+ epidotes in metamorphic rocks contain up to ∼0.1 Sr apfu, and such compositions were also reported from ultra-high-pressure metamorphic rocks (e.g. Nagasaki and Enami, 1998). Among the samples studied here, Sr is partially distributed in E16 and E17. These epidotes are associated with prehnite and/or pumpellyite formed under the low-grade metamorphic condition.
Table 5Sample localities and chemical formulae of each analytical point in Sr-bearing epidote.
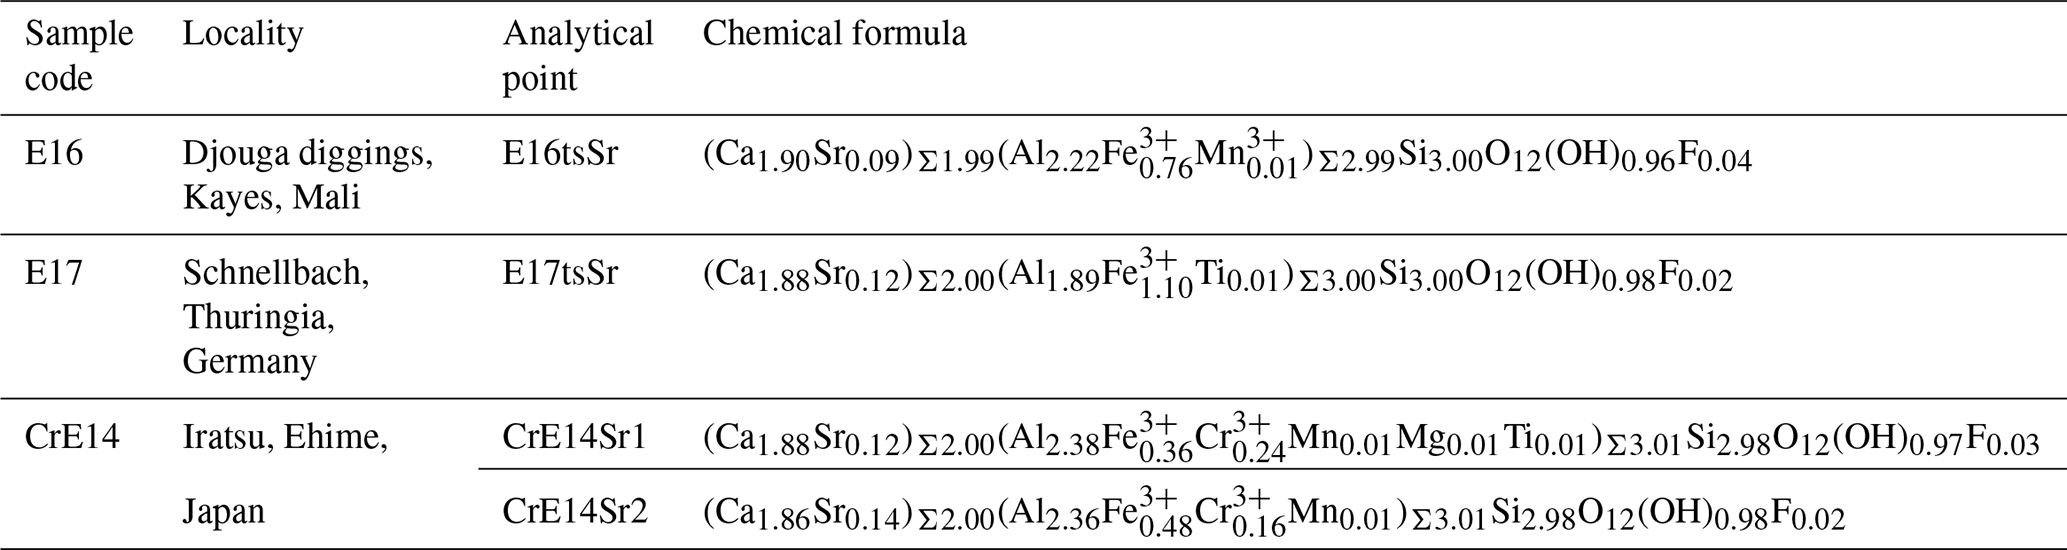
To evaluate the influence of Sr on the accuracy in estimating Fe content, Raman spectra were collected from Sr-bearing epidote, such as E16tsSr and E17tsSr (Table 5). The analytical point of E16tsSr contains 0.09 Sr and 0.76 Fe apfu (Table S3). Compared to the spectrum of Sr-free E22ts2 containing 0.75 Fe3+ apfu, no significant difference was observed (Fig. S1 in the Supplement). The estimated Fe content of E16tsSr using the ω570(x) equation was 0.73(5) apfu with 567.78(1) cm−1, which is consistent with the observed Fe content within the standard deviation. Moreover, the specimen labelled E17 is characterized by Sr and high Fe content. The Sr and Fe contents of the area (E17tsSr) where the Raman spectrum was collected were 0.12 and 1.10 apfu, respectively (Table S3). The peak position of ω570(x) was 563.74(3) cm−1, leading to 1.05(6) Fe apfu using the equation of ω570(x). These two spectra, E16tsSr and E17tsSr, suggest that the samples containing up to around 0.12 Sr apfu do not disturb the estimation of Fe content using the ω570 equation determined from the results of the Al–Fe3+ series of epidote.
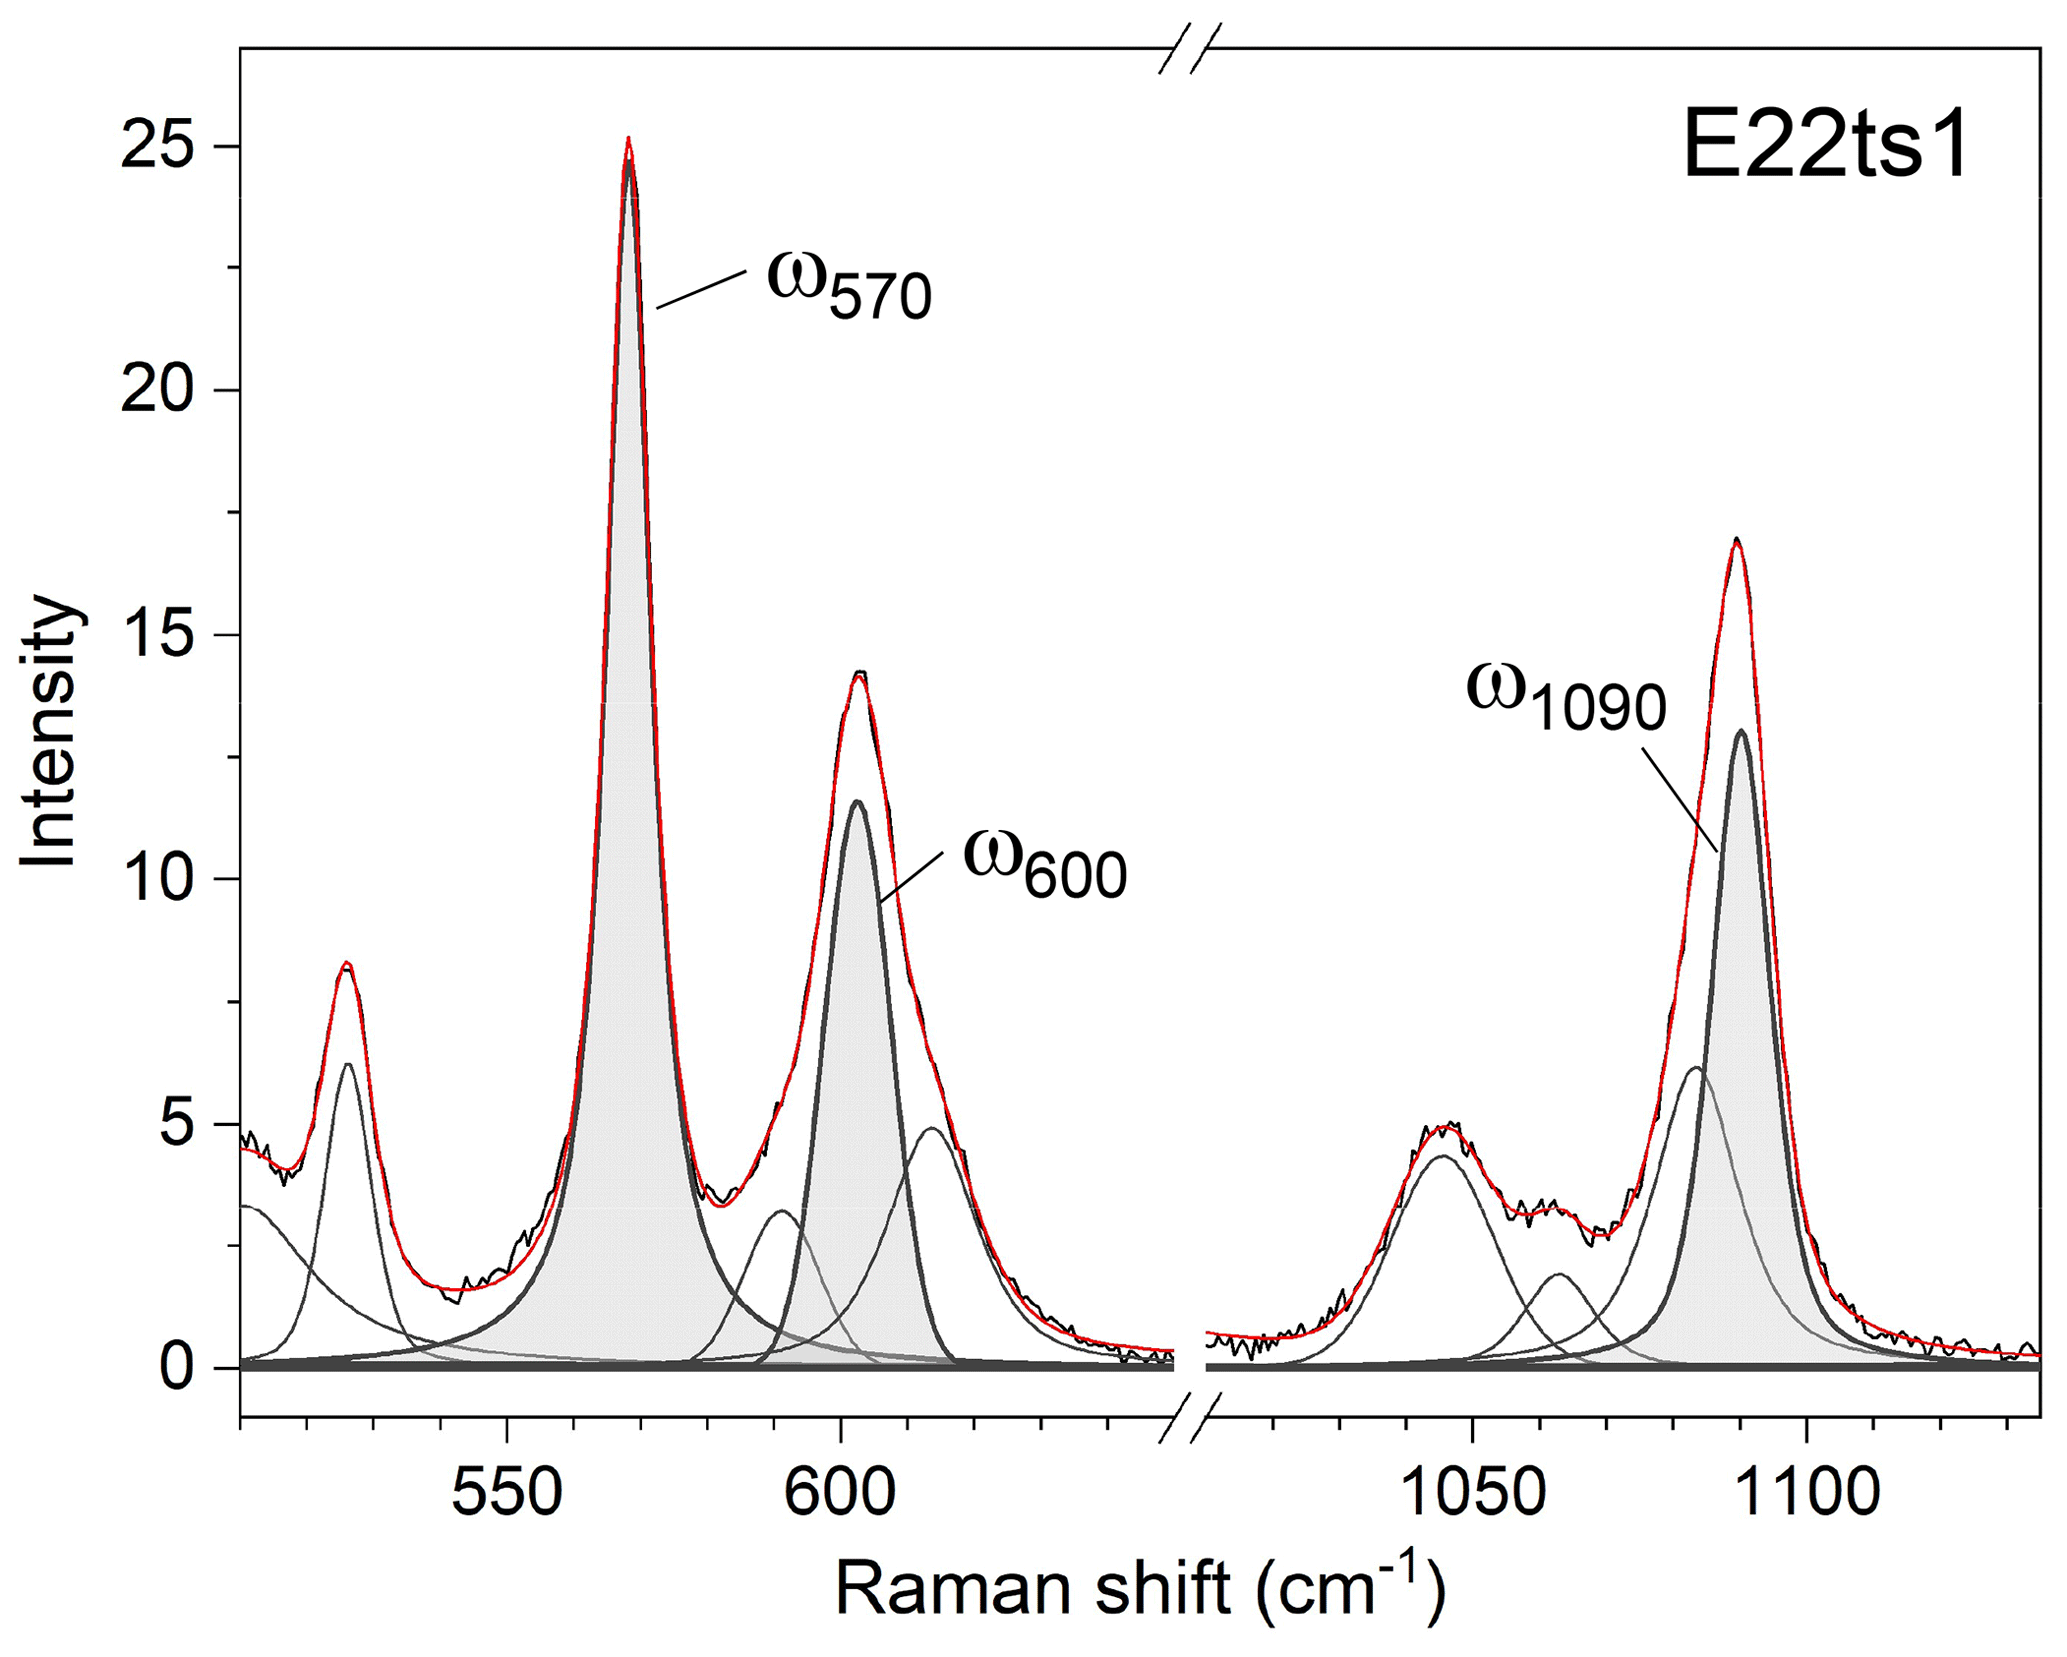
Figure 9Raman spectra of E22ts1 in the range of 510–650 and 1010–1135 cm−1 along with the fitting pseudo-Voigt functions.
4.3 Effect of chromium
The Sr+Cr-bearing epidote (specimen code: CrE14) from Iratsu, Ehime, Japan, studied by Nagashima et al. (2006, 2007) was also available for the current study (Tables 5 and S3). Since the Sr content of CrE14tsSr1 and tsSr2 is 0.12 and 0.14 apfu, respectively, the effect of Sr to estimate the Fe content can be negligible. The Fe content of CrE14tsSr1 and tsSr2 estimated from the ω570(x) relation proposed above is 0.52(4) apfu and 0.58(4) apfu, respectively (Fig. 10 and Table 6), whereas the content of Fe3+ determined by EPMA is less: 0.36 and 0.48 apfu, respectively (Table 5). On the other hand, the sum of the octahedrally coordinated non-aluminium trivalent cations Me3+ in each analytical point was 0.61 apfu (0.36 Fe3+ + 0.24Cr3+ + 0.01Mn) for CrE14tsSr1 and 0.65 apfu (0.48Fe3+ + 0.16Cr3+ + 0.01Mn) for CrE14tsSr2 (Tables 5 and S3), which is higher than the estimated Me3+ content considered Fe3+. This indicates that a content of VICr3+ more than 0.16 apfu leads to overestimation of Fe3+ via the ω570(x) relation while underestimating the total numbers of octahedrally coordinated non-aluminium trivalent cations Me3+. A previous study of natural Cr+V-bearing clinozoisite has revealed that octahedrally coordinated V3+ and Cr3+ promote structural defects due to their smaller electronegativity as compared to that of Fe3+ (Nagashima et al., 2021). This in turn causes broadening of the Raman peaks (Nagashima et al., 2021), which can also be seen in the spectra collected from the CrE14 specimen, particularly for the peaks near 95 and 250 cm−1 (Tables 4 and 6). Their FWHMs are approximately 2 times larger than the FWHMs of ∼10 cm−1 for Cr3+-free clinozoisite or epidote (Tables 4 and 6). It is worth noting that the deficiency of Σ(Cr+Fe) in the CrE14 crystal relative to that obtained by EPMA has been reported by X-ray single-structure analysis (SXRD: 0.65 apfu, EPMA: 0.87 apfu = 0.36Cr3+ + 0.51Fe3+; Nagashima et al., 2011), which also implies the presence of structural defects induced by VICr3+. Hence, although the occurrence of Cr-bearing epidote is less common, the presence of Cr apfu can be recognized by the broader Raman peaks near 95 and 250 cm−1, having a width >17 cm−1, and in this case ω570(x) cannot be used for proper quantification of Fe3+. More Cr-bearing samples need to be analysed to verify the minimum threshold value of Cr content that does not affect ω570(x).
Table 6The peak position, ω (cm−1), and FWHM, Γ (cm−1), of the selected Raman peaks for Sr+Cr-bearing epidote and reference materials.

a Me3+ content of Czo-ts1 and Czo-ts2 is 0.14Fe3+ and 0.46Cr3+ + 0.14V3+ + 0.02Fe3+, respectively (Nagashima et al., 2021).
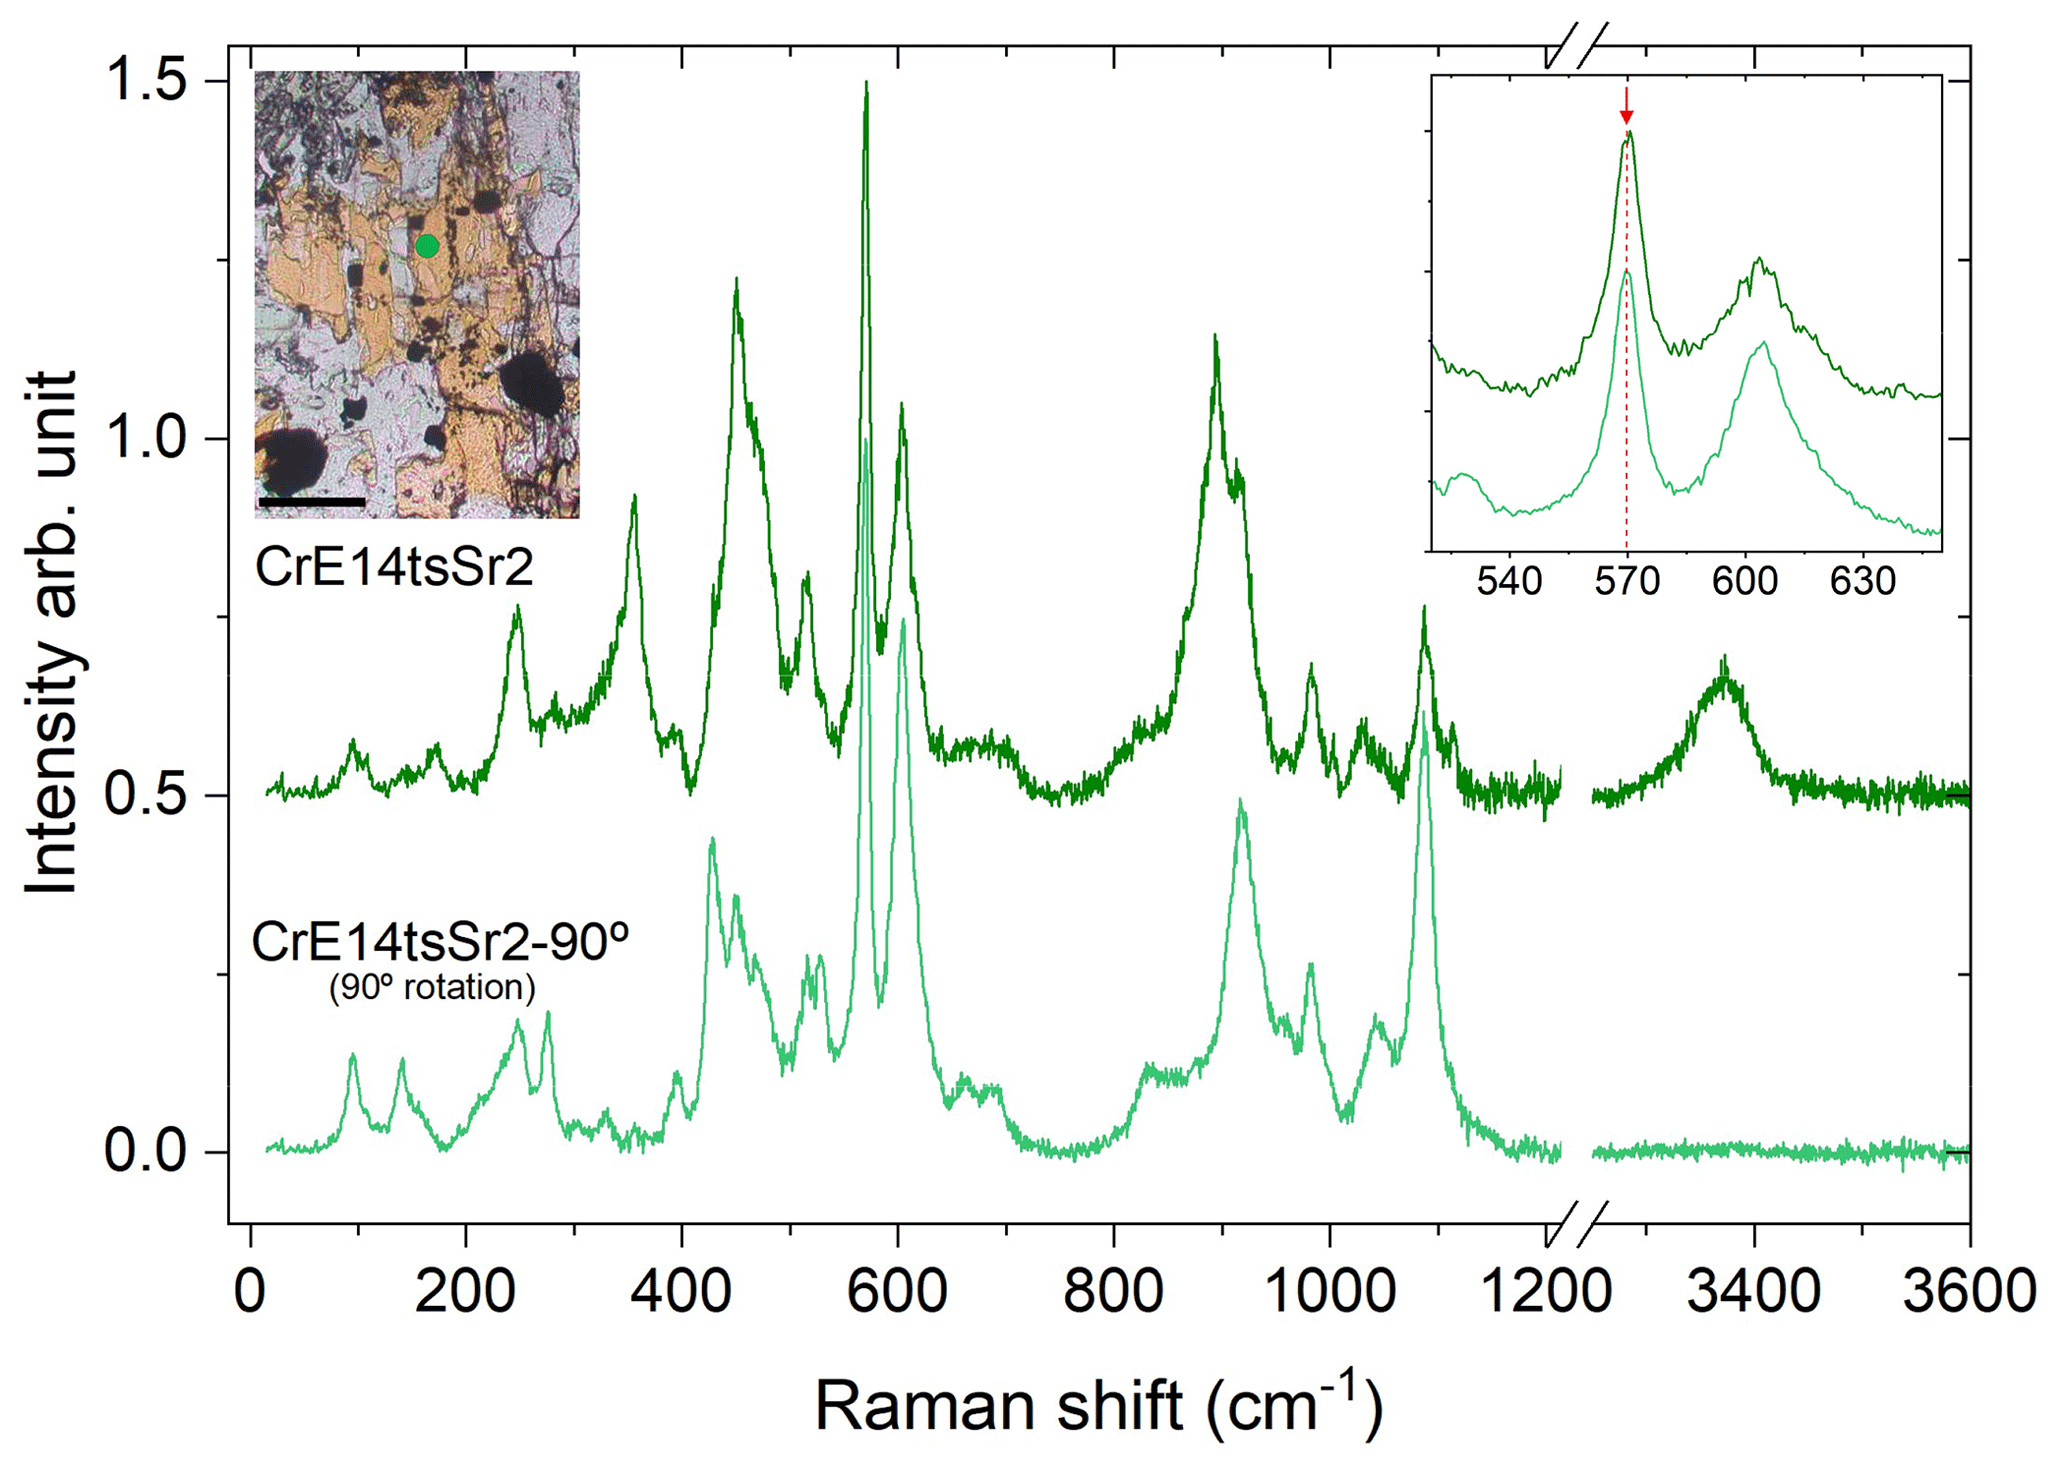
Figure 10Orientational dependence of the Raman spectra of CrE14tsSr2. The optical microphotograph shows the Sr+Cr-bearing epidote (yellow) corresponding to the orientation of the Raman spectrum of CrE14tsSr2 collected (green line). The spectrum of CrE14tsSr2-90∘ was collected after 90∘ rotation. The scale bar in the microphotograph is 100 µm, and the analytical point is represented in the green circle.
4.4 Tips for data collection
The orientation effects on the Raman scattering should also be taken into account when collecting a Raman spectrum from a randomly oriented epidote grain, with unknown directions of the crystallographic axes. As can be seen in Fig. 4, the peak near 570 cm−1 is well observed and separated from the other peaks in all parallel-polarized spectra. Since commercial Raman spectrometers are commonly designed to measure chiefly parallel-polarized Raman scattering, this peak is always well resolved (Figs. 5 and 10). Hence, we recommend the utilization of this peak for Fe3+-amount determination via Raman spectroscopy for any randomly oriented grain. If the use of the other three peaks (near 250, 600, and 1090 cm−1) is desired to verify the content of Fe3+ derived from ω570, one should find the most suitable orientation of the grain to better resolve the corresponding peak. To utilize the peak near 250 cm−1, it would be better to rotate the sample within the plane perpendicular to the laser beam to a position where the OH-stretching peak is strongest (Fig. 10), because in such an orientation the 250 cm−1 peak is better resolved. For the utilization of the peaks near 600 and/or 1090 cm−1, it is advisable to double-check their positions also in a 90∘ orientation with respect to the orientation where the OH stretching is strongest (Fig. 10), because then these peaks will be better resolved from the neighbouring Raman signals.
The ω570(x) equation proposed in this study was applied to estimate the Fe content for a selected Al–Fe3+ epidote in the RRUFF database. The processed Raman data collected from the unoriented sample using a 532 nm laser were compared. The wavenumber with a maximum peak count derived from the 570 cm−1 peak and the estimated Fe content are listed in Table 7. The Fe contents provided in RRUFF have also been added. The estimated Fe contents excluding R040092 are consistent with those derived by EPMA within the standard deviation. The estimated Fe content in sample R040092 is higher than that reported in RRUFF by Δ=0.11 apfu (Table 7) when the spectrum collected with the 532 nm laser was considered. However, the Fe content was calculated to 1.05 apfu, which is much closer to the reported value of 1.02 apfu if the peak position (563.73 cm−1) obtained using a 785 nm laser is applied. In the case where the data were collected from the same analytical area, the peak position should be identical, but they differ in ∼1 cm−1. Such differences may be due to local chemical variety related to unidentical analytical areas or calibration of the spectrometer. It is very clear that if the determination of the mineral chemistry is based on peaks with one-mode behaviour, one should take care to properly calibrate the spectrometer and, when possible, to collect a reference spectrum from a sample with known composition to verify that the corresponding data points do not systematically deviate from the linear trends proposed here.
Table 7Comparison between the Fe contents derived from EPMA as well as from the ω570(x) dependence proposed in this study, using data for Al–Fe3+ epidote provided in the RRUFF database.
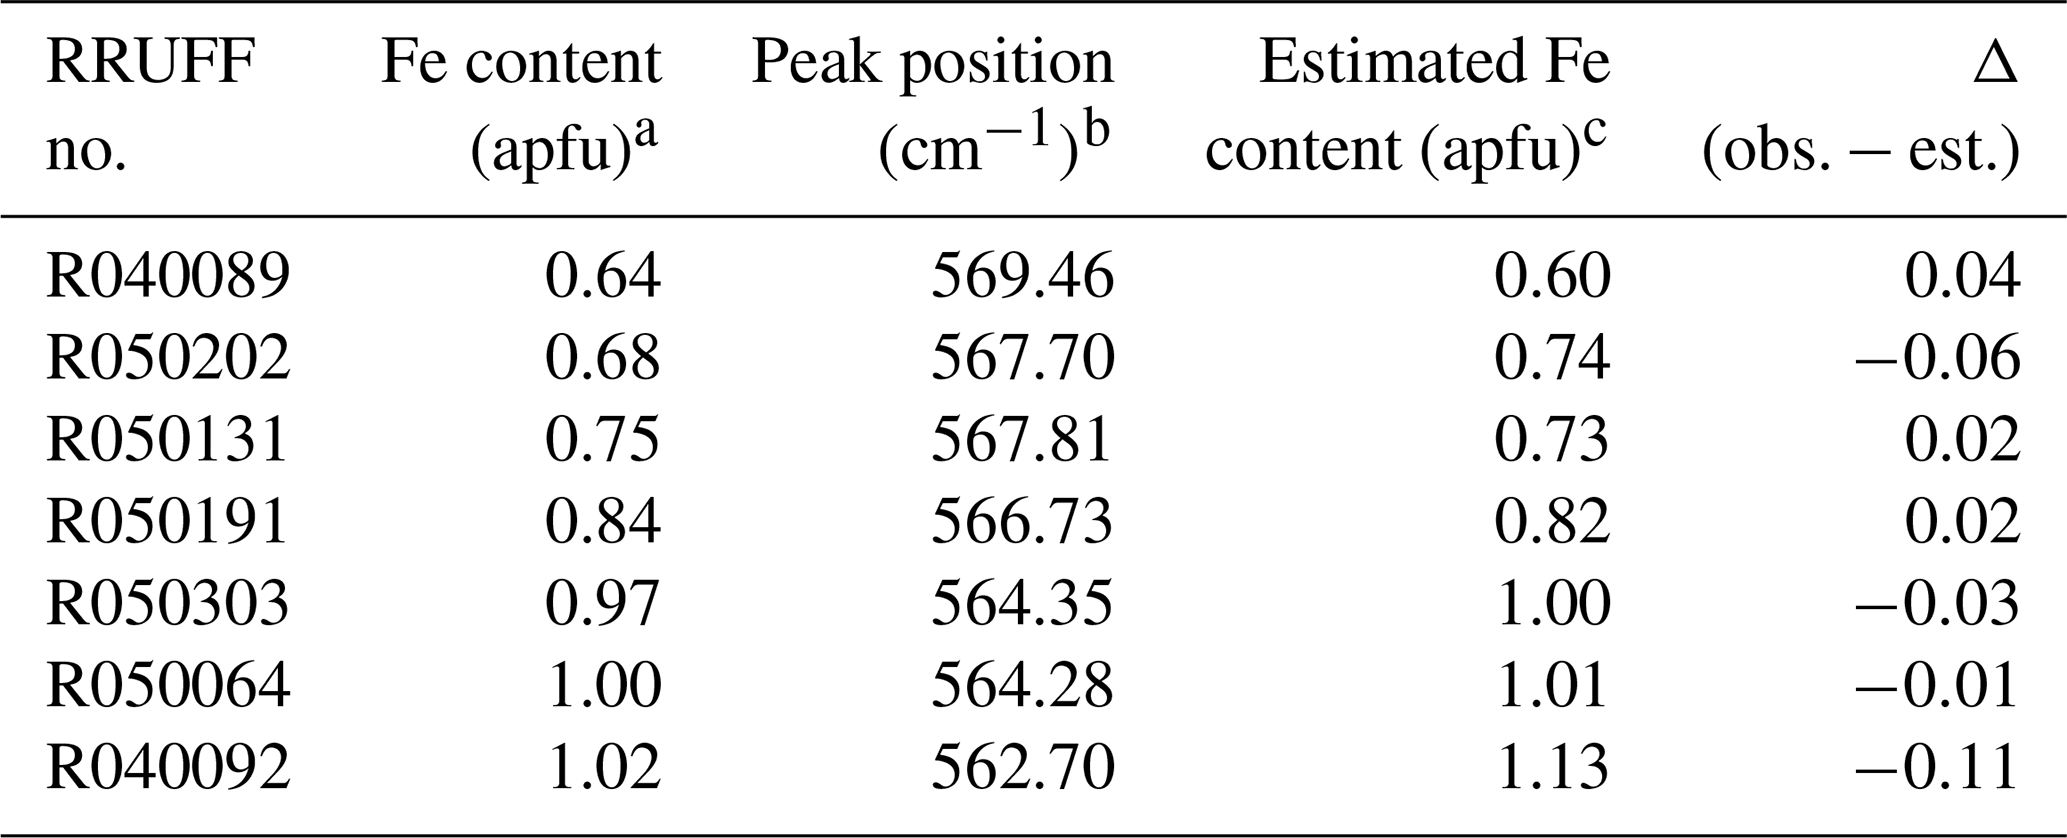
a The Fe content (apfu) provided by the RRUFF database. b Wavenumber of the maximum intensity count corresponding to the 570 cm−1 Raman peak. c Estimated Fe content (apfu) using the ω570(x) relation.
An open question remains whether the ω570(x) relation can also be used to determine the Fe3+ content in Mn3+-containing samples, such as piemontite. The ionic radius of Mn3+ (0.645 Å) is similar to that of Fe3+; octahedrally coordinated Mn3+ displays a Jahn–Teller effect. Although a split of the OH-stretching peak of piemontite caused by the Jahn–Teller effect was reported by Della Ventura et al. (1996), the effect of Mn3+ in the lattice vibration region of the epidote-group mineral has not been investigated until now. Further studies are needed to check whether the equation proposed by the systematic study of the Al–Fe3+ series is also applicable to Mn3+-bearing samples.
On the basis of a comprehensive Raman-scattering analysis of 33 areas from the 15 natural clinozoisite and epidote studied here, we provide a tool to determine Fe3+ content in the epidote group with a spatial resolution the same as that of WD-EPMA. As Raman spectroscopy is a non-destructive, preparation-free, quick, and easy-to-handle method, the following guidelines are intended to help to estimate the Fe content in the Al–Fe3+ series of epidote.
The spectrometer should be carefully calibrated using the standard material. The T2g mode at 520.5 cm−1 of a Si wafer is recommended for achieving the best results from the ω(x) relations proposed here.
The OH-stretching peaks are much broader than those in the framework-vibration region, and they are composed of overlapping components due to different local chemical surroundings (Figs. 4, 5, and 6). Moreover, the relative Raman intensities of the OH-stretching vibrations vary with the crystal orientation. Thus, the sole use of OH-stretching Raman peaks is not appropriate for the correct estimate of the Fe content.
With the increase in Fe content, the peaks in the framework-vibration region (below 1200 cm−1) gradually shift toward lower wavenumbers. Four well-resolved peaks, near 250, 570, 600, and 1090 cm−1, were selected as representatives in this study (Fig. 7). The peaks near 570 and 1090 cm−1 are assigned to the Si–Obr–Si bending and the Si–O stretching of the Si2O7 dimers, respectively. The 600 cm−1 peak is assumed to arise from O–Si–O bending/Si–O–Si rocking vibrations of the Si2O7 dimer. The peak near 250 cm−1, which is considered to be related to MO6 modes, should be avoided for the estimation of Fe because it is often unresolved (Fig. 7).
The 570 cm−1 peak, assigned to δ(Si–Obr–Si), is well resolved (Figs. 7 and 9) in all orientations and has a relatively small FWHM (Table 4). The experimental wavenumber–Fe content (ω–x) data points match the linear trend (Fig. 8b). In terms of peak characteristics, the 570 cm−1 peak has the highest reliability among the four representative peaks in estimating Fe content in epidotes, using the relation with accuracy ± 0.04 Fe apfu.
The peaks near 600 and 1090 cm−1 can be complementarily used for the Fe estimate. The corresponding ω(x) linear trends are (Fig. 8c) and (Fig. 8d), resulting in and with similar accuracy of ±0.04 Fe apfu. These equations can be applied if the peaks are confidently separated from the adjacent peaks.
The spectra collected from the Sr-bearing epidote suggested that the linear trend ω570(x) determined by Al–Fe3+ epidotes can be applied to the Sr-bearing epidote containing <0.12 Sr apfu.
The presence of VICr3+ affects the wavenumber Si–O–Si bending mode ω570, leading to overestimation of Fe3+ and underestimation of the sum of octahedrally coordinated non-aluminium trivalent cations (Me3+). Based on the samples available for this study, we recommend examining the FWHM of the peaks near 95 and 250 cm−1. If the instrumental spectral resolution is 2 cm−1 or better and the FWHM of the above-mentioned peaks is ∼10 cm−1, the sample is free of VICr3+. Cr content larger than 0.16 apfu leads to FWHM >17 cm−1.
Data derived from this research are presented in the Supplement. Additional data are available upon request from the corresponding author.
The supplement related to this article is available online at: https://doi.org/10.5194/ejm-35-267-2023-supplement.
MN designed the project. MN collected and evaluated all Raman spectra under the supervision of BM. MN and BM discussed all results and wrote the paper.
The contact author has declared that neither of the authors has any competing interests.
Publisher’s note: Copernicus Publications remains neutral with regard to jurisdictional claims in published maps and institutional affiliations.
We thank Stefanie Heidrich (Institute of Mineralogy and Petrology, Universität Hamburg) and Yoji Morifuku (Center for Instrumental Analysis, Yamaguchi University) for their technical assistance and Jochen Schlüter (Mineralogical Museum, Universität Hamburg) for providing the samples C19 and E21.
This research has been supported by the Japan Society for the Promotion of Science (grant no. 20KK0307).
This paper was edited by Reto Gieré and Roland Stalder and reviewed by two anonymous referees.
Akasaka, M., Zheng, Y., and Suzuki, Y.: Maximum strontium content of piemontite formed by hydrothermal synthesis, J. Miner. Petrol. Sci., 95, 84–94, https://doi.org/10.2465/jmps.95.84, 2000.
Andò, S. and Garzanti, E.: Raman spectroscopy in heavy-mineral studies, in: Sediment provenance studies in hydrocarbon exploration and production, edited by: Scott, R. A., Morton, A. C., and Richardson, N., Geol. Soc. London, Spec. Publ., 386, 395–412, https://doi.org/10.1144/SP386.2, 2014.
Armbruster, T., Bonazzi, P., Akasaka, M., Bermanec, V., Chopin, C., Heuss-Assbischler, S., Liebscher, A., Menchetti. S., Pan, Y., and Pasero, M.: Recommended nomenclature of epidote-group minerals, Eur. J. Miner., 18, 551–567, https://doi.org/10.1127/0935-1221/2006/0018-0551, 2006.
Armbruster, T., Gnos, E., Dixon, R., Gurzmer, J., Hejny, C., Döbelin, N., and Medenbach, O.: Manganvesuvianite and tweddillite, two new minerals from the Kalahari manganese fields, South Africa. Miner. Mag., 66, 137–150, https://doi.org/10.1180/0026461026610018, 2002.
Aspiotis, S., Schlüter, J., and Mihailova, B., Non-destructive determination of the biotite crystal chemistry using Raman spectroscopy: how far we can go?, Eur. J. Miner., 34, 573–590, https://doi.org/10.5194/ejm-34-573-2022, 2022.
Bendel, V. and Schmidt, B. C.: Raman spectroscopic characterisation of disordered alkali feldspars along the join KAlSi3O8–NaAlSi3O8: application to natural sanidine and anorthoclase, Eur. J. Mineral., 20, 1055–1065, https://doi.org/10.1127/0935-1221/2009/0021-1856, 2008.
Bersani, D., Andò, S., Vignola, P., Moltifiori, G., Marino, I.-G., Lottici, P. P., and Diella, V.: Micro-Raman spectroscopy as a routine tool for garnet analysis, Spectrochim. Acta A, 73, 484–491, https://doi.org/10.1016/j.saa.2008.11.033, 2009.
Bersani, D., Aliatis, I., Tribaudino, M., Mantovani, L., Benisek, A., Carpenter, M. A., Gatta, G. D., and Lottici, P. P.: Plagioclase composition by Raman spectroscopy, J. Raman. Spectrosc., 49, 684–698, https://doi.org/10.1002/jrs.5340, 2018.
Bersani, D., Andò, S., Scrocco, L., Gentile, P., Salvioli-Mariani, E., Fornasini, L., and Lottici, P. P.: Composition of amphiboles in the tremolite–ferro–actinolite series by Raman Spectroscopy, Minerals, 9, 491, https://doi.org/10.3390/min9080491, 2019.
Bonazzi, P. and Menchetti, S.: Monoclinic members of the epidote group: effects of the Al ↔ Fe3+ ↔ Fe2+ substitution and of the entry of REE3+, Miner. Petrol., 53, 133–153, https://doi.org/10.1007/BF01171952, 1995.
Chang, I. F. and Mitra, S. S.: Long wavelength optical phonons in mixed crystals, Adv. Phys., 20, 359–404, https://doi.org/10.1080/00018737100101271, 1971.
Coccato, A., Bersani, D., Caggiani, M. C., Mazzoleni, P., and Barone, G.: Raman studies on zoisite tanzanite for gemmological applications, J. Raman Spectrosc., 53, 617–629, https://doi.org/10.1002/jrs.6203, 2021.
Deer, W. A., Howie, R. A., and Zussman, J.: Rock-forming minerals. IB (Second edition), Disilicates and ring silicates, Geol. Soc. Pub. House. UK, ISBN 978-1-897799-89-5, 1997.
Della Ventura, G., Mottana, A., Parodi, G. C., and Griffin, W. L.: FTIR spectroscopy in the OH-stretching region of monoclinic epidotes from Praborna (St. Marcel, Aosta valley, Italy), Eur. J. Miner., 8, 655–665, https://doi.org/10.1127/ejm/8/4/0655, 1996.
Dollase, W. A.: Refinement and comparison of the structures of zoisite and clinozoisite, Amer. Miner., 53, 1882–1898, 1968.
Dollase, W. A.: Crystal structure and cation ordering of piemontite, Amer. Miner., 54, 710–717, 1969.
Dollase, W. A.: Refinement of the crystal structures of epidote, allanite and hancockite, Amer. Miner., 56, 447–464, 1971.
Dollase, W. A.: Mössbauer spectra and iron distribution in the epidote-group minerals, Z. Krist., 138, 41–63, https://doi.org/10.1524/zkri.1973.138.jg.41, 1973.
Dowty, E.: Vibrational interactions of tetrahedra in silicate glasses and crystals: I. Calculations on ideal silicate-aluminate-germanate structural units, Phys. Chem. Miner., 14, 80–93, https://doi.org/10.1007/BF00311151, 1987.
Enami, M.: Raman spectrometry of epidote-group minerals, Abstracts for Annual Meeting of the Miner. Soc. Japan, 84, https://doi.org/10.14824/jakoka.2009.0.82.0, 2009 (in Japanese).
Franz, G. and Liebscher, A.: Physical and chemical properties of the epidote minerals – An Introduction –, in: Epidotes, edited by: Liebscher, A. and Franz, G., Reviews in Mineralogy and Geochemistry, Washington DC, Miner. Soc. Amer., 56, 1–82, https://doi.org/10.2138/gsrmg.56.1.1, 2004.
Garzanti, E. and Andò, S.: Plate tectonics and heavy mineral suites of modern sands, Develop. Sediment., 58, 741–763, https://doi.org/10.1016/S0070-4571(07)58029-5, 2007.
Gatta, G. D., Alvaro, M., and Bromiley, G.: A low temperature X-ray single-crystal diffraction and polarized infra-red study of epidote, Phys. Chem. Miner., 39, 1–15, https://doi.org/10.1007/s00269-011-0455-y, 2012.
Giuli, G., Bonazzi, P., and Menchetti, S.: Al–Fe disorder in synthetic epidotes: A single-crystal X-ray diffraction study, Amer. Miner., 84, 933–936, https://doi.org/10.2138/am-1999-5-630, 1999.
Huang, E., Chen, C. H., Huang, T., Lin, E. H., and Xu, J.-A.: Raman spectroscopic characteristics of Mg-Fe-Ca pyroxenes, Amer. Miner., 85, 473–479, https://doi.org/10.2138/am-2000-0408, 2000.
Huber, B. and Bahlburg, H.: The provenance signal of climate–tectonic interactions in the evolving St. Elias orogen: Framework component analysis and pyroxene and epidote single grain geochemistry of sediments from IODP 341 sites U1417 and U1418, Int. J. Earth Sci., 110, 1477–1499, https://doi.org/10.1007/s00531-021-02025-9, 2021.
Kozáková, P. Miglierini, M., Čaplovičová, M., Škoda, R., and Bačík, P.: Structural breakdown of natural epidote and clinozoisite in high-T and low-P conditions and characterization of its products, Minerals, 12, 238, https://doi.org/10.3390/min12020238, 2022.
Kroumova, E., Aroyo, M. I., Perez Mato, J. M., Kirov, A., Capillas, C., Ivantchev, S., and Whittaker, E. J. W.: Bilbao Crystallographic Server: useful databases and tools for phase transitions studies, Phase Trans., 76, 155–170, https://doi.org/10.1080/0141159031000076110, 2003.
Kuebler, K. E., Jolliff, B. L., Wang, A., and Haskin, L. A.: Extracting olivine (Fo–Fa) compositions from Raman spectral peak positions, Geochim Cosmochim. Ac., 70, 6201–6222, https://doi.org/10.1016/j.gca.2006.07.035, 2006.
Kuzmany, H.: Solid-state spectroscopy-an introduction, Springer, Berlin, p. 554, https://doi.org/10.1007/978-3-642-01479-6_ 1, 2009.
Langer, K. and Raith, M.: Infrared spectra of Al–Fe (III)-epidotes and zoisites, Ca2(Al1−pFeAl2O(OH)[Si2O7][SiO4], Amer. Miner., 59, 1249–1258, 1974.
Langer, K., Tillmanns, E., Kersten, M., Almen, H., and Arni, R. K.: The crystal chemistry of Mn3+ in the clino- and orthozoisite structure types, Ca2M(OH/O/SiO4/Si2O7): A structural and spectroscopic study of some natural piemontites and “thulites” and their synthetic equivalents, Z. Kristallogr., 217, 563–580, https://doi.org/10.1524/zkri.217.11.563.20780, 2002.
Lafuente, B., Downs, R. T., Yang, H., and Stone, N.: The power of databases: the RRUFF project, in: Highlights in Mineralogical Crystallography, edited by: Armbruster, T. and Danisi, R. M., Berlin, Germany, W. De Gruyter, 1–30, https://doi.org/10.1515/9783110417104-003, 2015.
Leissner, L., Schlüter, J., Horn, I., and Mihailova, B.: Exploring the potential Raman spectroscopy for crystallochemical analyses of complex hydrous silicates: I. Amphiboles, Amer. Miner., 100, 2682–2694, https://doi.org/10.2138/am-2015--5323, 2015.
Limonta, M., Andò, S., Bersani, D., and Garzanti, E.: Discrimination of clinozoisite-epidote series by Raman spectroscopy: An application to Bengal Fan Turbidites (IODP Expedition 354), Geoscience, 12, 442, https://doi.org/10.3390/geosciences12120442, 2022.
Liebscher, A.: Spectroscopy of epidote minerals, in: Epidotes, edited by: Liebscher, A. and Franz, G., 628 pp., Rev. Mineral. Geochem., 56, Miner. Soc. Amer., Washington, 125–170, https://doi.org/10.2138/gsrmg.56.1.125, 2004.
Makreski, P., Jovanovski, G., Kaitner, B., Gajović, A., and Biljan, T.: Minerals from Macedonia XVIII. Vibrational spectra of some sorosilicates, Vibr. Spectr., 44, 172–170, https://doi.org/10.1016/j.vibspec.2006.11.003, 2007.
Mills, S. J., Hatert, F., Nickel, E. H., and Ferraris, G.: The standardusation of mineral group hierarchies: application to recent nomenclature proposals, Eur. J. Miner., 21, 1073–1080, https://doi.org/10.1127/0935-1221/2009/0021-1994, 2009.
Momma, K. and Izumi, F.: VESTA3 for three-dimensional visualization of crystal, volumetric and morphology data, J. Appl. Cryst., 44, 1257–1276, https://doi.org/10.1107/S0021889811038970, 2011.
Nagasaki, A. and Enami, M.: Sr-bearing zoisite and epidote in ultra-high pressure (UHP) metamorphic rocks from the Su-Lu province, eastern China: An important Sr-reservoir under UHP condition, Amer. Miner., 83, 240–247, https://doi.org/10.2138/am-1998-3-407, 1998.
Nagashima, M. and Akasaka, M.: An X-ray Rietveld study of piemontite on the join Ca2Al3Si3O12(OH)-Ca2MnSi3O12(OH) formed by hydrothermal synthesis, Amer. Miner., 89, 1119–1129, https://doi.org/10.2138/am-2004-0725, 2004.
Nagashima, M. and Akasaka, M.: X-ray Rietveld and 57Fe Mössbauer studies of epidote and piemontite on the join Ca2Al3Si3O12(OH) – Ca2Al2Fe3+Si3O12(OH) – Ca2Al2Mn3+Si3O12(OH) formed by hydrothermal synthesis, Amer. Miner., 95, 1237–1246, https://doi.org/10.2138/am.2010.3418, 2010.
Nagashima, M., Akasaka, M., and Sakurai, T.: Chromian epidote in omphacite rocks from the Sambagawa metamorphic belt, central Shikoku, Jpn. J. Miner. Petrol. Sci., 101, 157–169, https://doi.org/10.2465/jmps.101.157, 2006.
Nagashima, M., Akasaka, M., Kyono, A., Makino, K., and Ikeda, K.: Distribution of chromium among the octahedral sites in chromian epidote from Iratsu, central Shikoku, Jpn. J. Miner. Petrol. Sci., 102, 240–254, https://doi.org/10.2465/jmps.060310, 2007.
Nagashima, M., Armbruster, T., Herwegh, M., Pettke, T., Lahti, S., and Grobéty, B.: Severe structural damage in Cr- and V-rich clinozoisite: relics of an epidote-group mineral with Ca2Al2Cr3+Si3O12(OH) composition? Eur. J. Miner., 23, 731–743, https://doi.org/10.1127/0935-1221/2011/0023-2153, 2011.
Nagashima, M., Armbruster, T., Nishio-Hamane, D., and Mihailova, B.: The structural state of Finnish Cr- and V-bearing clinozoisite: insights from Raman spectroscopy, Phys. Chem. Miner., 48, 5, https://doi.org/10.1007/s00269-020-01129-z, 2021.
Nagashima, M., Geiger, C. A., and Akasaka, M.: A crystal-chemical investigation of clinozoisite synthesized along the join Ca2Al3Si3O12(OH)-Ca2Al2CrSi3O12(OH), Amer. Miner., 94, 1351–1360, https://doi.org/10.2138/am.2009.3183, 2009.
Nagashima, M., Nishio-Hamane, D., Nakano, N., and Kawasaki, T.: Synthesis and crystal chemistry of mukhinite, V-analogue of clinozoisite on the join Ca2Al3Si3O12(OH)-Ca2Al2VSi3O12(OH), Phys. Chem. Miner., 46, 63–76, https://doi.org/10.1007/s00269-018-0988-4, 2019.
Petrusenko, S., Taran, M. N., Platonov, A. N., and Gavorkyan, S. V.: Optical and infrared spectroscopic studies of epidote group minerals from the Rhodope region, Rev. Bulgar. Geol. Soc., 53, 1–9, 1992 (in Russian).
Porto, S. P. S. and Scott, J. F.: Raman spectra of CaWO4, SrWO4, CaMoO4 and SrMoO4, Phys. Rev., 157, 716–717, https://doi.org/10.1103/PhysRev.157.716, 1967.
Roache, T. J., Walshe, J. L., Huntington, J. F., Quigley, M. A., Yang, K., Bil, B. W., Blake, K. L., and Hyvärinen, T.: Epidote-clinozoisite as a hyperspectral tool in exploration for Archean gold, Austr. J. Earth Sci., 58, 813–822, https://doi.org/10.1080/08120099.2011.608170, 2011.
Su, W., Liu, Z. X., Chen, F., Gao, J., and Li, X. G.: Construction of FT-IR micro-spectroscopy system: In situ studies on reaction-dynamics of material, Acta Petrol. Sinica, 35, 252–260, https://doi.org/10.18654/1000-0569/2021.12.17, 2019 (in Chinese).
Waeselmann, N., Schlüter, J., Malcherek, T., Della Ventura, G., Oberti, R., and Mihailova, B.: Non-destructive determination of the amphibole crystal-chemical formulae by Raman spectroscopy; one step closer, J. Raman Spectrosc., 51, 1530–1548, https://doi.org/10.1002/jrs.5626, 2020.
Watenphul, A., Burgdorf, M., Schlüter, J., Horn, I., Malcherek, T., and Mihailova, B.: Exploring the potential of Raman spectroscopy for crystallochemical analyses of complex hydrous silicates: II. Tourmalines, Amer. Miner. 101, 970–985, https://doi.org/10.2138/am-2016-5530, 2016a.
Watenphul, A., Schlüter, J., Bosi, F., Skogby, H., Malcherek, T., and Mihailova, B.: Influence of the octahedral cationic-site occupancies on the framework vibrations of Li-free tourmalines, with implications for estimating temperature and oxygen fugacity in host rocks, Amer. Miner., 101, 2554–2563, https://doi.org/10.2138/am-2016-5820, 2016b.
White, A. J. R., Laukamp, C., Stokes, M. A., Legras, M., and Pejcic, B.: Vibrational spectroscopy of epidote, pumpellyite and prehnite applied to low-grade regional metabasites, Geochem.: Expl. Envir. Anal., 17, 315–333, https://doi.org/10.1144/geochem2016-007, 2017.
Winkler, B., Gale, J. D., Refson, K., Wilson, D. J., and Milman, V.: The influence of pressure on the structure and dynamics of hydrogen bonds in zoisite and clinozoisite, Phys. Chem. Miner., 35, 25–35, https://doi.org/10.1007/s00269-007-0195-1, 2008.
Zheira, G., Masoudi, F., and Rahimzadeh, B.: Identification of Fe3+ content in epidote from Varan, Urumieh-Dokhtar magmatic arc, Iran: using FTIR and Raman spectroscopy, Iran. J. Earth Sci., 14, 131–139, https://doi.org/10.30495/ijes.2021.685387, 2022.