the Creative Commons Attribution 4.0 License.
the Creative Commons Attribution 4.0 License.
 | 21 Mar 2023
Thermodynamic and structural variations along the olivenite–libethenite solid solution
Alexandra Plumhoff
Martin Števko
Gwladys Steciuk
Jakub Plášil
Edgar Dachs
Artur Benisek
Many natural secondary arsenates contain a small fraction of phosphate. In this work, we investigated the olivenite–libethenite (Cu2(AsO4)(OH)–Cu2(PO4)(OH)) solid solution as a model system for the P–As substitution in secondary minerals. The synthetic samples spanned the entire range from pure olivenite (Xlib=0) to libethenite (Xlib=1). Acid-solution calorimetry determined that the excess enthalpies are non-ideal, with a maximum at Xlib=0.6 of +1.6 kJ mol−1. This asymmetry can be described by the Redlich–Kister equation of Hex= Xoli⋅Xlib [A+B(Xoli−Xlib)], with A=6.27 ± 0.16 and B=2.9 ± 0.5 kJ mol−1. Three-dimensional electron diffraction analysis on the intermediate member with Xlib=0.5 showed that there is no P–As ordering, meaning that the configurational entropy (Sconf) can be calculated as ). The excess vibrational entropies (), determined by relaxation calorimetry, are small and negative. The entropies of mixing () also show asymmetry, with a maximum near Xlib=0.6. Autocorrelation analysis of infrared spectra suggests local heterogeneity that arises from strain relaxation around cations with different sizes (As5+ P5+) in the intermediate members and explains the positive enthalpies of mixing. The length scale of this strain is around 5 Å, limited to the vicinity of the tetrahedra in the structure. At longer length scales (≈15 Å), the strain is partially compensated by the monoclinic–orthorhombic transformation. The volume of mixing shows complex behavior, determined by P–As substitution and symmetry change. A small (0.9 kJ mol−1) drop in enthalpies of mixing in the region of Xlib=0.7–0.8 confirms the change from monoclinic to orthorhombic symmetry.
- Article
(1868 KB) - Full-text XML
-
Supplement
(545 KB) - BibTeX
- EndNote


Minerals of the olivenite–libethenite (Cu2(AsO4)(OH)–Cu2(PO4)(OH)) group appear at many sites with secondary copper oxysalts (Števko et al., 2017; Southwood et al., 2020). Their structure and properties were investigated by Toman (1977), Yakubovich et al. (1993), Burns and Hawthorne (1995), Li et al. (2008), and Kharbish et al. (2014). The P–As substitution in these minerals is extensive (Sejkora et al., 2006; Majzlan et al., 2015) but is not the only possible substitution. The Cu–Zn substitution is also very common (Toman, 1978; Braithwaite, 1983; Gołębiowska et al., 2006b; Southwood et al., 2020). The Zn arsenate end-member adamite is a common mineral, and its crystal structure was investigated in detail (Hill, 1976; Kato and Miúra, 2007; Zema et al., 2016; Junnouchi et al., 2016). A phase with an olivenite structure and ordered Cu–Zn arrangement corresponds to the mineral zincolivenite (Chukanov et al., 2007). Chukanov et al. (2007) also suggested that such a phase exists with a range of compositions, not only strictly at Cu : Zn = 1:1. The thermodynamic stability of the end-member compositions was investigated by Magalhães et al. (1986, 1988) and Majzlan et al. (2015).
The structural arrangement of olivenite and libethenite seems to be particularly stable and is also found in minerals in other classes, such as in andalusite (Al2SiO5) or kieserite (MgSO4⋅H2O). The symmetry and crystal class of olivenite and libethenite was a matter of long debate (Heritsch, 1938; Richmond, 1940; Berry, 1951; Walitzi, 1963; Toman, 1977). To resolve the issue, Burns and Hawthorne (1995) carried out the refinement of the structural model in both orthorhombic and monoclinic symmetry for olivenite. Even though the topology of the structures of olivenite and libethenite is identical, they have different space groups at room temperature. Libethenite is orthorhombic, with the space group Pnnm, whereas olivenite is monoclinic, with space group (Burns and Hawthorne, 1995; Li et al., 2008). Burns and Hawthorne (1995) refined the monoclinic structure of olivenite in a non-standard space group , where the monoclinic angle α is 90.088(3)∘, very close to 90∘. For consistency, we also keep this setting in this work. Both olivenite and libethenite undergo a displacive phase transformation and change their symmetry. Olivenite transforms to an orthorhombic phase above ≈200 ∘C (Tarantino et al., 2018). Libethenite changes to a monoclinic phase at ∘C (Belik et al., 2011). They proposed that the Pnnm– transition is a general feature of olivenite-type phases with the stoichiometry M2(XO4)OH (X: tetrahedrally coordinated cation). The monoclinic–orthorhombic transition involves a very small shift of the atoms; the largest shift is observed for the O(1) atom (Burns and Hawthorne, 1995). This atom is displaced by 0.0551(21) Å from the mirror plane perpendicular to [001], thus violating the Pnnm symmetry. The attribution of the symmetry lowering to the Jahn–Teller effect in the Cu2+ centered polyhedra is possible and was described as “tempting” by Toman (1977).
The thermodynamics of the arsenate–phosphate substitution was investigated in the synthetic analogs of the hydroxylapatite–johnbaumite (Ca5(PO4)3(OH)–Ca5(AsO4)3(OH)) (Zhang et al., 2011) and pyromorphite–mimetite (Pb5(PO4)3Cl–Pb5(AsO4)3Cl) (Flis et al., 2011) solid-solution series. For the hydroxylapatite–johnbaumite series, Zhang et al. (2011) argued that the solid solution is ideal even though their data deviated from ideality. The same conclusion was reached for the pyromorphite–mimetite series, with better support of the available data. Here, we set out to answer the question whether the olivenite–libethenite series is also thermodynamically ideal or not.
In this work, we analyzed thermodynamic properties of the olivenite–libethenite solid solution. The methods chosen were powder X-ray diffraction, acid-solution and relaxation calorimetry, three-dimensional electron diffraction and structure refinement, and autocorrelation analysis of Fourier-transform infrared spectra.
The olivenite–libethenite solid solution was synthesized by a wet chemical procedure using analytical reagent grade chemicals. The syntheses were prepared to reach 100 mL of the final solution by mixing 50 mL of a 0.5 M Cu(NO3)2 solution with 50 mL of a solution with (NH4)H2PO4 and Na2HAsO4⋅7H2O, in different proportions. All reagents were dissolved in deionized water. For the synthesis of the end-members, 50 mL of a 0.5 M Cu(NO3)2 solution was mixed with 50 mL of a 0.32 M (NH4)H2PO4 solution for libethenite and 50 mL of a 0.19 M Na2HAsO4 solution for olivenite. Even though the Cu PO4 ratio in libethenite and the Cu AsO4 ratio in olivenite are identical, the molarities of the starting phosphate and arsenate solutions are different. These molarities were determined by trial and error in many preliminary runs. The reason for the difference in the necessary molarities is not clear to us; there is a number of competing copper phosphates or copper arsenates in each system which may contaminate the final product. For the intermediate members of the solid solution, prepared solutions of (NH4)H2PO4 and Na2HAsO4⋅7H2O were mixed together in desired proportions so that the molar As P ratio corresponded to the desired As P ratio in the solid. The different molarities of PO4 and AsO4 in the starting solutions had to be taken into account. The mixed As P solutions were stirred and added to 50 mL of a Cu(NO3)2 solution. The final solutions were stirred constantly while being heated up to 70 ∘C and having their pH value adjusted to 3 using (NH4)OH (28 %–30 % NH3). After stabilization of the pH, the used borosilicate bottles were closed and placed in a water bath with a constant temperature of 70 ∘C being controlled by a thermostat. The pH was controlled and raised with (NH4)OH (28 %–30 % NH3) every few hours. After 4 d, the resulting suspension was filtered hot, washed several times with deionized water, and air-dried at ambient temperature.
Powder X-ray diffraction (pXRD) data of the solid samples were collected with a Bruker D8 ADVANCE with DAVINCI.DESIGN and with Cu Kα radiation, an Ni filter, and a Lynxeye one-dimensional detector. The data were measured in the range of 5–90∘ 2θ, with a step size of 0.02∘ 2θ and a 0.25 s time per step. Lattice parameters were refined using the JANA2006 program (Petříček et al., 2014).
The elemental composition of the fine-grained samples was analyzed with a simultaneous radial inductively coupled plasma optical emission spectrometer (ICP-OES) 725-ES (Agilent, Germany) with a CCD (charge-coupled device) detector and an ASX-520 autosampler (Teledyne CETAC, Omaha, Nebraska, USA). The sample (≈ 10 mg) was diluted in 10 mL of 20 % HNO3.
Fourier-transform infrared (FTIR) transmission spectra were recorded using a Nicolet iS 10 spectrometer (Thermo Fisher Scientific, Germany). The spectra were collected under a single set of experimental conditions. The samples were fine-grained, and no grinding was necessary. They were mixed with KBr (FTIR spectroscopy grade, Merck) in a constant ratio, gently mixed, and pressed to pellets. The pellets were measured in the wavenumber range from 4000 to 400 cm−1 with 64 scans per spectrum at a resolution of 4 cm−1. The spectra were normalized to maximum intensity. No background subtraction was performed for the autocorrelation analysis.
Acid-solution calorimetry was done with an IMC 4400 (isothermal microcalorimeter; Calorimetry Sciences Corporation) following the procedure described in Majzlan (2017). A water reservoir was held at a constant temperature of 298.15 K. After stabilization of the calorimeter overnight, the sample pellet with 10 mg weight was dropped into the solvent (25 g of 5 N HCl) held in a PEEK (polyetheretherketone) container. The samples dissolved in the acid solution, and the heat flow was measured to calculate the heats of dissolution. Each sample was measured four times, and the uncertainties reported are as 2 standard deviations of the mean. They were further propagated in the appropriate thermochemical cycles.
Heat capacity (Cp) was measured by relaxation calorimetry using a commercial physical properties measurement system (PPMS; Quantum Design, San Diego, California, USA). With due care, the accuracy can be within 1 % from 5 to 300 K and 5 % from 0.7 to 5 K (Kennedy et al., 2007). Powdered samples were wrapped in a thin Al foil and compressed to produce a ≈ 0.5 mm thick pellet, which was then placed onto the sample platform of the calorimeter for measurement. The heat capacity was measured in the PPMS in a 2 to 300 K temperature interval.
The precession-assisted three-dimensional electron diffraction (3D ED) data were collected on four crystal fragments of the 50P50As sample in an FEI Tecnai 02 transmission electron microscope (TEM) (acceleration voltage of 200 kV, LaB6) equipped with an Amsterdam Scientific Instruments (ASI) CheeTah M3 side-mounted hybrid single-electron detector, which is 512×512 pixels with high sensitivity and a fast readout. The sample was deposited on a Cu grid coated by a thin film of holey amorphous carbon. To further reduce the dynamical effect, the 3D ED (Gemmi and Lanza, 2019; Gemmi et al., 2019) was coupled with precession electron diffraction (PED) using the precession device Nanomegas DigiSTAR (Vincent and Midgley, 1994). The precession semi-angle was set to 1∘. Series of non-oriented patterns are sequentially collected by a step of 1∘ on the accessible tilt range of the goniometer (Kolb et al., 2007, 2008; Mugnaioli et al., 2009), automated by the in-house software, including the tracking of the crystal following the procedure described by Plana-Ruiz et al. (2020). The 3D ED data reduction was performed using the computer program PETS2 (Palatinus et al., 2019). The result of the data reduction is two hkl file types: one considering the kinematical approximation used for the structural solution with and 100 % coverage for (sin θ) λ=0.75 Å−1 and the other one used in the dynamical refinement, where each frame is considered independently (Palatinus et al., 2015a, b). The structure was solved using SUPERFLIP (Palatinus and Chapuis, 2007; Palatinus, 2013) in Jana2020 (Petříček et al., 2014) and refined using DYNGO and Jana2020.
4.1 Chemical composition and crystal structures
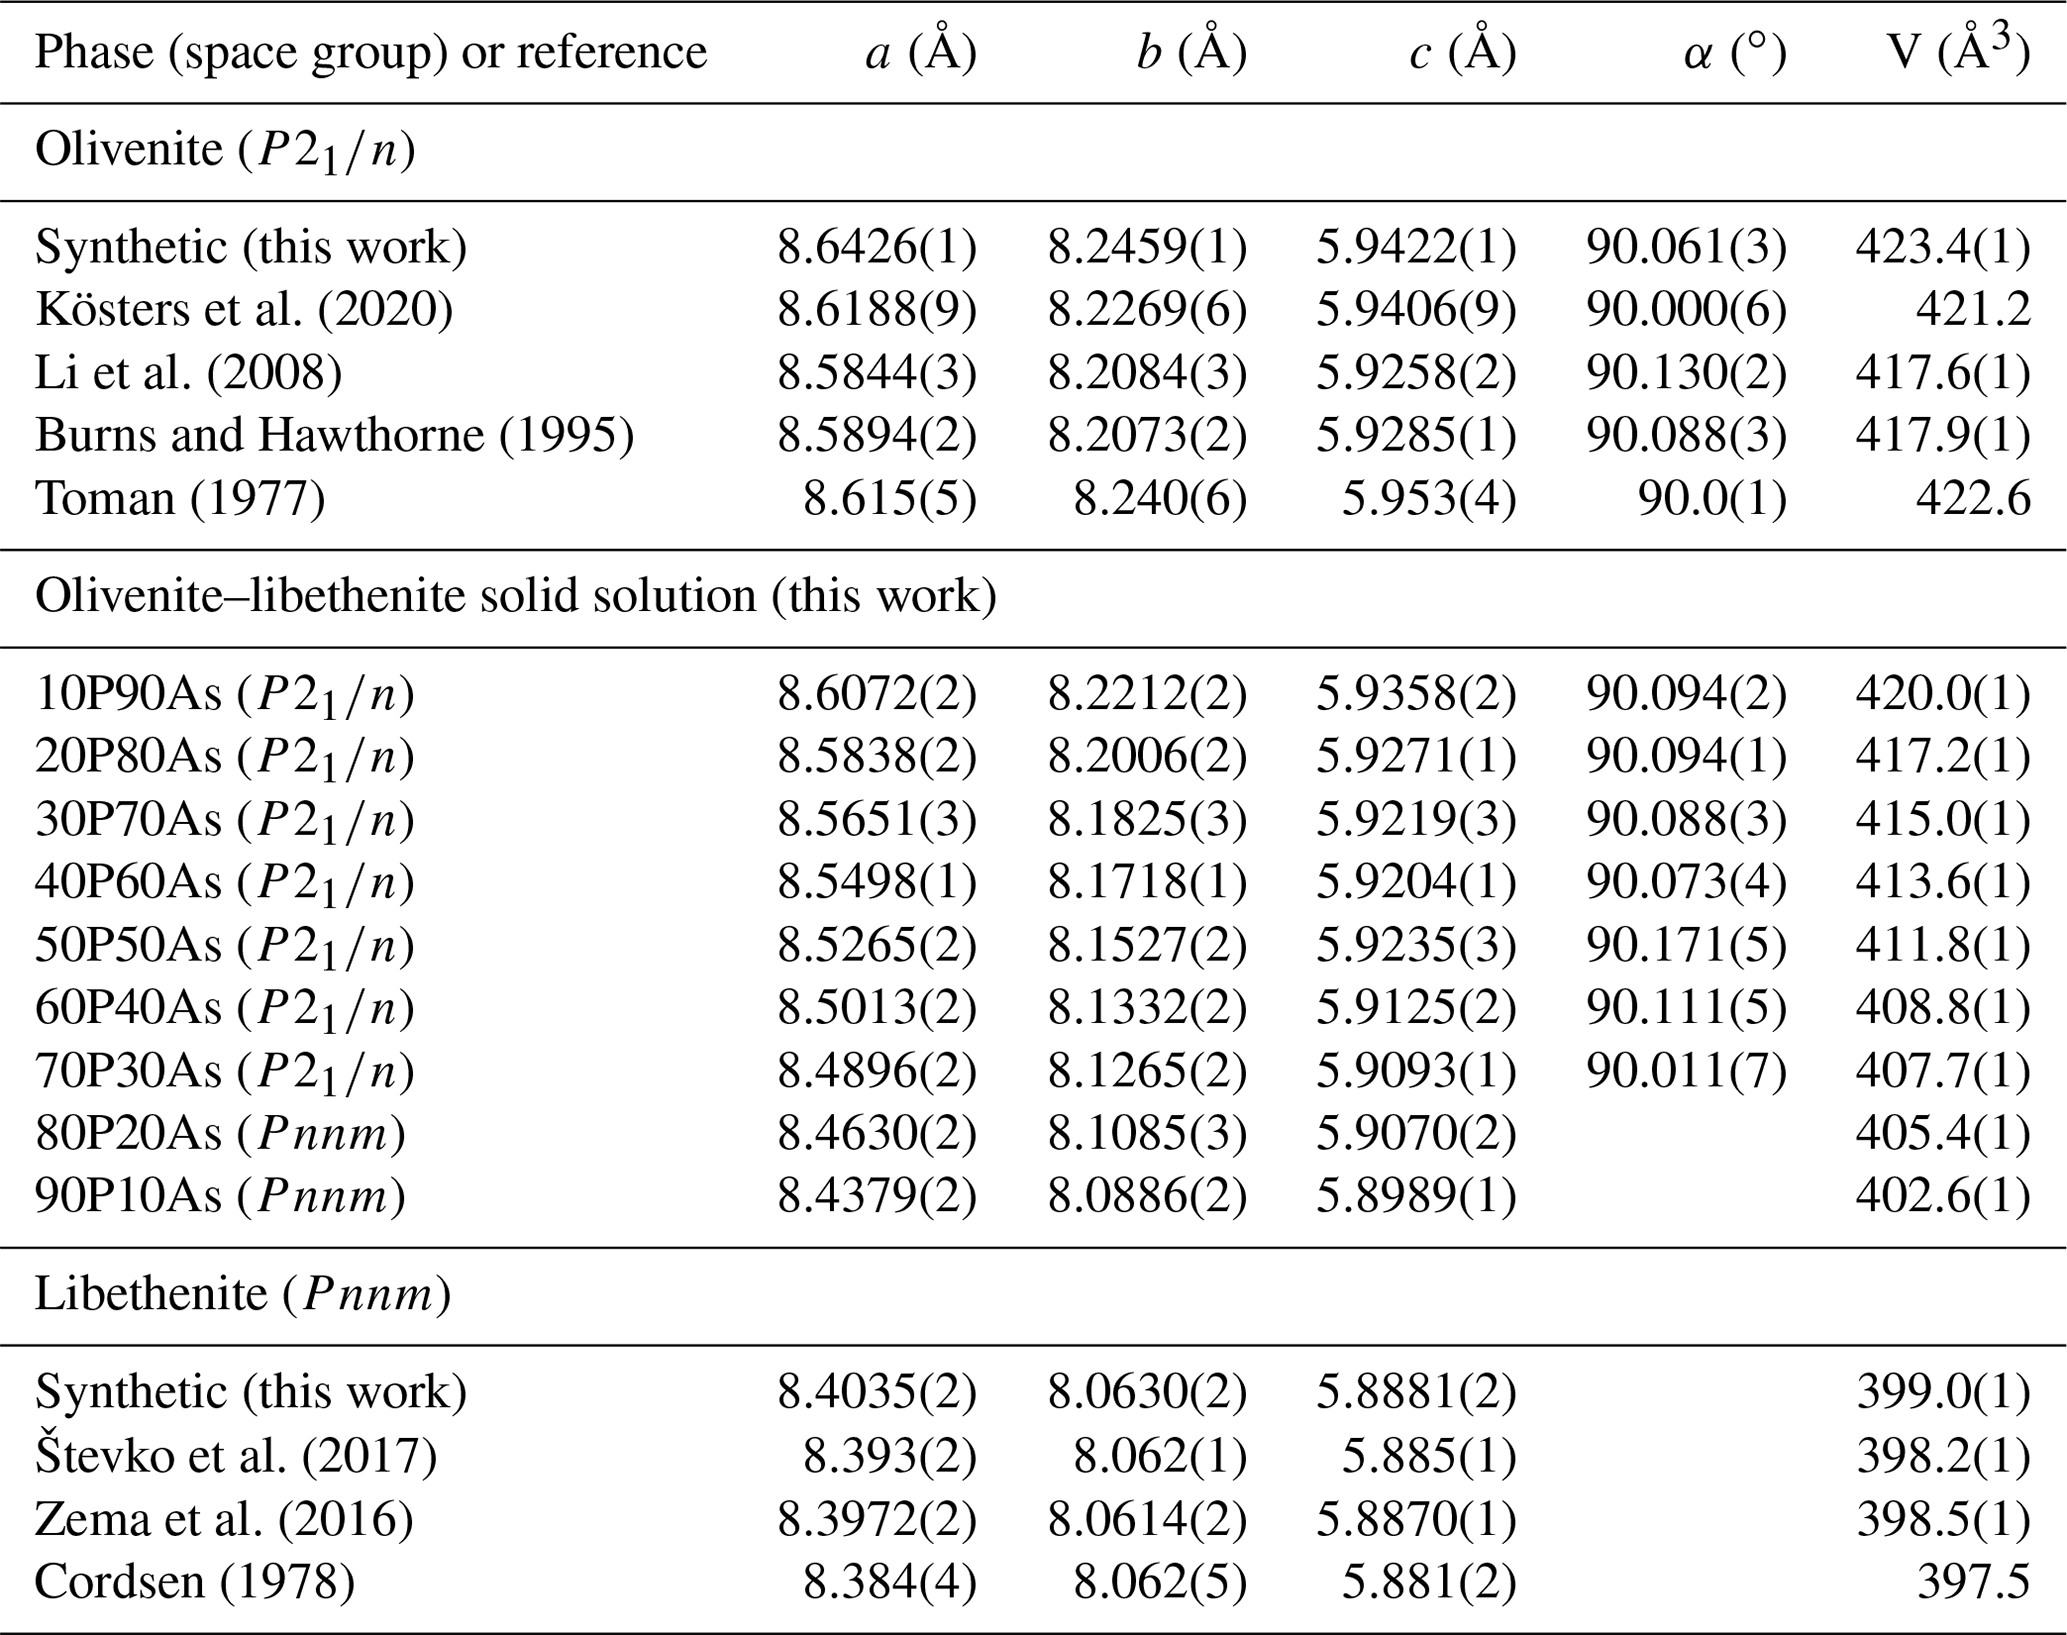
Chemical composition of the synthetic members of the olivenite–libethenite solid solution was determined by ICP-OES, and the results are listed in Table 1. The relative proportions of the cations (As P) differ little from the initial ratios in the parental solutions. Lattice parameters of these phases are listed in Table 2, together with comparison with previously determined parameters for the end-member compositions. For libethenite and a few solid-solution members, the orthorhombic space group Pnnm was taken. For olivenite and the solid-solution members up to Xlib=0.7, the powder X-ray diffraction (XRD) patterns were consistent with the monoclinic space group . The choice of the symmetries (monoclinic versus orthorhombic) was also supported by the calorimetric results (see below).
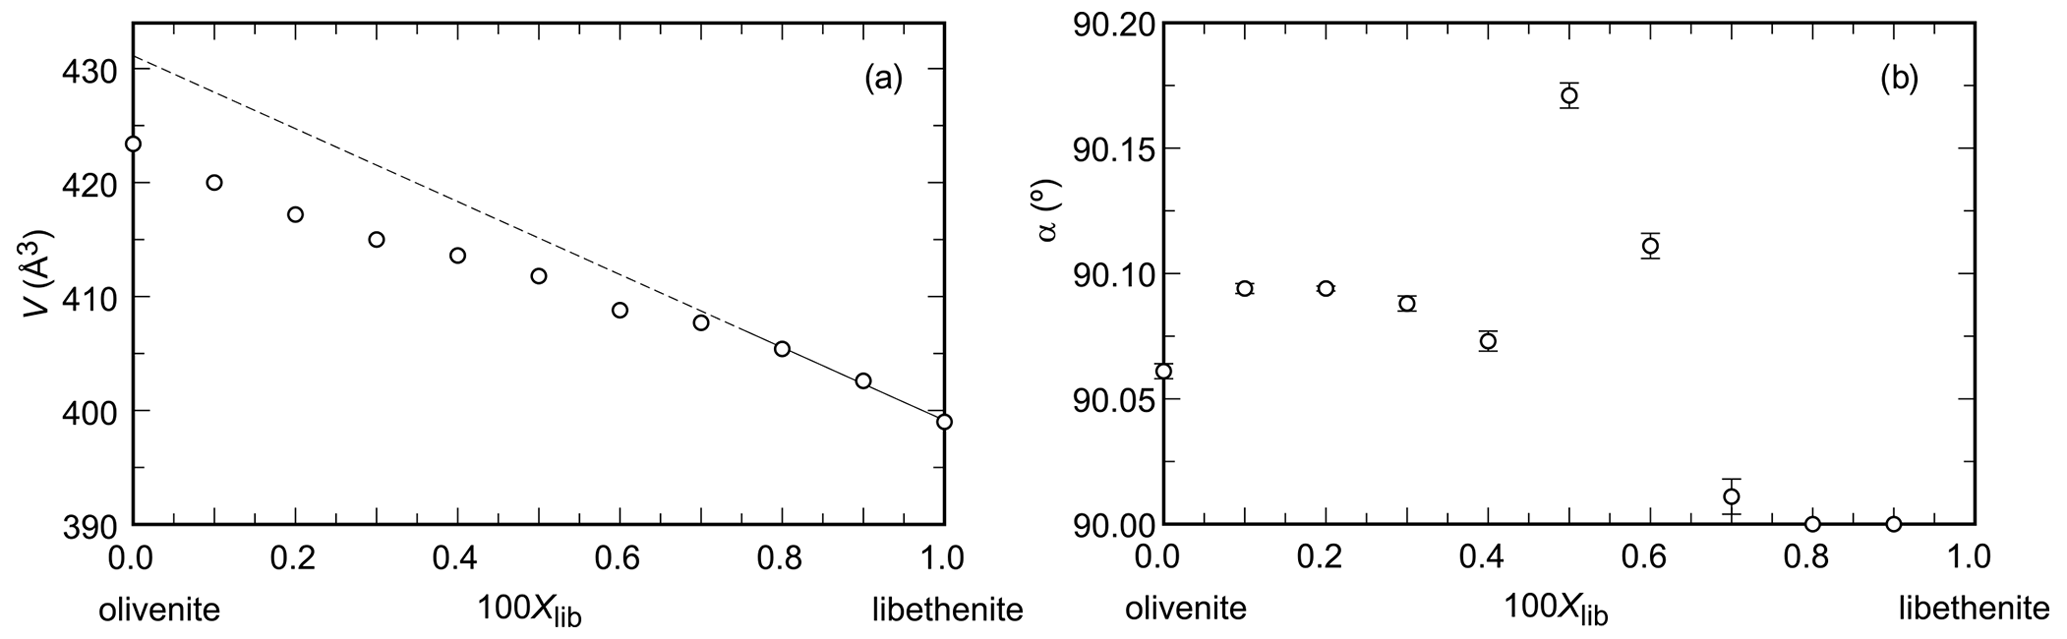
Figure 1Variations in (a) unit-cell volume and (b) the monoclinic angle α (note the non-standard monoclinic setting, described in the Introduction) across the olivenite–libethenite solid-solution series. In (a), the uncertainties are always smaller than the size of the symbols.
The unit-cell volumes (Vo) (Table 2) do not vary linearly between the end-members olivenite and libethenite (Fig. 1a). If only the orthorhombic samples of the solid solution between Xlib=0.8 and pure libethenite are considered, a linear trend, shown by the linear fit in Fig. 1a, is obtained for the volume change in the orthorhombic structures. Such a trend points to a fictitious orthorhombic olivenite end-member with a larger volume than that of monoclinic olivenite. This difference may be the driving force behind the orthorhombic–monoclinic transition. The variations in the monoclinic angle α is shown in Fig. 1b. After a slight initial increase from the end-member olivenite, the angle is dropping toward 90∘. The exception is samples with Xlib=0.5 and 0.6, with much larger α angles. These are the samples with the largest Hex and largest k2 values (see autocorrelation analysis). The sudden increase in the monoclinic angle is interpreted here as a distortion related to structural strain near the compositionally induced monoclinic–orthorhombic transition. The Vo values (Table 2) were used to calculate excess volumes of , where Xlib and Xoli are the molar fractions of the libethenite and olivenite end-members, respectively, in a solid-solution (ss) composition. The resulting Vex values are listed in Table 3.
Table 1Chemical composition of the synthetic members of the olivenite–libethenite solid solution, recalculated from the ICP-OES analyses.
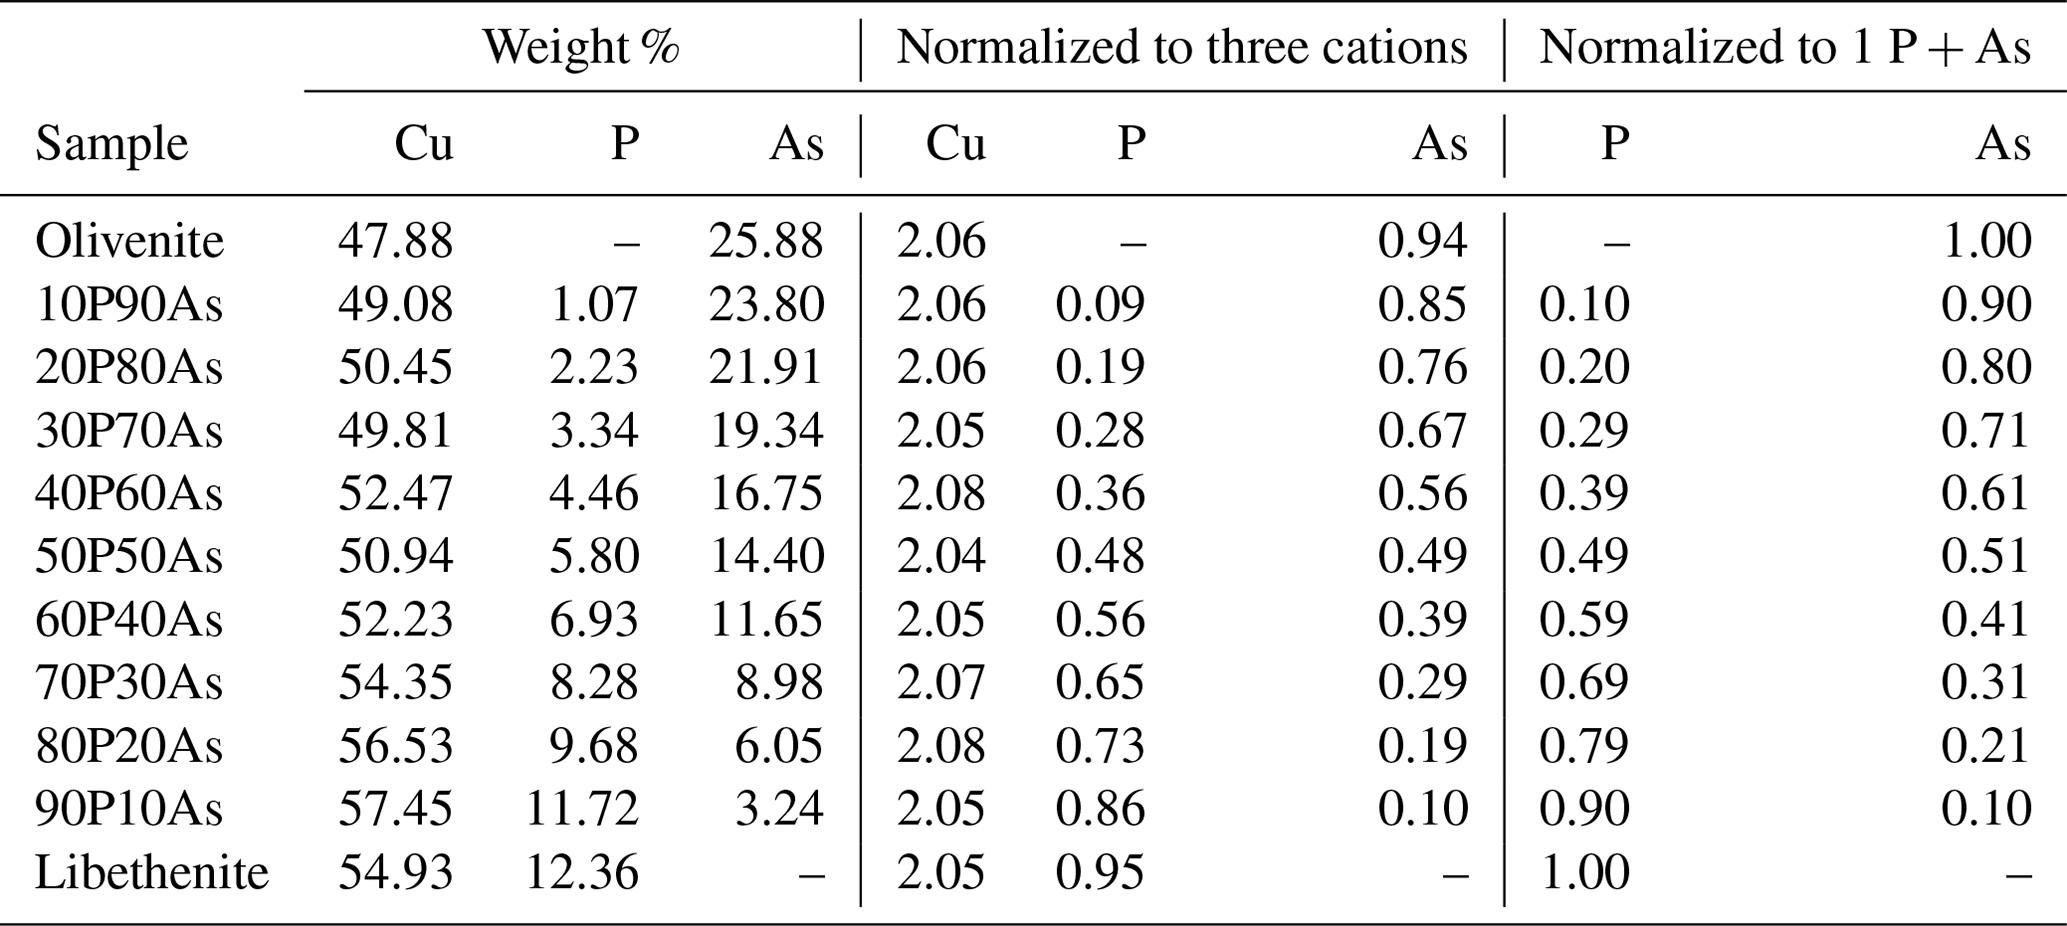
Table 2Unit-cell parameters for the synthetic phases of the olivenite group, used in this work, compared to values from studies on natural material. The data from this work come from full-profile refinements of powder X-ray diffraction data.
Crystal structure of the 50P50As sample was investigated in detail by the 3D ED techniques. The analysis confirmed monoclinic symmetry of the crystal. The refined monoclinic angle α (note the non-standard space group setting) is 90.171(5)∘, i.e., distinctly different from 90∘, but the deviation from the orthorhombic symmetry is not large. The structure solution yielded the same structure as previously reported for olivenite (Burns and Hawthorne, 1995) and its solid solution toward libethenite, including positions of heavy atoms and hydrogen atoms. This result is confirmed by the dynamical refinement that led to and for (observed/all) reflections and 528 refined parameters (Table 4). The resulting structural model can be found in the CIF (Crystallographic Information File) in the electronic Supplement to this publication. The most important reason for the 3D ED analysis was the question if there is P–As ordering in the solid solution or not. This question cannot be answered with powder XRD data. Inspection of the electron diffraction spots showed with no doubt that there is no ordering. The P5+ and As5+ cations are randomly distributed on a single tetrahedral site with a refined P As ratio of 0.522(8) : 0.478(8) based on four independent data sets.
4.2 Fourier-transform infrared spectroscopy
The infrared spectra of the studied samples are displayed in Fig. 2. All spectra are comparable to the ones shown in Braithwaite (1983) and Chukanov (2014). Some of the weak bands described by these authors are not seen in our spectra, but the strong bands are comparable. A detailed analysis of the IR spectra of the olivenite–libethenite series was provided by Braithwaite (1983).
For olivenite, the band at 940 cm−1 corresponds to O–H deformation (Braithwaite, 1983). In libethenite, the band shifts to about 975 cm−1 but is hidden under P–O stretching bands. Another O–H deformation band in olivenite should be located at 820 cm−1 but is obscured by the As–O stretching bands, whereas it is visible in the spectrum of libethenite at 810 cm−1. Bands observed in the range of 400–560 cm−1 are assigned to bending vibrations of the AsO4 groups and in the range of 750–945 cm−1 to AsO4 stretching vibrations (Frost et al., 2002). The PO4 bending vibrations correspond to the bands in the region of 500–560 cm−1, with the stretching vibrations to the bands at 1022–1080 cm−1 (Gołębiowska et al., 2006a; Jastrzebski et al., 2011). The measured spectra in the region between 800–1200 cm−1 appear close to a two-mode behavior of the solid solution. This spectral region consists of two subregions in samples with intermediate compositions, one at lower wavenumbers due to the vibrations of the AsO4 group and one at higher wavenumbers due mainly to the vibration of the PO4 groups. As there is partial overlap, the two subregions cannot be easily separated.
The band around 3430 cm−1 for olivenite is attributed to the OH stretching vibrations (Hill, 1976; Braithwaite, 1983; Chukanov, 2014). Braithwaite (1983) reported that the position of the OH stretching band shifts from 3420 cm−1 in olivenite to 3470 cm−1 in libethenite, in agreement with the results of this study (Fig. S1).
Initially, the purpose of the FTIR spectroscopy was to check for impurities in the samples. No crystalline admixtures or impurities in the products (e.g., carbonate) were detected in the samples used for calorimetric measurements. The second purpose of this spectroscopy was to carry out the autocorrelation analysis. The spectra do not contain any feature that would possibly affect the autocorrelation analysis results.
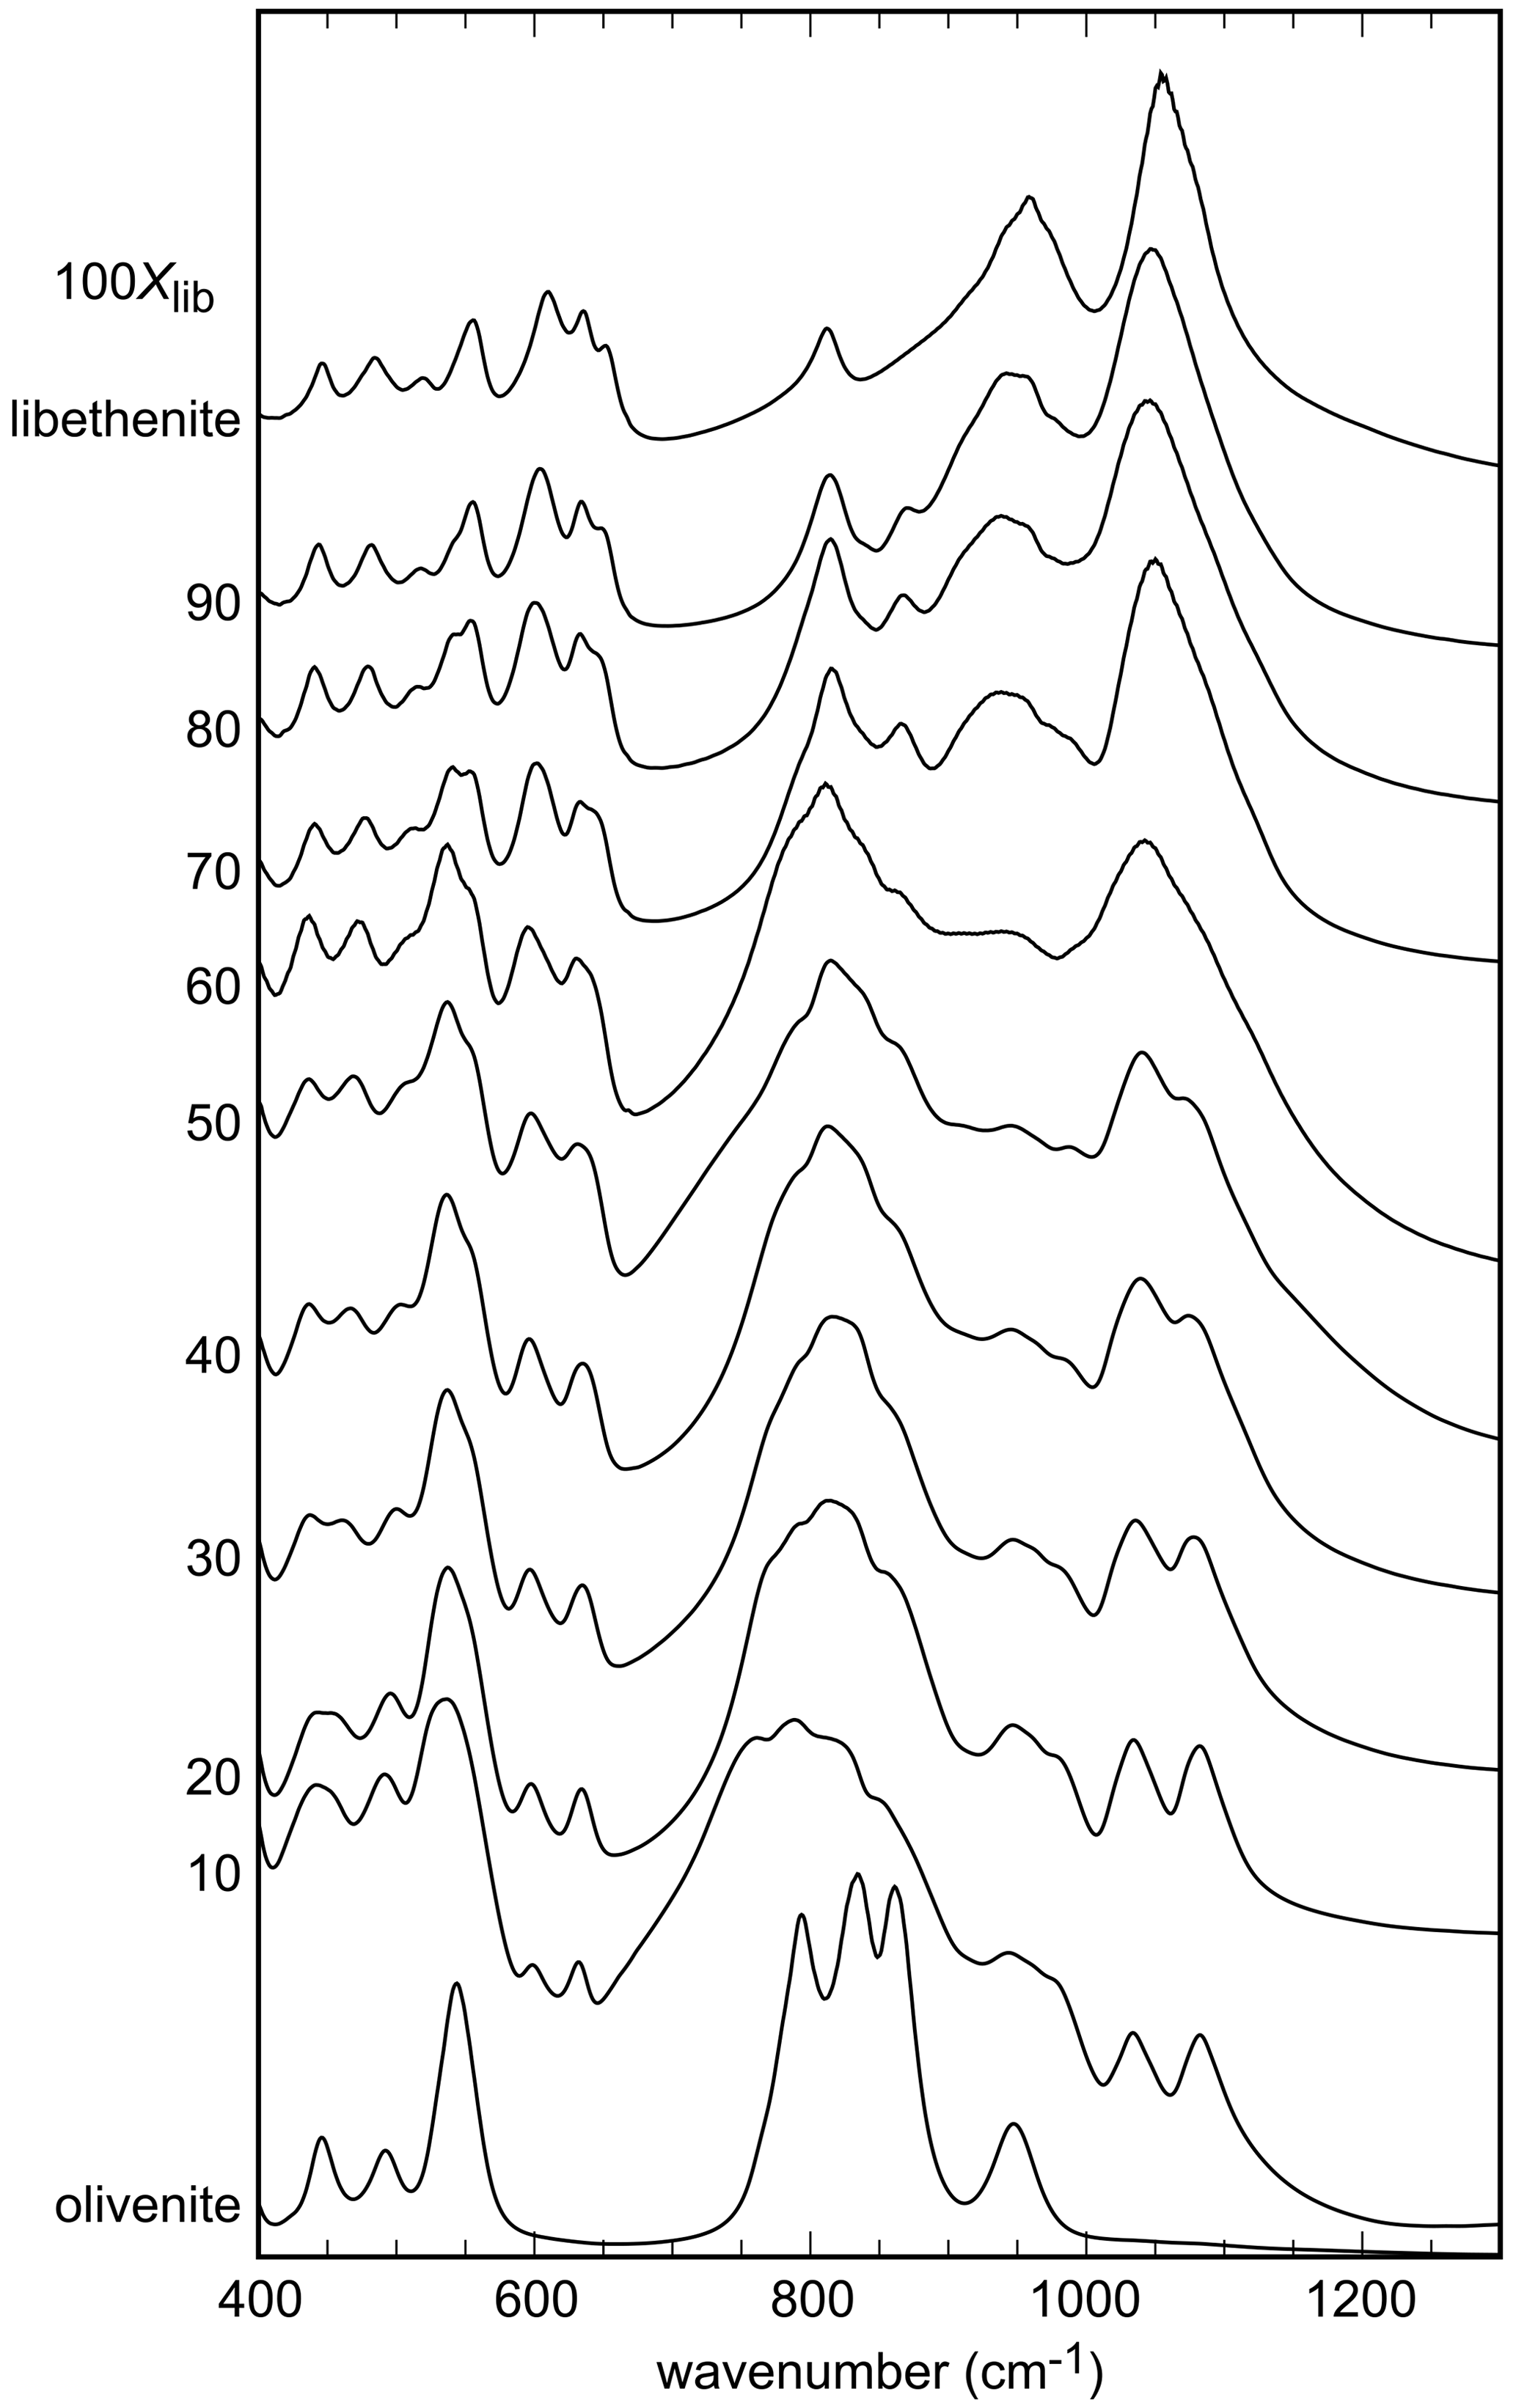
Figure 2FTIR spectra of the synthetic members of the olivenite–libethenite solid solution. For the assignment of the bands, see the text. For clarity, the spectra were offset vertically.
The autocorrelation function was defined as (Salje et al., 2000)
where α is the experimentally measured absorbance of the sample at frequencies of ω. For this analysis, the spectra are successively offset by the frequency shift ω′. One of the resulting corr() functions is shown in Fig. 3; all of them are shown in Fig. S2. The side peaks in this function originate from the overlap of the FTIR bands in the experimental data set. To obtain the information about band broadening, only the central portion of the autocorrelation function is fitted with a Gaussian function of
where k0 is the height of the Gaussian peak, k1 is the position of its center, and k2 is a parameter related to the width of the Gaussian peak. Only the parameter k2 is of interest for the discussion here. It is obtained by extrapolation of the fit values for narrowing ranges of (see Salje et al., 2000). All spectra (Fig. 2), with the exception of Xlib=0.1, were subjected to this analysis. The spectrum for the sample Xlib=0.1 was excluded from the final data set for the autocorrelation analysis. The shape of this spectrum made the definition of the fitted region difficult and always led to outliers in the results of the analysis.
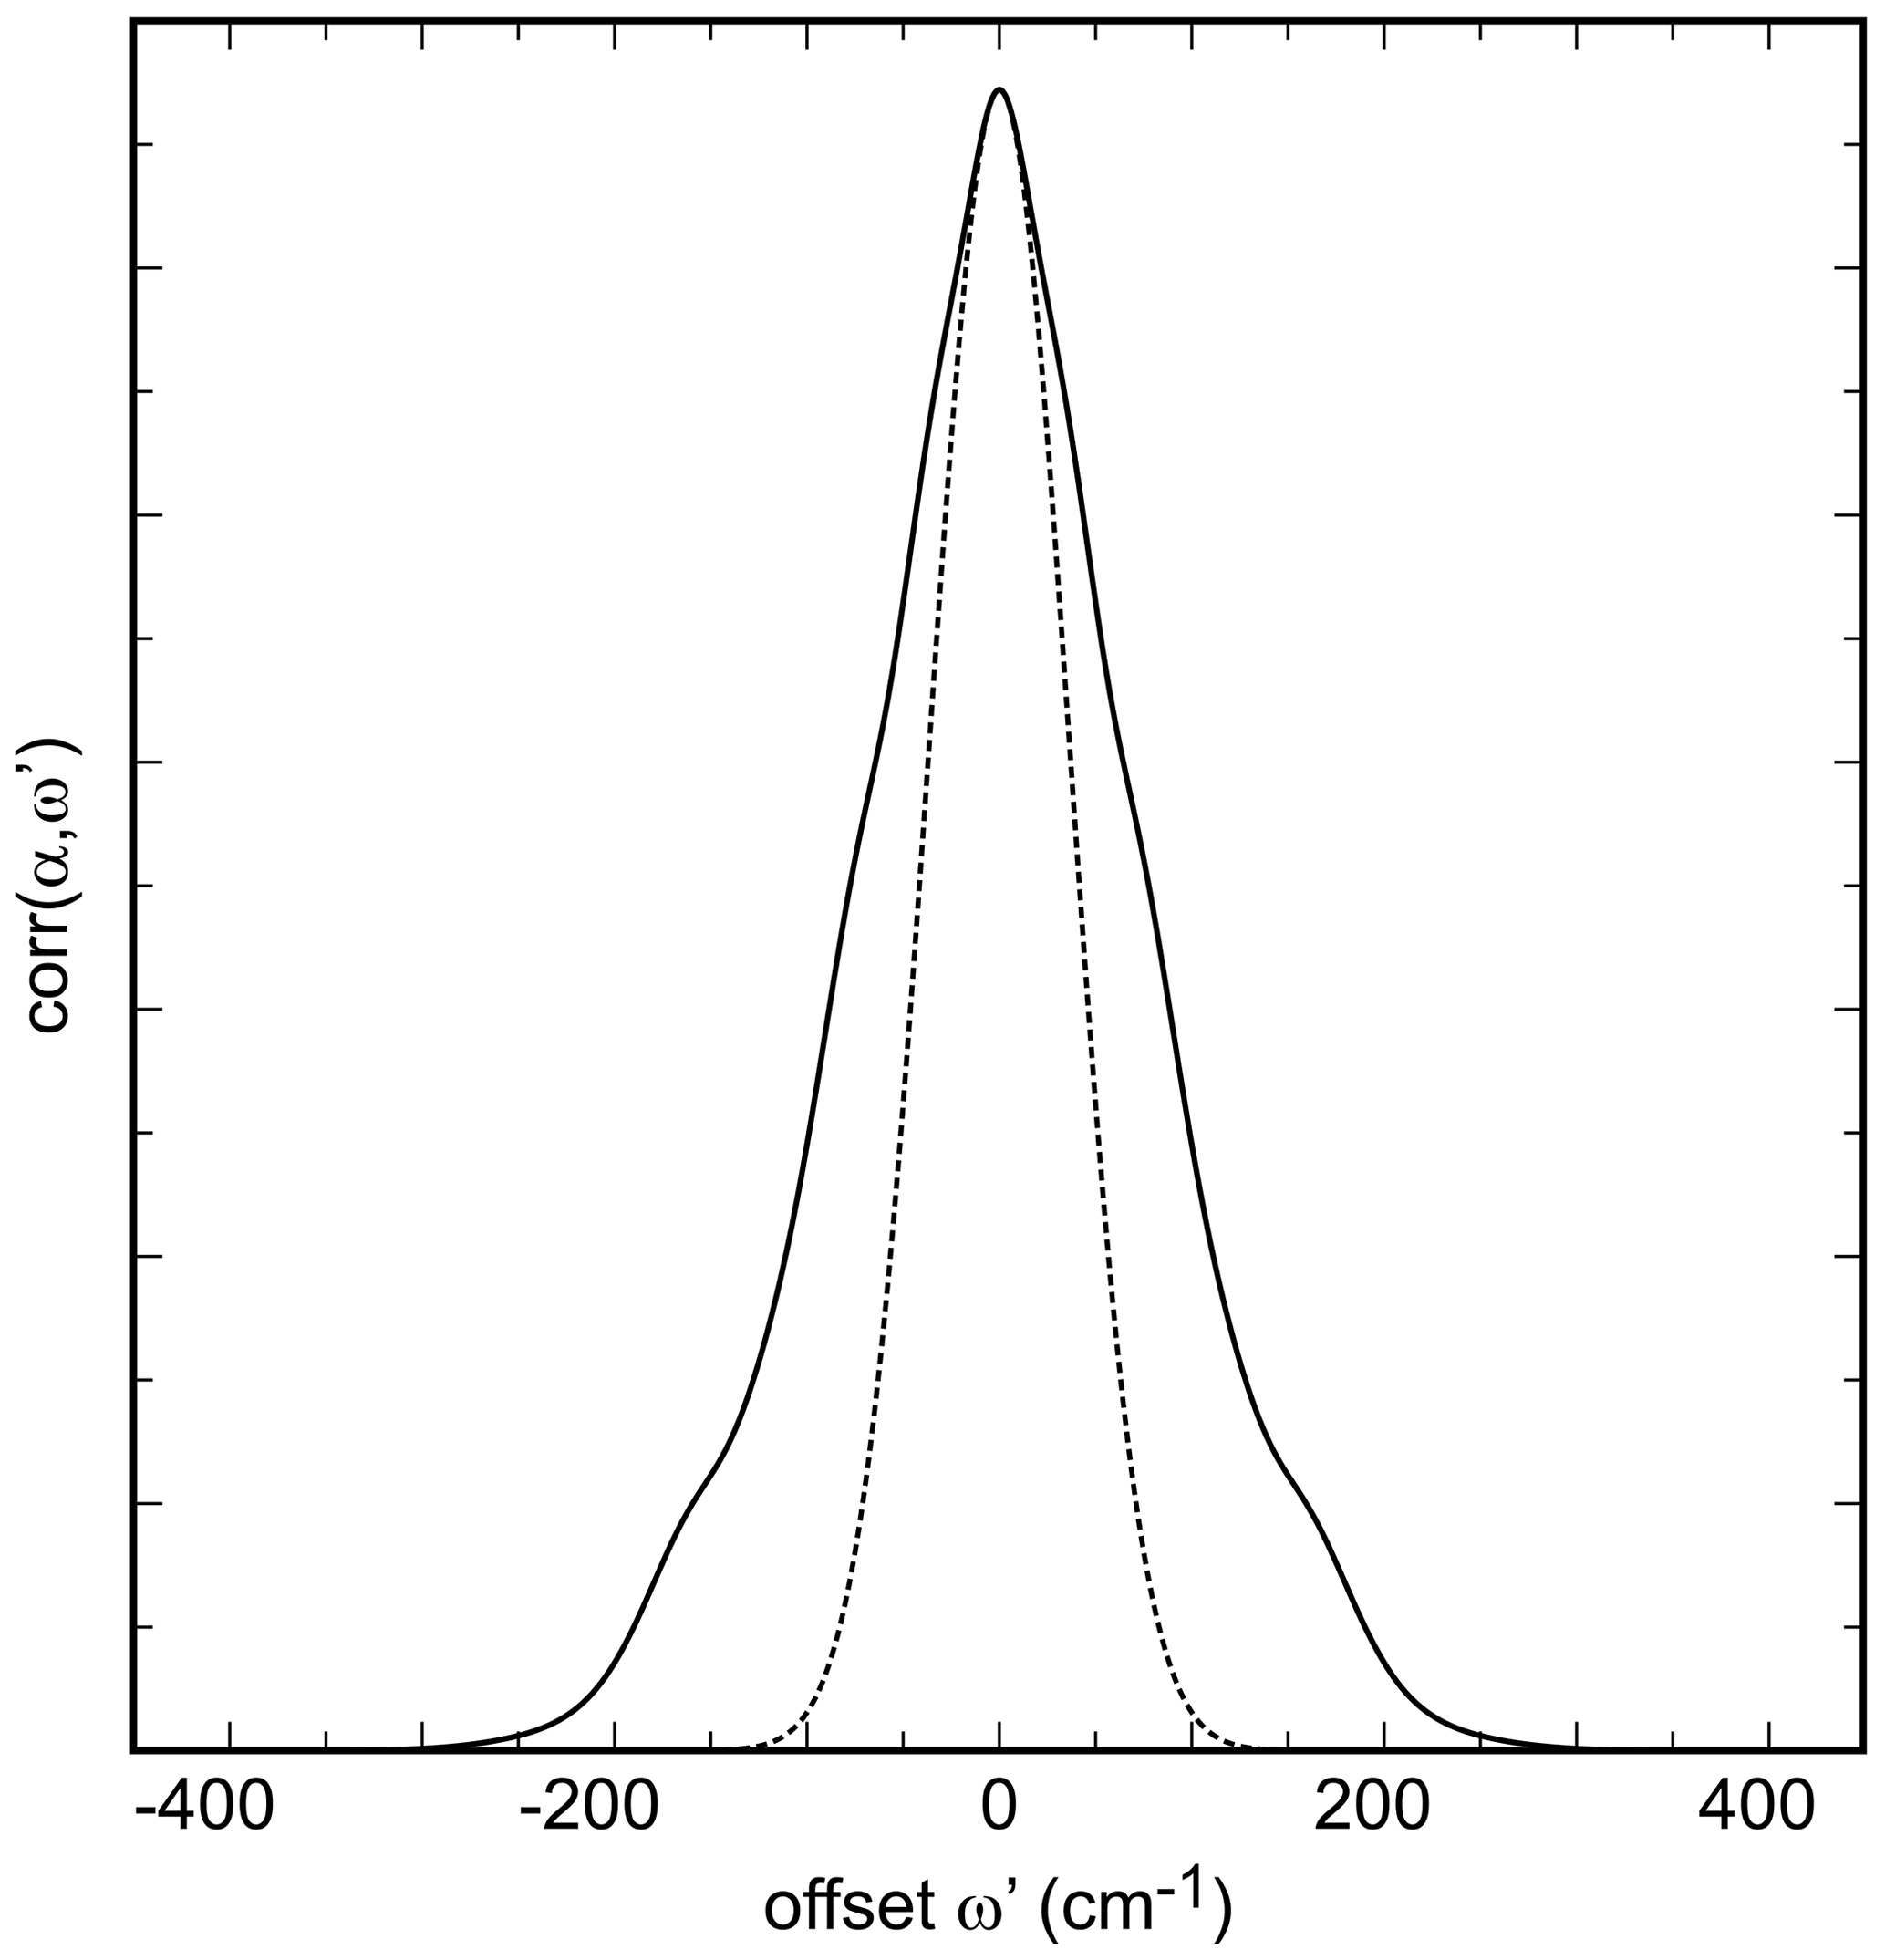
Figure 3Autocorrelation spectrum of the synthetic olivenite from this work from the spectral range of 660 to 1250 cm−1. The dotted curve is a Gaussian fit to the central portion of the autocorrelation spectrum.
Two spectral regions were chosen for the autocorrelation analysis. One of them covered the lower-energy range of 400–660 cm−1; the other one covered the higher-energy range between 660 and 1250 cm−1. The precise bound at ≈660 cm−1 varied from spectrum to spectrum (within ± 10 cm−1) and was defined by the minimum absorbance in that portion of the spectrum.
Ideally, the values of k2 obtained while successively narrowing the fit () range should vary smoothly and allow for extrapolation to with a parabolic function. In our analysis, in agreement with the work of Salje et al. (2000), we found that some spectral sets have enough noise to cause a sudden drop of the k2 values just before (see also Fig. 3 in Salje et al., 2000). Such fits were then performed with k2 values outside of this anomalous behavior as shown for all data sets from this study in Fig. S3.
4.3 Calorimetry – enthalpies
All samples and reference phases dissolved rapidly and reproducibly in the solvent. The dissolution of the synthetic phases of the olivenite–libethenite series is described by the reaction
with the associated enthalpy ΔdissHX, where X is the mole fraction, either of libethenite or olivenite. The enthalpies of mixing in the olivenite–libethenite solid solution refer to the reaction
with
The measured enthalpies of dissolution and calculated excess enthalpies are summarized in Table 3 and plotted in Fig. 4a.
Table 3Thermodynamic properties of mixing the olivenite–libethenite solid solution. The enthalpies of dissolution correspond to ΔdissHX, defined by Reaction (3) in the text. The excess enthalpies (Hex) are calculated from these dissolution enthalpies. The excess volumes (Vex) are calculated from unit-cell volumes listed in Table 2. The third-law entropies (So) were calculated by integration of data. The excess entropies (Sex) were calculated from So. The equations for the calculation of Vex and Sex are defined in the text.
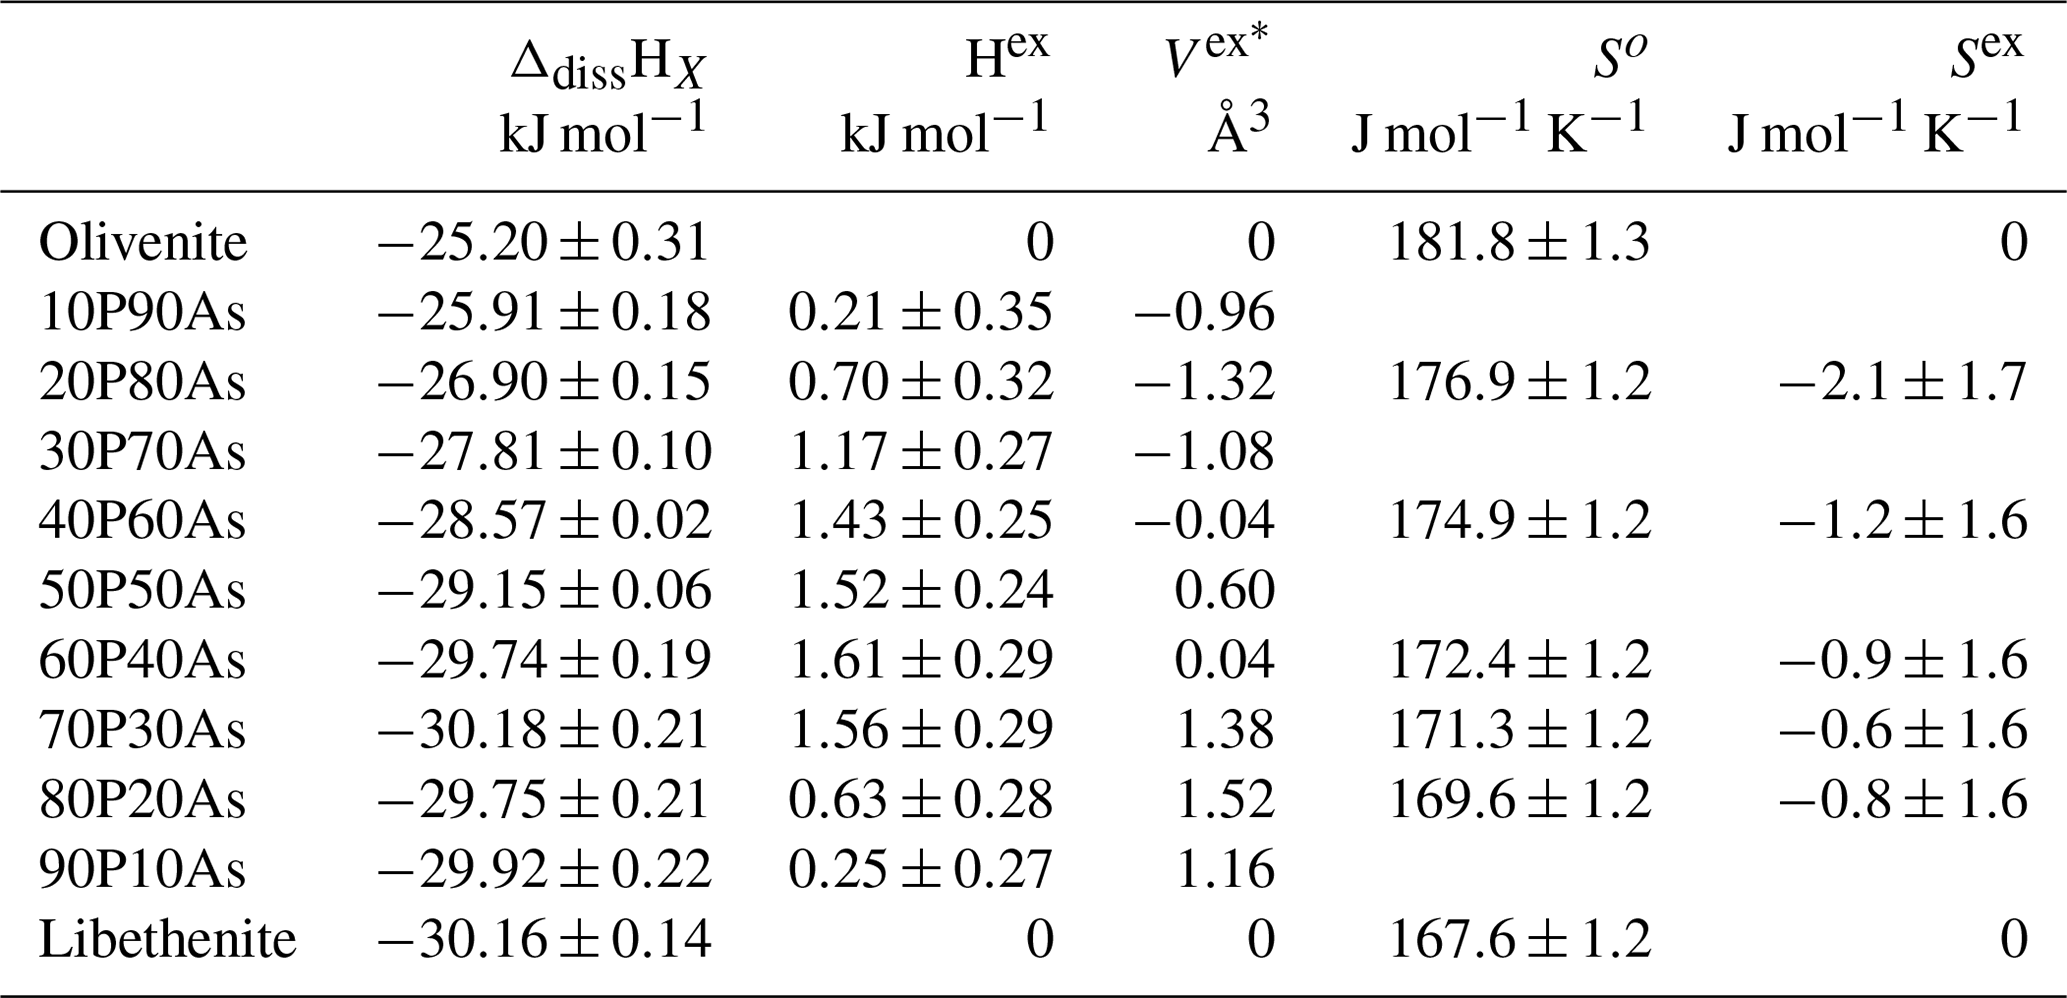
* Uncertainties are ± 0.02.
Table 43D ED data collection and structure refinement details for the olivenite–libethenite solid-solution series sample 50P50As.
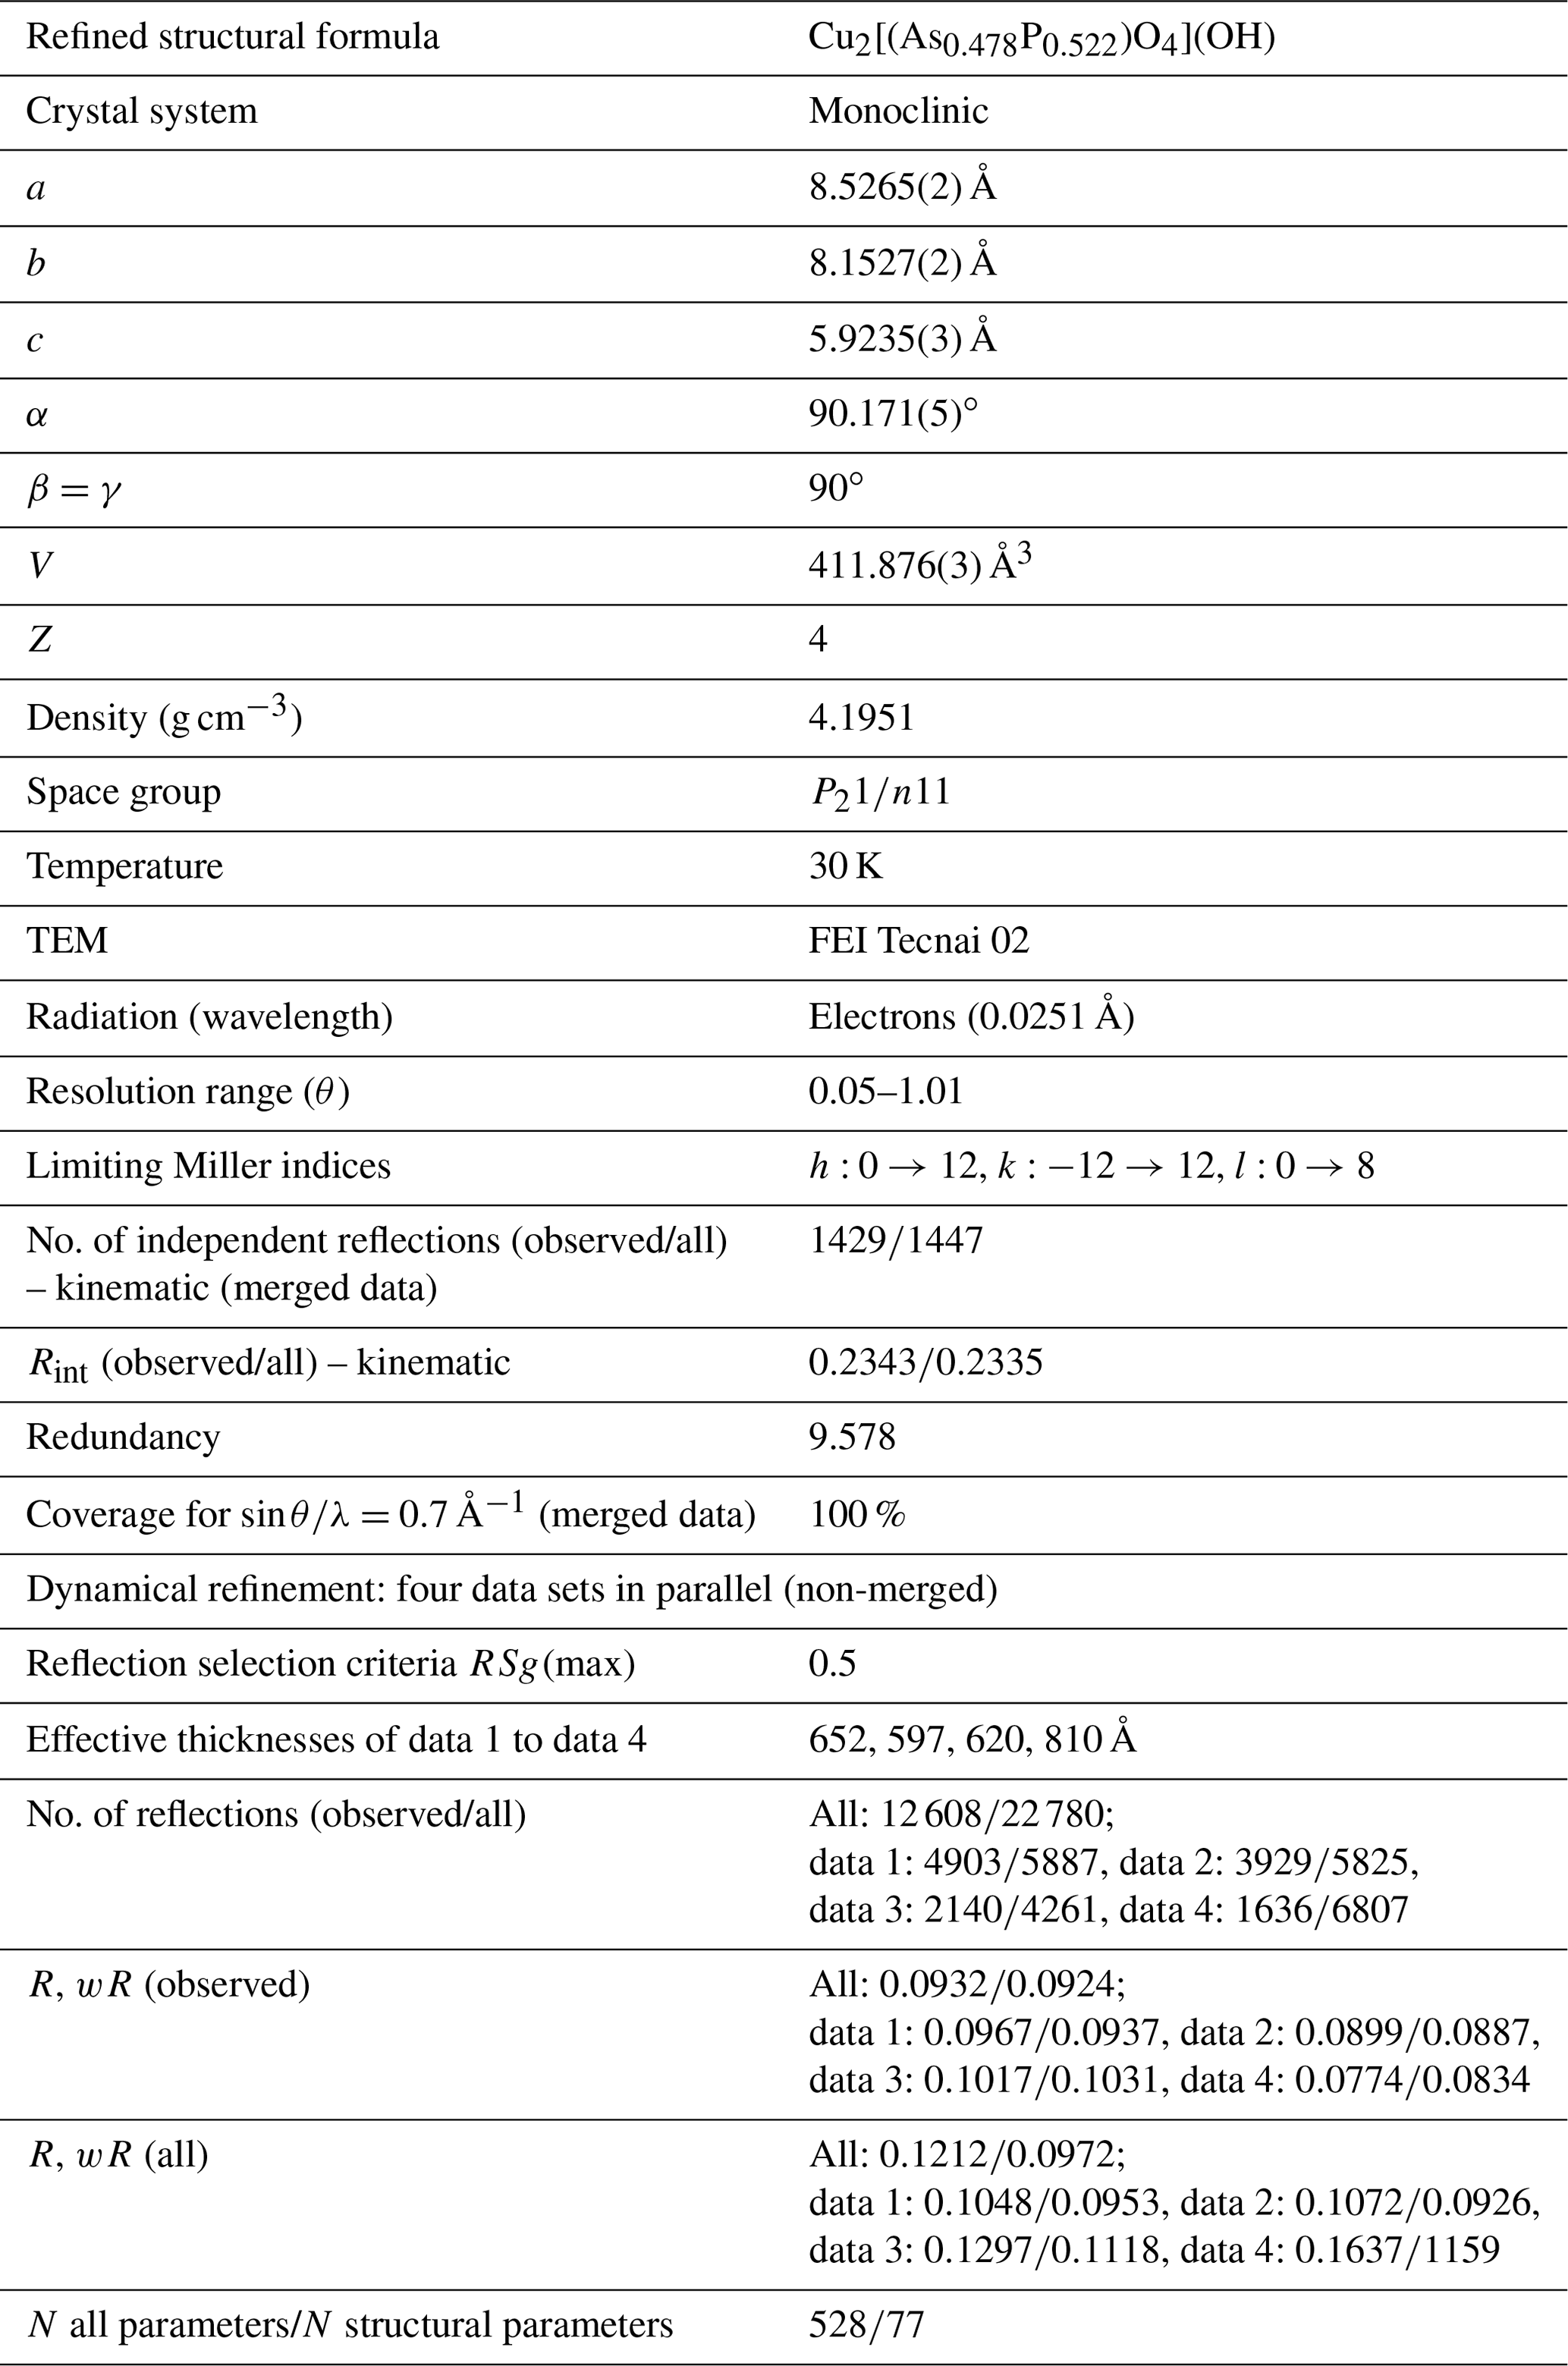
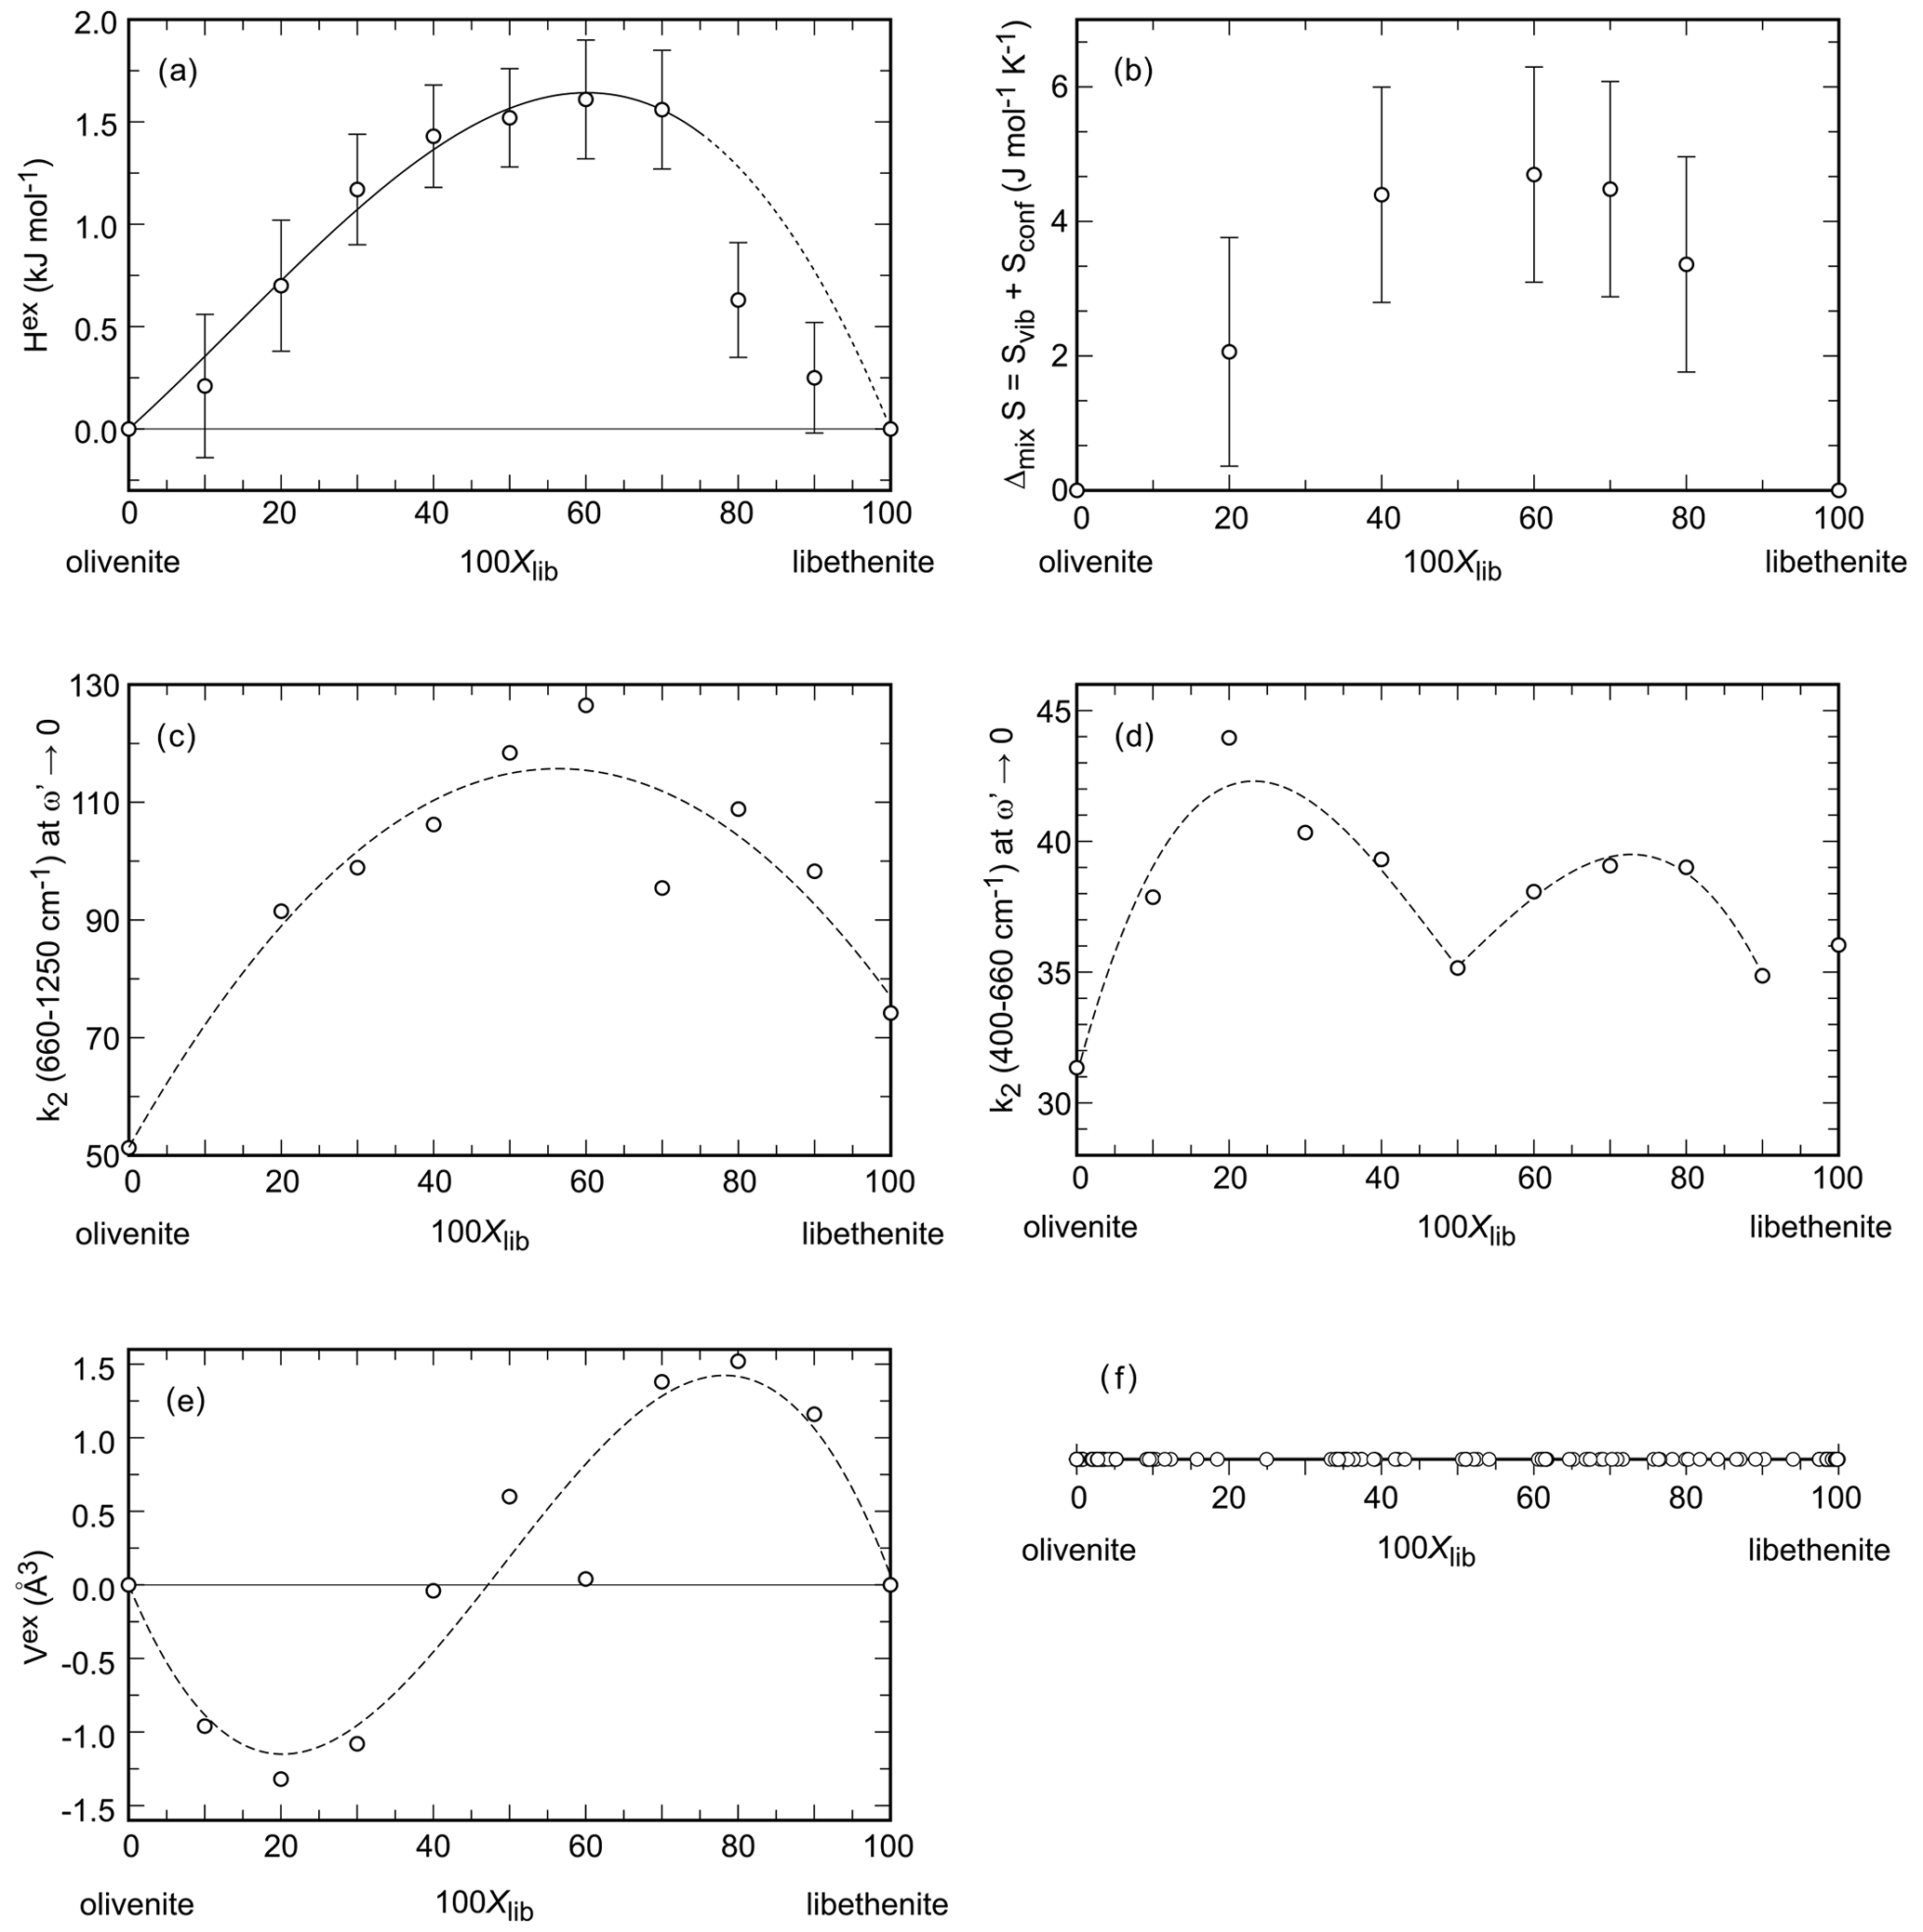
Figure 4Properties in the olivenite–libethenite solid solution. (a) Excess enthalpy. Error bars are 2 standard deviations of the mean of the dissolution experiments. (b) Entropy of mixing. Error bars represent the estimated standard deviation for the integration of the data. (c, d) Width of the central peaks of the autocorrelation function k2 in two different spectral regions, specified on the ordinate of each diagram. The dotted curves are only guides for the eye. (e) Excess volume. The dotted curve is only a guide for the eye. (f) Chemical analyses (all from spot analyses in an electron microprobe) of a natural olivenite–libethenite solid solution. The data are from Števko (2014) and Števko et al. (2017).
4.4 Calorimetry – heat capacities and entropies
Low-temperature heat capacity was measured experimentally, by relaxation calorimetry, for selected members of the olivenite–libethenite solid solution. Heat capacity for the samples with , and 1.0 was measured. The data set was augmented with Cp for Xlib=0.7. From these data, third-law entropies (So) at T=298.15 K were calculated. Additional Cp measurements were not performed because the general trend of variations in So was clear and because these measurements are time- and cost-intensive.
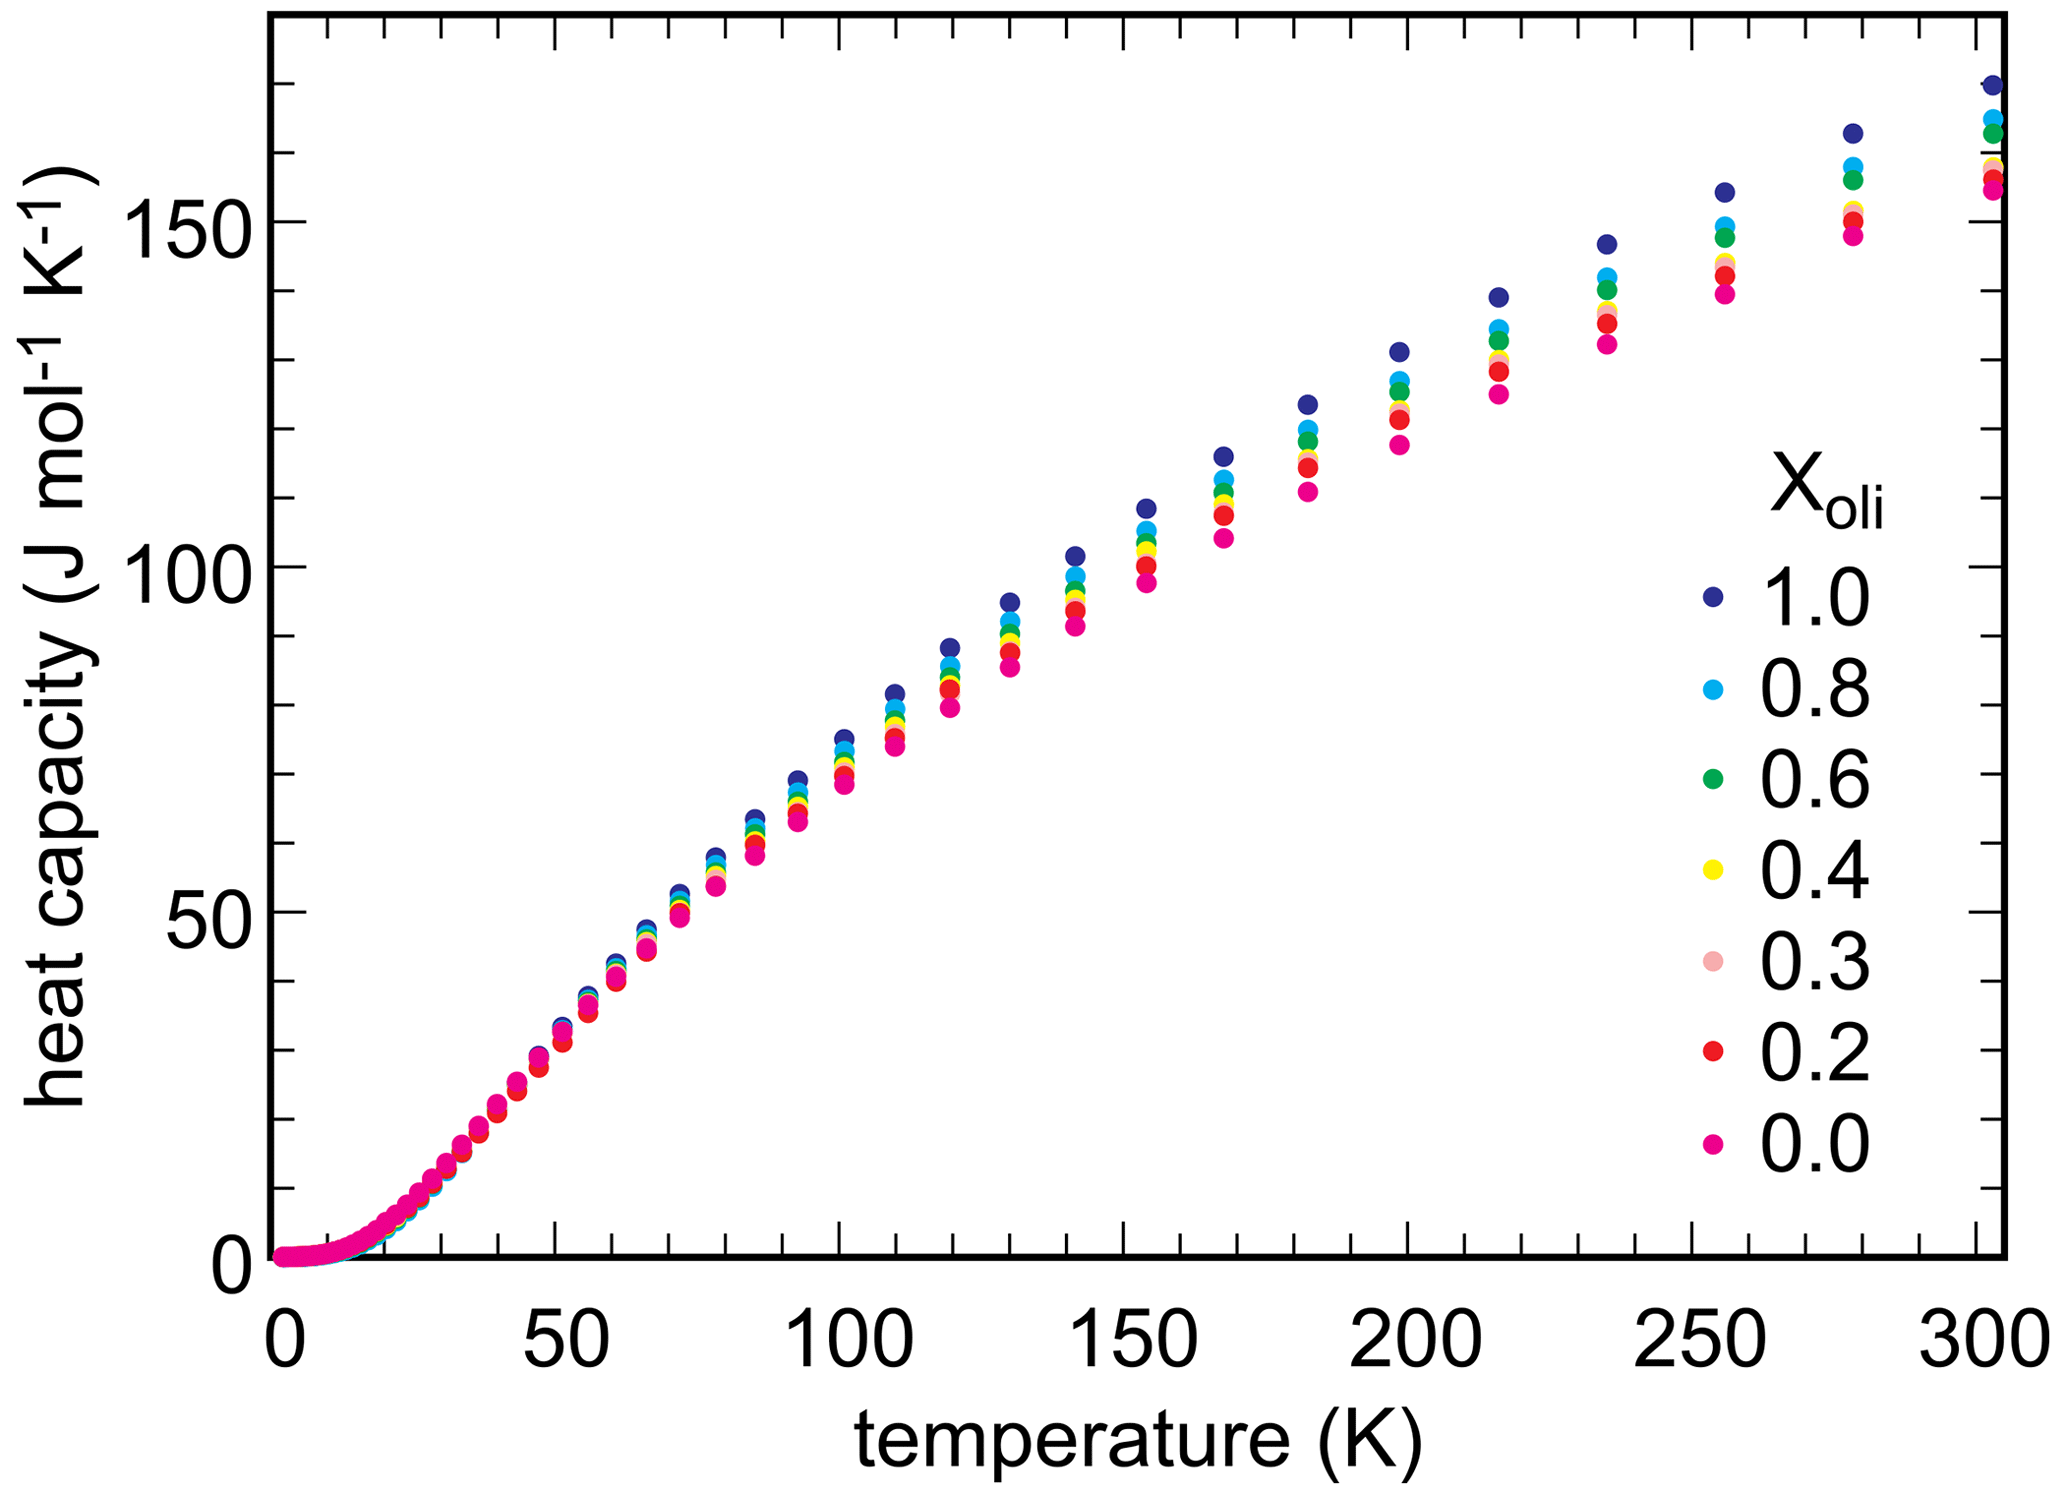
Measured heat capacity data for end-members and selected solid-solution members of the olivenite–libethenite solid solution are shown in Fig. 5. In all cases, heat capacities show no anomalies and fall smoothly to low values down to T ≈ 2 K, the lowest temperature of measurement. Even though magnetic transitions are expected in these phases, they were shown to occur at very low temperatures, below 1.8 K (Belik et al., 2007). The So values, obtained by integration of the functions, are given in Table 3.
The excess entropies in the olivenite–libethenite solid solution (Table 3) were calculated as , where Xlib and Xoli are the molar fractions of the libethenite and olivenite end-members, respectively, in a solid-solution (ss) composition. The Sex values are small and negative. With the exception at Xlib=0.2, all measured values are zero within their uncertainties. There is a trend, however, of increasing excess entropies toward the libethenite end-member. The entropy of mixing (Fig. 4b) consists of the configurational entropies due to mixing (ideal entropies of mixing) and the excess vibrational entropies, determined by relaxation calorimetry. The configurational entropies were calculated as because the electron diffraction data showed no ordering on the P–As site.
5.1 Enthalpies of dissolution and formation
For libethenite and olivenite, the data obtained in this work deviate somewhat from our previous results (Majzlan et al., 2015). The enthalpy of dissolution for libethenite reported in Majzlan et al. (2015) was kJ mol−1; the value from this work is kJ mol−1, with the difference being 0.9 kJ mol−1, outside of the uncertainties. The sample used in the previous study (Majzlan et al., 2015) was re-measured during this work and gave kJ mol−1, in excellent agreement with the earlier datum. Hence, the difference appears to be related to the sample, although no difference was determined, either by chemical, crystallographic, or spectroscopic analysis.
Similarly for olivenite, an earlier datum (Majzlan et al., 2015) was kJ mol−1, but the new value is kJ mol−1. The difference is smaller at 0.7 kJ mol−1 but still slightly larger than the combined uncertainties.
These differences are probably related to the sample preparation protocols that may slightly influence the impurities in the samples. Regular checks with the dissolution of KCl in the 5 N HCl show no differences over more than 10 years during operation of our calorimeter.
5.2 Excess enthalpies and entropies
The excess properties in the olivenite–libethenite solid solution provide an interesting picture. The excess enthalpies (Table 3, Fig. 4a) deviate from ideal behavior, reaching up to 1.6 kJ mol−1. The data, taken at face value, suggest a slight asymmetry of the Hex curve, with a maximum near Xlib=0.6. The values at Xlib=0.5, 0.6, and 0.7 are indistinguishable from each other within uncertainty. The autocorrelation analysis (see above) indicated also asymmetry of the properties of the olivenite–libethenite solid solution, with a maximum at Xlib = 0.6. This asymmetry can be described by the Redlich–Kister equation:
The fit, with the parameters kJ mol−1 and kJ mol−1, is shown in Fig. 4a. The same asymmetry, with a maximum near Xlib=0.6, is indicated by the entropies of mixing (Fig. 4b).
Another distinct feature is the sudden drop of the mixing enthalpies between Xlib=0.7 and 0.8 (Fig. 4a). This feature can be explained by the monoclinic–orthorhombic symmetry change in the solid solution. Our data confirm the structural change, with a small associated energy difference. Such differences are typical of displacive transformations, such as one between the monoclinic and orthorhombic structures of the solid-solution compositions in this compositional region. The displacive nature of this transformation was also assumed by Tarantino et al. (2018). The energetic difference between the monoclinic and orthorhombic intermediate composition in the region of Xlib=0.7–0.8 is small, on the order of 0.9 kJ mol−1 or less.
5.3 Relationship between excess enthalpies and results of the autocorrelation analysis
The resulting values of k2 (660–1200 cm−1) (at ), also known as Δcorr, relate to the average band widths for the investigated part of the spectrum and are shown in Fig. 4c. The values of k2 (400–660 cm−1) (at ) are shown in Fig. 4d.
The determined values of k2 (660–1200 cm−1) do not vary linearly but show a line broadening with a maximum at Xlib=0.6. This behavior can be interpreted as a local heterogeneity that arises from strain relaxation around cations with different sizes (As5+ P5+) in the intermediate members. The length scale of the heterogeneity corresponds to the wavelength of the phonon; for the wavenumbers of 1000 cm−1, this length scale could be on the order of ≈5 Å (Boffa-Ballaran et al., 1999). Given that the edge of the (As, P)O4 tetrahedron is ≈2.6 Å, this strain is limited to the immediate surrounding of the tetrahedra. The heterogeneity could be relieved by cation ordering or by exsolution which is not observed in our data. Such effects are well known from solid solutions of silicate minerals, such as garnets, amphiboles, or pyroxenes (Boffa-Ballaran et al., 1999; Carpenter et al., 1999; Carpenter and Boffa-Ballaran, 2001; Tarantino et al., 2002), or perovskites (Carpenter et al., 2009).
The values of k2 (400–660 cm−1) also do not vary linearly, but their dependence on Xlib is more complicated (Fig. 4d). The length scale of the phonon is estimated to be 6–15 Å (Boffa-Ballaran et al., 1999). At this length scale, the P5+–As5+ substitution also causes strain, but this strain is relieved by the structural (monoclinic–orthorhombic) transformation. There is a distinct minimum in the k2 (400–660 cm−1) at Xlib=0.5, near the composition where this transformation occurs.
It has been proposed that FTIR line broadening may correlate with non-ideal mixing behavior (e.g., Boffa-Ballaran et al., 1999; Tarantino et al., 2002). The line-broadening parameter δΔcorr was therefore calculated from the k2 (660–1200 cm−1) (at ) (also known as Δcorr) values (Fig. 4c) in the same manner as done with the excess enthalpies (Eq. 4):
where Aδ=210.2 and for the data in this study. Etzel and Benisek (2008) proposed a correlation between monatomic excess enthalpy (hex) and δΔcorr for silicates. If the integrated excess volume of mixing is zero, as is the case with the present binary (see next section), a corr ratio of 10.5 would result according to this correlation. For the binary under investigation, this value (derived for silicates by Etzel and Benisek, 2008) is too large. A corr value of 3 results in a good agreement with the calorimetric data (Fig. 6). The excess enthalpy derived from the line broadening was thereby calculated according to
where n is the number of atoms per formula unit (n=9 for Cu2(AsO4)(OH), Cu2(PO4)(OH), or their solid-solution members). We emphasize that the value of 3 is just a fit parameter with no physical meaning. It is only used to map the Hex values onto the δΔcorr values, in order to compare the shape of both parameters as a function of Xlib according to Eqs. (4) and (5).
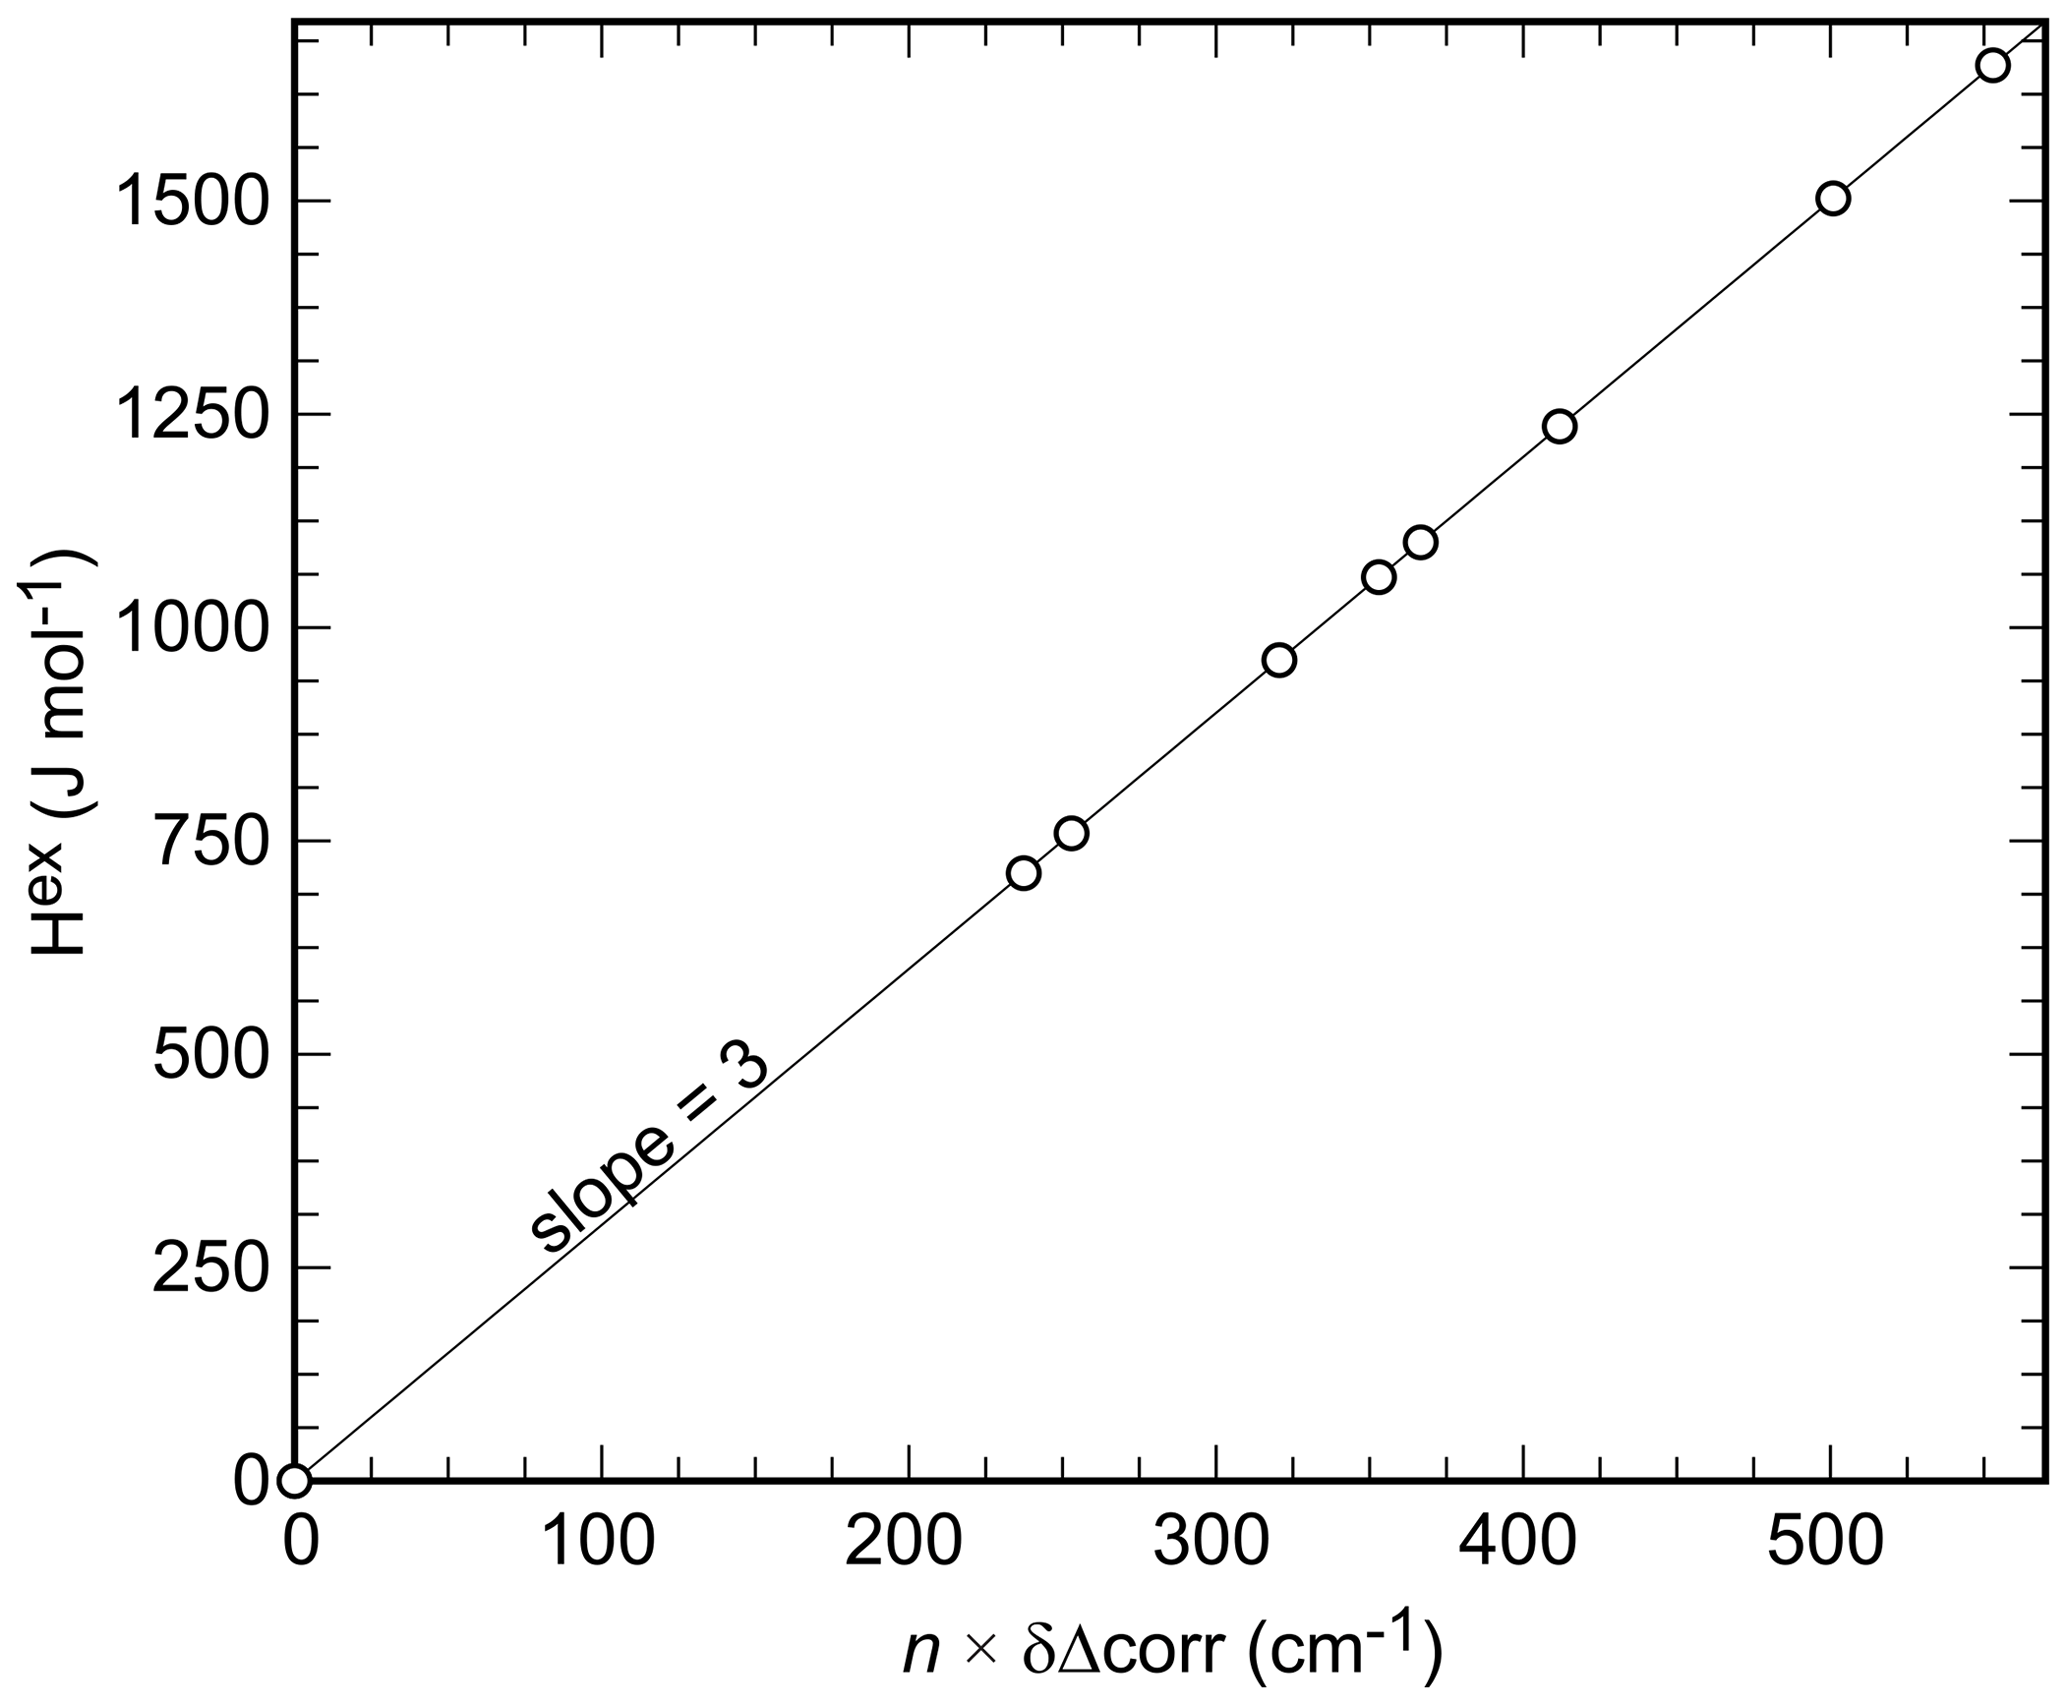
Figure 6Correlation of Hex and the δΔcorr values determined for the olivenite–libethenite samples in this study; n is the number of the atoms in the formula unit, in this case 9. The line shown is not a fit to the data, but it is rather a line with an exact slope of 3.
5.4 Variations in the molar volumes in the solid-solution series
The excess molar volumes (Vex) are plotted in Fig. 4e. Addition of PO4 into olivenite causes contraction of the unit cell, as expected for substitution of a smaller for a larger cation, leading to a minimum of Vex at Xlib≈0.2 (Fig. 4e). On the other side of the solid solution, addition of AsO4 into libethenite causes expansion of the unit cell. The excess volume does not scale with Xlib in a linear fashion, however. The crest of the peak of the Vex curve coincides with the drop in Hex between Xlib=0.7 and 0.8, suggesting that the shape of Vex curve is linked to the symmetry change. We assume, therefore, that the variations in Vex are related to the interplay of cation-size differences and the small driving force between the two related (monoclinic–orthorhombic) structures.
An alternative explanation for the shape of the Vex curve could be P–As ordering in the solid-solution members near Xlib=0.5. The existence of such ordering, however, was conclusively refuted by the electron diffraction work presented herein.
5.5 Arsenate–phosphate solid solutions in secondary minerals
Many secondary arsenates that form by oxidative weathering of primary ore minerals contain small amounts of phosphate in their structure. Complete solid solution or limited solubility, manifested by co-existence of near end-members, is rare. Therefore, the question of geochemical or thermodynamic reasons for this observation can be posed.
Two small historical copper deposits near the village of Ľubietová in Slovakia may bring some insights about this question. They are located 3 km apart, and their primary mineralogy is different (Števko et al., 2017, 2021). The Podlipa deposit is dominated by chalcopyrite, with minor to trace tennantite and Bi sulfosalts. The Svätodušná deposit is dominated by tennantite, with minor chalcopyrite. Podlipa has an oxidation zone with exceptional specimens of the copper phosphates libethenite (Podlipa is the type locality of libethenite, the mineral was named after the German name of Ľubietová – Libethen) and pseudomalachite (Cu5(PO4)2(OH)4). A rare mineral there is mrázekite (Bi2Cu3(PO4)2O2(OH)2⋅ H2O), forming near the needles of Bi sulfosalts (Řídkošil et al., 1992). Svätodušná, on the other hand, is known for rich association of copper arsenates, especially euchroite (Cu2(AsO4)(OH) ⋅ 3H2O) crystals (it is the type locality of this mineral) and olivenite. The secondary mineralogy at these two sites is clearly controlled by the primary minerals. The absence of arsenic at Podlipa led to the precipitation of abundant phosphates, unlike at Svätodušná. At Podlipa, however, even the small amounts of tennantite can cause rare and local increase of the As (As + P) ratio in the members of the olivenite–libethenite solid solution (Števko et al., 2017, 2021). When summarizing all available data (Fig. 4f), this solid solution appears to be continuous, although we suspected in our earlier work (Majzlan et al., 2015) that there may be a small miscibility gap.
The structures of olivenite and libethenite are dense, with little possibility of relieving structural strain caused by the P–As substitution. The olivenite–libethenite solid solution is thermodynamically non-ideal, albeit with small excess enthalpies. The small negative excess entropies and the configurational entropies stabilize the solid solution. Altogether, this solid solution does not develop a miscibility gap. This conclusion agrees with the observations on natural assemblages, when examined on large data sets of the chemical composition of the olivenite–libethenite series (Fig. 4f). In our earlier work (Majzlan et al., 2015), we assumed that there is a small miscibility gap, but it turns out that this conclusion was an artifact of an insufficient number of data points.
Lippmann diagrams for this solid solution (Majzlan et al., 2015), for either an ideal or a non-ideal solid solution, predict preferential uptake of PO4 in the product that precipitates from an aqueous phase. Our experiments did not confirm this prediction, perhaps because our samples formed by recrystallization of an amorphous precursor. It is not clear if such processes also operate in nature or if these minerals precipitate directly, over longer time periods, from the aqueous solutions.
It could be assumed that the mixing enthalpies are even smaller in metastable structures of secondary arsenates. Therefore, such minerals should be able to take up a variable amount of phosphate into their structures. If true, then the separation of P–As is essentially geochemical in its nature. Arsenic is a common constituent of primary ores (e.g., in arsenopyrite, enargite, pyrite, or tennantite), whereas phosphorus is found, if at all, usually only as accessory apatite or monazite in the host rocks. For this reason, the oxidation zones of ore deposits more commonly contain secondary arsenates than secondary phosphates.
Heat capacity raw data for all measured samples are available in the XLSX file. The CIF file is available for the 3D ED refinement of the sample 50P50As. Complete FTIR spectra for all samples from this study are available in the CSV and PDF file. The data are available upon request.
The supplement related to this article is available online at: https://doi.org/10.5194/ejm-35-157-2023-supplement.
JM: conception of the project, reduction of data, calculation of thermodynamic quantities and models, and writing of the paper. AP: syntheses and characterization of the samples and acid-solution calorimetry. MŠ: data and discussion of natural assemblages. GS and JP: 3D ED experiments. ED and AB: relaxation calorimetry and calculation of correlations.
The contact author has declared that none of the authors has any competing interests.
Publisher’s note: Copernicus Publications remains neutral with regard to jurisdictional claims in published maps and institutional affiliations.
We appreciate the many constructive and meticulous comments of an anonymous reviewer and Tiziana Boffa Ballaran that helped to improve this paper significantly. We thank Michael Carpenter for helpful comments on the local heterogeneities in solid solutions. The work presented here was financially supported by a grant of the Deutsche Forschungsgemeinschaft (no. MA 3927/26-1) and by Operational Programme Research, Development and Education financed by European structural and investment funds and the Czech Ministry of Education, Youth and Sports (MEYS CR; project no. SOLID21 CZ.02.1.01/0.0/0.0/16_019/0000760). We also acknowledge the CzechNanoLab research infrastructure supported by MEYS CR (grant no. LM2018110).
This research has been supported by the Deutsche Forschungsgemeinschaft (grant no. MA 3927/26-1).
This paper was edited by Tiziana Boffa Ballaran and reviewed by Tiziana Boffa Ballaran and one anonymous referee.
Belik, A. A., Koo, H.-J., Whangbo, M.-H., Tsujii, N., Naumov, P., and Takayama-Muromachi, E.: Magnetic properties of synthetic libethenite, Cu2PO4OH: A new spin-gap system, Inorg. Chem., 46, 8684–8689, 2007. a
Belik, A. A., Naumov, P., Kim, J., and Tsuda, S.: Low-temperature structural phase transition in synthetic libethenite Cu2PO4OH, J. Solid State Chem., 184, 3128–3133, 2011. a
Berry, L. G.: Observations on conichalcite, cornwallite, euchroite, liroconite and olivenite, Am. Mineral., 36, 484–503, 1951. a
Boffa-Ballaran, T., Carpenter, M. A., Geiger, C. A., and Koziol, A. M.: Local structural heterogeneity in garnet solid solutions, Phys. Chem. Miner., 26, 554–569, 1999. a, b, c, d
Braithwaite, R. S. W.: Infrared spectroscopic analysis of the olivenite-adamite series, and of phosphate substitution in olivenite, Mineral. Mag., 47, 51–57, 1983. a, b, c, d, e, f
Burns, P. C. and Hawthorne, F. C.: Rietveld refinement of the crystal structure of olivenite: a twinned monoclinic structure, Can. Miner., 33, 885–888, 1995. a, b, c, d, e, f, g
Carpenter, M. A. and Boffa-Ballaran, T.: The influence of elastic strain heterogeneities in silicate solid solutions, EMU Notes Miner., 3, 155–178, 2001. a
Carpenter, M. A., Boffa-Ballaran, T., and Atkinson, A. J.: Microscopic strain, local structural heterogeneity and the energetics of silicate solid solutions, Phase Trans., 69, 95–109, 1999. a
Carpenter, M. A., McKnight, R. E. A., Howard, C. J., Zhou, Q., Kennedy, B. J., and Knight, K. S.: Characteristic length scale for strain fields around impurity cations in perovskites, Phys. Rev. B, 80, 214101, https://doi.org/10.1103/PhysRevB.80.214101, 2009. a
Chukanov, N. V., Pushcharovsky, D. Yu., Zubkova, N. V., Pekov, I. V., Pasero, M., Merlino, S., Möckel, S., Rabadanov, M. K., and Belakovskiy, D. I.: Zincolivenite CuZn(AsO4)(OH): A new adamite-group mineral with ordered distribution of Cu and Zn, Trans. Russ. Acad. Sci. A , 415, 841–845, 2007. a, b
Chukanov, N. V.: Infrared spectra of mineral species: Extended library, Springer Geochemistry/Mineralogy, Springer Netherlands, Dordrecht, Springer, ISBN: 978-94-007-7128-4, 2014. a, b
Cordsen, A.: A crystal-structure refinement of libethenite, Can. Mineral., 16, 153–157, 1978. a
Etzel, K. and Benisek, A.: Thermodynamic mixing behaviour of synthetic Ca-Tschermak-diopside pyroxene solid solutions: III. Analyses of IR line broadening and heat of mixing behaviour, Phys. Chem. Miner., 35, 399–407, 2008. a, b
Flis, J., Manecki, M., and Bajda, T.: Solubility of pyromorphite Pb5(PO4)3Cl–mimetite Pb5(AsO4)3Cl solid solution series, Geochim. Cosmochim. Ac., 75, 1858–1868, 2011. a
Frost, R. L., Martens, W. N., and Williams, P. A.: Raman spectroscopy of the phase-related basic copper arsenate minerals olivenite, cornwallite, cornubite and clinoclase, J. Raman Spectr., 33, 475–484, 2002. a
Gemmi, M. and Lanza, A. E.: 3D electron diffraction techniques, Acta Cryst. B, 75, 495–504, 2019. a
Gemmi, M., Mugnaioli, E., Gorelik, T. E., Kolb, U., Palatinus, L., Boullay, P., Hovmöller, S., and Abrahams, J. P.: 3D electron diffraction: The nanocrystallography revolution, ACS Central Sci., 5, 1315–1329, 2019. a
Gołębiowska, B., Pieczka, A., and Franus, W., 2006: Olivenite-adamite solid solution from oxidation zone in Rędziny (West Sudetes, Poland), Miner. Polonica, 37, 97–107, 2006. a
Gołębiowska, B., Pieczka, A., and Franus, W.: Olivenite-adamite solid solution from oxidation zone in Rędziny (West Sudetes, Poland), Miner. Polonica, 37, 101–110, 2006. a
Heritsch, H.: Vorbericht über röntgenographische Untersuchungen an Olivenit Cu2(OH)(AsO4), Z. Kristallogr., 98, 351–353, 1938. a
Hill, R. J.: The crystal structure and infrared properties of adamite, Am. Miner., 61, 979–986, 1976. a, b
Jastrzebski, W., Sitarz, M., Rokita, M., and Bułat, K.: Infrared spectroscopy of different phosphates structures, Spectroch. Ac. A, 79, 722–727, 2011. a
Jinnouchi, S., Yoshiasa, A., Sugiyama, K., Shimura, R., Arima, H., Momma, H., and Miyawaki, R.: Crystal structure refinements of legrandite, adamite, and paradamite: The complex structure and characteristic hydrogen bonding network of legrandite, J. Miner. Petrol. Sci., 111, 35–43, 2016. a
Kato, T. and Miúra, Y.: The crystal structures of adamite and paradamite, Mineral. J., 6, 320–328, 2007. a
Kennedy, C. A., Stancescu, M., Marriott, R. A., and White, M. A.: Recommendations for accurate heat capacity measurements using a Quantum Design physical property measurement system, Cryogenics, 47, 107–112, 2007. a
Kharbish, S., Andráš, P., Luptáková, J., and Milovská, S.: Raman spectra of oriented and non-oriented Cu hydroxy-phosphate minerals: libethenite, cornetite, pseudomalachite, reichenbachite and ludjibaite, Spectrochim. Ac. A, 130, 152–163, 2014. a
Klar, P. B., Xu, H., Steciuk, G., Cho, J., Zou, X., Palatinus, L., and Republic, C.: Chirality and accurate structure models by exploiting dynamical effects in continuous-rotation 3D ED data, Chemrxiv, 1–25, https://doi.org/10.26434/chemrxiv-2021-4jh14, 2021.
Kolb, U., Gorelik, T., Kübel, C., Otten, M. T., and Hubert, D.: Towards automated diffraction tomography: Part I – Data acquisition, Ultramicroscopy, 107, 507–513, 2007. a
Kolb, U., Gorelik, T., and Otten, M. T.: Towards automated diffraction tomography, Part II – Cell parameter determination, Ultramicroscopy, 108, 763–772, 2008. a
Kösters, J., Paulsen, C., Stegemann, F., Heying, B., Galéa-Clolus, V., and Pöttgen, R.: Twinned olivenite from Cap Garonne, Mine du Pradet – structure and magnetic behavior, Z. Kristall., 235, 7–13, 2020. a
Li, C., Yang, H., and Downs, R. T.: Redetermination of olivenite from an untwinned single crystal, Acta Cryst. Ser. E, 64, 60–61, 2008. a, b, c
Magalhães, M. C. F., De Jesus, J. D. P., and Williams, P. A.: Stability constraints and formation of Cu(II) and Zn(II) phosphate minerals in the oxidized zone of base metal orebodies, Miner. Mag., 50, 33–39, 1986. a
Magalhães, M. C. F., De Jesus, J. D. P., and Williams, P. A.: The chemistry of formation of some secondary arsenate minerals of Cu(II), Zn(II) and Pb(II), Miner. Mag., 52, 679–690, 1988. a
Majzlan, J.: Solution calorimetry on minerals related to acid mine drainage – methodology, checks, and balances, Acta Geol. Slovaca, 9, 171–183, 2017. a
Majzlan, J., Fillipi, M., and Drahota, P.: Mineralogy and crystal chemistry of arsenic, Rev. Miner. Geochem., 79, 17–184, 2014.
Majzlan, J., Zittlau, A., Grevel, K.-D., Schliesser, J., Woodfield, B. F., Dachs, E., Števko, M., Plášil, J., and Milovská, S.: Thermodynamic properties and phase equilibria of the secondary copper minerals libethenite, olivenite, pseudomalachite, kröhnkite, cyanochroite, and devilline, Can. Miner., 53, 937–960, 2015. a, b, c, d, e, f, g, h, i
Mugnaioli, E., Gorelik, T., and Kolb, U.: Ab initio structure solution from electron diffraction data obtained by a combination of automated diffraction tomography and precession technique, Ultramicroscopy, 109, 758–765, 2009. a
Palatinus, L. and Chapuis, G.: SUPERFLIP – A computer program for the solution of crystal structures by charge flipping in arbitrary dimensions, J. Appl. Cryst., 40, 786–790, 2007. a
Palatinus, L.: The charge-flipping algorithm in crystallography, Acta Cryst. B, 69, 1–16, 2013. a
Palatinus, L., Corrêa, C. A., Steciuk, G., Jacob, D., Roussel, P., Boullay, P., Klementová, M., Gemmi, M., Kopeček, J., Domeneghetti, M. C., Cámara, F., and Petříček, V.: Structure refinement using precession electron diffraction tomography and dynamical diffraction: tests on experimental data, Acta Cryst. B, 71, 740–751, 2015. a
Palatinus, L., Petříček, V., and Corrêa, C. A.: Structure refinement using precession electron diffraction tomography and dynamical diffraction: Theory and implementation, Acta Cryst. A, 71, 235–244, 2015. a
Palatinus, L., Brázda, P., Jelínek, M., Hrdá, J., Steciuk, G., and Klementová, M.: Specifics of the data processing of precession electron diffraction tomography data and their implementation in the program PETS2.0, Acta Cryst. B, 75, 512–522, 2019. a
Petříček, V., Dušek, M., and Palatinus, L.: Crystallographic computing system JANA2006: General features, Z. Kristallogr., 229, 345–352, 2014. a, b
Plana-Ruiz, S., Krysiak, Y., Portillo, J., Alig, E., Estradé, S., Peiró, F., and Kolb, U.: Fast-ADT: A fast and automated electron diffraction tomography setup for structure determination and refinement, Ultramicroscopy, 211, 112951, https://doi.org/10.1016/j.ultramic.2020.112951, 2020. a
Richmond, W. E.: Crystal chemistry of the phosphates, arsenates and vanadates of the type A2XO4(Z), Am. Mineral., 25, 441–479, 1940. a
Řídkošil, T., Šrein, V., Fábry, J., Hybler, J., and Maximov, B. A.: Mrázekite, Bi2Cu3(OH)2O2(PO4) ⋅ 2H2O, a new mineral species and its crystal structure, Can. Miner., 30, 215–224, 1992. a
Salje, E. K. H., Carpenter, M. A., Malcherek, T., and Boffa-Ballaran, T.: Autocorrelation analysis of infrared spectra from minerals, Eur. J. Miner., 12, 503–519, 2000. a, b, c, d
Sejkora, J., Ondruš, P., Fikar, M., Veselovský, F., Mach, Z., Gabašová, A., Škoda, R., and Beran, P.: Supergene minerals at the Huber stock and Schnöd stock deposits, Krásno ore district, the Slavkovský les area, Czech Republic, J. Czech Geol. Soc., 51, 57–101, 2006. a
Rumsey, M., Welch, M., Spratt, J., Kleppe, A., and Števko, M.: Kernowite, Cu2Fe(AsO4)(OH)4⋅ 4H2O, the Fe3+-analogue of liroconite from Cornwall, UK, Mineral. Mag., 85, 283–290, 2021.
Southwood, M., Števko, M., and Carr, P.: Tsumeb: Zincolivenite and the adamite-olivenite series, Rocks Mineral., 95, 210–232, 2020. a, b
Števko, M.: Mineralogical characteristics of the supergene minerals from the localities Novoveská Huta, Poniky a Špania Dolina, PhD Thesis, Comenius University Bratislava, PhD thesis, 134 pp., 2014 (in Slovak). a
Števko, M., Sejkora, J., and Súľovec, Š.: Contribution to the chemical composition of libethenite from the type locality: Podlipa copper deposit, Ľubietová (Slovak Republic), Bull. Miner. Petrol., 25, 252–259, 2017 (in Slovak with English summary). a, b, c, d, e
Števko, M., Sejkora, J., and Dolníček, Z.: Olivenite and cornwallite from the Podlipa copper deposit near Ľubietová, Slovakia, Bull. Miner. Petrol., 29, 189–196, 2021. a, b
Tarantino, S. C., Boffa-Ballaran, T., Carpenter, M. A., Domeneghetti, M. C., and Tazzoli, V.: Mixing properties of the enstatite-ferrosilite solid solution: II. A microscopic perspective, Eur. J. Miner., 14, 537–547, 2002. a, b
Tarantino, S. C., Zema, M., Callegari, A. M., Boiocchi, M., and Carpenter, M. A.: Monoclinic-to-orthorhombic phase transition in Cu2(AsO4)(OH) olivenite at high temperature: strain and mode decomposition analyses, Mineral. Mag., 82, 347–365, 2018. a, b
Toman, K.: The symmetry and crystal structure of olivenite, Acta Cryst. B, 33, 2628–2631, 1977. a, b, c, d
Toman, K.: Ordering in olivenite-adamite solid solutions, Acta Cryst. B, 34, 715–721, 1978. a
Vincent, R. and Midgley, P. A.: Double conical beam-rocking system for measurement of integrated electron diffraction intensities, Ultramicroscopy, 53, 271–282, 1994. a
Walitzi, E. M.: Die Raumgruppe von Libethenit und Olivenit, Tschermaks Mineral. Petrogr. Mitt., 8, 275–280, 1963. a
Yakubovich, O. V., Mel'nikov, O. K., and Wester, D.: Libethenite Cu2(PO4)OH: synthesis, crystal-structure refinement, and comparative crystal chemistry, Cryst. Reports, 38, 32–36, 1993. a
Zema, M., Tarantino, S. C., Boiocchi, M., and Callegari, A. M.: Crystal structure of adamite at high temperature, Miner. Mag., 80, 901–914, 2016. a, b
Zhang, X., Zhu, Y., Zeng, H., Wang, D., Liu, J., Liu, H., Qian, M., and Xu, L.: Dissolution and solubility of the arsenate–phosphate hydroxylapatite solid solution [Ca5(PxAs1−xO4)3(OH)] at 25 ∘C, Environ. Chem., 8, 133–145, 2011. a, b