the Creative Commons Attribution 4.0 License.
the Creative Commons Attribution 4.0 License.
 | 14 Dec 2022
Molecular overtones and two-phonon combination bands in the near-infrared spectra of talc, brucite and lizardite
Etienne Balan
Lorenzo Paulatto
Qianyu Deng
Keevin Béneut
Maxime Guillaumet
Benoît Baptiste
The near-infrared (NIR) spectra of hydrous minerals display absorption bands involving multiple excitations of vibrational modes. They usually involve OH stretching modes, but their interpretation is not straightforward due to the combined effects of bond anharmonicity and vibrational coupling. In the present study, the mid-infrared (MIR) and near-infrared spectra of well-ordered samples of trioctahedral layered hydrous minerals, talc, brucite and lizardite, have been measured on a spectral range extending from the fundamental vibrational modes to the second OH stretching overtones. The bands corresponding to molecular overtones are interpreted using an effective approach allowing us to infer the anharmonicity and coupling parameters controlling the OH stretching frequencies from spectroscopic data. They follow the usual relation between transition energy and quantum number of the excited state, which facilitates the comparison of NIR and MIR spectra. The results support the assignment of the main overtone bands to specific environments of OH groups and bring new constraints for the identification of the vibrational bands related to Fe and Al substitutions at octahedral sites in serpentines. The two-phonon absorption bands are theoretically analyzed at the density functional theory level by computing the absorption arising from the self-energy of the IR-active vibrational modes. The characteristics of the two-phonon OH stretching continuum between 7300 and 7400 cm−1 and of the combination bands between 4000 and 4800 cm−1 are related to the specificities of the one-phonon and two-phonon densities of states of the three minerals.
- Article
(2555 KB) - Full-text XML
-
Supplement
(855 KB) - BibTeX
- EndNote


The near-infrared (NIR) spectra of hydrous minerals display characteristic absorption bands related to the OH stretching vibrational modes. Compared with fundamental transitions in the mid-infrared (MIR) range, the weaker oscillator strength of NIR bands reduces the anomalous dispersion of the refractive index related to strong resonances (e.g., Chalmers, 2006). This property facilitates the NIR spectroscopic study of raw samples using a diffuse reflectance geometry. It supports the use of remote-sensing techniques or field-based spectrometers for the identification and mapping of hydrous minerals in many contexts, ranging from the study of rocky planets or asteroids (e.g., Bishop et al., 2008; Carter et al., 2013; Beck et al., 2015) to mining geology (Mathian et al., 2018).
The NIR bands of hydrous minerals are categorized as overtone or combination bands when they correspond to transitions from the ground state to the nth (n>1) excited state of OH oscillators or to the simultaneous excitation of two vibrational modes (one of which being an OH stretching mode), respectively. The first overtone bands occur as relatively sharp and strong peaks in the 7000–7500 cm−1 range, whereas combination bands are usually reported in the 3850–5000 cm−1 range. However, the combination of two OH stretching modes also leads to absorption features in the 7000–7500 cm−1 range.
In crystals, the combination bands actually correspond to the combined excitation of two phonons with opposite wave vectors, as imposed by momentum conservation (Bogani, 1978a; Bogani et al., 1984; Califano et al., 1981). Accordingly, they are not solely related to the long wavelength excitations observed in the MIR range but reflect the two-phonon density of states of the crystal, modulated by the infrared absorption processes. Due to the anharmonicity of the OH stretching potential, the two-phonon continuum related to the combination of OH stretching modes is observed at a higher frequency than the first OH overtones. In this case, the overtones correspond to the excitation of two-phonon bound states by opposition to the free phonons involved in combination bands (Kimball et al., 1981; Klafter and Jortner, 1982; Holstein et al., 1982). Their similarity with molecular overtones supports their interpretation using a local mode approach accounting for the internal anharmonicity and local coupling of OH oscillators (Balan et al., 2021a).
In the present study, we analyze the NIR spectra of well-ordered samples of the archetypal trioctahedral layered minerals (talc, brucite and lizardite) to better assess the importance of the various factors contributing to the absorption bands. In talc, the OH groups are in inner position, which minimizes their vibrational coupling, whereas the inter-layer OH location in brucite leads to significant coupling and related phonon dispersion. The spectroscopic properties of these two minerals can then be compared to those of lizardite in which both types of local environments occur. The spectra are recorded on a range extending to the second OH stretching overtones and are discussed in the light of an ab initio theoretical determination of the one- and two-phonon densities of states and previous ab initio modeling of the spectroscopic properties of Fe- and Al-bearing lizardite (Balan et al., 2021b). The results clarify the relations between the overtone spectra and their fundamental counterparts and provide a sound interpretation of the two-phonon combination bands.
2.1 Samples
The talc sample is a well-ordered monomineralic sample from the Trimouns deposit, Luzenac, France (Martin et al., 1999; Petit et al., 2004a; Madejová et al., 2017; Mathian et al., 2018). The brucite sample is a well-ordered sample of unknown origin which also contains ∼ 3 wt % of calcite, as determined by X-ray diffraction (Supplement). Traces of manganese and iron are detected in its X-ray fluorescence spectrum (Supplement). The lizardite sample is a well-ordered lizardite-1T sample from Monte Fico, Elba, which also contains minor amounts of chrysotile and polygonal serpentine (Mellini and Viti, 1994; Gregorkiewitz et al., 1996; Viti and Mellini, 1997; Fuchs et al., 1998; Capitani et al., 2021). The infrared spectrum of the Monte Fico lizardite has been previously reported by Fuchs et al. (1998) and Balan et al. (2002, 2021b). Its Raman spectroscopic properties have been investigated by Auzende et al. (2004), Compagnoni et al. (2021), Capitani et al. (2021), and Tarling et al. (2022).
2.2 Spectroscopic methods
NIR diffuse reflectance spectra were recorded on pure powder samples with a 1 cm−1 resolution using a Nicolet 6700 FTIR spectrometer set with a white light source, quartz beamsplitter, nitrogen-cooled MCT (mercury cadmium telluride) detector, reference aluminum mirror and Collector II diffuse reflectance accessory. The single-beam signals were obtained as co-addition of 500 scans, and the spectra are reported in the 4000–11 000 cm−1 range as remission functions f(R) obtained using the Kubelka–Munk transformation of the reflectance spectra.
MIR transmission spectra of the talc and brucite samples were recorded on KBr pellets (sample KBr mass ratio ∼ 0.5 %) using a Nicolet 6700 FTIR spectrometer set with an EverGlo source, KBr beamsplitter and nitrogen-cooled MCT detector. The spectra correspond to the co-addition of 120 scans in the 400–4000 cm−1 range with a resolution of 2 cm−1. The lizardite spectrum is that previously reported in Balan et al. (2002).
MIR and NIR spectra were decomposed in individual bands using the Fityk software (Wojdyr, 2010). Depending on the bands, various functions were used to model the band shape. Besides Lorentzian and Gaussian functions, split-Lorentzian and split-Gaussian were used to account for asymmetric profiles (Tables 1, 2 and 3). In this case, the left and right half widths at half maximum of the band were allowed to differ. Subtraction of a linear or a quadratic baseline was simultaneously performed with the fit of the individual bands as recommended by Meier (2005).
Table 1Profile function (prof.), frequency (ω), full width at half maximum (FWHM) and relative area of bands related to structural OH groups in the MIR and NIR spectra of talc. Proposed assignments are also indicated in terms of cationic environments or contribution to the two-phonon continuum (two-phonon).
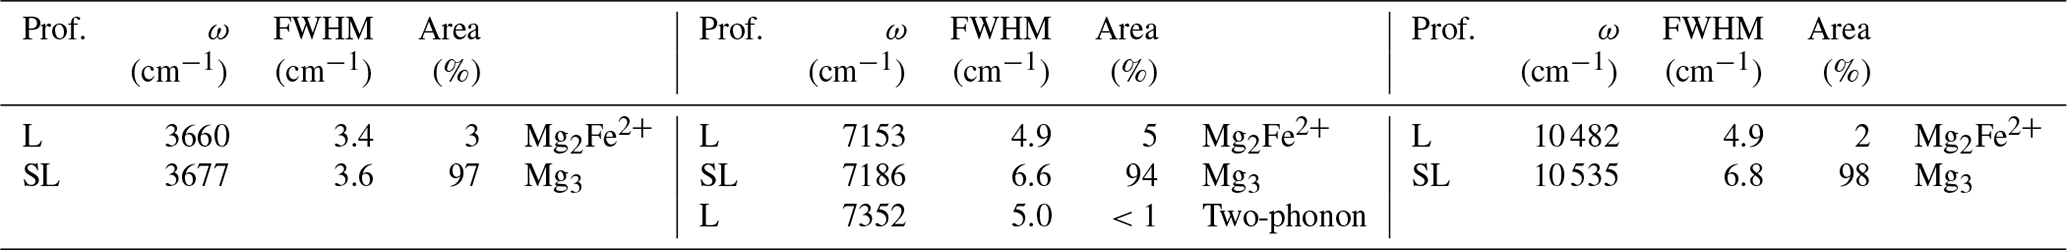
L: Lorentzian; G: Gaussian, SL: split-Lorentzian.
Table 2Profile function (prof.), frequency (ω), full width at half maximum (FWHM) and relative area of bands related to structural OH groups in the MIR and NIR spectra of brucite. Proposed assignments are also indicated in terms of cationic environments (M2+ = Fe2+, Mn2+) or contribution to the two-phonon continuum (two-phonon).

L: Lorentzian; G: Gaussian, SL: split-Lorentzian.
Table 3Profile function (prof.), frequency (ω), full width at half maximum (FWHM) and relative area of bands related to structural OH groups in the MIR and NIR spectra of lizardite. Proposed assignments are also indicated in terms of cationic environments or contribution to the two-phonon continuum (two-phonon). Unless specified, they correspond to inter-layer OH groups.
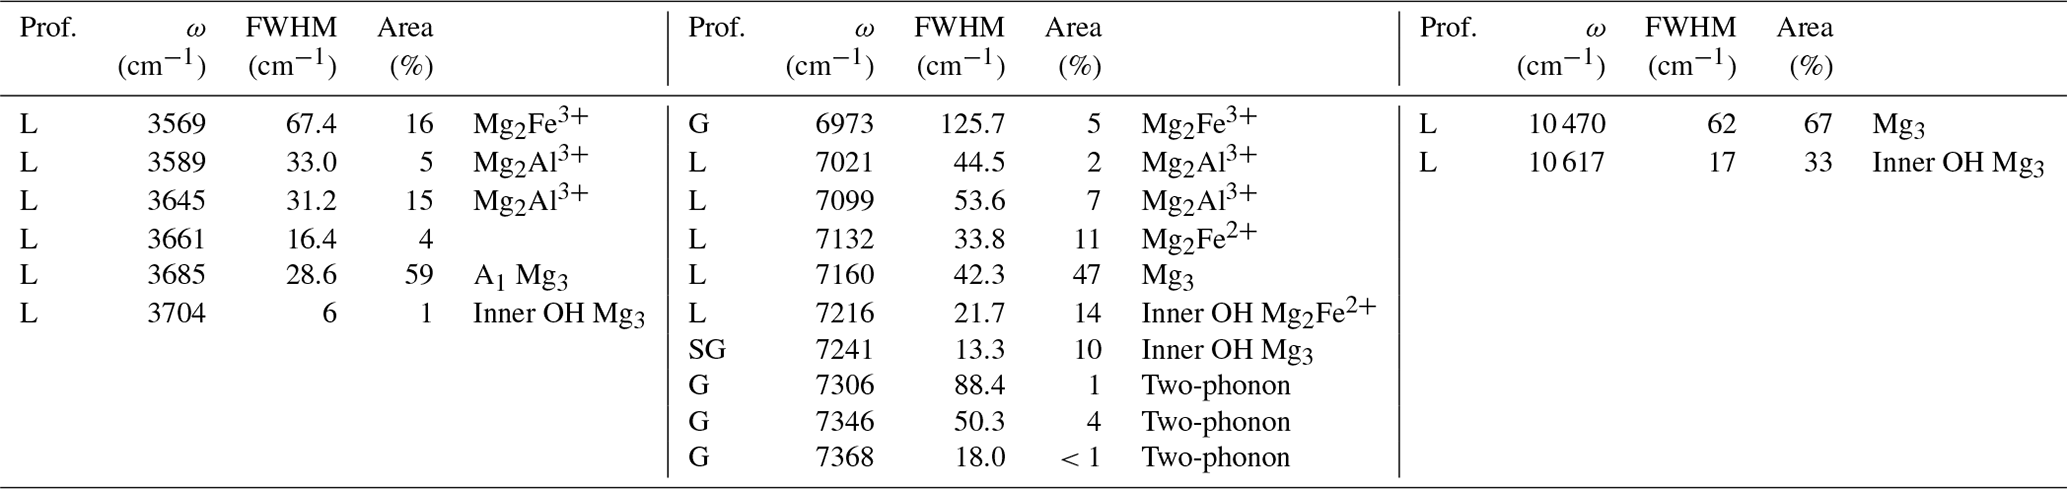
L: Lorentzian; G: Gaussian; SL: split-Lorentzian; SG: split-Gaussian.
2.3 Theoretical modeling
Relevant properties were obtained within the framework of density functional theory (DFT) using a plane-wave and pseudopotential scheme, as implemented in the PWscf and PHonon codes from the Quantum ESPRESSO package (Giannozzi et al., 2009; http://www.quantum-espresso.org, last access: 12 December 2022). The vdw-DF2 exchange-correlation (XC) functional (Thonhauser et al., 2007; Langreth et al., 2009; Sabatini et al., 2012; Berland et al., 2015) was used because it ensures the mechanical stability of the ordered brucite structure with space group (Pillai et al., 2021). The ionic cores were described by optimized norm-conserving pseudopotentials from the SG15-ONCV library (Hamann, 2013; Schlipf and Gygi, 2015) with cutoffs of 140 and 840 Ry on the plane wave and charge density, respectively. Internal atomic coordinates were relaxed until the residual forces on atoms were less than 10−4 Ry a.u.−1 Electronic integration was performed using a k-point grid for brucite and a grid for lizardite and talc.
Phonon polarization and frequencies were determined from density functional perturbation theory (DFPT) using the PHonon code. Dispersion patterns were obtained via Fourier interpolation of inter-atomic force constants computed on a grid of q-points. One-phonon and two-phonon densities of states were computed by integrating the interpolated phonon dispersion over a grid of points, imposing energy conservation with a Gaussian smearing of 5 cm−1.
Among the various mechanisms contributing to the absorption in the NIR range, it is possible to distinguish local mechanisms involving single molecule quantities and non-local mechanisms which couple the ground state to the two-phonon states (Bogani, 1978b; Bogani et al., 1984). The local mechanisms are similar to those giving rise to the combination and overtone bands in molecules and depend on the intra-molecular anharmonicity. In crystals, non-local mechanisms also occur. They correspond to the direct excitation of two phonons by a photon and to indirect processes involving the decay in two phonons of a virtual state related to an IR-active optical phonon (e.g., Dows and Schettino, 1973). Although the computation of all absorption processes is not straightforward and would exceed the purpose of the present study, the non-local contribution to light absorption involving virtual states depends on three-phonon coupling coefficients and can be readily obtained within the DFPT framework.
The third-order anharmonic “dynamical matrices” were obtained ab initio via the “2n+1” theorem, as implemented in the Anharmonic code (Paulatto et al., 2013) on a double grid of () points for brucite (lizardite and talc). A finer grid of () points was tested for brucite (lizardite) but showed no significant difference. These matrices were Fourier-transformed to three-body force constants and then interpolated back in reciprocal space over a finer grid to integrate the phonon infrared spectrum according to Cowley theory (Cowley, 1996; Paulatto et al., 2015). For the self-energy, the complex form from Calandra et al. (2007) was used with a regularization δ of 2 cm−1. The grid used for integration was randomly shifted and contained () points for brucite (lizardite and talc). The contributions to the simulated IR spectrum were weighted with the IR cross-section, obtained from ab initio effective charges, corresponding to the “virtual” harmonic phonon involved. In order to account for the dependency of IR cross-section on the angle between the phonon and photon polarizations, they were computed and averaged for six different photon polarizations corresponding to the Cartesian directions.
3.1 MIR and NIR spectra of trioctahedral minerals
The MIR and NIR spectra of the talc, brucite and lizardite samples are similar to those previously reported by, e.g., Martens and Freund (1976) for brucite and Madejová et al. (2017) for talc and lizardite. Band parameters related to structural OH groups determined by the fit of experimental spectra are reported in Tables 1, 2 and 3 for talc, brucite and lizardite, respectively. Additional broad bands likely related to molecular water are observed at ∼ 3430–3480 cm−1 in the MIR spectra (Fig. 1).
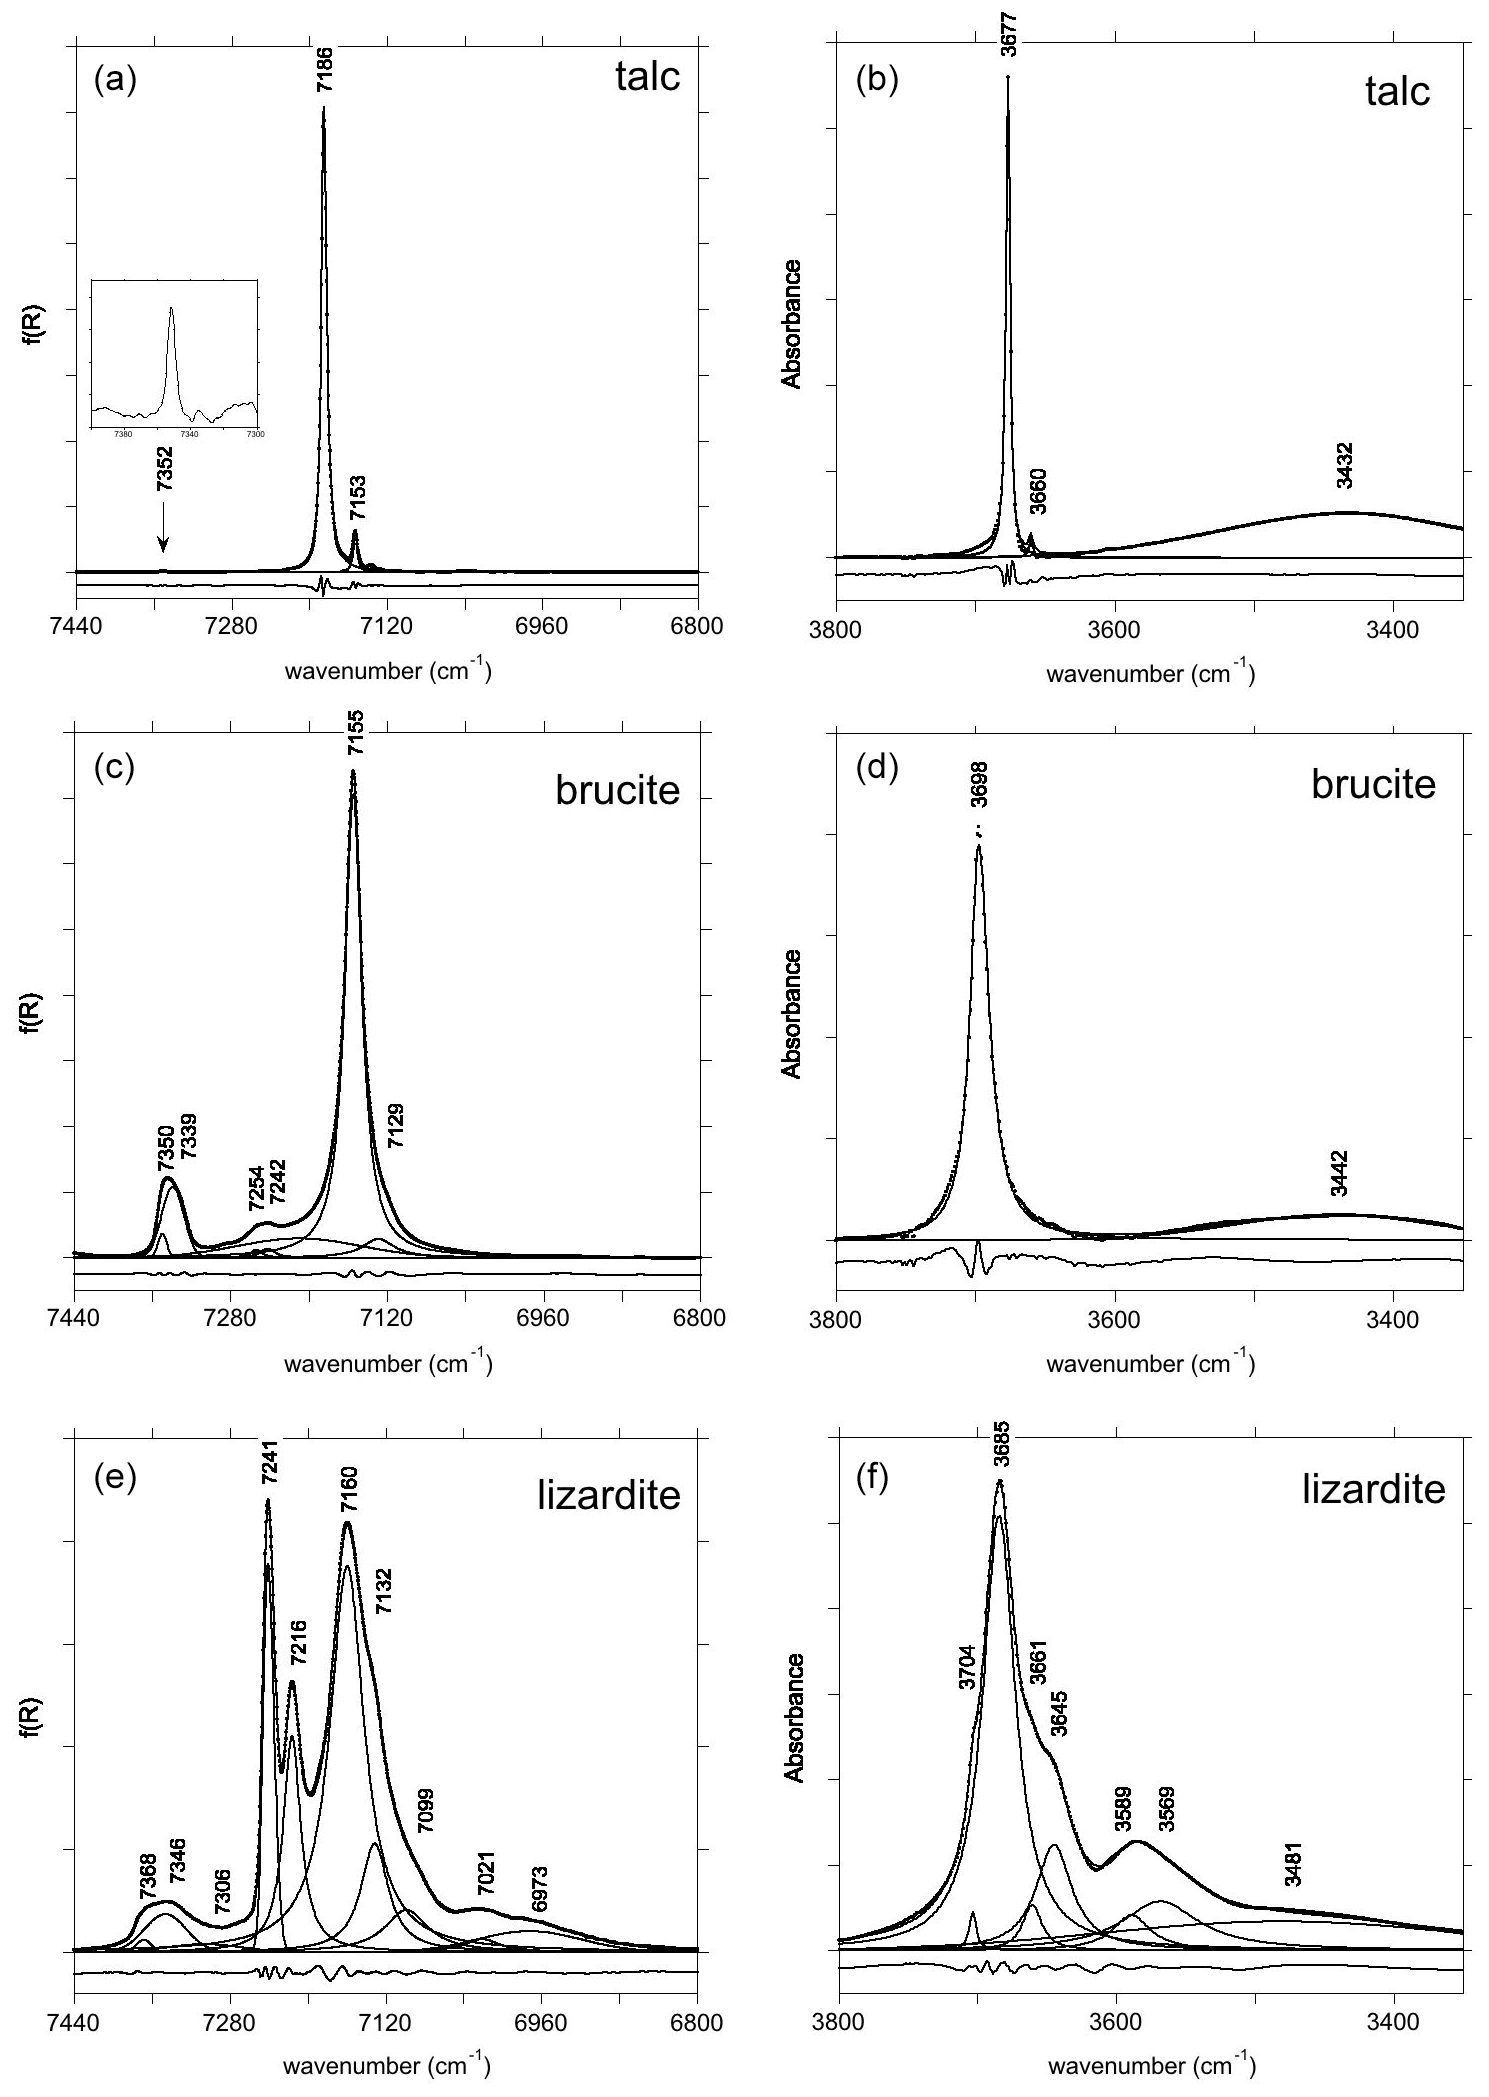
Figure 1Fundamental (right) and first overtone (left) OH stretching spectra of talc (a, b), brucite (c, d) and lizardite (e, f). The spectra have been decomposed into individual components, and residues are reported at the bottom with an arbitrary shift for clarity sake.
The primitive cell of talc (space group ) contains two equivalent OH groups leading to two OH stretching modes with Au (IR-active) and Ag (Raman-active) symmetry (Rosasco and Blaha, 1980). The OH groups are sufficiently distant from each other to minimize the vibrational couplings such that the two stretching modes have very close frequencies (Rosasco and Blaha, 1980). Consistently with previous studies (Martin et al., 1999; Petit et al., 2004a; Madejová et al., 2017; Mathian et al., 2018), the Trimouns talc sample displays in its MIR spectrum a major band at 3677 cm−1 related to inner OH groups in a Mg3 environment and a weaker band related to the Mg2Fe2+ environment at 3660 cm−1 (Fig. 1). The first and second overtone bands corresponding to the Mg3 environment are observed at ωOH(2)=7186 cm−1 and ωOH(3) = 10 535 cm−1 (Figs. 1 and 2). The bands related to the Mg2Fe2+ environment are observed at ωOH(2)=7153 cm−1 and ωOH(3) = 10 482 cm−1. A weak and narrow band also occurs at 7352 cm−1 (Fig. 1).
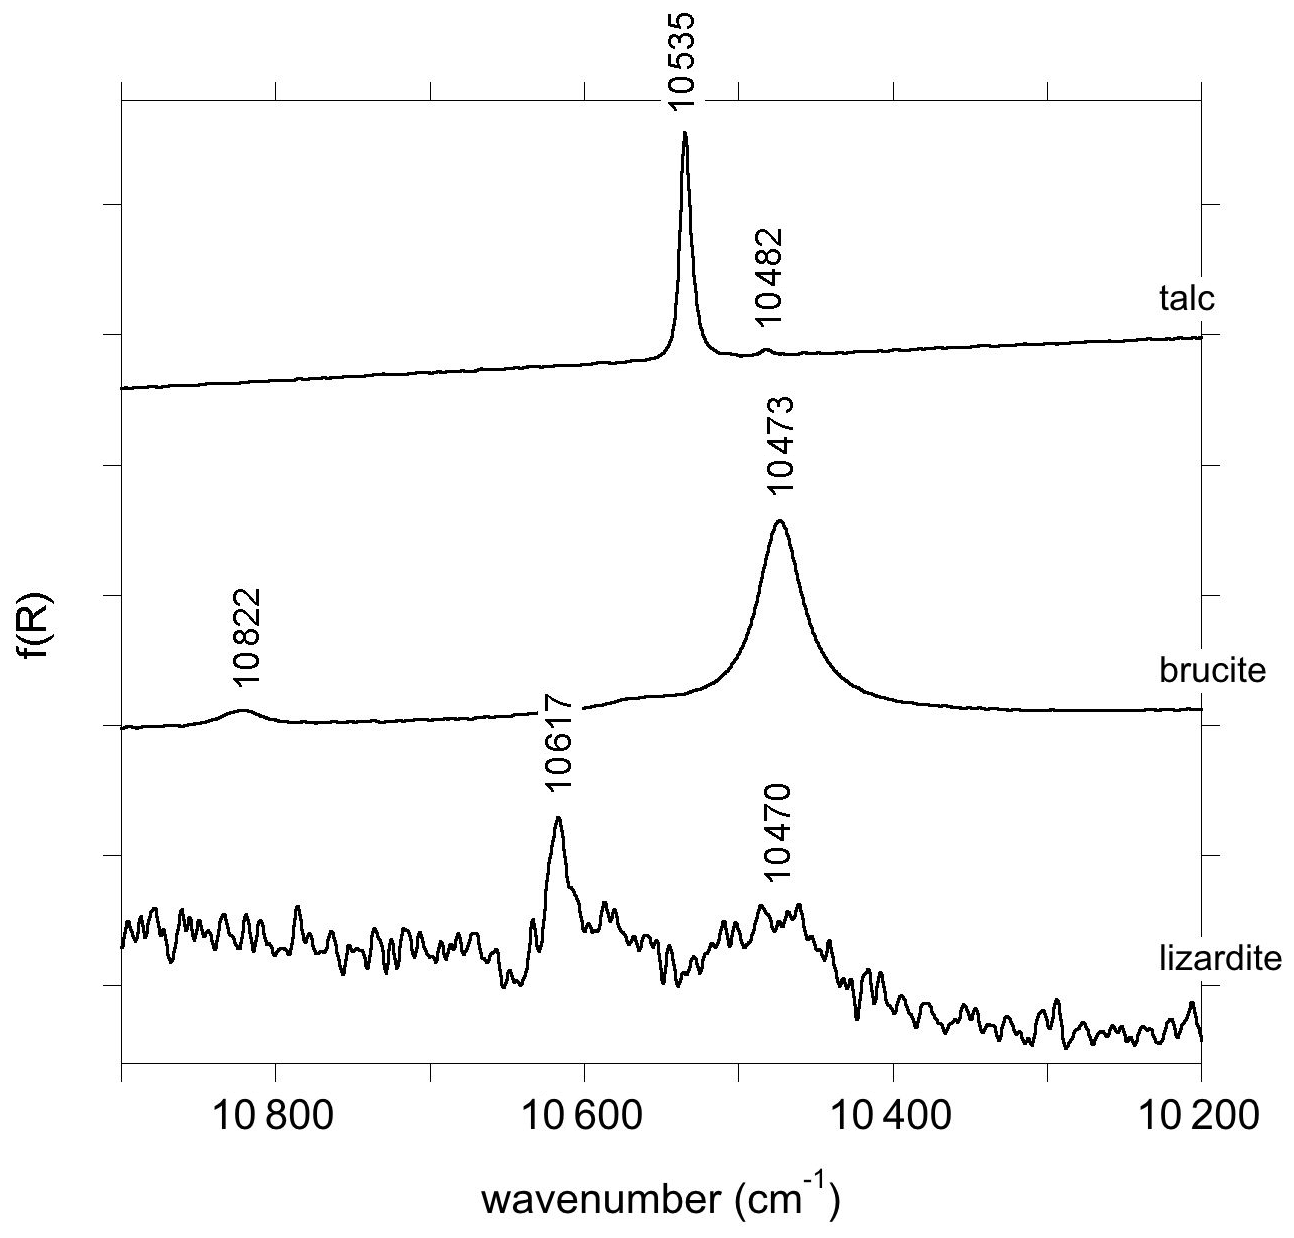
The primitive cell of brucite (space group ) contains two symmetrically equivalent OH groups, leading to two OH stretching modes belonging to the A1g and A2u representations (Dawson et al., 1973). The IR-active A2u mode leads to the single band observed at 3698 cm−1 in the MIR spectrum (Fig. 1). Its frequency in powder samples differs from the transverse optical (TO) frequency (3688 cm−1) measured on single crystals (Dawson et al., 1973). This difference is due to long-range electrostatic interactions which can upshift the IR absorption bands measured on powder samples from the TO to the longitudinal optical (LO) frequency, depending on the shape of the particles (Farmer, 2000). In the present case, it can be assumed that the LO frequency is ∼ 3700 cm−1, which is the maximum frequency reported for this band (de Oliveira and Hase, 2001). The related LO–TO splitting (12 cm−1) is consistent with the theoretical value (14 cm−1) determined by Pascale et al. (2004) and Reynard and Caracas (2009). The A1g stretching mode, reported at 3652 cm−1 by Dawson et al. (1973) and Duffy et al. (1995), is not IR-active and therefore not affected by long-range electrostatic effects. The splitting between the A1g and A2u modes (36 cm−1) attests to the significant vibrational coupling of OH groups in brucite. As previously reported by Martens and Freund (1976) and Frost et al. (2000), a strong and narrow band corresponding to the first OH stretching overtone is observed at 7155 cm−1 (Fig. 1). It displays a shoulder on its low-frequency side suggesting the occurrence of an overlapping weaker band at 7129 cm−1. Based on the frequency shifts observed in talc (Wilkins and Ito, 1967), this weaker band most likely corresponds to OH groups in a Mg2M2+ (M = Fe, Mn) environment. The band observed at 10 473 cm−1 corresponds to the second OH stretching overtone (Fig. 2). A weaker band at 10 822 cm−1 has been ascribed to a higher-order combination with a lattice mode (Martens and Freund, 1976). A broader asymmetric band occurs at 7345 cm−1 with a width of ∼ 40 cm−1 (Fig. 1). Two overlapping Gaussian components were used to account for its peculiar shape. This band most likely corresponds to the two-phonon continuum of OH stretching modes. Minor bands of uncertain origin are also observed at 7242 and 7254 cm−1 (Fig. 1).
The primitive cell of lizardite (space group P31m) contains four OH groups. The inner OH group is located on the 3-fold axis, whereas the vibrational coupling of the three equivalent inter-layer OH groups leads to one symmetric A1 mode and two degenerate E modes at lower frequency (e.g., Balan et al., 2002; Prencipe et al., 2009). The A1 mode is polarized along the [001] axis and dominantly carries the IR and Raman intensity. The E modes polarized in the (001) plane lead to a weaker band in the vibrational spectra. The main band at 3685 cm−1 (Fig. 1) corresponds to the A1 mode. It is affected by long-range electrostatic interactions explaining its frequency variation as a function of the experimental geometry of Raman spectroscopic measurements (Compagnoni et al., 2021; Tarling et al., 2022). A shoulder at 3704 cm−1 corresponds to the inner OH group which is not vibrationally coupled to other OH groups. Other overlapping contributions occur at 3569, 3589, 3645 and 3661 cm−1 in the IR spectrum (Fig. 1). As discussed in Balan et al. (2021b), the three low-frequency bands likely attest to aluminum and trivalent iron substitutions in the trioctahedral layer. Note that due to the band overlap, the shape and position of these relatively broad bands (Table 3) are affected by a significant uncertainty. In the Raman spectra, components at 3642, 3653 and 3669 cm−1 have been reported by Compagnoni et al. (2021) and a broad band at 3590 cm−1 by Tarling et al. (2022).
In the energy range of the first OH stretching overtones, the NIR spectrum of the Monte Fico sample (Fig. 1) is similar to the lizardite spectra previously reported by, e.g., Madejová et al. (2017), Balan et al. (2021a), and Fritsch et al. (2021). An intense narrow band is observed at 7241 cm−1 and a weaker one at 7216 cm−1. These two bands have been related to the first overtone of inner OH groups in Mg3 and Mg2M2+ (M = Fe, Ni) environments, respectively (Balan et al., 2021a). The frequency of this second band is slightly higher in the Monte Fico sample than in the New Caledonian samples (7208–7210 cm−1) investigated by Balan et al. (2021a) and Fritsch et al. (2021). A broader asymmetric band displays a strong contribution at 7160 cm−1 and weaker ones at 7132 and 7099 cm−1 (Fig. 1). The bands at 7160 and 7132 cm−1 have been assigned to the first OH stretching overtone of interlayer OH groups in Mg3 and Mg2M2+ (M = Fe, Ni) environments, respectively (Balan et al., 2021a). Broad bands are observed at 7021 and 6973 cm−1. Second OH stretching overtones are observed at ∼ 10 470 and 10 617 cm−1 for the interlayer and inner OH, respectively (Fig. 2). The two-phonon continuum of OH stretching modes occurs as an asymmetric band at ∼ 7350 cm−1 (Fig. 1). It extends over ∼ 85 cm−1 and was fitted using three overlapping Gaussian functions accounting for its asymmetric shape (Table 3).
For the three minerals, a series of bands related to the combination of two phonons is observed between 4000 and 4800 cm−1 (Fig. 3). In talc, the dominant ones occur at 4182, 4303, 4323 and 4637 cm−1, which is consistent with previous observations (Zhang et al., 2006, 2007; Madejová et al., 2017). In brucite, combination bands involving OH stretching and other excitations, as previously reported by Dawson et al. (1973) and Frost et al. (2000), occur at 4308, 4450 and 4550 cm−1. In lizardite, combinations involving OH stretching modes and other vibrational modes lead to multiple bands between 4000 and 4800 cm−1 (Fig. 3), as previously reported by Bishop et al. (2002), Baron and Petit (2016), and Madejová et al. (2017). The dominant ones occur at 4300, 4395 and 4452 cm−1.
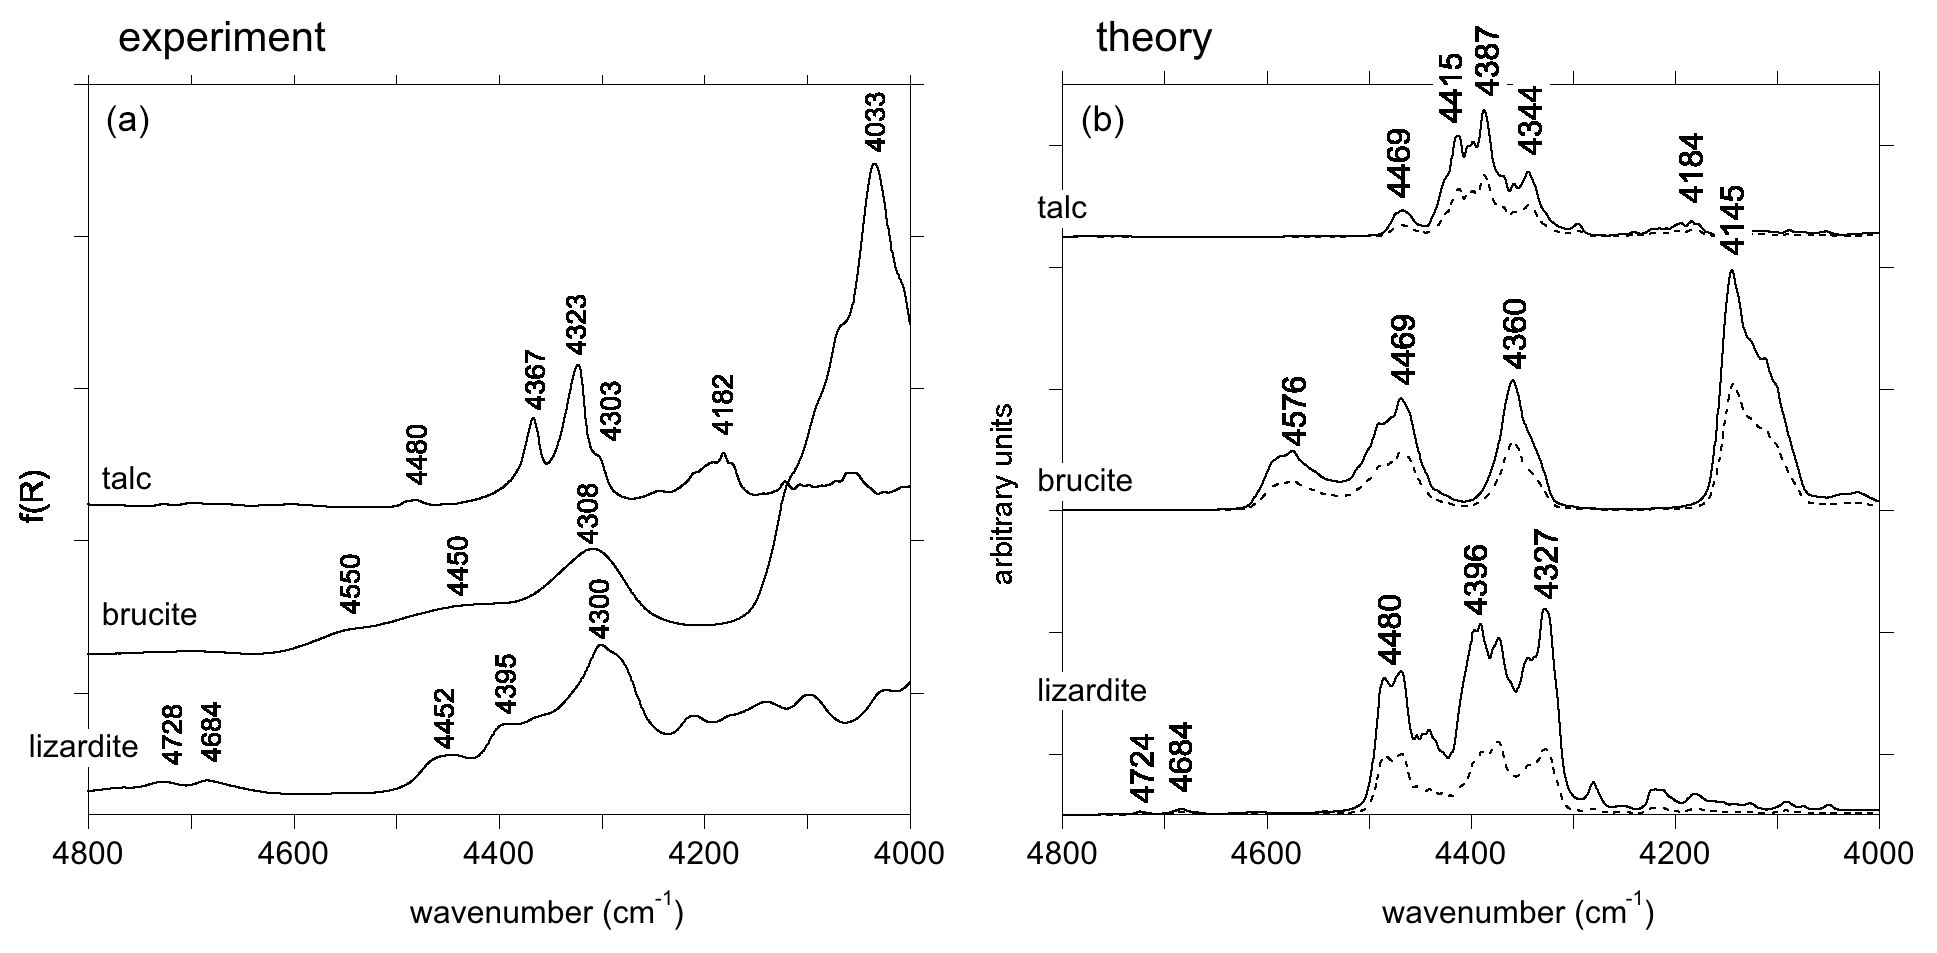
Figure 3(a) NIR spectra of talc, brucite and lizardite in the range corresponding to combination bands. (b) Theoretical spectral functions of talc, brucite and lizardite. The dotted lines correspond to the contributions related to the self-energy of modes 61, 11 and 47 for talc, brucite and lizardite, respectively, as numbered in Tables S2, S3 and S4 in the Supplement.
3.2 Theoretical properties of talc, brucite and lizardite
3.2.1 Theoretical crystal structures and zone-center OH stretching modes
The theoretical structural and vibrational properties of the three minerals have been previously investigated in detail at the DFT level using various XC functionals (e.g., Baranek et al., 2001; Pascale et al., 2004; Ugliengo et al., 2009; Reynard and Caracas, 2009; Mitev et al., 2010; Treviño et al., 2018; Pillai et al., 2021; for brucite; Ulian et al., 2013; Blanchard et al., 2018; for talc; Prencipe et al., 2009; Balan et al., 2002, 2021b; for lizardite). Overall the present theoretical results (Tables 4 and 5) are consistent with these previous studies, and we will only focus on points specifically related to the use of the vdw-DF2 functional. The choice of this XC functional was motivated by the specificities of the modeling of brucite. Using the PBEsol functional, the stable structure of brucite has C2/m space symmetry up to 300 K (Treviño et al., 2018). The more symmetric structure is unstable, as attested by imaginary phonon frequencies at 0 K. This instability also occurs with the standard PBE (Perdew–Burke–Ernzerhof) functional. In contrast, the use of the non-empirical vdw-DF2 functional ensures the stability of the more symmetric structure at 0 K, eliminating the imaginary frequencies (Pillai et al., 2021). In this case the unit cell is small enough to keep the computation time within reasonable limits, which facilitates the computation of three-phonon coupling coefficients and supports the present choice of the vdw-DF2 functional.
Table 4Theoretical and experimental cell parameters of talc, brucite and lizardite. Structure files are provided in the Supplement.
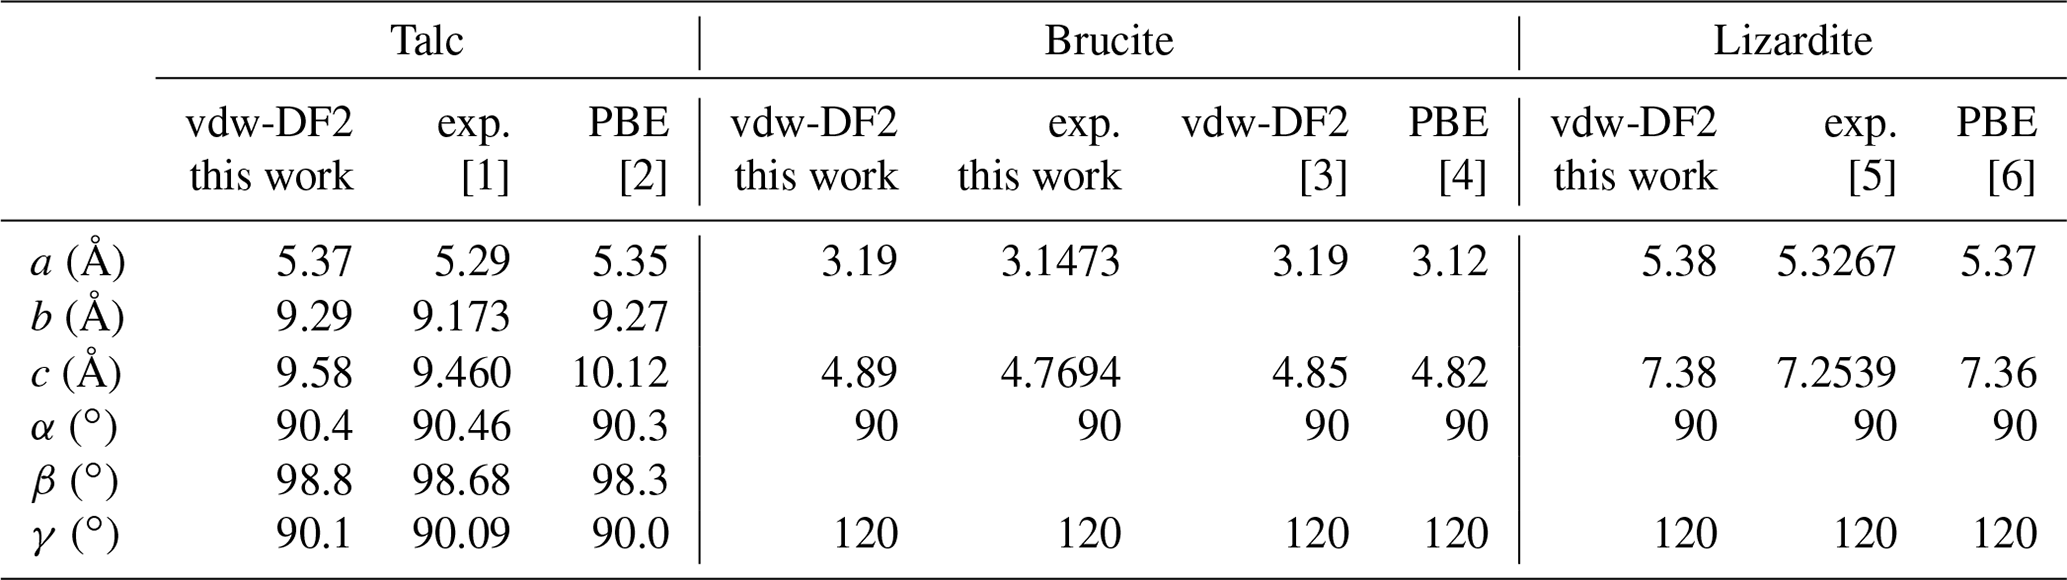
[1] Perdikatsis and Burzlaff (1981). [2] Blanchard et al. (2018). [3] Pillai et al. (2021). [4] Reynard and Caracas (2009). [5] Gregorkiewitz et al. (1996). [6] Balan et al. (2021b).
Table 5Zone-center theoretical frequencies (cm−1) of OH stretching modes in talc, brucite and lizardite. Theoretical vibrational modes are provided in the Supplement.
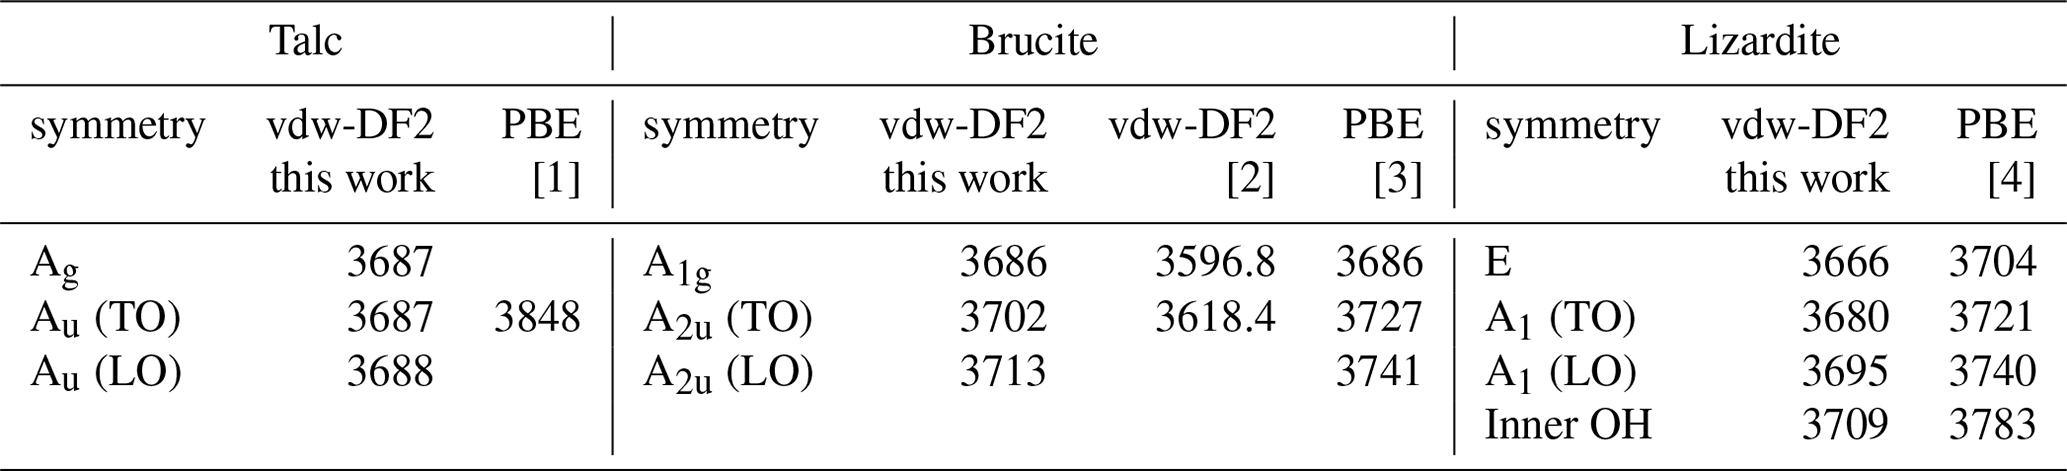
[1] Blanchard et al. (2018). [2] Pillai et al. (2021). [3] Reynard and Caracas (2009). [4] Balan et al. (2021b).
For the three minerals, the vdw-DF2 functional leads to moderate variations in the cell geometry with respect to that obtained with the PBE functional (Table 4). In talc, the c cell parameter is reduced, whereas the a and b parameters are close to the PBE ones. This reduction is consistent with a significant contribution of van der Walls interactions in the cohesion of its layered structure (Ulian et al., 2013). The OH stretching modes are calculated at 3687 cm−1 (Table 5), significantly lower than the corresponding PBE frequency (3848 cm−1; Blanchard et al., 2018). In brucite, an increase in both the a and c cell parameters is observed with the vdw-DF2 functional, which is consistent with the findings of Pillai et al. (2021). The OH stretching A1g and A2u frequencies are computed at 3686 and 3702 cm−1, respectively (Table 5). The splitting of the A1g and A2u modes (16 cm−1) is smaller than that experimentally observed (36 cm−1), suggesting that the vdw-DF2 functional underestimates the vibrational coupling of OH groups in brucite. In comparison, the PBE functional provides a better account of the vibrational coupling in brucite with a A1g–A2u splitting closer to its experimental counterpart (Reynard and Caracas, 2009). In lizardite, the cell parameters are very close to those previously determined using the PBE functional (Table 4). The frequencies of the OH stretching modes are 3666 and 3680 cm−1 for the E and A1 modes of interlayer OH groups, respectively. The stretching of the inner OH is calculated at 3709 cm−1. Compared with the PBE results (Balan et al., 2021b), these values are closer to the experimentally observed band frequencies.
3.2.2 Theoretical phonon density of states (DOS) and two-phonon absorption spectra
The one-phonon DOS of talc and lizardite (Fig. 4) between 0 to ∼ 1100 cm−1 displays two gaps separating the Si–O stretching (above ∼ 840 cm−1) modes and the contributions dominantly related to H displacements (between 590 and 840 cm−1) from other modes at lower frequencies. The DOS of brucite (Fig. 4) is similar to that previously reported by Treviño et al. (2018). The features between 620 and 930 cm−1 almost exclusively correspond to H atom displacements, whereas other excitations lead to a continuum below 480 cm−1. A significant contribution of H atoms is however also observed between 380 and 480 cm−1. In comparison, the H contribution in this lower-frequency region is weaker in talc and lizardite.
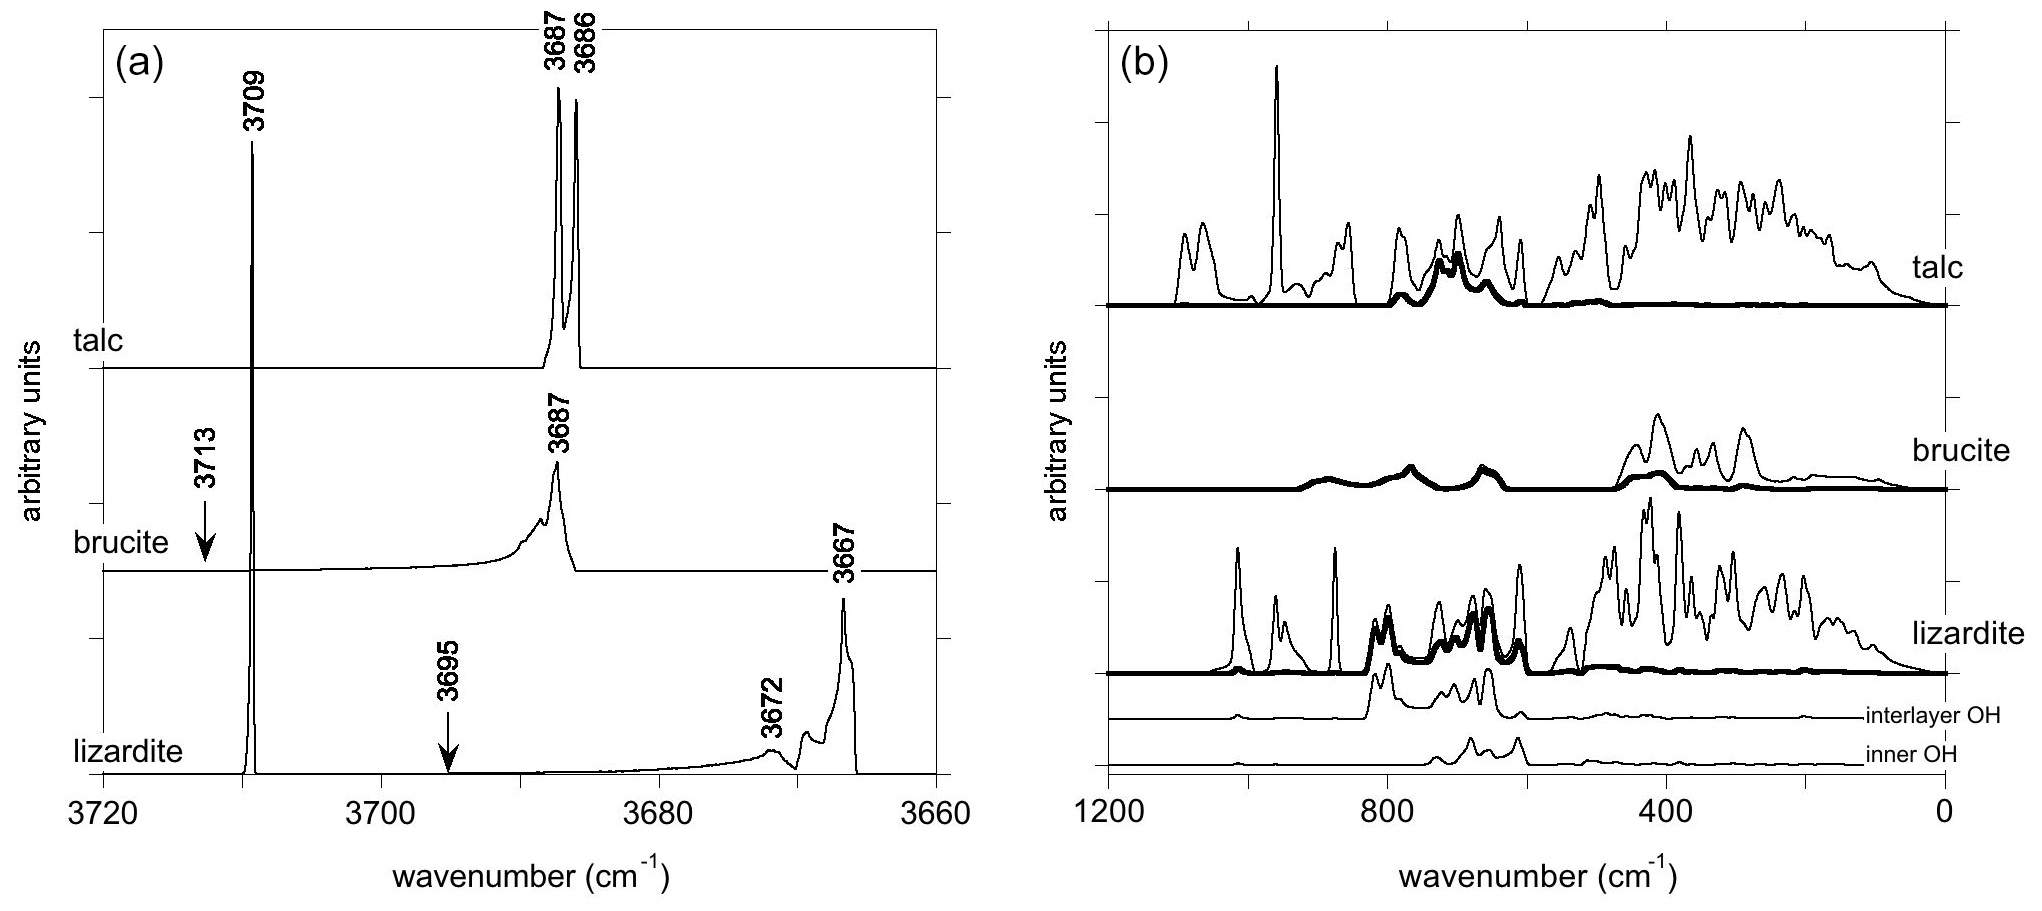
Figure 4One-phonon density of states of talc, brucite and lizardite. Panel (a) corresponds to the OH stretching modes. The arrows point to the LO frequency of A2u and A1 interlayer OH stretching modes in brucite and lizardite, respectively. The thick line in (b) corresponds to the contribution of H displacements. For lizardite, the contributions of inner and interlayer OH groups are reported below. Note that a smaller smearing has been used to obtain the DOS of OH stretching modes (a).
The one-phonon DOS of OH stretching modes displays characteristic features between 3650 and 3725 cm−1 (Fig. 4). In talc, a double peak with a very small splitting (∼ 1 cm−1) corresponding to the Au and Ag modes is observed. In brucite, the dispersion of the OH stretching modes leads to a broader and asymmetric peak that covers a frequency range of ∼ 27 cm−1. Its maximum is observed at 3687 cm−1, close to the A1g mode frequency (Table 5). Towards the high frequencies, the DOS extends up to ∼ 3713 cm−1, corresponding to the theoretical A2u(LO) frequency. In lizardite, the inner OH stretching appears as a narrow peak at 3709 cm−1. The shape of the DOS corresponding to interlayer OH stretching is similar to that observed in brucite, covering a frequency range of 29 cm−1 with a maximum at 3667 cm−1 close to the E mode frequency. Its asymmetric tail extends up to the A1(LO) frequency (3695 cm−1).
The two-phonon DOS of OH stretching modes in talc displays features at approximately twice the frequency of the two fundamental bands (Fig. 5). An additional peak at intermediate frequency (7373 cm−1) corresponds to the combination of the two fundamental states. Its frequency coincides with that of the peak observed in the theoretical spectral function (Fig. 5). In this centro-symmetric structure, the IR-active virtual phonon with u symmetry decays in a combination of g and u modes. This narrow peak (FWHM ∼ 2 cm−1) displays an asymmetric shape extending toward high wavenumbers.
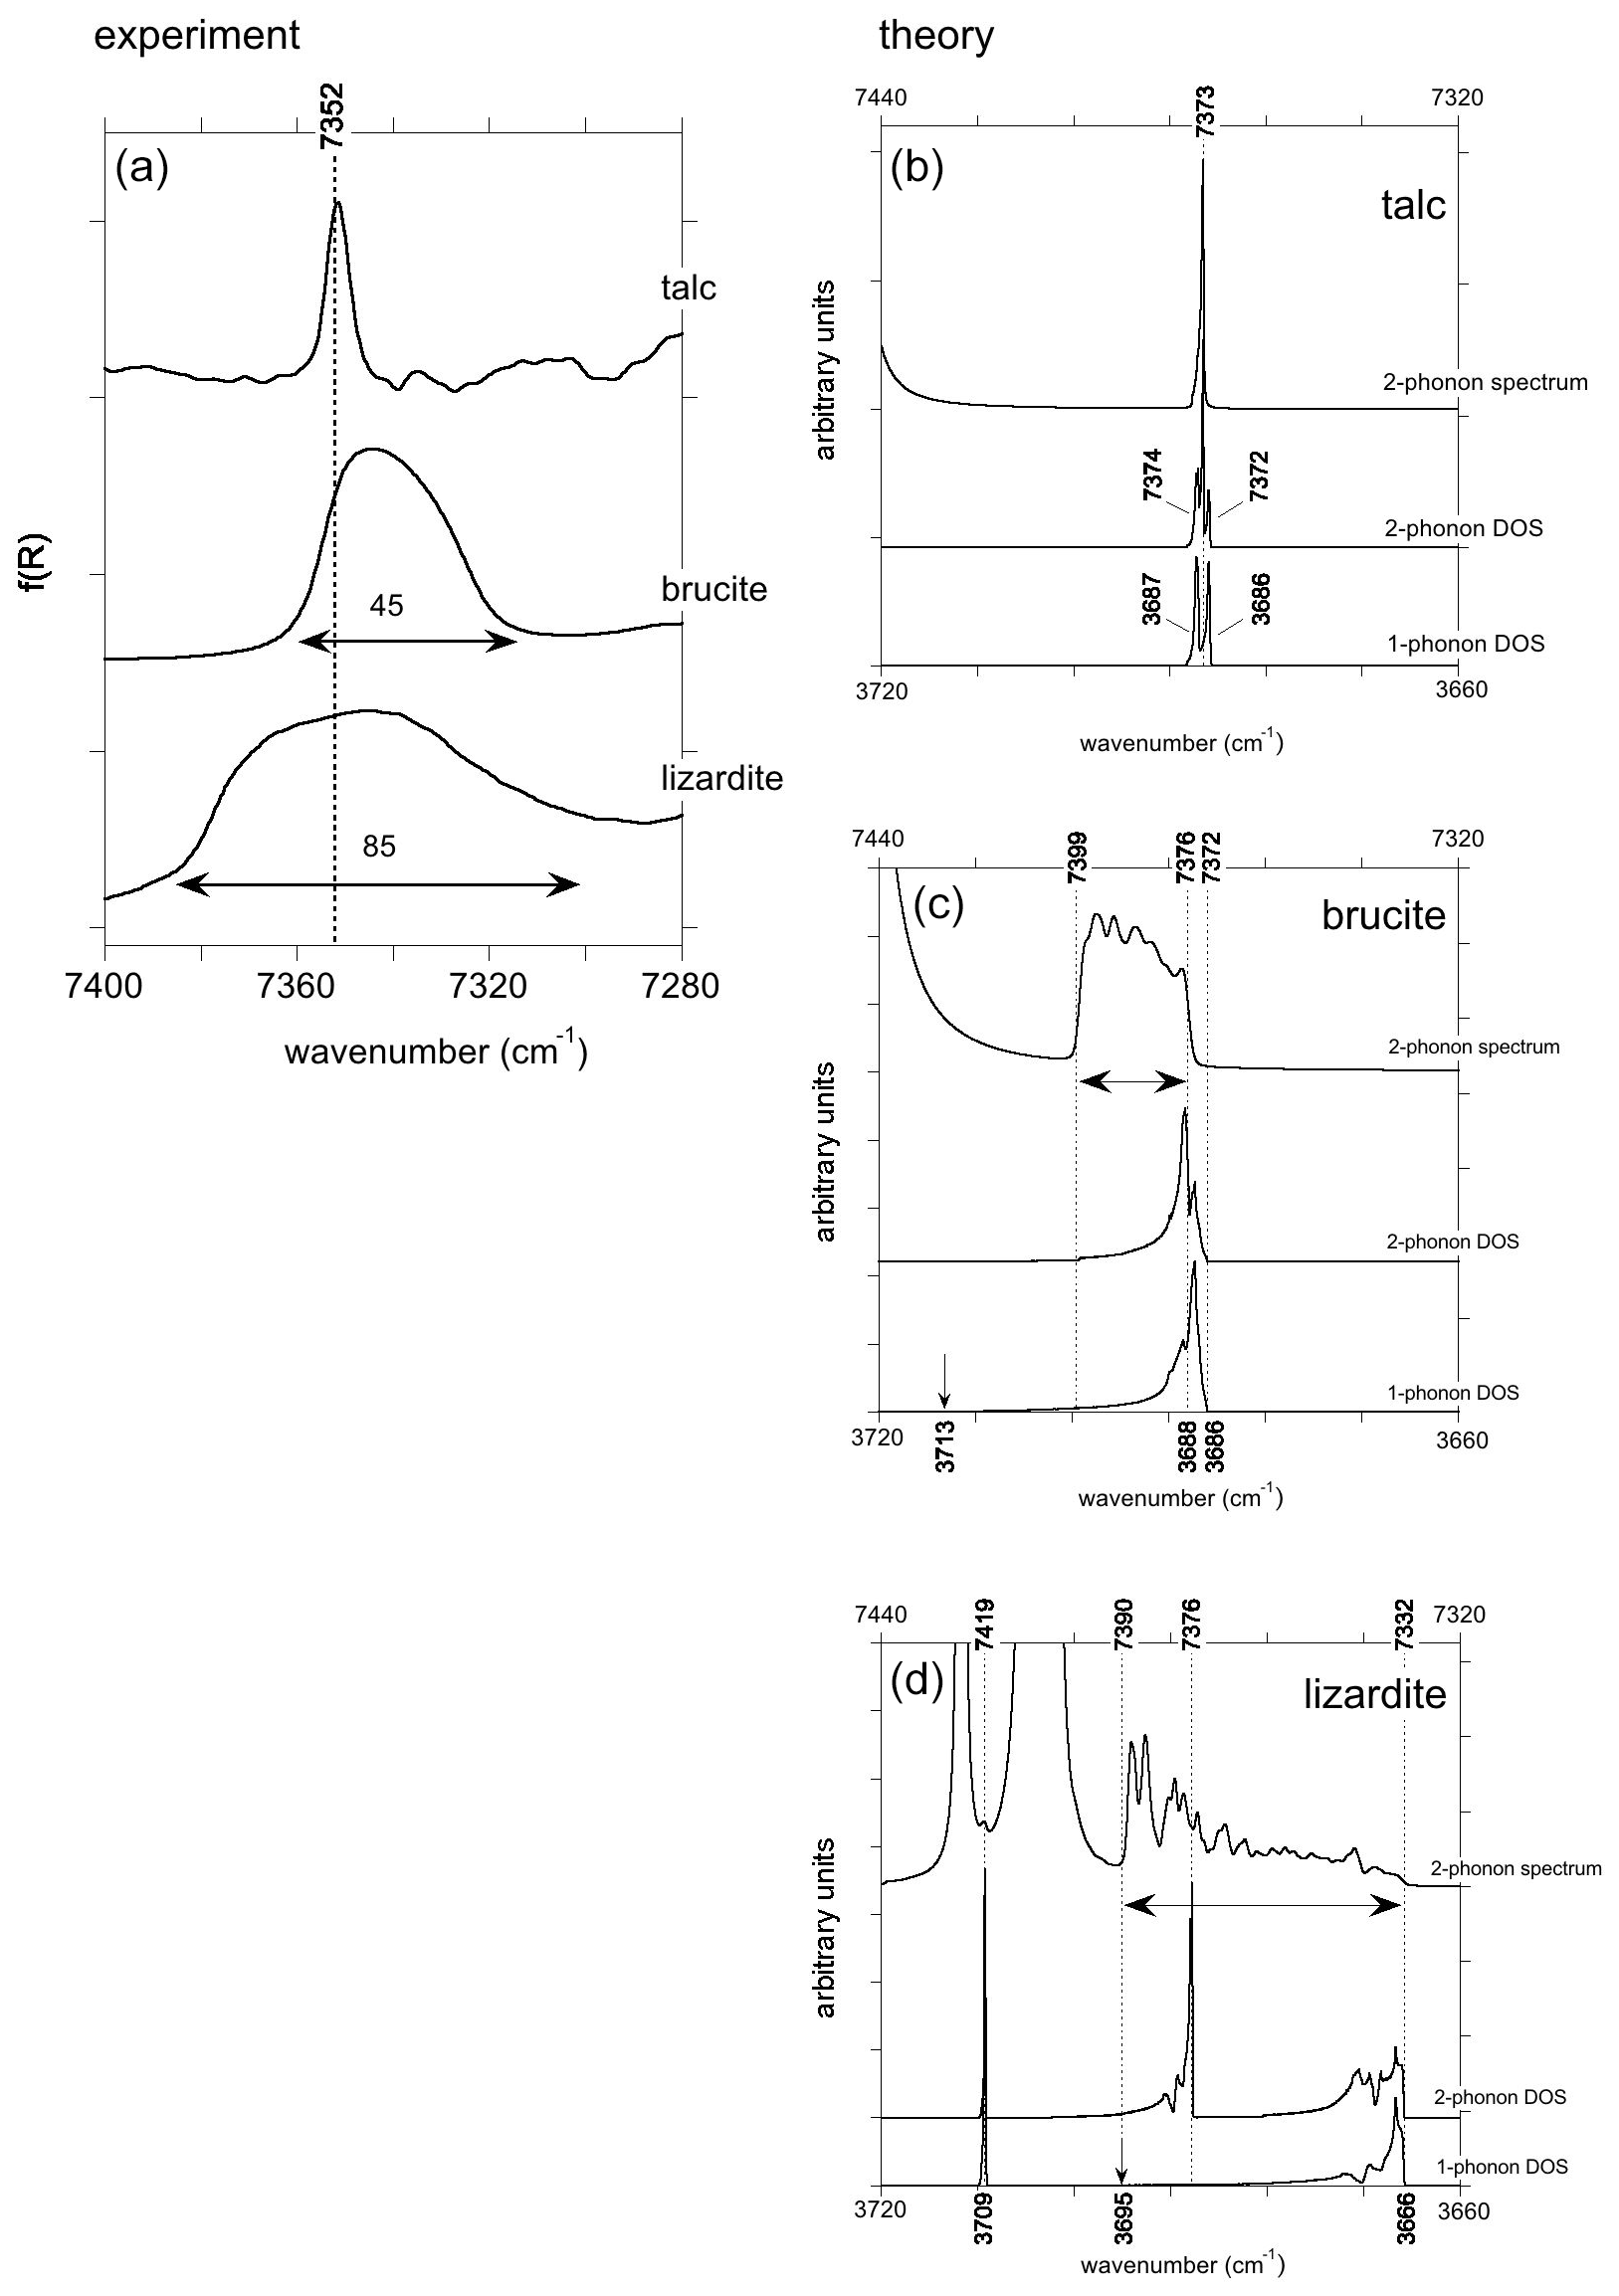
Figure 5(a) Enlarged view of the experimental absorption bands corresponding to the two-phonon OH stretching continuum in talc, brucite and lizardite. Note the significant variations in the width of the bands. (b, c, d) Theoretical two-phonon DOS and spectral function of OH stretching modes in talc, brucite and lizardite. For an easier comparison the one-phonon DOS is also reported at the bottom with a wavenumber scale multiplied by 2.
In brucite, the two-phonon DOS also extends on a range approximately twice as large as the one-phonon DOS, and its shape is similar to that of the one-phonon DOS, except that its maximum, corresponding to a reciprocal space domain with a high density of vibrational states and relatively flat phonon dispersion, is shifted to a comparatively higher wavenumber (Fig. 5). The shape of the two-phonon spectral function differs from that of the two-phonon DOS. It has a significant intensity in a range extending from 7376 to 7399 cm−1, i.e., from the high-density region involving A2u and A1g branches to the combination of A2u(LO) and A1g mode, respectively. Its intensity is almost exclusively related to the self-energy of the A2u OH stretching mode.
The two-phonon DOS of lizardite (Fig. 5) displays a narrow peak corresponding to the inner OH at 7419 cm−1 and a structured continuum corresponding to the interlayer OH groups. The lower edge of the continuum (7332 cm−1) corresponds to twice the frequency of the E modes. A strong peak occurs at 7376 cm−1 with additional peaks on its high-frequency side. These features correspond to a combination of the interlayer modes with the inner OH mode. The shape of the spectral function differs from that of the two-phonon DOS. It displays transitions to a continuum of states extending from twice the E mode frequency to twice the A1(LO) frequency (7390 cm−1) with an intensity increase towards the high wavenumbers (Fig. 5).
As exposed in Bogani (1978a, b) and Klafter and Jortner (1982), the spectral features corresponding to the two-phonon continuum are dominantly related to the harmonic two-phonon Green's function. However, it is noteworthy that the spectral functions of the three minerals also display strong peaks at wavenumbers above the continuum (Fig. 5). They are observed at 7447 cm−1 in talc and brucite and at 7404, 7409, 7423 and 7485 cm−1 in lizardite. These split-off resonances are related to the cancelation of the real part of the denominator in the anharmonic two-phonon Green's functions. This property of the anharmonic Green's function produces the split-off bound states associated with molecular overtones when the internal anharmonicity of molecular groups is fully taken into account. As only three-order terms are explicitly computed in the present study, these poles appear at meaningless frequencies and will not be further considered in this study.
Finally, the spectral functions in the vicinity of the fundamental OH stretching bands reveal features corresponding to the combination of OH stretching modes with other modes involving OH groups (Fig. 3). These features correspond to overlapping contributions from the self-energy of several modes, among which one or two are dominant. The decay channels involve the combination of an OH stretching mode with other modes at lower frequency. The corresponding spectral functions (Fig. 3) reflect the contributions related to H displacements in the low-frequency part of the one-phonon DOS (Fig. 4).
In talc, the main structures are observed at 4344, 4387, 4415 and 4469 cm−1. The major contribution to these features is related to the self-energy of an in-plane Si–O stretching mode whose theoretical TO frequency is 1046 cm−1 (mode 61; Table S2).
In brucite, three bands are observed at 4360, 4469 and 4576 cm−1 in the theoretical spectrum (Fig. 3). A stronger one is observed at 4145 cm−1. Dominant contributions to these four bands involve the self-energy of modes 9 and 11 (Table S3). Mode 11 at 478 cm−1 corresponds to a Mg–(OH) stretching with A2u symmetry, experimentally observed at 461 cm−1. Mode 9 has Eu symmetry and corresponds to OH libration motions. It is computed at 447 cm−1 and experimentally observed at 416 cm−1 (Dawson et al., 1973). The observed bands correspond to the decay of these modes into the OH stretching modes combined with the phonon branches leading to the H-related features observed between 620 and 930 cm−1 and to the H contribution between 380 and 480 cm−1 in the one-phonon DOS (Fig. 4).
Three major bands are observed at 4327, 4396 and 4480 cm−1 in the spectral function of lizardite (Fig. 3). They are dominated by the self-energy of an in-plane Si–O stretching mode with E symmetry (mode 47 with a TO frequency of 877 cm−1; Table S4) which accounts for about one-third of the intensity of the three bands. A comparison with the one-phonon DOS projected on H displacements indicates that these bands are mostly related to decay channels involving the interlayer OH groups (Fig. 3). Two weaker theoretical features are also observed at 4684 and 4724 cm−1. They are related to the minor contribution of interlayer and inner OH groups, respectively, to the vibrational states dominated by the stretching of apical Si–O bonds at ∼ 1014 cm−1 (Fig. 4). These features have their counterparts at 4684 and 4728 cm−1 in the experimental spectrum of lizardite (Fig. 3).
As exposed in the Introduction, absorption bands observed in the near-infrared spectra of hydrous minerals can be categorized as a function of the localization of the excitation. Due to the significant anharmonicity of the OH stretching potential and the moderate vibrational coupling between the OH groups, the overtones of OH stretching modes are observed at a frequency significantly lower than the frequency range covered by the two-phonon continuum and can be interpreted within a molecular approach. Other absorption bands involving the combination of two (or more) free phonons depend on collective vibrational properties and are related to the vibrational DOS of the crystals. Although more sophisticated models accounting for both characters have been developed for molecular crystals (Bogani, 1978a, b; Klafter and Jortner, 1982) or adsorbates (Jakob and Persson, 1998), a sound interpretation of the spectra can be based on a separate treatment of the two types of bands.
4.1 Anharmonicity of OH stretching potential in trioctahedral minerals
In most hydrous minerals, the low mass of the H atom ensures a significant frequency separation and related minimal coupling of OH stretching mode with the other vibrational modes. Therefore, their OH stretching vibrations can be understood by limiting the analysis to sets of interacting OH dipoles (e.g., Mitev et al., 2010; Fuchs et al., 2022).
In the absence of significant vibrational coupling, as in talc or for the inner OH group in lizardite, the frequency of the fundamental and overtone bands is well described by the following one-dimensional (1-D) relation (Szalay et al., 2002):
where ωOH(n) is the (anharmonic) frequency of the transition from the fundamental state to the nth excited state (0→n), ωhar is the harmonic OH stretching frequency, and Xanhar is the anharmonicity parameter associated with the OH potential along the stretching coordinate (Petit et al., 2004b; Balan et al., 2007). The linear regression of experimental data (Fig. 6) leads to an anharmonicity parameter cm−1 for both types of OH groups, as well as for those associated with the Mg2Fe2+ configuration in talc. This value is consistent with that previously reported for talc (−84 cm−1) by Petit et al. (2004b). The corresponding harmonic frequencies (ωhar) are 3842, 3826 and 3869 cm−1 for the OH groups associated with the Mg3 and Mg2Fe2+ environments in talc and for the inner OH of lizardite, respectively.
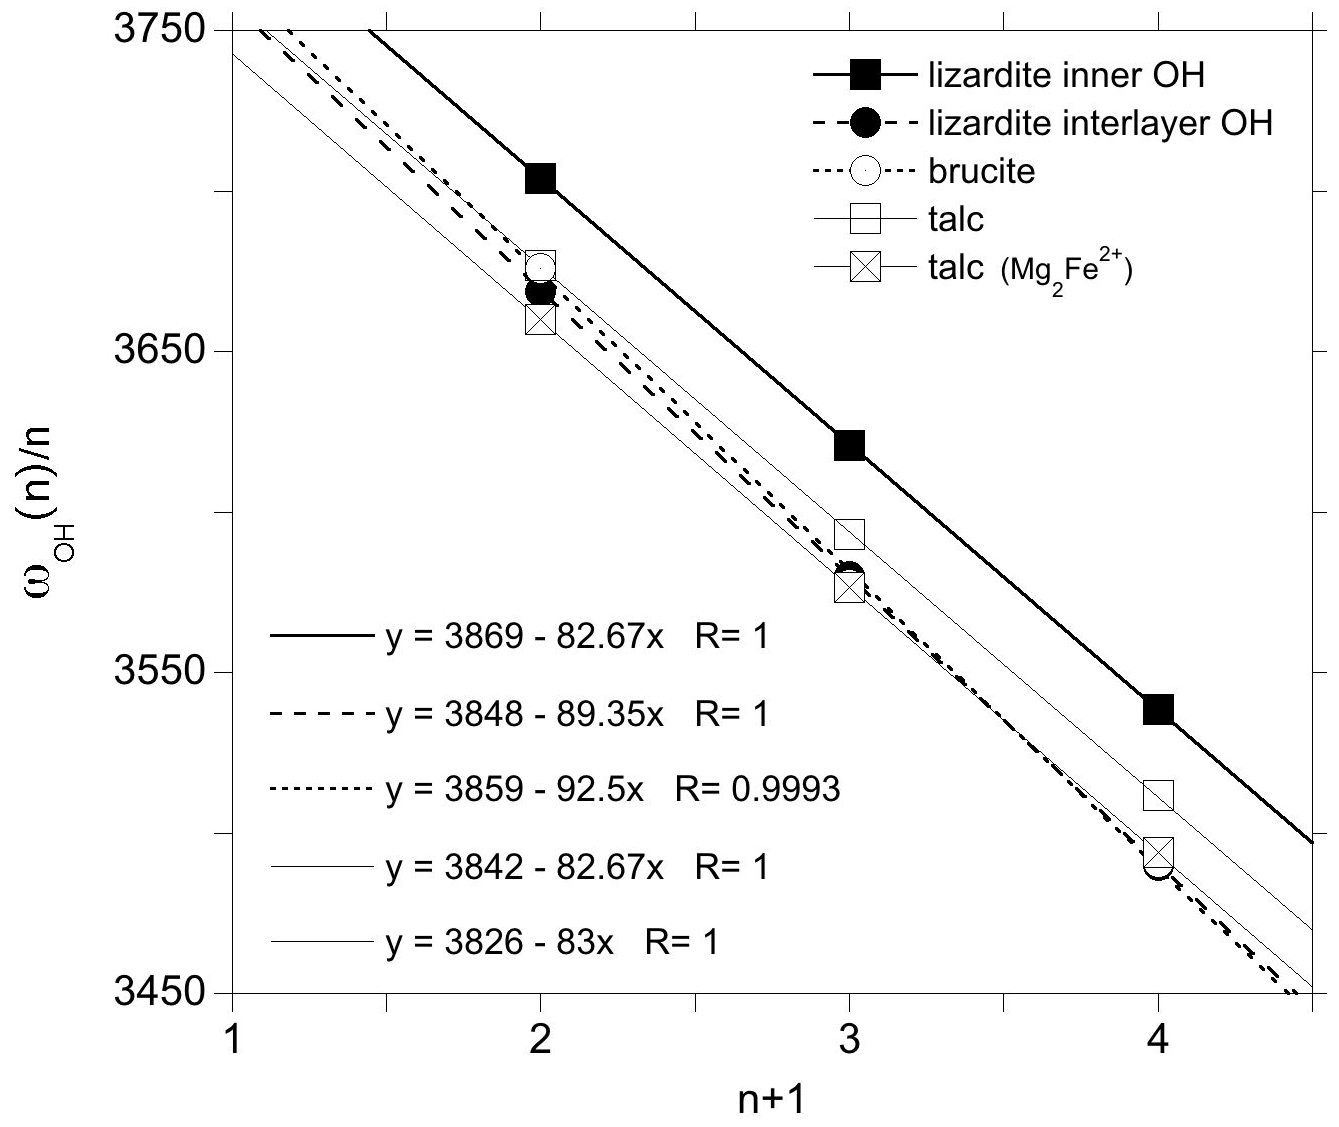
Figure 6Fundamental and overtone frequencies as a function of the quantum number n characterizing the excited state. The linear regressions correspond to the application of the 1-D relation (Eq. 1). The squares and circles correspond to inner and interlayer OH groups, respectively.
When the OH groups are vibrationally coupled, as in brucite or for the interlayer OH groups in lizardite, Eq. (1) cannot be directly used because the fundamental bands correspond to vibrational modes whose frequency differs from that of the 0→1 transition of the uncoupled OH oscillator. This effect of coupling is reduced for the overtone bands, which appear close to the frequencies of 0→n transitions (n>1) of non-interacting molecular groups (Child, 1985; Balan et al., 2021a). The frequency of the uncoupled oscillator can be assessed from the splitting of the OH stretching modes involving the coupled oscillators (e.g., Fuchs et al., 2022). Considering the symmetry of the crystal and expressing its zone-center dynamical matrix using molecular coordinates (Califano et al., 1981), the frequency of the uncoupled oscillator is given by the relation for the interlayer OH groups in lizardite and by for the OH groups in brucite. However, these expressions do not consider the long-range electrostatic interactions which potentially affect the vibrational frequency of the IR-active vibrational modes. The LO–TO splitting of the A1 mode of lizardite and A2u mode of brucite amounts to ∼ 16–19 and ∼ 12 cm−1, respectively, whereas the other weakly active or IR-inactive modes are unaffected. These effects have been previously discussed in kaolinite group minerals by assuming that these systems are well described by periodically repeated sheets of dipoles oscillating along the direction perpendicular to the sheets (Balan et al., 2005). In this simple model, the LO frequency of the bulk crystal coincides with that of the isolated sheet of dipoles. In contrast, the TO frequency corresponds to the condition that the macroscopic electric field in the periodic system is nil. This condition is ensured by a local electrostatic field which interacts with the dipoles and downshifts their vibrational frequency with respect to that of the isolated sheet. Based on this analysis, it seems reasonable to consider the LO frequency of the IR-active modes, instead of the TO frequency, to assess the stretching frequency of the uncoupled OH groups.
For the interlayer OH groups of lizardite, the Raman spectroscopic measurements suggest that the E and the A1(LO) mode frequencies are 3653 and 3688 cm−1, respectively, leading to an uncoupled frequency ωOH(1) of 3665 cm−1. For brucite, the frequency of the A1g and A2u(LO) modes are inferred at 3652 and ∼ 3700 cm−1, respectively, leading to a ωOH frequency of 3676 cm−1. This frequency is in excellent agreement with that experimentally determined on isotopically isolated OH groups in Mg(OD)2 (3677 cm−1) (Hermansson et al., 2009). Combining these values for the 0→1 transition with the observed position of 0→n overtone bands, the experimental data closely follow Eq. (1) (Fig. 6). The linear regression leads to anharmonicity parameters of −89.4 and −92.5 cm−1 for the interlayer OH groups in lizardite and brucite, respectively. The corresponding harmonic frequencies are 3848 and 3859 cm−1, respectively. The quality of the linear regressions (Fig. 6) further supports the use of LO (instead of TO) frequencies of IR-active modes to infer the frequency of uncoupled OH groups.
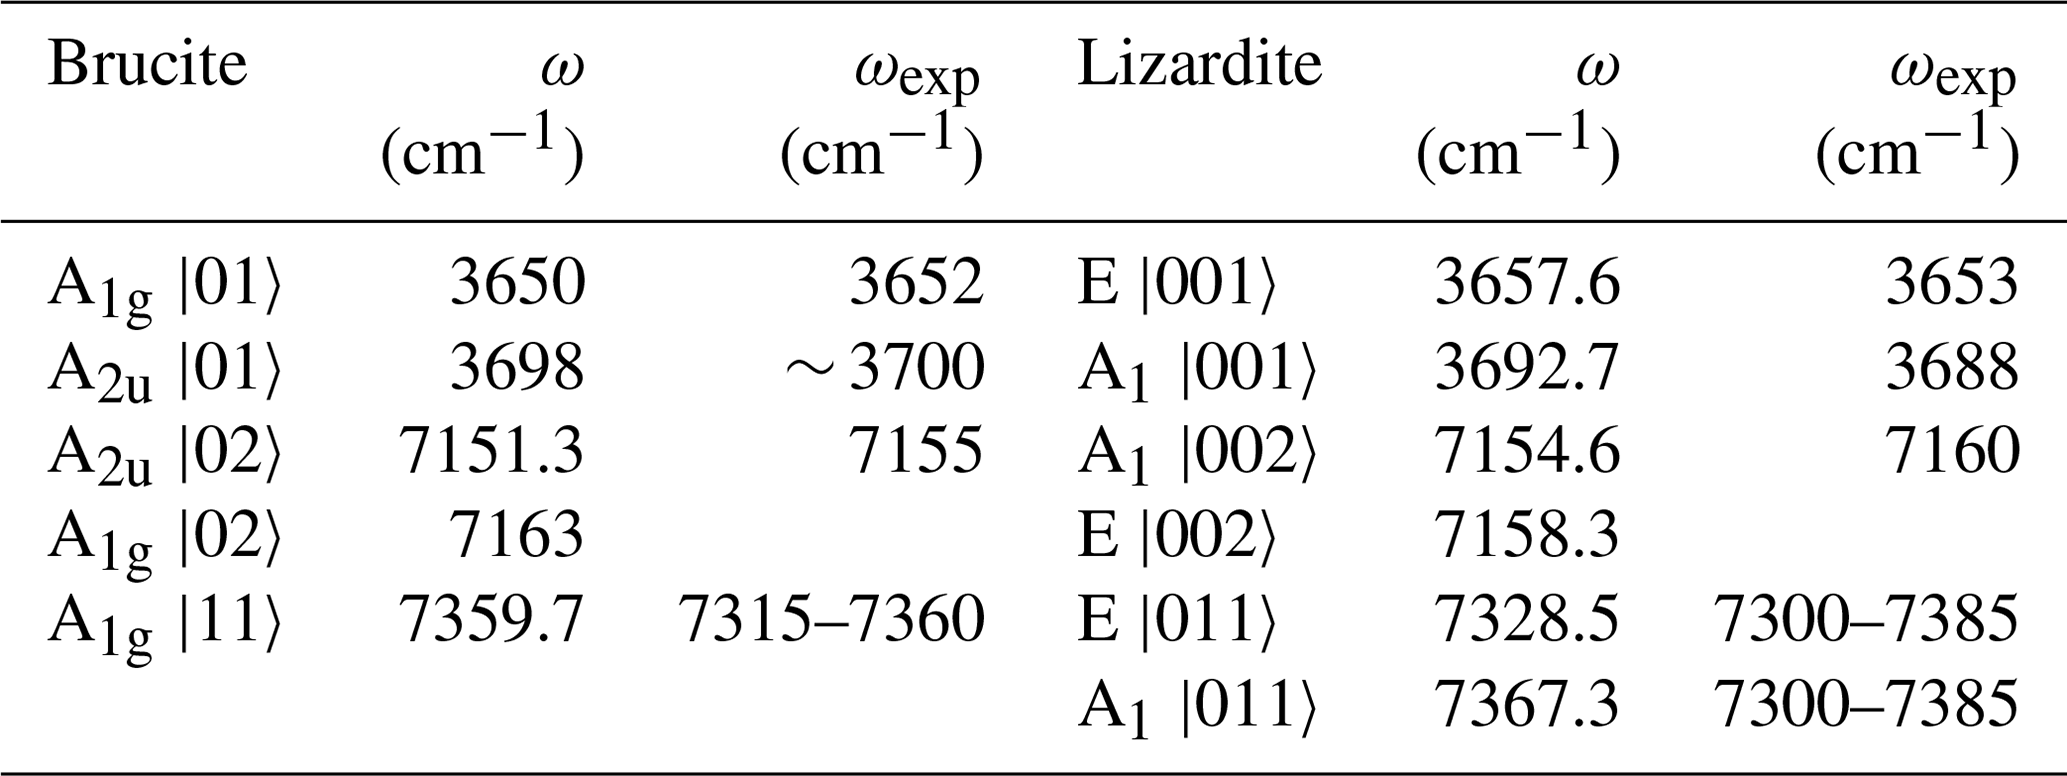
The parameters obtained from the linear regressions can be inserted in an effective spectroscopic Hamiltonian as proposed in Balan et al. (2021a). For brucite the dimension of the Hamiltonian is reduced to 6×6, consistent with the occurrence of two OH groups in the primitive cell. Using an effective coupling constant (λ) of 11.7 and −24 cm−1 for interlayer OH groups in lizardite and brucite, respectively, a good agreement with experimental data is obtained (Table 6). The parameters describing the interlayer OH groups in lizardite (ωhar=3848 cm−1, cm−1 and λ=11.7 cm−1) slightly differ from those previously proposed (ωhar=3829 cm−1, cm−1 and λ=16 cm−1) from the analysis of New Caledonian serpentine samples (Balan et al., 2021a). The anharmonicity parameter of brucite ( cm−1) also slightly differs from that previously proposed by Weckler and Lutz (1996) ( cm−1). It should be stressed that all these parameters, including the present ones, are determined using approximate models of anharmonic properties, which contributes to the reported differences. It is also noteworthy that the transitions corresponding to the local combination of OH stretching modes obtained by the diagonalization of the effective Hamiltonian fall within the frequency range covered by the two-phonon continuum (Table 6).
Table 6Frequencies of interlayer OH stretching fundamental and first overtone transitions in brucite and lizardite obtained using the effective Hamiltonian of Balan et al. (2021a). The transitions are labeled by the symmetry and the ket of the dominant contribution to the final state. The frequencies are compared with their experimental counterparts. The local transitions to |11〉 type states actually correspond to the two-phonon continuum.
4.2 Assignment of NIR and MIR absorption bands related to cationic substitutions in lizardite
Using the anharmonicity parameters characterizing the OH stretching potential, it is possible to relate to first overtone bands to fundamental frequencies of uncoupled OH groups in the series of investigated samples using the following relation: obtained from Eq. (1). As expected, the frequencies extrapolated for the OH groups in the pristine environments of talc, lizardite and brucite closely match those determined from the fundamental spectra (Fig. 7). This relation can also be applied to the bands related to the presence of substituting cations, such as Fe2+, Fe3+ or Al3+, assuming that their presence does not significantly affect the anharmonicity parameter of the coordinated OH groups. This assumption is supported by the similarity of the anharmonicity parameters obtained for the Mg3 and Mg2Fe2+ environments in talc (Fig. 6). The bands observed at 6973, 7021 and 7099 cm−1 in the overtone spectrum of lizardite (Table 3) lead to ωOH(1) frequencies of 3575.5, 3599.5 and 3638.5 cm−1, respectively. These values compare to those of the bands at 3569, 3589 and 3642 cm−1, respectively, in the fundamental spectra of lizardite (Fig. 7). Based on the theoretical study of Al and Fe impurities in lizardite (Balan et al., 2021b), the band at 3569 cm−1 is most likely related to the presence of Fe3+ at octahedral sites. In this case, the three interlayer OH groups have a similar bond length leading to three OH stretching modes, among which the one corresponding to the in-phase vibration of the OH groups has the strongest spectroscopic activity. Consistently, a single band is observed at 3569 and 6973 cm−1 in the MIR and NIR spectra of lizardite (Fig. 1). This frequency analysis does not explicitly consider the splitting of the three fundamental OH stretching modes associated with the octahedral Fe3+ because it is theoretically expected (16 cm−1; Balan et al., 2021b) to be significantly smaller than the experimental width (67 cm−1; Table 3). Note also that overlapping contributions arising from Al3+ at tetrahedral sites cannot be excluded in these MIR and NIR bands (Balan et al., 2021b). In contrast, the stronger distortion of the octahedral site induced by the Al3+ for Mg2+ substitution theoretically leads to two absorption bands split by ∼ 50 cm−1 (Balan et al., 2021b). Consistently, the fundamental bands observed at 3589 and 3642 cm−1 can be ascribed to Al3+ substitution at octahedral sites, corresponding to an experimental splitting of 53 cm−1. As this band splitting is not related to the vibrational coupling but to structural distortions, it is not reduced in the NIR spectra but leads to two overtone bands split by ∼ 78 cm−1 (Figs. 1 and 7).
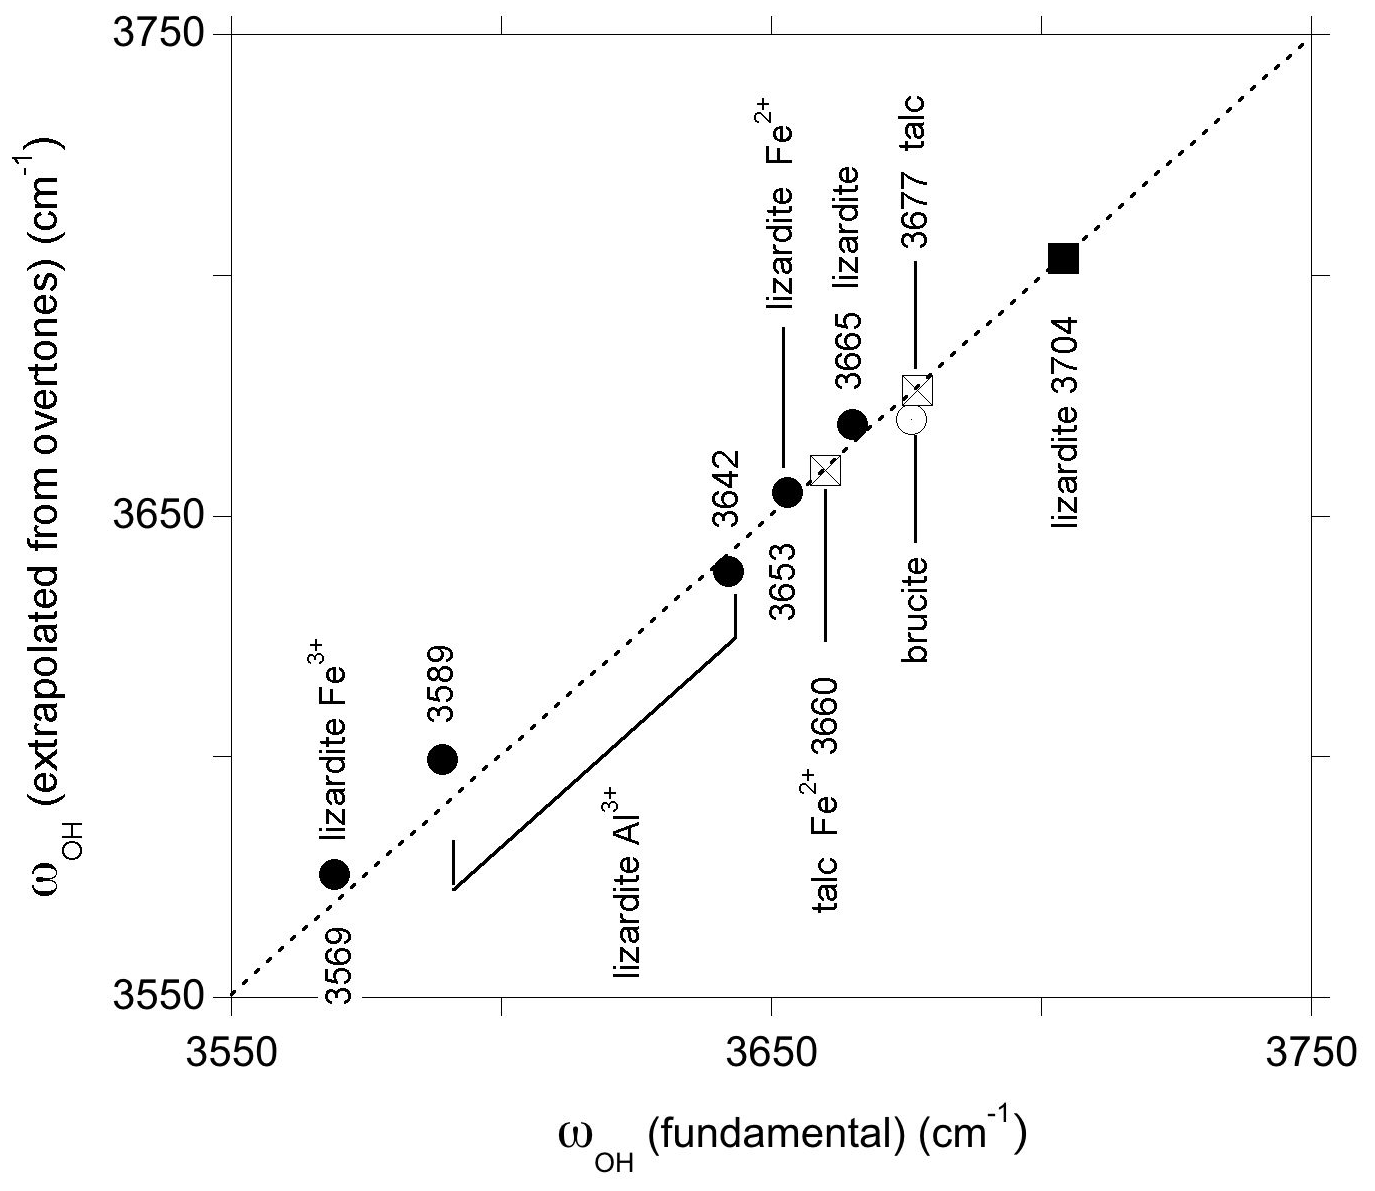
Figure 7Comparison of fundamental frequencies with frequencies extrapolated from overtone bands using the 1-D approximation (Eq. 1). The squares and circles correspond to inner and interlayer OH groups, respectively. The 3642 and 3653 cm−1 frequencies correspond to Raman data (Campagnoni et al., 2021) and are not resolved in the MIR spectrum of lizardite (Fig. 1). The interlayer OH frequencies of brucite and lizardite are those inferred for the uncoupled OH oscillator (see text).
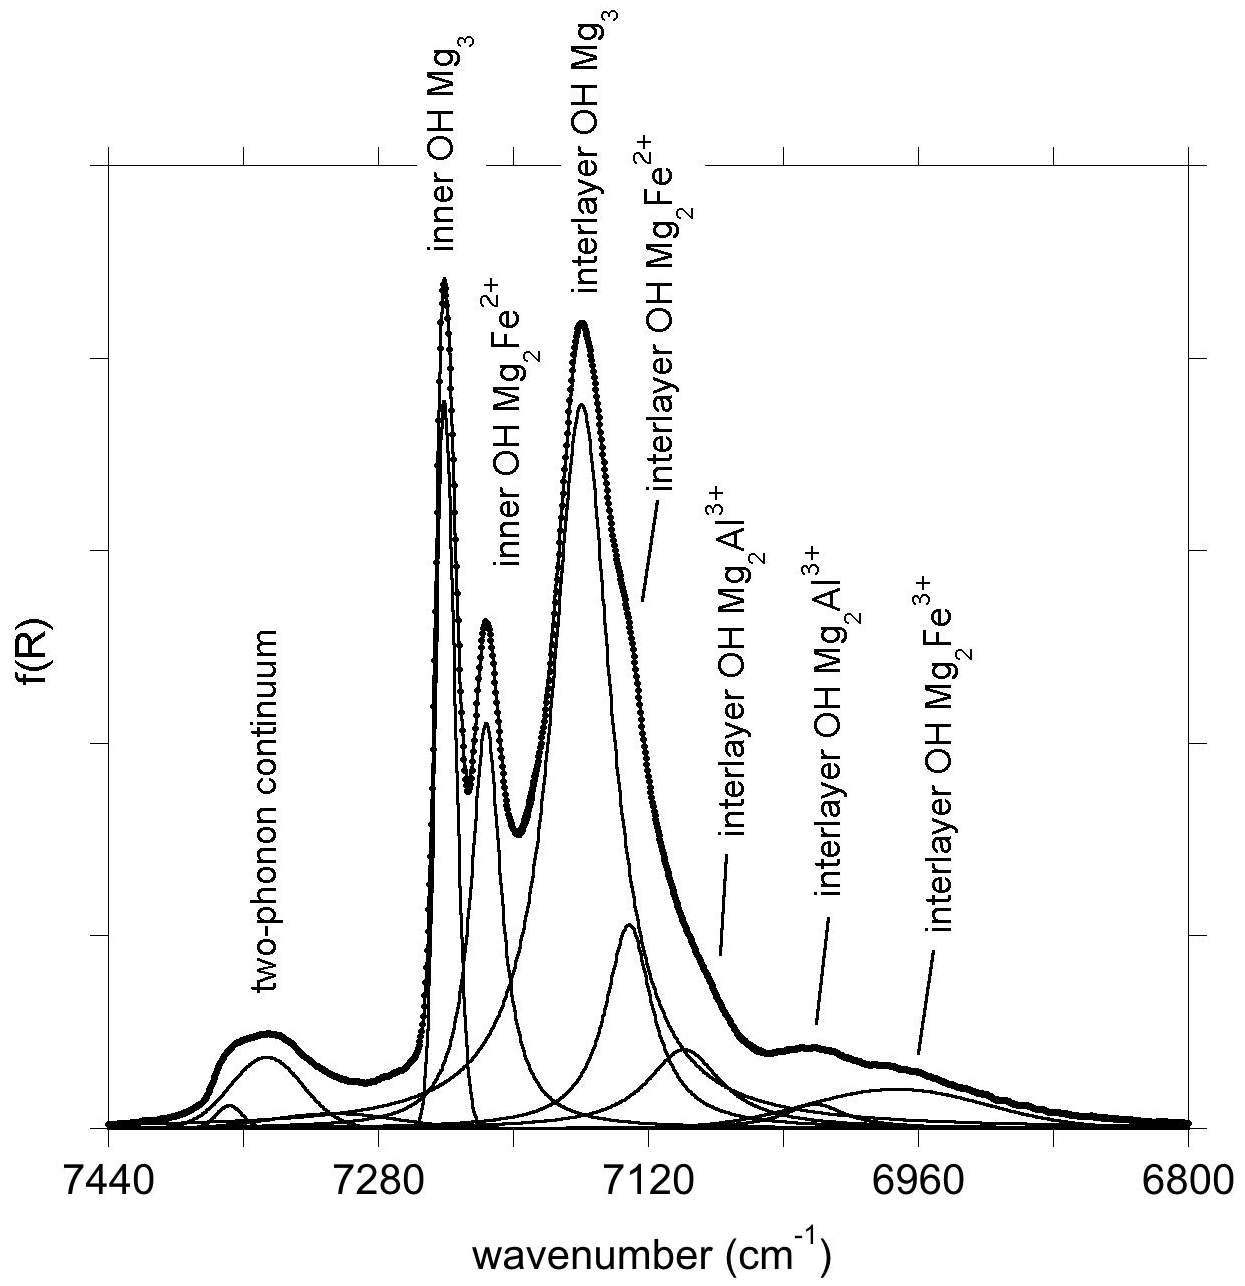
Unlike the New Caledonian serpentines investigated by Balan et al. (2021a), the Monte Fico lizardite is Ni-free (Fuchs et al., 1998). Accordingly, the overtone band at 7132 cm−1 can be related to the sole Fe2+ for Mg substitution (Balan et al., 2021a). Its frequency is consistent with a downshift of the fundamental OH stretching frequency by ∼ 14 cm−1, similar to that observed in talc or brucite. Following the same approach as for the other bands, the frequency of the fundamental band inferred from the overtone frequency is 3655 cm−1 (Fig. 7). As a consequence, the fundamental interlayer OH band related to the Mg2Fe2+ environment likely overlaps with the contribution of the E mode of lizardite at ∼ 3653 cm−1. The corresponding frequency shift of 12 cm−1 with respect to the uncoupled ωOH(1) frequency (3665 cm−1) is consistent with the shift observed for the other type of OH groups affected by Fe2+ for Mg substitution at octahedral sites. In comparison, the previously proposed contribution of the Mg2Fe2+ environment to the 3642 cm−1 band (Balan et al., 2021b) would lead to a 23 cm−1 shift, which is less likely. As for the Fe3+ substitution at octahedral sites, the splitting related to the vibrational coupling of OH groups is neglected because its theoretical value (8 cm−1; Balan et al., 2021b) is significantly smaller than the width of inter-layer OH bands (Table 3). It is therefore expected to contribute to the broadening of MIR absorption features instead of producing discrete features.
4.3 Two-phonon absorption continuum and combination bands
Although partially accounting for the various absorption processes, the spectral functions computed for the two-phonon continuum in talc, brucite and lizardite provide sound explanations for some of the salient differences observed in the experimental spectra of the three minerals. The sole consideration of the absorption mediated by a “virtual” IR-active mode should not modify the frequency range covered by the calculated features but could affect their relative intensities.
In talc, the two-phonon absorption of OH stretching modes corresponds to a narrow feature consistent with the weakness of OH coupling and related phonon dispersion. The weak and narrow absorption is observed at 7352 cm−1, i.e., about twice the frequency of the fundamental band (3677 cm−1).
In brucite, the theoretical two-phonon OH stretching absorption extends from a frequency corresponding to the maximum of the two-phonon DOS to a frequency equal to the sum of A2u(LO) and A1g frequencies. The corresponding experimental upper value is therefore 7352 cm−1 (3700+3652). The maximum of the two-phonon DOS is more difficult to locate from the experimental data, but it should occur at a frequency slightly higher than the lower bound of the two-phonon DOS, which is determined by the weakly dispersing A1g mode (3652 cm−1). Accordingly the band of the two-phonon continuum should occur between >7304 and 7352 cm−1, i.e., with a width of ∼ 48 cm−1. These values compare well with the experimental observations of a band extending from 7315 to 7360 cm−1, with a width of 45 cm−1 (Fig. 5). In addition, the increase in the theoretical intensity toward the high wavenumbers is consistent with the asymmetry of the experimental band (Fig. 5).
Compared with brucite, the two-phonon band of lizardite is broader with a width of ∼ 85 cm−1 (from 7300 to 7385 cm−1). The theoretical two-phonon spectral function extends from twice the E frequency to twice the A1(LO) mode frequency. Based on the experimental frequencies of lizardite stretching modes, these boundaries correspond to 7306 and 7376 cm−1, i.e., a width of ∼ 70 cm−1. In lizardite, both the A1 and E modes are IR-active and can contribute to the two-phonon band in the NIR range, which thus covers the full range of the two-phonon DOS of OH stretching modes. In contrast, the IR-active A2u mode in brucite decays in a combination of g and u modes which restricts the absorption range with respect to that covered by the two-phonon DOS, explaining the difference observed between the brucite and lizardite two-phonon spectra.
A proportion of interlayer OH groups in lizardite occurs in the Mg2Fe2+ environment. Neglecting their weak coupling (Balan et al., 2021b), the frequency corresponding to local transitions from ground to |110〉 states can be assessed using the effective Hamiltonian proposed in Balan et al. (2021a), assuming that the harmonic stretching frequency is lowered by 14 cm−1 and the anharmonicity parameter is unchanged with respect to the Mg3 environment. The resulting frequency at 7311 cm−1 suggests that the corresponding signal overlaps with the low-frequency tail of the main two-phonon band. Accordingly the splitting of the two-phonon band observed in chrysotile (two components identified at 7375 and 7349 cm−1) and tentatively ascribed to the presence of two different cationic environments by Balan et al. (2021a) rather corresponds to a modification of the two-phonon DOS related to the specificities of the chrysotile nanostructure.
Finally, a one-to-one relation based on their relative position and intensity can be drawn between the main experimental and theoretical combination bands observed between 4000 and 4800 cm−1 (Fig. 3). The theoretical model supports the assignment of these bands to contributions arising from the poles of the self-energy of lower-frequency modes. The decay channels corresponding to the absorption involve the combination of OH stretching modes with the more dispersive OH librational and translational modes. The observed features then reflect the contribution of the H displacements to the low-frequency part of the one-phonon DOS (Fig. 4), explaining why the combination bands are usually broader than overtone bands. Although sensitive to the cationic composition of the octahedral sheet (Baron and Petit, 2016), the interpretation of these bands in terms of local absorption properties and their relation to MIR spectra is not as straightforward as for the overtone bands.
In the present study, two different approaches were used to relate the NIR absorption bands to their fundamental counterparts, depending on the overtone or combination nature of the excitation.
The frequency of the first and second overtones can be accounted for by using the usual 1-D molecular model. This model is still valid for the vibrationally coupled interlayer OH groups, provided that the fundamental stretching frequency of the uncoupled OH group is considered. This frequency can be assessed from that of the OH stretching bands using a local mode approach. The interpretation of the talc and brucite overtones and the related parameters characterizing the OH stretching potential are consistent with those previously reported by, e.g., Petit et al. (2004b) for talc and Weckler and Lutz (1996) for brucite. The interpretation of the main overtone bands in the NIR spectrum of the Monte Fico lizardite (Fig. 8) corresponds to that previously proposed by Balan et al. (2021b) for New Caledonian samples. Specific contributions related to Fe3+ and Al3+ substitutions at octahedral sites are identified in the NIR spectrum of this well-ordered sample. In addition, the extrapolation of the overtone frequency to its fundamental counterpart suggests that the interlayer OH stretching band related to the Mg2Fe2+ environment occurs at 3655 cm−1, overlapping with the weak absorption related to the interlayer E modes in pristine lizardite.
The two-phonon combination bands of the three minerals can be interpreted on the basis of the theoretical one-phonon and two-phonon vibrational densities of states determined from first-principle calculations and by assuming that the absorption process is mediated by the decay of a “virtual” IR-active phonon. The results indicate that the combination bands occurring in the 4000–4800 cm−1 range reflect the H contribution to the one-phonon DOS in the 380–1200 cm−1 range. This explains why it is challenging to relate these NIR bands to MIR features, the latter being restricted to the IR-active long-wavelength phonons. The theoretical spectra also reproduce the OH stretching combination bands in the 7000–7500 cm−1 range. In talc, the weakness of OH coupling and negligible dispersion of OH stretching modes lead to a weak and narrow band at 7352 cm−1. In brucite and lizardite, the experimentally observed bands correspond to a two-phonon continuum related to the dispersion of the interlayer OH stretching modes. Compared with brucite, the absence of inversion symmetry in lizardite leads to a broader band covering the full range of the two-phonon DOS of interlayer OH stretching modes.
The experimental MIR and NIR spectra of the talc, brucite and lizardite samples are available in the Supplement. PWscf and PHonon codes (Giannozzi et al., 2009) are available at http://www.quantum-espresso.org/. The pseudopotentials (Schlipf and Gygi, 2015) are available at http://www.quantum-simulation.org/potentials/sg15_oncv/. Spectral fitting was performed using the Fityk® program (Wojdyr, 2010; https://github.com/wojdyr/fityk). Specific requests should be addressed to Etienne Balan (etienne.balan@sorbonne-universite.fr).
The supplement related to this article is available online at: https://doi.org/10.5194/ejm-34-627-2022-supplement.
EB and LP performed the calculations. EB, QD, KB, MG and BB performed the spectroscopic, XRD and μ-fluorescence measurements. All co-authors contributed to the discussion of the results and preparation of the manuscript.
At least one of the (co-)authors is a member of the editorial board of European Journal of Mineralogy. The peer-review process was guided by an independent editor, and the authors also have no other competing interests to declare.
Publisher’s note: Copernicus Publications remains neutral with regard to jurisdictional claims in published maps and institutional affiliations.
Calculations have been performed using the HPC resources of the SACADO MeSU platform at Sorbonne-Université and the HPC resources of IDRIS under the allocations 910820 and 907320 attributed by GENCI (Grand Équipement National de Calcul Intensif).
This paper was edited by Reto Gieré and Roland Stalder, and reviewed by two anonymous referees.
Auzende, A. L., Daniel, I., Reynard, B., Lemaire, C., and Guyot, F.: High-pressure behaviour of serpentine minerals: A Raman spectroscopic study, Phys. Chem. Miner., 31, 269–277, https://doi.org/10.1007/s00269-004-0384-0, 2004.
Balan, E., Saitta, A. M., Mauri, F., Lemaire, C., and Guyot, F.: First-principles calculation of the infrared spectrum of lizardite, Am. Mineral., 87, 1286–1290, https://doi.org/10.2138/am-2002-1003, 2002.
Balan, E., Lazzeri, M., Saitta, A. M., Allard, T., Fuchs, Y., and Mauri, F.: First-principles study of OH stretching modes in kaolinite, dickite and nacrite, Am. Mineral., 90, 50–60, https://doi.org/10.2138/am.2005.1675, 2005.
Balan, E., Lazzeri, M., Delattre, S., Meheut, M., Refson, K., and Winkler, B.: Anharmonicity of inner-OH stretching modes in hydrous phyllosilicates: assessment from first-principles frozen-phonon calculations, Phys. Chem. Miner., 34, 621–625, https://doi.org/10.1007/s00269-007-0176-4, 2007.
Balan, E., Fritsch, E., Juillot, F., Allard, T., and Petit, S.: Local mode interpretation of the OH overtone spectrum of 1 : 1 phyllosilicates, Eur. J. Mineral., 33, 209–220, https://doi.org/10.5194/ejm-33-209-2021, 2021a.
Balan, E., Fritsch, E., Radtke, G., Paulatto, L., Juillot, F., Baron, F., and Petit, S.: First-principles modeling of the infrared spectrum of Fe- and Al-bearing lizardite, Eur. J. Mineral., 33, 647–657, https://doi.org/10.5194/ejm-33-647-2021, 2021b.
Baranek, P., Lichanot, A., Orlando, R., and Dovesi, R.: Structural and vibrational properties of solid Mg(OH)2 and Ca(OH)2 – performances of various hamiltonians, Chem. Phys. Lett., 340, 362–369, https://doi.org/10.1016/S0009-2614(01)00381-5, 2001.
Baron, F. and Petit, S.: Interpretation of the infrared spectra of the lizardite-nepouite series in the near and middle infrared range, Am. Mineral., 101, 423–430, https://doi.org/10.2138/am-2016-5352, 2016.
Beck, P., Schmitt B., Cloutis, E. A., and Vernazza, P.: Low-temperature reflectance spectra of brucite and the primitive surface of 1-Ceres?, Icarus, 257, 471–476, https://doi.org/10.1016/j.icarus.2015.05.031, 2015.
Berland, K., Cooper, V. R., Lee, K., Schröder, E., Thonhauser, T., Hyldgaard, P., and Lundqvist, B. I.: Van der Waals forces in density functional theory: a review of the vdW-DF method, Rep. Prog. Phys., 78, 066501, https://doi.org/10.1088/0034-4885/78/6/066501, 2015.
Bishop, J. L., Murad, E., and Dyar, M. D.: The influence of octahedral and tetrahedral cation substitution on the structure of smectites and serpentines as observed through infrared spectroscopy, Clay Miner., 37, 617–628, https://doi.org/10.1180/0009855023740064, 2002.
Bishop, J. L., Noe Dobrea, E. Z., McKeown, N. K., Parente, M., Ehlman, B. L., Michalski, J. R., Milliken, R. E., Poulet, F., Swayze, G. A., Mustard, J. F., Murchie, S. L., and Bibring, J.-P.: Phyllosilicate diversity and past aqueous activity revealed at Mawrth Vallis, Mars, Science, 321, 830–833, https://doi.org/10.1126/science.1159699, 2008.
Blanchard, M., Méheut, M., Delon, L., Poirier, M., Micoud, P., Le Roux, C., and Martin, F.: Infrared spectroscopic study of the synthetic Mg-Ni talc series, Phys. Chem. Miner., 45, 843–854, https://doi.org/10.1007/s00269-018-0966-x, 2018.
Bogani, F.: Two-phonon resonances and bound-states in molecular crystals. I. General theory, J. Phys. C, 1, 1283–1295, https://doi.org/10.1088/0022-3719/11/7/019, 1978a.
Bogani, F.: Two-phonon resonances and bound-states in molecular crystals. II. Absorption coefficient, J. Phys. C, 11, 1297–1309, https://doi.org/10.1088/0022-3719/11/7/019, 1978b.
Bogani, F., Giua, R., and Schettino, V.: Two-exciton spectra of HCl and HBr crystals, Chem. Phys., 88, 375–389, https://doi.org/10.1016/0301-0104(84)87004-4, 1984.
Calandra, M., Lazzeri, M., and Mauri, F.: Anharmonic and non-adiabatic effects in MgB2: Implications for the isotope effect and interpretation of Raman spectra, Physica C, 456, 38–44, https://doi.org/10.1016/j.physc.2007.01.021, 2007.
Califano, S., Schettino, V., and Neto, N.: Lattice dynamics of molecular crystals, Lecture Notes in Chemistry, Vol. 26, edited by: Berthier, G., Dewar, M. J. S., Fischer, H., Fukui, K., Hall, G. G., Hartmann, H., Jaffé, H. H., Jortner, J., Kutzelnigg, W., Ruedenberg, K., and Scrocco, E., Springer-Verlag, Berlin, https://doi.org/10.1007/978-3-642-93186-4, 1981.
Capitani, G., Compagnoni, R., Cossio, R., Botta, S., and Mellini, M.: The intracrystalline microstructure of Monte Fico lizardite, by optics, μ-Raman spectroscopy and TEM, Eur. J. Mineral., 33, 425–432, https://doi.org/10.5194/ejm-33-425-2021, 2021.
Carter, J., Poulet, F., Bibring, J.-P., Mangold, N., and Murchie, S.: Hydrous minerals on Mars as seen by the CRISM and OMEGA imaging spectrometers: Updated global view, J. Geophys. Res.-Planet., 118, 831–858, https://doi.org/10.1029/2012JE004145, 2013.
Chalmers, J. M.: Mid-Infrared Spectroscopy: Anomalies, Artifacts and Common Errors, in: Handbook of Vibrational Spectroscopy, edited by: Chalmers, J. M. and Griffiths, P. R., 2327–2347, https://doi.org/10.1002/0470027320.s3101, 2006.
Child, M. S.: Local mode overtone spectra, Accounts Chem. Res., 18, 45–50, https://doi.org/10.1021/ar00110a003, 1985.
Compagnoni, R., Cossio, R., and Mellini, M.: Raman anisotropy in serpentine minerals, with a caveat on identification, J. Raman Spectrosc., 52, 1334–1345, https://doi.org/10.1002/jrs.6128, 2021.
Cowley, E. R.: Self-consistent phonon studies of a model diatomic ferroelectric, Physica A, 232, 585–599, https://doi.org/10.1016/0378-4371(96)00168-9, 1996.
Dawson, P., Hadfield, C. D., and Wilkinson, G. R.: The polarized infra-red and Raman spectra of Mg(OH)2 and Ca(OH)2, J. Phys. Chem. Solids, 34, 1217–1225, https://doi.org/10.1016/S0022-3697(73)80212-4, 1973.
De Oliveira, E. F. and Hase, Y.: Infrared study and isotopic effect of magnesium hydroxide, Vib. Spectrosc., 25, 53–56, https://doi.org/10.1016/S0924-2031(00)00107-7, 2001.
Dows, D. A. and Schettino, V.: Two-phonon infrared absorption spectra in crystalline carbon dioxide, J. Chem. Phys., 58, 5009–5016, https://doi.org/10.1063/1.1679088, 1973.
Duffy, T. S., Meade, C., Fei, Y., Mao, H.-K., and Hemley, R. J.: High-pressure phase transition in brucite, Mg(OH)2, Am. Mineral., 80, 222–230, https://doi.org/10.2138/am-1995-3-403, 1995.
Farmer, V. C.: Transverse and longitudinal crystal modes associated with OH stretching vibrations in single crystals of kaolinite and dickite, Spectrochim. Acta A, 56, 927–930, https://doi.org/10.1016/S1386-1425(99)00182-1, 2000.
Fritsch, E., Balan, E., Petit, S., and Juillot, F.: Structural, textural, and chemical controls on the OH stretching vibrations in serpentine-group minerals, Eur. J. Mineral., 33, 447–462, https://doi.org/10.5194/ejm-33-447-2021, 2021.
Frost, R. L., Ding, Z., and Kloprogge, J. T.: The application of near-infrared spectroscopy to the study of brucite and hydrotalcite structures, Can. J. Anal. Sci. Spect., 45, 96–101, 2000.
Fuchs, Y., Linares, J., and Mellini, M.: Mössbauer and infrared spectrometry of lizardite-1T from Monte Fico, Elba, Phys. Chem. Miner., 26, 111–115, https://doi.org/10.1007/s002690050167, 1998.
Fuchs, Y., Fourdrin, C., and Balan, E.: Theoretical OH stretching vibrations in dravite, Eur. J. Mineral., 34, 239–251, https://doi.org/10.5194/ejm-34-239-2022, 2022.
Giannozzi, P., Baroni, S., Bonini, N., Calandra, M., Car, R., Cavazzoni, C., Ceresoli, D., Chiarotti, G. L., Cococcioni, M., Dabo, I., Dal Corso, A., de Gironcoli, S., Fabris, S., Fratesi, G., Gebauer, R., Gerstmann, U., Gougoussis, C., Kokalj, A., Lazzeri, M., Martin-Samos, L., Marzari, N., Mauri, F., Mazzarello, R., Paolini, S., Pasquarello, A., Paulatto, L., Sbraccia, C., Scandolo, S., Sclauzero, G., Seitsonen, A. P., Smo- gunov, A., Umari, P., and Wentzcovitch, R. M.: Quantum ESPRESSO: a modular and open-source software project for quantum simulations of materials, J. Phys. Cond. Mat., 21, 395502, https://doi.org/10.1088/0953-8984/21/39/395502, 2009 (code available at: http://www.quantum-espresso.org/, last access: 12 December 2022).
Gregorkiewitz, M., Lebech, B., Mellini, M., and Viti, C.: Hydrogen positions and thermal expansion in lizardite-1T from Elba: A low-temperature study using Rietveld refinement of neutron diffraction data, Am. Mineral., 81, 1111–1116, https://doi.org/10.2138/am-1996-9-1008, 1996.
Hamann, D. R.: Optimized norm-conserving Vanderbilt pseudopotentials, Phys. Rev. B, 88, 085117, https://doi.org/10.1103/PhysRevB.88.085117, 2013.
Hermansson, K., Probst, M. M., Gajewski, G., and Mitev, P. D.: Anharmonic OH vibrations in Mg(OH)2 (brucite): two-dimensional calculations and crystal-induced blueshift, J. Chem. Phys., 131, 244517, https://doi.org/10.1063/1.3266507, 2009.
Holstein, T., Orbach, R., and Alexander, S.: Cooperative optical absorption, Phys. Rev. B, 26, 4721–4726, https://doi.org/10.1103/PhysRevB.26.4721, 1982.
Jakob, P. and Persson, B. N.: Infrared spectroscopy of overtones and combination bands, J. Chem. Phys., 109, 8641, https://doi.org/10.1063/1.477531, 1998.
Kimball, J. C., Fong, C. Y., and Shen, Y. R.: Anharmonicity, phonon localization, two-phonon bound states, and vibrational spectra, Phys. Rev. B, 23, 4946, https://doi.org/10.1103/PhysRevB.23.4946, 1981.
Klafter, J. and Jortner, J.: Two-particle vibrational excitations in molecular crystals, J. Chem. Phys., 77, 2816, https://doi.org/10.1063/1.444172, 1982.
Langreth, D. C., Lundqvist, B. I., Chakarova-Kack, S. D., Cooper, V. R., Dion, M., Hyldgaard, P., Kelkkanen, A., Kleis, J., Kong, L., Li, S., Moses, P. G., Murray, E., Puzder, A., Rydberg, H., Schröder, E., and Thonhauser, T.: A density functional for sparse matter, J. Phys. Condens. Matter, 21, 084203, https://doi.org/10.1088/0953-8984/21/8/084203, 2009.
Madejová, J., Gates, W. P., and Petit, S.: Chapter 5 – IR Spectra of Clay Minerals, Dev. Clay Science, 8, 107–149, https://doi.org/10.1016/B978-0-08-100355-8.00005-9, 2017.
Martens, R. and Freund, F.: The potential energy curve of the proton and the dissociation energy of the OH− ion in Mg(OH)2, Phys. Stat. Sol., 37, 97–104, https://doi.org/10.1002/pssa.2210370112, 1976.
Martin, F., Micoud, P., Delmotte, L., Maréchal, C., Le Dred, R., de Parseval, P., Mari, A., Fortuné, J. P., Salvi, S., Béziat, D., Grauby, O., and Ferret, J.: The structural formula of talc from the Trimouns deposit, Pyrénées, France, Can. Mineral., 37, 975–984, 1999.
Mathian, M., Hebert, B., Baron, F., Petit, S., Lescuyer, J.-L., Furic, R., and Beaufort D.: Identifying the phyllosilicate minerals of hypogene ore deposits in lateritic saprolites using the near-IR spectroscopy second derivative methodology, J. Geochem. Explor., 186, 298–314, https://doi.org/10.1016/j.gexplo.2017.11.019, 2018.
Meier, R. J.: On art and science in curve-fitting vibrational spectra, Vib. Spectrosc., 39, 266–269, https://doi.org/10.1016/j.vibspec.2005.03.003, 2005.
Mellini, M. and Viti, C.: Crystal structure of lizardite-1T from Elba, Italy, Am. Mineral., 79, 1194–1198, 1994.
Mitev, P. D., Hermansson, K., and Briels, W. J.: Calculation of anharmonic OH phonon dispersion curves for the Mg(OH)2 crystal, J. Chem. Phys., 133, 034120, https://doi.org/10.1063/1.3458001, 2010.
Pascale, F., Tosoni, S., Zicovich-Wilson, C., Ugliengo, P., Orlando, R., and Dovesi, R.: Vibrational spectrum of brucite, Mg(OH)2: a periodic ab initio quantum mechanical calculation including OH anharmonicity, Chem. Phys. Lett., 396, 308–315, https://doi.org/10.1016/j.cplett.2004.08.047, 2004.
Paulatto, L., Mauri, F., and Lazzeri, M.: Anharmonic properties from a generalized third-order ab initio approach: Theory and applications to graphite and graphene, Phys. Rev. B, 87, 214303, https://doi.org/10.1103/PhysRevB.87.214303, 2013.
Paulatto, L., Errea, I., Calandra, M., and Mauri F.: First-principles calculations of phonon frequencies, lifetimes, and spectral functions from weak to strong anharmonicity: The example of palladium hydrides, Phys. Rev. B, 91, 054304, https://doi.org/10.1103/PhysRevB.91.054304, 2015.
Perdikatsis, B. and Burzlaff, H.: Strukturverfeinerung am talk Mg3[(OH)2Si4O10], Z. für Krist., 156, 177–186, https://doi.org/10.1524/zkri.1981.156.3-4.177, 1981.
Petit, S., Martin, F., Wiewiora, A., De Parseval, P., and Decarreau, A.: Crystal-chemistry of talc: a near infrared (NIR) spectroscopy study, Am. Mineral., 89, 319–326, https://doi.org/10.2138/am-2004-2-310, 2004a.
Petit, S., Decarreau, A., Martin, F., and Robert, R.: Refined relationship between the position of the fundamental OH stretching and the first overtones for clays, Phys. Chem. Miner., 31, 585–592, https://doi.org/10.1007/s00269-004-0423-x, 2004b.
Pillai, S. B., Joseph, B., and Jha, P. K.: Brucite (Mg(OH)2) under small perturbation: A combined first principles and synchrotron X-ray diffraction study, J. Phys. Chem. Solids, 154, 110078, https://doi.org/10.1016/j.jpcs.2021.110078, 2021.
Prencipe, M., Noel, Y., Bruno, M., and Dovesi, R.: The vibrational spectrum of lizardite-1T [Mg3Si2O5(OH)4] at the Γ point: A contribution from an ab initio B3LYP calculation, Am. Mineral., 94, 986–994, https://doi.org/10.2138/am.2009.3127, 2009.
Reynard, B. and Caracas, R.: D/H isotopic fractionation between brucite Mg(OH)2 and water from first-principles vibrational modeling, Chem. Geol., 262, 159–168, https://doi.org/10.1016/j.chemgeo.2009.01.007, 2009.
Rosasco, G. J. and Blaha, J. J.: Raman microprobe spectra and vibrational mode assignments of talc, Appl. Spectrosc., 34, 140–144, https://doi.org/10.1366/0003702804730664, 1980.
Sabatini, R., Küçükbenli, E., Kolb, B., Thonhauser, T., and De Gironcoli, S.: Structural evolution of amino acid crystals under stress from a non-empirical density functional, J. Phys. Condens. Matter, 24, 424209, https://doi.org/10.1088/0953-8984/24/42/424209, 2012.
Schlipf, M. and Gygi, F.: Optimization algorithm for the generation of ONCV pseudopotentials, Comput. Phys. Commun., 196, 36–44, https://doi.org/10.1016/j.cpc.2015.05.011, 2015 (code available at: http://www.quantum-simulation.org/potentials/sg15_oncv/, last access: 12 December 2022).
Szalay, V., Kovács, L., Wöhlecke, M., and Libowitzky, E.: Stretching potential and equilibrium length of the OH bonds in solids, Chem. Phys. Lett., 354, 56–61, https://doi.org/10.1016/S0009-2614(02)00099-4, 2002.
Tarling, M. S., Demurtas, M., Smith, S. A. F., Rooney, J. S., Negrini, M., Viti, C., Petriglieri, J. R., and Gordon, K. C.: Crystallographic orientation mapping of lizardite serpentinite by Raman spectroscopy, Eur. J. Mineral., 34, 285–300, https://doi.org/10.5194/ejm-34-285-2022, 2022.
Thonhauser, T., Cooper, V. R., Li, S., Puzder, A., Hyldgaard, P., and Langreth, D. C.: Van der Waals density functional: self-consistent potential and the nature of the van der Waals bond, Phys. Rev. B, 76, 125112, https://doi.org/10.1103/PhysRevB.76.125112, 2007.
Treviño, P., Garcia-Castro, A. C., Lopez-Moreno, S., Bautista-Hernandez, A., Bobocioiu, E., Reynard, B., Caracas, R., and Romero, A. H.: Anharmonic contribution to the stabilization of Mg(OH)2 from first principles, Phys. Chem. Chem. Phys., 20, 17799–17808, https://doi.org/10.1039/c8cp02490a, 2018.
Ugliengo, P., Zicovich-Wilson, C. M., Tosoni, S., and Civalleri, B.: Role of dispersive interactions in layered materials: a periodic B3LYP and B3LYP-D* study of Mg(OH)2, Ca(OH)2 and kaolinite, Mater. Chem., 19, 2564–2572, https://doi.org/10.1039/B819020H, 2009.
Ulian, G., Tosoni, S., and ValdreÌ, G.: Comparison between Gaussian-type orbitals and plane wave ab initio density functional theory modeling of layer silicates: Talc [Mg3Si4O10(OH)2] as model system, J. Chem. Phys., 139, 204101, https://doi.org/10.1063/1.4830405, 2013.
Viti, C. and Mellini, M.: Contrasting chemical compositions in associated lizardite and chrysotile in veins from Elba, Italy, Eur. J. Mineral., 9, 585–596, https://doi.org/10.1127/ejm/9/3/0585, 1997.
Weckler, B. and Lutz, H. D.: Near-infrared spectra of M(OH)Cl (M = Ca, Cd, Sr), Zn(OH)F, γ-Cd(OH)2, Sr(OH)2, and brucite-type hydroxides M(OH)2 (M = Mg, Ca, Mn, Fe, Co, Ni, Cd), Spectrochim. Acta A, 52, 1507–1513, https://doi.org/10.1016/0584-8539(96)01693-5, 1996.
Wilkins, R. W. T. and Ito, J.: Infrared spectra of some synthetic talcs, Am. Mineral., 52, 1649–1661, 1967.
Wojdyr, M.: Fityk: a general-purpose peak fitting program, J. Appl. Crystallogr., 43, 1126–1128, https://doi.org/10.1107/S0021889810030499, 2010 (code available at: https://github.com/wojdyr/fityk, last access: 12 December 2022).
Zhang, M., Qun, H., Lou, X.-J., Redfern, S. A. T., Salje, E. K. H., and Tarantino, S. C.: Dehydroxylation, proton migration, and structural changes in heated talc: An infrared spectroscopic study, Am. Mineral., 91, 816–825, https://doi.org/10.2138/am.2006.1945, 2006.
Zhang, M., Salje, E. K. H., Carpenter, M. A., Wang, J. Y., Groat, L. A., Lager, G. A., Wang, L., Beran, A., and Bismayer, U.: Temperature dependence of IR absorption of hydrous/hydroxyl species in minerals and synthetic materials, Am. Mineral., 92, 1502–1517, https://doi.org/10.2138/am.2007.2586, 2007.