the Creative Commons Attribution 4.0 License.
the Creative Commons Attribution 4.0 License.
 | 11 May 2022
Crystallographic orientation mapping of lizardite serpentinite by Raman spectroscopy
Matthew S. Tarling
Matteo Demurtas
Steven A. F. Smith
Jeremy S. Rooney
Marianne Negrini
Cecilia Viti
Jasmine R. Petriglieri
Keith C. Gordon
The serpentine mineral lizardite displays strong Raman anisotropy in the OH-stretching region, resulting in significant wavenumber shifts (up to ca. 14.5 cm−1) that depend on the orientation of the impinging excitation laser relative to the crystallographic axes. We quantified the relationship between crystallographic orientation and Raman wavenumber using well-characterised samples of Monte Fico lizardite by applying Raman spectroscopy and electron backscatter diffraction (EBSD) mapping on thin sections of polycrystalline samples and grain mounts of selected single crystals, as well as by a spindle stage Raman study of an oriented cylinder drilled from a single crystal. We demonstrate that the main band in the OH-stretching region undergoes a systematic shift that depends on the inclination of the c-axis of the lizardite crystal. The data are used to derive an empirical relationship between the position of this main band and the c-axis inclination of a measured lizardite crystal: y=14.5cos 4 (, where y is the inclination of the c-axis with respect to the normal vector (in degrees), and x is the main band position (wavenumber in cm −1) in the OH-stretching region. This new method provides a simple and cost-effective technique for measuring and quantifying the crystallographic orientation of lizardite-bearing serpentinite fault rocks, which can be difficult to achieve using EBSD alone. In addition to the samples used to determine the above empirical relationship, we demonstrate the applicability of the technique by mapping the orientations of lizardite in a more complex sample of deformed serpentinite from Elba Island, Italy.
- Article
(10009 KB) - Full-text XML
- BibTeX
- EndNote


Serpentinites are primarily composed of serpentine minerals which are formed in a wide range of tectonically active environments (e.g. transform faults, mid-ocean ridges, slab–mantle interface in subduction zones) by hydration of ultramafic rocks such as peridotites (Wang et al., 2020; Reynard, 2013; Evans et al., 2013). Understanding and quantifying the crystallographic orientation of serpentine minerals within deformed serpentinitic rocks can provide important insights into the kinematic history, rheological behaviour, and active deformation mechanisms that operate in such environments and also provide one method of calculating geophysical properties including seismic anisotropy (Jung, 2011; Katayama et al., 2009).
The most commonly used modern analytical tool for quantifying crystallographic orientations in polycrystalline samples is electron backscatter diffraction (EBSD) (Prior et al., 2009). Recent work has demonstrated that EBSD is possible on weak phyllosilicates such as talc, following extensive sample preparation (e.g. Lee et al., 2020; Nagaya et al., 2020), as well as biotite and muscovite (Dempsey et al., 2011), but generally the crystallographic orientation of phyllosilicate minerals, including serpentine, is challenging to measure using EBSD in part due to technical difficulties in polishing (Charoensawan et al., 2021; Inoue and Kogure, 2012). A notable exception is antigorite, generally considered to be the high-temperature serpentine mineral (Evans, 2004) which polishes reasonably well due to its mechanical strength (Amiguet et al., 2014) and has been analysed with EBSD with moderately high indexing rates (Soda and Wenk, 2014; Padrón-Navarta et al., 2012; Brownlee et al., 2013; Van De Moortèle et al., 2010). Using traditional polishing methods, EBSD data on phyllosilicates are typically limited to grains that have their basal planes sub-parallel to the thin section surface largely due to amorphisation and damage to phyllosilicates during polishing of oblique grain orientations due to mechanical weakness along basal planes (Inoue and Kogure, 2012; Amiguet et al., 2014; Kronenberg et al., 1990). Ion-beam milling techniques have been developed to overcome this problem, but they require time-consuming preparation with expensive and specialised ion-milling equipment (Inoue and Kogure, 2012).
Raman spectroscopy is potentially a useful tool for determining the crystallographic orientation of some minerals (Zhong et al., 2021; Ishibashi et al., 2008; Tesar et al., 2019). This is based on comparing the polarisation directions and intensities of select Raman modes for a range of orientations relative to polarisation (Zhong et al., 2021). Unlike EBSD that typically has an interaction volume extending only 10–50 nm below the sample surface (depending on material density and acceleration voltage) (Van De Moortèle et al., 2010), the detection volume for confocal Raman spectroscopy with a high numerical aperture objective can extend up to 1–2 µm below the surface, depending on the properties of the measured material. This allows for the crystallographic orientation to be determined despite some surface damage and amorphisation that may occur during sample preparation and polishing.
Recently, Compagnoni et al. (2021) and Capitani et al. (2021) reported a significant Raman anisotropy effect in the serpentine minerals lizardite and polyhedral serpentine, which results in wavenumber shifts depending on the orientation of the crystals relative to the impinging excitation laser. In particular, they noted a shift of more than 10 cm−1 in the position of the main band in the OH-stretching region for lizardite. Their analysis included a comparison of Raman spectra recorded on thin sections cut approximately parallel and perpendicular to the lizardite (001) planes. In this paper, we confirm that this previously observed shift is due to the inclination of the c-axis of the lizardite grains relative to the impinging excitation laser, but we extend the results to show that the band shift also occurs as a continuum for grains with intermediate orientations as a function of the inclination of the c-axis with respect to the orientation of the impinging excitation laser (here and throughout the text, we use the term lizardite “grain” to refer to a single crystal without internal sub-grains). Exploiting an empirical relationship between wavenumber and c-axis inclination, we propose a methodology based on Raman spectroscopy that allows the mapping of the c-axis inclination of lizardite grains with minimal preparation directly on standard polished thin sections. The resulting detailed maps provide a new way of quantifying and visualising the crystallographic orientation of lizardite aggregates and individual lizardite grains in samples that may be difficult to measure using conventional EBSD alone.
2.1 Materials and sample preparation
2.1.1 Monte Fico lizardite vein
The lizardite sample used to calibrate the new method is a well-studied sample of lizardite vein from Monte Fico, Elba Island, Italy. Mellini and Viti (1994) and Viti and Mellini (1997) initially characterised samples of the Monte Fico lizardite vein by optical microscopy, X-ray diffraction, scanning electron microscopy, and transmission electron microscopy. Since then, the sample has been studied using a diverse range of approaches, including neutron diffraction (Gregorkiewitz et al., 1996), thermal analysis (Viti, 2010), Mössbauer and infrared spectroscopy (Fuchs et al., 1998; Trittschack et al., 2012), Raman spectroscopy (Rinaudo et al., 2003; Auzende et al., 2004; Trittschack et al., 2012; Capitani et al., 2021; Compagnoni et al., 2021), X-ray diffraction (Hilairet et al., 2006), and calorimetry (Gailhanou et al., 2018). Additionally, Monte Fico lizardite has been used as a starting material for several rock deformation experiments (Hirose et al., 2006; Viti and Hirose, 2010, 2009; Amiguet et al., 2014; Tesei et al., 2018).
The vein consists of highly crystalline, elongate, trigonal to pseudohexagonal prisms of euhedral lizardite with an average size of 0.3 mm × 0.3 mm ×0.7 mm and a strongly defined (001) cleavage. The lizardite grains have both a strong shape and crystallographic preferred orientation, with elongation of grains along the [001] axis approximately parallel to the vein wall. The lizardite has a structural formula of approximately Mg2.79 Fe0.16 Al0.07 Si1.93 Al0.09 O5 (OH)3.90, and chemical compositions are generally homogeneous throughout (Viti and Mellini, 1997). The lizardite grains are surrounded by a fibrous matrix of chrysotile that comprises between 5 % and 20 % of vein samples (Mellini and Viti, 1994).
2.1.2 Thin section and grain mount preparation
In order to analyse grains with a wide range of crystallographic orientations, two thin sections were prepared from a sample of Monte Fico lizardite vein, cut approximately perpendicular (MF01⊥, Fig. 1a) and parallel (MF01‖, Fig. 1b) to the elongation direction of lizardite grains in the sample. In addition, two epoxy resin grain mounts were prepared: oriented grain mount (OGM, Fig. 2a–b) and random grain mount (RGM, Fig. 2c–d). To do this, a ∼ 3 cm3 volume of vein was gently crushed using a hammer to separate individual grains. Grains were cleaned in an ultrasonic bath and individually picked under a stereomicroscope. A wooden toothpick and tweezers were used to abrasively remove chrysotile from the exterior of each individual grain, followed by a final ultrasonic bath. Individual grains are typically either elongated with visible (001) cleavage perpendicular to grain elongation (Fig. 2e–f) or flat plates with faces corresponding to (001) cleavage (Fig. 2g).

Figure 1Crossed-polarised light photomontages of samples of Monte Fico lizardite vein (thin section thickness of ∼ 70 µm). (a) Thin section MF01⊥ cut approximately perpendicular to the elongation direction of lizardite grains showing locations of maps 1 and 2 in Figs. 3 and 4. (b) Thin section MF01‖ cut approximately parallel to the elongation direction of lizardite showing location of map 3 in Fig. 5.
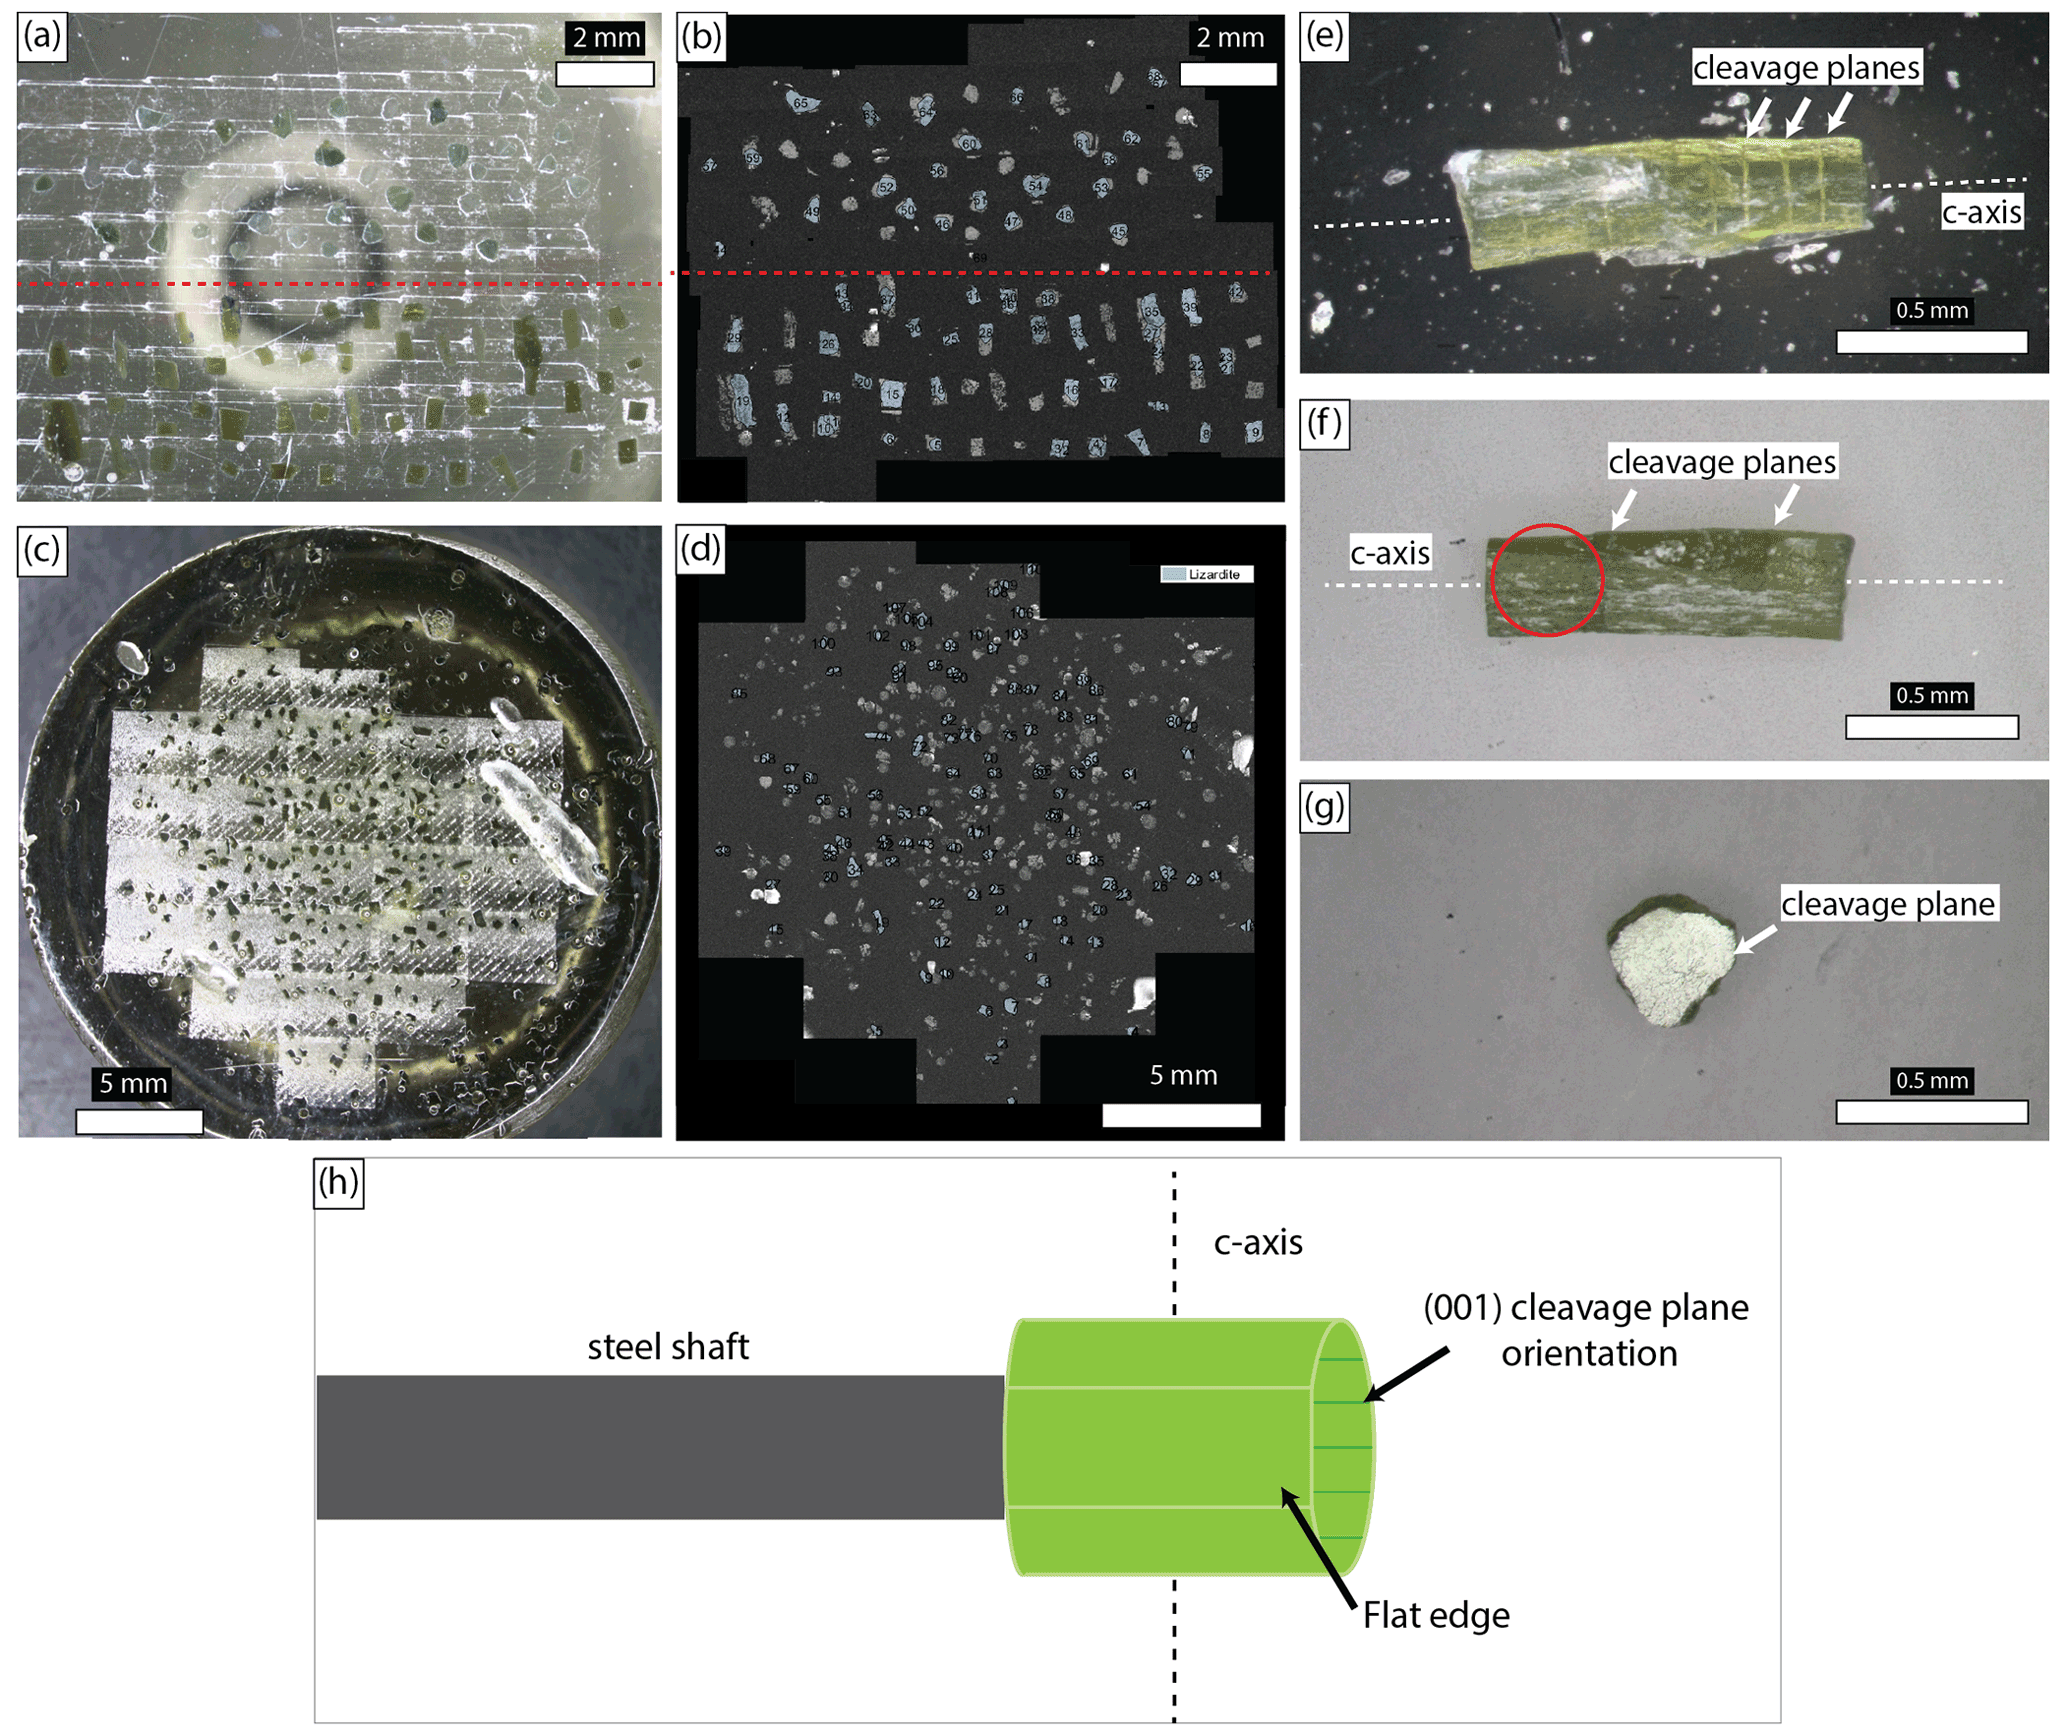
Figure 2Single crystal epoxy resin grain mounts and single grains used for spindle study. (a) Photograph of oriented grain mount (OGM). (b) Forescatter detector scanning electron microscope (SEM) image of OGM with successfully indexed grains identified in blue. (c) Photograph of random grain mount (RGM). (d) Forescatter detector SEM image of RGM with successfully indexed grains identified in blue. Panels (e) and (f) show single elongate grains with (001) cleavage planes (marked by white arrows) perpendicular to the grain elongation. The red circle identifies the approximate location of the core drilled for single-crystal spindle study. (g) Flat platy grain showing face corresponding to (001) cleavage plane. (h) Schematic illustration of the single crystal grain spindle mount (SCGSM).
In the OGM (Fig. 2a–b), 45 grains were placed with their long grain elongation axis parallel to the grain mount surface, and 45 grains were placed with their (001) cleavage planes parallel to the grain mount surface. The RGM (Fig. 2c–d) was made by “sprinkling” a small quantity of grains (∼ 100) onto the surface of the grain mount. Both the thin sections and the grain mounts were made using a low-fluorescence epoxy (EpoFix cold-setting embedding resin, Struers Ltd., Copenhagen, Denmark). Thin sections and grain mounts were progressively polished with 3 and 1 µm polycrystalline diamond pastes (Struers) followed by further chemical–mechanical polishing on a rotational polisher for ∼ 20 min with a colloidal silica suspension (OP-U NonDry, 0.04 µm, Struers).
2.1.3 Single crystal grain spindle mount (SCGSM)
In order to measure the Raman spectrum of a single grain of lizardite as a function of the inclination of the c-axis with respect to the incident laser, an oriented single crystal grain spindle mount (SCGSM) was prepared. Firstly, select grains were mounted using the same method as described above for the OGM. EBSD was then performed to determine the crystallographic orientation of the embedded grains, and a grain with a c-axis inclination of approximately 90∘ (89.9∘) with respect to the surface of the grain mount was selected (grain shown in Fig. 2f). A 300 µm interior diameter electroplated hollow diamond drill (UKAM Industrial Superhard Tools, Santa Clarita, California, USA) was used to extract a cylindrical core from this single grain. The grain was drilled such that the edge of the drill core intersected the crystal edge, creating one flat edge along the cylinder circumference to provide a reference for the crystallographic orientation of the single-crystal core. This results in a single-crystal cylindrical core with the c-axis perpendicular to the rotational axis of the cylinder. The cylindrical core was fixed to a 0.25 mm steel shaft using cyanoacrylate glue (Fig. 2h). This shaft was mounted in a custom-built spindle stage powered by a stepper motor (NEMA 17HS4401 Bipolar Stepper Motor, 200 steps per revolution) driven in micro-stepping mode (eight micro-steps per full step) and controlled by an Arduino microcontroller, resulting in an angular resolution of 0.225∘ per step, allowing the cylindrical core to be precisely rotated under the Raman microscope. Raman spectra were measured at every 10∘ of rotation, with 0∘ corresponding to a measurement with the incident laser normal to the (001) plane (a relative c-axis inclination of 0∘) and 90∘ corresponding to a measurement with the incident laser perpendicular to the (001) plane (a relative c-axis inclination of 90∘).
2.1.4 Ribbon-textured lizardite serpentinite sample
To demonstrate our technique on a naturally deformed lizardite-rich serpentinite, we selected a deformed sample with a strong crystallographic fabric dominantly containing lizardite. The sample (Sample CV7a; Fig. 10) is a ribbon-textured lizardite serpentinite collected from a retrograde serpentinite outcrop in eastern Elba Island, Italy (close to Rio nell'Elba), and described previously by Viti and Mellini (1998) and Viti et al. (2018). The sample was cut perpendicular to a weak foliation and parallel to lineations, and a thin section was prepared as described in Sect. 2.1.1.
2.2 Electron backscatter diffraction (EBSD) analysis
EBSD data were acquired with an HKL Synergy Integrated EDS/EBSD system (Oxford Instruments) using a Zeiss Sigma field-emission gun scanning electron microscope in the Otago Micro and Nanoscale Imaging (OMNI) facility at the University of Otago, New Zealand. Data were collected with a step size of 10 µm at an accelerating voltage of 30 kV, an aperture of 300 µm, and a ∼70 nA beam current. EBSD maps were indexed as lizardite-1T with an average indexing rate of ∼45 % for the whole map. Individual maps were montaged using Oxford Instruments' AZtec software and subsequently processed using the MTEX toolbox for MATLAB (Hielscher and Schaeben, 2008).
To improve the quality of the analysed data, indexed pixels with a mean angular deviation (MAD, defined as the angular deviation between the observed and simulated lattice plane orientation) larger than 1∘ were deleted from the dataset. Grains were reconstructed following the procedure described by Bachmann et al. (2011), and grain boundaries were defined as having a misorientation angle of ≥ 10∘ between neighbouring pixels. Lizardite grains comprising fewer than 10 pixels were deleted. Additionally, grains with notable intra-granular distortion were not considered because of the intra-grain spread of c-axis orientations. Between 23 and 46 internally uniform lizardite grains were identified in each of the three EBSD thin section maps (total of 125 grains), as well as 33 and 44 grains from OGM and RGM grain mounts, respectively. For each selected grain, the inclinations of the c axes (in an angle range of 0–90∘) with respect to the vertical (z vector) were extracted for comparison with Raman spectroscopy data.
2.3 Raman spectroscopy mapping
Raman mapping was performed in the chemistry department of the University of Otago on a WITec alpha300 R confocal Raman microscopy system (WITec GmbH, Ulm, Germany) equipped with a thermoelectrically cooled charge-coupled device (CCD) detector (Andor iDus 401, Oxford Instruments, Abingdon, UK). A 1200 grooves per millimetre grating was used, resulting in a spectral resolution of 1 cm−1. A 532 nm laser (Coherent, Santa Clara, California) at 50 mW power that was linearly polarised in the x stage dimension was used. No analyser was used in the reported measurements; however there were no significant differences in Raman spectra with or without the analyser in place. Both 10× (N.A. 0.1, Zeiss) and 100× objectives (N.A. 0.9, Zeiss) were used for measurements, with the ability to achieve spatial resolutions of approximately 1 µm and 370 nm, respectively, when the step size is optimised (Rooney et al., 2018). The system was calibrated with a monocrystalline silicon wafer before each session by verifying the position and intensity of the Si band at 520.6 cm−1. Control of the piezo-driven nano-positioning xy-stage movement and data acquisition were performed using the WITec Control Plus software. Spectra were collected in the OH-stretching region of lizardite between 3540 and 3740 cm−1. The 10× objective with a step size of 10 µm was used for Raman mapping of thin sections (MF01⊥ and MF01‖; Fig. 1) and grain mounts (Fig. 2). The 10× objective was used to collect data during the spindle stage study, although the 100× objective produced equivalent results. The 100× objective with a step size of 1 µm was used to map sample CV7a. Raman maps 1 and 2 were made on thin section MF01⊥ with dimensions of 5500 µm by 4000 µm (550×400 spectra, total of 220 000) and 6670 µm by 3690 µm (667×369 spectra, total of 246 123). Raman map 3 made on thin section MF01‖ has dimensions of 5500 µm by 4000 µm (550×400 spectra, total of 220 000). An integration time of 1 s per point was used, resulting in a map acquisition time of between 62 and 70 h per map. Raman mapping was performed on each grain in the RGM and OGM samples individually due to the large space between grains and the tendency for the epoxy to burn under the excitation laser.
Raman data processing
Raw Raman data were processed and analysed using WITec Project Plus software, PeakFit v4.12, and MATLAB. In Project Plus, Raman spectra were first filtered to remove spikes due to the incidence of cosmic rays on the CCD camera, followed by the application of a dynamic background subtraction algorithm to remove contributions from any fluorescence signal and elevated background. For the three Raman maps, suitable grains were first identified in the EBSD data (see above). The Raman maps were examined to confirm that the grains selected from EBSD mapping displayed a uniform and consistent Raman spectra throughout. In Project Plus, a mask was first created by drawing within the boundaries of the select grains. The “average” function was used to produce an average spectrum for each selected grain based on this mask. The data were imported into PeakFit v4.12, and the main band was fit using the combined Gaussian–Lorentzian amplitude function which has the widths of the peak at the base and the full-width at half maximum (FWHM) as user-refinable parameters. The maximum of this fitted function was taken as the position of the main band.
Raman maps of the spatial distribution of the OH-stretching mode's band position for lizardite were made by using the position of the maximum intensity filter in Project Plus. The regions corresponding to chrysotile were identified using the basis analysis function. The data were then imported into MATLAB, and colour maps were plotted using a perceptually uniform colour map (inferno colour map; MPL Colour Maps: https://bids.github.io/colormap, last access: 9 May 2022).
2.4 Transmission electron microscopy (TEM)
To provide further information on the grain-scale microstructures of the naturally deformed lizardite serpentinite (sample CV7a), we investigated the sample using transmission electron microscopy. TEM was performed with a JEOL JEM-2010 microscope (JEOL Ltd., Tokyo, Japan) at the University of Siena in Italy. The TEM was operated at 200 kV with a LaB6 source and ultra-high-resolution pole pieces, resulting in a point resolution of 0.19 nm. Samples were prepared for TEM from polished petrographic thin sections made using a Canada balsam adhesive. TEM grids were extracted from the sections and mounted on a 3 mm Cu grid with a central hole 800 µm in diameter. Samples were milled to electron transparency using Ar+ ion milling with a PIPS dual ion mill (Gatan Inc., United States).
3.1 EBSD and Raman mapping of thin sections
The microstructural characteristics of the three analysed map areas in thin sections MF01⊥ and MF01‖ (Fig. 1), including the results of EBSD and Raman analyses, are shown in Figs. 3–5 and described in the following two paragraphs.
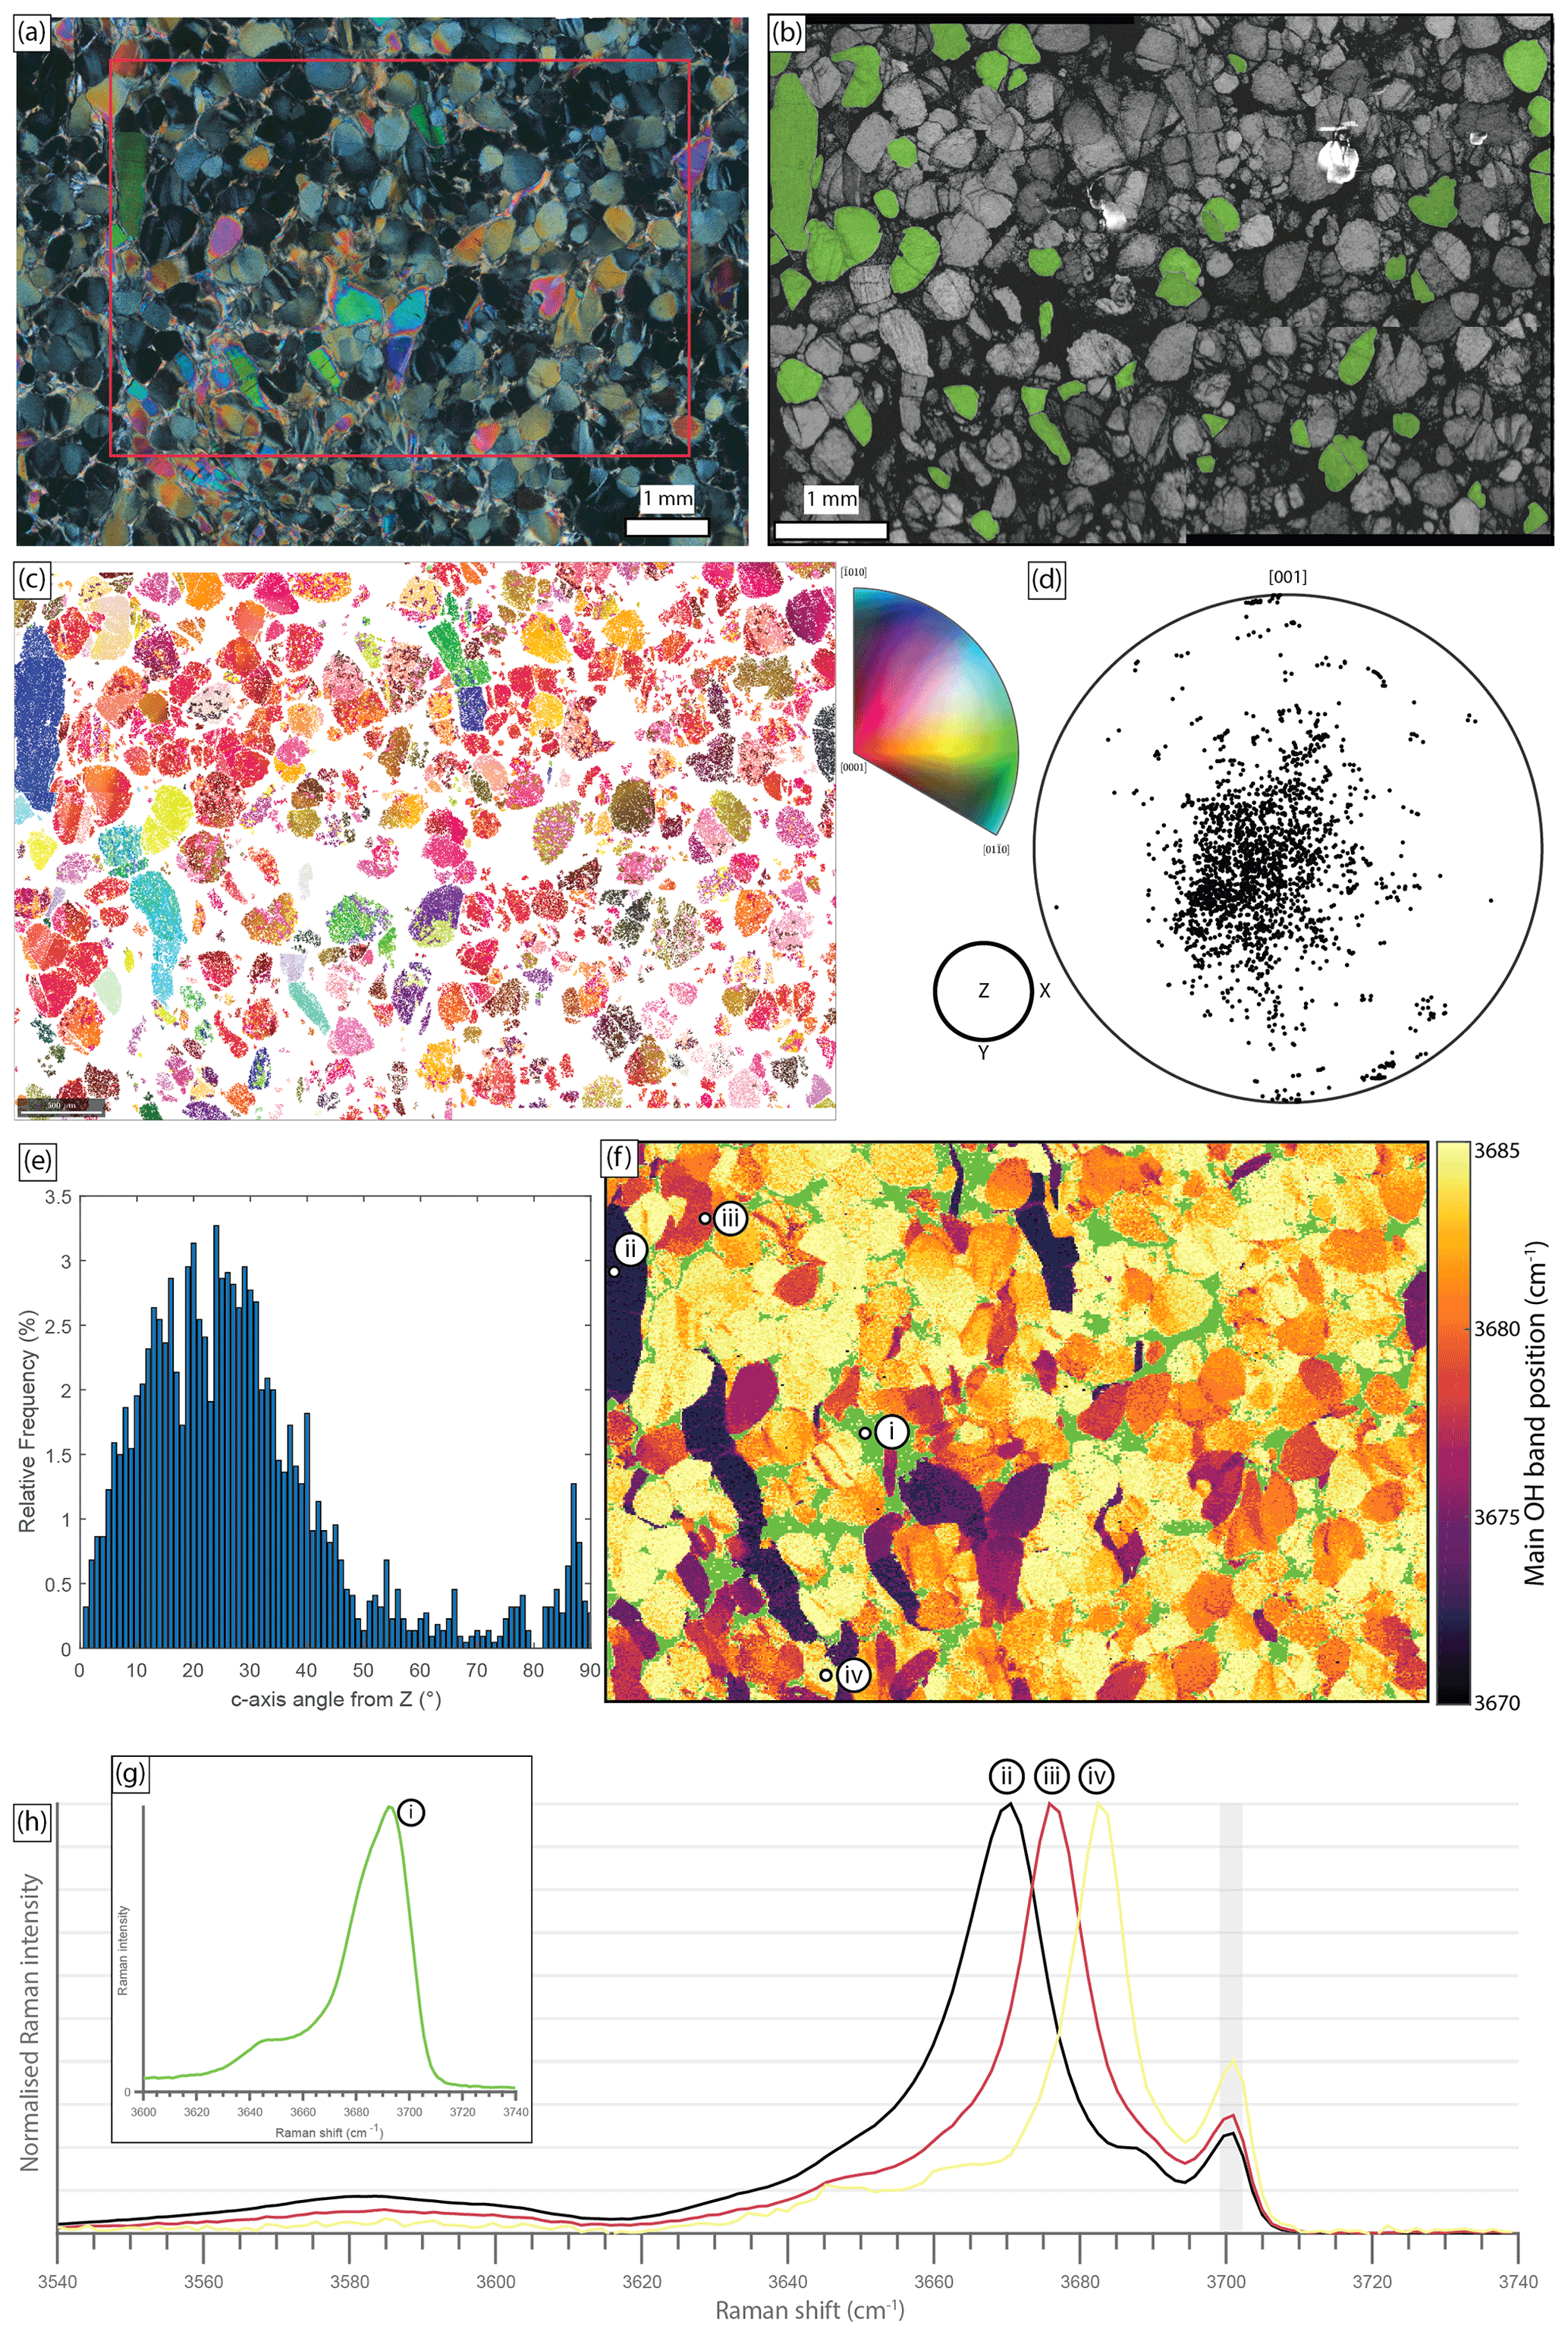
Figure 3EBSD and Raman map 1 on thin section MF01⊥. (a) Cross-polarised light photomicrograph with mapped area in the red box. (b) Image quality band contrast map from EBSD analysis. (c) Inverse pole figure (IPFZ) map from EBSD analysis coloured with the inverse pole figure scheme shown on the right. (d) Pole figure (lower-hemisphere equal area, one point per grain) of [001] orientations (c-axis). (e) Histogram of the relative frequency of the c-axis angle from z for each grain. (f) Raman-based map displaying the position of the main OH-stretching band of lizardite. Green areas represent chrysotile-dominated matrix. (g) Representative spectrum of the chrysotile matrix (corresponding to point i in panel f). (h) Select spectra from the Raman map for grains with c-axis close to the plane of section (ii), intermediate in orientation (iii), and with c-axis close to normal relative to the plane of section (iv). The light grey rectangle highlights the secondary peak at 3701 cm−1 observed in all spectra.
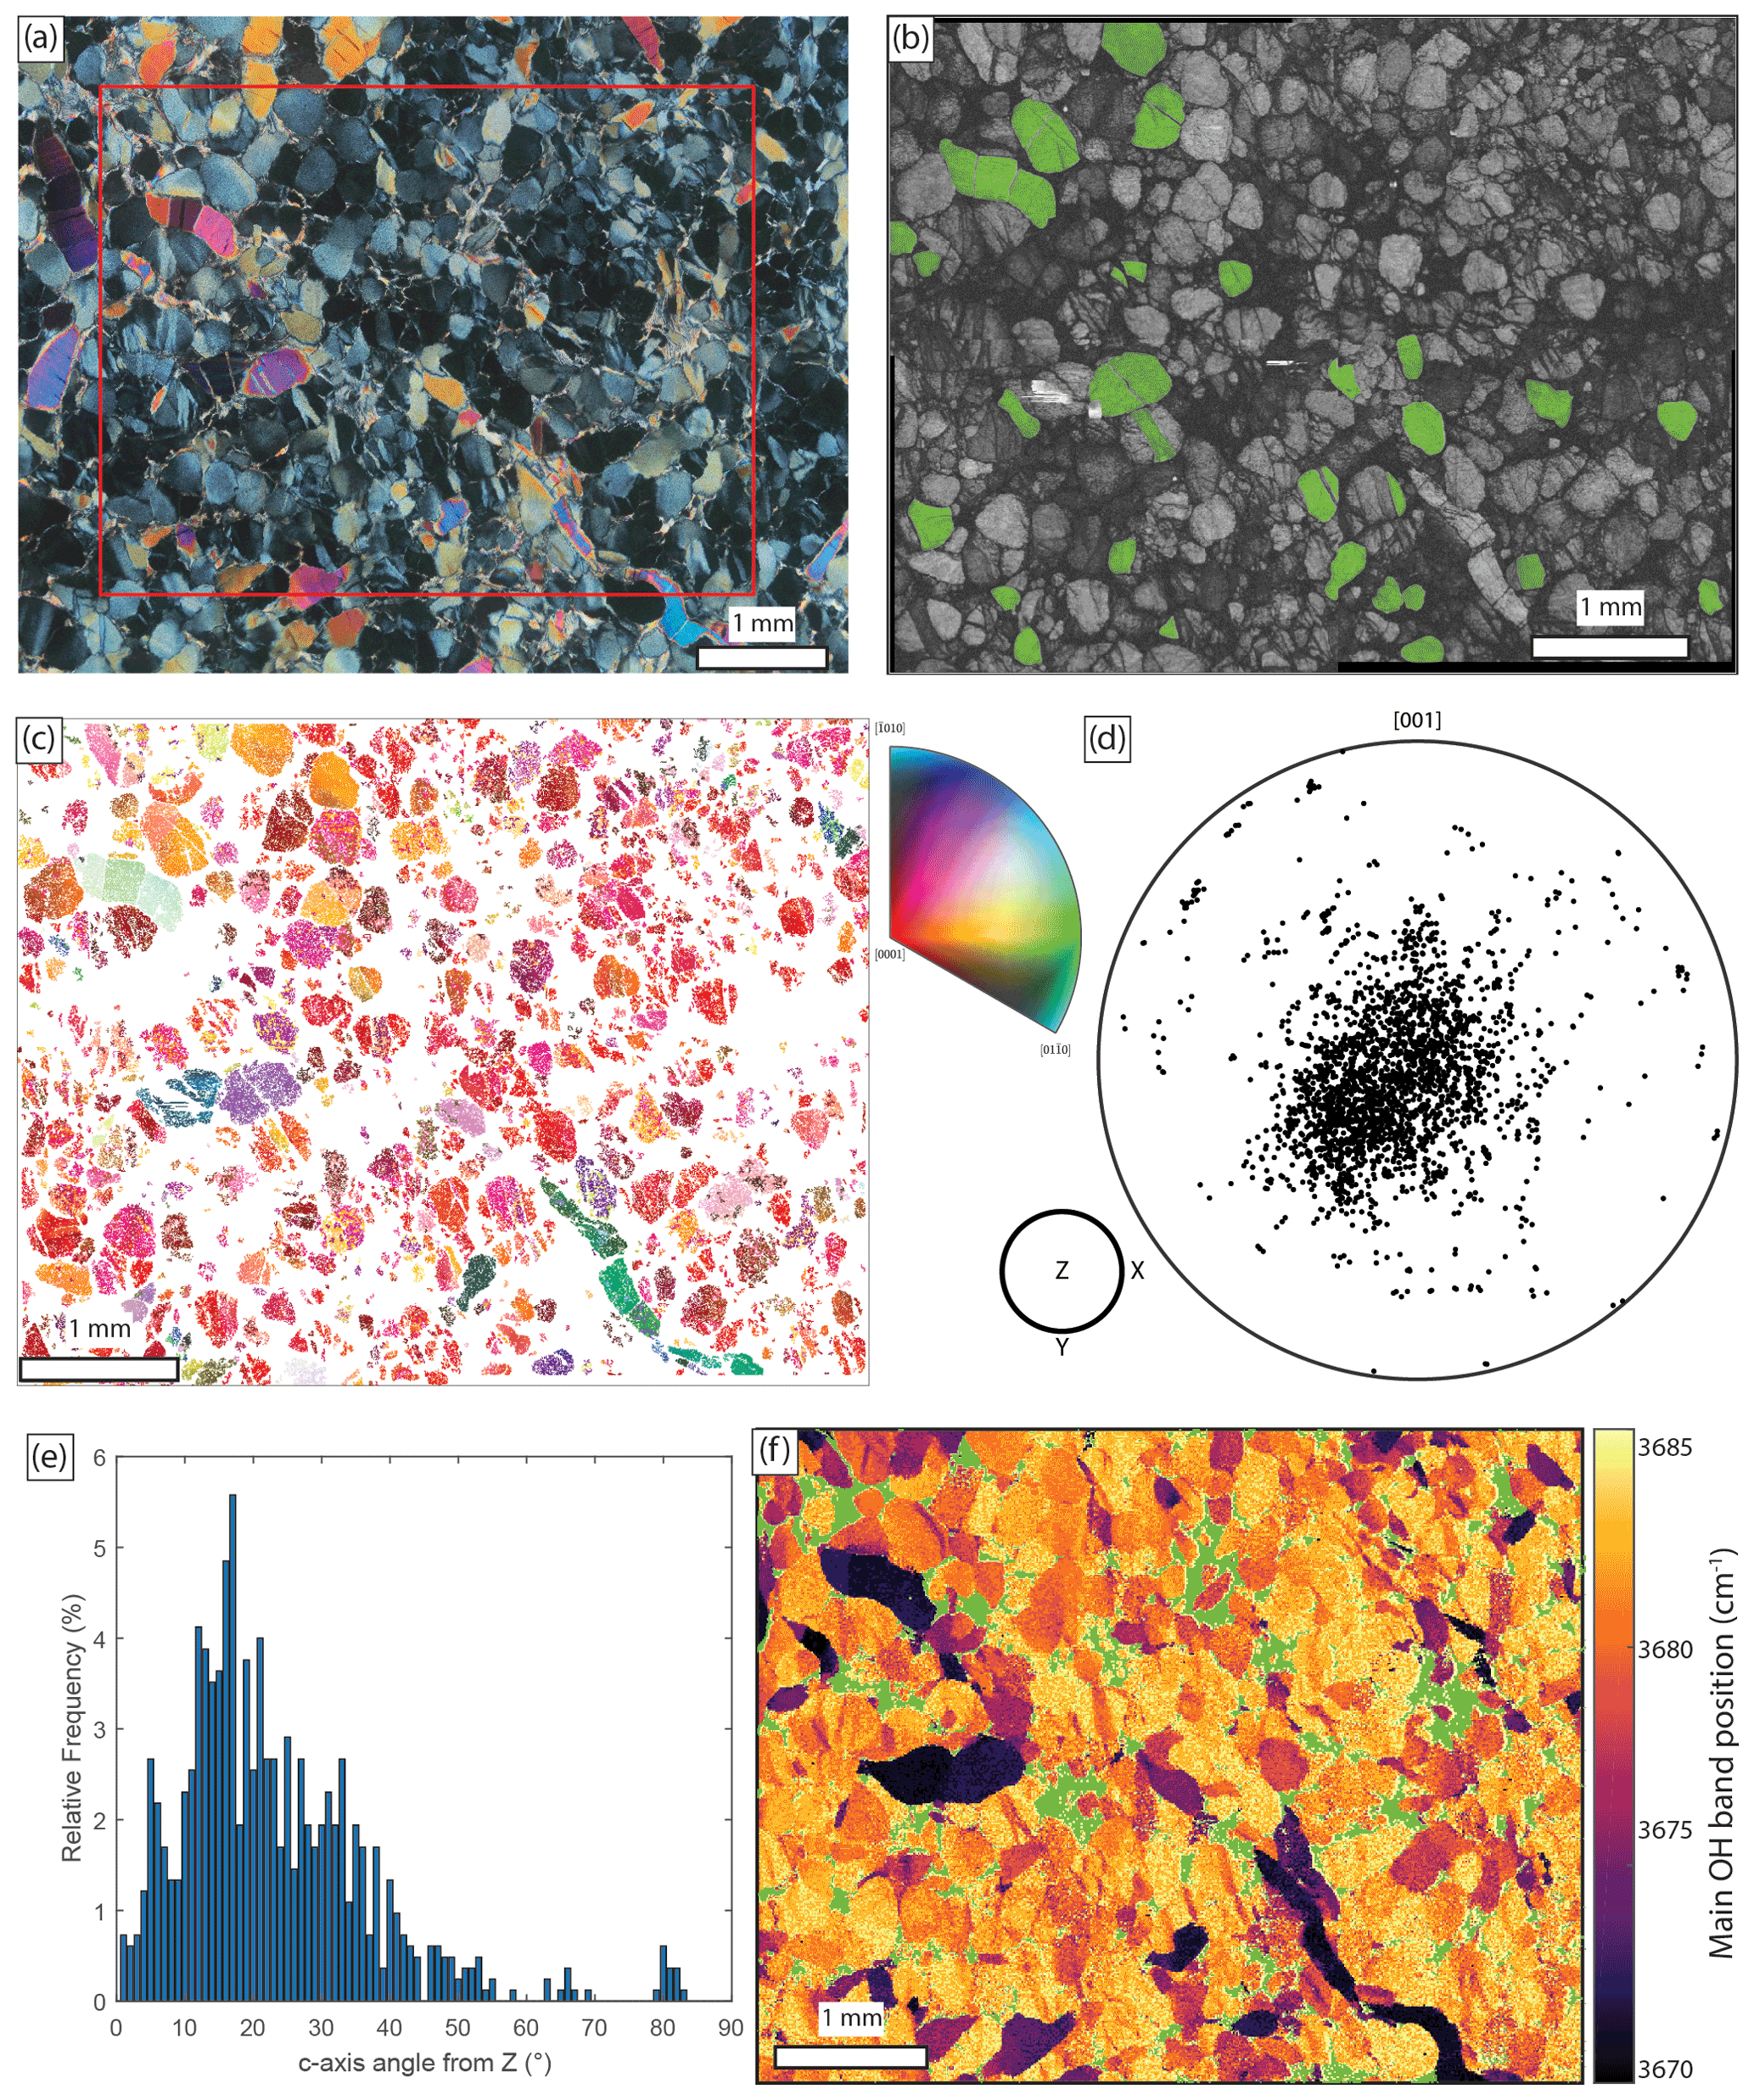
Figure 4EBSD and Raman map 2 on thin section MF01⊥. (a) Cross-polarised light photomicrograph with mapped area in the red box. (b) Image quality band contrast map with selected grains from the EBSD analysis highlighted in green. (c) Inverse pole figure (IPFZ) map coloured with the inverse pole figure scheme shown on the right. (d) Pole figures (lower-hemisphere equal area, one point per grain) of [001] orientation (c-axis). (e) Histogram of the relative frequency of the c-axis angle from z for each grain. (f) Raman-based map displaying the position of the main OH-stretching band of lizardite. Green areas represent chrysotile-dominated matrix.
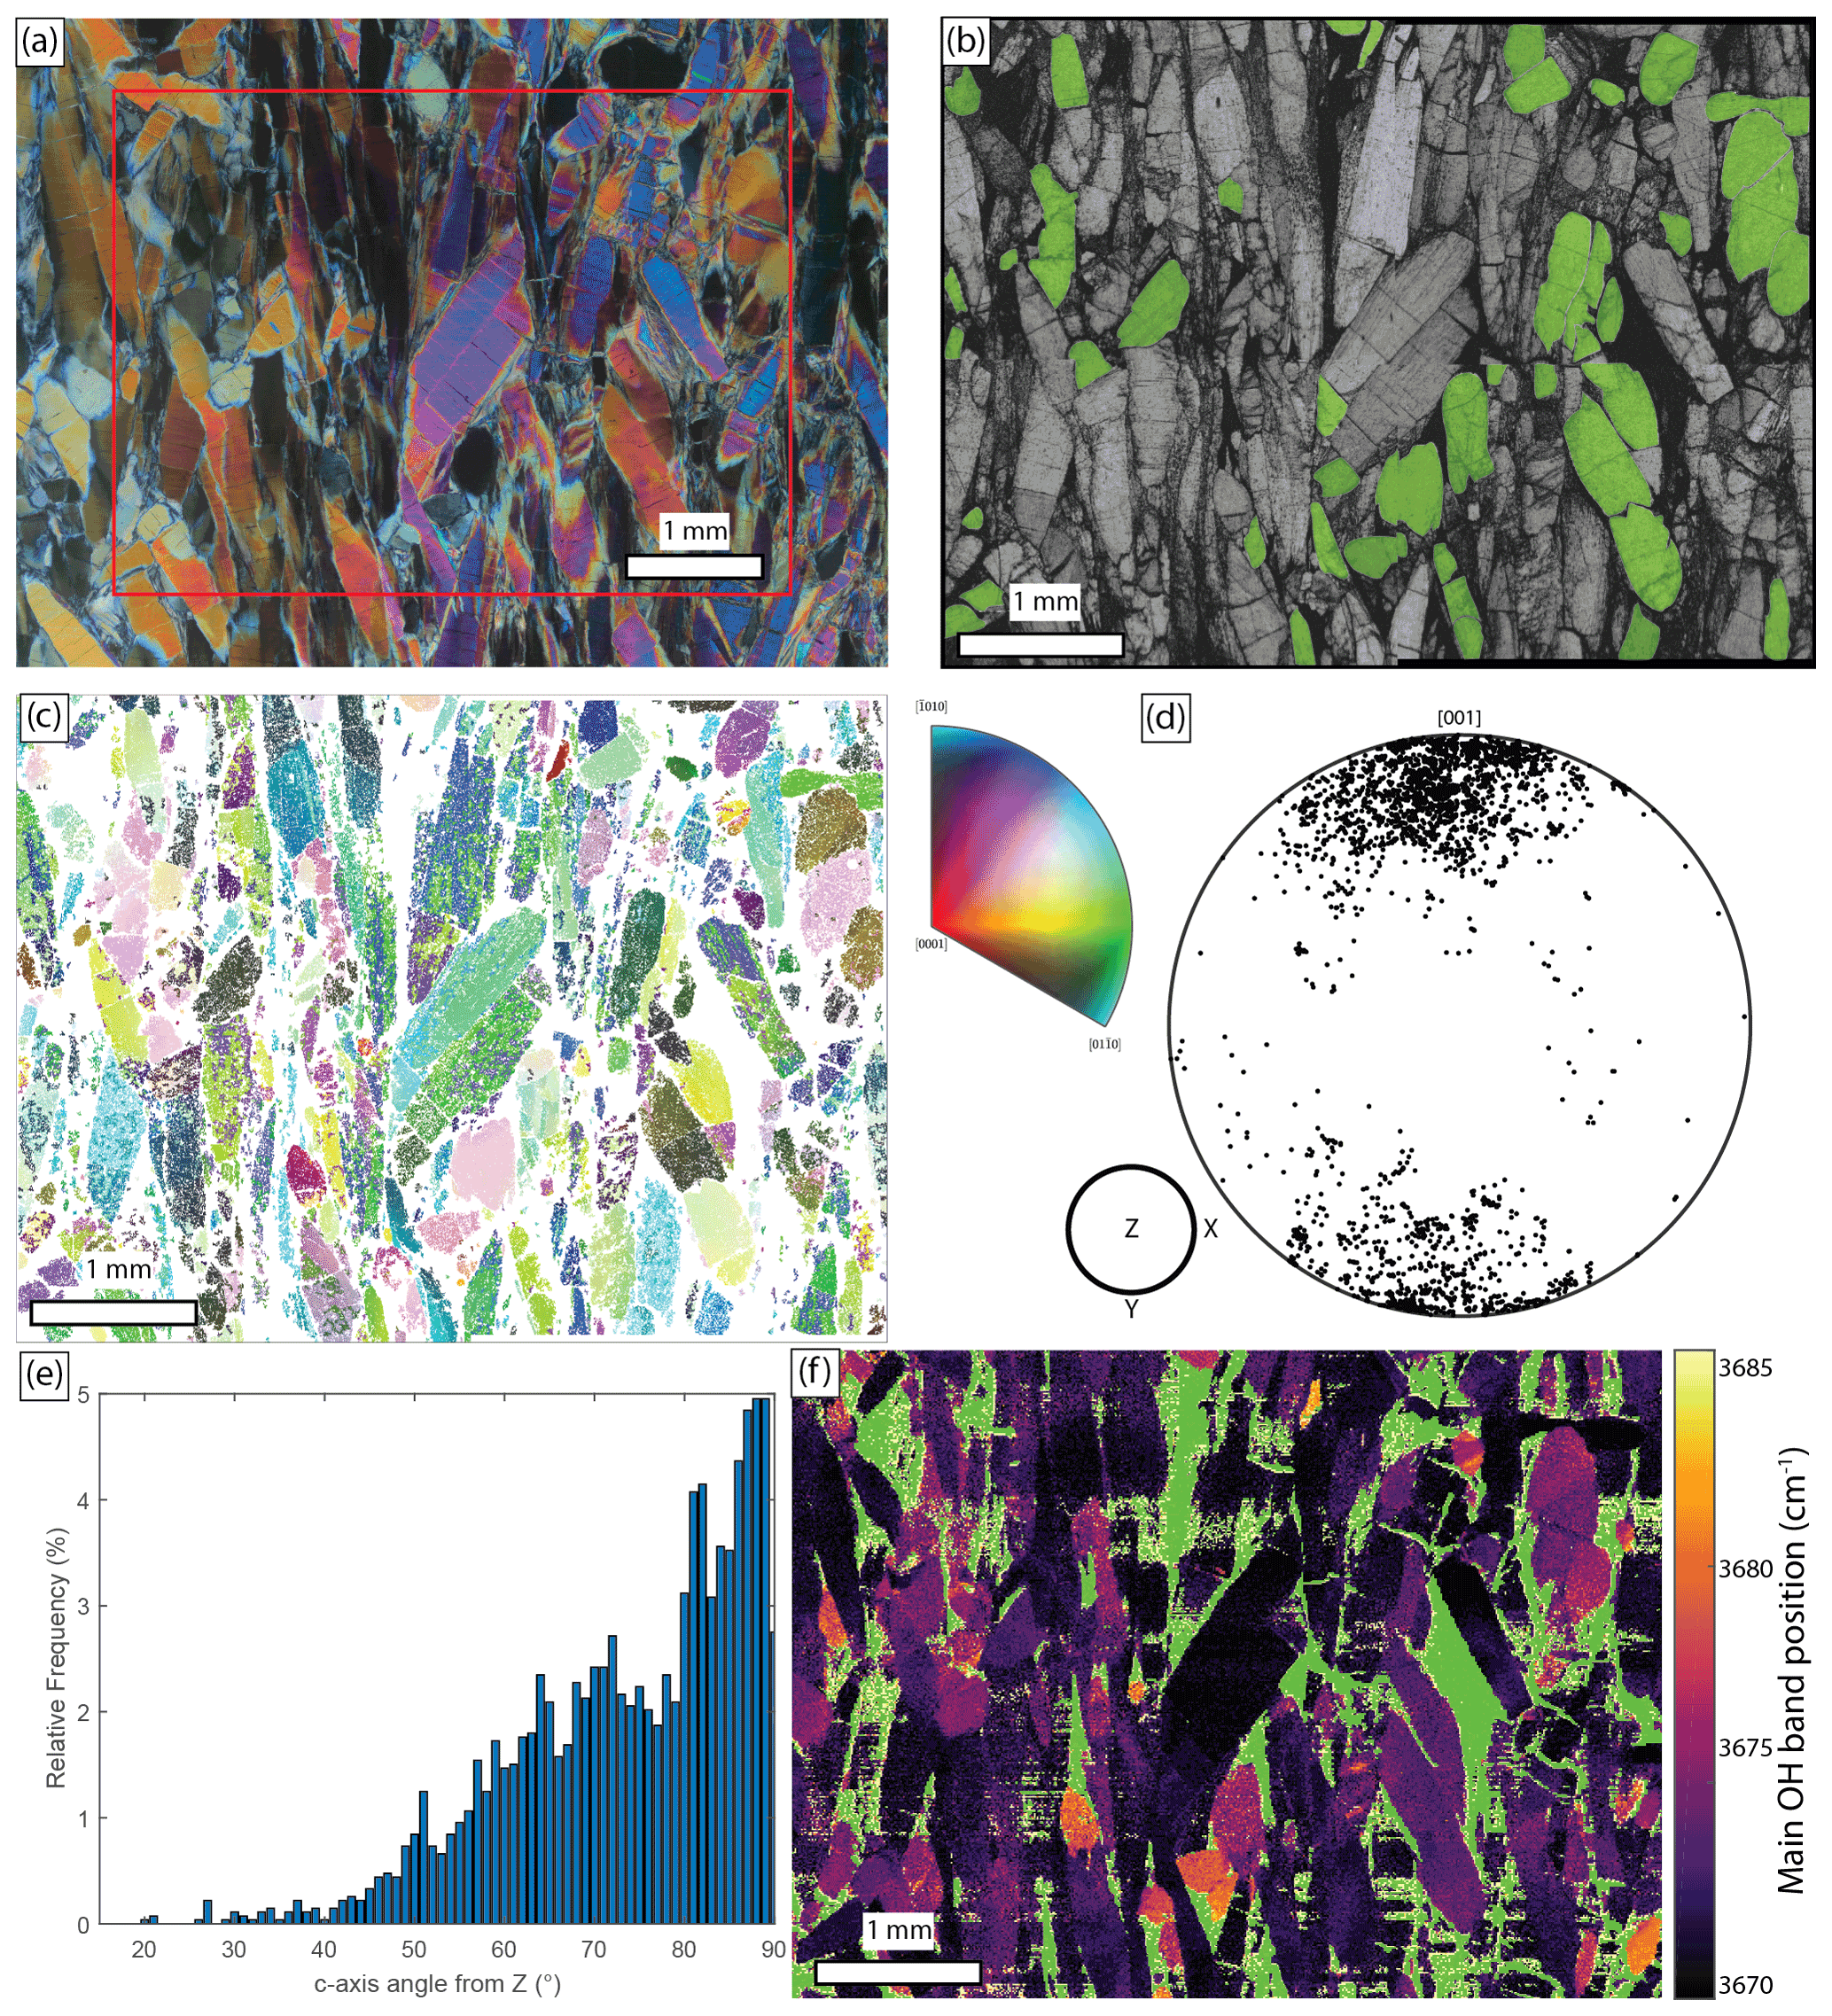
Figure 5EBSD and Raman map 3 on thin section MF01b. (a) Cross-polarised light photomicrograph with mapped area in the red box. (b) Image quality band contrast map with selected grain from the EBSD analysis highlighted in green. (c) Inverse pole figure (IPFZ) map coloured with the inverse pole figure scheme shown on the right. (d) Pole figures (lower-hemisphere equal area, one point per grain) of [001] orientations (c-axis). (e) Histogram of the relative frequency of the c-axis angle from z for each grain. (f) Raman-based map displaying the position of the main OH-stretching band of lizardite. Green areas represent chrysotile-dominated matrix.
Maps 1 and 2 show largely equant, sub-rounded crystal sections, displaying the basal plane close to perpendicular to the crystallographic c-axis (Figs. 3a, 4a). Map 3 shows elongate crystal sections close to parallel to the c-axis (Fig. 5a). Band contrast maps from EBSD analysis show high rates of indexing and high-quality patterns for lizardite grains, while the intergranular matrix that is mostly composed of chrysotile does not produce patterns at all (dark in Figs. 3b, 4b, 5b). As expected from the strong alignment of the lizardite crystals, EBSD mapping reveals a relatively strong crystallographic preferred orientation (CPO) of lizardite (Figs. 3d, 4d, 5d). Grain [001] axes are clustered at large angles to the thin section surface in maps 1 and 2 (sub-parallel to the z direction, Figs. 3c–e, 4c–e) and lie approximately within the plane of the thin section in map 3 (sub-parallel to the y direction, Fig. 5c–e). In all three maps there is substantial spread in the c-axis orientations caused by the spread in grain-shape preferred orientations visible in the microstructural images.
Raman spectroscopy mapping was performed across the same three regions used for EBSD mapping, with spectra recorded in the OH-stretching region between 3540 and 3740 cm−1. When plotted as false-colour images based on the position of the main OH-stretching band, the maps highlight variation in the position of the main band, which is variable from grain to grain but generally quite consistent within single grains (Figs. 3f, 4f, 5f). The spectra of the intergranular matrix correspond to chrysotile (e.g. “i” in Fig. 3f and g). Elongate grains, which broadly correspond to grains for which the c-axis lies close to the plane of the section, display a main band shifted to lower wavenumbers near 3670 cm−1 (e.g. “ii” in Fig. 3f and h). Equant, rounded grains, which correspond to grains for which the c-axis is closer to normal relative to the plane of the section, display a main band at a higher wavenumber approaching 3684.5 cm−1 (e.g. “iv” in Fig. 3f and h). Grains of intermediate c-axis orientation display a main band located between 3670 and 3684.5 cm−1 (e.g. “iii” in Fig. 3f and h). In un-normalised spectra where the main band occurred at lower frequencies, the Raman intensity was approximately 1 order of magnitude greater than for spectra in which the main band manifested at higher frequencies (Fig. 6a). In all spectra, a secondary peak occurs at ∼ 3701 cm−1, which displays an increase in relative intensity for spectra in which the main band was shifted to higher frequencies in the normalised spectra.
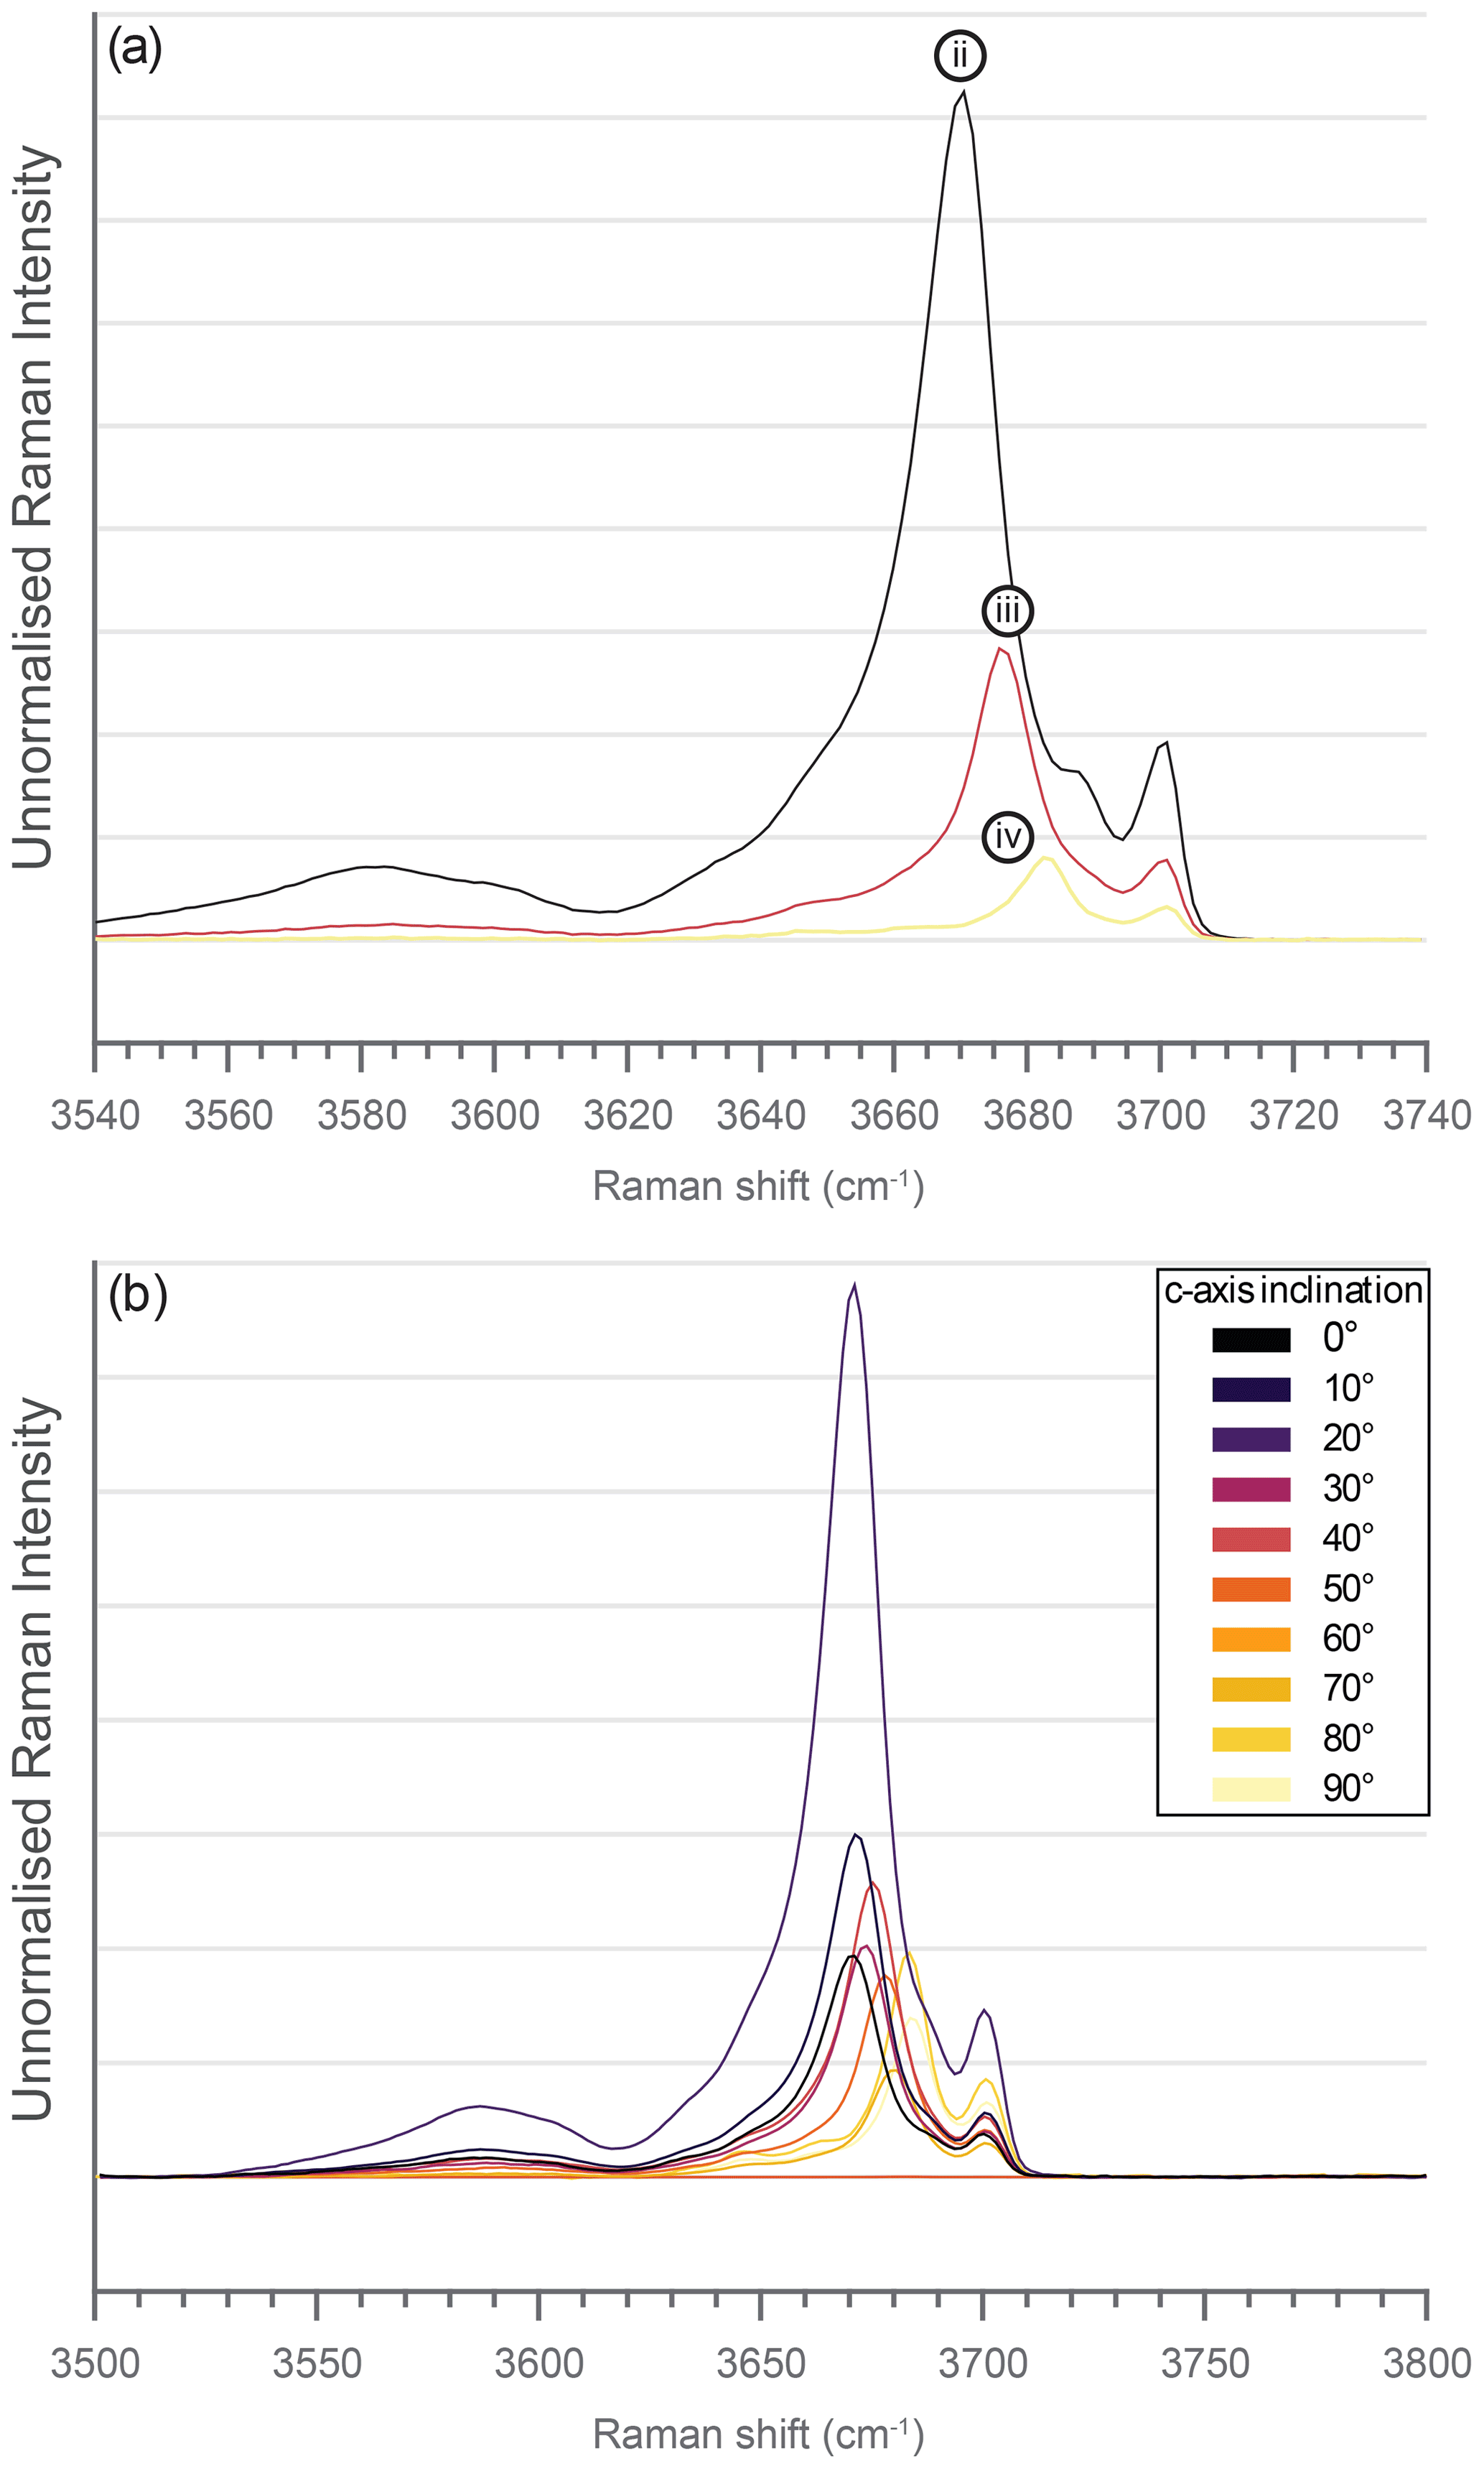
Figure 6(a) Un-normalised spectra of labelled grains from Fig. 3. (b) Un-normalised spectra from SCGSM study.
3.2 EBSD and Raman mapping of the grain mounts
The OGM sample consists of 45 equant, sub-rounded grains with their (001) cleavage planes (the basal plane) approximately parallel to the grain mount surface (top half of Fig. 2a–b) and 45 elongate grains with their c-axis approximately parallel to the grain mount surface (bottom half of Fig. 2a–b). The RGM grain mount consists of a wide range of grain shapes, ranging from sub-rounded to elongate, scattered across the grain mount surface. EBSD mapping of the OGM reveals that the c-axis inclinations of the equant, sub-rounded grains are 0–20∘, and those of the elongate grains are between 70 and 90∘. EBSD mapping of the RGM shows that the c-axis of the grains are between 0 and 90∘, with two population clusters at 0 to 10 and 80 to 90∘, likely due to preferential settling during deposition of the flat surfaces of the equant and elongate lizardite grains during the grain mount preparation. Raman spectroscopy mapping of the grains reveals a similar relationship between the position of main OH-stretching band and the c-axis inclination as noted for the thin section maps in Sect. 3.1.
3.3 Single crystal gain spindle mount Raman study
A normalised plot of spectra collected during rotation of the SCGSM stage shows that for a c-axis inclination of 0∘, the main band of the Raman spectrum occurs at ∼ 3670 cm−1 (Fig. 7). A non-linear increase in the wavenumber position is observed for spectra taken at increasing c-axis inclinations, up to 90∘ where the band occurs at ∼ 3684.5 cm−1. The relative change in wavenumber position of the main band is small for changes in c-axis inclination near the extreme values of 0 and 90∘, and it becomes progressively larger for changes in inclination around 45∘. The secondary peak occurs consistently for all spectra at ∼ 3701 cm−1, which displays a somewhat regular increase in relative intensity for spectra at increasing c-axis inclinations. All spectra display a very broad, flat band at ∼ 3590 cm−1, with a spread of ∼ 200 cm−1. The relative intensity of this band is greatest for lowest c-axis inclinations, with a progressive decrease in intensity for higher c-axis inclinations. Spectra taken for low c-axis orientations (near 0∘) display evidence of a shoulder at ∼ 3688 cm−1, while spectra taken for high c-axis orientations (near 90∘) display possible shoulders at ∼ 3656 and ∼ 3663 cm−1. Un-normalised spectra show that the lowest c-axis inclinations display generally higher relative Raman intensity, decreasing with greater c-axis inclination, but this relationship is not entirely consistent throughout (Fig. 6b).
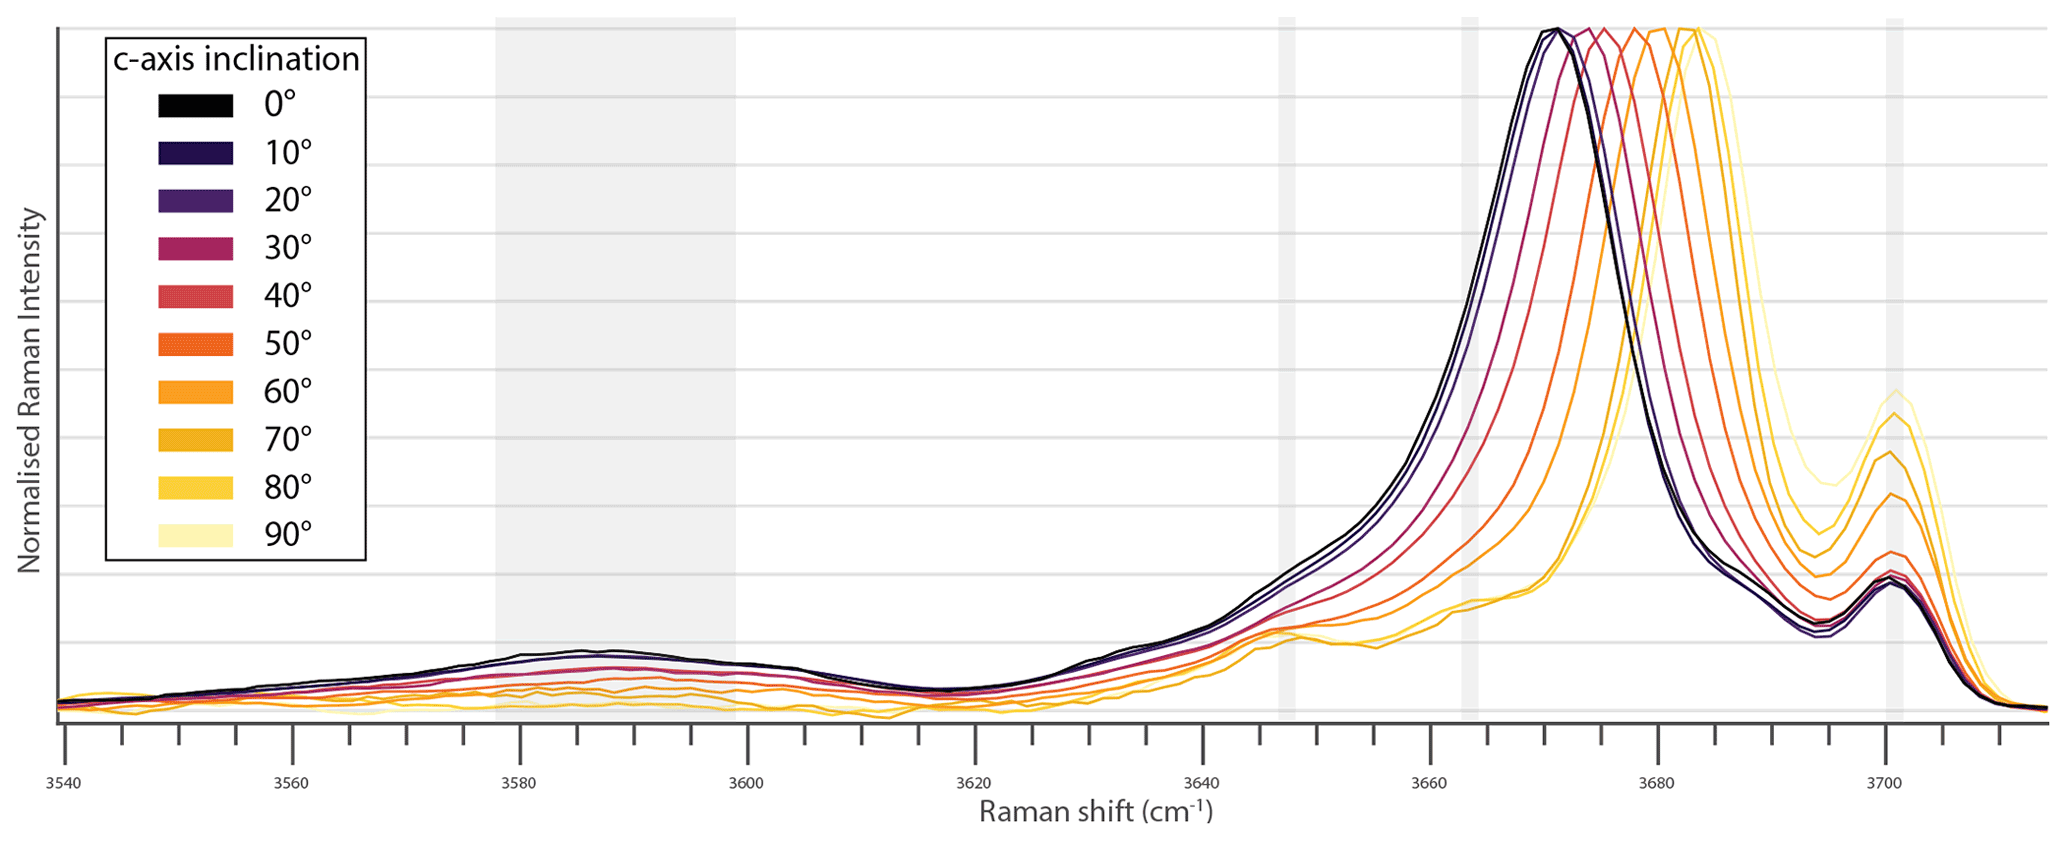
Figure 7Raman spectra as a function of c-axis inclination for the SCGSM study. Grey rectangles highlight bands at 3590, 3688, 3656, and ∼ 3663 cm −1.
4.1 Empirical relationship between Raman OH band position and lizardite c-axis inclination
In order to evaluate the empirical relationship between the c-axis inclination of lizardite and the position of the main band in the OH-stretching region, we plotted the band positions of select grains in Raman maps 1, 2, and 3 (Figs. 3b, 4b, and 5b), as well as grains from the two grain mounts (Fig. 2b and d), against their corresponding crystallographic c-axis orientations obtained from EBSD mapping of the same grains (Figs. 3c, 4c, and 5c). Grains in maps 1, 2, and 3 were selected on the basis that both the Raman and EBSD data were consistent and of high quality with no major distortions to the crystal lattice and no internal grain boundaries. We also added the coupled c-axis inclination and Raman dataset from the SCGSM stage study. Figure 8 shows that the results from thin section, grain mount, and spindle stage datasets are consistent and define a smooth sinusoidal function, with the wavenumber of the main Raman band position in the OH-stretching region decreasing towards higher c-axis inclinations. The relationship between the position of the main lizardite band and the c-axis inclination can be fit by a function of the fourth power of cosine with the following relationship:
where y is the inclination of the c-axis with respect to the vector normal to the observed surface (in degrees), and x is the main band position (in cm−1) in the OH-stretching region.
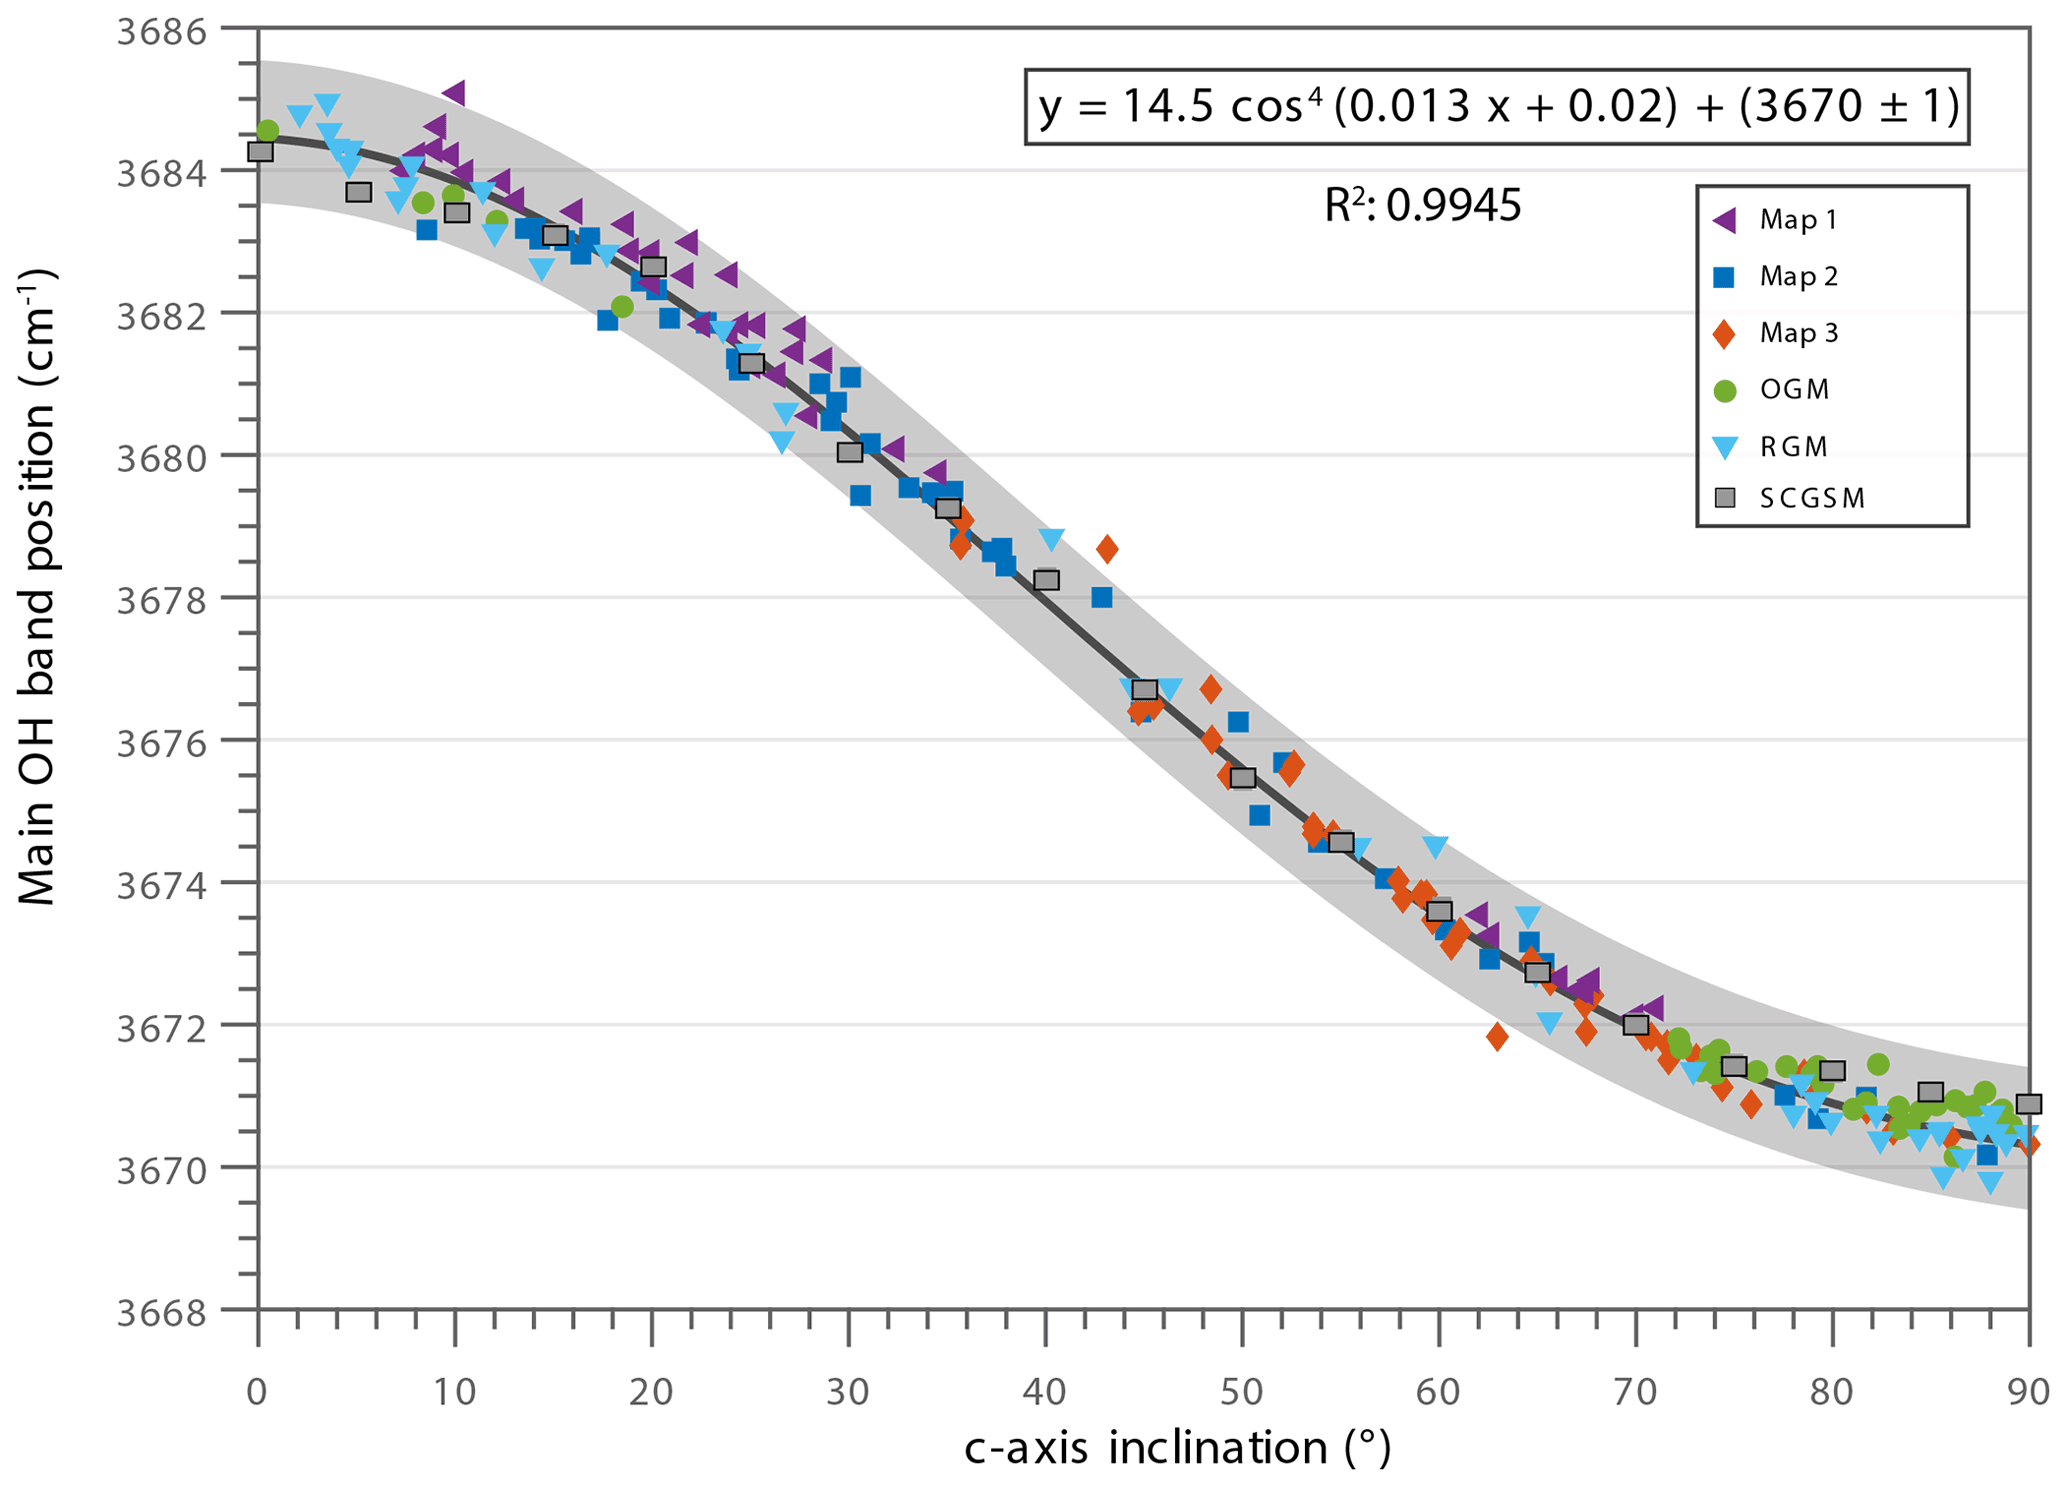
Figure 8Position of the main band in the OH-stretching region vs. the c-axis inclination of the same grains obtained from EBSD data. The grey region shows an envelope around the data two wavenumbers wide and can be considered a conservative estimate of the uncertainty.
This equation suggests that in samples containing lizardite grains that are substantially larger than the spatial resolution of a Raman microscope, the position of the main band in the OH-stretching region could be used as a proxy for the c-axis inclination of lizardite in serpentinites. This is potentially an alternative way of determining the crystallographic fabrics, and derivative geophysical properties, of complex and fine-grained lizardite samples that are often difficult to analyse using EBSD alone (see also Sect. 4.4 below). These results are consistent with the observations of Raman anisotropy in lizardite documented by Compagnoni et al. (2021) and Capitani et al. (2021), who noted the shift in the main band position for grains with c-axis inclinations of approximately 0 and 90∘. However, the results presented here show that the relationship is systematic for grains of all orientations, indicating that there is potential for this technique to be further exploited to reveal fine-scale microstructural characteristics that may not otherwise be possible to study using other techniques.
4.2 Error analysis
The main error in the calibration of this technique is the spectral resolution of the Raman microscopy system, which is on the order of 1 cm−1. The standard error on the mean of the averaged Raman spectra for the grains used in the calibration plot is on the order of 0.1 cm−1, while the standard deviation of the crystallographic orientation for the grains measured by EBSD is on the order of 0.5∘. This means that the inherent error is dominated by the spectral resolution of the Raman system. Given the spread of data, a range of ±1 cm−1 about the fitted sinusoid encapsulates the data well and provides a semi-quantitative estimate of the error of the method (Fig. 8). Given the sinusoidal nature of the relationship, measurements at the extreme ends of the distribution where the curve flattens will be less distinguishable than the central section of the curve where the relationship is close to linear.
4.3 Cause of the Raman anisotropy
Lizardite is a 1 : 1 layer silicate, formed by tetrahedral sheets and brucite-like trioctahedral sheets (Fig. 9). Two different hydroxyl groups can be distinguished: one emerging at the centre of the six-membered tetrahedral rings (inner OH, orange in Fig. 9) and one emerging within the interlayer space (outer OH, black in Fig. 9) that is responsible for the hydrogen bonding with the above layer (Balan et al., 2002, 2021; Rooney et al., 2018). Both O–H bond types are broadly parallel to [001]. The main band of the lizardite Raman spectrum in the OH-vibrational region can be decomposed into multiple components which are attributed to the outer OH stretching modes (Rooney et al., 2018; Fritsch et al., 2021; Auzende et al., 2004). According to recent works, the higher-frequency components correspond to the longitudinal optical (LO) frequency of the modes, while the lower frequency corresponds to the transverse optical (TO) frequency of the modes (Balan et al., 2002, 2021).
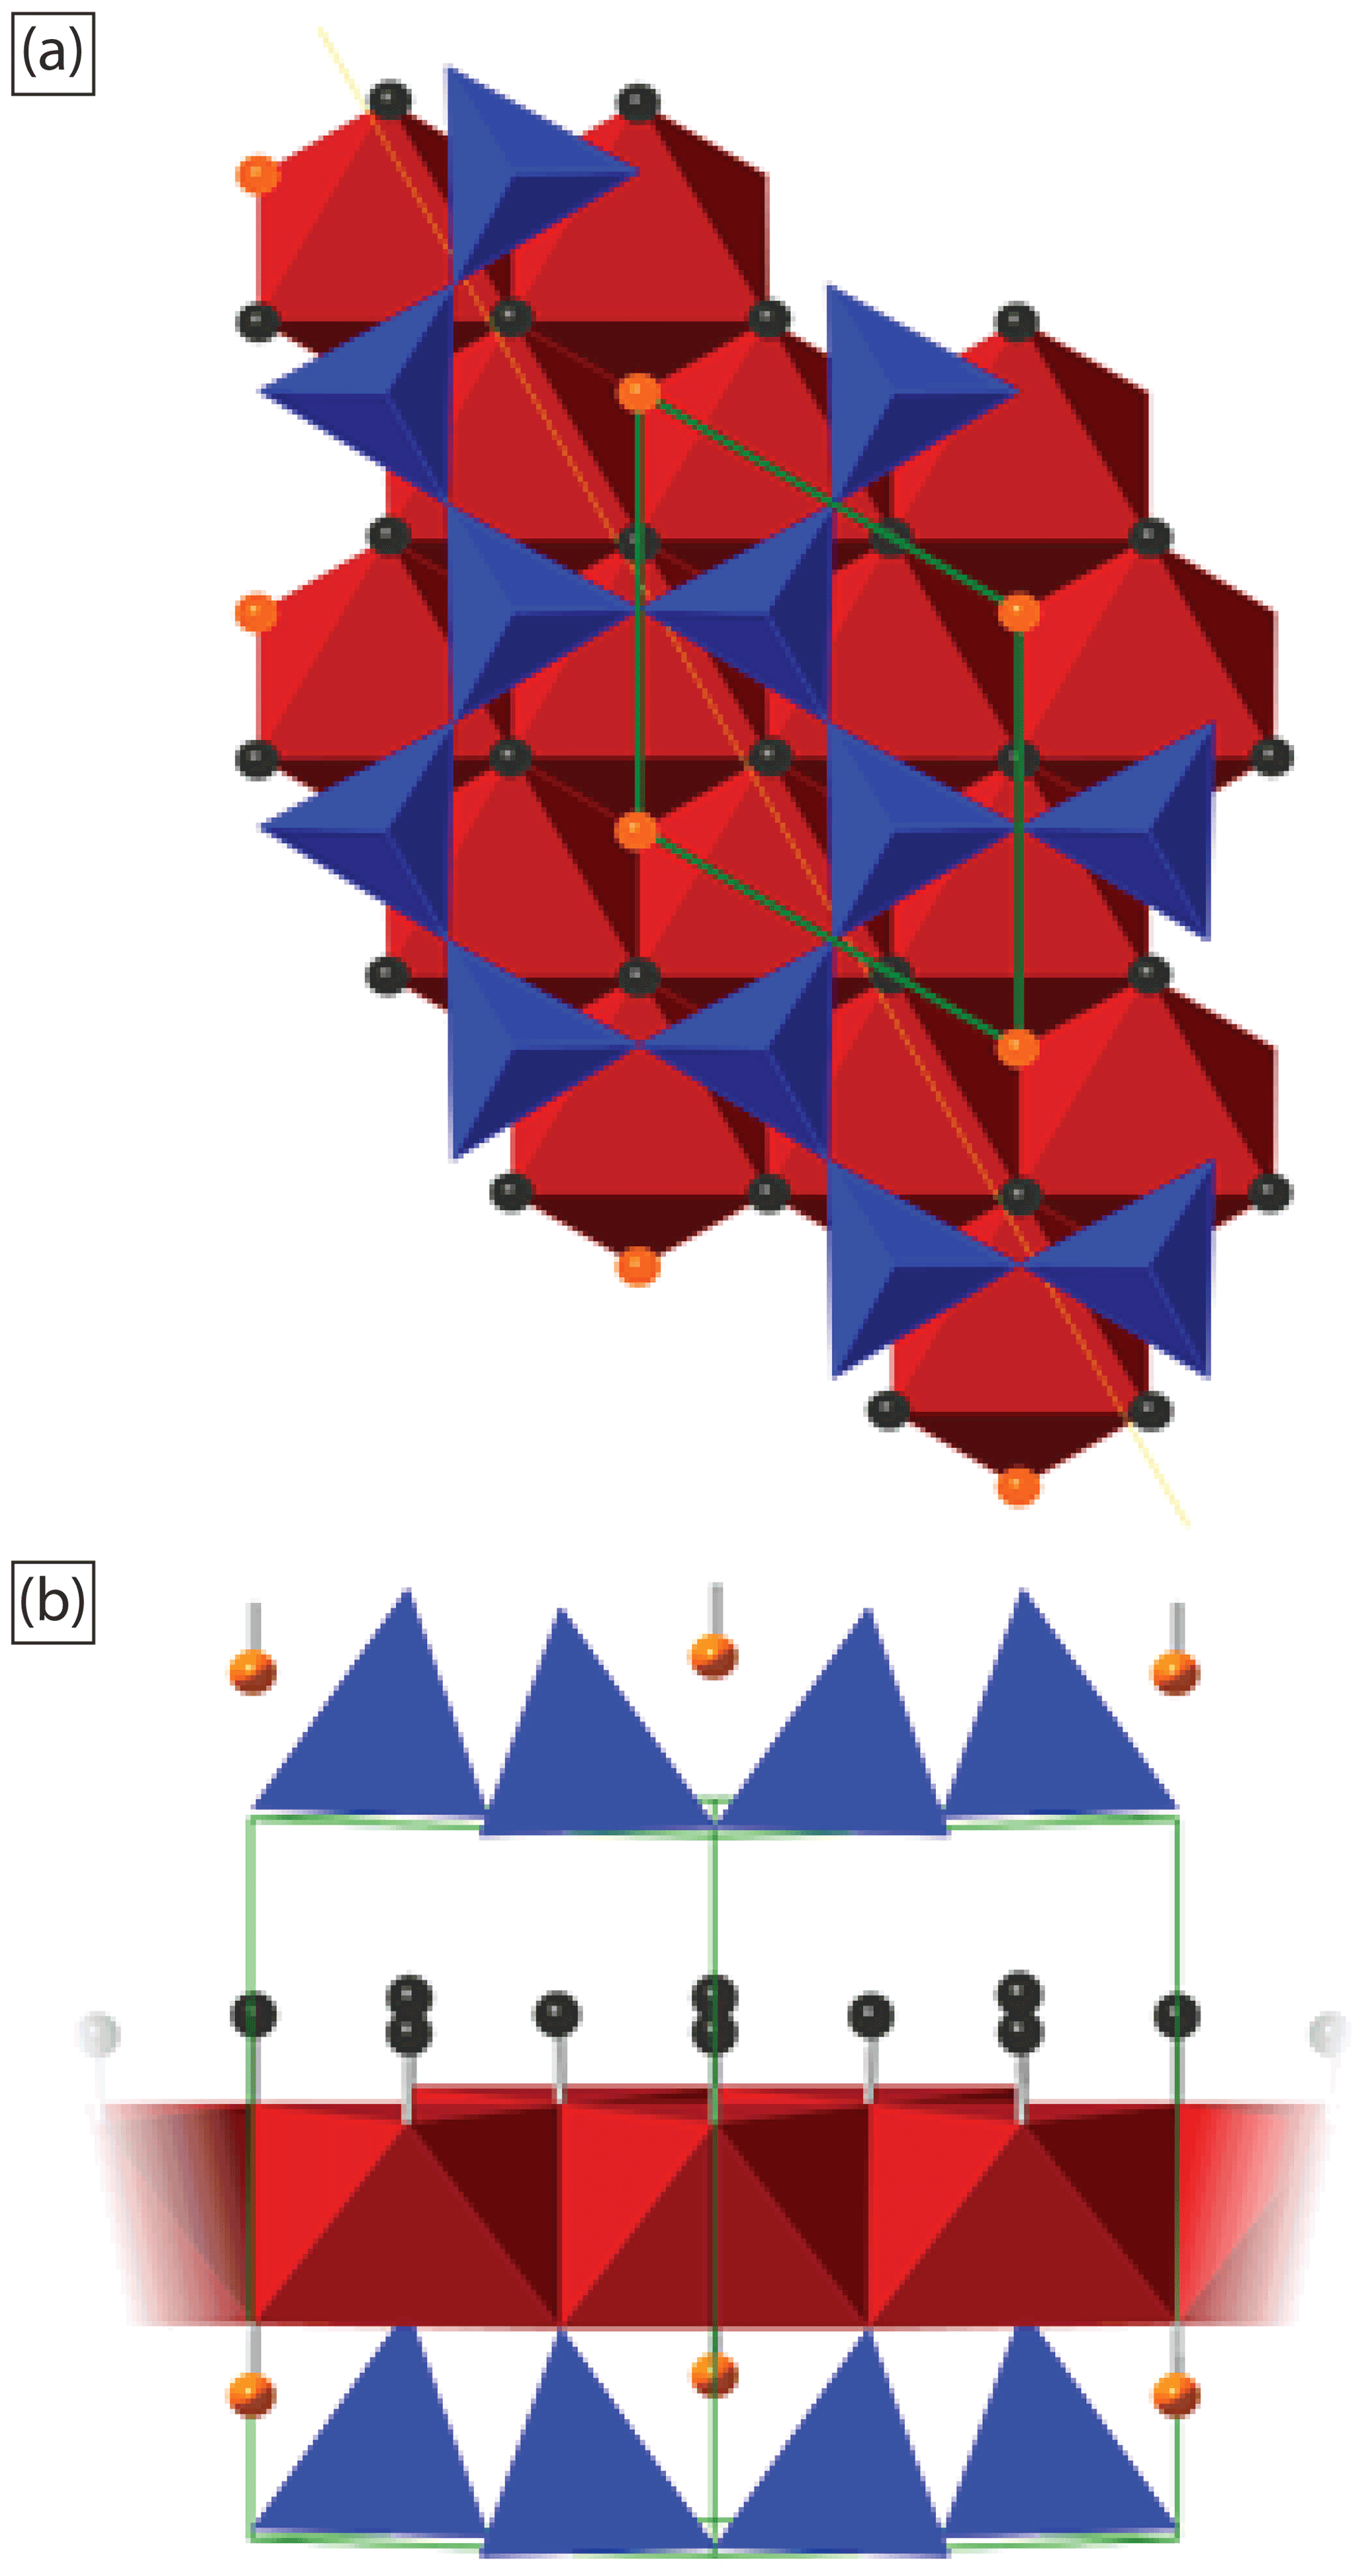
Figure 9The crystal structure of lizardite (Rooney et al., 2018). (a) Viewed from a silicate tetrahedral sheet looking down to the adjacent octahedral sheet, direction ]. The crystal cell is shown in green, while the corners of the tetrahedra and octahedra represent oxygen atoms. The hydrogen atoms of the outer hydroxyl groups are shown in black, and the hydrogens of the inner hydroxyl groups are shown in orange. (b) The crystal structure viewed along [110] which is shown in (a) as the yellow line.
When a measurement is made on a lizardite crystal with the excitation laser incident on the (001) plane (a relative c-axis inclination of 0∘), the in-phase stretching mode of the outer-OH groups, corresponding to the LO mode, is enhanced (Fritsch et al., 2021; Balan et al., 2021; Farmer, 2000). Conversely, with the excitation laser perpendicular to the (001) planes (relative c-axis inclination of 90∘), the TO mode at lower frequency is enhanced relative to the LO mode (Balan et al., 2021; Farmer, 2000). This phenomenon, known as LO–TO splitting, is predicted to be on the order of 14–21 cm−1 (Balan et al., 2021), consistent with our observations of a range of 14.5 cm−1 between the spectra for a c-axis inclination of 0 and 90∘ (Fig. 8). This effect was also reported by Farmer (2000) for Raman spectra of the phyllosilicate clay mineral dickite, which suggests that this technique could be adapted for mapping the crystallographic orientation of other phyllosilicates and clays that are difficult or time-consuming to analyse using other techniques such as EBSD.
4.4 Application of the method to deformed lizardite serpentinite
We applied our new Raman-based crystallographic orientation mapping technique to a sample of strongly deformed serpentinite characterised by a texture known as ribbon texture (Maltman, 1978; Fig. 10), mostly consisting of lizardite. This texture develops as a result of shearing of pseudomorphic mesh-textured serpentinite, leading to the formation of interconnected, anastomosing to sub-parallel networks of lizardite rims in which the lizardite (001) planes are approximately parallel to the shear direction (Tesei et al., 2018; Viti et al., 2018). Thin section photomicrographs of this sample (CV7a) show interconnected “ribbons” of lizardite up to 100 µm thick separating dark elongate patches corresponding to the deformed mesh cores, consisting of chaotic random chrysotile, lizardite, and poorly crystalline serpentine with abundant magnetite (Fig. 10a, b). EBSD was attempted on this sample, but insufficient signal leading to extremely low indexing rates meant that a meaningful EBSD map could not be produced.
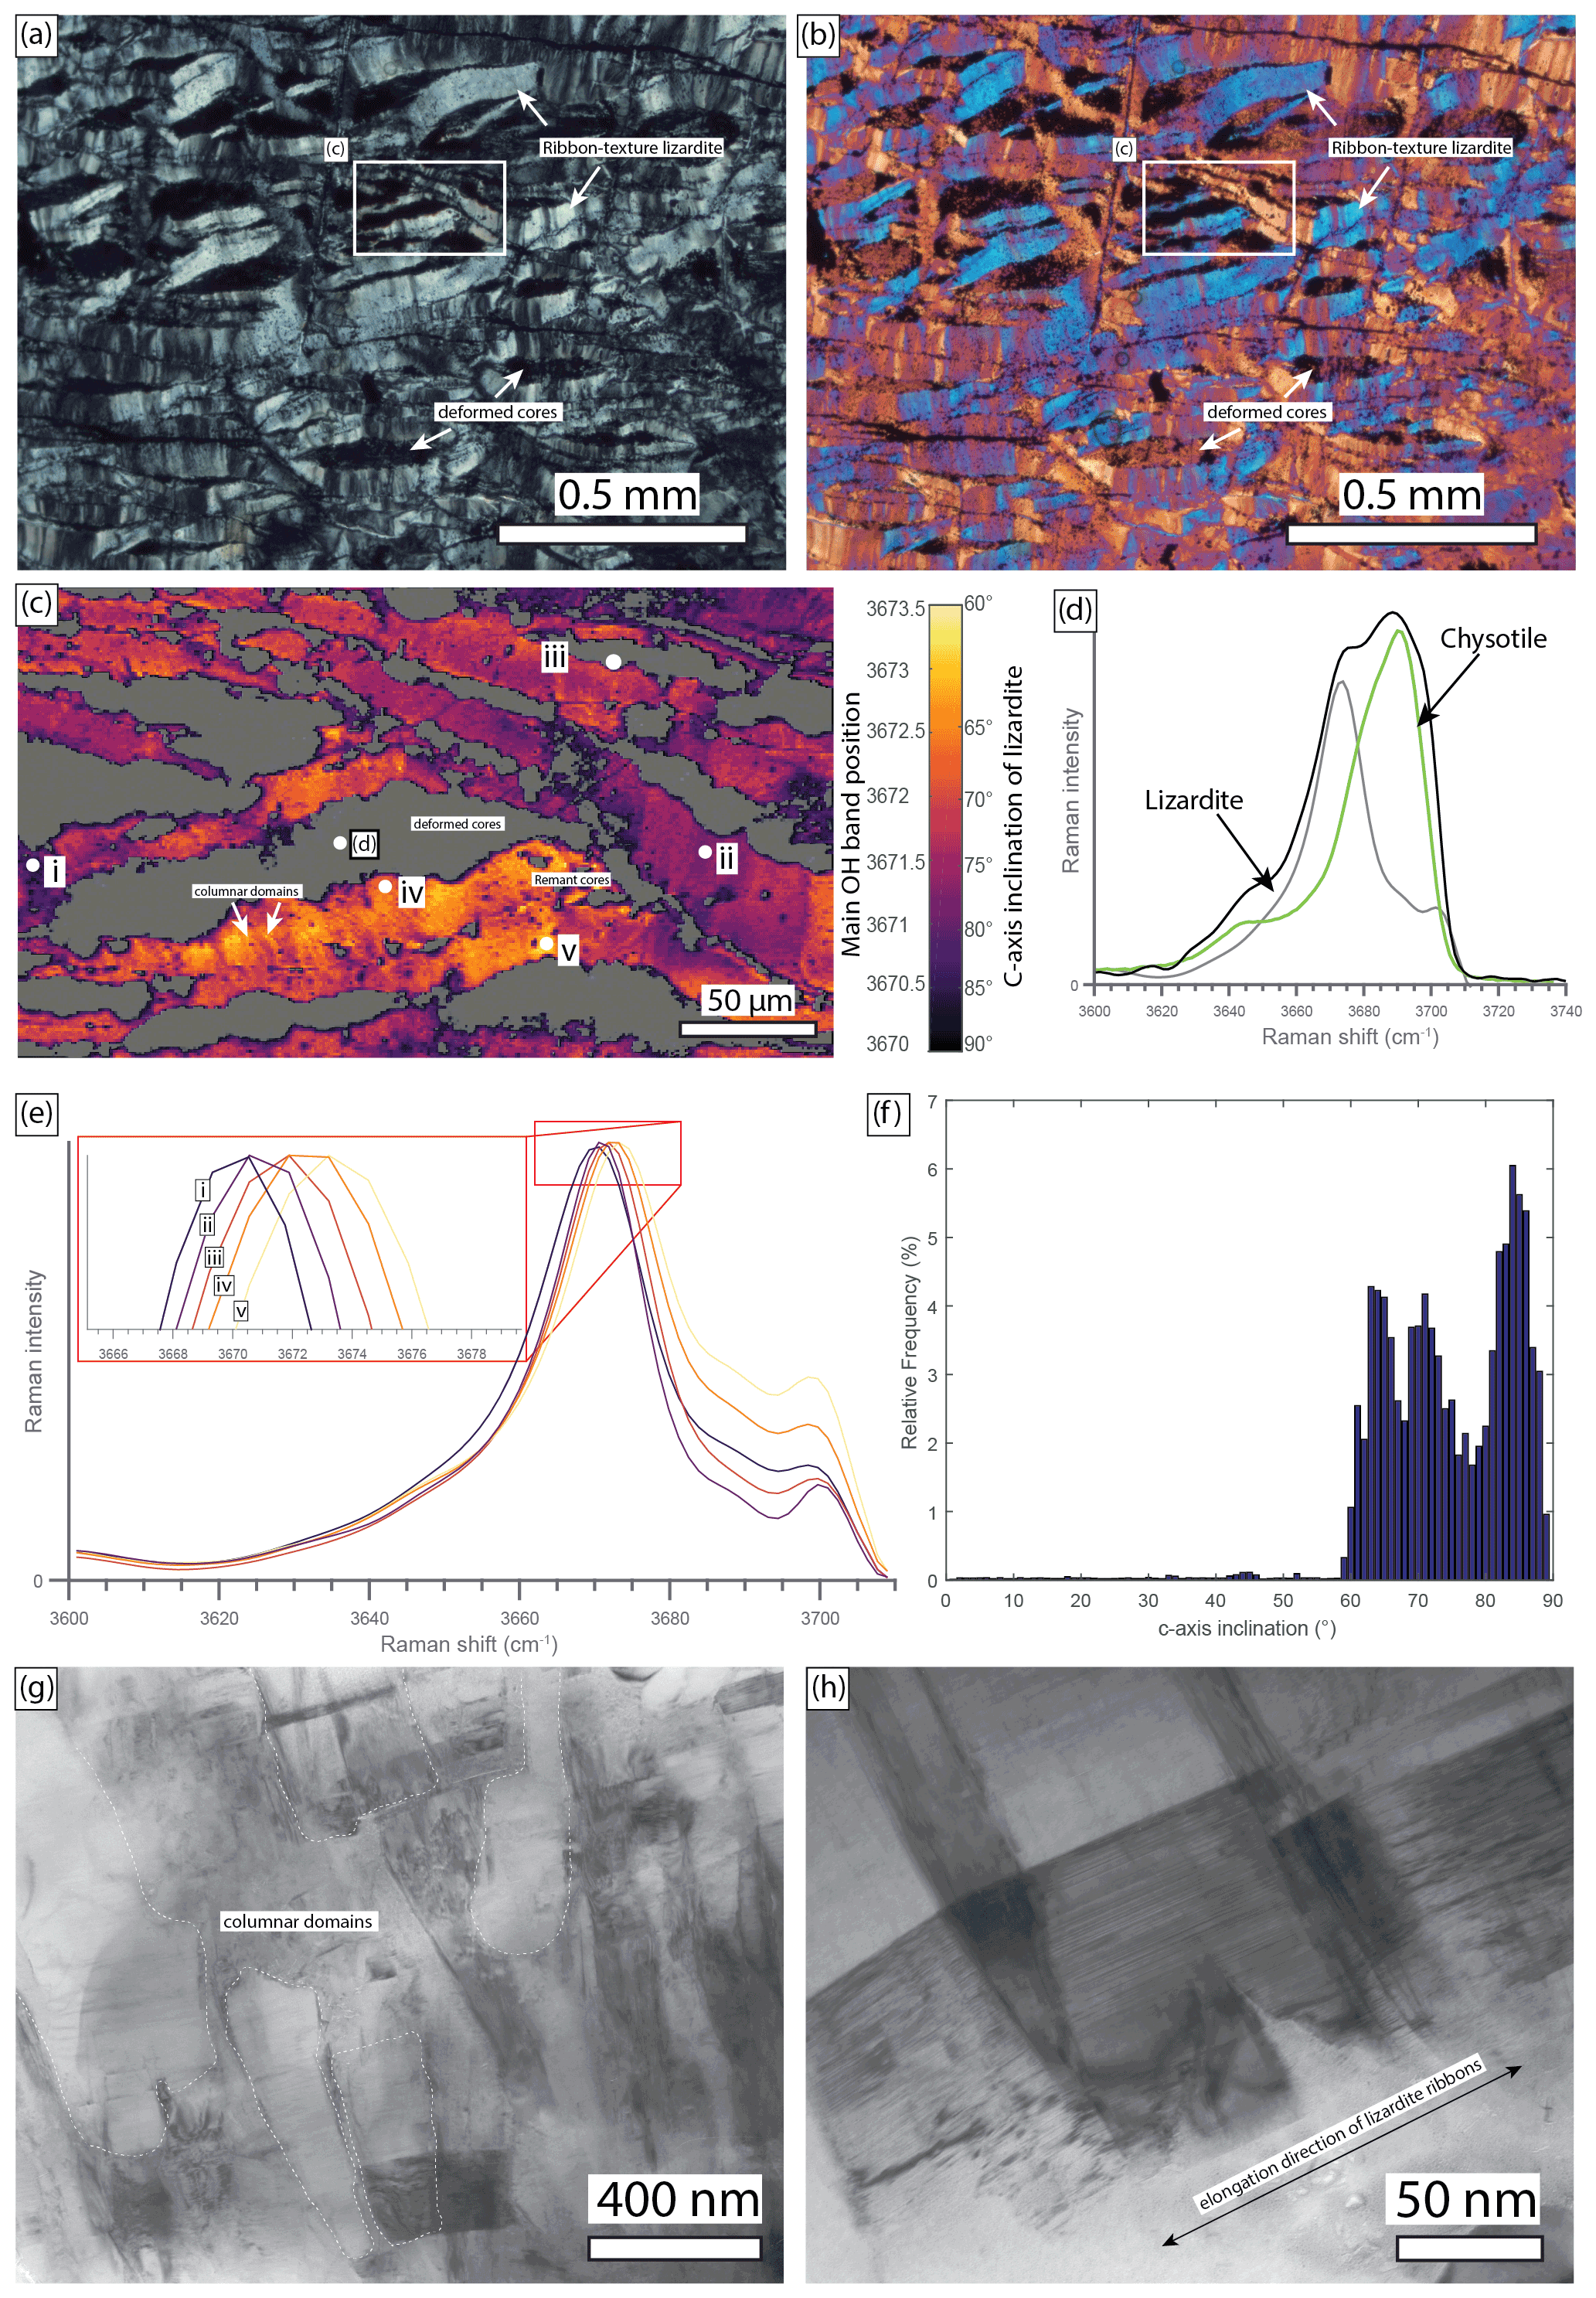
Figure 10Raman spectroscopy mapping of the crystallographic orientation of lizardite in sample CV7a, a lizardite ribbon-textured serpentinite from eastern Elba, Italy. Thin section image of sample in (a) cross-polarised light and (b) cross-polarised light with a wave plate inserted. The mapped region is outlined in a white box. (c) Raman-based map displaying the inclination of the c-axis of lizardite. Grey regions with no data represent the cores of deformed mesh-textured serpentinite surrounded by mapped lizardite ribbon-textured serpentinite. The cores are characterised by a sub-resolution intergrowth of lizardite and chrysotile, as well as the abundant presence of magnetite. (d) Representative OH-region Raman spectrum for the deformed cores in (c) displaying a mixed spectrum of lizardite and chrysotile. (e) Representative spectra from the Raman map in (c) which demonstrate the shift in the main band in the OH region for lizardite, which can be related to the inclination of the c-axis of lizardite. (f) Histogram of the c-axis inclination for every measured point. (g) TEM image of sample CV7a which shows columnar lizardite crystals with a large base and a thinner “apex”. (h) TEM image of sample CV7a which shows columnar lizardite crystals oriented at a large angle to the elongation direction of the ribbons.
The false-colour Raman map produced using the techniques described previously shows that the c-axis inclinations of the lizardite are relatively high throughout the analysed area and range from 60 to 90∘ (Fig. 10c). A selection of spectra taken from different locations within the Raman map (points i–v in Fig. 10c) show a relatively narrow spread in band positions (3670–3673.5 cm−1) due to the strong crystallographic preferred orientation of lizardite (Fig. 10e). Lizardite immediately adjacent to the deformed cores displays a c-axis inclination >80∘, visible in Fig. 10c as a dark rim around the margins of the deformed cores. Raman mapping also indicates that the mesh cores (grey areas in Fig. 10c) consist of mixed chrysotile and lizardite intergrown below the spatial resolution, resulting in a mixed Raman spectra (Fig. 10d). The abundant magnetite present in the mesh cores results in permanent damage to the thin section during mapping due to the oxidation of magnetite to haematite by heating from the excitation laser (Shebanova and Lazor, 2003). Despite the limited range of band positions and c-axis orientations in the analysed area, our mapping technique shows that the lizardite ribbons have a columnar internal structure in places, with narrow (<10–20 µm) columnar domains orientated at large angles to the edges of ribbons, separated by well-defined boundaries across which there are small but discrete changes in c-axis inclination (Fig. 10c). This is consistent with the microstructure of the lizardite ribbons observed in plane (Fig. 10a) and crossed-polarised (Fig. 10b) light images. A histogram of the relative frequency of the c-axis orientation calculated from the Raman map (Fig. 10c) shows that the c-axis inclinations dominantly range from 60 to 90∘. Additionally, TEM analysis reveals that the lizardite grains form sectors that are columnar to triangular in shape with the apex orientated at large angles to the boundaries of the deformed ribbons (Fig. 10g, h). The lizardite sectors comprise planar (001) lattice fringes with minor defects such as interlayer partings, kinking, and other crystal-structural faults. The lizardite (001) planes in adjacent sectors are slightly misoriented with respect to one another. These observations are all consistent with previous high-resolution studies of deformed mesh-textured serpentinite (Viti and Mellini, 1998; Viti et al., 2018). A comparison of the Raman-based map to optical microscope and TEM observations indicates that our new Raman mapping technique is capable of discerning relatively small and subtle microstructural features at a nominal resolution of less than a few microns.
4.5 Further considerations and potential limitations
Lizardite spectra in the OH-stretching region reported in the literature show some variability. However, the reported peaks are generally consistent, with a main peak reported between 3681 and 3688 cm−1 and a secondary peak between 3701 and 3707 cm −1 (Petriglieri et al., 2015; Auzende et al., 2004; Rooney et al., 2018; Tarling et al., 2018). The spread in reported values can be attributed to differences in Raman microscopy systems and calibration techniques. However, except for the recent reports by Capitani et al. (2021) and Compagnoni et al. (2021), there are no published examples of lizardite displaying a significant shift in the bands responsible for the main hydroxyl peak. Raman measurements excite phonon modes with approximately half the wavelength of the excitation laser (532 nm), on the order of ∼ 260 nm (Farmer, 2000, 1998). For platy grains with a thickness less than this scale, the in-phase vibration of the outer OH groups' TO modes are inhibited, and the LO modes prevail at the higher frequency (Farmer, 2000; Kloprogge, 2017; Prencipe et al., 2009). Natural serpentinite fault rocks such as serpentinite mylonites often consist of fine-grained (sub-micron) and texturally complex intergrowths of different serpentine minerals and accessory phases (Tarling et al., 2019; Rooney et al., 2018; Tarling et al., 2021). TEM observations show that the grain size of lizardite in many natural serpentines is on the order of hundreds of nanometres or smaller (Viti and Mellini, 1998; Andreani et al., 2005; Rumori et al., 2004; Tarling et al., 2021). This may explain why most previously reported Raman measurements in the OH-stretching region of lizardite display a main band with a wavenumber towards the upper end of the range reported here. Thus, a limitation of our new methodology is that Raman-based CPO measurements may only be possible when the lizardite grain size is on the order of 250 nm or greater. The spatial resolution of the Raman system sets an additional constraint on the spatial resolution of these measurements. The diffraction-limited Raman system used in this study has a spatial resolution of ∼ 370 nm using the 100× objective (Rooney et al., 2018). These requirements and constraints may limit the applicability of this technique on many natural serpentinites, which are frequently characterised by sub-micron intergrowths of multiple serpentine minerals (Viti and Mellini, 1998; Andreani et al., 2005; Rumori et al., 2004; Tarling et al., 2021; Rooney et al., 2018). Despite these limitations, the availability of Raman instruments, and the relatively simple and cost-effective requirements for sample preparation, makes this technique a valid alternative to EBSD-based CPO measurements if the sample requirements (i.e. grain size) can be satisfied. Additionally, the technique provides some advantages over EBSD because it is relatively insensitive to surface polishing damage and amorphisation, which means that it can be successfully applied even when EBSD fails.
We demonstrate that a strong orientation anisotropy effect in the Raman spectra of lizardite can be used to measure the c-axis orientations of lizardite crystals and lizardite-bearing samples and to generate detailed maps of the crystallographic preferred orientation (CPO) of lizardite serpentinites. This new methodology is based on a shift in the main band in the OH-stretching region due to LO–TO splitting, which depends on the orientation of the excitation laser relative to the inclination of the c-axis of a grain. The technique can be applied to high-throughput mapping and allows for the mapping of the c-axis inclination of lizardite grains in texturally complex, lizardite-bearing serpentinite samples with minimal preparation and directly on standard polished thin sections. The LO–TO splitting effect has also been reported in the Raman spectra of the phyllosilicate clay minerals kaolinite (Farmer, 1998) and dickite (Farmer, 2000), as well as other hydrous minerals such as gibbsite (Wang and Johnston, 2000). This suggests that our Raman-based technique could be adapted to map the crystallographic orientations of other phyllosilicates and OH-bearing minerals that are challenging to analyse using other techniques.
The Raman and EBSD data presented in this work are available for download at https://doi.org/10.5281/zenodo.6192312 (Tarling et al., 2022). Specific requests for materials should be addressed to Matthew Tarling (tarlingmatthew@gmail.com).
MST and SAFS designed and developed the project. MST and JSR acquired and analysed the Raman data. MN and MST acquired the EBSD data. MD and MST performed the analyses of the EBSD data. CV supplied the samples of Monte Fico lizardite and sample CV7a and performed the TEM analyses. JRP contributed confirmatory Raman analyses and discussion of the Raman anisotropy. KCG provided access to Raman microscopy facilities and expertise in Raman spectroscopy. MST wrote the manuscript with input from all authors.
The contact author has declared that neither they nor their co-authors have any competing interests.
Publisher's note: Copernicus Publications remains neutral with regard to jurisdictional claims in published maps and institutional affiliations.
Continued access to the WITec Project FIVE software during the COVID-19 pandemic was facilitated by Matthias Kress and Lars-Gunnar Ranz at WITec GmbH, Ulm, Germany.
This work was supported by the Marsden Fund Council (project UOO1829) administered by the Royal Society of New Zealand. This research was also supported by the Dodd–Walls Centre for Photonic and Quantum Technologies and the New Zealand Ministry for Business and Innovation Endeavour funding grant (grant no. C11X2001).
This paper was edited by Reto Gieré and reviewed by two anonymous referees.
Amiguet, E., Van de Moortèle, B., Cordier, P., Hilairet, N., and Reynard, B.: Deformation mechanisms and rheology of serpentines in experiments and in nature, J. Geophys. Res.-Sol. Ea., 119, 4640–4655, https://doi.org/10.1002/2013JB010791, 2014.
Andreani, M., Boullier, A. M., and Gratier, J. P.: Development of schistosity by dissolution-crystallization in a Californian serpentinite gouge, J. Struct. Geol., 27, 2256–2267, https://doi.org/10.1016/j.jsg.2005.08.004, 2005.
Auzende, A. L., Daniel, I., Reynard, B., Lemaire, C., and Guyot, F.: High-pressure behaviour of serpentine minerals: A Raman spectroscopic study, Phys. Chem. Miner., 31, 269–277, https://doi.org/10.1007/s00269-004-0384-0, 2004.
Bachmann, F., Hielscher, R., and Schaeben, H.: Grain detection from 2d and 3d EBSD data – Specification of the MTEX algorithm, Ultramicroscopy, 111, 1720–1733, 2011.
Balan, E., Saitta, A. M., Mauri, F., Lemaire, C., and Guyot, F.: First-principles calculation of the infrared spectrum of lizardite, Am. Mineral., 87, 1286–1290, 2002.
Balan, E., Fritsch, E., Radtke, G., Paulatto, L., Juillot, F., Baron, F., and Petit, S.: First-principles modeling of the infrared spectrum of Fe-and Al-bearing lizardite, Eur. J. Mineral., 33, 647–657, 2021.
Brownlee, S. J., Hacker, B. R., Harlow, G. E., and Seward, G.: Seismic signatures of a hydrated mantle wedge from antigorite crystal-preferred orientation (CPO), Earth Planet. Sc. Lett., 375, 395–407, https://doi.org/10.1016/j.epsl.2013.06.003, 2013.
Capitani, G., Compagnoni, R., Cossio, R., Botta, S., and Mellini, M.: The intracrystalline microstructure of Monte Fico lizardite, by optics, μ-Raman spectroscopy and TEM, Eur. J. Mineral., 33, 425–432, 2021.
Charoensawan, J., Adam, L., Ofman, M., Toy, V., Simpson, J., Zhong, X., and Schuck, B.: Fracture Shape and Orientation Contributions to P-Wave Velocity and Anisotropy of Alpine Fault Mylonites, Front. Earth Sci., 9, 238, https://doi.org/10.3389/feart.2021.645532, 2021.
Compagnoni, R., Cossio, R., and Mellini, M.: Raman anisotropy in serpentine minerals, with a caveat on identification, J. Raman Spectrosc., https://doi.org/10.1002/jrs.6128, 2021.
Dempsey, E. D., Prior, D. J., Mariani, E., Toy, V. G., and Tatham, D. J.: Mica-controlled anisotropy within mid-to-upper crustal mylonites: an EBSD study of mica fabrics in the Alpine Fault Zone, New Zealand, Geol. Soc. Lond. Spec. Publ., 360, 33–47, 2011.
Evans, B. W.: The Serpentinite Multisystem Revisited: Chrysotile Is Metastable, Int. Geol. Rev., 46, 479–506, https://doi.org/10.2747/0020-6814.46.6.479, 2004.
Evans, B. W., Hattori, K., and Baronnet, A.: Serpentinite: what, why, where?, 9, 99–106, https://doi.org/10.2113/gselements.9.2.99, 2013.
Farmer, V. C.: Differing effects of particle size and shape in the infrared and Raman spectra of kaolinite, Clay Miner., 33, 601–604, 1998.
Farmer, V. C.: Transverse and longitudinal crystal modes associated with OH stretching vibrations in single crystals of kaolinite and dickite, Spectrochim. Acta A, 56, 927–930, 2000.
Fritsch, E., Balan, E., Petit, S., and Juillot, F.: Structural, textural, and chemical controls on the OH stretching vibrations in serpentine-group minerals, Eur. J. Mineral., 33, 447–462, 2021.
Fuchs, Y., Linares, J., and Mellini, M.: Mössbauer and infrared spectrometry of lizardite-1T from Monte Fico, Elba, Phys. Chem. Miner., 26, 111–115, 1998.
Gailhanou, H., Blanc, P., Mikaelian, G., Rogez, J., and Kawaji, H.: Thermodynamic properties of lizardite, determined by calorimetry. International Symposium on Solubility Phenomena and Related Equilibrium Processes (ISSP), Tours, France, HAL Id: hal-01720566, https://hal-brgm.archives-ouvertes.fr/hal-01720566 (last access: 26 July 2021), 2018.
Gregorkiewitz, M., Lebech, B., Mellini, M., and Viti, C.: Hydrogen positions and thermal expansion in lizardite-1T from Elba; a low-temperature study using Rietveld refinement of neutron diffraction data, Am. Mineral., 81, 1111–1116, https://doi.org/10.2138/am-1996-9-1008, 1996.
Hielscher, R. and Schaeben, H.: A novel pole figure inversion method: specification of the MTEX algorithm, J. Appl. Crystallogr., 41, 1024–1037, 2008.
Hilairet, N., Daniel, I., and Reynard, B.: P-V equations of state and the relative stabilities of serpentine varieties, Phys. Chem. Miner., 33, 629–637, https://doi.org/10.1007/s00269-006-0111-0, 2006.
Hirose, T., Bystricky, M., Kunze, K., and Stünitz, H.: Semi-brittle flow during dehydration of lizardite–chrysotile serpentinite deformed in torsion: Implications for the rheology of oceanic lithosphere, Earth Planet. Sc. Lett., 249, 484–493, 2006.
Inoue, S. and Kogure, T.: Electron backscatter diffraction (EBSD) analyses of phyllosilicates in petrographic thin sections, Am. Mineral., 97, 755–758, 2012.
Ishibashi, H., Arakawa, M., Ohi, S., Yamamoto, J., Miyake, A., and Kagi, H.: Relationship between Raman spectral pattern and crystallographic orientation of a rock-forming mineral: a case study of Fo89Fa11 olivine, J. Raman Spectrosc. An Int. J. Orig. Work all Asp. Raman Spectrosc. Incl. High. Order Process. also Brillouin Rayleigh Scatt., 39, 1653–1659, 2008.
Jung, H.: Seismic anisotropy produced by serpentine in mantle wedge, Earth Planet. Sc. Lett., 307, 535–543, 2011.
Katayama, I., Hirauchi, K., Michibayashi, K., and Ando, J.: Trench-parallel anisotropy produced by serpentine deformation in the hydrated mantle wedge, Nature, 461, 1114–1117, 2009.
Kloprogge, J. T.: Raman spectroscopy of clay minerals, in: Developments in clay science, edited by: Gates, W. P., Kloprogge, J. T., Madejová, J., and Bergaya, F., Vol. 8, Elsevier, 150–199, https://doi.org/10.1016/B978-0-08-100355-8.00006-0, 2017.
Kronenberg, A. K., Kirby, S. H., and Pinkston, J.: Basal slip and mechanical anisotropy of biotite, J. Geophys. Res.-Sol. Ea., 95, 19257–19278, 1990.
Lee, J., Jung, H., Klemd, R., Tarling, M. S., and Konopelko, D.: Lattice preferred orientation of talc and implications for seismic anisotropy in subduction zones, Earth Planet. Sc. Lett., 537, 116178, https://doi.org/10.1016/j.epsl.2020.116178, 2020.
Maltman, A. J.: Serpentinite textures in Anglesey, North Wales, United Kingdom, Geol. Soc. Am. Bull., 89, 972–980, 1978.
Mellini, M. and Viti, C.: Crystal structure of lizardite-1T from Elba, Italy, Am. Mineral., 79, 1194–1198, 1994.
Nagaya, T., Okamoto, A., Oyanagi, R., Seto, Y., Miyake, A., Uno, M., Muto, J., and Wallis, S. R.: Crystallographic preferred orientation of talc determined by an improved EBSD procedure for sheet silicates: Implications for anisotropy at the slab–mantle interface due to Si-metasomatism, Am. Mineral. J. Earth Planet. Mater., 105, 873–893, 2020.
Padrón-Navarta, J. A., Tommasi, A., Garrido, C. J., and López Sánchez-Vizcaíno, V.: Plastic deformation and development of antigorite crystal preferred orientation in high-pressure serpentinites, Earth Planet. Sc. Lett., 349–350, 75–86, https://doi.org/10.1016/j.epsl.2012.06.049, 2012.
Petriglieri, J. R., Salvioli-Mariani, E., Mantovani, L., Tribaudino, M., Lottici, P. P., Laporte-Magoni, C., and Bersani, D.: Micro-Raman mapping of the polymorphs of serpentine, J. Raman Spectrosc., 46, 953–958, 2015.
Prencipe, M., Noel, Y., Bruno, M., and Dovesi, R.: The vibrational spectrum of lizardite-1 T [Mg3Si2O5 (OH)4] at the Γ point: A contribution from an ab initio periodic B3LYP calculation, Am. Mineral., 94, 986–994, 2009.
Prior, D. J., Mariani, E., and Wheeler, J.: EBSD in the Earth Sciences: Applications, Common Practice, and Challenges, in: Electron Backscatter Diffraction in Materials Science, Schwarz, A. J., Kumar, M. Adams, B. L., and Field, D. P., Springer US, Boston, MA, 2009.
Reynard, B.: Serpentine in active subduction zones, Lithos, 178, 171–185, https://doi.org/10.1016/j.lithos.2012.10.012, 2013.
Rinaudo, C., Gastaldi, D., and Belluso, E.: Characterization of chrysotile, antigorite and lizardite by FT-Raman spectroscopy, Can. Mineral., 41, 883–890, https://doi.org/10.2113/gscanmin.41.4.883, 2003.
Rooney, J. S., Tarling, M. S., Smith, S. A. F., and Gordon, K. C.: Submicron Raman spectroscopy mapping of serpentinite fault rocks, J. Raman Spectrosc., 49, 279–286, https://doi.org/10.1002/jrs.5277, 2018.
Rumori, C., Mellini, M., and Viti, C.: Oriented, non-topotactic olivine? serpentine replacement in mesh-textured, serpentinized peridotites, Eur. J. Mineral., 16, 731–741, 2004.
Shebanova, O. N. and Lazor, P.: Raman study of magnetite (Fe3O4): laser-induced thermal effects and oxidation, J. Raman Spectrosc., 34, 845–852, 2003.
Soda, Y. and Wenk, H. R.: Antigorite crystallographic preferred orientations in serpentinites from Japan, Tectonophysics, 615–616, 199–212, https://doi.org/10.1016/j.tecto.2013.12.016, 2014.
Tarling, M. S., Rooney, J. S., Viti, C., Smith, S. A. F., and Gordon, K. C.: Distinguishing the Raman spectrum of polygonal serpentine, J. Raman Spectrosc., 49, 1978–1984, https://doi.org/10.1002/jrs.5475, 2018.
Tarling, M. S., Smith, S. A. F., Scott, J. M., Rooney, J. S., Viti, C., and Gordon, K. C.: The internal structure and composition of a plate-boundary-scale serpentinite shear zone: the Livingstone Fault, New Zealand, Solid Earth, 10, 1025–1047, https://doi.org/10.5194/se-10-1025-2019, 2019.
Tarling, M. S., Smith, S. A. F., Rooney, J. S., Viti, C., and Gordon, K. C.: A common type of mineralogical banding in serpentine crack-seal veins, Earth Planet. Sc. Lett., 564, 116930, https://doi.org/10.1016/j.epsl.2021.116930, 2021.
Tarling, M. S., Demurtas, M., Smith, S. A. F., Rooney, J. S., Negrini, M., Viti, C., Petriglieri, J. R., and Gordon, K. C.: Data for Crystallographic orientation mapping of lizardite serpentinite by Raman spectroscopy, Zenodo [data set], https://doi.org/10.5281/zenodo.6192312, 2022.
Tesar, K., Gregora, I., Beresova, P., Vanek, P., Ondrejkovic, P., and Hlinka, J.: Raman scattering yields cubic crystal grain orientation, Sci. Rep.-UK, 9, 1–8, 2019.
Tesei, T., Harbord, C. W. A., De Paola, N., Collettini, C., and Viti, C.: Friction of Mineralogically Controlled Serpentinites and Implications for Fault Weakness, J. Geophys. Res.-Sol. Ea., 123, 6976–6991, https://doi.org/10.1029/2018JB016058, 2018.
Trittschack, R., Grobéty, B., and Koch-Müller, M.: The lizardite phase transformation followed by in situ high-temperature Raman and FTIR spectroscopy, Am. Mineral., 97, 1965–1976, https://doi.org/10.2138/am.2012.4162, 2012.
Van De Moortèle, B., Bezacier, L., Trullenque, G., and Reynard, B.: Electron back-scattering diffraction (EBSD) measurements of antigorite lattice-preferred orientations (LPO), J. Microsc., 239, 245–248, https://doi.org/10.1111/j.1365-2818.2010.03398.x, 2010.
Viti, C.: Serpentine minerals discrimination by thermal analysis, Am. Mineral., 95, 631–638, 2010.
Viti, C. and Hirose, T.: Dehydration reactions and micro/nanostructures in experimentally-deformed serpentinites, Contrib. Mineral. Petr., 157, 327–338, https://doi.org/10.1007/s00410-008-0337-6, 2009.
Viti, C. and Hirose, T.: Thermal decomposition of serpentine during coseismic faulting: Nanostructures and mineral reactions, J. Struct. Geol., 32, 1476–1484, https://doi.org/10.1016/j.jsg.2010.09.009, 2010.
Viti, C. and Mellini, M.: Contrasting chemical compositions in associated lizardite and chrysotile in veins from Elba, Italy, Eur. J. Mineral., 9, 585–596, https://doi.org/10.1127/ejm/9/3/0585, 1997.
Viti, C. and Mellini, M.: Mesh textures and bastites in the Elba retrograde serpentinites, Eur. J. Miner., 10, 1341–1359, https://doi.org/10.1127/ejm/10/6/1341, 1998.
Viti, C., Collettini, C., Tesei, T., Tarling, M. S., and Smith, S. A. F.: Deformation Processes, Textural Evolution and Weakening in Retrograde Serpentinites, 8, 241, https://doi.org/10.3390/min8060241, 2018.
Wang, K., Huang, T., Tilmann, F., Peacock, S. M., and Lange, D.: Role of Serpentinized mantle wedge in affecting Megathrust Seismogenic behavior in the area of the 2010 M=8.8 Maule earthquake, Geophys. Res. Lett., 47, e2020GL090482, https://doi.org/10.1029/2020GL090482, 2020.
Wang, S.-L. and Johnston, C. T.: Assignment of the structural OH stretching bands of gibbsite, Am. Mineral., 85, 739–744, 2000.
Zhong, X., Loges, A., Roddatis, V., and John, T.: Measurement of crystallographic orientation of quartz crystal using Raman spectroscopy: application to entrapped inclusions, Contrib. Mineral. Petrol., 176, 1–20, 2021.