the Creative Commons Attribution 4.0 License.
the Creative Commons Attribution 4.0 License.
Equation of state and sound wave velocities of fayalite at high pressures and temperatures: implications for the seismic properties of the martian mantle
Frédéric Béjina
Misha Bystricky
Nicolas Tercé
Matthew L. Whitaker
Haiyan Chen
The elastic properties of a pure, synthetic fayalite aggregate were studied by coupled synchrotron X-ray diffraction and ultrasonic interferometry in a DIA-type multi-anvil press. Measurements at pressures up to about 7 GPa and temperatures up to 873 K yielded an adiabatic bulk modulus, GPa with , and a shear modulus, GPa with . When fixing (after from Nestola et al., 2011), KS0 increases to about 130 GPa. These estimates of () follow a general linear trend, , for fayalite. We define limited ranges for both bulk and shear moduli from previous studies, and we discuss how these variations affect seismic velocities and the determination of a mineralogical model in the context of the Mars InSight SEIS (Seismic Experiment for Interior Structure) experiment.
- Article
(3826 KB) - Full-text XML
-
Supplement
(802 KB) - BibTeX
- EndNote
The successful landing of the Mars InSight mission and more specifically the installation of the seismometer SEIS (Seismic Experiment for Interior Structure) (Lognonné et al., 2019) on the surface of Mars will bring new constraints on the deep interior of the red planet. A depth profile of the seismic velocities is one of the major goals of this mission because (1) it will provide the first direct picture of the inner structure of the planet, in particular the size of its core (Witze, 2021; Stähler et al., 2021), the presence or not of a lower mantle, and possible discontinuities in its upper mantle (a transition zone?); and (2) it will allow, for the first time, mineralogical models to be fitted to real martian data and therefore the mineralogy of Mars' interior to be constrained.
Building such models requires knowing the thermoelastic properties of candidate minerals, i.e., minerals with compositions close to what is expected for Mars. For a solid solution like (Fe,Mg) olivines, unknown elastic parameters of a given composition are calculated from those of pure endmembers according to their relative amounts (e.g., Eq. 6 in Stixrude and Lithgow-Bertelloni, 2005). As recently proposed, such a relation may not work for all olivine compositions (Béjina et al., 2019; Pamato et al., 2019). Consequently it is important to measure the elastic properties across the entire solid solution in order to clearly define a compositional trend. With this goal in mind we started performing experimental measurements of equations of state (EoS) and sound velocities on silicate minerals with an iron content higher than on Earth. In the text below we will use a simplified notation for the expressions of bulk and shear moduli. Unless mentioned otherwise the elastic parameters at constant temperature and room pressure, KT0, KS0, G0 and their derivatives, , and , will be denoted as KT, KS, G, (or ), (or ) and respectively.
The iron content of the martian mantle is estimated to be around 17 wt % (e.g., Dreibus and Wänke, 1985; Taylor, 2013); therefore, olivine, one of its major phases, is thought to have a molar Fe content (XFe) around 25 %–30 %. Very few values for bulk modulus (K) and shear modulus (G) exist for olivines with XFe>0.2. If the trend of G values with XFe seems well defined and decreases linearly with increasing XFe (e.g., Liu et al., 2005), the few results on K appear contradictory. Nestola et al. (2011) performed room-temperature static compression experiments and measured an isothermal bulk modulus, KT=124.7 GPa and for olivines with %, concluding that Fe has little effect on both K and K′ in this composition range. By contrast Chung (1971) determined a decreasing linear trend of the adiabatic bulk modulus (KS) between forsterite (KS=128.1 GPa) and fayalite (KS=122.0 GPa) from sound velocity measurements. In addition data on pure fayalite are largely discrepant, with KT (see Fig. S4 and Table S6 in Béjina et al., 2019) ranging from about 104 GPa (Plymate and Stout, 1990, at 400 ∘C) to 138 GPa (Smyth, 1975) and KS values of 138 GPa (Sumino, 1979), 128 GPa (Graham et al., 1988) and 134 GPa (Isaak et al., 1993). First-principles calculations by Stackhouse et al. (2010) predicted an even larger bulk modulus for fayalite, above 139 GPa. Therefore, a Fe-compositional trend of the bulk modulus for Fe-rich olivines is difficult to define and may even be nonlinear (Béjina et al., 2019; Pamato et al., 2019).
This lack of constraints on the effect of iron on the elastic properties of the Fe–Mg olivine solid solution, in particular for XFe>0.2, makes it difficult to adjust a mineralogical model to SEIS data and decipher the Fe content of the Mars mantle. We recently published high-pressure room-temperature X-ray diffraction (XRD) data (Béjina et al., 2019) and calculated the isothermal bulk modulus (KT) for the following olivine compositions: with and 1. Because room-temperature measurements at high pressure are subjected to consequent differential stress (t), these were estimated by using the method of Singh et al. (1998) that allows for the determination of d spacing values under hydrostatic pressure and the calculation of t. Subsequently the NaCl pressures were corrected for t. We present here the first results from an experiment at high temperatures and pressures above 1 GPa on a polycrystalline fayalite with coupled XRD and ultrasonic interferometry techniques (with the exception of Liu et al., 2010, but they did not calculate the elastic parameters). XRD measurements show that, as expected, high-temperature data present less differential stress than at room temperature, but t can be either positive or negative. The same correction for stress is therefore applied here.
The main details of our experiment, performed at the superconducting wiggler beamline X17B2 at the National Synchrotron Light Source (Brookhaven National Laboratory, Uptown, NY), as well as the preparation and characteristics of our fayalite (Fa) aggregate, can be found in our previous paper (Béjina et al., 2019). The acoustic velocity measurements were obtained in conjunction with X-ray diffraction (XRD) in situ at high pressure and temperature with the setup described by Whitaker et al. (2017). We will therefore only give here a brief description of the experiment.
2.1 Sample characteristics
Our Fe2SiO4 sample was synthesized from nanometric powders of Fe2O3 and SiO2. The oxide powder mixture was annealed twice for 2 h at 1000 ∘C and fO2 buffered by a gas mixture close to the equilibrium. After checking that the run product was pure fayalite by XRD, a dense pellet was prepared by spark plasma sintering (Béjina and Bystricky, 2009; Guignard et al., 2011). Observations of a fragment of this aggregate by scanning electron microscopy (SEM) using energy dispersive X-ray spectroscopy, orientation contrast and electron backscatter diffraction (EBSD) showed a very weak preferred crystallographic orientation and a homogeneous grain size around 2 µm. Finally our 1.2 mm diameter specimen was cored from this pellet, its length was brought to 1.2 mm, and both ends were carefully polished with Al2O3 powders.
2.2 High-pressure and high-temperature experiment
Beamline X17B2 at National Synchrotron Light Source (NSLS) was equipped with a 1000 ton DIA-type multi-anvil apparatus placed in the path of a white X-ray beam and with the DIASCoPE acoustic system for sound velocity measurements (Whitaker et al., 2017). Energy-dispersive XRD patterns (see as an example Fig. 3 in Béjina et al., 2019) were collected at a scattering angle of about 6.5∘ on the detection system composed of 10 detectors placed in a circle (nine between 0 and 180∘ azimuth plus one at 270∘) allowing for the calculation of differential stress (see description in Weidner et al., 2010). We later used the stress values to correct the pressure obtained from NaCl XRD analysis. Our experiment was run using the cell assembly shown in Fig. 1 containing both the fayalite sample and NaCl as a pressure calibrant. A detailed description of the cell is given by Whitaker et al. (2017), the main characteristics being a graphite heater with a WRe3%-WRe25% thermocouple to measure temperature (not corrected for pressure effects); a mixture 10NaCl:1BN at the back of the sample serving as both pressure marker using the NaCl EoS by Brown (1999) and as cushioning to reduce differential stress in the sample; and a BN sleeve along the sample helping to provide a pseudo-hydrostatic environment but also creating low-fO2 conditions needed to keep fayalite stable. In order to maximize the coupling between the different parts of the cell assembly for better sound wave propagation, 1 µm thick gold foils are placed at each interface along the wave path (Fig. 1). The ones around the sample also serve as markers when measuring sample length on X-radiographic images (see Sect. 2.3). The beamline setup allows us to take images of the full sample at once, these being recorded on a Prosilica charge-coupled device (CCD) camera. A dual-mode 10∘ Y-cut LiNbO3 piezoelectric transducer generated both P and S waves at resonance frequencies of 62 and 35 MHz respectively. XRD on NaCl and fayalite, P and S wave signals, and sample images were recorded sequentially at each step of the experiment.
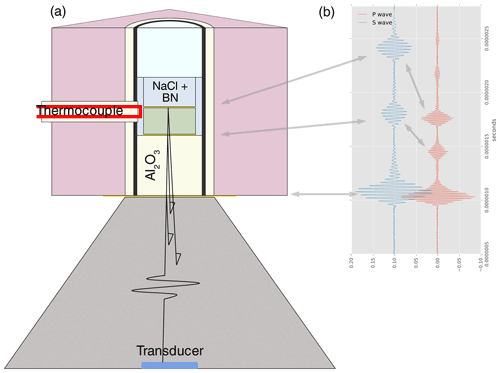
Figure 1(a) Cell assembly designed for ultrasonic interferometry measurements at high pressure and temperature (for details see Whitaker et al., 2017). The X-ray beam enters the cell via an edge of the boron-epoxy cube at 90∘ to the thermocouple. The dual-mode 10∘ Y-cut LiNbO3 piezoelectric transducer, placed at the back of one of the anvils (grey), generates both P and S waves. Al2O3 serves as a buffer rod. To maximize coupling between the different parts on the wave paths, 1 µ thick gold foils are placed at each interface. They also serve as markers to measure the sample length on X-ray images. (b) Examples of P and S wave echoes of the different interfaces: anvil–Al2O3, Al2O3–fayalite and fayalite–NaCl. The travel time across the sample for each wave is calculated by cross-correlation of the echoes reflected from both ends.
The tonnage-temperature path is presented in Fig. S1 in the Supplement. The Fa aggregate was first cold-pressed to 35 tons and then heated at 1073 K for about 15 min in order to relax the accumulated stress. Because the furnace started to become unstable, the temperature was brought down to 873 K, and this remained the maximum temperature of the experiment. The maximum tonnage-temperature conditions were 50 tons and 873 K. XRD on Fa and NaCl, P and S wave data, and X-ray radiographic images of the sample were collected while decreasing temperature (usually by steps of 100 K). Once at room temperature tonnage was lowered, and temperature increased back to 873 K before collecting a new set of data. Similar steps were repeated until tonnage reached 5 tons. Note that at 5 and 7.5 tons, the maximum temperatures were 573 and 673 K respectively. As discussed in Sect. 3, the maximum pressure estimated from NaCl unit-cell volumes and the EoS of Brown (1999) and corrected for differential stress was about 7 GPa at the highest temperature and about 5 GPa at room temperature because of the relaxation of cell-assembly materials.
2.3 Measurements of sample length and (Vp, Vs)
The length of the Fa sample was determined from X-ray radiographic images taken during the experiment thanks to gold foils placed at each end of our sample that blocked X-rays and acted as markers. The length variation is therefore known as a function of pressure and temperature (Fig. S2). The uncertainty in length is around 2 pixels (e.g., Li et al., 2004) corresponding to about 5 µm.
The round-trip travel times of P and S waves were obtained by cross-correlation of the echoes reflected from the top and bottom of the Fa specimen.
This gives a precise superposition of the two echoes, and their cross-correlation presents a unique maximum corresponding to the round-trip travel time across the sample (Fig. 2).
To perform these calculations we built a Python script largely based on the ObsPY package (Krischer et al., 2015).
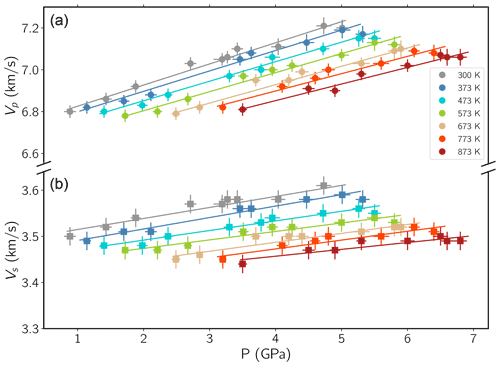
Figure 3 shows the P and S velocities obtained with this method as a function of pressure.
The main source of uncertainty in the velocities of P and S waves comes from the length measurements described above.
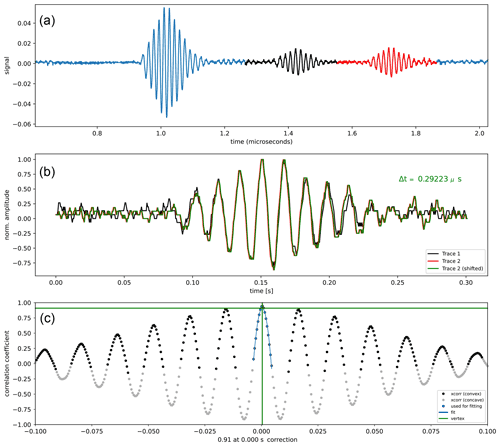
Figure 2Example of a cross-correlation using our ObsPY-based Python script. (a) Recorded Vp data at 7 GPa and 874 K. The black and red echoes are from both ends of the sample. (b) Superposition of the red and black echoes resulting from the cross-correlation with the indication of the travel time, Δt. (c) Result of the cross-correlation showing the unique maximum that precisely determines the round-trip travel time of the P wave across the specimen.
In this section we will discuss both X-ray and ultrasonic interferometry results. It is well accepted that the latter approach is more reliable, in particular because it does not need an external pressure scale such as NaCl EoS (e.g., Kung et al., 2002). Nevertheless, a comparison of the two datasets provides clues on the consistency of our results.
We removed data acquired during the cold-pressing step of our experiment in both X-rays (already presented in Béjina et al., 2019) and sound velocity sets because they present the highest differential stress levels, and these may affect sound velocity measurements.
The microstructure of our sample was also described in our previous publication, and we will only emphasize that our fayalite remained stable throughout the experiment. XRD measurements and postmortem SEM-EBSD observations showed no signs of transformation in our specimen.
3.1 Stress, pressure and unit-cell volume determination
The 10-detector array and other high-pressure equipment we used at the NSLS beamline X17B2 have been described in detail by Weidner et al. (2010). The stress estimation was based on the measurement of lattice strains, a method detailed by Singh et al. (1998). We therefore refer readers to these previous publications (and references therein) for more information on evaluating differential stress in high-pressure experiments. For each fitted hkl peak the measured d spacings, dm, were determined from the energy peak position on all available detectors (nine detectors subend 180∘ and 22.5∘ apart and one at 270∘). The values dP(hkl), representing d at hydrostatic pressure and used to estimate all unit-cell volumes, were calculated from the following relation (Singh et al., 1998, their Eqs. 3 and 4):
where dm(hkl) is the measured d spacing of a plane (hkl), ψ is the detector azimuth, and Q(hkl) is a term proportional to differential stress (t):
In the above equation, is the aggregate shear modulus calculated under the Reuss condition (iso-stress), GV is the shear modulus under the Voigt condition (iso-strain), and their respective expression is to be found in Singh et al. (1998) and Hearmon (1956). The weight factor α=1 (or =0) corresponds to the pure Reuss (or pure Voigt) bound. Our estimation of t was made assuming pure Reuss condition according to Chen et al. (2006).
Examples of plots, , are presented in Fig. S3.
The value of dP(hkl) corresponds to d when 3cos 2ψ=1.
To estimate the differential stress both in NaCl and Fa we preferred an individual-peak fitting procedure instead of refining the unit-cell parameters by fitting the full measured diffraction patterns with modeled spectra.
NaCl peaks were fitted using the software plot85 (Weidner et al., 2010), while fityk (Wojdyr, 2010) was used for Fa peaks.
All unit-cell volumes were calculated using both the UnitCell software (Holland and Redfern, 1997) and our own set of Python scripts that make use of the LMFIT minimization package (Newville et al., 2014), also used for the stress calculations.
Both procedures gave identical volumes within uncertainties, and UnitCell diagnostics helped filter poorly fitting peaks.
In the end, unit-cell volumes of NaCl at high pressure and high temperature were calculated from the d spacings of peaks (200), (220), (222), (400), (420) and (422), and for Fa we kept peaks (061), (112), (130), (131), (132), (133), (134), (152), (211), (222), (241) and (422).
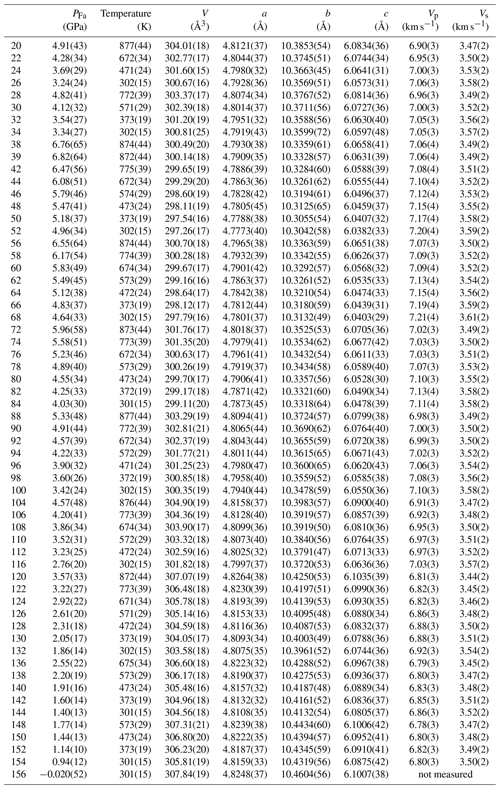
Pressure was first estimated from the NaCl volumes using a third-order Birch–Murnaghan (BM) EoS (Birch, 1947) with the isothermal bulk modulus, KT, and , from Brown (1999), as recommended by Strässle et al. (2014), and thermal expansion from Spetzler et al. (1972). This pressure was then corrected for the differential stresses, t, measured in both NaCl and Fa (Fig. 4) following the next relation (Béjina et al., 2019):
where PFa is the pressure felt by the Fa sample, PNaCl is the pressure calculated from NaCl volumes, and tFa and tNaCl are stresses measured in the Fa sample and in NaCl respectively (detailed data are listed in Table S1). Stress was calculated from d spacings measured at different azimuths of the detector array using Eq. (1) and following the method of Singh et al. (1998). As shown in Fig. 4, differential stress in Fa is mostly compressive at the highest pressures but mostly extensive below about 4 GPa. In comparison NaCl presents less variation in t, and consequently PFa is slightly higher than PNaCl below 4 GPa and lower above (Fig. S4). Table 1 lists unit-cell parameters calculated from the above dP values as a function of pressure and temperature.
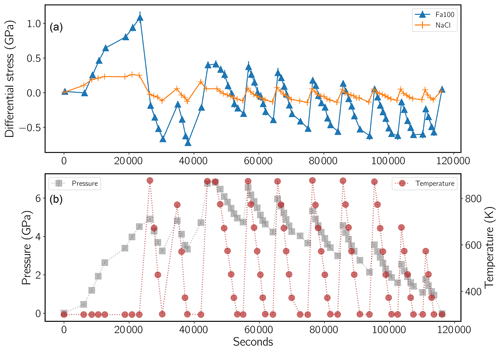
Figure 4(a) Differential stress calculated in both NaCl and fayalite using the method of Singh et al. (1998) (compressive stresses are marked as positive). (b) Pressure, PFa (left axis and grey squares), determined from the NaCl unit-cell volumes and corrected for the differential stress. Right axis and red dots show temperature. Data from the cold-pressing step were not included in the determination of the elastic parameters, as discussed in the text.
3.2 Uncertainties
Uncertainties (1σ) in individual peak positions, hence on dhkl spacing values (Δdhkl), were directly obtained from the Levenberg–Marquardt fit of the diffractograms in fityk.
Because there is no straightforward way to include error bars on data in LMFIT (one can use weighting factors, but there are different ways to estimate them), we used the d−Δd and d+Δd of each hkl peak to calculate the minimum and maximum values of cell parameters and volumes.
The uncertainty in V (ΔV) for each (P,T) condition was defined as the maximum value between V−Vmin and Vmax−V, with V being the nominal volume calculated from d.
Uncertainties in PNaCl, tFa and tNaCl (Table S1) were obtained from those on unit-cell volumes and d spacings by error propagation.
Uncertainties in PFa were then determined according to Eq. (3).
These were finally included in the weighted fitting routine of EosFit7 (Angel et al., 2014) in order to obtain the fayalite EoS parameters.
This approach leads to larger errors in V and subsequently in all parameters derived from either NaCl or fayalite volumes compared to a purely statistical approach (for example a weighted fit) but could very well be more representative of the real ΔV. Indeed, in many high-pressure studies, underestimated errors are often attributed to pressure and temperature mainly because pressure and thermal gradients are poorly known, the position of the thermocouple with respect to the sample could change with pressure and/or temperature, uncertainties in the EoS used to estimate pressure are not taken into account, etc.
3.3 Isothermal equation of state of fayalite
Unit-cell volumes (Table 1) as a function of stress-corrected pressure and temperature were fitted simultaneously in EosFit7.
We used both the second- and third-order Birch–Murnaghan (BM) EoS with a linear expression of .
Because high-temperature data measured at high pressure rarely have the precision of those at 1 atm, the modified Holland–Powell expression was chosen to calculate the thermal expansion (Angel et al., 2014).
An acceptable value of a fitted , 5.5 for KT=125.2 GPa, could be obtained after removing the room-temperature data, but uncertainties in all EoS parameters are large.
Therefore, for the third-order BM EoS we fixed at 5.3 (Nestola et al., 2011) to accommodate the small pressure range.
All results are listed in Table 2, and one can see that KT values are compatible with our previous value, GPa (Béjina et al., 2019), within the error bars.
This KT was obtained using all room-temperature data, including the pressurization cycle, and therefore with a much higher stress (Fig. 4).
The compatibility between room-temperature and high-temperature data, with different stress levels in both, is a hint that our pressure correction leads to reliable results.
Table 2Birch–Murnaghan EoS parameters determined from our XRD data at all temperatures using EoSFit7 with the modified Holland–Powell equation for thermal expansion (Angel et al., 2014).

a implied value; b fixed value.
As mentioned above high-pressure experiments rarely have precise temperature measurements.
Consequently the thermal parameters are not fully reliable and present large uncertainties.
Our expression of the thermal expansion tends to overestimate volumes at high temperature compared to Kroll et al. (2012), a point that we discuss in Sect. 4.1.
To circumvent this difficulty and test the validity of our values for KT, we fitted data at each temperature independently using a third-order BM EoS with (Fig. 5).
Obtained values of V0 and KT extrapolated to room pressure are listed in Table 3 as a function of temperature.
From these values, an overall GPa was calculated from a linear fit, KT=f(T), and Å3 was determined from the modified Holland–Powell equation (Angel et al., 2014).
Despite the dispersion in the data we found a KT(0,298) value compatible with the EoSFit7 results within the uncertainty, therefore validating the simultaneous fit to the whole dataset.
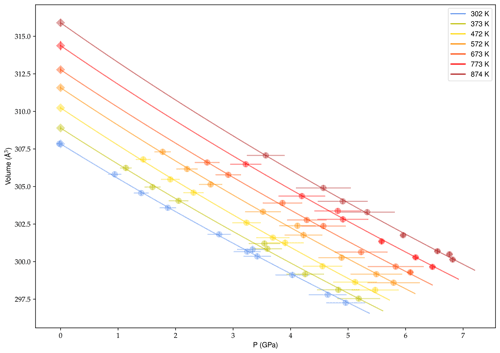
Table 3Third-order Birch–Murnaghan EoS parameters obtained from a weighted least-square fit of XRD data at each temperature; was fixed at 5.3 (Nestola et al., 2011).

3.4 Ks, , G and for fayalite
Following the procedure described, for example, in Kung et al. (2002) and using finite strain equations from Davies and Dziewoński (1975), we calculated KS0, G0 and their pressure derivatives at each temperature (Table 4). This method only uses the density of the sample and sound wave velocities and does not need an external pressure gauge such as NaCl (see also Li and Zhang, 2005). The formulation of Kung et al. (2002), thereafter named K02, is a truncated version of Davies and Dziewoński (1975), DD75, this latter giving access to second derivatives of KS and G with respect to pressure. Our data do not have the resolution necessary to obtain reliable values for these, but they nevertheless allow for the calculation of pressure. A comparison of the pressure calculated by the finite strain equations with PFa (Eq. 3) shows a remarkable agreement (Fig. 6). One can also see in Fig. 6 that uncorrected pressure is more discrepant. It is therefore not surprising that fitting and to the data at each temperature using the NaCl pressure scale gives results very close to those from the finite strain method (Table 4).
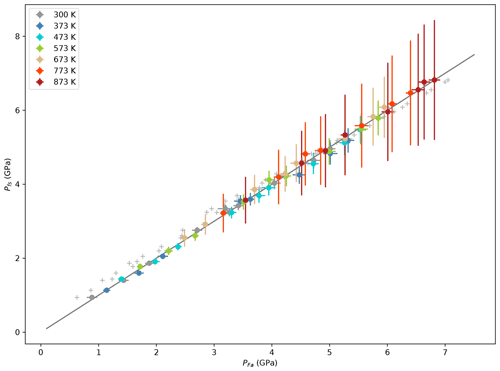
Figure 6Pressure calculated using the finite strain equations (Pfs) as a function of PFa obtained from unit-cell volumes of NaCl (using EoS by Brown, 1999) and corrected for differential stress in both Fa and NaCl. The line shows the 1:1 ratio (not a fit). Grey crosses show PNaCl not corrected for stress.
Table 4Adiabatic bulk modulus, shear modulus and their pressure derivatives from fitting finite strain equations at each temperature using the full form of Davies and Dziewoński (1975), DD75, or their truncated version from Kung et al. (2002), K02, or the stress-corrected NaCl pressure scale, PFa.
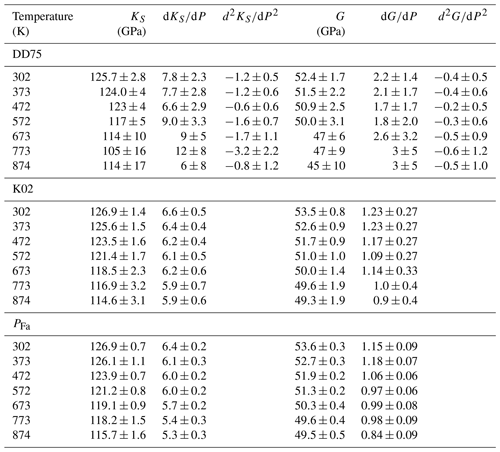
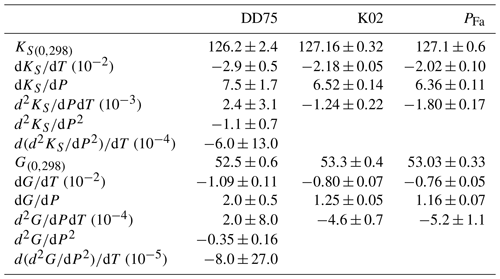
Table 5 lists the values of all elastic parameters at 298 K calculated after a linear fit of data from Table 4 as a function of temperature. While we list the results from both DD75 and K02 formulations, we only retain the values from the K02 equations because of the large uncertainties around the DD75 results. One can nevertheless note that the two formulations give similar results and that K02 values for KS, , G and are nearly identical to those obtained when fitting the data using PFa. On Fig. 7 we show the fit of K02 data (Table 4) as a function of T. Points at the highest temperatures may seem to diverge from the trends, but removing them does not significantly change the results of the weighted least-square fit. The value of KS we calculated at 298 K is very close to the one found for KT. The relation , with γ the Grüneisen parameter, α the thermal expansion and T the temperature, implies a KT about 1 % smaller than KS, a difference too small to resolve here because of our uncertainties.
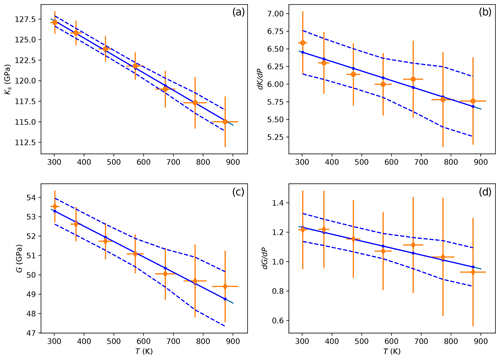
Figure 7(a, b) Adiabatic bulk modulus and its pressure derivative as a function of temperature. (c, d) Same for shear modulus. Fits are performed with the formulation by Kung et al. (2002). Solid blue lines are the results of a weighted least-square fit to the data, and dashed lines show the 95 % confidence interval. Results (labeled as K02) are listed in Table 5.
Table 5Results from a linear least-square fit of data (Table 4) with T using the formulations of Davies and Dziewoński (1975), DD75, and Kung et al. (2002), K02, and compared with fitting the data using PFa. Uncertainties are 1σ calculated from the covariance of the minimization. K and G are expressed in gigapascals, T in kelvin, and PFa in gigapascals.
4.1 The hard case of fayalite
4.1.1 Oxygen fugacity
Physical properties of Fe-rich minerals are always a challenge to study, in particular at high pressures. For example, variations in the ratio may cause volume changes that in turn may perturb measurements. A non-exhaustive search of experimentally measured unit-cell volumes (V0) of Fa at ambient conditions shows values between 306.9 Å3 (natural sample, Richard and Richet, 1990) and 310.1 Å3 (synthetic crystal, Graham et al., 1988), a range more than twice as large as that of forsterite, the pure Mg endmember of olivines. In a 1 atm furnace, performing annealing runs at constant oxygen fugacity (fO2), and therefore at a constant ratio, is feasible with proper gas mixtures. At high pressures, solid buffers are used to maintain the fO2 along a chemical equilibrium, often metal/metal oxide, and consequently the fO2 changes with temperature and pressure. It is therefore possible that the range of V0 mentioned above reflects the formation conditions and/or the thermal history of the different Fa specimens.
Our volume V0 fitted from high-temperature data down to room temperature (Table 2) is very close to that of the starting material (Béjina et al., 2019), but, nevertheless, our high-temperature volumes are larger than what is expected from thermal expansion expressions (e.g., Fei, 1995; Kroll et al., 2012). There are very few studies on point defects in minerals in relation to their unit-cell volumes and elastic properties. To our knowledge, among minerals present in planetary mantles, only defects in wüstite, FexO, have been studied in detail (McCammon and Liu, 1984; Zhang, 2000; Zhang and Zhao, 2005). These show that the cell parameter of FexO increases as the mineral tends toward perfect stoichiometry, i.e., as Fe2+ stoichiometry tends to 1. However, a comparison between wüstite and fayalite should be made with caution because the point-defect populations are very different in the two minerals. FeO is known for its non-stoichiometry allowing for the accommodation of high levels of metal vacancies (VFe) which form clusters of Fe3+ surrounded by VFe (e.g., Minervini and Grimes, 1999), clusters that are not present in fayalite (e.g., Nakamura and Schmalzried, 1983). On the other hand, in a non-stoichiometric Fe2SiO4 wadsleyite, Hazen et al. (2000) proposed that the substitution of 2Fe3+ for increases its unit-cell volume. A parallel could be made with the defect (Fe3+ on a Si4+ site) proposed in fayalite (Nakamura and Schmalzried, 1983; Hillert et al., 1996) that probably increases the size of the tetrahedron. Fe3+-related defects could very well lead to larger unit cells in Fe-bearing silicates. Like for most Fe-rich minerals, it is difficult to prepare perfectly stoichiometric fayalite. In our high-pressure experiment, our sample was placed in a BN sleeve, a very reducing material, but also in contact with Al2O3 and NaCl, making it difficult to estimate the oxygen fugacity in the cell assembly and therefore the nature of the point-defect population. One must also note that our maximum temperature is, so far, the highest at which Fa unit-cell volumes have been measured at high pressure.
4.1.2 Shear modulus
Our value of the shear modulus at room conditions, GPa, is close to previous data (Fig. 8). This is the first estimate of G and G′ obtained from ultrasonic interferometry and on an aggregate since the study by Chung (1971), all other studies having used Fa single crystals (Graham et al., 1988; Speziale et al., 2004). Except for the G′ data point of Chung (1971) that is very low, all G′ are within the range [1.2,1.8]. It is interesting to note that G seems less sensitive to the sample's environment than K. For example, it is accepted that S waves are less sensitive to differential stress than P waves, especially if the wave propagation direction is aligned with the maximum principal stress. Keeping in mind that , it is not surprising that G is less affected by differential stress.
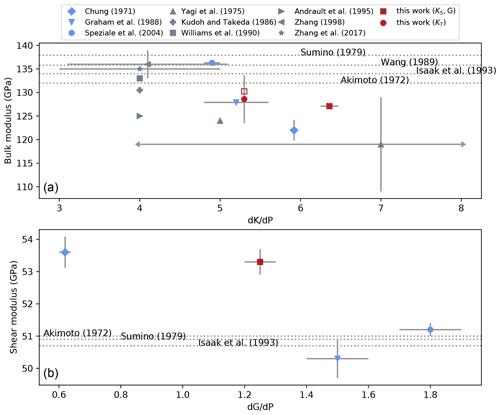
Figure 8Trend of two elastic parameters for fayalite with their respective pressure derivatives. (a) Bulk modulus versus . The blue color is for KS values, grey for KT and red for this study. KS and KT values are plotted as published, with no conversion from one to the other. The full red square is our data as reported in Table 4 (PFa), the open square being KS fitted to our data with fixed . Arrows at the end of error bars of the data of Yagi et al. (1975) symbolize that they extend outside the plot range. (b) Shear modulus versus . On both plots, a given symbol refers to the same publication. Dotted lines represent values of KS and G determined at room pressure; therefore, no pressure derivative was determined.
4.1.3 Bulk modulus
Comparing bulk moduli between studies is always difficult and more so than for G. For Fe–Mg olivines, G decreases linearly with XFe by about 30 GPa over the entire solid solution, whereas K varies by only a few gigapascals with no clear trend with XFe. As discussed, for example, in Angel (2000), the fitted values of K and K′ are often strongly correlated, and therefore, fixing either one affects the estimation of the other. This can be seen in Fig. 8 representing experimental values of K of fayalite plotted against . The figure shows a clear trend with a negative slope, meaning that as K′ increases, K decreases. Many high-pressure experiments, in particular in multi-anvil, only explore a limited pressure range. For such experiments, analyzing data often requires one to fix either K or K′ and calculate the other from a fit to the data. In our case, for example, Table 2 shows that for fixed at 4 (second-order BM EoS) and 5.3 (Nestola et al., 2011), KT varies by almost 3 GPa.
Another source of difficulty when comparing EoS parameters comes from the choice of a pressure scale. Historically the NaCl Decker scale (Decker, 1971) has been the most used one, but Strässle et al. (2014) proposed that the scale of Brown (1999) is more accurate. When measuring sound wave velocities, the finite strain approach (Davies and Dziewoński, 1975) allows for the determination of the elastic parameters without prior knowledge of the pressure, which can be calculated afterwards (see their Eq. 1c). These different methods can lead to small changes in pressure estimates with a strong impact on the determination of an EoS, in particular for .
Among other factors affecting the determination of K are, as mentioned above, the sample's stoichiometry and therefore the fO2 conditions of the experiment, as well as the (often ignored) level of non-hydrostaticity of most high-pressure experiments.
Our result for KT measured at room temperature, GPa for (Table 3), is within the uncertainties of our previous estimate (Béjina et al., 2019).
Our choice of comes from the high accuracy of the data of Nestola et al. (2011) measured for olivines with XFe between 8 % and 38 %, close to estimates, (Speziale et al., 2004) and 5.2 (Graham et al., 1988), for fayalite.
When recalculating KT using EoSFit7 and high-temperature data as well, we obtain GPa for the same (Table 2).
From the relation between KS and KT given in Sect. 3.4, one would expect KS≃131 GPa with at 300 K.
The values we deduced from our dataset are GPa and (Table 5).
Fixing at 5.3 would increase KS to about 130 GPa, a value very consistent with our estimate of KT (Table 2).
These values follow the trend from previous studies (Fig. 8) and therefore are in general agreement with these.
From this figure, KS and of fayalite seem to fall in a limited range, [125,135] GPa and [4,6.5] respectively.
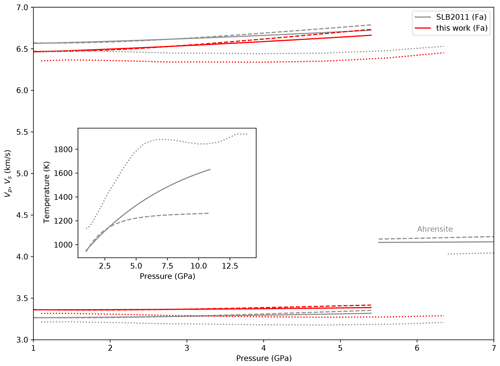
Figure 9P wave (top) and S wave (bottom) velocities in fayalite calculated with burnman (Cottaar et al., 2014) using the formalism of EoS of Stixrude and Lithgow-Bertelloni (2011) (SLB2011). Full lines are Mars profiles along the hot areotherm A and dashed lines along the cold areotherm C of Bertka and Fei (1997). Dotted lines are along a geotherm (Priestley and McKenzie, 2013) included in burnman. Pressure and temperature profiles are shown in the inset. Red lines are velocities calculated using the elastic parameters from this work and grey curves those for parameters from Stixrude and Lithgow-Bertelloni (2011). S wave velocities in ahrensite are also shown to visualize the velocity jump when transiting to the spinel structure.
It is in general difficult to pinpoint a main reason for low values of KS even when correlated with high . Among a variety of reasons, we possibly have the wrong temperature reading of the thermocouple, the effect of oxygen fugacity and hence point defects on the elasticity of the olivine structure, the effect of differential stress (Yagi et al., 1975), compositional inhomogeneities or microstructure irregularities, etc. In our case, one could argue that the transition of our Fa specimen to ahrensite (Ahr) may have impacted our estimates of the elastic parameters. However we emphasize that no Ahr was observed by SEM, no distinct Ahr peaks can be seen on the XRD patterns, and sound velocities do not increase when approaching the phase boundary as seen by Liu et al. (2010).
In their study of nanocrystalline forsterite (11 nm grain size prior to the experiment), Couvy et al. (2010) proposed that a small grain size (i.e., many grain boundaries and triple junctions) leads to a lower KT. This effect has been observed in different materials and for grain sizes usually below 100 nm (e.g., see Marquardt et al., 2011, for MgO and references therein for other materials). To our knowledge no systematic studies have been performed, in particular on olivines, to quantify this effect of grain size on the bulk modulus. The grain size of our Fa sample, prepared from nano-size oxide powders, was about 1 µm prior to the experiment and around 3 µm after. Even though much larger than 100 nm, we cannot rule out that the grain size of our sample could be small enough to start affecting its elastic properties. This assumption is difficult to verify because postmortem microstructures are rarely described in most studies.
4.2 Seismic velocities in Mars' upper mantle
In order to visualize the effect of fayalite elastic parameters on P and S wave velocities, we calculated Vp and Vs using the Python package burnman (Cottaar et al., 2014) with the formalism of Stixrude and Lithgow-Bertelloni (2011) (SLB2011) and data for fayalite (KT0=135 GPa, , G=50.9 GPa, ) and then with our determination of these parameters (Table 5).
We kept the temperature-dependent parameters of SLB2011 because of the large uncertainties in ours.
Figure 9 represents the P and S velocities in Fa as a function of pressure along two areotherms for Mars (profiles A and C of Bertka and Fei, 1997) and a geotherm from the CAM2016 model (Priestley and McKenzie, 2013).
We chose this geotherm in order to have a very different temperature profile compared to the two areotherms.
This figure shows that the differences in P and S velocities with the change in parameters are very small.
For the geotherm the effect of the hot temperatures prevails over that of pressure, and we observe a decrease in the velocities up to about 5 GPa.
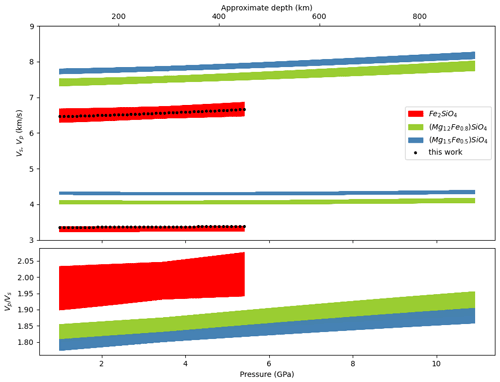
Figure 10Velocity profiles in Mars' upper mantle calculated with burnman using the formulation of Stixrude and Lithgow-Bertelloni (2011). The black dots represent the velocities for fayalite using our KS, , G and . The red, green and blue domains are the ranges of velocities calculated when varying thermoelastic parameters, as described in the text.
To further test the influence of elastic parameters of Fa on its P and S velocities, we performed the same calculations along the areotherm A from Bertka and Fei (1997), allowing all parameters from the SLB2011 EoS to vary in the intervals: GPa, GPa, , , the Debye temperature K, the Grüneisen parameter and exponent . Figure 10 shows Vp, Vs and along this areotherm for Fa and two olivines: one with 25 mol % Fe and one with 40 mol % Fe. The EoS for these olivines are calculated by mixing Fe and Mg olivine endmembers according to their molar fraction (Cottaar et al., 2014). In our calculation, only Fa parameters vary, those of forsterite (Fo) being considered as perfectly determined. Consequently mixing Fo and Fa parameters to calculate velocities results in smaller domains of possible velocities compared to pure Fa, but the difference in velocities between these two olivines is rather small. This could be a challenge when fitting data from the SEIS instrument.
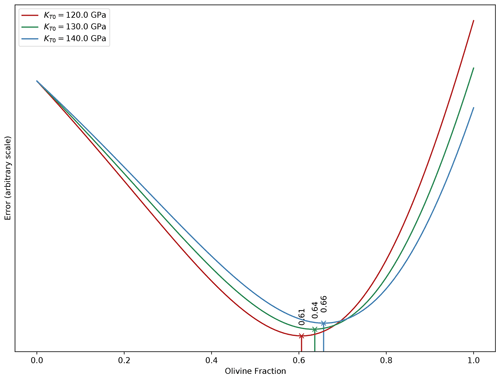
Figure 11Optimum olivine contents determined by adjusting Vp of a simple upper-mantle model to PREM using burnman for three KT values for fayalite.
Large variations in KT produce small changes in olivine fractions. See text for calculation details.
Another way to look at this is to test the effect of the bulk modulus on the optimized olivine content resulting from a fit of a simple model of Earth's upper mantle to the Preliminary Reference Earth Model (PREM) (Davies and Dziewoński, 1975) using burnman.
We only test here the sensitivity with K because its experimental determination presents a much larger dispersion than G.
We built a very simple model of the Earth's upper mantle with three mineral phases: olivine, orthopyroxene (Opx) and garnet (Gt), all three being simple Fe–Mg solid solutions.
The molar percentage ratio of Opx to Gt was fixed at 2:1, and only the olivine fraction was optimized.
These calculations were done for three values of the olivine KT0, 120, 130 and 140 GPa, which correspond approximately to the range of experimental values determined for this mineral.
The properties of this modeled rock were calculated as described by Cottaar et al. (2014) along a geotherm (Anderson, 1982, provided by burnman).
Figure 11 shows that the three optimum olivine contents fall in a tight range despite the large variation in KT0, between 61 mol % and 66 mol %.
Therefore, considering the uncertainties in the effect of Fe on the bulk modulus of olivine, it is difficult to say at this point if the SEIS data will have the necessary resolution to determine the Fe concentration of the minerals of Mars' upper mantle with an uncertainty less than 15 %.
The bulk and shear moduli of fayalite presented here are the first to be determined by coupled synchrotron X-ray radiation and ultrasonic interferometry. A fit using the third-order Birch–Murnaghan EoS with (fixed) to the data gives GPa at room conditions, whereas GPa and were obtained from sound wave velocities. Fixing to 5.3 increases KS to 130 GPa, therefore showing that our KT and KS are compatible within uncertainties. These values of K and K′ follow the linear trend defined by previously published data. The shear modulus values of fayalite show less dispersion than the bulk modulus; therefore, the latter will be critical when fitting a mineralogical model to Mars InSight SEIS data. The range of K values for the olivine Fe–Mg solid solution is defined between about 125 and 135 GPa. With such variation, a precise compositional and mineralogical model of the Mars mantle will be challenging to obtain. Because experiments on Fe-rich minerals are always difficult, more experiments are needed to better define the trend of K with XFe so that more robust values of K can be established for minerals with an Fe content consistent with Mars' mantle composition.
Data are provided in the main text and in the Supplement.
The supplement related to this article is available online at: https://doi.org/10.5194/ejm-33-519-2021-supplement.
FB and MB designed the experiment. FB analyzed the data and wrote the manuscript. MB analyzed ultrasonic data and corrected the manuscript. All authors participated in running the experiment.
The authors declare that they have no conflict of interest.
Publisher's note: Copernicus Publications remains neutral with regard to jurisdictional claims in published maps and institutional affiliations.
This article is part of the special issue “Probing the Earth: experiments and mineral physics at mantle depths”. It is a result of the 17th International Symposium on Experimental Mineralogy, Petrology and Geochemistry, Potsdam, Germany, 21–24 June 2020.
The high-pressure experiments were performed at hutch X17B2 of NSLS (Brookhaven National Lab.) thanks to the support of COMPRES. We would also like to thank the two anonymous reviewers for their constructive remarks.
This research has been supported by the TS8 CNES, focusing on Mars InSight SEIS, and by ANR MAGIS (grant no. ANR-19-CE31-0008-08).
This paper was edited by Monika Koch-Müller and reviewed by two anonymous referees.
Anderson, O. L.: The Earth's core and the phase diagram of iron, Philos. T. R. Soc. A, 306, 21–35, https://doi.org/10.1098/rsta.1982.0063, 1982. a
Andrault, D., Bouhifd, M., Itié, J., and Richet, P.: TS3 Compression and amorphization of (Mg,Fe)2SiO4 olivines: An X-ray diffraction study up to 70 GPa, Phys. Chem. Miner., 22, 99–107, https://doi.org/10.1007/BF00202469, 1995.
Angel, R. J.: Equations of State, Rev. Mineral. Geochem., 41, 35–59, https://doi.org/10.2138/rmg.2000.41.2, 2000. a
Angel, R. J., Alvaro, M., and González-Platas, J.: EosFit7c and a Fortran module (library) for equation of state calculations, Z. Kristallogr., 229, 405–419, https://doi.org/10.1515/zkri-2013-1711, 2014. a, b, c, d
Béjina, F. and Bystricky, M.: Use of the spark plasma sintering technique for the synthesis of dense mineral aggregates suitable for high-pressure experiments, High Pressure Res., 29, 630–634, https://doi.org/10.1080/08957950903425249, 2009. a
Béjina, F., Bystricky, M., Tercé, N., Whitaker, M. L., and Chen, H.: Bulk modulus of Fe-rich olivines corrected for non-hydrostaticity, C. R. Geosci., 351, 86–94, https://doi.org/10.1016/j.crte.2018.06.002, 2019. a, b, c, d, e, f, g, h, i, j, k
Bertka, C. M. and Fei, Y.: Mineralogy of the Martian interior up to core-mantle boundary pressures, J. Geophys. Res., 102, 5251–5264, https://doi.org/10.1029/96JB03270, 1997. a, b, c
Birch, F.: Finite elastic Strain of cubic Crystals, Phys. Rev., 71, 809–824, https://doi.org/10.1103/PhysRev.71.809, 1947. a
Brown, J. M.: The NaCl pressure standard, J. Appl. Phys., 86, 5801–5808, https://doi.org/10.1063/1.371596, 1999. a, b, c, d, e
Chen, J., Li, L., Yu, T., Long, H., Weidner, D., Wang, L., and Vaughan, M.: Do Reuss and Voigt bounds really bound in high-pressure rheology experiments?, J. Phys., 18, S1049–S1059, https://doi.org/10.1088/0953-8984/18/25/S11, 2006. a
Chung, D. H.: Elasticity and equations of state of olivines in the Mg2SiO4-Fe2SiO4 system, Geophys. J. Int., 25, 511–538, https://doi.org/10.1111/j.1365-246x.1971.tb02201.x, 1971. a, b, c
Cottaar, S., Heister, T., Rose, I., and Unterborn, C.: BurnMan: A lower mantle mineral physics toolkit, Geochem. Geophy. Geosy., 15, 1164–1179, https://doi.org/10.1002/2013GC005122, 2014. a, b, c, d
Couvy, H., Chen, J., and Drozd, V.: Compressibility of nanocrystalline forsterite, Phys. Chem. Miner., 37, 343–351, https://doi.org/10.1007/s00269-009-0337-8, 2010. a
Davies, G. F. and Dziewoński, A. M.: Homogeneity and constitution of the Earth's lower mantle and outer core, Phys. Earth Planet. Int., 10, 336–343, https://doi.org/10.1016/0031-9201(75)90060-6, 1975. a, b, c, d, e, f
Decker, D. L.: High-Pressure Equation of State for NaCl, KCl, and CsCl, J. Appl. Phys., 42, 3239–3244, https://doi.org/10.1063/1.1660714, 1971. a
Dreibus, G. and Wänke, H.: Mars, a volatile-rich planet, Meteoritics, 20, 367–381, 1985. a
Fei, Y.: Thermal Expansion, in: Mineral Physics & Crystallography: A Handbook of Physical Constants, edited by: Ahrens, T. J., AGU, Washington, DC, 29–44, https://doi.org/10.1029/RF002p0029, 1995. a
Graham, E. K., Schwab, J. A., Sopkin, S. M., and Takei, H.: The pressure and temperature dependence of the elastic properties of single-crystal Fayalite Fe2SiO4, Phys. Chem. Miner., 16, 186–198, https://doi.org/10.1007/BF00203203, 1988. a, b, c, d
Guignard, J., Bystricky, M., and Béjina, F.: Dense fine-grained aggregates prepared by spark plasma sintering (SPS), an original technique in experimental petrology, Eur. J. Mineral., 23, 323–331, https://doi.org/10.1127/0935-1221/2011/0023-2099, 2011. a
Hazen, R., Yang, H., and Prewitt, C.: High-pressure crystal chemistry of Fe3+-wadsleyite, β-Fe2.33Si0.67O4, Am. Mineral., 85, 778–783, https://doi.org/10.2138/am-2000-5-618, 2000. a
Hearmon, R. F. S.: The elastic constants of anisotropic materials – II, Adv. Phys., 5, 323–382, https://doi.org/10.1080/00018732.1956.tADP0323, 1956. a
Hillert, M., Selleby, M., and Sundman, B.: A Reassessment of the Non-Stoichiometry of Fayalite, Phys. Chem. Miner., 23, 387–390, https://doi.org/10.1007/BF00199504, 1996. a
Holland, T. J. B. and Redfern, S. A. T.: Unit cell refinement from powder diffraction data: the use of regression diagnostics, Mineral. Mag., 61, 65–77, https://doi.org/10.1107/S0021889896011673, 1997. a
Isaak, D. G., Graham, E. K., Bass, J. D., and Wang, H.: The elastic properties of single-crystal fayalite as determined by dynamical measurement techniques, Pure Appl. Geophys., 141, 393–414, https://doi.org/10.1007/BF00998337, 1993. a
Krischer, L., Megies, T., Barsch, R., Beyreuther, M., Lecocq, T., Caudron, C., and Wassermann, J.: ObsPy: a bridge for seismology into the scientific Python ecosystem, Comput. Sci. Discov., 8, 014003, https://doi.org/10.1088/1749-4699/8/1/014003, 2015. a
Kroll, H., Kirfel, A., Heinemann, R., and Barbier, B.: Volume thermal expansion and related thermophysical parameters in the Mg,Fe olivine solid-solution series, Eur. J. Mineral., 24, 935–956, https://doi.org/10.1127/0935-1221/2012/0024-2235, 2012. a, b
Kudoh, Y. and Takeda, H.: Single crystal X-ray diffraction study on the bond compressibility of Fayalite, Fe2SiO4 and Rutile, TiO2 under high pressure, Physica B+C, 139–140, 333–336, https://doi.org/10.1016/0378-4363(86)90591-7, 1986.
Kung, J., Li, B., Weidner, D., Zhang, J., and Liebermann, R.: Elasticity of (Mg0.83,Fe0.17)O ferropericlase at high pressure: ultrasonic measurements in conjunction with X-radiation techniques, Earth Planet. Sc. Lett., 203, 557–566, https://doi.org/10.1016/S0012-821X(02)00838-5, 2002. a, b, c, d, e, f
Li, B. and Zhang, J.: Pressure and temperature dependence of elastic wave velocity of MgSiO3 perovskite and the composition of the lower mantle, Phys. Earth Planet. Int., 151, 143–154, https://doi.org/10.1016/j.pepi.2005.02.004, 2005. a
Li, B., Kung, J., and Liebermann, R. C.: Modern techniques in measuring elasticity of Earth materials at high pressure and high temperature using ultrasonic interferometry in conjunction with synchrotron X-radiation in multi-anvil apparatus, Phys. Earth Planet. Int., 143-144, 559–574, https://doi.org/10.1016/j.pepi.2003.09.020, 2004. a
Liu, Q., Liu, W., Whitaker, M. L., Wang, L., and Li, B.: In situ ultrasonic velocity measurements across the olivine-spinel transformation in Fe2SiO4, Am. Mineral., 95, 1000–1005, https://doi.org/10.2138/am.2010.3369, 2010. a, b
Liu, W., Kung, J., and Li, B.: Elasticity of San Carlos olivine to 8 GPa and 1073 K, Geophys. Res. Lett., 32, L16301, https://doi.org/10.1029/2005GL023453, 2005. a
Lognonne, P., Banerdt, W. B., Giardini, D., Pike, W. T., TS10 Christensen, U., Laudet, P., de Raucourt, S., Zweifel, P., Calcutt, S., Bierwirth, M., Hurst, K. J., Ijpelaan, F., Umland, J. W., Llorca-Cejudo, R., Larson, S. A., Garcia, R. F., Kedar, S., Knapmeyer-Endrun, B., Mimoun, D., Mocquet, A., Panning, M. P., Weber, R. C., Sylvestre-Baron, A., Pont, G., Verdier, N., Kerjean, L., Facto, L. J., Gharakanian, V., Feldman, J. E., Hoffman, T. L., Klein, D. B., Klein, K., Onufer, N. P., Paredes-Garcia, J., Petkov, M. P., Willis, J. R., Smrekar, S. E., Drilleau, M., Gabsi, T., Nebut, T., Robert, O., Tillier, S., Moreau, C., Parise, M., Aveni, G., Ben Charef, S., Bennour, Y., Camus, T., Dandonneau, P. A., Desfoux, C., Lecomte, B., Pot, O., Revuz, P., Mance, D., tenPierick, J., Bowles, N. E., Charalambous, C., Delahunty, A. K., Hurley, J., Irshad, R., Liu, Huafeng, Mukherjee, A. G., Standley, I. M., Stott, A. E., Temple, J., Warren, T., Eberhardt, M., Kramer, A., Kühne, W., Miettinen, E. P., Monecke, M., Aicardi, C., André, M., Baroukh, J., Borrien, A., Bouisset, A., Boutte, P., Brethomé, K., Brysbaert, C., Carlier, T., Deleuze, M., Desmarres, J. M., Dilhan, D., Doucet, C., Faye, D., Faye- Refalo, N., Gonzalez, R., Imbert, C., Larigauderie, C., Locatelli, E., Luno, L., Meyer, J. R., Mialhe, F., Mouret, J. M., Nonon, M., Pahn, Y., Paillet, A., Pasquier, P., Perez, G., Pérez, R., Perrin, L., Pouilloux, B., Rosak, A., de Larclause, I. Savin, Sicre, J., Sodki, M., Toulemont, N., Vella, B., Yana, C., Alibay, F., Avalos, O. M., Balzer, M. A., Bhandari, P., Blanco, E., Bone, B. D., Bousman, J. C., Bruneau, P., Calef, F. J., Calvet, R. J., D’Agostino, S. A., de los Santos, G., Deen, R. G., Denise, R. W., Ervin, J., Ferraro, N. W., Gengl, H. E., Grinblat, F., Hernandez, D., Hetzel, M., Johnson, M. E., Khachikyan, L., Lin, J. Y., Madzunkov, S. M., Marshall, S. L., Mikellides, I. G., Miller, E. A., Raff, W., Singer, J. E., Sunday, C. M., Villalvazo, J. F., Wallace, M. C., Banfield, D., Rodriguez-Manfredi, J. A., Russell, C. T., Trebi-Ollennu, A., Maki, J. N., Beucler, E., Böse, M., Bonjour, C., Berenguer, J. L., Ceylan, S., Clinton, J., Conejero, V., Daubar, I., Dehant, V., Delage, P., Euchner, F., Estève, I., Fayon, L., Ferraioli, L., Johnson, C. L., Gagnepain- Beyneix, J., Golombek, M., Khan, A., Kawamura, T., Kenda, B., Labrot, P., Murdoch, N., Pardo, C., Perrin, C., Pou, L., Sauron, A., Savoie, D., Stähler, S., Stutzmann, E., Teanby, N. A., Tromp, J., van Driel, M., Wieczorek, M., Widmer-Schnidrig, R., and Wookey, J.: SEIS: Insight's Seismic Experiment for Internal Structure of Mars, Space Sci. Rev., 215, 12, https://doi.org/10.1007/s11214-018-0574-6, 2019. a
Marquardt, H., Gleason, A., Marquardt, K., Speziale, S., Miyagi, L., Neusser, G., Wenk, H.-R., and Jeanloz, R.: Elastic properties of MgO nanocrystals and grain boundaries at high pressures by Brillouin scattering, Phys. Rev. B, 84, 064131, https://doi.org/10.1103/PhysRevB.84.064131, 2011. a
McCammon, C. A. and Liu, L.-G.: The effects of pressure and temperature on nonstoichiometric wüstite, FexO: The iron-rich phase boundary, Phys. Chem. Miner., 10, 106–113, https://doi.org/10.1007/BF00309644, 1984. a
Minervini, L. and Grimes, R. W.: Defect clustering in wüstite, J. Phys. Chem. Solids, 60, 235–245, https://doi.org/10.1016/S0022-3697(98)00273-X, 1999. a
Nakamura, A. and Schmalzried, H.: On the Nonstoichiometry and Point Defects of Olivine, Phys. Chem. Miner., 10, 27–37, https://doi.org/10.1007/BF01204323, 1983. a, b
Nestola, F., Pasqual, D., Smyth, J. R., Novella, D., Secco, L., Manghnani, M. H., and Dal Negro, A.: New accurate elastic parameters for the forsterite-fayalite solid solution, Am. Mineral., 96, 1742–1747, https://doi.org/10.2138/am.2011.3829, 2011. a, b, c, d, e, f
Newville, M., Stensitzki, T., Allen, D. B., and Ingargiola, A.: LMFIT: Non-Linear Least-Square Minimization and Curve-Fitting for Python, Zenodo [data set], https://doi.org/10.5281/zenodo.4516651, 2014. a
Pamato, M. G., Nestola, F., Novella, D., Smyth, J. R., Pasqual, D., Gatta, G. D., Alvaro, M., and Secco, L.: The High-Pressure Structural Evolution of Olivine along the Forsterite–Fayalite Join, Minerals, 9, 790, https://doi.org/10.3390/min9120790, 2019. a, b
Plymate, T. and Stout, J.: Pressure-volume-temperature behavior of fayalite based on static compression measurements at 400∘C, Phys. Chem. Miner., 17, 413–420https://doi.org/10.1007/BF00201452, 1990. a
Priestley, K. and McKenzie, D.: The relationship between shear wave velocity, temperature, attenuation and viscosity in the shallow part of the mantle, Earth Planet. Sc. Lett., 381, 78–91, https://doi.org/10.1016/j.epsl.2013.08.022, 2013. a, b
Richard, G. and Richet, P.: Room-temperature amorphlzation of fayalite and high-pressure properties of Fe2SiO4 liquid, Geophys. Res. Lett., 17, 2093–2096, https://doi.org/10.1029/GL017i012p02093, 1990. a
Singh, A., Balasingh, C., Mao, H.-K., Hemley, R., and Shu, J.: Analysis of lattice strains measured under nonhydrostatic pressure, J. Appl. Phys., 83, 7567–7575, https://doi.org/10.1063/1.367872, 1998. a, b, c, d, e, f
Smyth, J. R.: High temperature crystal chemistry of Fayalite, Am. Mineral., 60, 1092–1097, 1975. a
Spetzler, H., Sammis, C. G., and O'Connell, R. J.: Equation of state of NaCl: Ultrasonic measurements to 8 kbar and 800 ∘C and static lattice theory, J. Phys. Chem. Solids, 33, 1727–1750, https://doi.org/10.1016/S0022-3697(72)80468-2, 1972. a
Speziale, S., Duffy, T. S., and Angel, R. J.: Single-crystal elasticity of fayalite to 12 GPa, J. Geophys. Res., 109, B12202, https://doi.org/10.1029/2004JB003162, 2004. a, b
Stackhouse, S., Stixrude, L., and Karki, B.: Determination of the high-pressure properties of fayalite from first-principles calculations, Earth Planet. Sc. Lett., 289, 449–456, https://doi.org/10.1016/j.epsl.2009.11.033, 2010. a
Stähler, S. C., Khan, A., Banerdt, W. B., Lognonné, P., Giardini, D., and Ceylan, S., Drilleau, M., Duran, A. C., Garcia, R. F., Huang, Q., Kim, D., Lekic, V., Samuel, H., Schimmel, M., Schmerr, N., Sollberger, D., Stutzmann, É., Xu, Z., Antonangeli, D., Charalambous, C., Davis, P. M., Irving, J. C. E., Kawamura, T., Knapmeyer, M., Maguire, R., Marusiak, A. G., Panning, M. P., Perrin, C., Plesa, A.-C., Rivoldini, A., Schmelzbach, C., Zenhäusern, G., Beucler, É., Clinton, J., Dahmen, N., van Driel, M., Gudkova, T., Horleston, A., Pike, W. T., Plasman, M., and Smrekar, S. E.: Seismic Detection of the Martian Core, Science, 373, 443–448, https://doi.org/10.1126/science.abi7730, 2021. a
Stixrude, L. and Lithgow-Bertelloni, C.: Thermodynamics of mantle minerals - I. Physical properties, Geophys. J. Int., 162, 610–632, https://doi.org/10.1111/j.1365-246X.2005.02642.x, 2005. a
Stixrude, L. and Lithgow-Bertelloni, C.: Thermodynamics of mantle minerals – II. Phase equilibria, Geophys. J. Int., 184, 1180–1213, https://doi.org/10.1111/j.1365-246X.2010.04890.x, 2011. a, b, c, d
Strässle, T., Klotz, S., Kunc, K., Pomjakushin, V., and White, J. S.: Equation of state of lead from high-pressure neutron diffraction up to 8.9 GPa and its implication for the NaCl pressure scale, Phys. Rev. B, 90, 014101, https://doi.org/10.1103/PhysRevB.90.014101, 2014. a, b
Sumino, Y.: The elastic constants of Mn2SiO4, Fe2SiO4 and Co2SiO4, and the elastic properties of olivine group minerals at high temperature, J. Phys. Earth, 27, 209–238, https://doi.org/10.4294/jpe1952.27.209, 1979. a
Taylor, G. J.: The bulk composition of Mars, Chem. Erde, 73, 401–420, https://doi.org/10.1016/j.chemer.2013.09.006, 2013. a
Weidner, D. J., Vaughan, M. T., Wang, L., Long, H., Li, L., Dixon, N. A., and Durham, W. B.: Precise stress measurements with white synchrotron x rays, Rev. Sci. Instrum., 81, 013903, https://doi.org/10.1063/1.3263760, 2010. a, b, c
Whitaker, M. L., Baldwin, K. J., and Huebsch, W. R.: DIASCoPE: Directly integrated acoustic system combined with pressure experiments – A new method for fast acoustic velocity measurements at high pressure, Rev. Sci. Instrum., 88, 034901, https://doi.org/10.1063/1.4977596, 2017. a, b, c, d
Williams, Q., Knittle, E., Reichlin, R., Martin, S., and Jeanloz, R.: Structural and electronic properties of Fe2SiO4-Fayalite at ultrahigh pressures: Amorphization and gap closure, J. Geophys. Res., 95, 21549–21563, https://doi.org/10.1029/JB095iB13p21549, 1990.
Witze, A.: Seismic ripples reveal size of Mars's core, Nature, 591, 514–515, https://doi.org/10.1038/d41586-021-00696-7, 2021. a
Wojdyr, M.: Fityk: a general-purpose peak fitting program, J. Appl. Crystallogr., 43, 1126–1128, https://doi.org/10.1107/S0021889810030499, 2010. a
Yagi, T., Ida, Y., Sato, Y., and Akimoto, S.-I.: Effect of hydrostatic pressure on the lattice parameters of Fe2SiO4 olivine up to 70 kbar, Phys. Earth Planet. Int., 10, 348–354, https://doi.org/10.1016/0031-9201(75)90062-X, 1975. a, b
Zhang, J.: Effect of defects on the elastic properties of wüstite, Phys. Rev. Lett., 84, 507–510, https://doi.org/10.1103/PhysRevLett.84.507, 2000. a
Zhang, L.: Single crystal hydrostatic compression of (Mg, Mn, Fe, Co)2SiO4 olivines, Phys. Chem. Miner., 25, 308–312, https://doi.org/10.1007/s002690050119, 1998.
Zhang, J. and Zhao, Y.: Effects of defect and pressure on the thermal expansivity of FexO, Phys. Chem. Miner., 32, 241–247, https://doi.org/10.1007/s00269-005-0447-x, 2005. a
Zhang, J. S., Hu, Y., Shelton, H., Kung, J., and Dera, P.: Single-crystal X-ray diffraction study of Fe2SiO4 Fayalite up to 31 GPa, Phys. Chem. Miner., 44, 171–179, https://doi.org/10.1007/s00269-016-0846-1, 2017.


