the Creative Commons Attribution 4.0 License.
the Creative Commons Attribution 4.0 License.
 | 19 Jul 2021
First-principles modeling of the infrared spectrum of antigorite
Etienne Balan
Emmanuel Fritsch
Guillaume Radtke
Lorenzo Paulatto
Farid Juillot
Sabine Petit
The infrared absorption spectrum of a natural antigorite sample from New Caledonia is compared to its theoretical counterpart computed for the pristine antigorite m=17 polysome within the density functional perturbation theory framework. The theoretical model reproduces most of the bands related to Si-O stretching in the 800–1300 cm−1 range, OH libration, hindered OH translation and SiO4 bending in the 400–800 cm−1 range, and OH stretching in the 3500–3700 cm−1 range. Most of the observed bands have a composite nature involving several vibrational modes contributing to their intensity, except the apical and one of the basal Si-O stretching bands whose intensity is carried by a single mode. The peculiarity of the antigorite structure favors a localization of the Si-O and OH stretching modes in specific regions of the unit cell. Weaker Si-O stretching bands experimentally observed at 1205 and 1130 cm−1 are related to the occurrence of 6- and 8-reversals in the antigorite structure, respectively. The distribution of OH bond lengths leads to an asymmetric distribution of frequencies consistent with the width and the shape of the experimentally observed OH stretching band. It also leads to a strong distribution of OH libration frequencies ranging from 600 to 830 cm−1 explaining the asymmetry of the band observed at 648 cm−1 in the antigorite spectrum.
- Article
(8747 KB) - Full-text XML
-
Supplement
(24867 KB) - BibTeX
- EndNote


Serpentine-group minerals are hydrous phyllosilicates produced by the hydrothermal alteration of anhydrous (Mg,Fe) silicates. As serpentinites carry water and fluid-mobile elements during subduction processes, they play a key role in the geochemical coupling between external and internal envelopes of the Earth (Deschamps et al., 2013). Natural samples often display a mixture of different varieties of serpentine minerals, which are characterized by the geometry of their layered structure (Wicks and O'Hanley, 1988). The three most common varieties are lizardite, antigorite, and chrysotile, which display flat layers, corrugated layers, or occur as multi-wall hollow nanotubes, respectively. Antigorite is dominant in high-grade metamorphic rocks (e.g., Schwartz et al., 2013) and its dehydration is expected to play a key role in the rheology of oceanic lithosphere (e.g., Wunder et al., 2001), and in the generation of arc magmas (Ulmer and Trommsdorff, 1995) and intermediate depth (50–200 km) seismicity (e.g., Dobson et al., 2002; Hilairet et al., 2006).
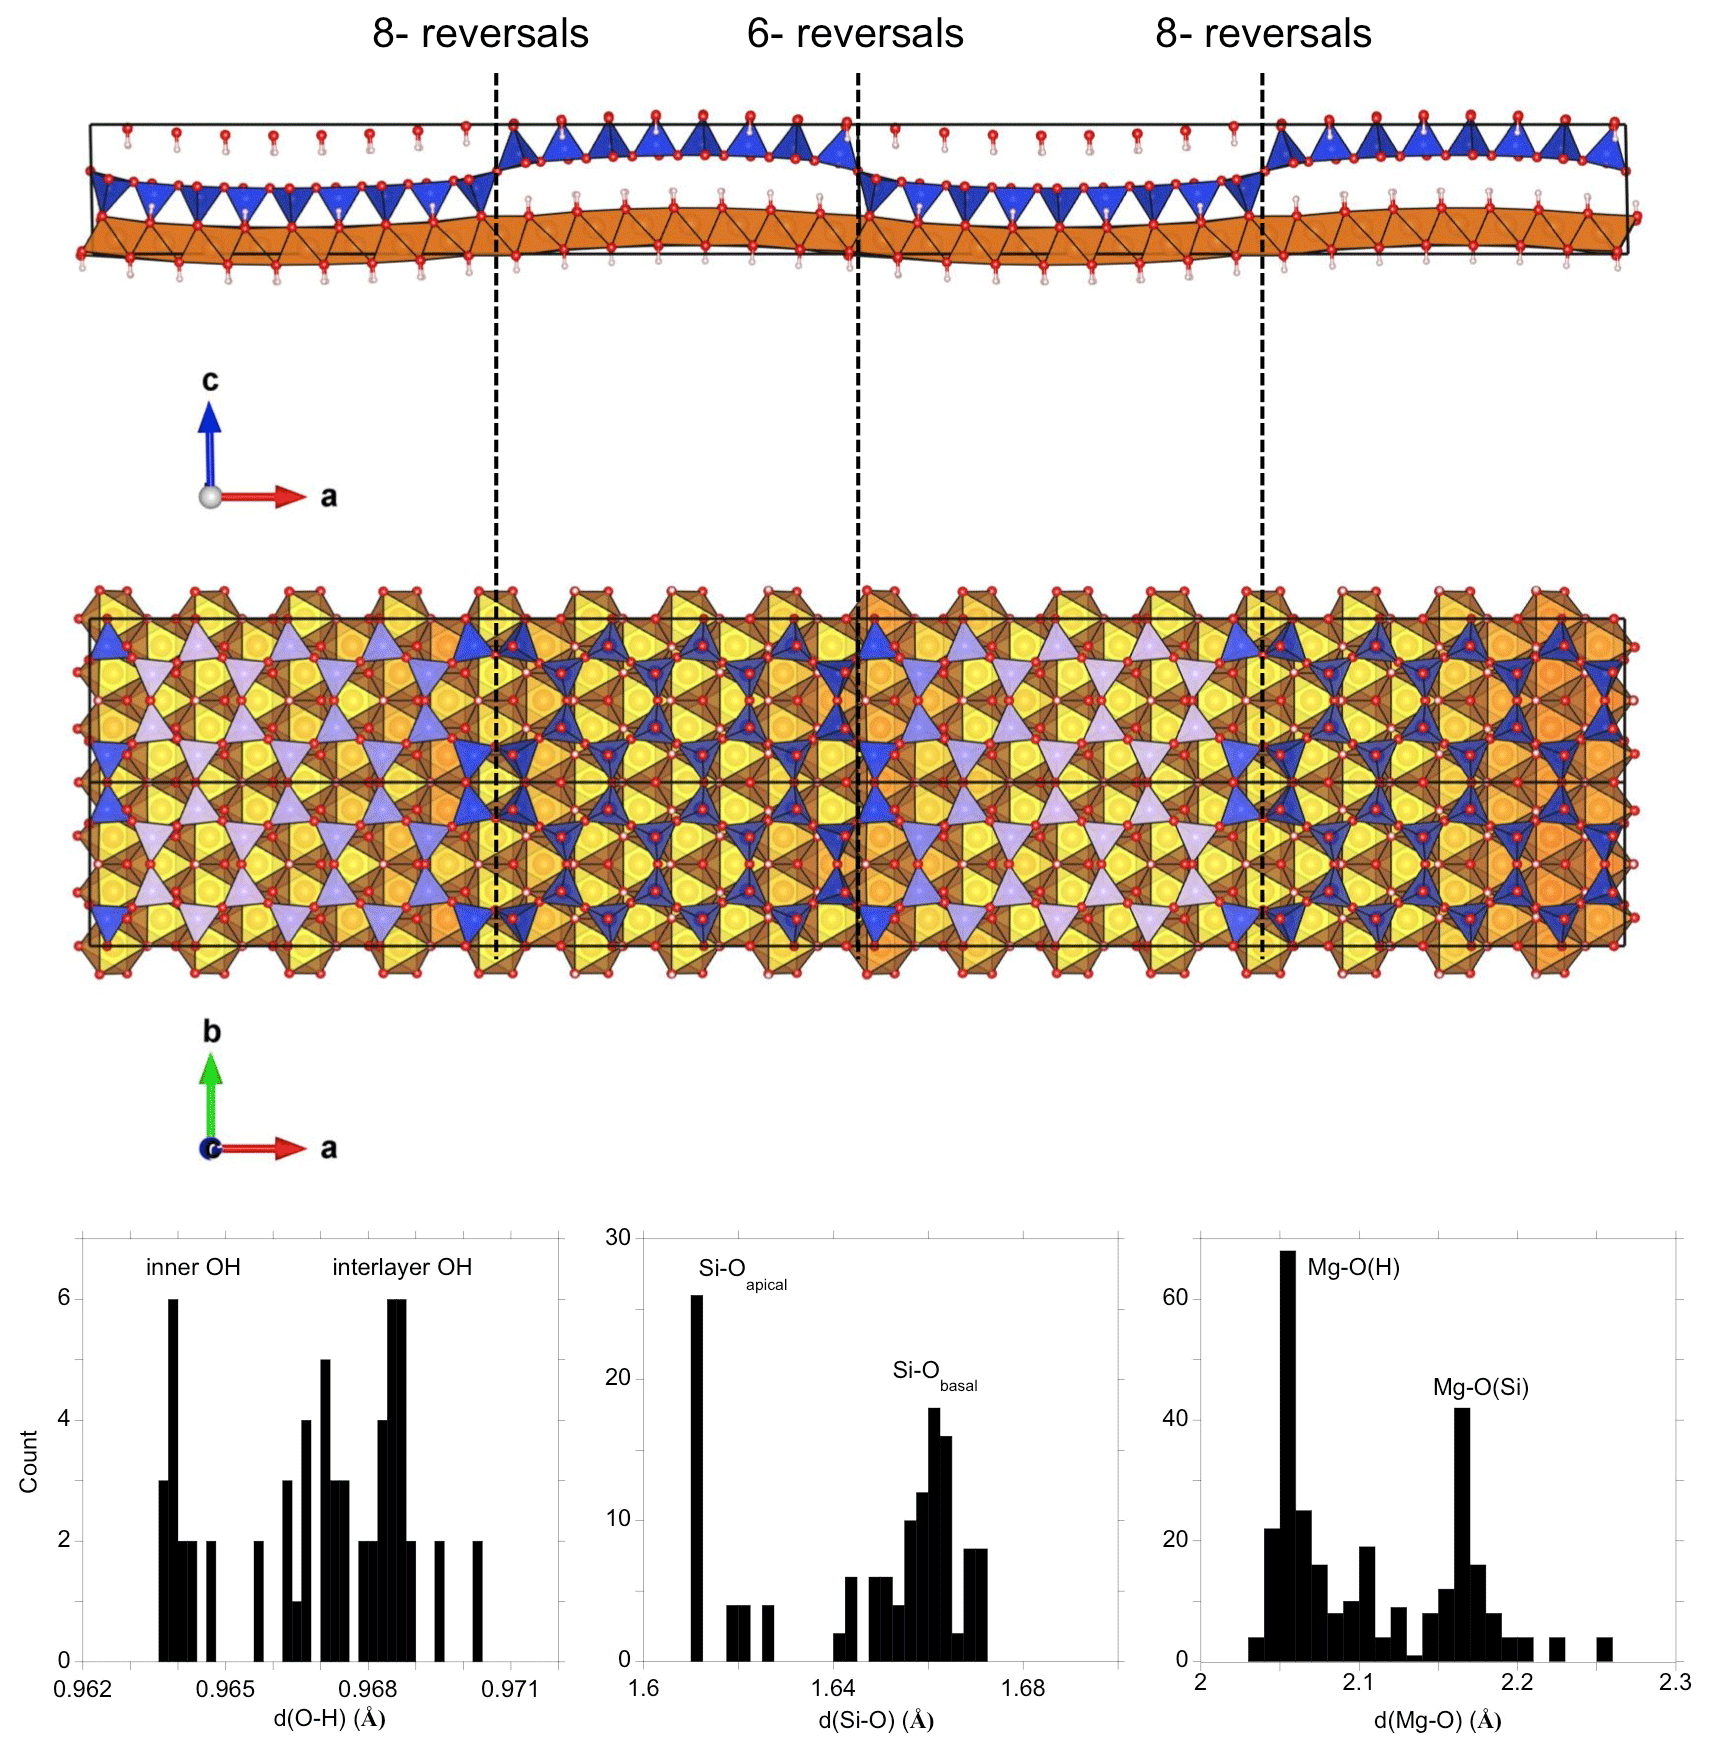
Figure 1Structure of the antigorite m=17 polysome. Blue: silicate tetrahedra, brown: MgO6 octahedra, red: oxygen, light pink: hydrogen. Note the different reversals involving 6-members silicate rings (6-reversals) and alternating 4-members and 8-member silicate rings along the [010] direction (8-reversals). Histograms of O-H, Si-O and Mg-O bond lengths are reported at the bottom. Note the distribution of bond lengths related to the layer corrugation.
Compared with other phyllosilicates, antigorite has an unusual wavy structure with sectors of TO layers (associating one tetrahedral and one octahedral sheet) extended along the [010] direction but displaying an alternation of the polarity of the tetrahedral sheet along the [100] direction (Fig. 1). The trioctahedral sheets have a wavelike geometry and the polarity of the tetrahedral sheets reverses at each inflection point of the latter. Compared with other serpentine varieties, the presence of reversals reduces the relative Mg and OH contents with respect to Si. A nominal antigorite formula has been proposed as Mg3m−3Si2mO5m(OH)4m−6 where m is the number of tetrahedra along a wave projecting down [010] (e.g., Capitani et al., 2009). The m values, typically ranging between 13 and 24, define the various antigorite polysomes and have been related to the growth conditions of antigorite (Mellini, 2013).
The first structure of antigorite was proposed by Kunze (1956, 1958, 1961) who showed that only discrete wavelengths were possible. As exposed by Capitani and Mellini (2004) and Mellini (2013), the experimental determination of the antigorite structure, using single-crystal X-ray diffraction or high-resolution electron microscopy (HRTEM) imaging and selected area electron diffraction (SAED), is difficult and has resulted in somehow contradictory results. Although the basic structural features are similar, competing models of the topology of the reversals have been proposed. According to the studies of Dódony et al. (2002, 2006), the reversals only display 6-membered silicate rings and can be referred to as 6-reversals. In contrast, the crystal structures proposed by, for example, Uehara and Shirozu (1985), Uehara (1998), Grobéty (2003) and Capitani and Mellini (2004, 2005, 2006) are consistent with the initial model proposed by Kunze and display 6-reversals alternating with another type of reversal displaying juxtaposed 4- and 8-membered rings along the [010] direction. These different reversals are referred to as 8-reversals. The structure of the antigorite m=17 polysome experimentally determined by Capitani and Mellini (2004) was found to be more stable (ΔE=0.5 kJ mol−1 per atom) than the structure determined by Dódony et al. (2002) in the theoretical study performed at the density functional level by Capitani et al. (2009).
Useful insights into fine details of mineral structures can be also obtained using vibrational spectroscopic methods (e.g., Farmer, 1974; Madejová et al., 2011). In this respect, the infrared (IR) spectrum of antigorite displays significant differences with that of lizardite, the more symmetric serpentine variety. Additional bands and significant shifts are observed in the Si-O stretching range whereas the OH stretching bands are shifted to lower frequencies (Farmer, 1974; Yariv and Heller-Kallai, 1975; Uehara and Shirozu, 1985; Mellini et al., 2002). However, the interpretation of the differences may prove to be difficult because of the chemical variability of the samples, related to structural incorporation of trace elements such as iron and aluminum in various concentrations. Broadening effects related to electrostatic interactions in powder spectra may also add some complexity to the measured spectra because they depend on macroscopic parameters such as the shape and aggregation states of the particles (e.g., Farmer, 1998, 2000).
Independent constraints for the interpretation of the vibrational spectra of minerals can be gained from a theoretical approach. Previous modeling studies (e.g., Balan et al., 2001, 2002; Kendrick and Burnett, 2016) have shown that it is possible to compute the powder IR spectra of minerals from first-principles quantum mechanical calculations with enough accuracy to provide useful constraints for the interpretation of experimental spectra. In the present study, we apply this well-tested approach to the pristine antigorite m=17 polysome whose structure has been previously investigated experimentally (Capitani and Mellini, 2004) and theoretically (Capitani et al., 2009). Comparison of the theoretical spectrum with that of a representative antigorite sample from New Caledonia (Fritsch et al., 2016) allows us to assign most of the experimental bands to specific vibrational modes of the antigorite structure.
The monophasic antigorite sample has been collected in the saprock of a Ni-laterite deposit from New Caledonia (sample A2, Fritsch et al., 2016, 2019). Antigorite occurs as wavy laths on corrugated greenish brown to faint colored walls of major detachment faults. Its chemical composition reveals the presence of minor amounts of impurities leading to the structural formula (Mg2.66Fe0.08Ni0.05Al0.03Cr0.01)Σ=2.83Si2.08O5(OH)4) (Fritsch et al., 2019). Note, however, that a fraction of these impurities can also occur as trivalent cations in tetrahedral sites. Its transmission Fourier-transform infrared (FTIR) spectrum was obtained at room temperature on a KBr pellet prepared with a sample-to-KBr mass ratio of mg using a Thermo Scientific Nicolet 6700 FT-IR spectrometer equipped with an EverGlo source, KBr beam splitter and DTGS-KBr detector. The experimental spectrum was recorded over the 400–4000 cm−1 range with a resolution of 4 cm−1 and co-addition of 100 scans.
The theoretical modeling framework is the same as that previously used for investigating the structural and vibrational properties of other phyllosilicates and hydrous minerals (e.g., Balan et al., 2001, 2002). The initial guess of the pristine antigorite structure was built using the experimental structure of the m=17 polysome determined by Capitani and Mellini (2004). Relevant properties were obtained using the density functional theory (DFT) and the generalized gradient approximation (GGA) to the exchange-correlation functional (xc-functional) as proposed by Perdew, Burke and Ernzerhof (PBE) (Perdew et al., 1996) and a plane-wave/pseudo-potential scheme, as implemented in the PWscf and Phonon codes from the Quantum-ESPRESSO package (Giannozzi et al., 2009; http://www.quantum-espresso.org, last access: 15 July 2021). The ionic cores were described by optimized norm-conserving pseudo-potentials from the SG15-ONCV library (Hamann, 2013; Schlipf and Gygi, 2015). The wave functions and the charge density were expanded in plane waves with 80 and 480 Ry cutoffs, respectively. The discrete sampling of the Brillouin zone for electronic integration was restricted to the Γ point. Convergence of the total energy to within 0.3 mRy per atom was ascertained by testing with more strict numerical parameters (120 Ry, k points). Structure relaxations were performed until the residual forces on atoms were less than 10−4 Ry/a.u. Absolute value of the residual stress over the cell was smaller than 4 kbar.
Harmonic vibrational (displacements and frequencies of the normal vibrational modes at the Brillouin zone center (Γ point)) and dielectric (Born effective charge tensors and electronic dielectric tensor) properties were calculated from the second-order derivatives of the total energy with respect to atomic displacements and external electric field using the linear response theory (Baroni et al., 2001). The theoretical powder infrared absorption spectra were obtained from the low-frequency dielectric tensor of antigorite using the approach developed by Balan et al. (2001, 2008). This approach computes the orientational average of the electromagnetic power dissipated in an ellipsoidal particle (including needles and plates as limit cases of oblate or prolate ellipsoids, respectively) inserted in an infinite isotropic matrix, which is characterized by a real dielectric constant, assuming that the size of the isolated particle is significantly smaller than the IR wavelength. In the calculation of the low-frequency dielectric tensor (Eq. 1; Balan et al., 2001), a damping coefficient of 6 cm−1 was arbitrarily used to account for the homogeneous width of absorption bands. Note that identical results can be obtained by averaging the imaginary part of the particle polarizability tensor, which corresponds to the high-dilution limit of the effective medium absorption in the Maxwell–Garnett approach (Eqs. 19 and 24 of Kendrick and Burnett, 2016; https://github.com/JohnKendrick/PDielec, last access: 15 July 2021).
3.1 Theoretical structural properties of antigorite
The unit cell of the antigorite m=17 polysome (S.G. Pm) contains 291 atoms. The relaxed cell parameters are a=43.86 Å, b=9.35 Å, c=7.39 Å and β=91.125∘, in very good agreement with the theoretical values (a=43.84 Å, b=9.33 Å, c=7.38 Å) reported by Ghaderi et al. (2015) with the same xc-functional. The theoretical edge lengths overestimate their experimental counterparts (a=43.505 Å, b=9.2509 Å, c=7.2625 Å; Capitani and Mellini, 2004) by 0.8 %, 1.1 % and 1.7 %, respectively. This theoretical overestimation is consistent with that observed on other minerals in previous studies performed using the PBE xc-functional (e.g., Ducher et al., 2016; Balan et al., 2019). The cell dimensions and the average 〈Mg-O〉, 〈Si-O〉 and 〈O-H〉 bond lengths (2.107, 1.647 and 0.967 Å, respectively) are also slightly larger than those obtained by Capitani et al. (2009) using the same xc-functional but performing the relaxation of the cell geometry at constant volume. Besides these minor differences, the structural properties of the two theoretical models are quite consistent regarding the distortion of cationic polyhedra and dispersion of bond lengths (Fig. 1). For example, the average length of apical Si-O bonds is 0.45 Å shorter than that of the basal bonds, in excellent agreement with the distortion of 0.44 Å determined by Capitani et al. (2009). Because of the low symmetry and large size of the unit cell, a significant dispersion of cation–oxygen bond lengths (Fig. 1) is observed around the average value as previously reported by Capitani et al. (2009).
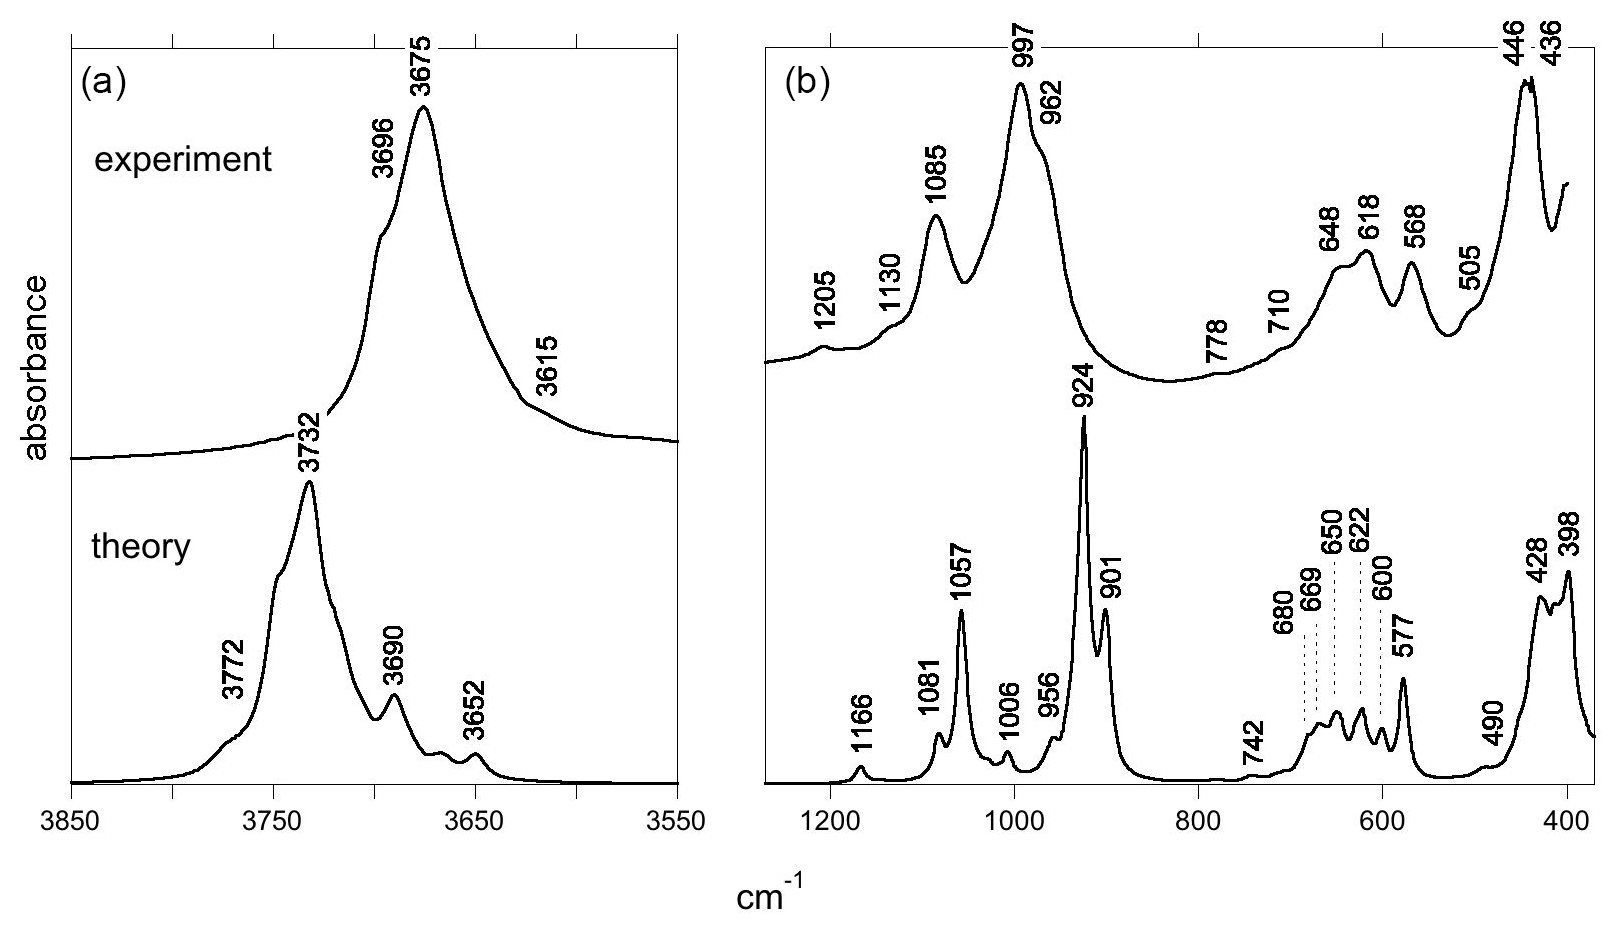
Figure 2Experimental (top) and theoretical (bottom) IR absorption spectra of antigorite: (a) OH-stretching region, (b) mid-IR range. The major features of the experimental and theoretical spectra are indicated by their wavenumber. The theoretical spectrum is computed for a (001) plate inserted in a KBr matrix.
3.2 Experimental and theoretical infrared absorption spectrum of antigorite
The FTIR spectrum of the antigorite sample (Fig. 2) is fully consistent with those previously reported by, for example, Farmer (1974), Yariv and Heller-Kallai (1975), Uehara and Shirozu (1985), Mellini et al. (2002) and Jovanoski and Makreski (2016). In the mid-IR (MIR) range, the spectrum displays characteristic bands related to Si-O stretching modes in the 800–1300 cm−1 range. The main band is split, with two components at 962 and 997 cm−1. A well-defined band is observed at 1085 cm−1 and two weaker bands at 1130 and 1205 cm−1. At lower frequency, a triplet is observed at 568, 618 and 648 cm−1. The band at 648 cm−1 is broadened toward higher frequencies, and weak features are observed at 710 and 778 cm−1. Finally, a strong and split band is observed at 436 and 446 cm−1 and a weaker shoulder at 505 cm−1. All these features are also present in the spectrum reported by, for example, Farmer (1974), suggesting that they correspond to intrinsic vibrational properties of antigorite and that they are not related to the presence of impurities in the investigated sample. In the OH stretching range (Fig. 2), the antigorite spectrum displays a broad and dominant band with a maximum at 3675 cm−1 and a shoulder at 3696 cm−1. A broad and weaker contribution can be identified at ∼3615 cm−1.
Table 1Interpretation of experimental absorption bands. The mode number refers to the Supplement.
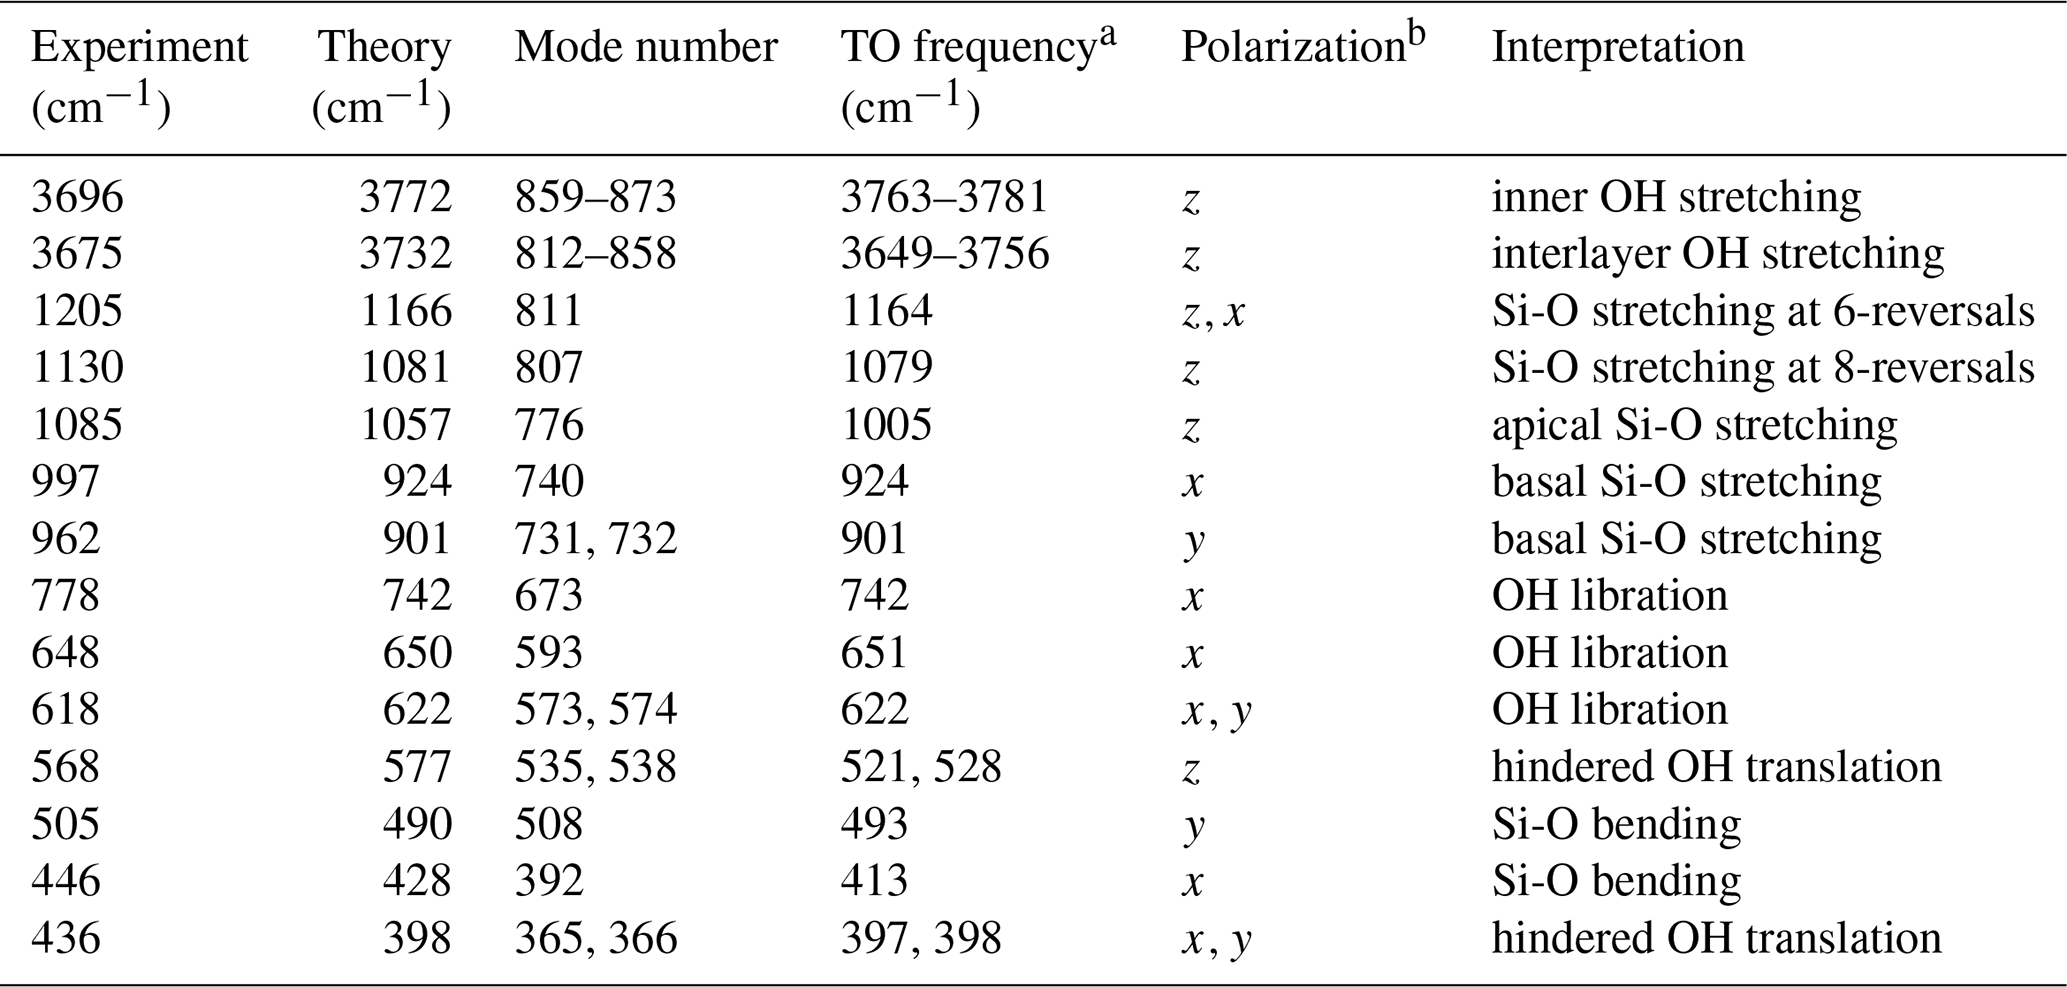
a Theoretical transverse optical (TO) frequency. b correspond to the [100], [010], [001]* directions, respectively.

Figure 3Comparison of the position of theoretical and experimental absorption bands. The linear correlation supports the proposed assignment (Table 1) and indicates that theoretical frequencies are underestimated by ∼4 %.
The diagonalization of the analytical part of the dynamical matrix of the antigorite m=17 polysome leads to 870 normal vibrational optical modes, including 62 OH and 84 Si-O stretching modes (see the Supplement). Due to the low symmetry of antigorite, all these modes display some degree of IR activity. The theoretical infrared spectrum (Fig. 2) was derived assuming a platy particle shape parallel to the (001) plane and inserted in an external isotropic medium characterized by εext=2.25, as in Balan et al. (2002). Well-defined absorption features are observed on the theoretical spectrum despite the large number of vibrational modes, and most of the bands experimentally observed can be related to a theoretical counterpart (Table 1). The linear correlation observed between the experimental and theoretical positions of the bands in the 400–1200 cm−1 range supports the proposed assignment. It indicates that theoretical values tend to be systematically lower than the experimental values by ∼4 % (Fig. 3). Such frequency scaling is consistent with the overestimation of the unit cell volume by the theoretical model and is a common feature of studies performed using the same approximations (e.g., Ducher et al., 2016).
The systematic underestimation of vibrational frequencies is, however, not valid for the OH stretching modes. In this case, the difference between experimental and theoretical frequencies also depends on the cancelation of errors introduced by the harmonic approximation and the use of the PBE xc-functional (Balan et al., 2007). Depending on the investigated system, systematic differences between the theoretical (harmonic) and experimental (anharmonic) OH frequencies can range from ∼0 to ∼100 cm−1 (e.g., Jollands et al., 2020; Balan, 2020). In the present case, the main band at 3675 cm−1 can be related to the theoretical band at 3732 cm−1. The shoulder at 3696 cm−1 is the feature observed at the highest frequency in the experimental spectrum and for this reason is most likely related to the highest shoulder at 3772 cm−1 in the theoretical spectrum (Fig. 2). These assignments correspond to a theoretical overestimation of experimental frequencies by 57 to 76 cm−1.
3.3 Analysis of vibrational modes and interpretation of IR absorption bands
The relations established between experimental and theoretical absorption bands makes it possible to assign the observed bands to specific vibrational modes (Table 1). However, due to the large number of atoms and peculiar structure of antigorite, it is not possible to reach as straightforward a description as that previously obtained for the more symmetric lizardite (e.g., Balan et al., 2002; Prencipe et al., 2009) because the vibrational modes can involve the coupling of different types of atomic displacements. In addition, the modes can be extended over the full cell or restricted to a smaller region of the structure. In the following, the interpretation of the IR absorption bands will be proposed by considering the vibrational frequency in conjunction with the polarization and the IR activity of the modes (Fig. 4).
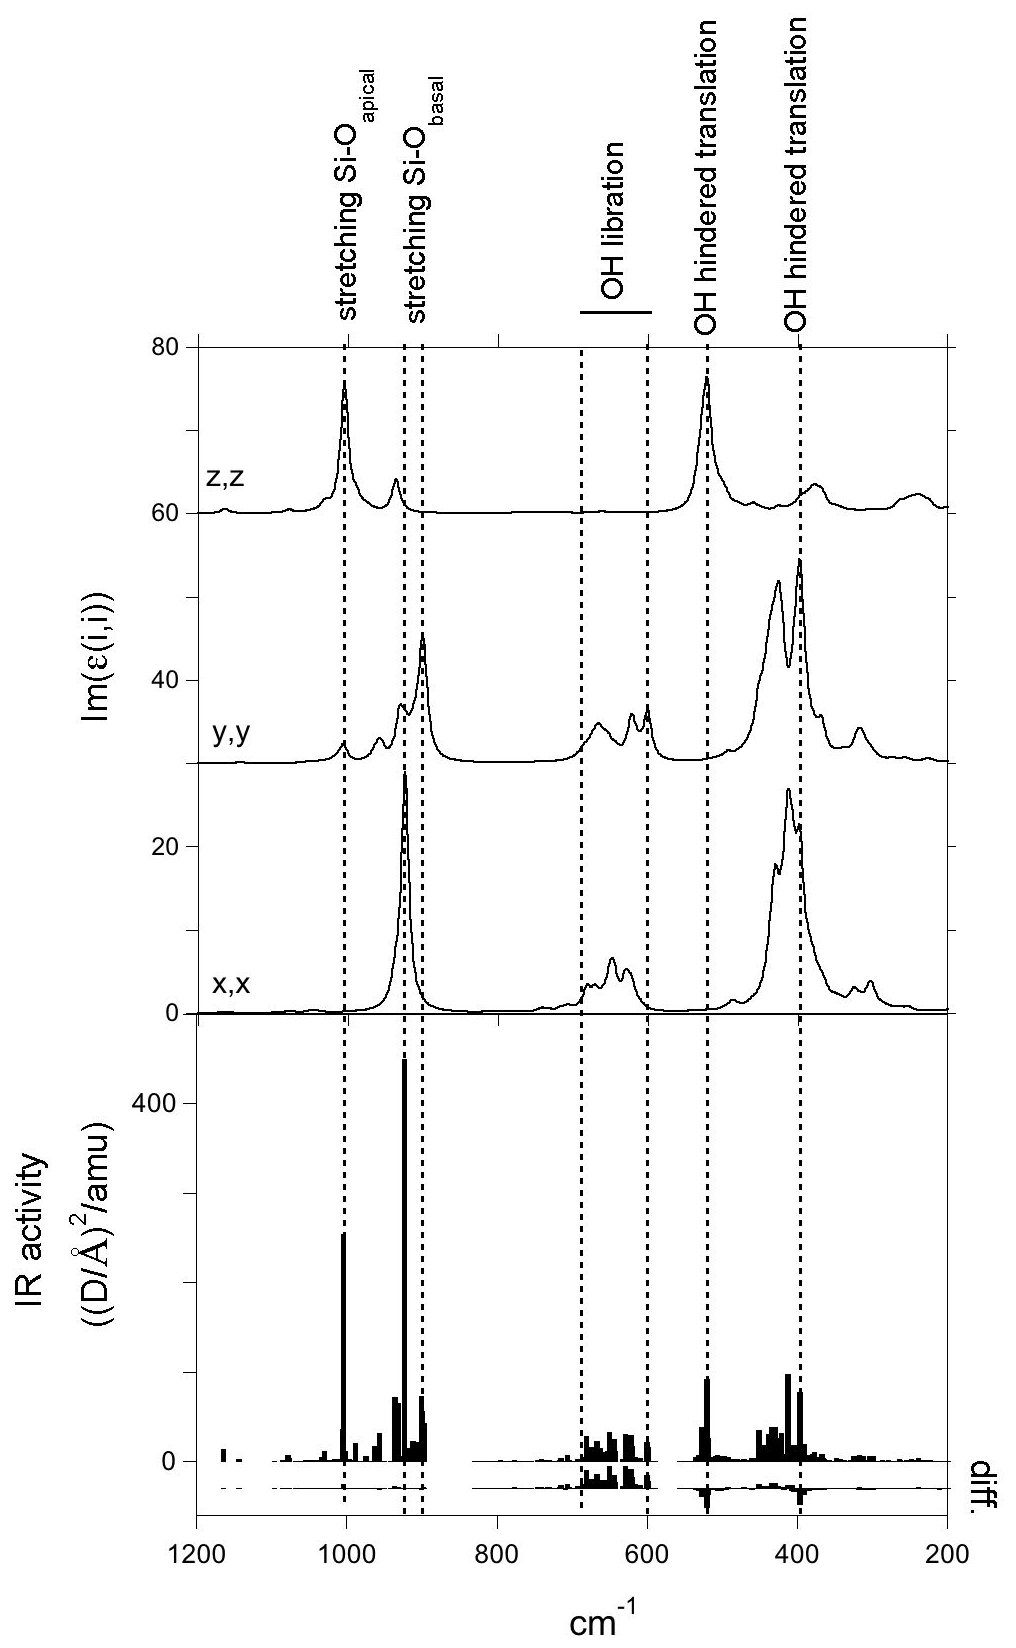
Figure 4Imaginary part of the diagonal elements of the antigorite dielectric tensor reported as a function of frequency in the MIR range. The IR activities of the vibrational modes in /amu are reported at the bottom as vertical sticks. Difference between IR activities computed with and without the contribution of hydrogen (see text) is also reported. Note that the position of the resonances of the dielectric tensor can differ from that of the bands in the absorption spectrum computed for a specific particle shape.
3.3.1 Si-O stretching modes in the 800–1300 cm−1 range
As in other hydrous phyllosilicates, vibrational modes observed in the 800–1300 cm−1 range are assigned to modes involving the stretching of Si-O bonds. According to the polarized measurements of Yariv and Heller-Kallai (1975), the main band at 1085 cm−1 is polarized along the [001]* direction, whereas the two components at 962 and 997 cm−1 are in the (001) plane. The dominant polarization of the corresponding resonances of the dielectric tensor and related vibrational modes (Fig. 4) confirms the attribution of the 1085 cm−1 to the stretching of apical Si-O bands, whereas the 962 and 997 cm−1 bands dominantly correspond to the stretching of basal Si-O bonds with polarization along the [100] and [010] directions and computed at 901 and 924 cm−1, respectively. Note that macroscopic electrostatic effects can upshift the bands with respect to the corresponding mode frequencies (e.g., Balan et al., 2002, for lizardite). This is the case for the band computed at 1057 cm−1, which corresponds to a mode frequency of 1005 cm−1 (Table 1). These effects are discussed in further detail below (Sect. 3.4). It is noteworthy that additional calculations performed on lizardite using the same numerical parameters lead to a basal Si-O stretching at 882 cm−1, indicating that the model also reproduces the frequency increases in the antigorite bands with respect to lizardite whose basal Si-O stretching band is observed at ∼950 cm−1 (e.g., Mellini et al., 2002). The IR intensity of each of the 997 and 1085 cm−1 bands is carried by a single vibrational mode involving the collective vibration of the whole cell (Fig. 5). In contrast, the band at 962 cm−1 has a more composite nature (Fig. 4), with several modes restricted to specific regions of the unit cell. The two dominant modes are mostly localized in two different regions of the cell separated by tetrahedral reversals (Fig. 5).
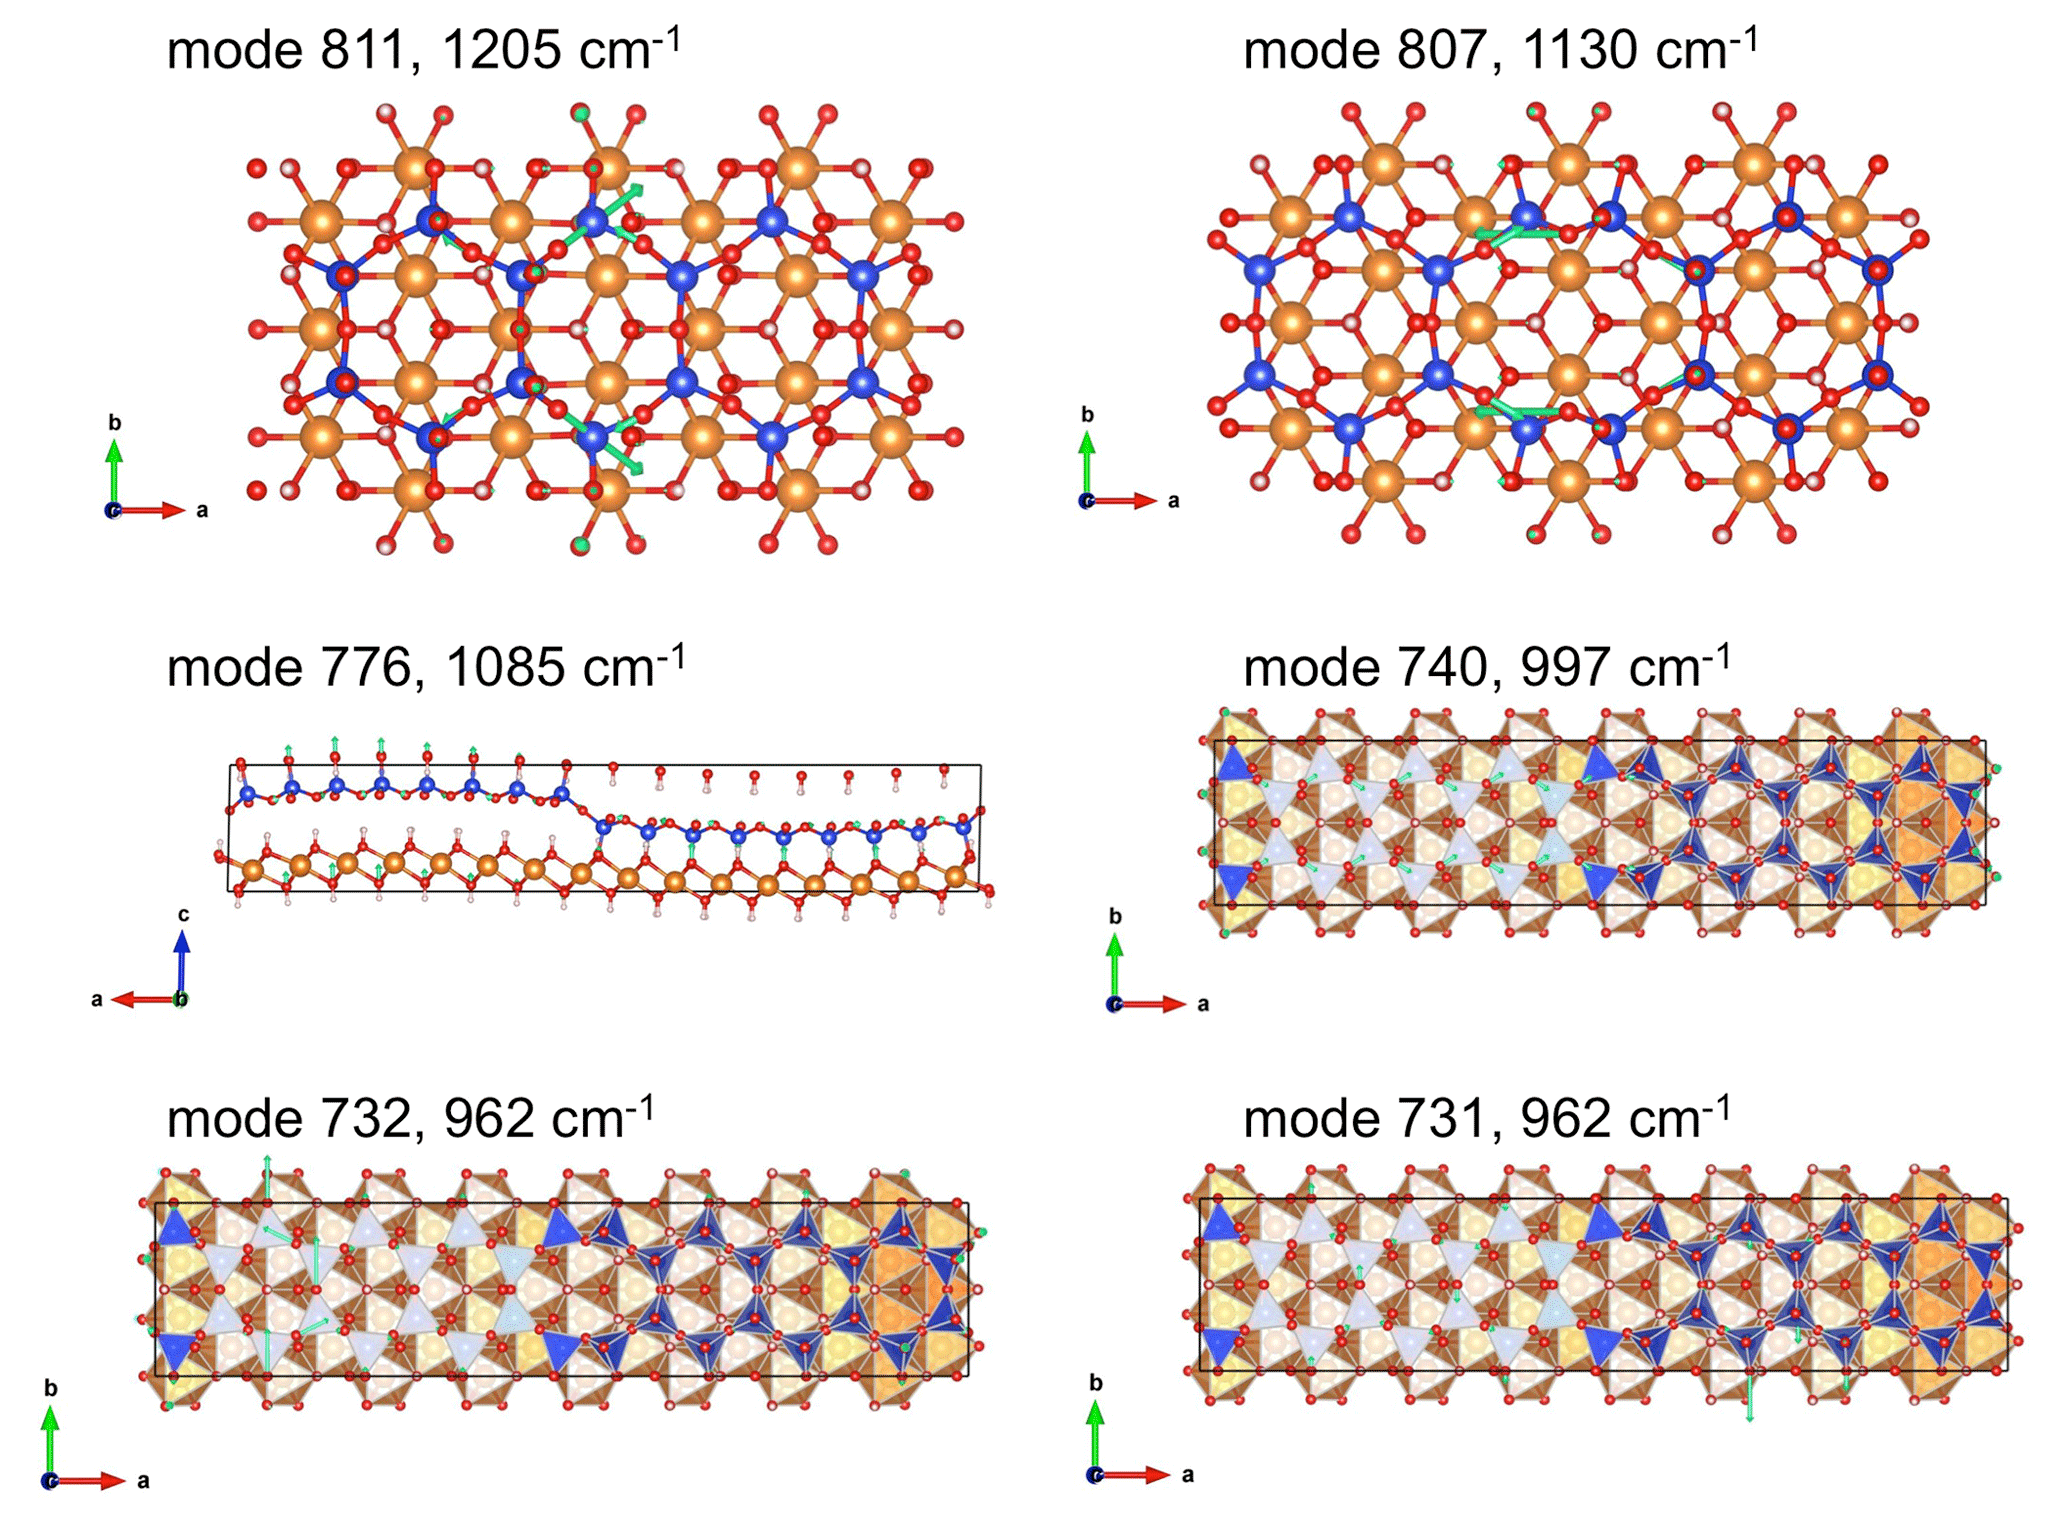
Figure 5Views of oxygen displacements in selected Si-O stretching modes (green arrows whose length is proportional to the magnitude of atomic displacement). Corresponding Vesta files are reported as supplementary information. Mode number and corresponding experimental frequencies (Table 1) are reported. Note the localization of the modes 811 and 807 on 6- and 8-reversals, respectively. Both the modes 731 and 732 contribute to the band observed at 962 cm−1.
Interestingly, the two weak bands at 1205 and 1130 cm−1 also have theoretical counterparts (Fig. 2). The analysis of the dielectric tensor indicates a dominant polarization of these bands along the [001]* direction (Fig. 4). The former band is related to a localized vibrational mode involving the stretching of Si-O bonds whose oxygen atom is located on the 6-reversal of the structure (Fig. 5). The later band has a similar origin but involves a mode computed at 1079 cm−1 (mode 807) corresponding to vibrations localized on the 8-reversal of the structure (Fig. 5). Note that the mode computed at a frequency just below (1076.5 cm−1, mode 806) only has a weak contribution to the theoretical absorption band, which supports the assignment of the band experimentally observed at 1130 cm−1 to the occurrence of 8-reversals in the antigorite structure. The observation of this band in the FTIR spectrum of antigorite (Farmer, 1974; Mellini et al., 2002) could thus be considered as an independent argument in support of the structural model proposed by, for example, Uehara (1998), Grobéty (2003) and Capitani and Mellini (2004).
3.3.2 The 400–800 cm−1 range: OH libration and hindered translation modes and SiO4 bending modes
Based on the previous analysis of the vibrational properties of lizardite (Balan et al., 2002; Prencipe et al., 2009), the bands observed in the 500–800 cm−1 range should involve the libration and hindered translation of OH groups. However, the lower symmetry of antigorite leads to relatively complex displacement patterns, complicating an interpretation solely based on a visualization of atomic displacements in the vibrational modes. Some insight into the nature of the observed bands can be gained by canceling the contribution of hydrogen atoms to the infrared absorption, setting the Born effective charge of hydrogen atoms to zero.
Comparing the IR intensity of the modes computed with this setting to those obtained in the full calculation confirms that the contribution of hydrogen displacements is major in the bands between 600 and 800 cm−1 but almost negligible in the Si-O stretching bands (Fig. 4). The intensity of the bands observed at 618 and 648 cm−1 is dominantly related to the libration of OH groups inducing their polarization in the (001) plane. These bands correspond to about 50 vibrational modes explaining the broadening of the 648 cm−1 band toward the high frequencies. A quasi-continuum of vibrational states is observed up to 830 cm−1 among which a libration mode (mode 673) polarized along the [100] direction and involving the collective displacement of almost all the OH groups of the cell corresponds to the weak feature experimentally observed at 778 cm−1.
The setting of the hydrogen charge to zero does not always decrease the absorption intensity. An increase in the whole (negative) charge of the OH group leading to a stronger IR absorption is expected for modes involving the rigid displacement of OH units. A significantly negative contribution of hydrogen to the IR activity is observed for two modes at 521 and 528 cm−1 (modes 535 and 538) and two modes at 397.3 and 398 cm−1 (modes 365 and 366). The corresponding modes can thus be identified as related to the hindered translation of OH groups, even though a significant coupling with other types of atomic displacements occurs. The polarization of the mode at 521 cm−1 along the [001]* direction is consistent with the polarization of the 568 cm−1 band experimentally determined by Yariv and Heller-Kallai (1975). Two other hindered translation modes of OH groups lead to the band computed at 398 cm−1 corresponding to the experimental band at 436 cm−1.
Finally, the bands experimentally observed at 446 and 505 cm−1 (Table 1) do not display a significant hydrogen contribution in the related modes (Fig. 4). Based on the visualization of atomic displacements, they can be assigned to modes dominantly related to the bending vibration of SiO4 tetrahedra.
3.3.3 The OH stretching modes of antigorite
The bands observed between 3550 and 3850 cm−1 are unambiguously assigned to OH stretching vibrations. All the corresponding 62 theoretical modes are dominantly polarized along the [001]* direction.
In total 16 modes with theoretical frequencies between 3756 and 3781 cm−1 correspond to the stretching modes of inner OH groups located in cavities formed by silicate rings. Each mode can be assigned to a single OH group. The highest-frequency mode at 3781 cm−1 corresponds to an OH group located at the center of the 8-membered silicate ring of the 8-reversals, whereas the mode at 3756 cm−1 corresponds to OH groups in the 6-membered rings of the 6-reversals. As in lizardite, these modes lead to a weak IR absorption because of the small value of the related component of the hydrogen Born effective charge tensor (Supplement).
The 46 other modes involve OH groups in interlayer configuration and the corresponding OH vibrations display some degree of coupling. A quantitative assessment of the localized or delocalized character of these modes can be obtained using an inverse participation ratio (P) restricted to the H atoms. The inverse participation ratio of mode ν is defined as follows (Hage et al., 2020):
where is the eigen displacement of atom i in direction k for mode ν and N is the number of atoms. For the analysis of stretching modes, the sum is restricted to the displacements of the N=62 hydrogen atoms of the unit cell, and the displacements are normalized by the following condition:
For a mode localized on a single OH bond, the inverse participation ratio P(ν) is close to 1 whereas it tends to for a mode fully delocalized over the N atoms of the unit cell with modules of individual H displacements approximately equal to each other. The factor P(ν)−1 thus measures an effective number of H atoms participating in the vibrational modes. In the case of antigorite OH stretching modes, P(ν)−1 ranges from 1 for the inner OH groups to about 7 for the most delocalized modes observed around 3700 cm−1 (Fig. 6). This suggests that the symmetry lowering due to the layer curvature has a significant effect on the dynamic of OH groups leading to a localization of the vibrations. This localization can be related to the significant dispersion of OH bond lengths observed in the relaxed structure (Fig. 1). The corresponding dispersion of vibrational frequencies extends over ∼100 cm−1, which is consistent with the width and the shape of the main band observed in the experimental spectrum (Fig. 2).
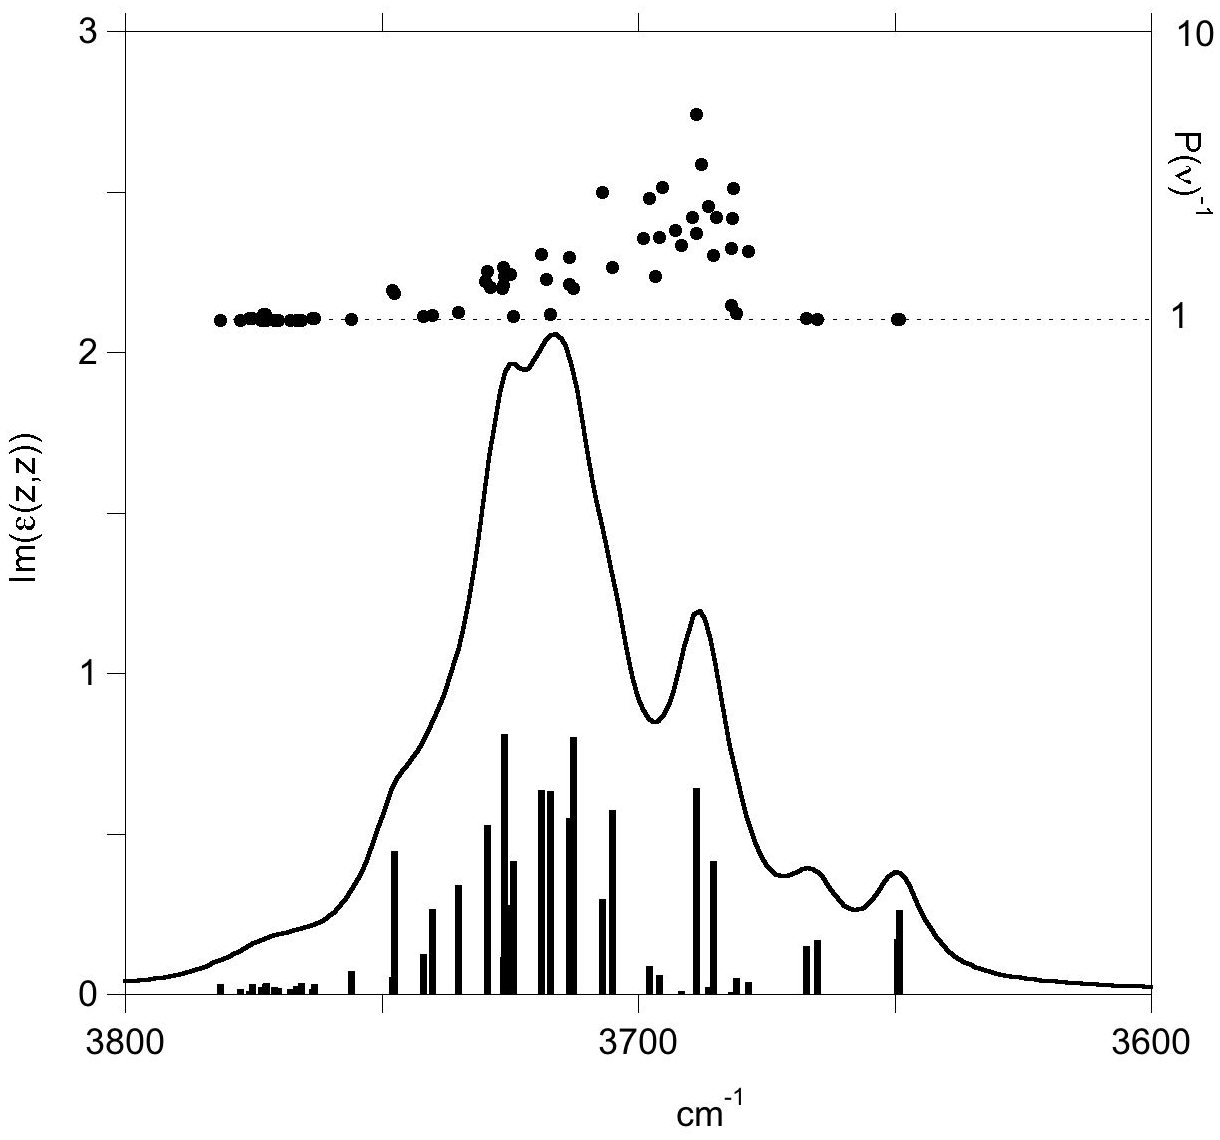
Figure 6Imaginary part of the diagonal element (z,z) of the antigorite dielectric tensor reported as a function of frequency in the OH stretching range. The IR activities of the vibrational modes (/amu on the left vertical scale) are reported as vertical sticks at the bottom of the figure. The participation factors P(ν)−1 of the modes are reported as circles with values on the right vertical scale. Note the localized character () of stretching modes related to inner OH groups observed on the high-frequency side of the spectrum and the presence of localized modes associated with 8-reversals on the low-frequency side.
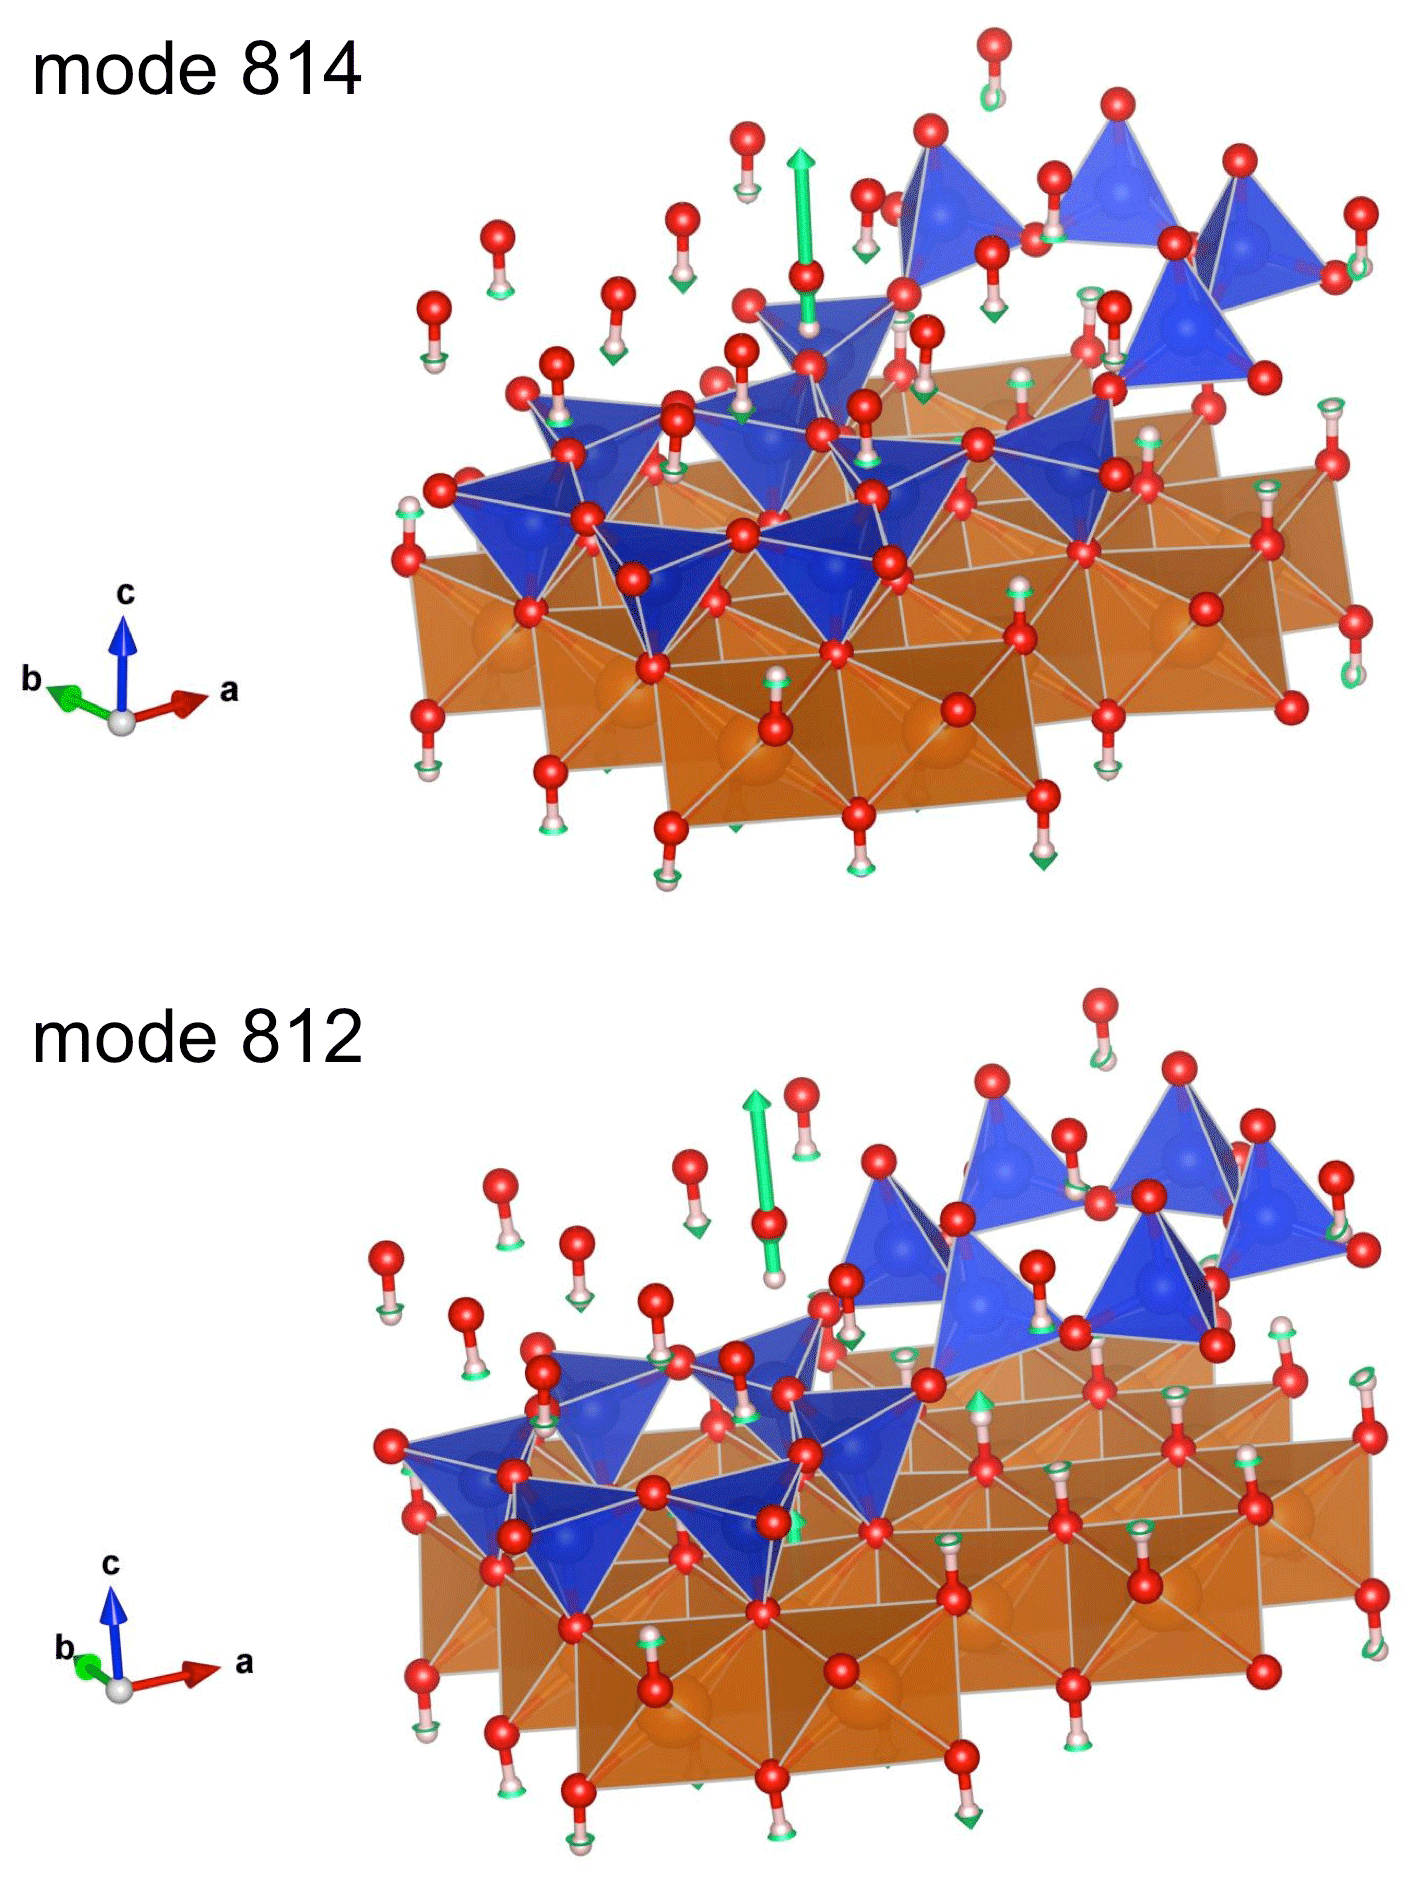
Figure 7Views of the atomic displacements in the localized OH stretching modes associated with the 8-reversals (green arrows whose length is proportional to the magnitude of atomic displacement). Corresponding Vesta files are reported as supplementary information. The modes 812 and 814 contribute to the theoretical bands at 3649 and 3665 cm−1, respectively. They are related to the modes 813 and 815, respectively, by the pseudo 2-fold axis corresponding to the reversal.
Interestingly, four modes (modes 812 to 815) observed at low frequency (3649–3667 cm−1) display a single-bond character (Fig. 6). They are associated with OH groups sharing relatively short (2.05–2.08 Å) hydrogen bonds with basal oxygen atoms associated with the 8-membered or 4-membered silicate rings belonging to 8-member reversals (Fig. 7). The corresponding OH groups appear at the upper edge of the distribution of OH bond lengths (Fig. 1). These modes are expected to contribute to the infrared absorption at the lower-frequency side of the OH stretching bands and could be related to the broad and weak shoulder observed at ∼3615 cm−1 (Fig. 2), which is also present at 3622 cm−1 in the spectra reported by Mellini et al. (2002). Uehara and Shirozu (1985) also proposed that the bands they observed at 3660, 3645 and 3625 cm−1 in the spectra of Al- and Fe-poor samples were related to OH groups located around reversal regions where shorter H-bond may be expected. Our results can support this interpretation, at least for the band at 3625 cm−1 which is observed at a frequency 60 cm−1 below that of the absorption maximum. However, this assignment remains ambiguous because the impurities present in the investigated natural samples (e.g., Fe, Ni, Al, Cr) could also contribute to the presence of absorption bands in this frequency range.
3.4 Macroscopic electrostatic effects in the infrared spectrum of antigorite
Macroscopic electrostatic interactions within and between the powder particles are known to affect the FTIR spectra of phyllosilicates as discussed by, for example, Farmer (1998, 2000) and Balan et al. (2001, 2002). These effects are related to the presence of a depolarization field in the particles, which is determined by electrostatic boundary conditions at the interface between the particle and the external medium. Due to the platy shape of clay particles, these effects preferentially affect the modes with a strong polarization in a direction perpendicular to the plates, i.e., along the [001]* direction. For example, kaolinite bands with this polarization are shifted toward higher frequencies in fine-grained samples with respect to coarser ones (Farmer, 1998). In the present case, these modes correspond to the stretching of apical Si-O bonds, to the hindered translation of OH groups along the [001]* direction (Fig. 4), and to a lesser extent to the stretching of OH groups. Comparing the position of the absorption bands to the corresponding transverse optical frequencies (Table 1) reveals that the Si-O stretching and OH translation bands are shifted by 52 and 56 cm−1 respectively. This compares to the values determined for the corresponding modes in lizardite (57 and 66 cm−1, respectively, Balan et al., 2002). The shift between the maximum of the OH stretching absorption band from the corresponding resonance of the dielectric tensor amounts to 16 cm−1, which also compares to the shift reported for lizardite (21 cm−1).
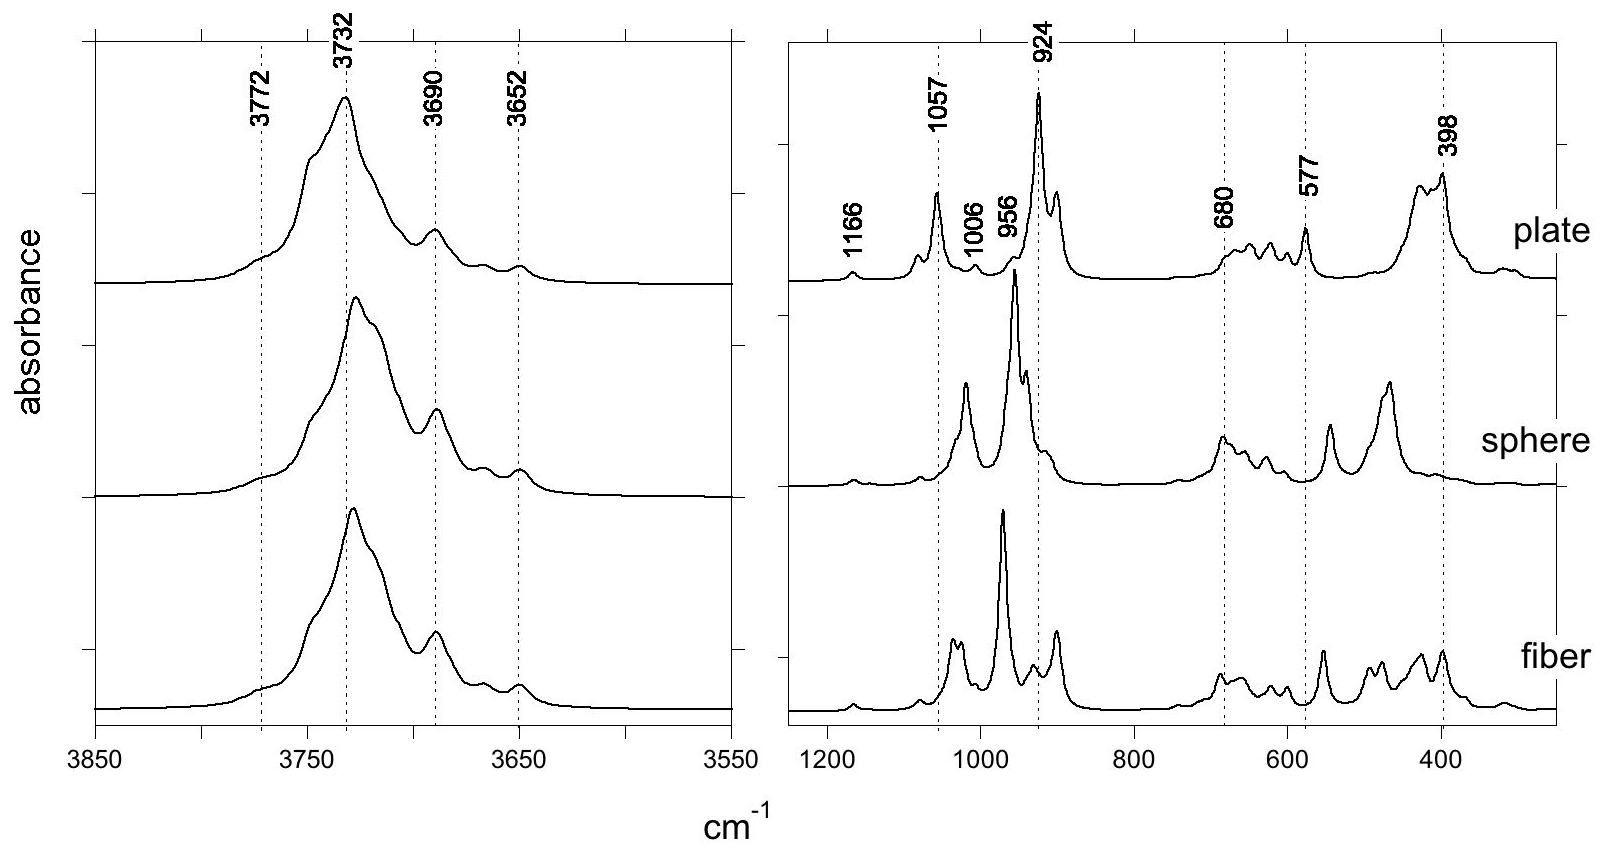
Figure 8Theoretical infrared spectra of antigorite computed for three different particle shapes: (001) plate, sphere and cylindrical fiber elongated along the [010] direction. The spectrum of the plate corresponds to that displayed in Fig. 2. Note the sensitivity of the strong bands to the particle shape, whereas weak bands are weakly affected.
The sensitivity of absorption bands to macroscopic electrostatic effects can be visualized by comparing the spectra computed for different particle shapes, showing that significant variations mainly affect strong bands (Fig. 8). For experimental samples with arbitrary particle shapes, broadened bands centered on an average frequency corresponding to that computed for a spherical particle are expected. As electrostatic effects marginally affect the weak bands, such as those experimentally observed at 1205 and 778 cm−1, these bands can be identified as narrower features on the experimental spectra. Consistently, weak bands can be more sensitive to the atomic-scale variability of the samples than the intense bands.
The intense basal Si-O stretching bands can be significantly broadened by long-range electrostatic interactions and also by the presence of defects and impurities in the investigated natural samples. This can explain the absence of the features theoretically predicted at 956 and 1006 cm−1 in the experimental spectrum, which instead displays an asymmetric spreading of the absorbance from the 997 to the 1085 cm−1 band (Fig. 2). Similarly, macroscopic electrostatic effects should contribute to the broadening of the stronger stretching band related to interlayer OH groups, whereas the unaffected inner-OH stretching band appears as a marked shoulder at 3696 cm−1 in the experimental spectrum (Fig. 2).
Although often reported as flat or tabular crystals, antigorite can also occur as an asbestiform material consisting of bundles of lath-shaped particles elongated along the [010] direction (e.g., Belluso et al., 2017). From a theoretical perspective, this shape can be approximated as a cylindrical needle extending along the [010] direction. In this case, dominant spectral changes should affect the main band related to the basal Si-O stretching along the [100] direction, whose theoretical shift between (001) platy particles and [010] needles reaches ∼50 cm−1 (Fig. 8).
We have theoretically computed the infrared absorption spectrum of the antigorite m=17 polysome using a first-principles quantum mechanical approach. This computation on a much larger system size (291 atoms) than that investigated in our previous study of lizardite (18 atoms; Balan et al., 2002) was rendered possible thanks to the increase in computing power over the years. The comparison of the theoretical spectrum with an experimental one recorded on a natural antigorite sample allowed us to assign most of the observed bands to specific vibrational modes of antigorite, thus supporting the model proposed by Capitani and Mellini (2004). Specific signatures of the antigorite reversals have been identified in the Si-O stretching range and more tentatively in the OH stretching range. The obtained results also allow us to explain the spectral changes observed between antigorite and lizardite. They confirm the importance of combining experimental observations and theoretical models to unravel the fine details of mineral structures from spectroscopic observations. The present interpretation of the antigorite infrared spectrum should support the spectroscopic identification of antigorite in complex natural samples displaying a mixture of serpentine-group minerals.
Structure drawings have been produced with the Vesta software (Momma and Izumi, 2011). PWscf and PHonon codes (Giannozzi et al., 2009) are available at http://www.quantum-espresso.org/ (last access: 15 March 2021). The pseudopotentials (Mg_ONCV_PBE-1.0.upf, O_ONCV_PBE-1.0.upf, Si_ONCV_PBE-1.1.upf, H_ONCV_PBE-1.0.upf) are available at http://www.quantum-simulation.org/potentials/sg15_oncv/ (last access: 7 June 2021). The structural, dielectric and vibrational properties of the model are provided as an electronic supplementary file, together with Vesta files enabling a visualization of the modes. Additional requests should be addressed to Etienne Balan (etienne.balan@sorbonne-universite.fr).
The supplement related to this article is available online at: https://doi.org/10.5194/ejm-33-389-2021-supplement.
EB, GR and LP performed the calculations. EF, FJ and SP performed the field and experimental works. All co-authors contributed to the discussion of the results and preparation of the paper.
The authors declare that they have no conflict of interest.
Publisher's note: Copernicus Publications remains neutral with regard to jurisdictional claims in published maps and institutional affiliations.
Pierre Chansigaud (IC2MP spectroscopy platform, University of Poitiers) is acknowledged for technical assistance in the production of the MIR spectrum. We thank Bernard Grobéty and two anonymous reviewers for their thoughtful suggestions. Calculations have been performed using the computing resources of IMPMC (Sorbonne Université-CNRS-MNHN) and the HPC resources of IDRIS under the allocation 2020-A0080910820 attributed by GENCI (Grand Equipement National de Calcul Intensif).
This research was supported by the CNRS INSU (project “Conditions of formation of Mg/Ni silicate ores from New Caledonia” (2010, CNRS INSU CESSUR)) and the CNRT “Nickel and its environment” (project “Ni/Co mineralization factors of laterites derived from ultramafic rocks of New-Caledonia”; 2010–2014).
This paper was edited by Monika Koch-Müller and reviewed by Bernard Grobéty and two anonymous referees.
Balan, E.: Theoretical infrared spectra of OH defects in corundum (α-Al2O3), Eur. J. Mineral., 32, 457–467, https://doi.org/10.5194/ejm-32-457-2020, 2020.
Balan, E., Saitta, A. M., Mauri, F., and Calas, G.: First-principles modeling of the infrared spectrum of kaolinite, Am. Mineral., 86, 1321–1330, https://doi.org/10.2138/am-2001-11-1201, 2001.
Balan, E., Saitta, A. M., Mauri, F., Lemaire, C., and Guyot, F.: First-principles calculation of the infrared spectrum of lizardite, Am. Mineral., 87, 1286–1290, https://doi.org/10.2138/am-2002-1003, 2002.
Balan, E., Lazzeri, M., Delattre, S., Meheut, M., Refson, K., and Winkler, B.: Anharmonicity of inner-OH stretching modes in hydrous phyllosilicates: assessment from first-principles frozen- phonon calculations, Phys. Chem. Miner., 34, 621–625, https://doi.org/10.1007/s00269-007-0176-4, 2007.
Balan, E., Blanchard, M., Hochepied, J.-F., and Lazzeri M.: Surface modes in the infrared spectrum of hydrous minerals: the OH stretching modes of bayerite, Phys. Chem. Miner., 35, 279–285, https://doi.org/10.1007/s00269-008-0221-y, 2008.
Balan, E., Créon, L., Sanloup, C., Aléon, J., Blanchard, M., Paulatto, L., and Bureau, H.: First-principles modeling of chlorine isotope fractionation between chloride-bearing molecules and minerals, Chem. Geol., 525, 424–434, https://doi.org/10.1016/j.chemgeo.2019.07.032, 2019.
Baroni, S., de Gironcoli, S., Dal Corso, A., and Giannozzi, P.: Phonons and related crystal properties from density-functional perturbation theory, Rev. Mod. Phys., 73, 515–561, https://doi.org/10.1103/RevModPhys.73.515, 2001.
Belluso, E., Cavallo, A., and Halterman, D.: Crystal habit of mineral fibres, in: Mineral Fibres: Crystal Chemistry, Chemical-Physical Properties, Biological Interaction and Toxicity, edited by: Gualtieri, A. F., EMU notes in Mineralogy, London, Mineralogical Society of Great Britain and Ireland, 18, 2017.
Capitani, G. C. and Mellini, M.: The modulated crystal structure of antigorite: the m=17 polysome, Am. Mineral., 89, 147–158, https://doi.org/10.2138/am-2004-0117, 2004.
Capitani, G. C. and Mellini, M.: HRTEM evidence for 8-reversals in the m=17 antigorite polysome, Am. Mineral., 90, 991–998, https://doi.org/10.2138/am.2005.1634, 2005.
Capitani, G. C. and Mellini, M.: The crystal structure of a second antigorite polysome (m=16), by single-crystal synchrotron diffraction, Am. Mineral., 91, 394–399, https://doi.org/10.2138/am.2006.1919, 2006.
Capitani, G. C., Stixrude, L., and Mellini, M.: First-principles energetics and structural relaxation of antigorite, Am. Mineral., 94, 1271–1278, https://doi.org/10.2138/am.2009.3218, 2009.
Deschamps, F., Godard, M., Guillot, S., and Hattori, K.: Geochemistry of subduction zone serpentinites: A review, Lithos, 178, 96–127, https://doi.org/10.1016/j.lithos.2013.05.019, 2013.
Dobson, D. P., Meredith, P. G., and Boon, S. A.: Simulation of subduction zone seismicity by dehydration of serpentine, Science, 298, 1407–1410, https://doi.org/10.1126/science.1075390, 2002.
Dódony, I., Pósfai, M., and Buseck, P. R.: Revised structure models for antigorite: An HRTEM study, Amer. Mineral., 87, 1443–1457, https://doi.org/10.2138/am-2002-1022, 2002.
Dódony, I., Pósfai, M., and Buseck, P. R.: Does antigorite really contain 4- and 8-membered rings of tetrahedra?, Am. Mineral., 91, 1831–1838, https://doi.org/10.2138/am.2006.1971, 2006.
Ducher, M., Blanchard, M., and Balan, E.: Equilibrium zinc isotope fractionation in Zn-bearing minerals from first-principles calculations, Chem. Geol., 443, 87–96, https://doi.org/10.1016/j.chemgeo.2016.09.016, 2016.
Farmer, V. C.: The infrared spectra of minerals, Mineralogical Society, London, https://doi.org/10.1180/mono-4, 1974.
Farmer, V. C.: Differing effect of particle size and shape in the infrared and Raman spectra of kaolinite, Clay Miner., 33, 601–604, https://doi.org/10.1180/000985598545921, 1998.
Farmer, V. C.: Transverse and longitudinal crystal modes associated with OH stretching vibrations in single crystals of kaolinite and dickite, Spectrochim. Acta A, 56, 927–930, https://doi.org/10.1016/S1386-1425(99)00182-1, 2000.
Fritsch, E., Juillot, F., Dublet, G., Fonteneau, L, Fandeur, D., Martin, E., Caner, L. Auzende, A.-L., Grauby, O., and Beaufort, D.: An alternative model for the formation of hydrous Mg/Ni layer silicates (“deweylite”/“garnierite”) in faulted peridotites of New Caledonia: I. Texture and mineralogy of a paragenetic succession of silicate infillings, Eur. J. Mineral., 28, 295–311, https://doi.org/10.1127/ejm/2015/0027-2503, 2016.
Fritsch, E. J. C., Juillot, F., Dublet, G., Fonteneau, L., Fandeur, D., Martin, E., Caner, L., Auzende, A. L., and Beaufort, D.: An alternative model for the formation of hydrous Mg/Ni layer silicates (“deweylite”/“garnierite”) in faulted peridotites of New Caledonia: II. Petrography and chemistry of white and green clay infillings, Eur. J. Mineral., 31, 945–962, https://doi.org/10.1127/ejm/2019/0031-2869, 2019.
Ghaderi, N., Zhang, H., and Sun, T.: Relative stability and contrasting elastic properties of serpentine polymorphs from first-principles calculations, J. Geophys. Res.-Sol. Ea., 120, 4831–4842, https://doi.org/10.1002/2015JB012148, 2015.
Giannozzi, P., Baroni, S., Bonini, N., Calandra, M., Car, R., Cavazzoni, C., Ceresoli, D., Chiarotti, G. L., Cococcioni, M., Dabo, I., Dal Corso, A., de Gironcoli, S., Fabris, S., Fratesi, G., Gebauer, R., Gerstmann, U., Gougoussis, C., Kokalj, A., Lazzeri, M., Martin-Samos, L., Marzari, N., Mauri, F., Mazzarello, R., Paolini, S., Pasquarello, A., Paulatto, L., Sbraccia, C., Scandolo, S., Sclauzero, G., Seitsonen, A. P., Smogunov, A., Umari, P., and Wentzcovitch, R. M.: Quantum ESPRESSO: a modular and open-source software project for quantum simulations of materials, J. Phys.-Cond. Mat., 21, 395502, https://doi.org/10.1088/0953-8984/21/39/395502, 2009.
Grobéty, B.: Polytypes and higher-order structures of antigorite: a TEM study, Am. Mineral., 88, 27–36, https://doi.org/10.2138/am-2003-0104, 2003.
Hage, F. S., Radtke, G., Kepaptsoglou, D. M., Lazzeri, M., and Ramasse, Q. M.: Single-atom vibrational spectroscopy in the scanning transmission electron microscope, Science, 367, 1124–1127, https://doi.org/10.1126/science.aba1136, 2020.
Hamann, D. R.: Optimized norm-conserving Vanderbilt pseudopotentials, Phys. Rev. B, 88, 085117, https://doi.org/10.1103/PhysRevB.88.085117, 2013.
Hilairet, N., Daniel, I., and Reynard, B.: Equation of state of antigorite, stability field of serpentines, and seismicity in subduction zones, Geophys. Res. Lett., 33, L02302, https://doi.org/10.1029/2005GL024728, 2006.
Jollands, M. C., Blanchard, M., and Balan, E.: Structure and theoretical infrared spectra of OH defects in quartz, Eur. J. Mineral., 32, 311–323, https://doi.org/10.5194/ejm-32-311-2020, 2020.
Jovanoski, G. and Makreski, P.: Minerals from Macedonia. XXX. Complementary use of vibrational spectroscopy and X-ray powder diffraction for spectra-structural study of some cyclo-, phyllo- and tectosilicate minerals. A review, Maced. J. Chem. Chem. En., 35, 125–155, https://doi.org/10.20450/mjcce.2016.1047, 2016.
Kendrick, J. and Burnett, A. D.: PDielec: The calculation of infrared and terahertz absorption for powdered crystals, J. Comput. Chem., 37, 1491–1504, https://doi.org/10.1002/jcc.24344, 2016.
Kunze, W. G.: Die gewellte struktur der antigorits, I., Zeitschrift für Kristallographie, 108, 82–107, https://doi.org/10.1524/zkri.1956.108.1-2.82, 1956.
Kunze, W. G.: Die gewellte struktur der antigorits, II., Zeitschrift für Kristallographie, 108, 282–327, https://doi.org/10.1524/zkri.1958.110.16.282, 1958.
Kunze, W. G.: Antigorit, Fortschritte der Mineralogie, 39, 206–324, 1961.
Madejová, J., Balan, E., and Petit, S.: Application of vibrational spectroscopy (IR and Raman) on the characterization of industrial minerals, EMU Notes in Mineralogy, 9, 171–226, https://doi.org/10.1180/EMU-notes.9, 2011.
Mellini, M.: Structure and microstructure of serpentine minerals, EMU Notes in Mineralogy, 14, 153–180, https://doi.org/10.1180/EMU-notes.14.5, 2013.
Mellini, M., Fuchs, Y., Viti, C., Lemaire, C., and Linarès, J.: Insights into the antigorite structure from Mössbauer and FTIR spectroscopies, Eur. J. Mineral., 14, 97–104, https://doi.org/10.1127/0935-1221/2002/0014-0097, 2002.
Momma, K. and Izumi, F.: VESTA 3 for three-dimensional visualization of crystal, volu- metric and morphology data, J. Appl. Crystallogr., 44, 1272–1276, https://doi.org/10.1107/S0021889811038970, 2011.
Perdew, J. P., Burke, K., and Ernzerhof, M.: Generalized Gradient Approximation Made Simple, Phys. Rev. Lett., 77, 3865–3868, https://doi.org/10.1103/PhysRevLett.77.3865, 1996.
Prencipe, M., Noel, Y., Bruno, M., and Dovesi, R.: The vibrational spectrum of lizardite-1T [Mg3Si2O5(OH)4] at the Γ point: A contribution from an ab initio B3LYP calculation, Am. Mineral., 94, 986–994, https://doi.org/10.2138/am.2009.3127, 2009.
Schlipf, M. and Gygi, F.: Optimization algorithm for the generation of ONCV pseudopotentials, Comput. Phys. Comm., 196, 36, https://doi.org/10.1016/j.cpc.2015.05.011, 2015.
Schwartz, S., Guillot, S., Reynard, B., Lafay, R., Debret, B., Nicollet, C., Lanari, P., and Auzende, A.-L.: Pressure–temperature estimates of the lizardite/antigorite transition in high pressure serpentinites, Lithos, 178, 197–210, https://doi.org/10.1016/j.lithos.2012.11.023, 2013.
Uehara, S.: TEM and XRD study of antigorite superstructures, Canad. Mineral., 36, 1595–1605, 1998.
Uehara, S. and Shirozu, H.: Variations in chemical composition and structural properties of antigorites, Mineral. J., 12, 299–318, https://doi.org/10.2465/minerj.12.299, 1985.
Ulmer, P. and Trommsdorff, V.: Serpentine stability to mantle depths and subduction- related magmatism, Science, 268, 858–861, https://doi.org/10.1126/science.268.5212.858, 1995.
Wicks, F. J. and O'Hanley, D. S.: Serpentine minerals: structures and petrology. in: Hydrous phyllosilicates, edited by: Bailey, S., Mineralogical Society of America, Rev. Mineral., 19, 91–167, 1988.
Wunder, B., Wirth, R., and Gottschalk, M.: Antigorite: pressure and temperature dependence of polysomatism and water content, Eur. J. Mineral., 13, 485–495, https://doi.org/10.1127/0935-1221/2001/0013-0485, 2001.
Yariv, S. and Heller-Kallai, L.: The relationship between the I.R. spectra of serpentines and their structures, Clays Clay Miner., 23, 145–152, https://doi.org/10.1346/CCMN.1975.0230210, 1975.