the Creative Commons Attribution 4.0 License.
the Creative Commons Attribution 4.0 License.
 | 02 Jul 2021
Chapmanite [Fe2Sb(Si2O5)O3(OH)]: thermodynamic properties and formation in low-temperature environments
Stefan Kiefer
Kristina Lilova
Tamilarasan Subramani
Alexandra Navrotsky
Edgar Dachs
Artur Benisek
In this work, we have determined or evaluated thermodynamic properties of synthetic Sb2O5, MgSb2O6 (analogue of the mineral byströmite), Mg[Sb(OH)6]2⋅6H2O (brandholzite), and natural chapmanite [(Fe1.88Al0.12)Sb(Si2O5)O3(OH)]. Enthalpies of reactions, including formation enthalpies, were evaluated using reference compounds Sb, Sb2O3, Sb2O5, and other phases, with high-temperature oxide melt solution calorimetry in lead borate and sodium molybdate solvents. Heat capacity and entropy were determined by relaxation and differential scanning calorimetry. The best set of ΔfHo (kJ mol−1) and So (J mol−1 K−1) is byströmite , 139.3±1.0; brandholzite , 571.0±4.0; and chapmanite , 305.1±2.1. The data for chapmanite give ΔfGo of kJ mol−1 and for the dissolution reaction (Fe1.88Al0.12)Sb(Si2O5)O3(OH) + 6H 1.88Fe3+ + 0.12Al3+ + 2SiO + Sb(OH) + 2H2O. Analysis of the data showed that chapmanite is finely balanced in terms of its stability with schafarzikite (FeSb2O4) and tripuhyite (FeSbO4) under a specific, narrow range of conditions when both aqueous Fe(III) and Sb(III) are abundant. In such a model, chapmanite is metastable by a narrow margin but could be stabilized by high SiO(aq) activities. Natural assemblages of chapmanite commonly contain abundant amorphous silica, suggesting that this mechanism may be indeed responsible for the formation of chapmanite. Chapmanite probably forms during low-temperature hydrothermal overprint of pre-existing Sb ores under moderately reducing conditions; the slightly elevated temperatures may help to overcome the kinetic barrier for its crystallization. During weathering, sheet silicates may adsorb Sb3+ in tridentate hexanuclear fashion, thus exposing their chapmanite-like surfaces to the surrounding aqueous environment. Formation of chapmanite, as many other sheet silicates, under ambient conditions, is unlikely.
- Article
(2851 KB) - Full-text XML
-
Supplement
(619 KB) - BibTeX
- EndNote


Antimony is an element that enters into both quite soluble and quite insoluble minerals as it moves through the aqueous environment. The solubility of such reservoirs was previously quantified by Filella and May (2003), Diemar et al. (2009), Leverett et al. (2012), Roper et al. (2015), and others using thermodynamic data. The discrepancies between the observations of antimony being soluble at some sites but insoluble at other ones were addressed and resolved by Majzlan et al. (2016). The rich mineralogy of antimony was extensively summarized by Majzlan (2021), and the details will not be repeated here.
Two insoluble minerals, considered to be the “ultimate sinks” of antimony, are tripuhyite (FeSb5+O4) and schafarzikite (FeSbO4) (Leverett et al., 2012). Tripuhyite has been identified at a number of sites polluted by Sb (see Majzlan, 2021), but schafarzikite is rare, restricted to a few localities where it seems to be primary and not secondary (e.g., Sejkora et al., 2007). Its rarity could be explained by the scarcity of research in reduced environments because most of the work at the polluted sites is concentrating on their oxidized portions. They are believed to release toxic elements, such as antimony, into the environment. An alternative explanation is that schafarzikite does not form since its nucleation and growth is kinetically hindered. Another possibility is that there is a competing phase or phases that scavenge antimony under such conditions. Iron oxides, the usual scavengers of many anions, are not good candidates, as they may undergo reductive dissolution under such conditions. On the other hand, it has been shown that during reduction–oxidation cycles antimony adsorbed onto goethite will be locked into tripuhyite and not into the structure of schafarzikite (Burton et al., 2020).
The aim of this work is to evaluate the thermodynamic stability of chapmanite, a rare mineral that could, however, constitute an alternative sink of antimony in slightly reducing environments. To this goal, first we verified the methodology of high-temperature oxide melt solution calorimetry in molten lead borate on antimony phases, doing a number of cross-checks. Once assured that this method can yield accurate and precise data, the enthalpy of formation of chapmanite was measured. Entropy was obtained by integration of low-temperature heat capacity data measured by relaxation calorimetry. Calculations of stability and solubility of chapmanite in selected exemplary systems document its possible role in the environment.
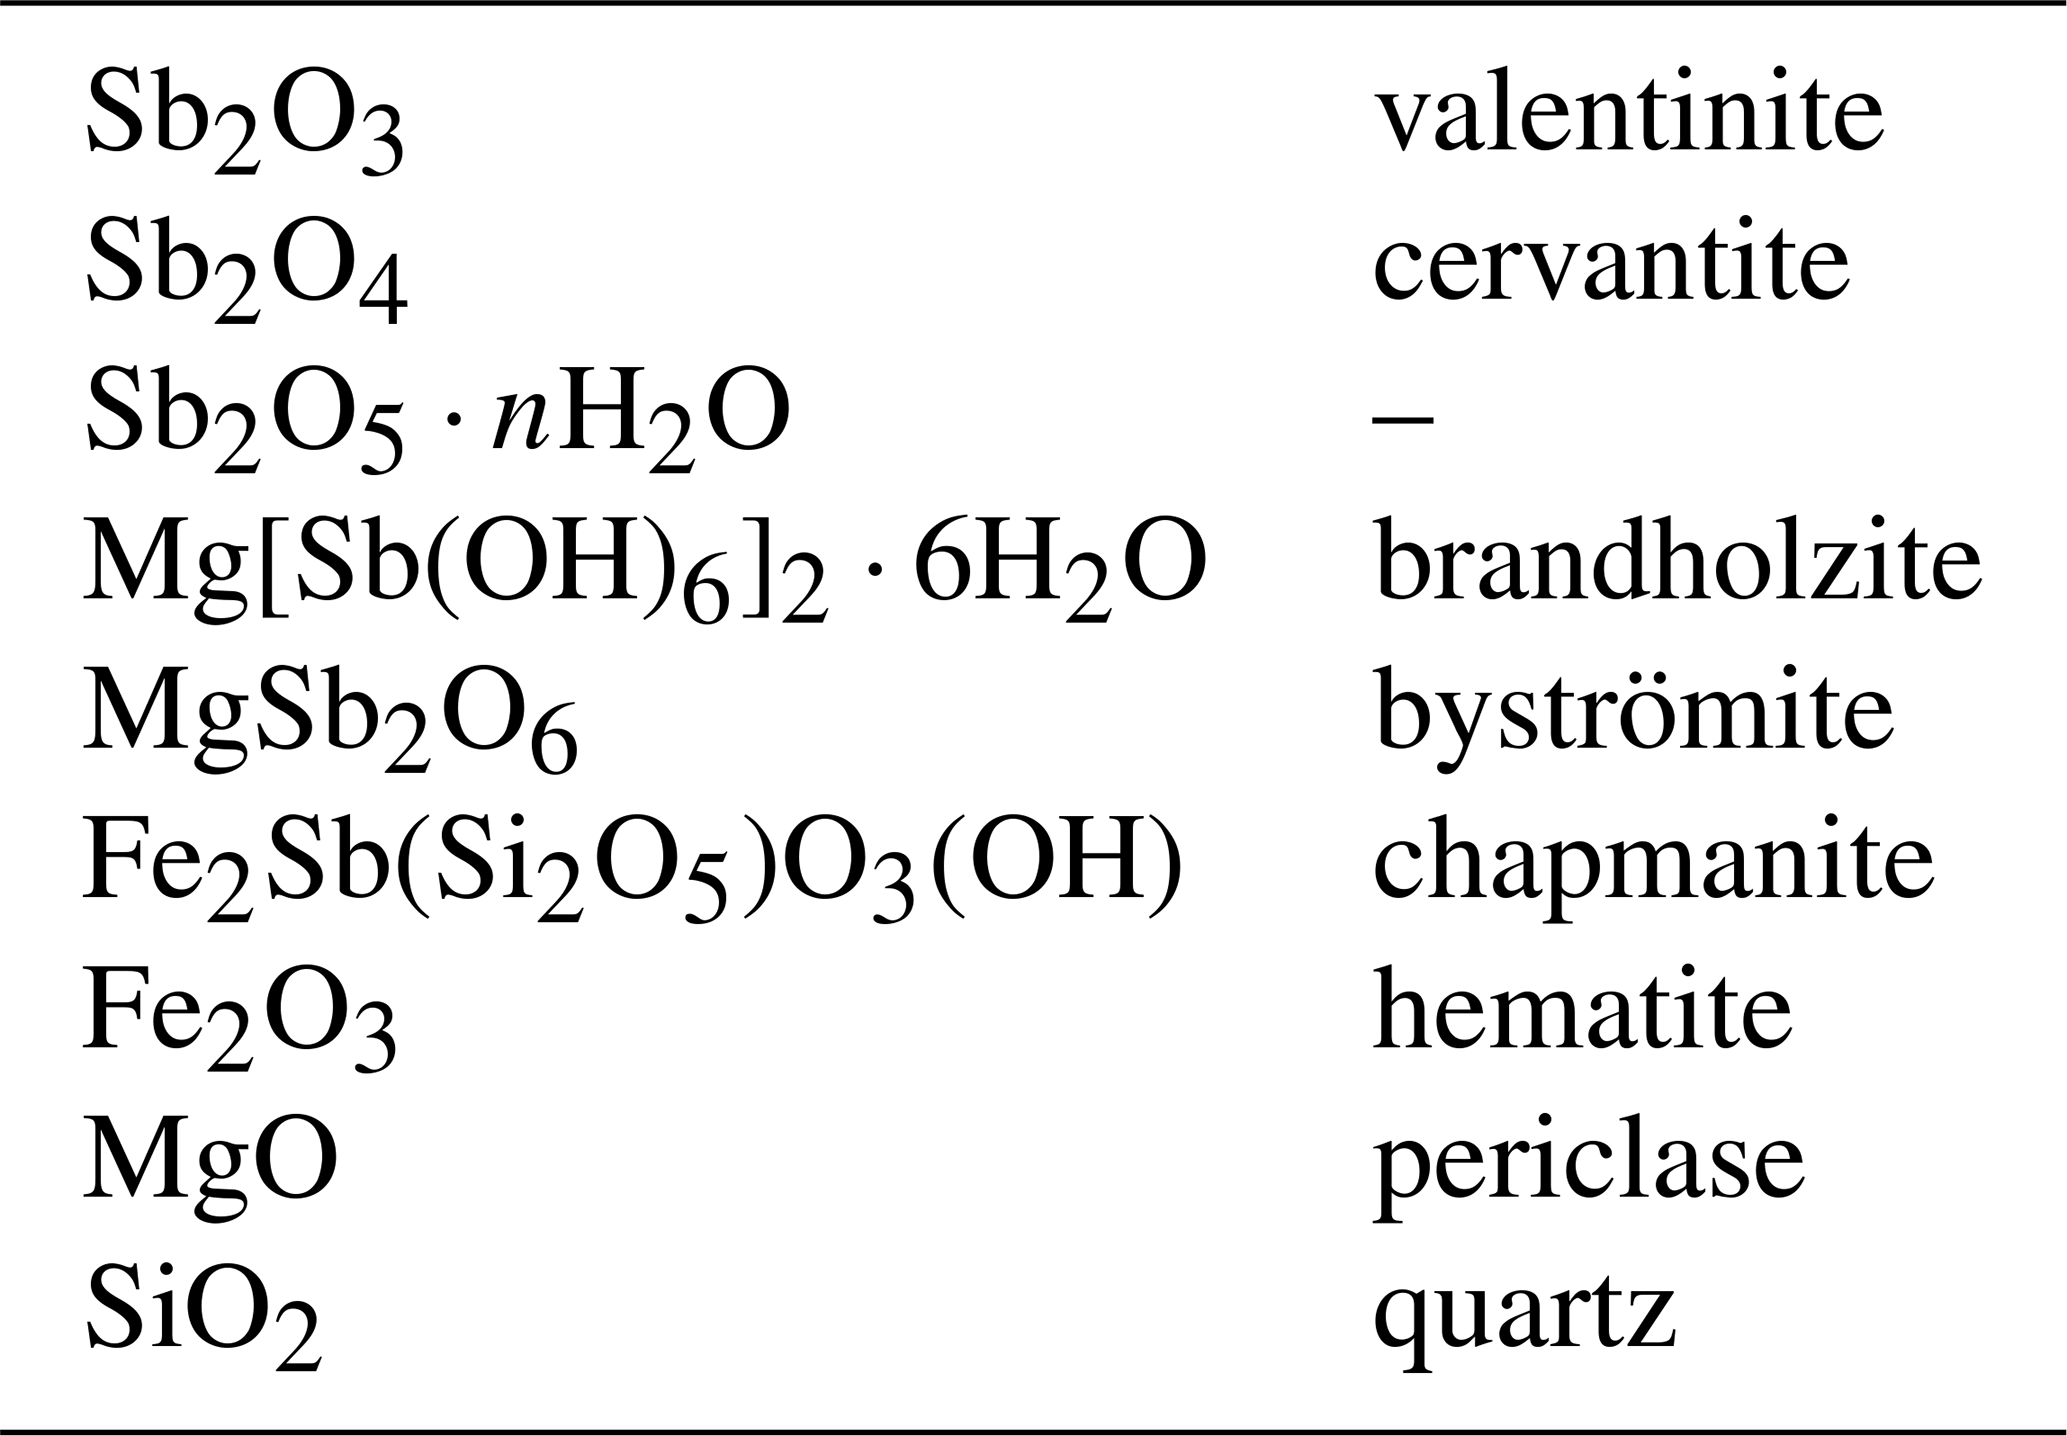
Throughout this paper, the phases investigated can be referred to by their mineral names. In their synthetic form, they are equivalents of the naturally occurring minerals. The use of these names improves the clarity of the presentation because a mineral name is linked not only to a specific chemical composition, but also to a crystal structure. It is particularly advantageous in systems with polymorphism, such as among the antimony oxides. The chemical formulae and mineral names of the phases considered in this paper are summarized in Table 1.
Table 1Chemical formulae and mineral names of phases investigated in this work. With the exception of chapmanite, all samples used in this work were synthetic. Space groups and refined lattice parameters for the antimony phases can be found in Table 2.
Synthetic Sb2O3 (equivalent of valentinite) and Sb2O5 were purchased from suppliers and used as received. Sb2O4 (equivalent of cervantite) was synthesized by treatment of Sb2O3 at 700 ∘C for 1 d (Konopik and Zwiauer, 1952). Powdery Sb2O3 was placed into a platinum crucible, covered by a platinum lid and heated in air. In contrast to the results of Konopik and Zwiauer (1952), we found that prolonged heat treatment does not lead to better crystallinity or phase purity but to amorphization of the sample.
Crystals of Mg[Sb(OH)6]2⋅6H2O (equivalent of brandholzite) were synthesized according to the procedure of Diemar et al. (2009). Two separate solutions were prepared initially. One of them was 1 M Sb5+ solution, prepared by mixing deionized water and KSb(OH)6. The suspension was heated on a heating plate at ≈ 60 ∘C until most of the solid dissolved. The undissolved residue was separated by decantation. The other solution was 0.1 M Mg2+, prepared by mixing of deionized water and MgCl2⋅6H2O. The two solutions were mixed, resulting in the immediate formation of a white precipitate. The suspension was allowed to stand at room temperature for 2 months and then filtered and washed several times by deionized water. The filtrate consisted of euhedral crystals of Mg[Sb(OH)6]2⋅6H2O and white, powdery aggregates of an unknown phase, perhaps of the same composition. The crystals were up to 1 mm in size and were separated from the rest of the sample under a binocular microscope.
MgSb2O6 was prepared from Mg[Sb(OH)6]2⋅6H2O by heating at 1000 ∘C for 1 h. The crystals of Mg(Sb(OH)6)2⋅6H2O were placed into a platinum crucible, covered by a platinum lid and heated in air. The resulting sample was powdery and grayish.
A natural sample of chapmanite, nominally Fe2Sb(Si2O5)O3(OH), used in this work originated from the Pezinok Sb deposit in Slovakia (Polák, 1983, 1988). The sample consisted of a coating of powdery greenish-yellow crusts of chapmanite on dark gray quartz with sparse tiny pyrite crystals. The crusts were scraped of the specimens and separated by a standard protocol for clay mineral separation. Briefly, 20 g of the sample under 0.16 mm (after grinding) was mixed with 300 mL distilled water in a beaker. Afterwards, 3–4 mL of 0.1 M solution of sodium hexametaphosphate were added, the suspension was ultrasonicated for 5 min, the volume added up to 2 L in a cylinder. After 24 h, the water column was removed with a suction pump and the sediment at the bottom discarded. The suspension from the suction pump was transferred into a beaker, and a few drops of 15 % HCl were added to coagulate the clay particles. After coagulation, water was removed with the suction pump and discarded. The slurry was transferred onto a thin plastic sheet and dried at 50 ∘C. Further treatment, owing to the analytical results, is described below.
Powder X-ray diffraction (PXRD) patterns of all minerals and reference compounds were collected using a Bruker D8 Advance DaVinci diffractometer employing Cu Kα radiation (λ=1.54058 Å). The patterns were collected at room temperature between 5 and 90 ∘C 2θ, with a step size of 0.02∘ 2θ and a time per step of 1 s. Lattice parameters and quantitative fractions of the studied phases were refined by a full-profile fit using the software suite JANA2006 (Petříček et al., 2014).
Thermogravimetric (TG) and differential thermal analysis (DTA) of chapmanite was done with a TG 92 Setaram TG/DTA instrument. The samples were heated from room temperature up to 900 ∘C in a flow of argon at a heating rate of 10 ∘C min−1. Thermogravimetric (TG) analysis of synthetic Sb2O5 was performed with a Labsys Evo instrument from room temperature to 600 ∘C. Heating rate was 10 ∘C min−1, and the measurement was done in flowing air.
The quantitative chemical composition of chapmanite was determined by electron microprobe using a JEOL JXA-8230. The operating conditions were set to an accelerating voltage of 15 kV, a beam current of 5 nA, and a beam diameter between 5 and 10 µm. The wavelength-dispersive X-ray spectrometers were used to measure the elements and X-ray emission lines of Al, Mg, Si, Ca, K, P, S, Fe, Mn (Kα), and Sb (Lα). To improve the count-rate statistics, the counting times were 40 s. The standard specimens used for calibration were Al2O3 for Al, wollastonite for Si and Ca, MgO for Mg, celestine for S, InSb for Sb, orthoclase for K, apatite for P, hematite for Fe, and rhodonite for Mn. Peak overlap correction was used to avoid interference between the lines of Sb and K. The detection limits, calculated from the peak and background counts, the measurement time, the beam current, and the standard material concentration, are 0.07 wt % for Si, Ca, Mg, and Mn; 0.08 wt % for Fe and Al; 0.09 wt % for P and S; 0.11 wt % for K; and 0.20 wt % for Sb.
Morphological characterization of the chapmanite sample was performed using a Carl Zeiss ULTRA Plus FEG scanning electron microscope (SEM) operating with an acceleration voltage of 20 kV. Selected crystals were analyzed by energy-dispersive X-ray (EDX) analysis.
A portion of the sample was brought into solution by total digestion in a microwave in a mixture of HNO3, HClO4, and HF. The concentration of selected elements was measured by inductively coupled plasma mass spectrometry (ICP-MS). The instrument used was Thermo Fisher Scientific.
High-temperature oxide melt solution calorimetry has been described in detail by Navrotsky (1997, 2014). The experiments were performed at 1073 K in both lead borate (2PbO ⋅ B2O3) and sodium molybdate (3Na2O ⋅ 4MoO3) solvents. Oxygen gas was flushed over the solvent at 90 mL min−1 and bubbled through it at 5 mL min−1.
Low-temperature heat capacity (Cp) was measured by relaxation calorimetry using a commercial Physical Properties Measurement System (PPMS, from Quantum Design, San Diego, California) at the University of Salzburg, Austria. With due care, accuracy can be within 1 % at 5 to 300 K and 5 % at 0.7 to 5 K (Dachs and Bertoldi, 2005; Kennedy et al., 2007). The powdered samples were wrapped in a thin Al foil and compressed to produce a ≈ 0.5 mm thick pellet, which was then placed onto the sample platform of the calorimeter for measurement. Differential scanning calorimetry (DSC) was used to measure heat capacities near and above room temperature using a Perkin Elmer Diamond DSC. Details of the method are described by Benisek et al. (2012). The entropy was calculated by integration of the function in the interval from 0 to 298.15 K.
Chapmanite is a rare sheet silicate with unique structural features. The crystal structure of this fine-grained mineral was solved early by electron diffraction (Zhukhlistov and Zvyagin, 1977). It is related to kaolinite with tetrahedral–octahedral layers. The vacant sites in the dioctahedral sheets are capped by Sb3+ ions (Fig. 1), with their lone electron pairs pointing into the interlayer. Charge balance is achieved by deprotonation of three OH groups. Zhukhlistov and Zvyagin (1977) report a limited (1 %) Si-Al substitution in the tetrahedral sites, slight excess of Fe, and deficiency of Sb.
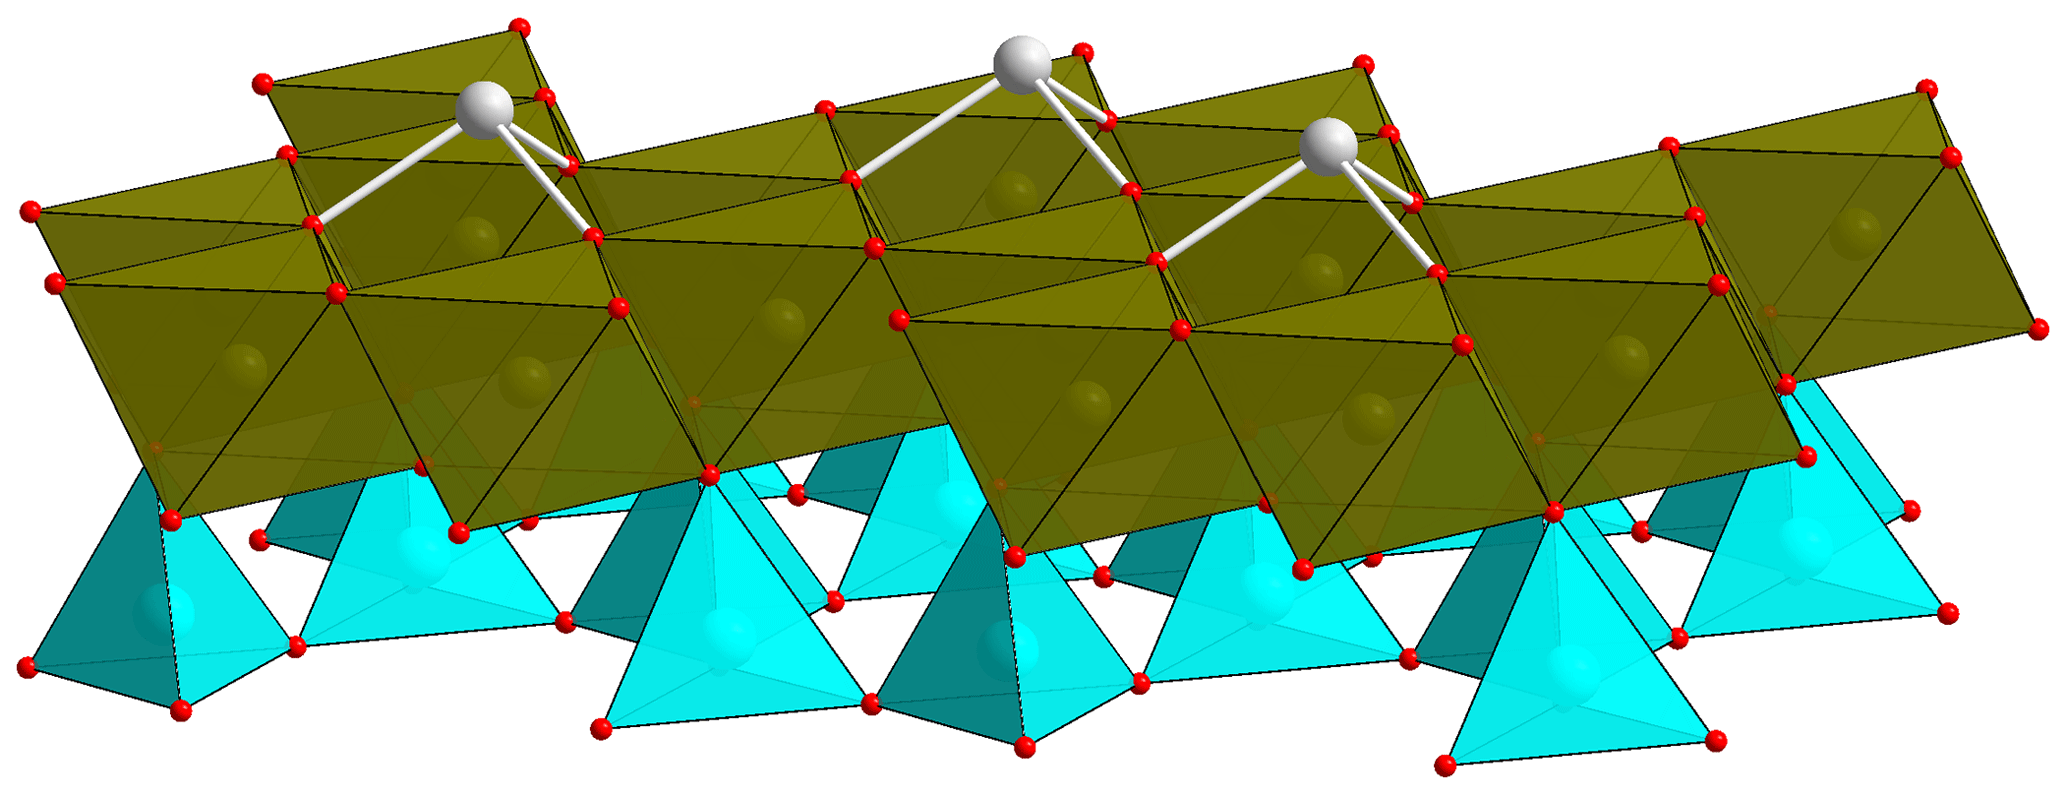
Figure 1Fragment of the chapmanite structure, showing the tetrahedral sheets (cyan), dioctahedral sheets (brown) populated by Fe3+, and the Sb3+ atoms (gray) bonded to three oxygen atoms in the dioctahedral sheets. Red balls represent oxygen atoms. Constructed from the data in Ballirano et al. (1998).
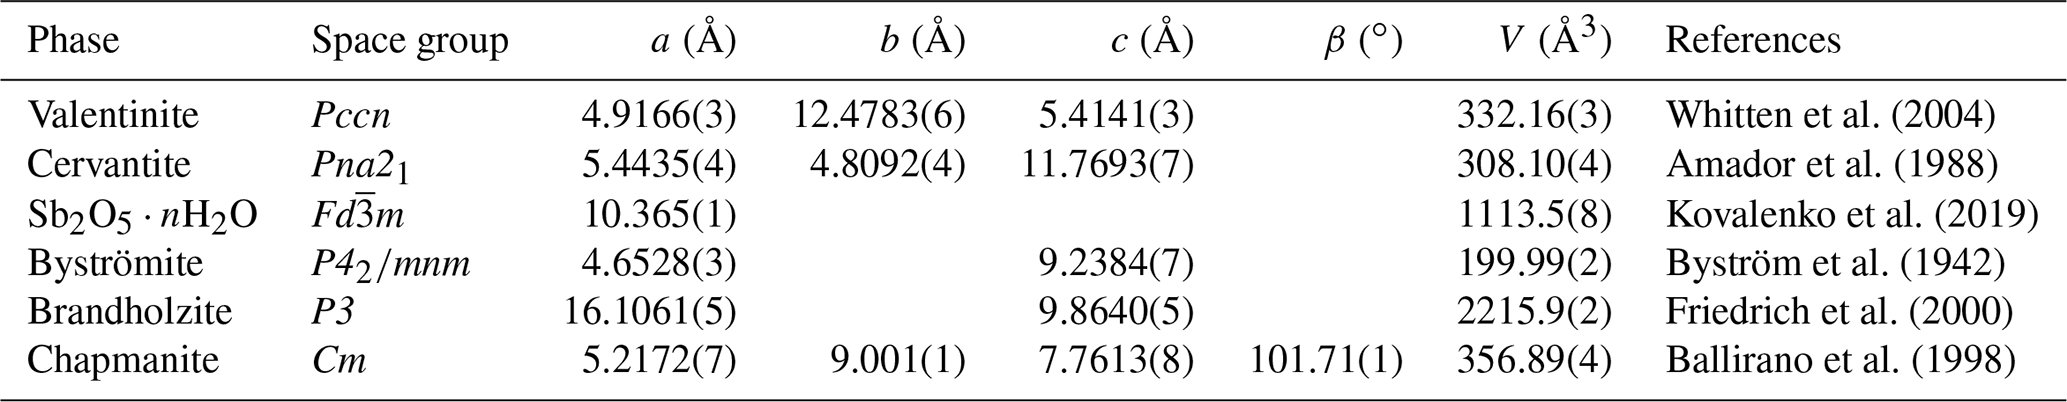
Table 2Lattice parameters of the studied antimony phases. Lattice parameters constrained by symmetry are not listed. Only the chapmanite sample was natural. Nominal chemical formulae are listed in Table 1.
A later study by Ballirano et al. (1998) confirmed the structural model of Zhukhlistov and Zvyagin (1977). Ballirano et al. (1998) used Rietveld refinement of powder XRD data to improve the structural model. They also showed that the natural samples are mixtures of chapmanite, quartz, microcline, calcite, and dolomite.
5.1 Characterization and calorimetry of oxides of antimony
The powder XRD patterns of all oxides of antimony show only sharp peaks of one phase (see supporting electronic information). The refined lattice parameters are summarized in Table 2.
Special attention was paid to the hydration state of Sb2O5⋅nH2O as the amount of H2O strongly influences the calorimetric results. The color of the initial product changed after the TG analysis from yellow to white, indicating H2O loss and possible partial reduction. The total weight loss measured for our Sb2O5⋅nH2O sample was 9.83 wt %. According to Kovalenko et al. (2019), Sb2O5⋅nH2O gradually loses water and becomes H2O-free at around 843 K. Additional weight loss was attributed to partial reduction of antimony and release of O2 gas. Using the same interpretation of our TG data, a weight loss of 9.28 wt % is attributable to H2O, and the remaining weight loss of 0.55 wt % is due to the partial reduction of the Sb2O5.
The H2O content determined for Sb2O5⋅nH2O was taken into account for the reduction of calorimetric data. For the calorimetric experiments, the sample Sb2O5⋅nH2O with 9.28 wt % H2O was used. The presence of H2O in the sample was corrected with the assumption that this water is loosely bound and its heat content is equal to the heat content of free (unbound) H2O ( kJ mol−1). Therefore, Tables 3 and 4 contain reactions and reaction enthalpies that refer to Sb2O5 and not Sb2O5⋅nH2O.
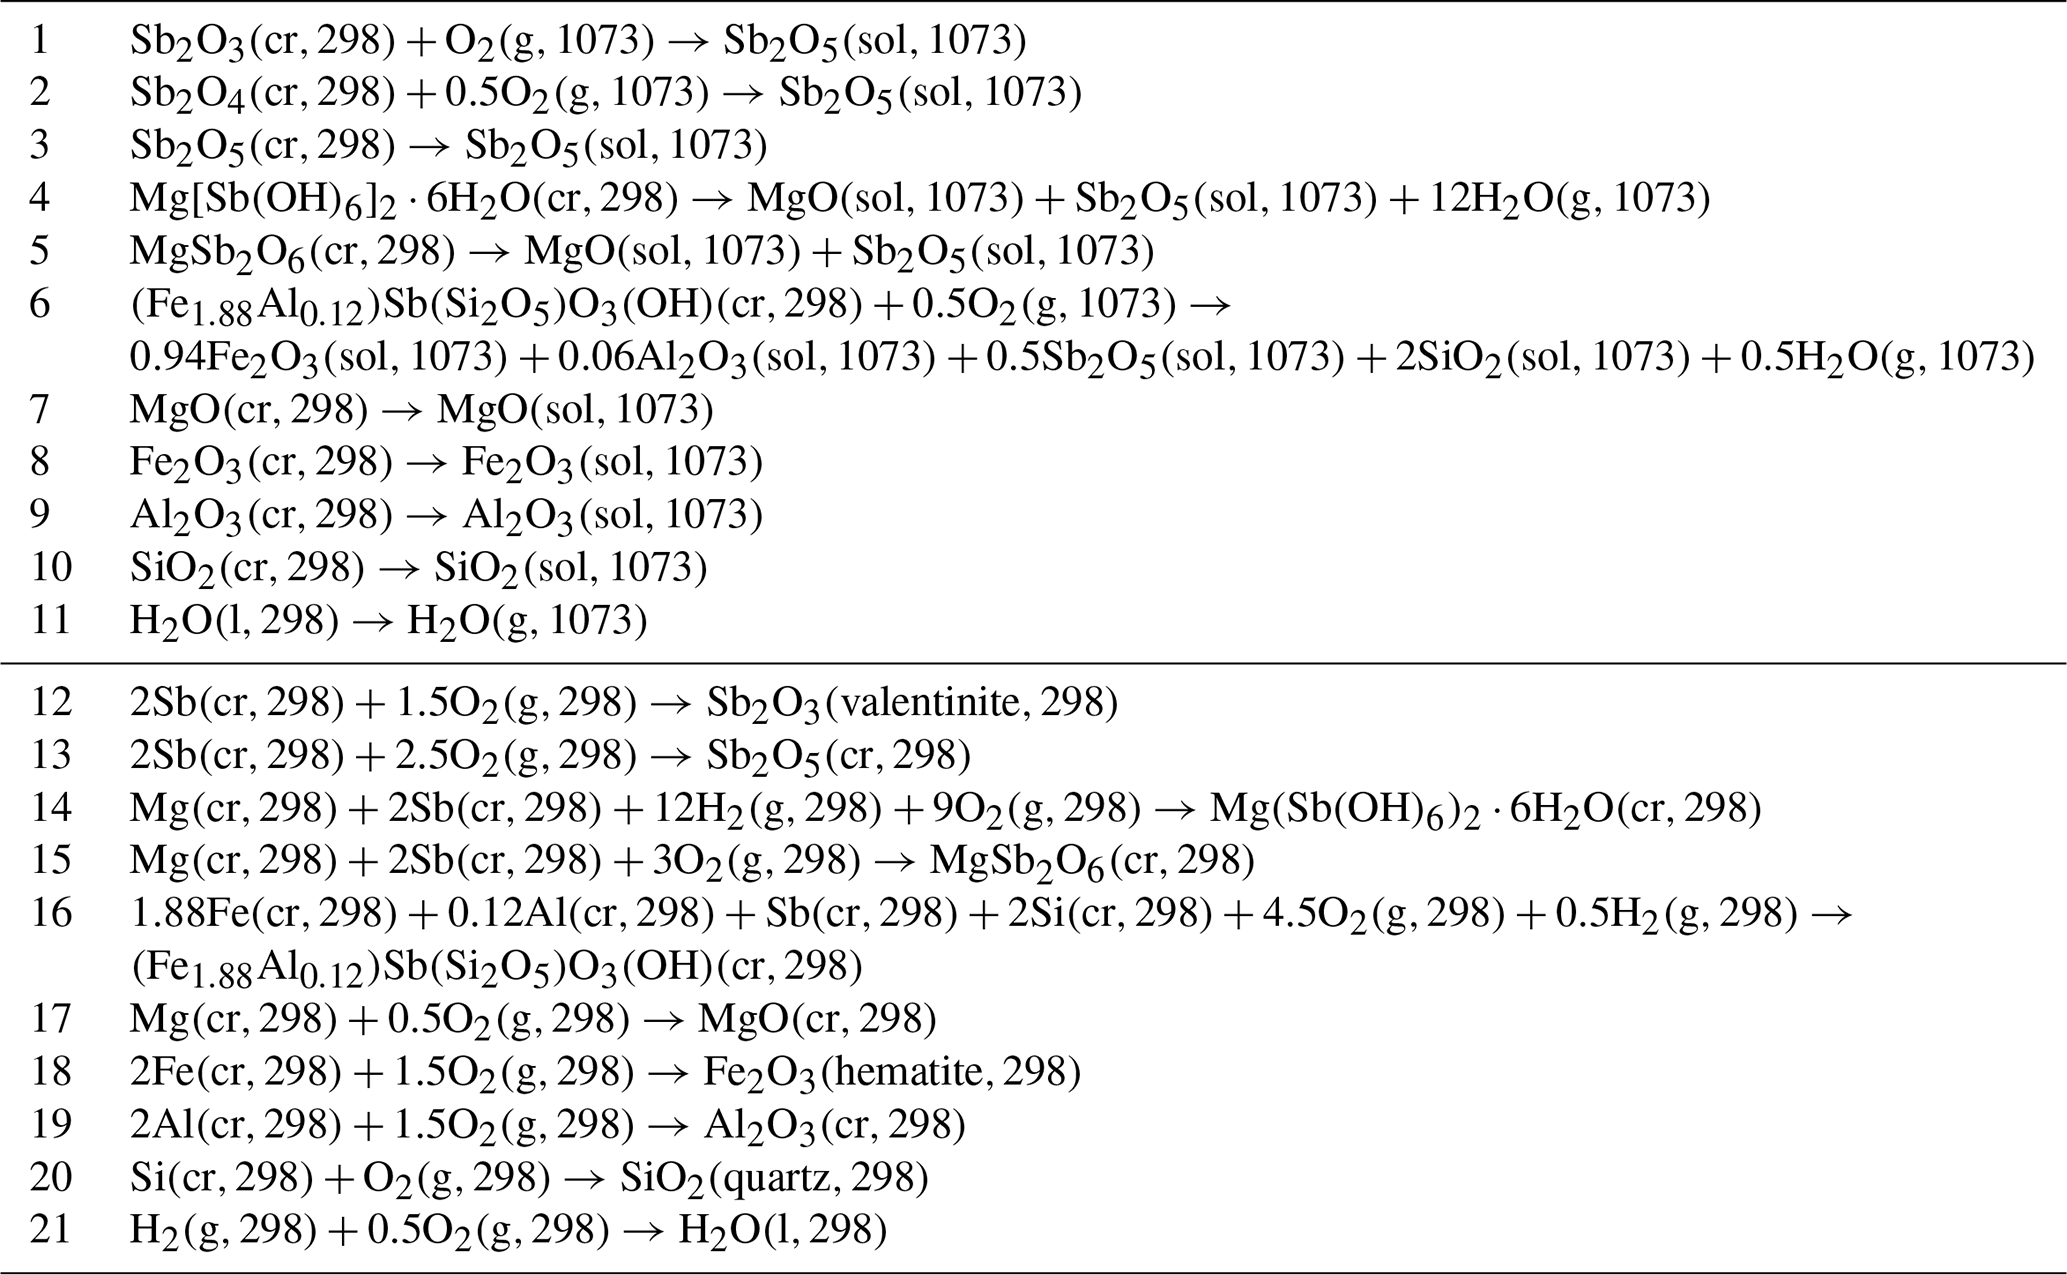
The chemical reactions considered in the calorimetric experiments are summarized in Table 3. The drop solution enthalpies of antimony oxides in lead borate and sodium molybdate are listed in Table 4. The final oxidation state of the antimony in the lead borate melt under oxygen flushing and bubbling is assumed to be 5+. There are no experimental data to confirm this assumption, but the experience with similar systems (e.g., arsenic in oxide melts, Majzlan, 2017) and the magnitudes of the measured enthalpies support the assumption. No difficulties or irregularities were encountered in the experiments with lead borate. The dissolution of the antimony oxides in sodium molybdate results in more scattered data than in lead borate due to baseline shifts. A possible explanation is a reaction of the antimony with the sodium molybdate solvent and the formation of an unknown refractory compound. Nevertheless, consistent drop solution enthalpy data can be obtained if the number of drops is increased. For sodium molybdate, the results for Sb2O5 are more consistent (smaller baseline shifts) than for the Sb3+-containing oxides.
Table 3Reactions considered in the thermochemical cycles used to calculate the enthalpies of selected reactions in the text and enthalpies of formation. cr: crystalline; l: liquid; g: gas; sol: solution in the molten calorimetric solvent. The numbers in parentheses indicate temperature in kelvin (K).
5.2 Thermodynamics of Mg(Sb(OH)6)2⋅6H2O (brandholzite)
The drop solution enthalpies of brandholzite were measured in both oxide melt solvents, and the enthalpies of formation from oxides and from elements were calculated via a thermochemical cycle, using reactions in Table 3 and their respective enthalpies (Table 4). The cycle can be expressed by the equation
The enthalpies of formation calculated from the measurements in the two solvents (Table 5) are consistent within their uncertainties.
Table 4Drop solution enthalpies (ΔdsH) of antimony compounds and reference phases in lead borate and sodium molybdate melt at 1073 K. “No.” is the reaction number of the reactions in Table 3. Data for the drop-solution enthalpies of reference Sb-free phases from Navrotsky (2014), with the exception of MgO (Lilova et al., 2019). H1073–H298.15 is heat content between T=298.15 and T=1073 K. Heat content is calculated from heat-capacity polynomials in Robie and Hemingway (1995). All data are in kJ mol−1.
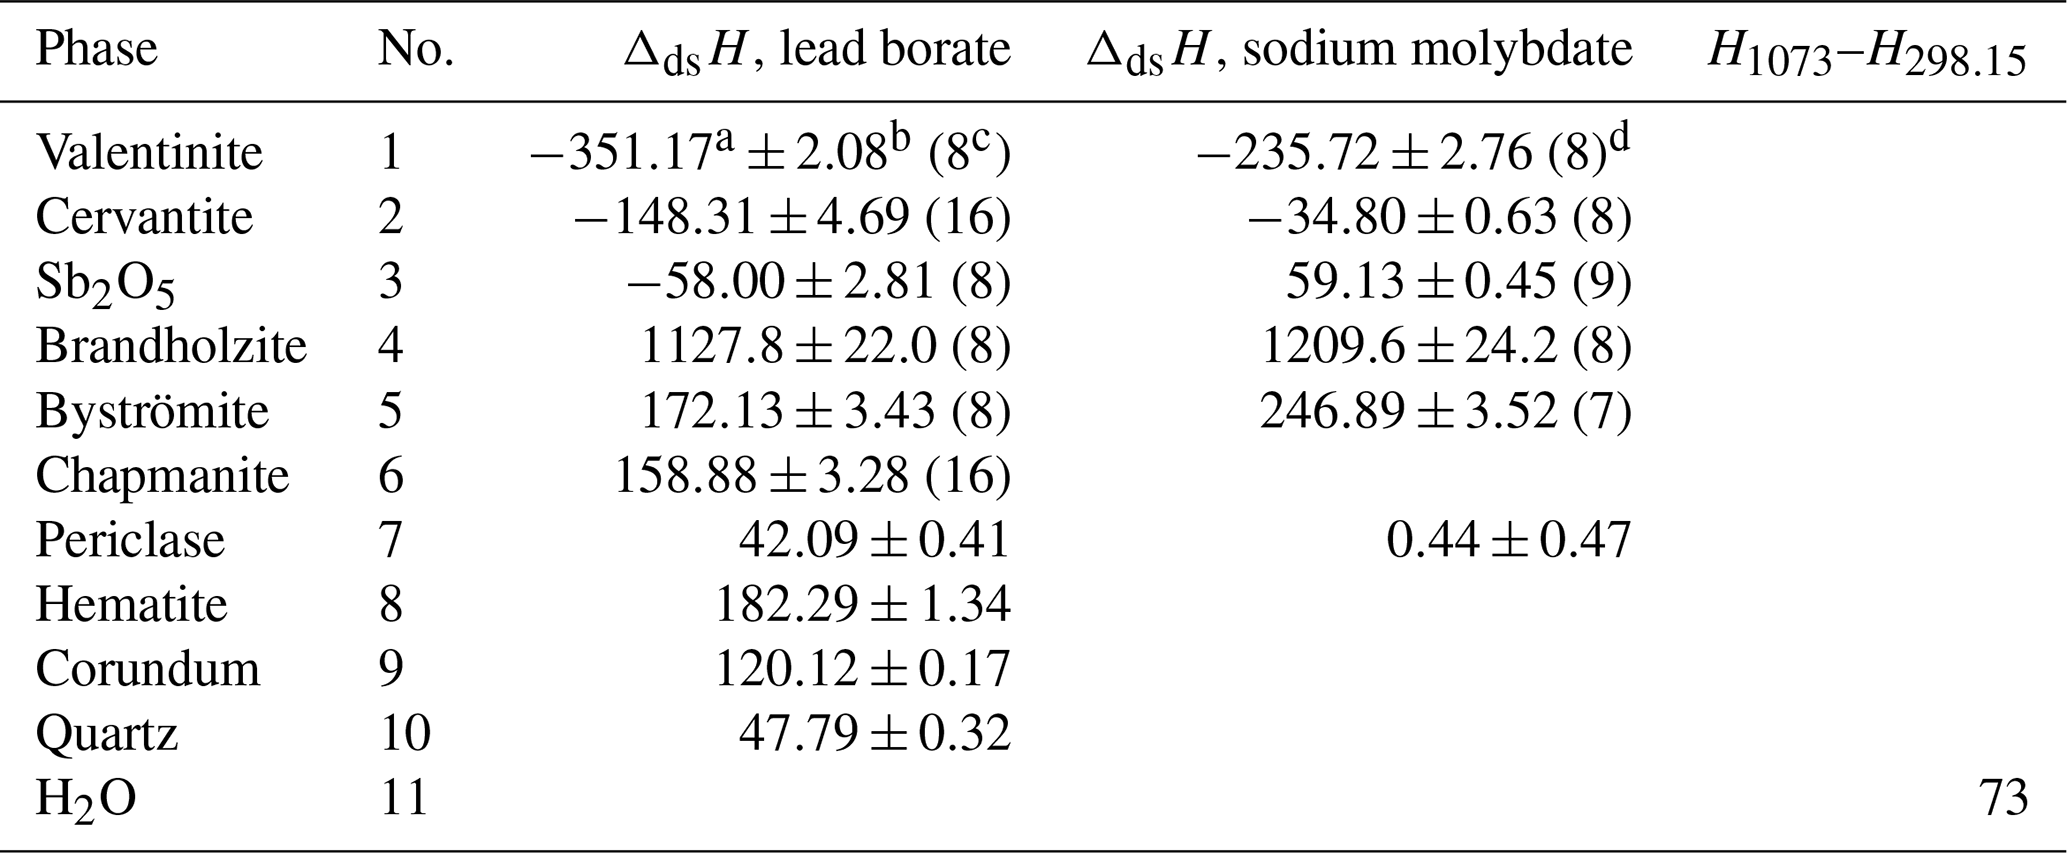
a Mean. b Two standard deviations of the mean. c Number of measurements. d Mielewczyk-Gryn and Lilova (unpublished data).
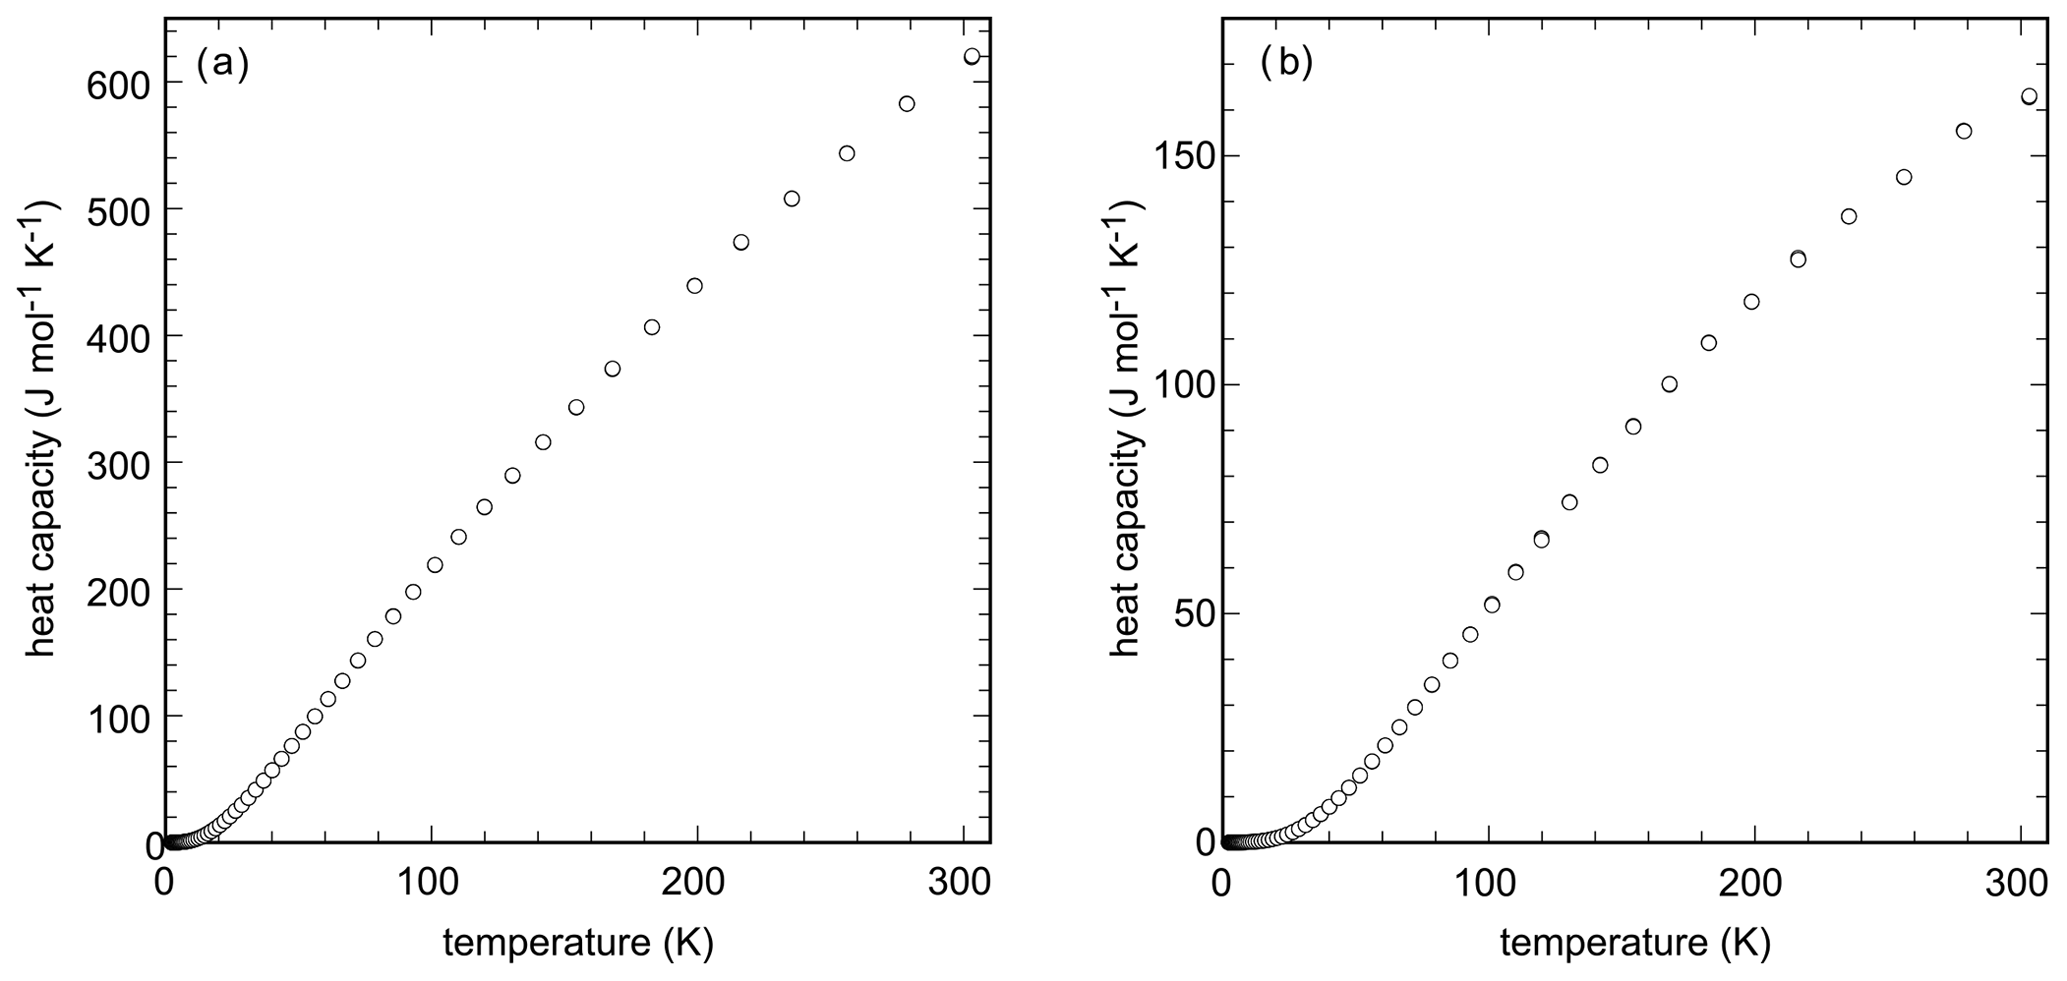
Low-temperature heat capacity data (Fig. 2a) for brandholzite show no anomalies, as expected for a phase with the elements Mg, Sb, O, and H. Integration with polynomials gave the standard entropy at T=298.15 K of J mol−1 K−1. DSC data were measured between 280 and 300 K and agree well with the PPMS data. The DSC data are ≈ 0.5 % higher than the PPMS data.
The relatively large uncertainties (in kJ mol−1) of the ΔfHo values from the calorimetric work are related to the high molecular weight of the samples and the large magnitude of heat effects of the primary high-temperature oxide melt solution calorimetric data. The usual uncertainty on these data is about 1 % of the measured signal. In the case of brandholzite, the signal is large because of the appreciable amount of H2O in this phase and the heat effect caused by this H2O. Hence, the uncertainties are not a sign of any problems in calorimetry. Despite these uncertainties, the data are very useful in evaluating the equilibria below.
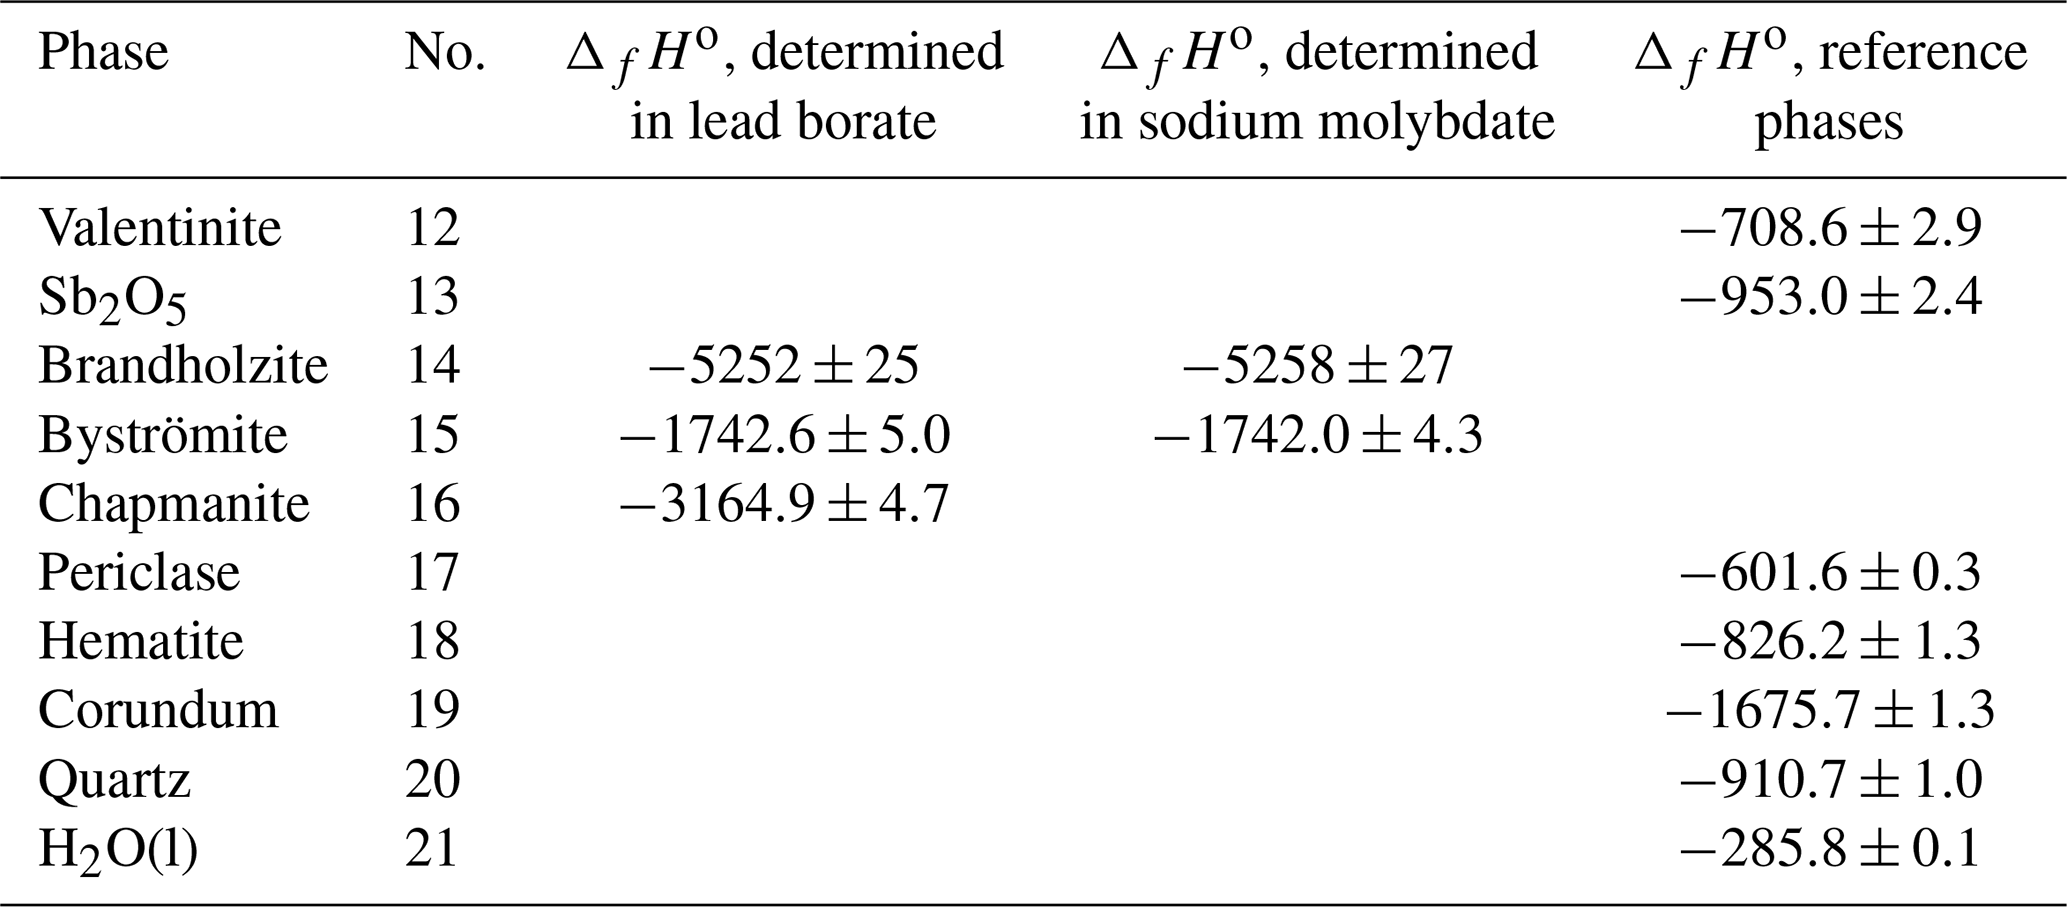
Table 5Summary of the enthalpies of formation for the reference phases and the enthalpies of formation calculated from the calorimetric data in lead borate or sodium molybdate in this work. “No.” is the reaction number of the reactions in Table 3. All data are in kJ mol−1. Enthalpies of formation for reference phases from Robie and Hemingway (1995), with the exception of the datum for Sb2O5 (data from this work and Abramchuk et al., 2020).
5.3 Thermodynamics of MgSb2O6 (byströmite)
The drop solution enthalpy of byströmite was measured in the two molten oxide solvents, and the enthalpy of formation from oxides and elements was calculated via a thermochemical cycle, using reactions in Table 3 and their respective enthalpies (Table 4). The cycle can be expressed by the equation
The standard entropy, calculated from the low-temperature heat capacity (Fig. 2b), is 139.3±1.0 J mol−1 K−1. DSC data were measured between 280 and 560 K. In the region of overlap, the DSC data are 1.3 % lower than the PPMS data. The DSC data were shifted to match the PPMS data and then fitted to a Maier–Kelley polynomial. The results are listed in Table 6.
Table 6Coefficients for the Maier–Kelley heat-capacity polynomial for byströmite and chapmanite.

5.4 Chapmanite: sample characterization
A full-profile refinement of the powder XRD data (Fig. 3a) quantified the fractions of minerals in the sample. This analysis gave 85.2 % chapmanite, 9.9 % quartz, and 4.9 % calcite. Small crystals of pyrite, visible during the separation of the fine fraction, were not captured by this analysis. Inspection of the sample in a scanning electron microscope did not reveal the presence of any other crystalline phases or grains which could be suspected to be amorphous. It has to be noted, however, that the carbonates were also not seen and are suspected to form microcrystalline coatings on the sheet silicates. Chapmanite forms book-like aggregates of platy crystals (Fig. 3b). Tiny (less than a few micrometers) hexahedral crystals used to be pyrite. In the EDX analyses, they gave strong Fe and S but also O signal, suggesting that they are pseudomorphs of iron oxides with sulfate after pyrite. This observation agrees with the fact that pyrite was not captured by PXRD. It is not clear if pyrite weathered naturally or during the initial sample handling. Quartz occurred as larger grains with typical conchoidal fracture.

Figure 3(a) Powder X-ray diffraction pattern of the chapmanite sample after the first treatment step. All peaks belong to chapmanite, with the exception of two small peaks that are assigned to quartz (Q) and calcite (C). (b) Secondary-electron image of this chapmanite sample, showing the small book-like aggregates of chapmanite but also small fragments of quartz (Q) and pseudomorphs of iron oxides after pyrite (P) with the cubic morphology.
This sample was subjected to electron microprobe analyses. The analyses were done on flakes of the chapmanite sample obtained by the first fine-fraction separation as polishing of this sample turned out to be impossible. These flakes provide a relatively, but not perfectly, flat surface and are porous, thus diminishing the quality of the analyses. Hence, these results can be considered only as semiquantitative. They are scattered – for example CaO averages at 1.3 wt % with a standard deviation of 0.5 wt % (n=30), and MgO is 1.0 ± 0.6 wt %. These results agree well with the fraction of carbonate refined from the PXRD data. The SO3 signal is ubiquitous, giving 3.7 ± 4.3 wt %. It agrees with the supposition that pyrite in the sample weathered to X-ray amorphous iron oxides (perhaps schwertmannite) with elevated sulfur content. The P2O5 concentration of 2.0 ± 0.4 wt % is attributable to the previous treatment with sodium hexametaphosphate. The only impurity that can be assigned to chapmanite is Al2O3, with 1.4 ± 1.3 wt %.
Obviously, calorimetric results from such a sample would be difficult to interpret. Therefore, the sample underwent several cycles of cleaning. The powder was re-dispersed three times in 5 % HCl overnight and then rinsed, filtered, and dried. Furthermore, a finer fraction of the sample was obtained by re-dispersing the sample, using the same procedure as described in the methods section but allowing it to sediment for 48 h, thus eliminating the larger quartz grains. After this procedure, the sample was rinsed extensively in an attempt to remove the phosphate.
Quartz and carbonates were removed from the sample, as evidenced by the PXRD data after the treatment. We recognized that not all phosphate was removed, and this impurity is not easy to correct for. There remained 0.4 wt % P2O5 and 0.2 wt % SO3 in the sample (recalculated ICP-MS data after the total digestion). Experience with high-temperature oxide melt calorimetry shows, however, that impurities under 1 % can generally be neglected if there is no way to correct for them. This is true if the contribution of such impurities to the measured heat effect is likely to be within the experimental error of the measurement and as long as their heat effects are comparable to that of the major phase. This is the case for P2O5 and SO3. Pyrite, on the other hand, would be an example of an impurity with much different, in this case much higher, signal. Our analyses showed that pyrite was not present, either in the initial or purified sample. The molar Al (Al + Fe) ratio of 0.06 was considered in the chemical formula used for calorimetric calculations. The molar Sb (Al + Fe) ratio was 0.98, which is slightly less than 1 but within the uncertainty of the analysis. A slight Sb deficiency in chapmanite was also detected by Zhukhlistov and Zvyagin (1977). They assumed that some of the vacant octahedra were occupied by Fe although there was no evidence of Fe2+ in the sample that could support such an assumption. The method selected (ICP-MS) is considered to be more accurate and precise than the electron microprobe analysis, but the downside is that Si is partially volatilized during the digestion as SiF4. Hence, Si cannot be determined, and the complete stoichiometry cannot be fixed. The formula constructed for the reduction of the calorimetric data is (Fe1.88Al0.12)Sb(Si2O5)O3(OH), with molecular mass of 431.1537 g mol−1. All thermodynamic data presented in this work refer to this formula and molecular mass.
The sample contained adsorbed water that manifested itself strongly during the DSC measurements. During the dynamic DSC measurement, the endothermic signal from the adsorbed H2O (at its peak at T≈620 K) exceeded the intrinsic heat capacity of the sample by ≈ 70 %. To remove the adsorbed H2O prior to the calorimetric experiments, the sample was treated statically (i.e., not under continuously increasing temperature) at 470 K for 3 min and cooled. The loss of structurally bound H2O begins at 620 K and continues to 900 K, when it is interrupted in the data by a mass gain. This mass gain is probably related to oxidation of Sb. The nature of high-temperature products was not investigated. The PXRD data indicated no structural changes in chapmanite after the thermal treatment at 470 K.
In addition, the purification led to preferential enrichment of the sample in smaller particles. Small particle size could also influence thermodynamic properties. It would be desirable, in the future, to repeat the calorimetric experiments on a synthetic, pure sample of chapmanite. However, synthesis protocols for such a phase are unknown at this time. Despite these complexities, we believe that our results are an accurate representation of the thermodynamic properties of this phase.
5.5 Thermodynamic properties of chapmanite, (Fe1.88Al0.12)Sb(Si2O5)O3(OH)
From the two solvents commonly used for high-temperature oxide melt solution calorimetry (see Navrotsky, 2014), lead borate is the only option for the calorimetry on chapmanite. This restriction is caused by its ability to dissolve silicates, in contrast to sodium molybdate. For this reason, we have cross-checked the two solvents and established that lead borate is a suitable solvent for calorimetry of antimonous and antimonic compounds.
The drop solution enthalpy of chapmanite was measured in lead borate, and the enthalpy of formation from elements and oxides was calculated via a thermochemical cycle, using reactions in Table 3 and their respective enthalpies (Table 4). The cycle can be expressed by the equation
The enthalpy of formation from oxides, for the reaction
is kJ mol−1.
Heat capacity of chapmanite was measured at sub- and superambient conditions. The low-temperature Cp data show a pronounced but broad anomaly centered at T=10.7 K (Fig. 4). Integration of the low-temperature Cp data gave J mol−1 K−1. Combination of the enthalpy of formation and entropy gave kJ mol−1 and kJ mol−1 with the corresponding log K25=6.06. The DSC data were shifted to match the PPMS data and fitted by a Maier–Kelley polynomial (Table 6).
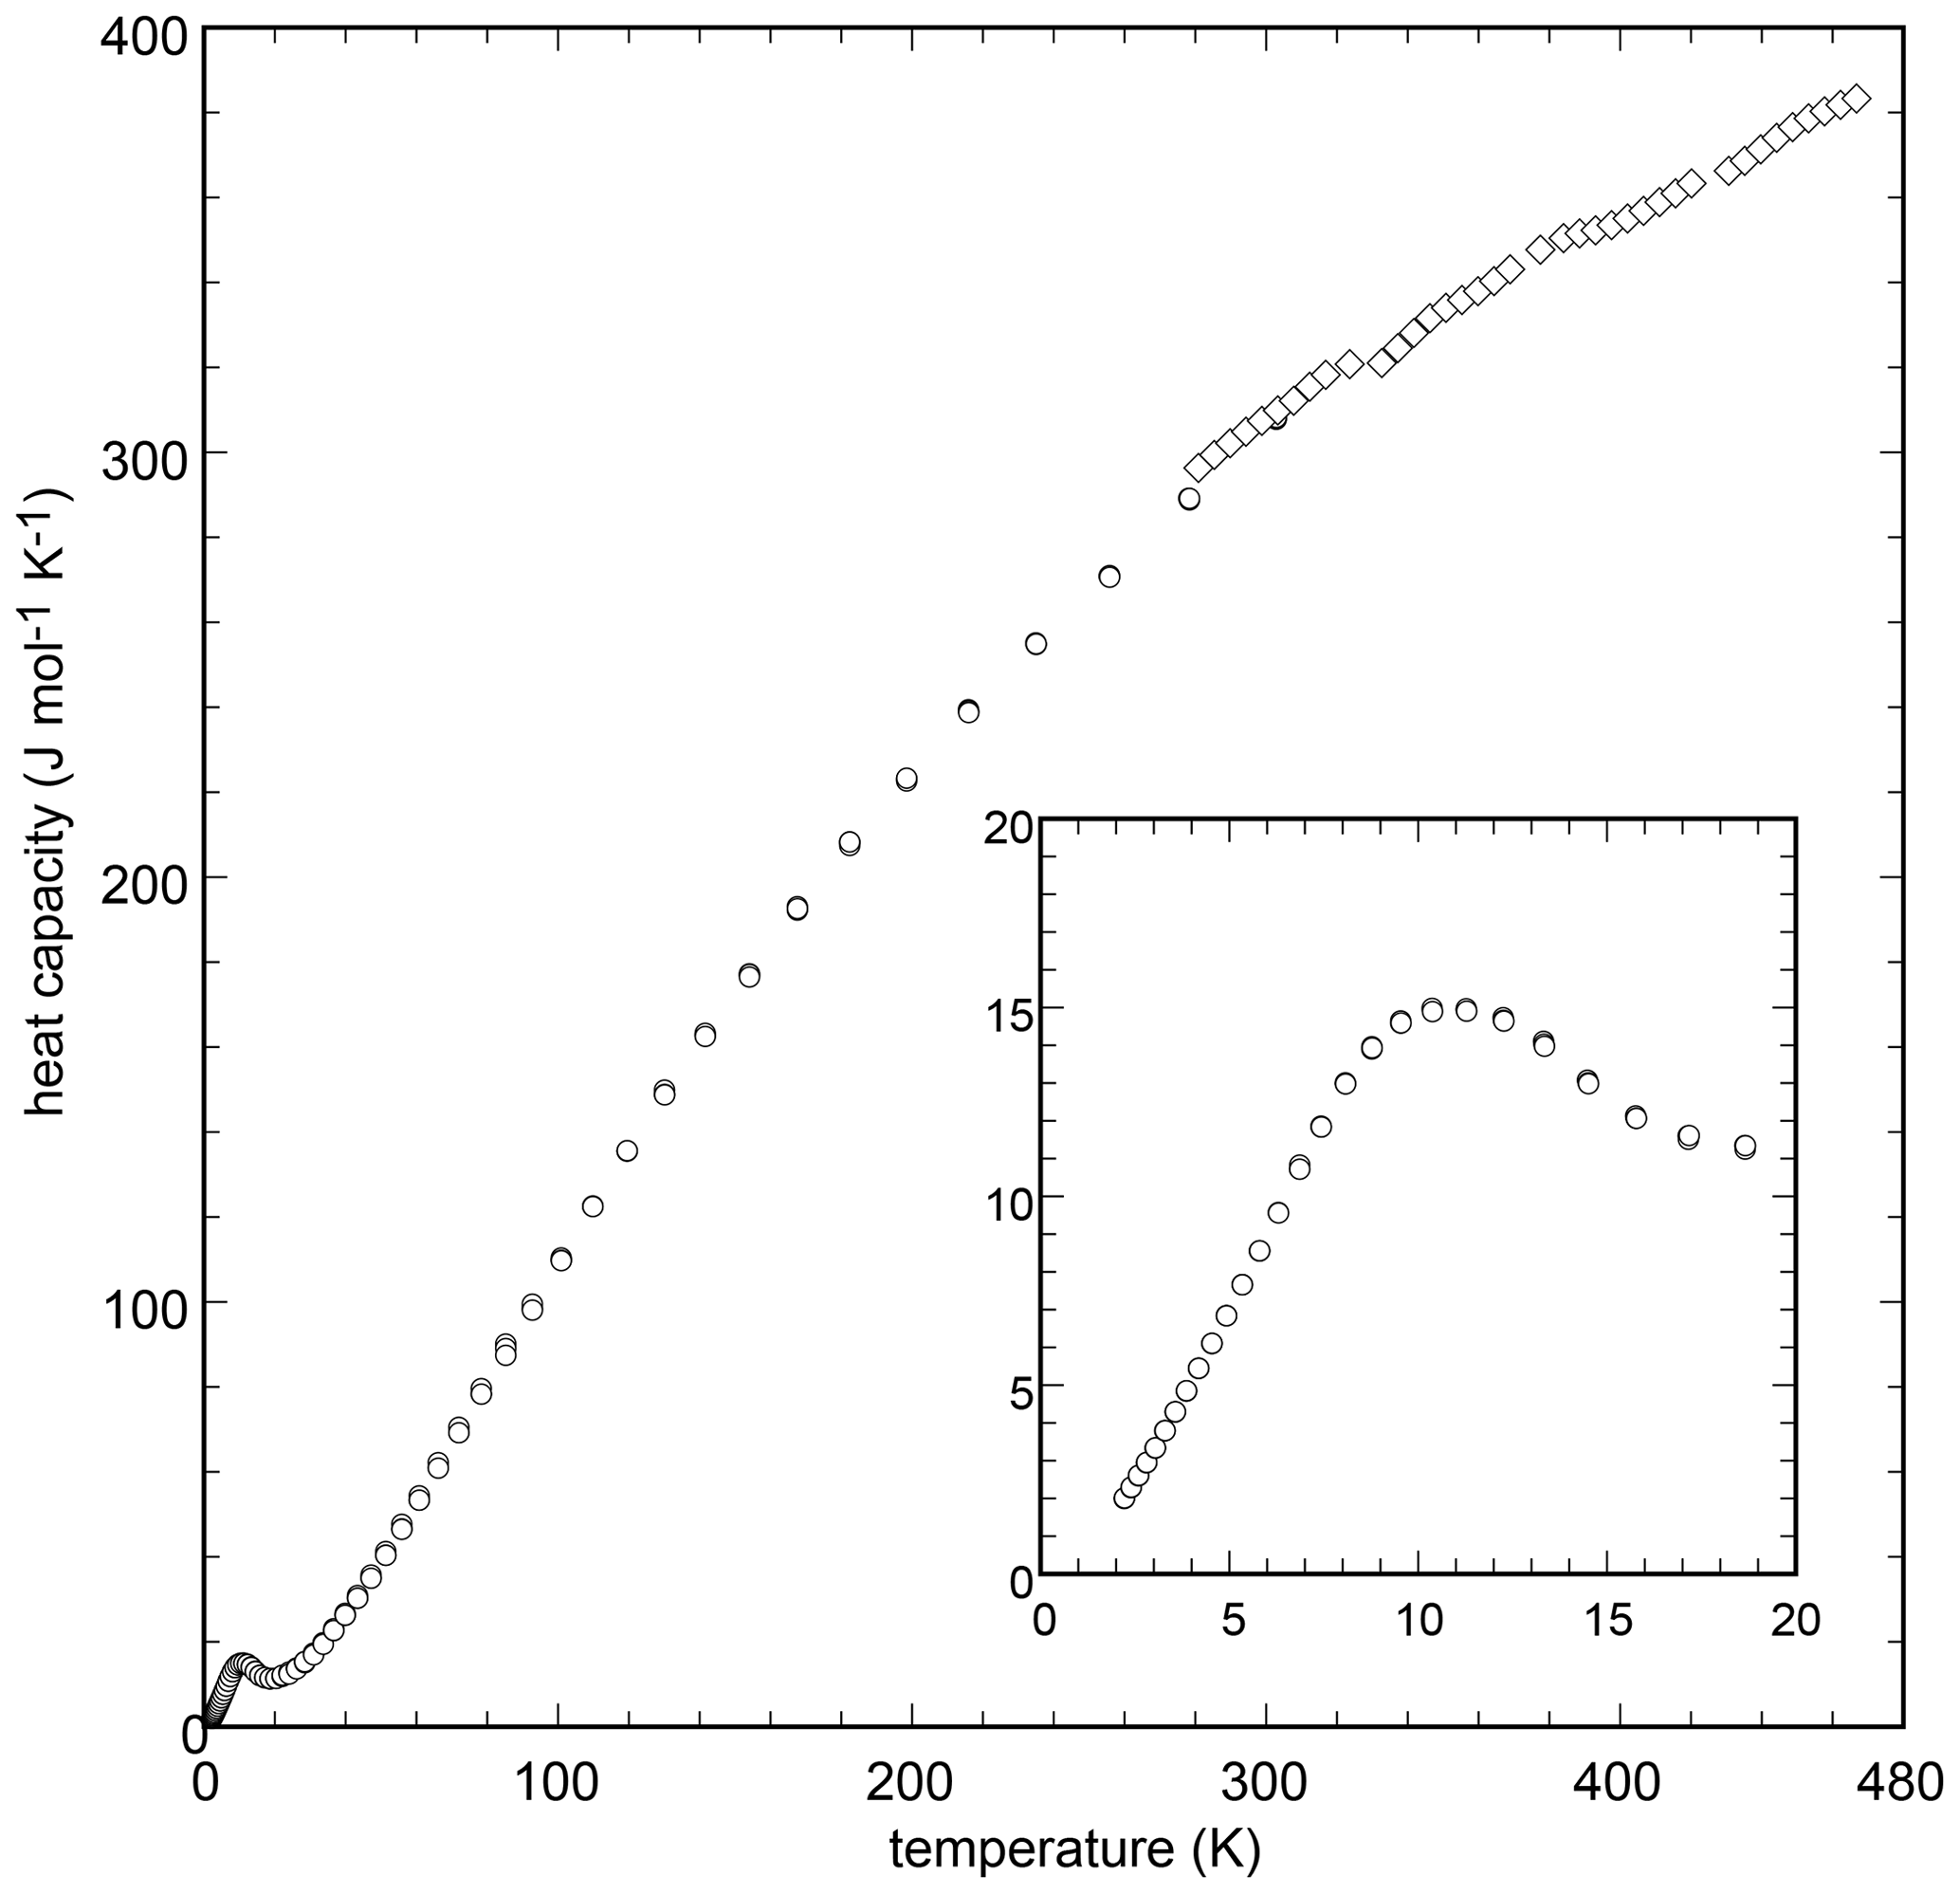
Figure 4Low-temperature (circles) and high-temperature (diamonds) heat capacity of chapmanite, measured by the PPMS and DSC instruments, respectively. The inset shows the Cp anomaly at very low temperatures.
Combining Eq. (25) with dissolution reactions for hematite, corundum, valentinite, and quartz defines the dissolution reaction for chapmanite:
with log . This value can be used for geochemical modeling with software packages such as PHREEQC or Geochemist's Workbench.
6.1 Consistency of the formation enthalpies of antimony oxides
An initial check of the calorimetric data is the comparison of the enthalpies for a reaction that relates all three antimony oxides:
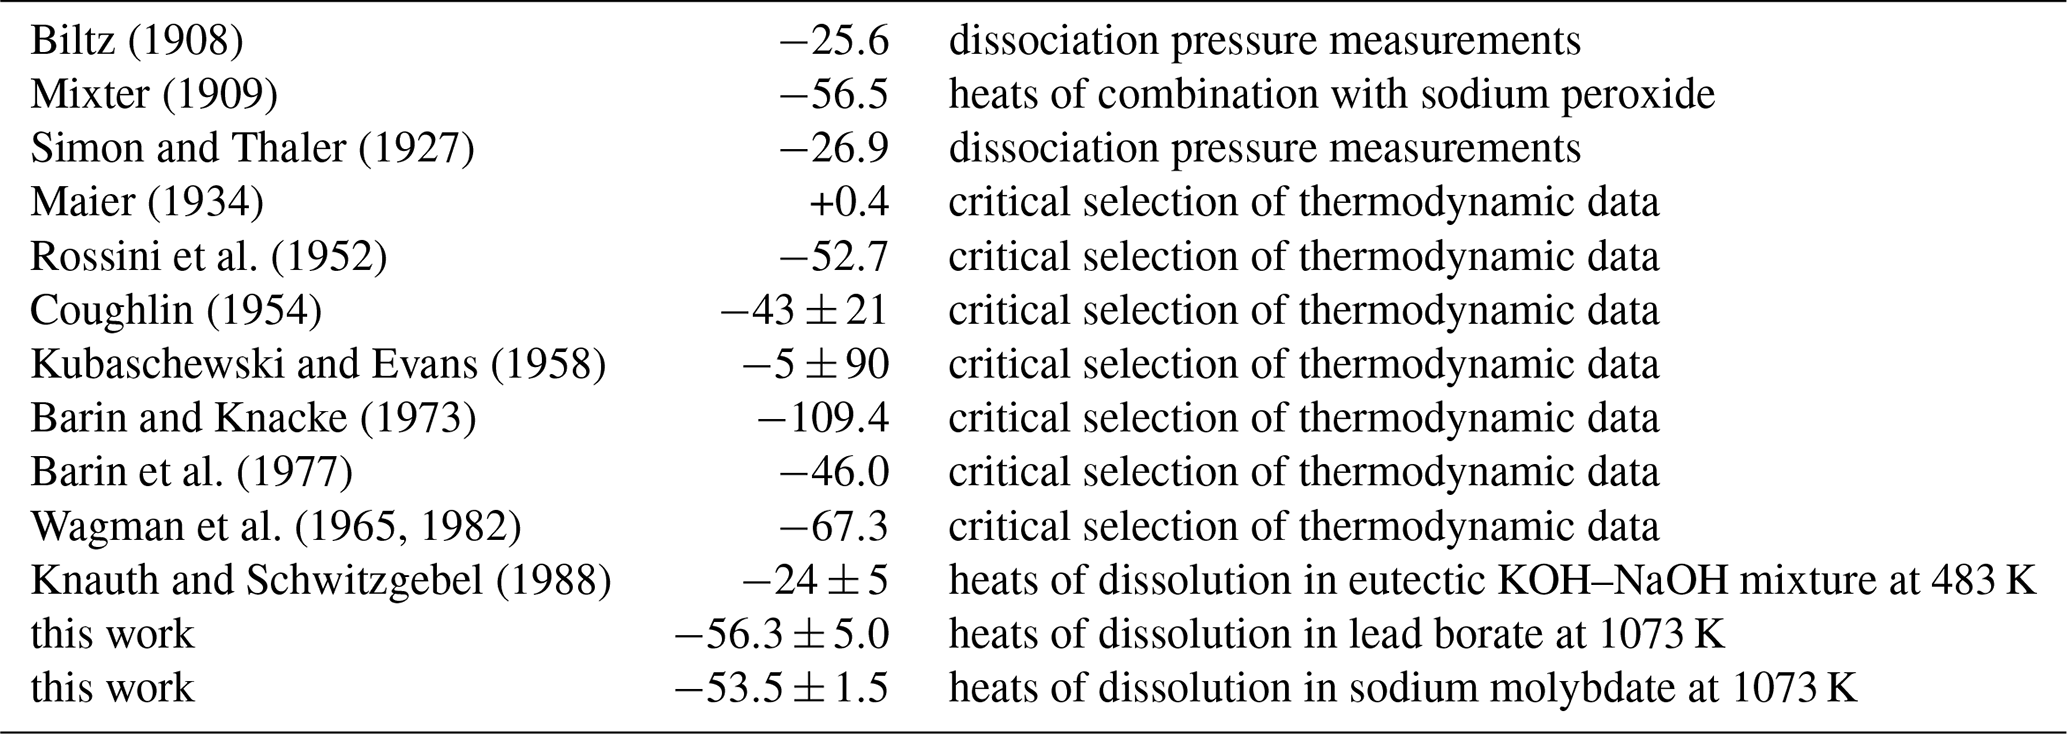
A cursory examination of the values in Table 7 shows that the enthalpies for Eq. (27) are scattered and inconsistent. Early data from dissociation pressure measurements (Biltz, 1908; Simon and Thaler, 1927) agree with the newer calorimetric work of Knauth and Schwitzgebel (1988). Our data form another cluster of values with the reaction calorimetry of Mixter (1909) and the critical selection of Rossini et al. (1952). The enthalpies for Eq. (27) span a range of 110 kJ mol−1, which makes critical comparison of our and earlier data complicated.
Biltz (1908)Mixter (1909)Simon and Thaler (1927)Maier (1934)Rossini et al. (1952)Coughlin (1954)Kubaschewski and Evans (1958)Barin and Knacke (1973)Barin et al. (1977)Wagman et al. (1965, 1982)Knauth and Schwitzgebel (1988)Table 7Enthalpies for reaction 0.5Sb2O3 (valentinite) + 0.5Sb2O5 → Sb2O4 (Eq. 27) at T=298.15 K. All data are in kJ mol−1.
The data agreement is even worse for the reaction
as shown in Fig. 5. The values calculated from reported data scatter almost over 150 kJ mol−1 and document the difficulties of measurements on antimony oxides. These compounds are sensitive to heat treatment and oxygen fugacity and are hard to control. This trouble was noted early on, for example by J. J. Berzelius who wrote in 1812 that “I have never worked with a material with which it was so extremely difficult to obtain constant results”, referring to his work on antimony oxides (Cooke, 1877). Obviously, much of this trouble has persisted until today.

Figure 5Enthalpies of reactions that relate the antimony oxides with different oxidation state of antimony. The data are summarized in Table 7.
When considering the enthalpies of formation of the antimony oxides, the most striking is the scatter for Sb2O5. Glushko et al. (1972) gave kJ mol−1, and Nekrasov (2009, p. 151) reported −1007.51 kJ mol−1, but Gribchenkova et al. (2009) presented a much different value of kJ mol−1, to name a few. Recently, Abramchuk et al. (2020) determined the enthalpy of the drop solution for metallic Sb. They also derived the enthalpy of formation of Sb2O5 to be kJ mol−1, but we improved this value by using a better characterized Sb2O5 sample. Combining our calorimetric data for Sb2O5 and the data of Abramchuk et al. (2020) for Sb, we obtain kJ mol−1. With this ΔfHo value for Sb2O5, our data for the Mg-Sb phases (brandholzite and byströmite) are reasonably close to what would be expected from solubility data (see Table 8).
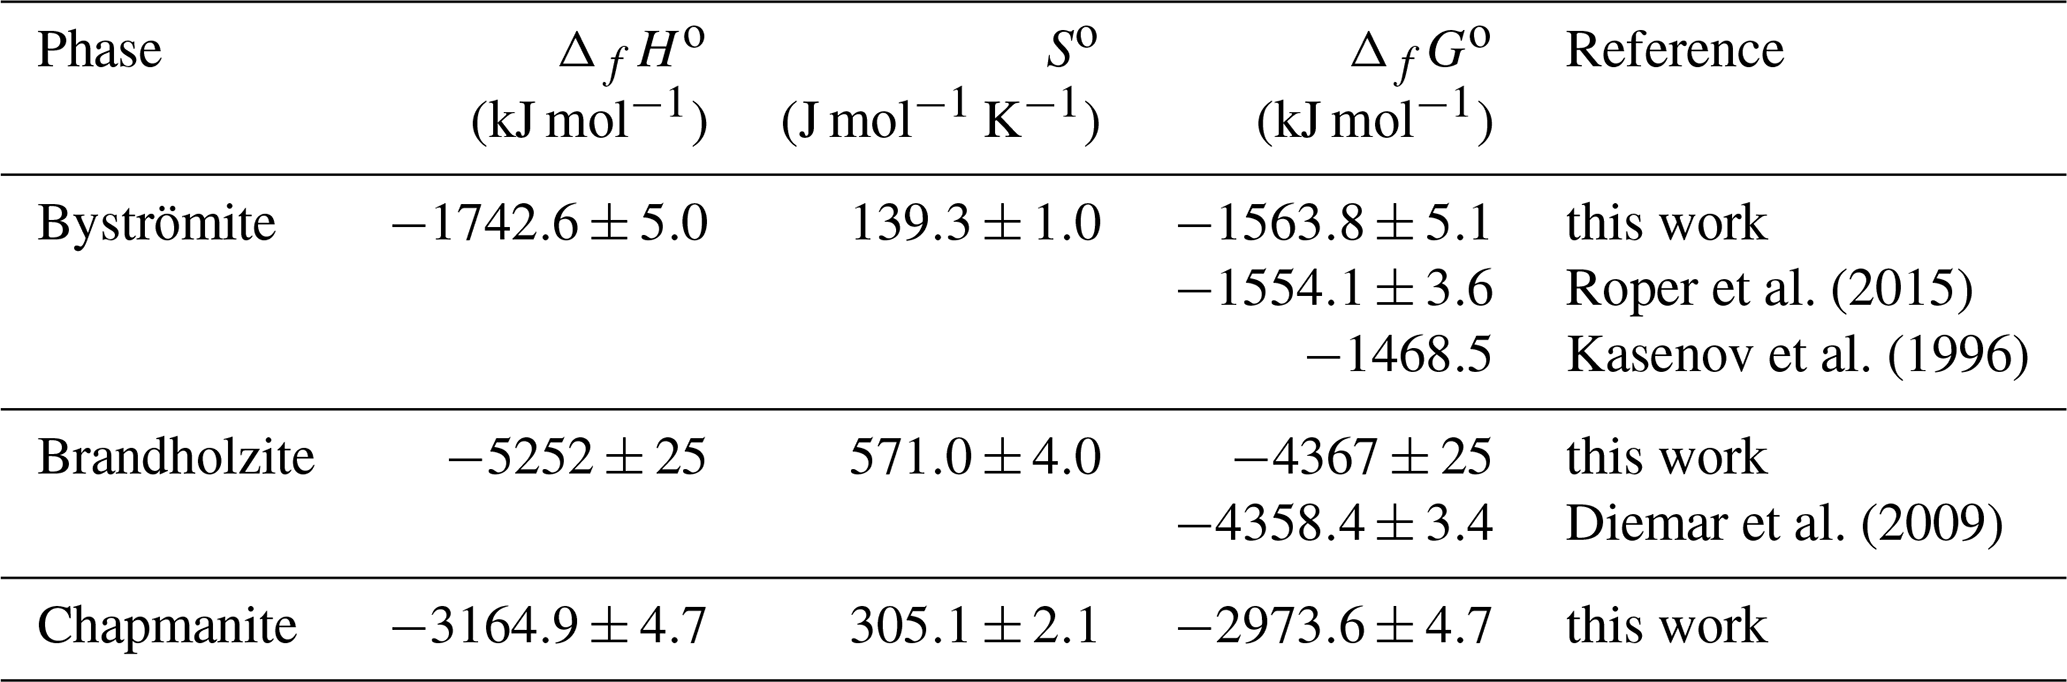
Roper et al. (2015)Kasenov et al. (1996)Diemar et al. (2009)Table 8Summary of thermodynamic data from this work, compared to previously published data.
The data for Sb2O3 are much less scattered, even though not every publication specified if the data relate to valentinite or senarmontite. Glushko et al. (1972) gave kJ mol−1, Nekrasov (2009, p. 151) gave −709.44 kJ mol−1, Robie and Hemingway (1995) selected kJ mol−1. A recent EMF study gave −709.74 kJ mol−1 (Aspiala et al., 2014) and showed that most available values in the literature cluster tightly between −708 and −710 kJ mol−1.
The available data show extreme discrepancies for Sb2O5. It could be suspected that one of the reasons for the inconsistency is the poorly defined oxidation state in the “Sb2O5” samples. Why otherwise would efforts to produce pure sample involve syntheses under high O2(g) pressure (Schwarzmann et al., 1977)? It was noted that “antimonic acid cannot be dehydrated by heating in air to give products of constant and reproducible weight without simultaneous reduction of some of the SbV to SbIII” (Stewart et al., 1972). The nature of the Sb2O5 used in various studies is therefore questionable, but this issue is beyond the scope of this study.
The situation regarding valentinite is much more favorable, and this phase can serve as a good reference compound for the calorimetry on Sb3+ phases. For further work, we adopt the datum from Robie and Hemingway (1995) that lies approximately in the middle of the tight cluster of values.
6.2 Consistency among the magnesium antimonates: byströmite and brandholzite
The agreement between our calorimetric data and published solubility data (Diemar et al., 2009; Roper et al., 2015) is less than optimal, although differences of similar magnitude are encountered in many systems. The values are summarized for easier comparison in Table 8. Yet, we can circumvent the need for reference compounds in the solution calorimetry and make a direct comparison. Consider the reaction
The value, calculated from the solubility data (Diemar et al., 2009; Roper et al., 2015), is 41.4±5.1 kJ mol−1. The calorimetric data from this study give kJ mol−1. The large error relates mostly to the calorimetric datum of brandholzite (Table 4, ±22.0 kJ mol−1) that was already discussed. The agreement between the two ΔG values is excellent. This agreement reinforces the suspicion that the primary source of the differences is the data for Sb2O5, even though the latest ΔfHo value for Sb2O5 (our data and Abramchuk et al., 2020) yields fairly good results. Hence, a compound like MgSb2O6 would possibly be a better reference compound for solution calorimetry of Sb5+ phases.
Using the solubility data of Diemar et al. (2009) and Roper et al. (2015), combined with the entropies determined in this work, we propose a set of consistent thermodynamic functions for byströmite and brandholzite. They are listed in Table 9.
Table 9Proposed best set of thermodynamic functions for brandholzite and byströmite at T=298.15 K.
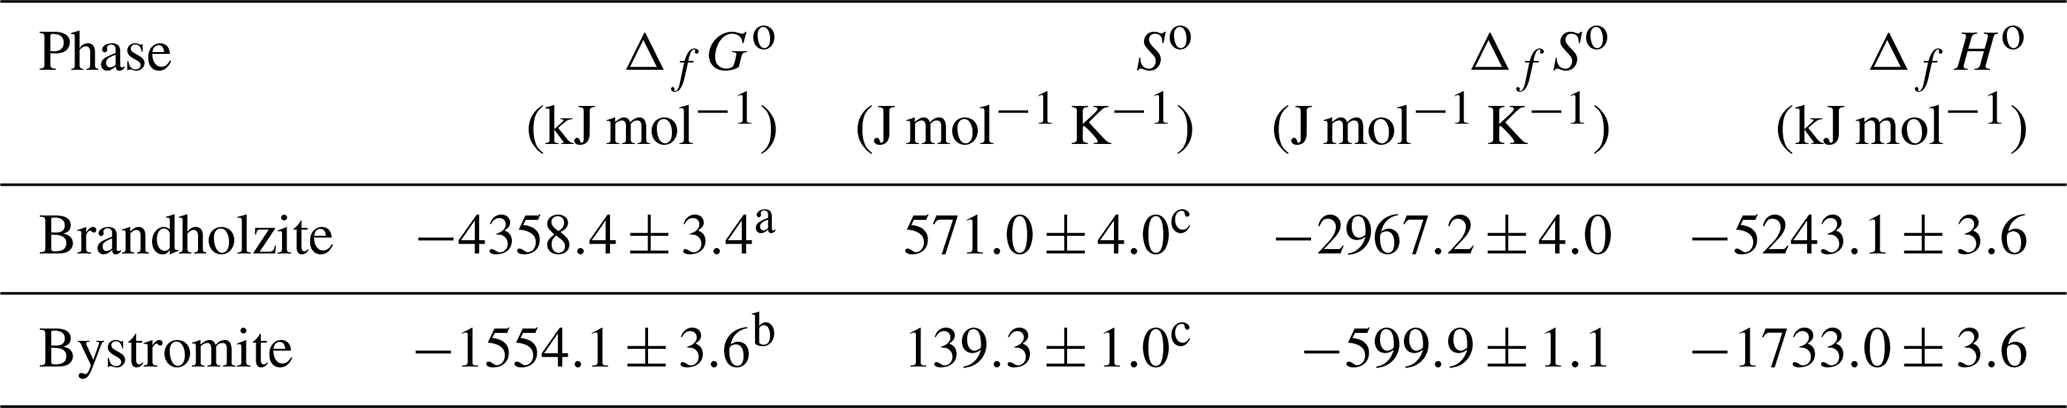
a Diemar et al. (2009); b Roper et al. (2015); c this work.
6.3 Assemblages and origin of chapmanite
In this and previous studies (e.g., Ballirano et al., 1998), chapmanite was consistently found to be associated with carbonates, mostly calcite or dolomite. Sulfides in the association of chapmanite were noted, for example small pyrite crystals (this work) or marcasite (Bräunsdorf, Germany, Milton et al., 1958). In the Keeley mine (Ontario, Canada), chapmanite is intergrown with native silver (Walker, 1924). In Pezinok (Slovakia), chapmanite was found to be associated with secondary siderite, cryptocrystalline SiO2 (hyalite), and allophane-like material (Polák, 1988). In both Pezinok and La Bessade (France) (Périchaud and Pierrot, 1965), chapmanite was identified in the deeper parts of the veins, partially forming pseudomorphs after stibnite. At La Bessade, chapmanite was intergrown with opaline silica, forming compact aggregates with conchoidal fracture. The association with quartz or chalcedony was described as a characteristic feature by Milton et al. (1958).
These assemblages bear information about the formation conditions of chapmanite. The common association with carbonates suggests that chapmanite cannot be related to acidic solutions related to oxidative weathering of pyrite. The presence of pyrite, marcasite, or siderite indicates reducing conditions. The carbonates, for example calcite or dolomite detected in this work or by Ballirano et al. (1998), could form later than chapmanite, thus invalidating the assumption that acidic conditions are excluded. On the other hand, siderite found with chapmanite at Pezinok (Polák, 1988) seems to be co-genetic and indicates indeed neutral or alkaline conditions. Chapmanite from Argent mine (South Africa, Verryn and Meulenbeeld, 2000) was reported to occur on siderite, but no details about this association were provided. Opaline silica, reported from several localities, suggests that the fluids were transporting greater amounts of silicic acid. Hence, chapmanite could be a product of supergene processes, as suggested by Pauliš et al. (2019), but in deeper, reduced portions of the ore bodies.
6.4 Stability and solubility of chapmanite
The thermodynamic data presented here allow one to model the stability of chapmanite quantitatively. There are two insoluble, competing sinks for antimony in low-temperature settings: schafarzikite and tripuhyite (Leverett et al., 2012). The question is therefore the relationship between these phases. Figure 6 presents the results of a forward simulation with PHREEQC. In this model, a Ca-Mg-SO4 solution (for its composition, see supporting electronic information) with pH = 5.7 was equilibrated with chapmanite under different redox conditions. They were imposed on the solution by simply varying the input value of pϵ. The starting solution had no Fe, Sb, Al, or Si. After equilibration, pH increased slightly but not more than 0.2 log units. The model shows that under low-pϵ conditions the saturation index of schafarzikite is almost always higher than 0, and this phase could precipitate. Under oxidizing conditions, tripuhyite is predicted to precipitate in a similar manner. There is not even a small window of pϵ conditions under which both competing phases would be undersaturated. It must be pointed out that tripuhyite, and likely also schafarzikite, possess dense structures whose formation from low-temperature fluids is kinetically inhibited (Majzlan et al., 2016). Therefore, rapid transformation of chapmanite to schafarzikite or tripuhyite should not be expected.
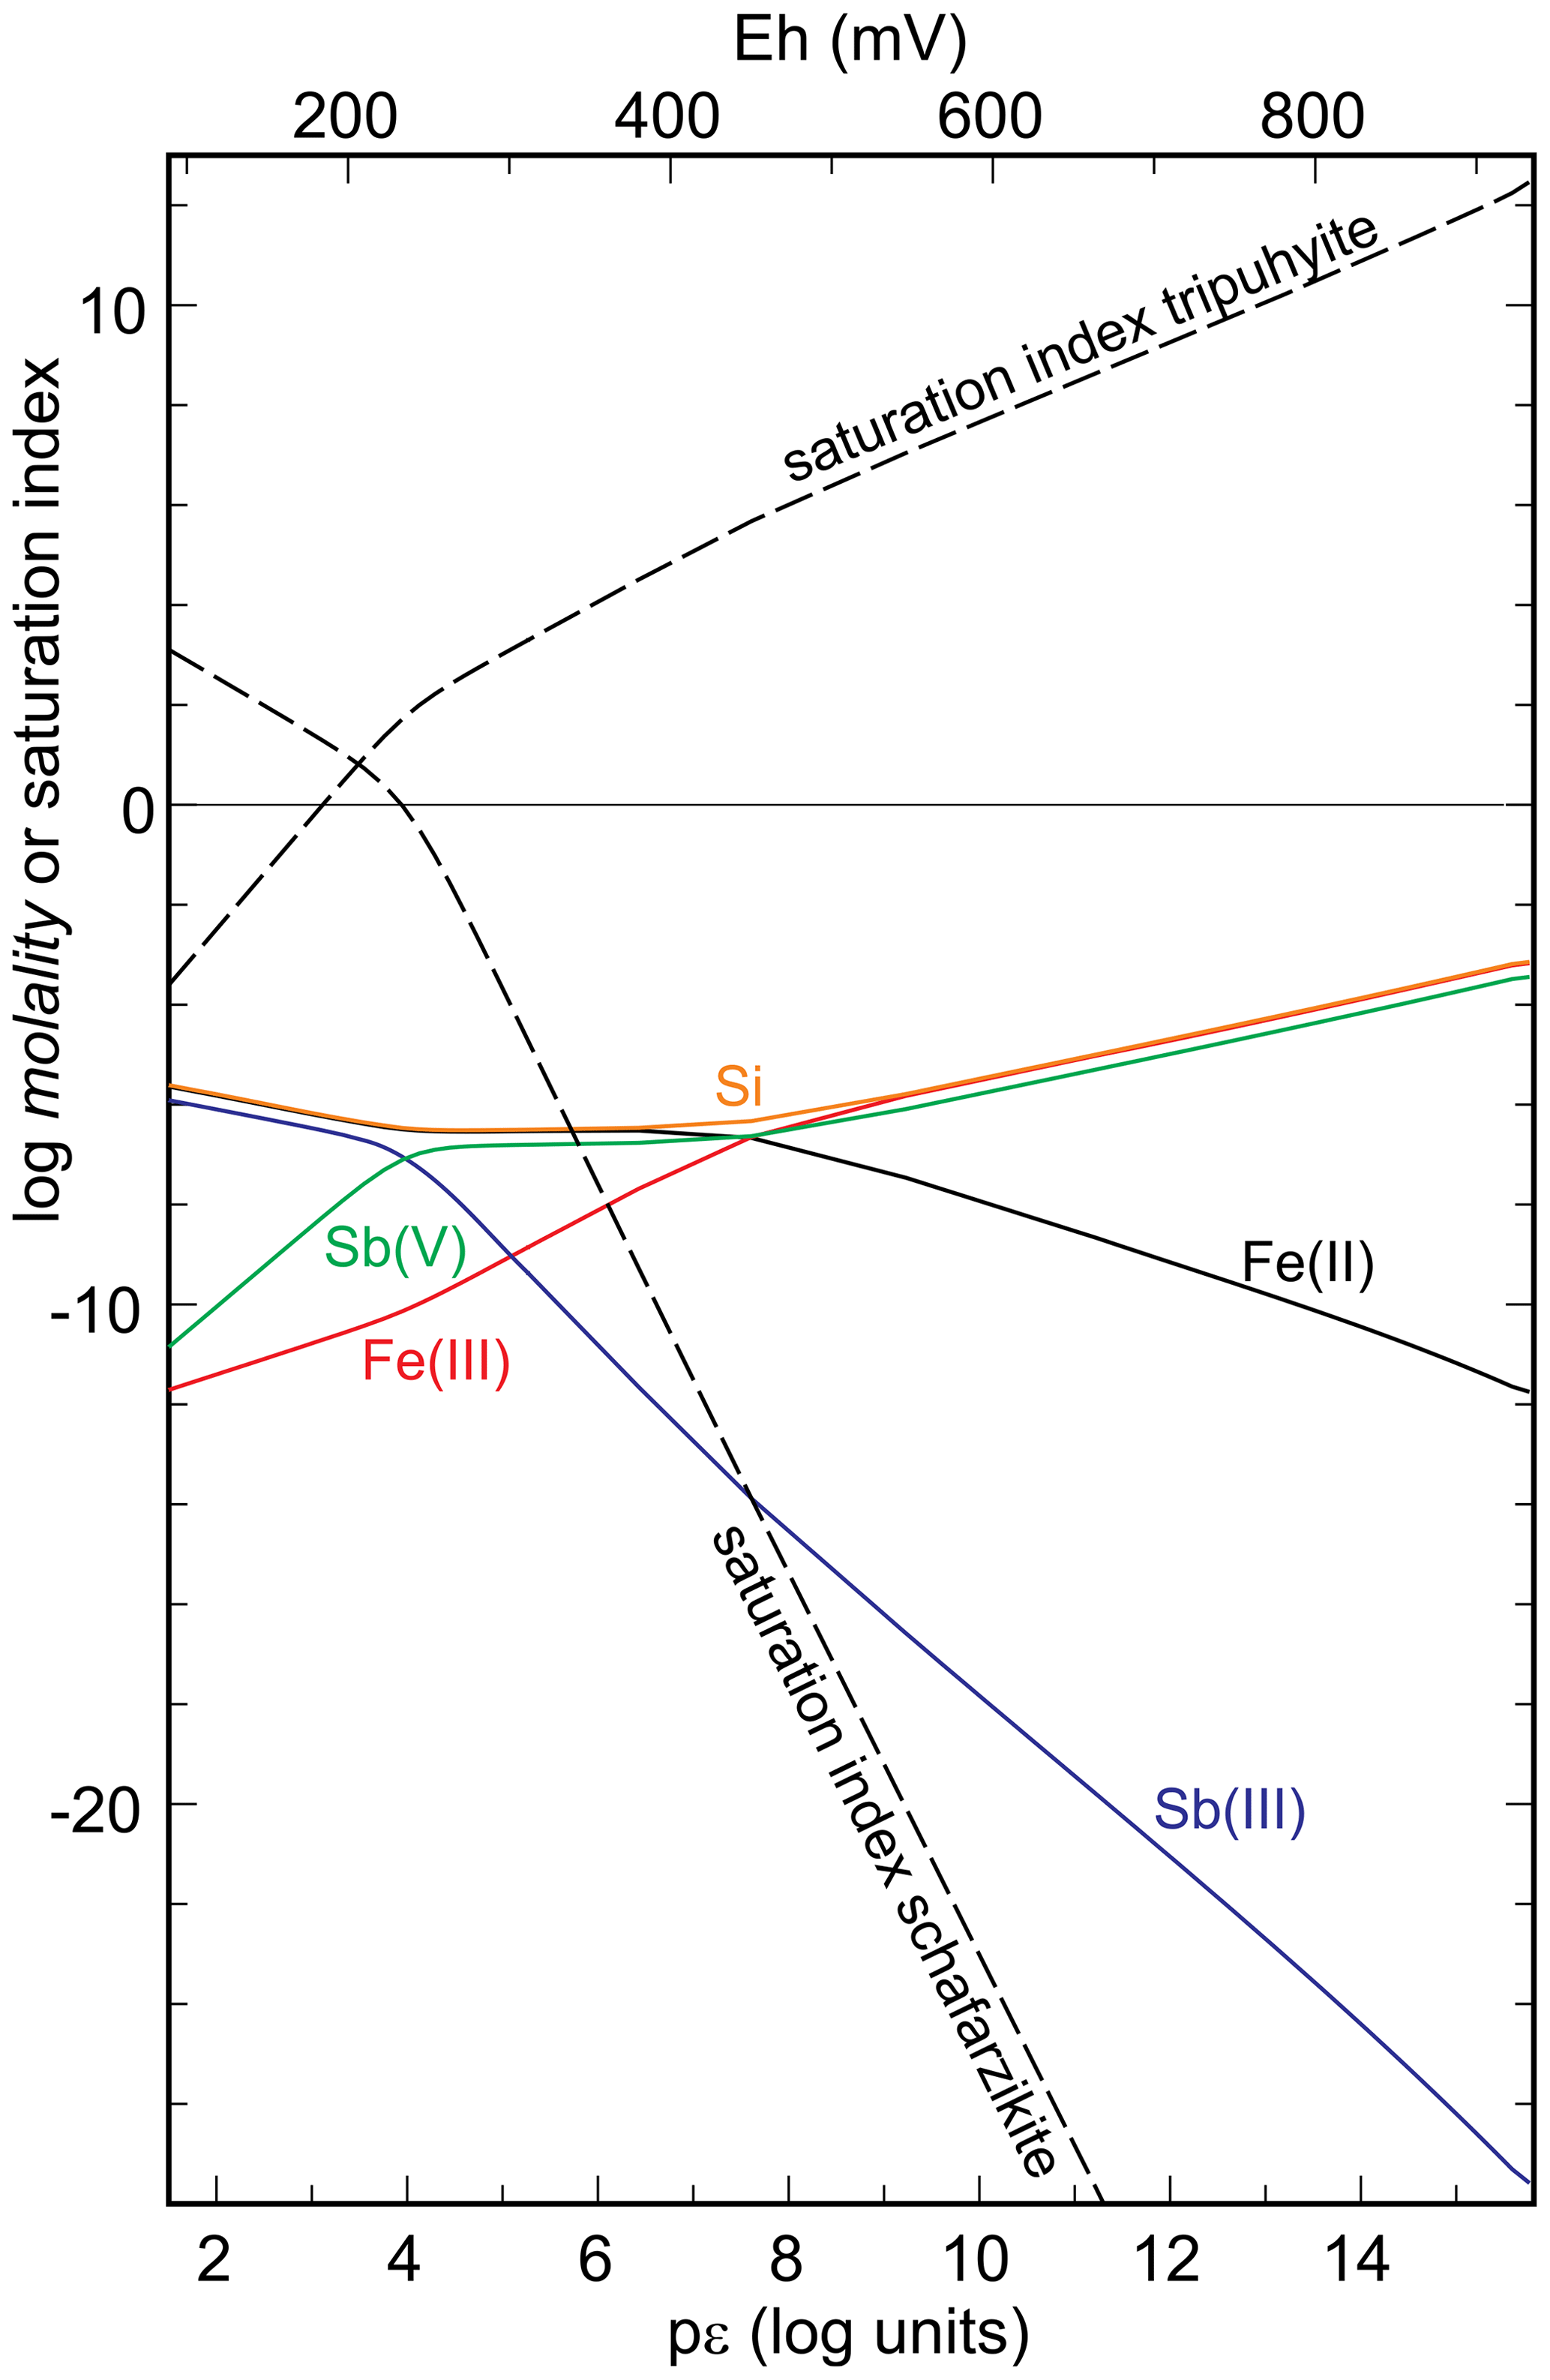
Figure 6Graphical summary of the results of a forward simulation. A Ca-Mg-SO4 solution with pH = 5.7 was equilibrated with chapmanite under variable redox (pϵ) conditions. Shown are the molalities of the aqueous species and saturation indices of schafarzikite and tripuhyite. For details, see text.
What are then the conditions conducive for the formation of chapmanite? Its association with opaline silica suggests elevated activity of SiO2(aq), which would stabilize and favor chapmanite over schafarzikite or tripuhyite, at least under some redox conditions.
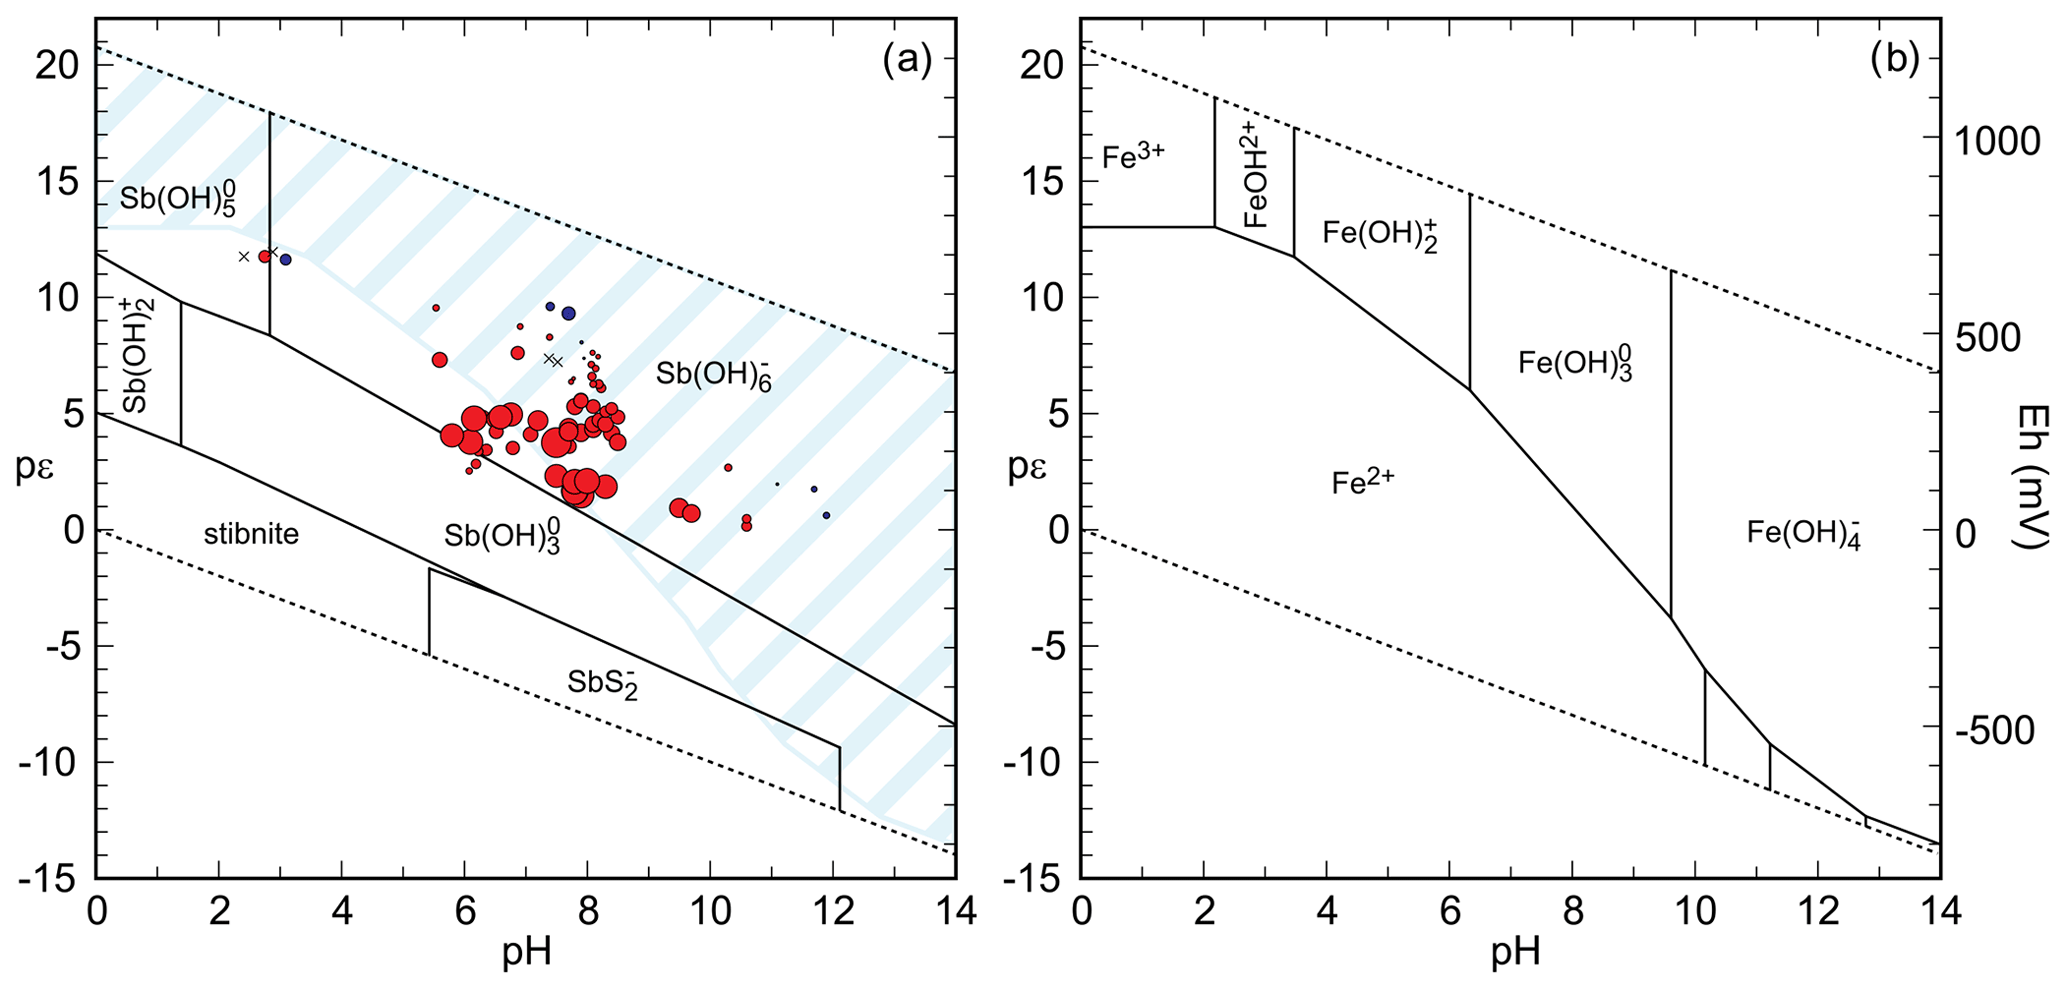
Figure 7(a) pH–pϵ diagram for the system Sb-O-S-H with the predominance field of aqueous species and the stability field of stibnite. Data from Filella and May (2003). In this diagram, , . The symbols show the saturation of mine drainage solutions with respect to chapmanite and are scaled to the magnitude of the saturation indices. Red circles – supersaturated; blue circles – undersaturated; crosses – solutions so close to saturation that the corresponding circles would be invisible. The light blue hatched area is the predominance field of Fe(III) species (), with the corresponding full pH–pϵ diagram shown in panel (b).
It is interesting to examine mine drainage solutions in terms of the saturation state with respect to chapmanite. From a database of mine drainage solutions that we amassed over years, we selected the analyses where Eh was analytically determined (by oxidation–reduction potential measurement in the field or Fe2+ Fe3+ determination in the laboratory). The results (Fig. 7) show that most of the examined solutions are supersaturated with respect to chapmanite. This observation is in conflict with the reports that chapmanite is such a rare mineral. Yet, unless specifically looked for, chapmanite would escape attention because it would fall into the group of 1 : 1 sheet silicates (like kaolinite) that are commonly found but not often investigated in detail.
Precipitation of chapmanite is likely also kinetically inhibited, as for many sheet silicates at low temperatures. Formation of Fe-rich sheet silicates at low temperatures is possible through aging of hydroxide-silica amorphous precursors (e.g., Harder, 1976), adding to the group of minerals that form from gel-like precursors (see Majzlan, 2020). This notion fits very well with the observation of amorphous silica in association with chapmanite.
Is chapmanite a sink of antimony in the environment? The neoformation of chapmanite is limited to a specific environment and is probably kinetically hindered. It requires an Sb-rich, disordered precursor and persistence of conditions that stabilize both Fe3+ and Sb3+ over longer times. Thermodynamic data suggest that chapmanite is finely balanced in its stability with tripuhyite and schafarzikite under a narrow range of conditions when ferric (Fe3+) and antimonous (Sb3+) species predominate.
On the other hand, Sb3+ can be adsorbed onto Fe-rich sheet silicates in a similar fashion as in chapmanite. This process can continue up to the formation of a monolayer of chapmanite-like arrangement but operates only on the outer surfaces of the sheet-silicate particles. Hence, chapmanite itself is rare, but chapmanite-like arrangements can be common. Identical arrangement in sheet silicates is observed for Bi3+ in bismutoferrite (Milton et al., 1958; Zhukhlistov and Zvyagin, 1977; Środek et al., 2019). Similar position was observed for As3+ in the structures of Mn-dominated sheet silicates schallerite and nelenite (e.g., Kato and Watanabe, 1991).
The attachment of Sb3+ to the dioctahedral sheets in chapmanite can be described as a tridentate-hexanuclear complex on a local scale. Such complexes have been detected for As3+ on the surface of iron oxides such as maghemite (Auffan et al., 2008) or magnetite (Liu et al., 2015). On the other hand, Ilgen and Trainor (2012) found mostly bidentate Sb3+ complexes on the reactive edges of kaolinite and nontronite particles. It has to be noted that the duration of these experiments was only short, thus representing only the initial, short-term interactions. They also found evidence for polynuclear clusters, interpreted as incipient surface precipitation. In river sediments, Sb is associated mostly with Fe and Al substances (Brannon and Patrick, 1985), confirmed by experimental studies of Sb3+ removal from solutions by oxides of Mn, Al, and Fe (e.g., Thanabalasingam and Pickering, 1990). Although the detrital clay particles are relatively large and Al-dominated, neoformed clays are commonly nanosized and Fe-rich, formed either inorganically or through the action of microorganisms (Farmer et al., 1991; Konhauser et al., 1993). They could adsorb Sb3+ in the tridentate-hexanuclear fashion, thus exposing their chapmanite-like surfaces to the aqueous environment around them.
XRD traces and Rietveld refinement. Protocols with all thermodynamic data for the studied phases. Starting composition of the solution for the forward model. All data sets available in Supplement.
The supplement related to this article is available online at: https://doi.org/10.5194/ejm-33-357-2021-supplement.
JM initiated the project, provided its concept, reduced the data, calculated all thermodynamic quantities and models, and wrote the paper. JM and SK synthesized and characterized the studied phases. KL, TS, and AN carried out high-temperature oxide melt solution calorimetry. ED and AB carried out relaxation and differential scanning calorimetry.
The authors declare that they have no conflict of interest.
We are thankful to Jiří Sejkora, an anonymous reviewer, and the editor Carlos Rodriguez-Navarro for the constructive criticism that improved the paper. Special thanks goes to Martin Chovan for providing the natural chapmanite sample. The work presented here was financially supported by a Deutsche Forschungsgemeinschaft grant (MA 3927/32-1). Oxide melt solution calorimetry was supported by the U.S. Department of Energy Office of Basic Energy Sciences, under grant DE-FG02-97ER14749.
This research has been supported by the Deutsche Forschungsgemeinschaft (grant no. MA 3927/32-1) and the Department of Energy, Labor and Economic Growth (grant no. DE-FG02-97ER14749).
This paper was edited by Bruno Lanson and reviewed by Jiří Sejkora and one anonymous referee.
Abramchuk, M., Lilova, K., Subramani, T., Yoo, R., and Navrotsky, A.: Development of high-temperature oxide melt solution calorimetry for p-block element containing materials, J. Mater. Res., 35, 2239–2246, 2020. a, b, c, d
Amador, J., Gutierrez-Puebla, E., Monge, M. A., Rasines, I., and Ruiz-Valero, C.: Diantimony tetraoxides revisited, Inorg. Chem., 27, 1367–1370, 1988. a
Aspiala, M., Sukhomlinov, D., and Taskinen, P.: Determination of standard thermodynamic properties of Sb2O3 by a solid-oxide electrolyte EMF technique, Solid State Ionics, 265, 80–84, 2014. a
Auffan, M., Rose, J., Proux, O., Borschneck, D., Masion, A., Chaurand, P., Hazemann, J.-L., Chaneac, C., Jolivet, J.-P., Wiesner, M. R., van Geen, A., and Bottero, J.-Y.: Enhanced adsorption of arsenic onto maghemites nanoparticles: As(III) as a probe of the surface structure and heterogeneity, Langmuir, 24, 3215–3222, 2008. a
Ballirano, P., Maras, A., Marchetti, F., Merlino, S., and Perchiazzi, N.: Rietveld refinement of chapmanite SbFe2Si2O8OH, a TO dioctahedral kaolinite-like mineral, Powder Diffr., 13, 44–49, 1998. a, b, c, d, e, f
Barin, I. and Knacke, O.: Thermochemical properties of inorganic substances, Springer, 1973. a
Barin, I., Knacke, O. and Kubaschewski, O.: Thermochemical properties of inorganic substances, Supplement volume, Springer, https://doi.org/10.1007/978-3-662-02293-1, 1977. a
Benisek, A., Kroll, H., and Dachs, E.: The heat capacity of fayalite at high temperatures, Am. Mineral., 97, 657–660, 2012. a
Biltz, W.: Ueber die Temperaturabhängigkeit der Valenz zwischen Metallen und Sauerstoff, Nachrichten der Königlichen Gesellschaft der Wissenschaften zu Göttingen, Math.-Phys. Klasse, 293–317, 1908. a, b
Brannon, J. and Patrick, W.: Fixation and mobilization of antimony in sediments, Environ. Pollut. B, 9, 107–126, 1985. a
Burton, E. D., Hockmann, K., and Karimian, N.: Antimony sorption to goethite: Effects of Fe(II)-catalyzed recrystallization, ACS Earth Space Chem., 4, 476–487, 2020. a
Byström, A., Hok, B., and Mason, B.: The crystal structure of zinc metantimonate and similar compounds, Arkiv for Kemi, Mineral. Geol., 15, 1–8, 1942. a
Cooke Jr., J. P.: Revision of the atomic weight of antimony, P. Am. Acad. Arts Sci., 13, 1–71, 1877. a
Coughlin, J. P.: Contributions to the data on theoretical metallurgy. XII. Heats and free energies of formation of inorganic oxides, Bulletin 542, United States Bureau of Mines, 84 pp., 1954. a
Dachs, E. and Bertoldi, C.: Precision and accuracy of the heat-pulse calorimetric technique: low-temperature heat capacities of milligram-sized synthetic mineral samples, Eur. J. Mineral., 17, 251–261, 2005. a
Diemar, G. A., Filella, M., Leverett, P., and Williams, P. A.: Dispersion of antimony from oxidizing ore deposits, Pure Appl. Chem., 81, 1547–1553, 2009. a, b, c, d, e, f, g
Farmer, V. C., Krishnamurti, G. S. R., and Huang, P. M.: Synthetic allophane and layer-silicate formation in SiO2-Al2O3-FeO-Fe2O3-MgO-H2O systems at 23 ∘C and 89 ∘C in a calcareous environment, Clays Clay Miner., 39, 561–570, 1991. a
Filella, M. and May, P. M.: Computer simulation of the low-molecular-weight inorganic species distribution of antimony(III) and antimony(V) in natural waters, Geochim. Cosmochim. Acta, 67, 4013–4031, 2003. a, b
Friedrich, A., Wildner, M., Tillmanns, E., and Merz, P. L.: Crystal chemistry of the new mineral brandholzite, Mg(H2O)6[Sb(OH)6]2, and of the synthetic analogues M2+(H2O)6[Sb(OH)6]2 (M2+ = Mg, Co), Am. Mineral., 85, 593–599, 2000. a
Glushko, V. P., Medvedev, V. A., Bergman, G. A., Vasilev, B. P., Gurvich, L. V., Alekseev, V. I., Kolesov, V. P., Yungman, V. S., Ioffe, N. T., Vorabev, A. F., Reznitskii, L. A., Khodakovskii, I. L., Smirnova, N. L., Galchenko, G. L., and Baibuz, V. F.: Thermicheskie konstanti veshtestv, Academy of Science, UDSSR, 1972. a, b
Gribchenkova, N. A., Steblevskii, A. V., Meshkov, L. L., Alikhanyan, A. S., and Nipan, G. D.: The standard enthalpies of formation of mixed antimony and bismuth oxides, Chem. Thermod. Thermoch., 83, 713–716, 2009. a
Harder, H.: Nontronite synthesis at low temperatures, Chem. Geol., 18, 169–180, 1976. a
Ilgen, A. G. and Trainor, T. P.: Sb(III) and Sb(V) sorption onto Al-rich phases. Hydrous Al oxide and the clay minerals kaolinite KGa-1b and oxidized and reduced nontronite NAu-1, Environ. Sci. Technol., 46, 843–851, 2012. a
Kasenov, B. K., Mukhanova, M. A., Kasenova, S. B., and Mustafin, E. S.: The thermodynamic properties of the alkaline-earth metal antimonates, Russ. J. Phys. Chem., 70, 18–20, 1996. a
Kato, T. and Watanabe, I.: The crystal structures of schallerite and friedelite, Yamaguchi University, College of Arts Bull., 26, 51–63, 1991. a
Kennedy, C. A., Stancescu, M., Marriott, R. A., and White, M. A.: Recommendations for accurate heat capacity measurements using a Quantum Design physical property measurement system, Cryogenics, 47, 107–112, 2007. a
Knauth, P. and Schwitzgebel, G.: E.M.F. and calorimetric investigations of antimony oxides, Berich. Bunsen. Phys. Chem., 92, 32–35, 1988. a, b
Konhauser, K. O., Fyfe, W. S., Ferric, F. G., and Beveridge, T. J.: Metal sorption and mineral precipitation by bacteria in two Amazonian river systems, Rio Solimões and Rio Negro, Geology, 21, 1103–1106, 1993. a
Konopik, N. and Zwiauer, J.: Über Antimontetroxyd. (Löslichkeit; Oxydationsstufen in Lösung), Monatshefte für Chemie und verwandte Teile anderer Wissenschaften, 83, 189–196, 1952. a, b
Kovalenko, L. Yu., Yaroshenko, F. A., Burmistrov, V. A., Isaeva, T. N., and Galimov, D. M.: Thermolysis of hydrated antimony pentoxide, Inorg. Mat., 55, 586–592, 2019. a, b
Kubaschewski, O. and Evans, E. L.: Metallurgical Thermochemistry, 3rd edn., Pergamon Press, 1958. a
Leverett, P., Reynolds, J. K., Roper, A. J., and Williams, P. A.: Tripuhyite and schafarzikite: two of the ultimate sinks for antimony in the natural environment, Mineral. Mag., 76, 891–902, 2012. a, b, c
Lilova, K., Sharma, G., Hayun, S., Shoemaker, D. P., and Navrotsky, A.: Thermodynamics of ZnxMn3−xO4 and Mg1−zCuzCr2O4 spinel solid solutions, J. Mat. Res., 34, 3305–3311, https://doi.org/10.1557/jmr.2019.196, 2019. a
Liu, C. H., Chuang, Y.-H., Chen, T.-Y., Tian, Y., Li, H., Wang, M.-K., and Zhang, W.: Mechanism of arsenic adsorption on magnetite nanoparticles from water: Thermodynamic and spectroscopic studies, Environ. Sci. Technol., 49, 7726–7734, 2015. a
Maier, C. G.: Thermodynamic data on some metallurgically important compounds of lead and the antimony-group metals and their application, Rep. Inv., United States Bureau of Mines, 1934. a
Majzlan, J., Števko, M., and Lánczos, T.: Soluble secondary minerals of antimony in Pezinok and Kremnica (Slovakia) and the question of mobility or immobility of antimony in mine waters, Environ. Chem., 13, 927–935, https://doi.org/10.1071/EN16013, 2016. a, b
Majzlan, J.: Solution calorimetry on minerals related to acid mine drainage – methodology, checks, and balances, Acta Geol. Slov., 9, 171–183, 2017. a
Majzlan, J.: Processes of metastable-mineral formation in oxidation zones and mine wastes, Mineral. Mag., 84, 367–375, 2020. a
Majzlan, J.: Primary and secondary minerals of antimony, in: Antimony, edited by: Filella, M., De Gruyter, https://doi.org/10.1515/9783110668711-002, 2021. a, b
Milton, C., Axelrod, J. M., and Ingram, B.: Bismutoferrite, chapmanite, and “hypochlorite”, Am. Mineral., 43, 656–670, 1958. a, b, c
Mixter, W. G.: The heat of formation of trisodium orthophosphate, trisodium orthoarsenate, the oxides of antimony, bismuth trioxide; and fourth paper on the heat of combination of acidic oxides with sodium oxide, Am. J. Sci., 28, 103–111, 1909. a, b
Navrotsky, A.: Progress and new directions in high temperature calorimetry revisited, Phys. Chem. Min., 24, 222–241, 1997. a
Navrotsky, A.: Progress and new directions in calorimetry: A 2014 perspective, J. Am. Ceram. Soc., 97, 3349–3359, 2014. a, b, c
Nekrasov, I. Ya.: Geochemistry, Mineralogy and Genesis of Gold Deposits, CRC Press, 2009. a, b
Pauliš, P., Dolníček, Z., Vrtiška, L., Pour, O., Žák, K., Ackerman, L., Veselovský, F., Pašava, J., Kadlec, T., and Malíková, R. Mineralogy of the stibnite deposit at Chříč near Rakovník (Czech Republic), Bull. Mineral. Petr., 27, 148–166, 2019 (in Czech). a
Périchaud, J.-J. and Pierrot, R.: La chapmanite de La Bessade (Haute-Loire), B. Soc. fr. Minér. Cristall. 88, 294–299, 1965. a
Petříček, V., Dušek, M., and Palatinus, L.: Crystallographic Computing System JANA2006: General features, Z. Kristall., 5, 345–352, 2014. a
Polák, S.: Chapmanite from Pezinok, Miner. Slov., 15, 565–566, 1983 (in Slovak). a
Polák, S.: Once again on chapmanite from Pezinok, Miner. Slov., 20, 475–476, 1988 (in Slovak). a, b, c
Robie, R. A. and Hemingway, B. S.: Thermodynamic properties of minerals and related substances at 298.15 K and 1 bar (105 Pascals) pressure and at higher temperatures, U.S. Geol. Survey Bull., 2131, 461 pp., 1995. a, b, c, d
Roper, A. J., Leverett, P., Murphy, T. D., and Williams, P. A.: Stabilities of byströmite, MgSb2O6, ordoñezite, ZnSb2O6 and rosiaite, PbSb2O6, and their possible roles in limiting antimony mobility in the supergene zone, Mineral. Mag., 79, 537–544, 2015. a, b, c, d, e, f
Rossini, F. D., Wagman, D. D., Evans, W. H., Levine, S., and Jaffe, I.: Selected values of chemical thermodynamic properties, Circ. Nat. Bureau Stand., 500 pp., 1952. a, b
Schwarzmann, E., Rumpel, H., and Berndt, W.: Synthese von Diantimonpentoxid Sb2O5, Z. Naturf. B, 32, 617–618, 1977. a
Sejkora, J., Ozdín, D., Vitálos, J., Tuček, P., Čejka, J., and Ďuďa, R.: Schafarzikite from the type locality Pernek (Malé Karpaty Mountains, Slovak Republic) revisited, Eur. J. Mineral., 19, 419–427, 2007. a
Simon, A. and Thaler, E.: Beiträge zur Kenntnis von Oxyden. Zur Kenntnis der Oxyde des Antimons, Z. Anorg. Chem., 162, 253–278, 1927. a, b
Środek, D., Encheva, S., Petrov, P., Gospodinov, N., and Galuskina, I.: Clinobisvanite and bismutoferrite from the village of Boyadzhik area, Yambol Region – new minerals for Bulgaria, Rev. Bulg. Geol. Soc., 80, 42–44, 2019. a
Stewart, D. J., Knop, O., Ayasse, C., and Woodhams, F. W. D.: Pyrochlores. VII. The oxides of antimony: an X-ray and Mössbauer study, Can. J. Chem., 50, 690–700, 1972. a
Thanabalasingam, P. and Pickering, W.: Specific sorption of antimony (III) by the hydrous oxides of Mn, Fe, and Al, Water Air Soil Pollut., 49, 175–185, 1990. a
Verryn, S. M. C. and Meulenbeeld, P. M. P. B: A new locality for Chapmanite (Sb(OH)Fe2(SiO4)2) at a lead-silver-zinc deposit near Argent Station, Mpumalanga, South Africa, Neues Jb. Mineral. Monat., 85–90, 2000. a
Wagman, D. D., Evans, W. H., Halow, I., Parker, V. B., Bailey, S. M., and Schumm, R. H.: Selected values of chemical thermodynamic properties Part 1. Tables for the first twenty-three elements in the standard order of arrangement, Nat. Bureau Stand., Techn. Note 270-1, 1965. a
Wagman, D. D., Evans, W. H., Parker, V. B., Schumm, R. H., Halow, I., Bailey, S. M., Churney, K. L., and Nuttall, R. L.: The NBS tables of chemical thermodynamic properties. Selected values for inorganic and C1 and C2 organic substances in SI units, J. Phys. Chem. Ref. Data, 11, 407 pp., 1982. a
Walker, T. L.: Chapmanite, a new mineral from South Lorraine, Ontario. Univ. of Toronto Studies, Geol. Ser. 17, 5–8, 1924. a
Whitten, A. E., Dittrich, B., Spackman, M. A., Turner, P., and Brown, T. C.: Charge density analysis of two polymorphs of antimony(III) oxide, Dalton Trans., 23–29, 2004. a
Zhukhlistov, A. P. and Zvyagin, B. B.: Determination of the crystal structures of chapmanite and bismuthoferrite by high-voltage electron diffraction, Kristallografiya, 22, 731–738, 1977. a, b, c, d, e