the Creative Commons Attribution 4.0 License.
the Creative Commons Attribution 4.0 License.
 | 11 May 2021
A Raman spectroscopic study of the natural carbonophosphates Na3MCO3PO4 (M is Mn, Fe, and Mg)
Evgeniy Nikolaevich Kozlov
Ekaterina Nikolaevna Fomina
Vladimir Nikolaevich Bocharov
Mikhail Yurievich Sidorov
Natalia Sergeevna Vlasenko
Vladimir Vladimirovich Shilovskikh
Raman spectra of three natural carbonophosphates (sidorenkite, bonshtedtite, and bradleyite) with the general formula Na3MCO3PO4 (M is Mn, Fe, and Mg) were studied and compared. These spectra showed from 21 to 24 vibrational bands, of which the two most intense (964±5 and 1074±3 cm−1) correspond to the υ1(P–O) and υ1(C–O) modes. These two bands split into doublet peaks due to the occurrence of isomorphic impurities. It was found that the crystallographic orientation of the sample influences the intensity of most bands. Most bands assigned to the same vibrations showed a regular shift (the smallest in sidorenkite spectra, an intermediate in bonshtedtite, and the largest in bradleyite). We propose an algorithm that allows for diagnostics of carbonophosphates in inclusions by their Raman spectra, providing a reliable result even in the absence of energy-dispersive X-ray spectroscopy (EDX) data.
- Article
(7248 KB) - Full-text XML
-
Supplement
(1052 KB) - BibTeX
- EndNote


First synthesized in the past decade (Chen et al., 2012a), chemical compounds of the carbonophosphate family with the general formula Na3MCO3PO4 (M is Mn, Fe, and Mg) have gained increased recognition in recent years. The reason for this lies in their promising application as high-performance and low-cost electrode materials for lithium-ion batteries (Chen et al., 2012b; Hautier et al., 2011; Huang et al., 2014; Kosova and Shindrov, 2019). In geology, these compounds have been known for more than 40 years: bradleyite Na3Mg(CO3)(PO4) was discovered in 1941 (Fahey and Tunell, 1941), sidorenkite Na3Mn(CO3)(PO4) in 1979 (Khomyakov et al., 1979; Khomyakov, 1980), and bonshtedtite Na3Fe(CO3)(PO4) in 1982 (Khomyakov, 1983; Khomyakov et al., 1982). The listed phases crystallize in the P2 monoclinic space group with two molecules per unity cell (Z=2) and have similar cell parameters to their synthetic analogs (Table 1). The double-layered structure of carbonophosphates is composed of [MO6] octahedra (where M is Mg, Fe, or Mn) and tetrahedral [PO4]3− chains along the b axis. Two atoms of oxygen in octahedra that are not linked to the [PO4]3− groups are shared with the [CO3]2− carbon triangles. The alkalis (Na) occupy two different interstitial sites as the “[NaIO7]-[NaIO7]” polyhedron chains and the isolated [NaIIO6] polyhedron, which link the layers in the a direction.
Table 1Cell parameters of the synthetic and natural carbonophosphates.
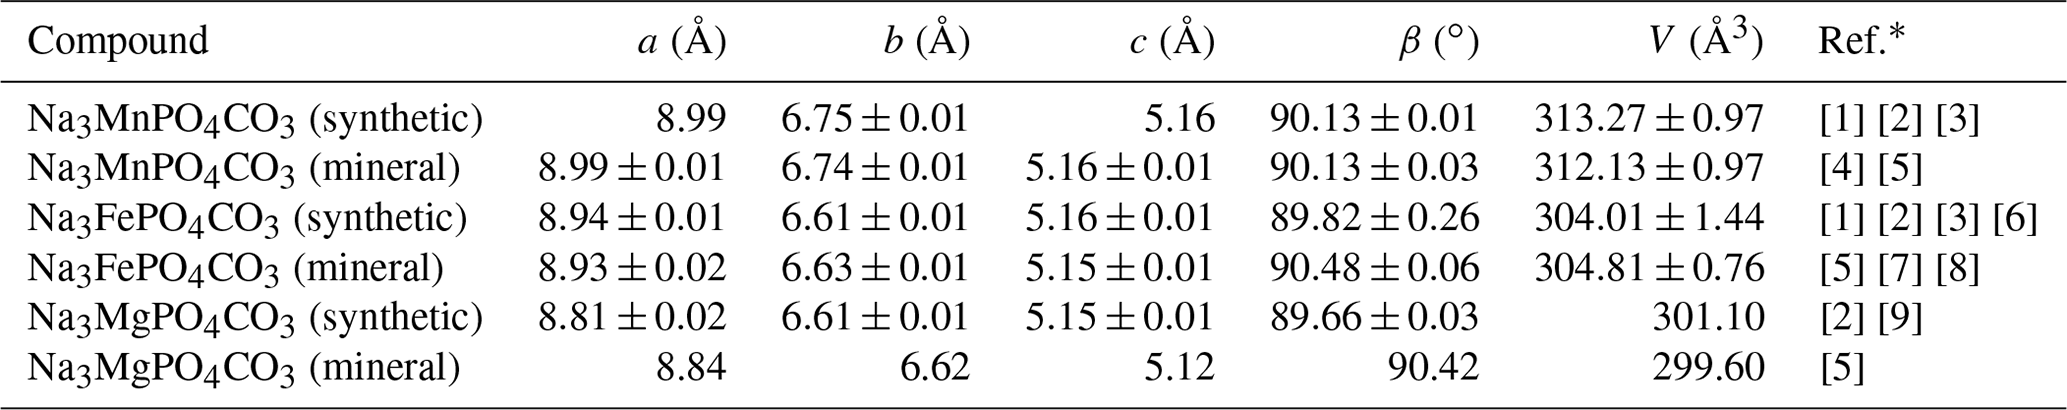
∗ References: [1] Chen et al. (2012b), [2] Chen et al. (2012a), [3] Gao et al. (2018), [4] Khomyakov (1980), [5] Tkhy et al. (1984), [6] Kosova and Shindrov (2019), [7] Khomyakov (1983), [8] Krivovichev et al. (2013), and [9] Gao et al. (2015).
All listed natural carbonophosphates occur as trace minerals in the Earth and are predominantly found in rocks from alkaline complexes. An exception is a bradleyite, which was first discovered in the Green River Formation, Wyoming, USA (Fahey and Tunell, 1941). Later, this mineral was reported from alkaline rocks, mostly as microinclusions in minerals of carbonatites and kimberlites from Russia, Canada, and Africa (Abersteiner et al., 2017, 2018, 2019, 2020; Chakhmouradian and Zaitsev, 2002; Golovin et al., 2018; Kamenetsky et al., 2013, 2014; Sharygin and Doroshkevich, 2017; Zaitsev et al., 2004). Bonshtedtite and sidorenkite were found exclusively in alkaline complexes. For the first time, these minerals were detected in the Lovozero (bonshtedtite) and Khibiny (sidorenkite) agpaitic nepheline-syenite complexes. Lovozero and Khibiny are parts of the Devonian Kola Alkaline Province formed 360–380 Myr ago (Kramm et al., 1993). This province covers more than 100×106 km2 in the Murmansk region (NW Russia) and Finland. Apart from Khibiny and Lovozero, it includes more than 20 nepheline-syenite and alkaline-ultrabasic carbonatite complexes and numerous dikes and explosion pipes (Downes et al., 2005). In this work, we studied natural carbonophosphates from several alkaline complexes of the Devonian Kola Alkaline Province.
Along with some other Na minerals, carbonophosphates indicate a high initial Na activity in carbonatite and kimberlite melts (Chakhmouradian and Zaitsev, 2002; Kamenetsky et al., 2014; Zaitsev et al., 2004), which is beneficial for petrological reconstructions. Because these species are capable of incorporating large-ion lithophile and rare earth elements (REEs) into their structure, they can participate in the transport of these elements (Gao et al., 2015). It is also noteworthy that bonshtedtite is one of the minerals obtained in recent experiments on the mobility of REEs in carbonatite systems (Anenburg et al., 2020), which indicates its value for petrological modeling of carbonatite evolution. Moreover, due to the presence of both [PO4]3− and [CO3]2− groups in carbonophosphates, these mineral phases can play an important role in the Earth's global carbon and phosphate cycles. According to Gao et al. (2015, 2018), carbonophosphates are also promising as diamond genesis indicators. With all these advantages, carbonophosphates have long attracted the attention of geologists. Raman spectroscopy appears to be one of the most suitable tools for their diagnosis since they are commonly present in rocks as small inclusions in other mineral grains. Raman spectroscopy makes it possible to analyze the behavior of the [PO4]3− and [CO3]2− groups in carbonophosphates under applied pressure and to estimate the effect of pressure on the structure of these phases (Gao et al., 2015, 2018). Despite this benefit, only a few publications contain Raman characteristics of either natural or synthetic carbonophosphates. A thorough study of the Raman spectrum has only been made for natural sidorenkite (Frost et al., 2015). For the synthetic analog of bonshtedtite, the position of the lattice modes in the 140–240 cm−1 spectral range and the two main modes of the [PO4]3− and [CO3]2− groups have been described (Amaral et al., 2019; Gao et al., 2018). Positions of only two main modes have previously been determined for synthetic bradleyite (Gao et al., 2015).
Based on studies of natural carbonophosphates, this paper provides (a) the structured and verified literature data on Raman spectroscopy of carbonophosphates; (b) an estimate of the influence of the positions of the crystallographic axes during the analysis on the band intensities; (c) new data on the peak positions in the bradleyite and bonshtedtite spectra within the bending modes of the [PO4]3− and [CO3]2− groups (from 350 to 900 cm−1), as well as an analysis of the stretching mode peaks for the same groups; and (d) recommendations as to which of the peaks are most suitable for diagnosing the studied minerals using the Raman technique. The above results can be useful both for studying the mineralogy of geological samples using Raman spectroscopy and as a basis for a detailed study of the Raman spectra of carbonophosphates in the course of specialized studies such as those presented in Gao et al. (2015, 2018).
2.1 Samples description and preparation
For this work, we used the samples of sidorenkite, bonshtedtite, and bradleyite from the collection of the Bel'kov Museum of Geology and Mineralogy (Geological Institute of Kola Science Centre of the Russian Academy of Science, Russia) and bradleyite from our collection from the Sallanlatwa massif.
Sidorenkite, represented by prismatic transparent pale-pink crystals ranging in size from 0.5 to 6.0 mm (sample GIM 7402), was found in the rock dump of the Umbozero mine, Karnasurt Mt., Lovozero alkaline massif (67∘52′ N, 34∘26′ E). In the studied sample from the pegmatite vein, sidorenkite occurs in association with green fibrous aegirine, pectolite, and villiaumite (Fig. 1a).
Bonshtedtite was studied in a sample GIM 5713/5 from bonshtedtite type locality (Kirovsk apatite mine, Kukisvumchorr Mt., Khibiny alkaline massif, Russia; 67∘40′ N, 33∘43′ E). This sample was donated to the museum collection by the discoverer of this mineral, Alexander Petrovich Khomyakov. The sample was selected from the late silicocarbonatite veinlet intersecting rischorrites and ijolite-urtites. In this sample, bonshtedtite occurs as prismatic translucent brown crystals ranging from 0.5 to 1.0 mm in size. The associated minerals include burbankite, ferrotychite, siderite, calcite, aegirine, albite, and thermonatrite (Khomyakov, 1983; Khomyakov et al., 1982) (Fig. 1b).
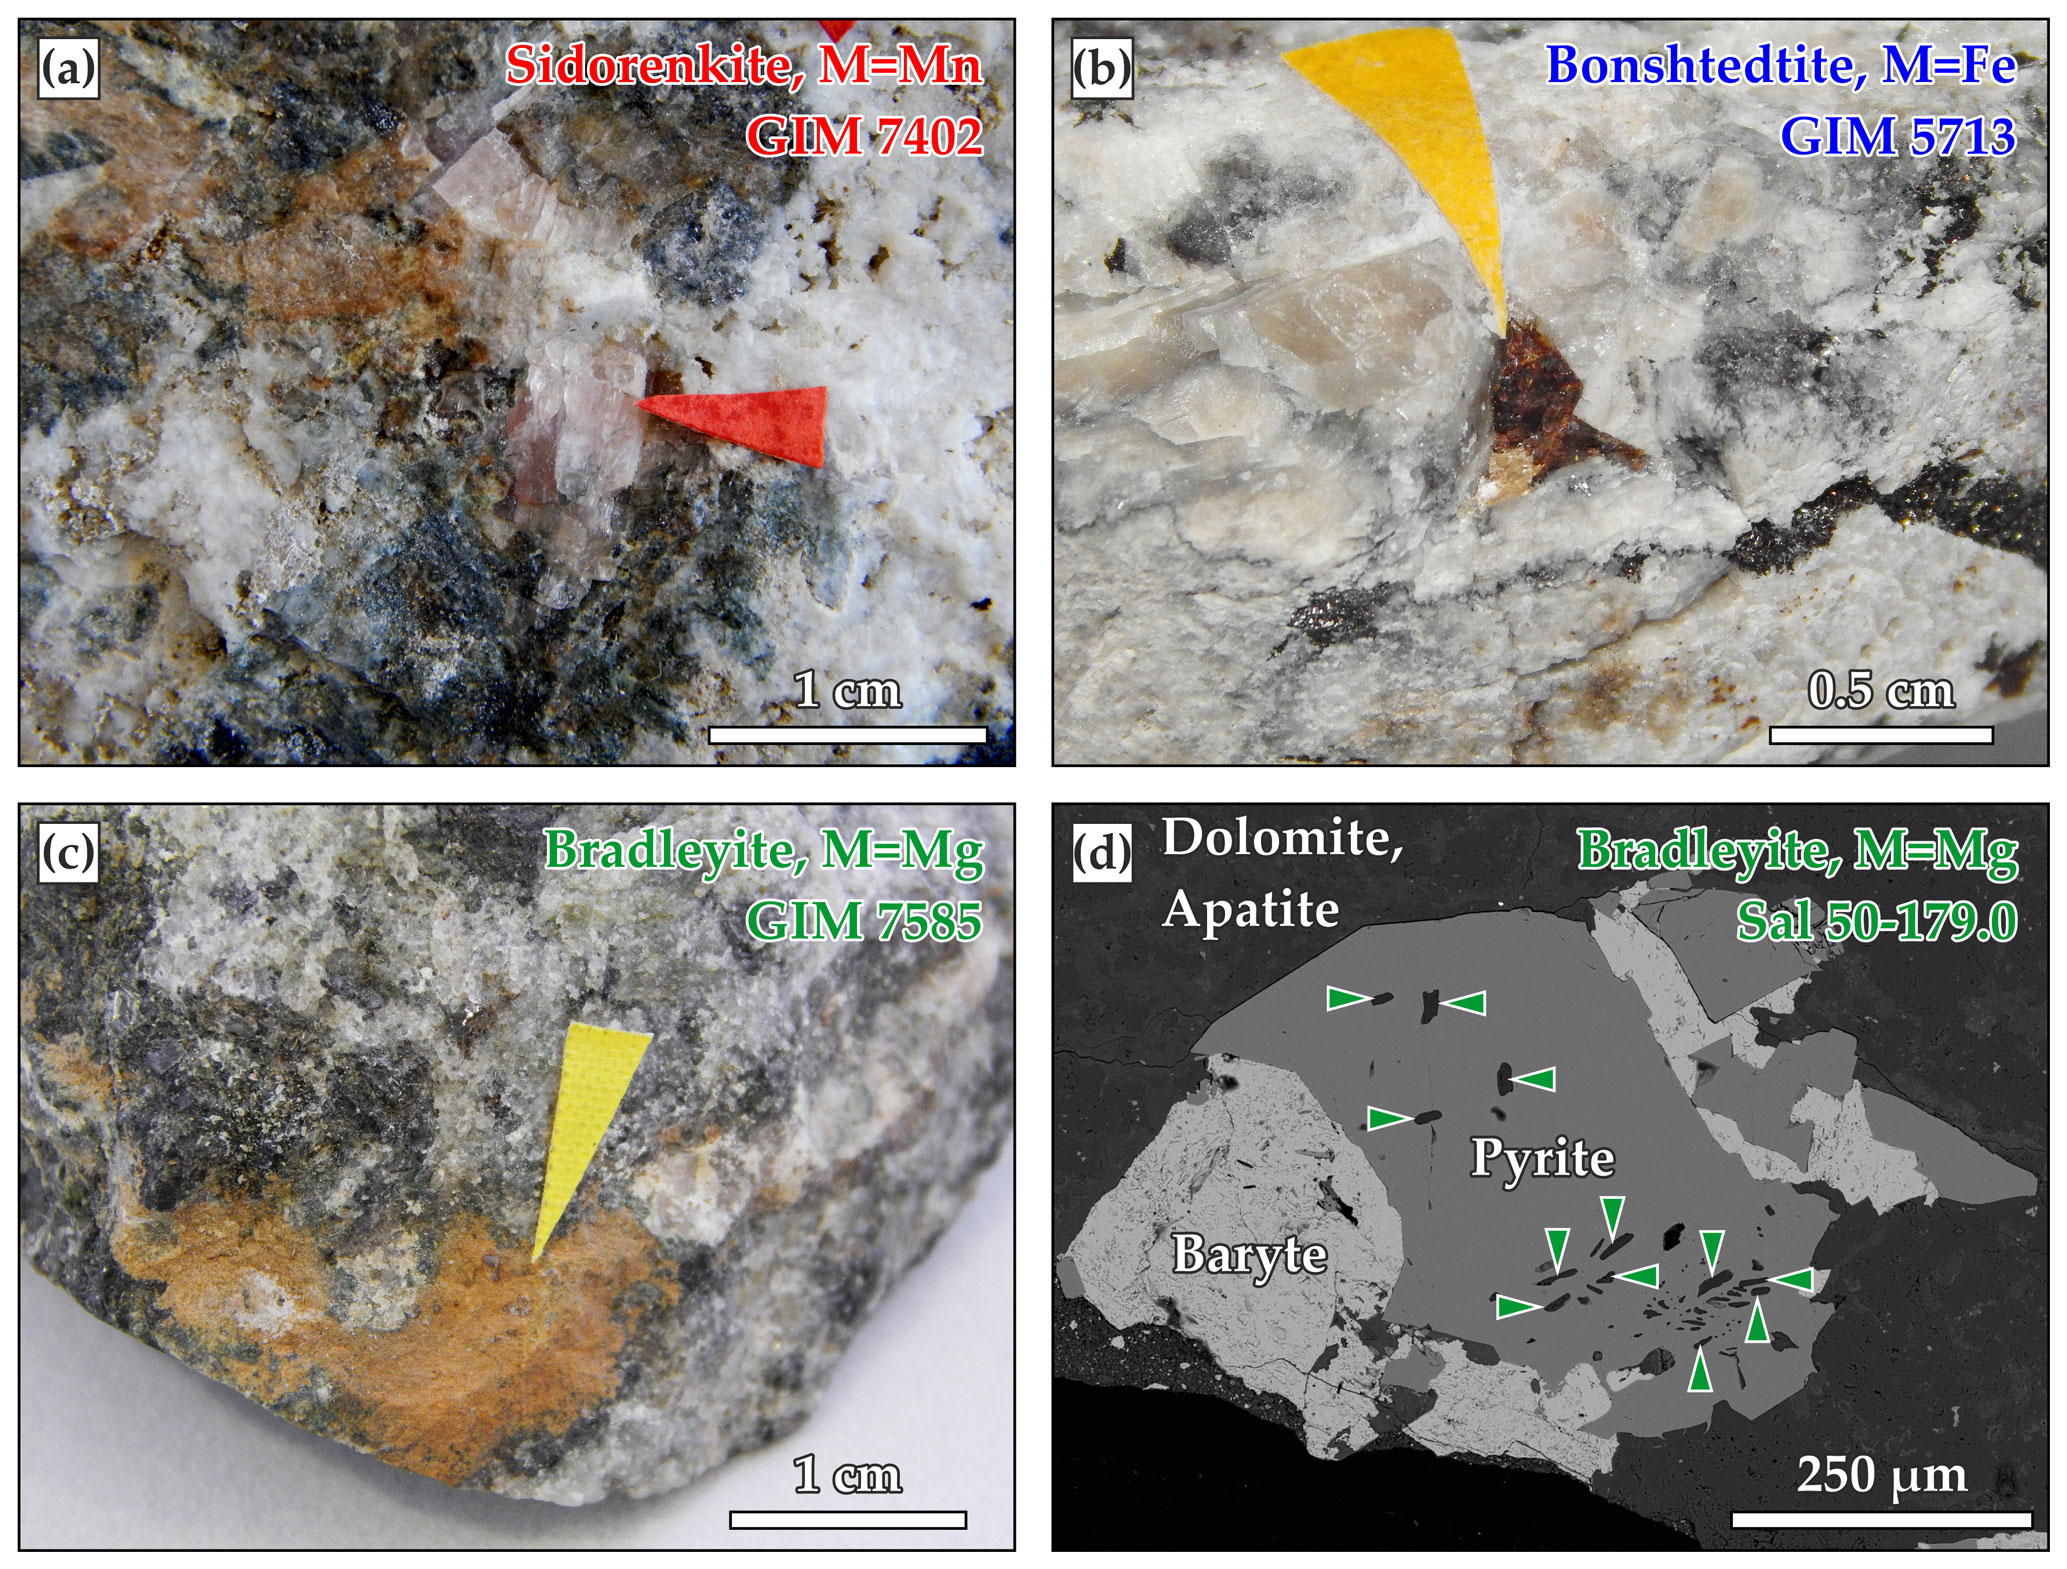
Figure 1Photographs of the studied samples with (a) sidorenkite from Lovozero, (b) bonshtedtite from Khibiny, (c) bradleyite from Vuoriyarvi, and (d) backscattered electron (BSE) image of bradleyite from Sallanlatwa.
Bradleyite was reported from two carbonatite massifs of the Kola region, namely Vuoriyarvi (66∘48′ N, 30∘07′ E) and Sallanlatwa (66∘45′ N, 29∘27′ E). In the sample GIM 7585 from Vuoriyarvi, this mineral fills in the veinlets intersecting calcite carbonatites. It is represented by an aggregate of long prismatic opaque brown crystals at lengths of up to 0.5 mm (Fig. 1c). In Sallanlatwa, bradleyite has previously been found as a daughter mineral in fluid inclusions and solid inclusions in the lueshite and early crystallized magnetite from calcite carbonatites (Zaitsev et al., 2004). In our Sallanlatwa silicocarbonatite breccia samples, bradleyite occurs as inclusions in pyrite crystals (samples Sal-50-184.0 and Sal-50-179.0), intersected by breunnerite–ankerite and phlogopite–calcite carbonatites with lueshite (Afanasyev, 2011). These inclusions exhibit isometric and long prismatic crystals of up to 0.1 mm in length (Fig. 1d).
To study the chemical composition and register the Raman spectra of carbonophosphates from the collection of the Bel'kov Museum of Geology and Mineralogy, we hand-picked the cleavage fragments of these minerals from specimens, embedded them into epoxy, and polished them. In the case of bradleyite from our Sallanlatwa rock collection, only thin polished sections were used.
2.2 Scanning electron microscopy (SEM), energy-dispersive X-ray spectroscopy (EDX), and electron backscatter diffraction (EBSD)
Chemical compositions of sidorenkite, bonshtedtite, and bradleyite were determined using a Hitachi S-3400N scanning electron microscope (Hitachi, Ltd., Tokyo, Japan) coupled with an Oxford X-Max 20 energy dispersive X-ray spectrometer (20 kV, 1 nA, 30 s exposure per spectrum) (Oxford Instruments PLC, Reading, UK). All spectra acquired by EDX were processed automatically using Oxford AZtec EDX software's Tru-Q procedure (AZtec 2.3, Oxford Instruments PLC, Reading, UK). Pyrite (Fe), apatite (P), periclase (Mg), rhodochrosite (Mn), and albite (Na) were used as standards. The detection limit was 0.02 % for Fe and Mn, 0.05 % for P and Na, and 0.1 % for Mg. The crystallographic orientation of the studied grains in space was determined using electron backscatter diffraction (EBSD). For EBSD measurements, an Oxford HKL Nordlys EBSD detector (Oxford Instruments PLC, Reading, UK) equipped with a Hitachi S-3400N scanning electron microscope was utilized. Operating conditions were 1 nA beam current with 20 kV acceleration voltage. The overall acquisition time was 16 s per EBSD pattern. Oxford Instruments AZtecHKL analysis software was used to determine the crystal orientation from the Kikuchi pattern, using the crystal structures of carbonophosphates from the Inorganic Crystal Structure Database (ICSD). In order to obtain the flattest surface possible for an EBSD analysis, each sample was polished with an ending stage of Ar-ion etching for 10 min (Oxford Ionfab 300, Oxford Instruments PLC, Reading, UK).
2.3 Raman microprobe spectroscopy
Raman spectra were collected at the GEOMODEL Research Center of the SPbU Scientific Park (St Petersburg) with a HORIBA Jobin-Yvon LabRam HR800 Raman spectrometer (Horiba, Ltd., Kyoto, Japan) equipped with an Olympus confocal microscope (50× objective lens, Olympus Corporation, Tokyo, Japan). The Raman scattering signal was excited by solid-state laser (532 nm) with an acquisition time of 4–10 s and 10–15 repetitions. The calibration was performed using the Raman line of silicon at 520.7 cm−1. The spectral resolution limit was 2 cm−1. The laser power at the sample was limited to 3 mW. The Raman spectrum was collected twice from each point, with the sample rotated 90∘ in one direction for the second time.
2.4 Software processing of Raman data
The appropriate spectral manipulations, including baseline correction and peak fitting by the PeakFit v. 4.12 (Systat Software, Inc., San Jose, CA, USA), were performed to obtain the best peak positions. Fragments of each spectrum containing groups of peaks were sequentially analyzed. For example, when analyzing the most intense modes of the [PO4]3− and [CO3]2− groups (∼960 and ∼1080 cm−1, respectively), a section from 900 to 1150 cm−1 was distinguished. No data reduction (such as a non-parametric digital filter) and smoothing procedures were applied. A linear two-point function was applied to correct the baseline. A band fitting was carried out using a Voigt function (“Voigt Amp Approx” tool with “varying peak widths and shapes” option enabled). The number of component bands for the fitting procedure was chosen based on prior information (Chukanov and Vigasina, 2020; Frost et al., 2015) and the fitting quality. The approximation coefficient (r2) and standard error (SE) were used to examine the approximation quality. A numerical peak fitting algorithm was used for processing. The fitting continued until a stable result was obtained, specifically, until the increase in r2 stopped.
3.1 Chemical characterization
Of the studied minerals, the most homogeneous composition (Fig. 2a) closest to the ideal formula with the lowest impurity content (Fig. 2b) is Mn-carbonophosphate sidorenkite GIM 7402. It contains insignificant FeO, less than 1.0 wt %, which corresponds to 0.04 Fe atoms per formula unit (a.p.f.u.). Its Mg content is below the detection limit. Thus, the chemistry of the studied sidorenkite is close to the endmember. The composition of a Fe-carbonophosphate bonshtedtite GIM 5713/5 varies due to the different Mg content (from 0.15 to 0.31 a.p.f.u.), which is quite abundant in this mineral (Fig. 2c). The Mn content ranges within 0.06–0.10 a.p.f.u. A Mg-carbonophosphate bradleyite from Sallanlatwa carbonatites (Sal-50-179.0 and Sal-50-184.0) exhibits a significant proportion of Fe (from 0.29 to 0.43 a.p.f.u.) and a Mn content of 0.08–0.10 a.p.f.u (Fig. 2d). Bradleyite GIM 7585 from Vuoriyarvi carbonatites is, on average, less ferruginous (the median Fe content is 0.26 a.p.f.u.) and less manganese (from 0.02 to 0.06 a.p.f.u. Mn). This phase has the widest compositional range (from 0.05 to 0.37 a.p.f.u. Fe) (see Fig. 2a).

Figure 2(a) The Mg–Fe–Mn (a.p.f.u.) classification diagram showing figurative points of the chemical composition of the studied samples; typical EDX spectra of (b) sidorenkite, (c) bonshtedtite, and (d) bradleyite.
3.2 Raman spectroscopy
The standard group theory analysis shows the presence of 78 vibrational modes for carbonophosphates, of which 39 can be expected in Raman spectra (Amaral et al., 2019). In the Raman spectra of the phases examined in this study, from 21 to 24 pronounced bands were detected. The Raman spectral profiles of all investigated minerals (i.e., sidorenkite, bonshtedtite, and bradleyite) are similar (Fig. 3) and generally correspond to the information reported in Amaral et al. (2019) and Frost et al. (2015).
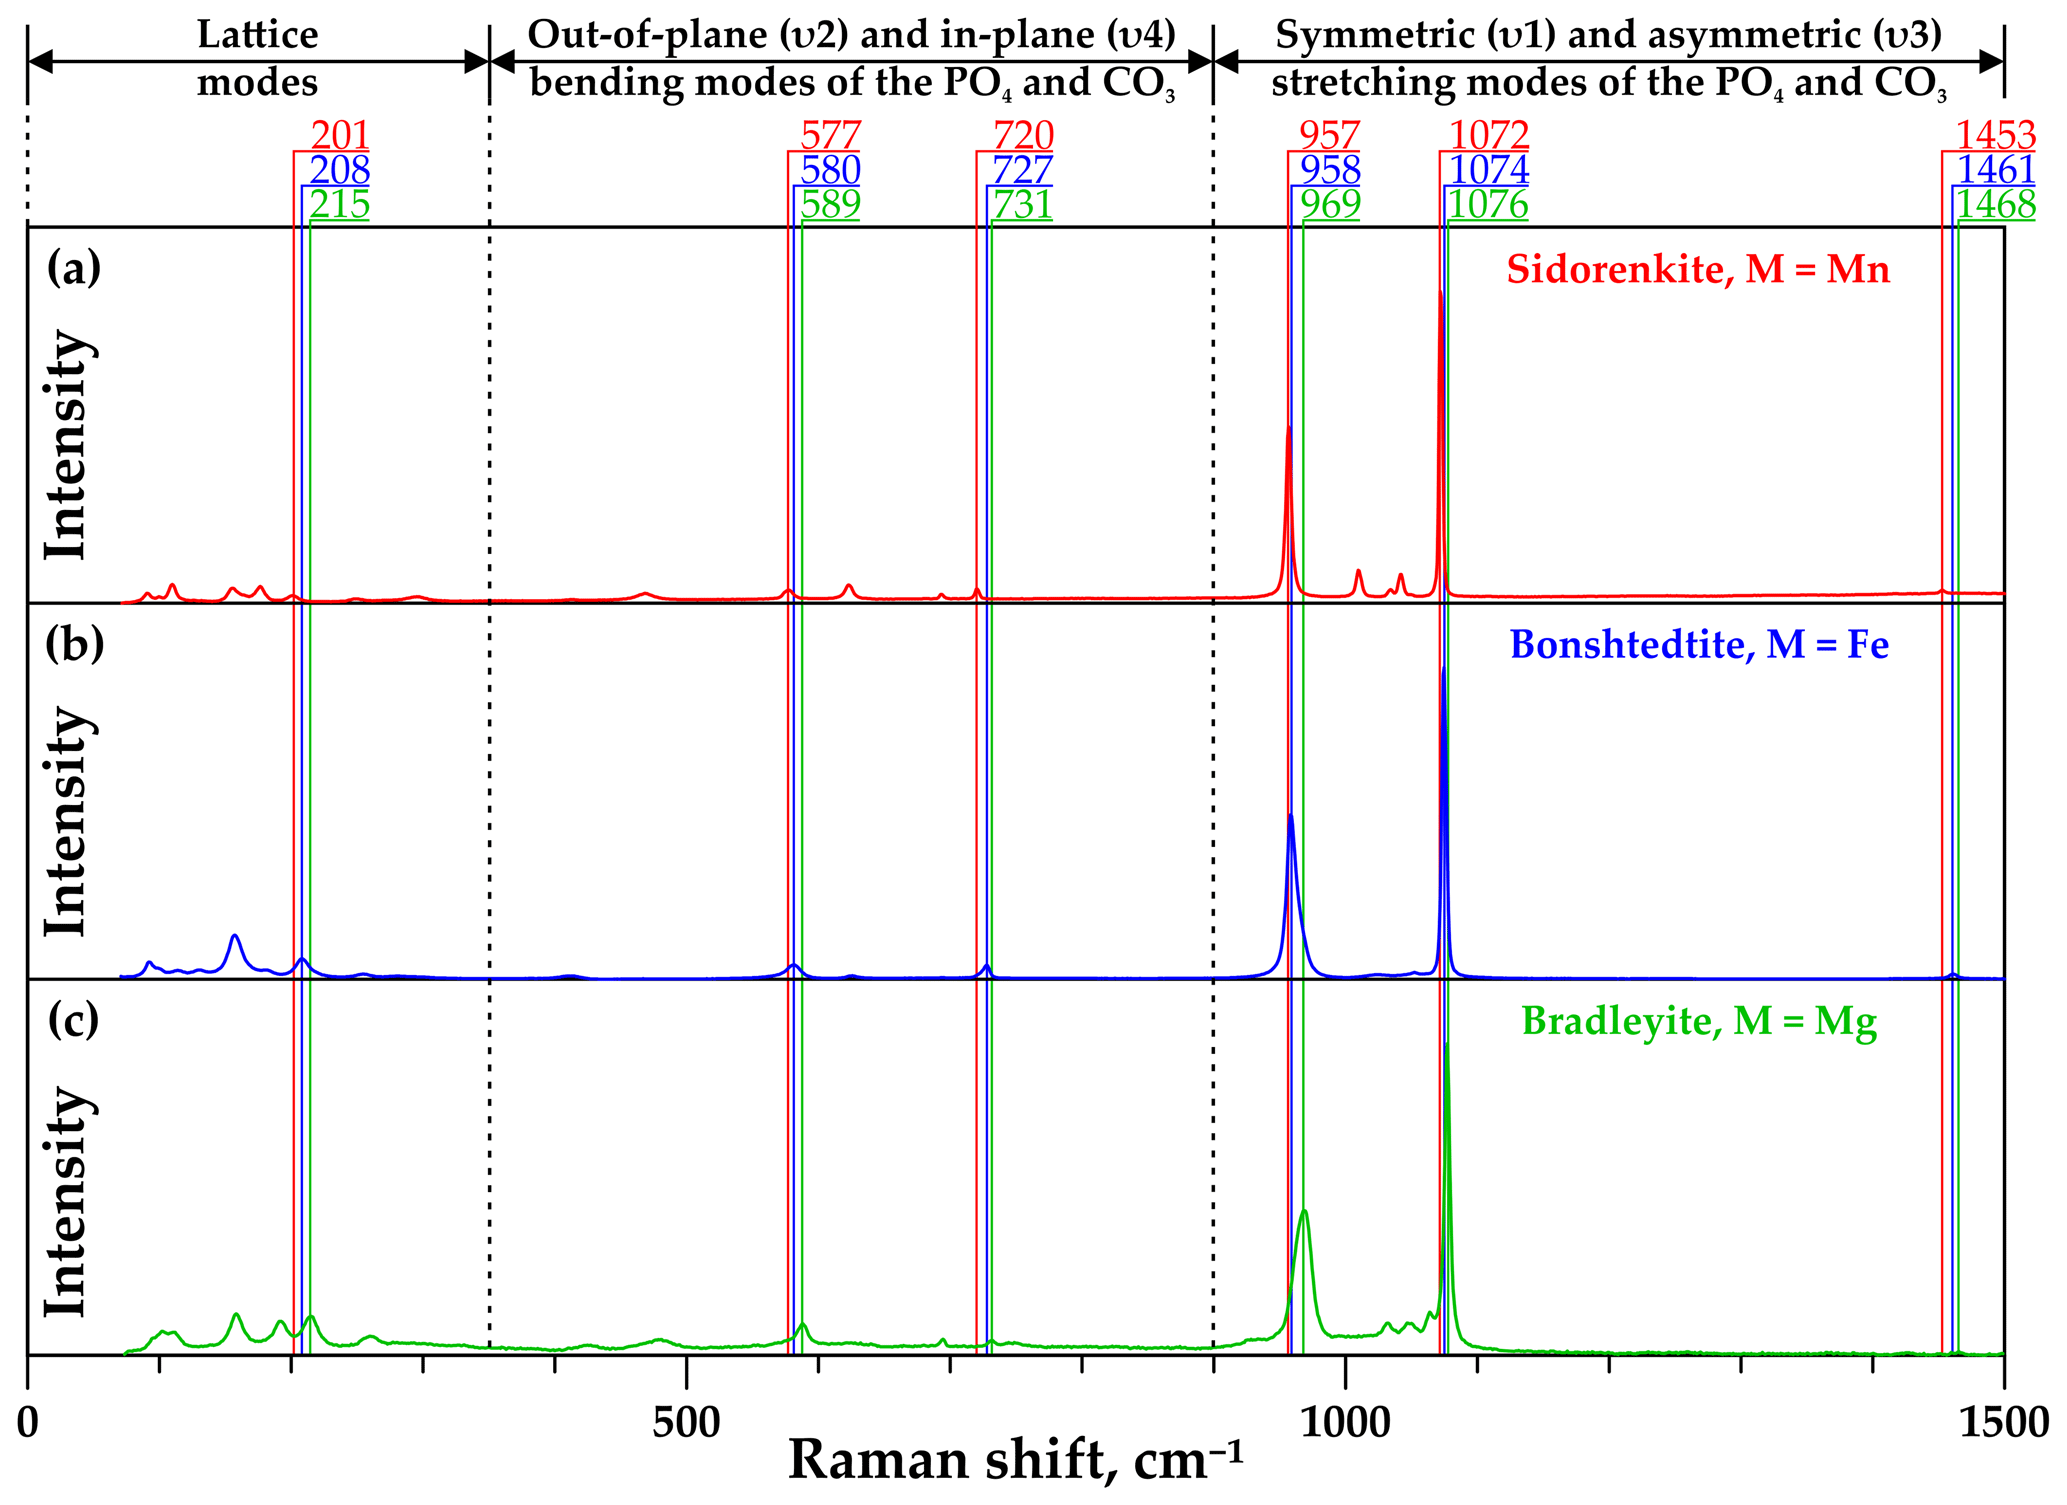
The low-frequency spectral region from 70 to 350 cm−1 shows a series of external (translational lattice) modes. The spectral range from 350 to 900 cm−1 contains low to medium intensity out-of-plane (υ2) and in-plane (υ4) bending modes of the [PO4]3− and [CO3]2− groups. In the range of 900–1500 cm−1, there are both symmetric (υ1) and asymmetric (υ3) stretching modes of the [PO4]3− and [CO3]2− groups. The latter range exhibits the two most intense bands in the Raman spectra of carbonophosphates. These are the maxima at 964±5 and 1074±3 cm−1. The first band is interpreted as a υ1(P–O) mode from the [PO4]3− group (Amaral et al., 2019; Frost et al., 2015). The second band was described as a υ1(C–O) mode from the [CO3]2− group (Amaral et al., 2019; Frost et al., 2015). The Raman bands between 1010–1050 cm−1 are identified as the υ3(P–O) antisymmetric stretching mode of the phosphate units. The asymmetric υ3(C–O) stretching modes from the [CO3]2− group in carbonates are usually positioned in the range of 1400–1500 cm−1; see Frezzotti et al. (2012) and references therein. All carbonophosphate spectra we collected have a weak band in the region of 1460±10 cm−1, which corresponds to a υ3(C–O) mode from the [CO3]2− group. They also contain a weak band in the range of 1740–1745 cm−1, which is probably caused by the [CO3]2− group vibrations. Over the threshold at 1800 cm−1, no bands were observed in the Raman spectra of the studied carbonophosphate phases. The absence of lines in the range of 3000–3500 cm−1 indicates that the samples used for our research contain neither H2O nor (OH)− groups.
The most apparent difference in the Raman spectra of carbonophosphates is a regular shift in the position of most similar bands (see Fig. 3). In all samples, vibrational bands of sidorenkite are characterized by the smallest shift value. The displaceability of bonshtedtite frequencies is average, and that of bradleyite is the greatest. For a more detailed examination of the individual features of the Raman spectra of each phase and identifying the most suitable bands for mineralogical diagnostics, it is necessary to clarify important points revealed during our experiments. First, it was found that the intensity of some bands is significantly influenced by the crystallographic orientation of the carbonophosphate grains. Second, the decomposition of the most intense modes showed that their structure is typically complex due to the band splitting.
3.2.1 The influence of crystallographic orientation
The dependence of the spectral band intensities on the crystal orientation relative to the direction of polarization for the incident laser beam has been shown for many minerals, e.g., phlogopite (Loh, 1973; Tlili et al., 1989), pyrite (Bryant et al., 2018), and zircon (Kolesov et al., 2001). The crystal structures of sidorenkite, bradleyite, and bonshtedtite contain valence bonds of different lengths between cations (Na+, Mn2+, Mg2+, Fe2+) and oxygen atoms in [PO4]3− and [CO3]2− groups (Krivovichev et al., 2013; Tkhy et al., 1984). We suggest that change in band intensity for modes depends on the orientation of chemical bonds and vibrational interactions with the electronic state of cations in crystals. The same has been revealed for SiO4 in zircon (Kolesov et al., 2001). In carbonophosphates, the crystallographic-orientation effect is most evident in the variability in the intensity ratios of the main modes υ1(P–O) and υ1(C–O). We determined the relative orientation of the sidorenkite crystal using EBSD (Fig. 4a). As it turned out, the intensity of the υ1(C–O) band increases when the laser polarization direction coincides with the b axis. With such a crystallographic orientation, the υ1(C–O) band is the most intense and exceeds the υ1(P–O) band by a factor of 1.5–2 (Fig. 4b). When the polarization direction deviates from the b axis, the intensity of the υ1(C–O) band is markedly reduced (Fig. 4c). We obtained similar results from the EBSD study for all other carbonophosphates. Additional equipment is required to elucidate the nature of the relationship between the mode intensity and crystallographic orientation (e.g., Fleck et al., 2020). In this study, we approached this issue only phenomenologically. The spectra in which the intensity ratio of the main peak from υ1(C–O) to the main peak from υ1(P–O) are maximal (Fig. 4b) are hereafter referred to as “A type”. The spectra with the minimum ratio of these peaks (Fig. 4c) are hereafter designated as “B type”. Note that we registered both A and B spectra at each point, and the transition between them was carried out by rotating the sample by 90∘.
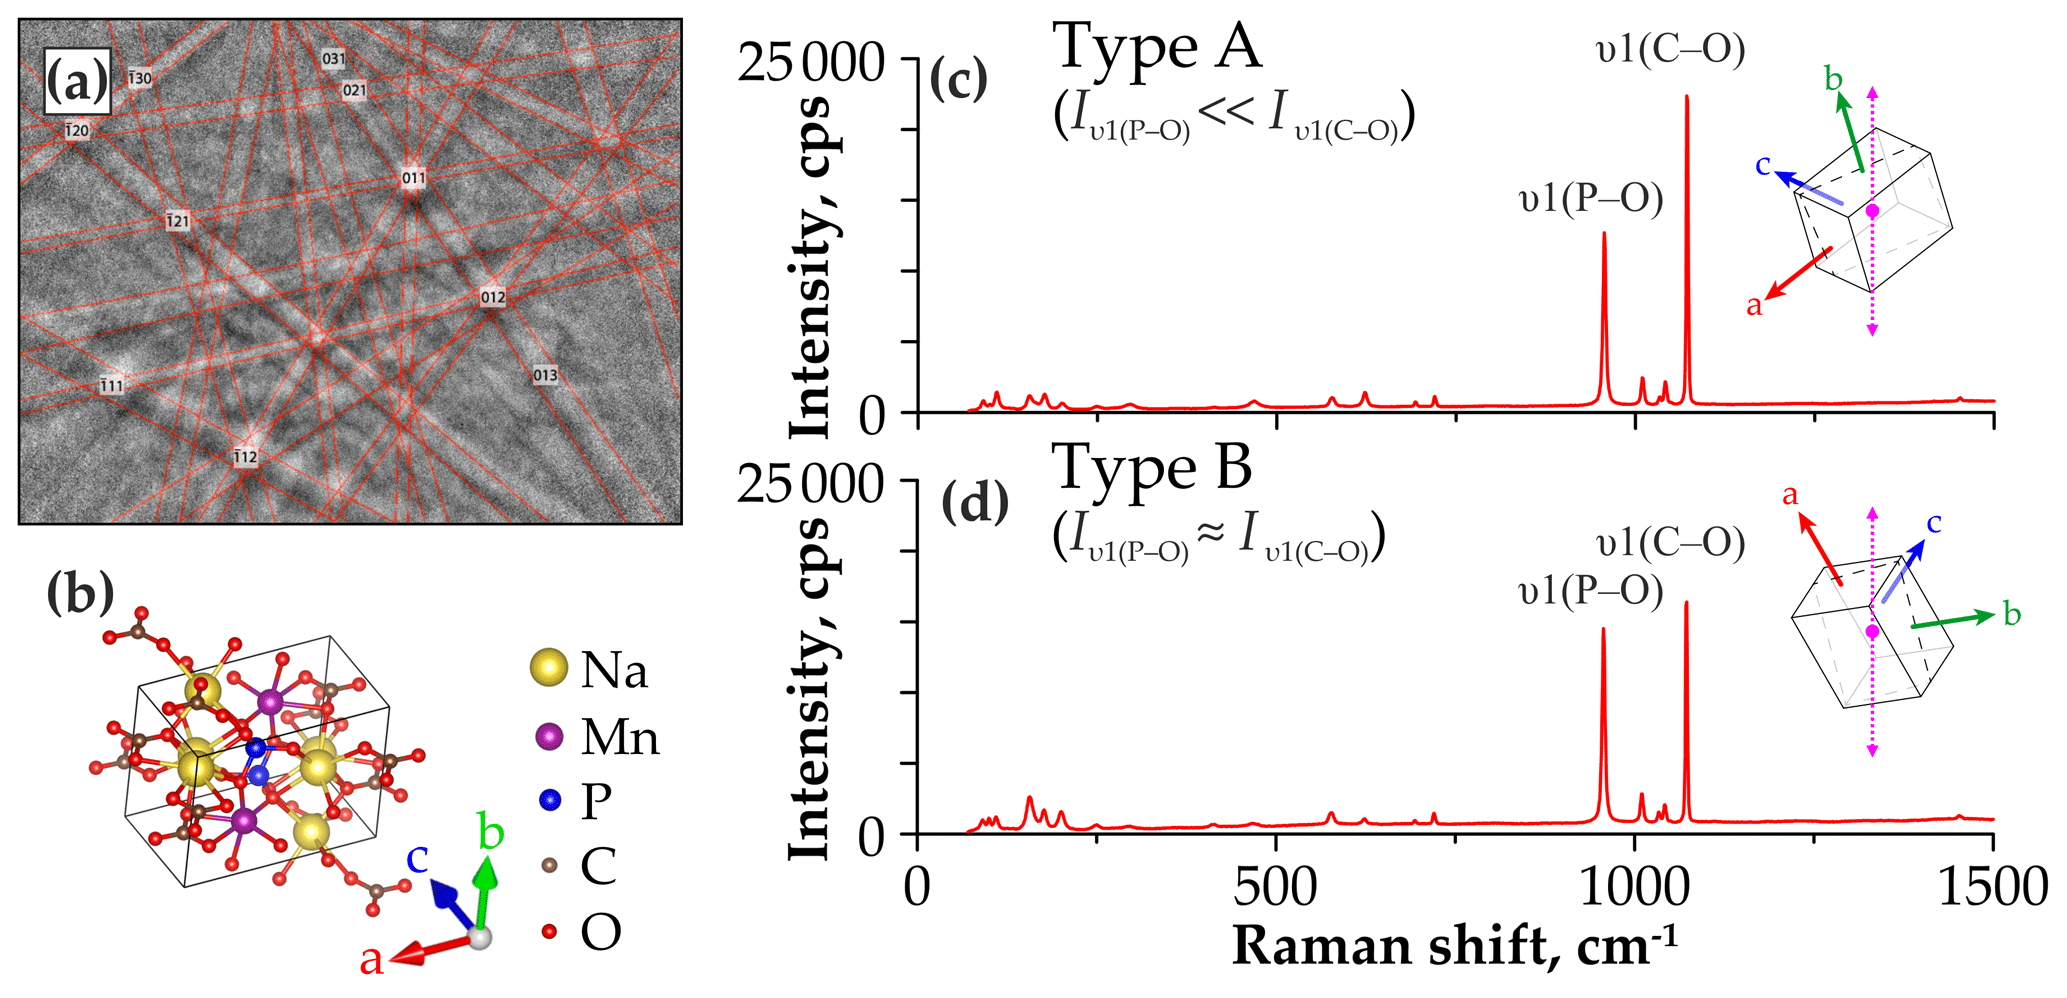
Figure 4(a) Kikuchi pattern of sidorenkite. (b) The orientation of the sidorenkite elementary cell relative to the presented pattern, drawing done with VESTA 3 (Momma and Izumi, 2011). Comparison of the Raman spectra of (c) type A with and (d) type B with , acquired at the different orientation of the crystal (the dotted purple line shows the laser polarization direction).
As the spectral profile transforms from A to B type, many bands change in intensity, and some bands completely disappear (Fig. 5). During the experiment, the sample's rotation significantly affected the intensity of the main peak of the υ1(C–O) band. However, the absolute intensity value of the main peak of the υ1(P–O) band remained almost unchanged; therefore, we used this value as a standard to assess the change in the intensity of other bands.
The differences between type-A and type-B Raman spectra were considered at three spectral segments: (1) the 900–1150 cm−1 range, where υ1 and υ3 stretching modes from the [PO4]3− group and υ1 from [CO3]2− group localize; (2) the 400–800 cm−1 range, which contains υ2 and υ4 bending modes from the [PO4]3− and [CO3]2− groups; and (3) the 70–350 cm−1 range, where lattice modes occur.
3.2.2 Spectral range from 900 to 1150 cm−1 and constitution of the most intense modes of the [PO4]3− and [CO3]2− groups
The two most intense modes of carbonophosphates υ1(P–O) and υ1(C–O) are positioned in the Raman spectra at 964±5 and 1074±3 cm−1, respectively. Several weak bands located between them are interpreted as the υ3(P–O) modes from the [PO4]3− group (Amaral et al., 2019; Frost et al., 2015). A similar position of the υ3(P–O) mode was found in the Raman spectra of many phosphate phases (Frezzotti et al., 2012; Litasov and Podgornykh, 2017; Pye and Rudolph, 2003). There are several peaks of the υ3(P–O) mode instead of one in this range because of the primitive (monoclinic) symmetry of carbonophosphates. The symmetry of the phosphate ion decreases in carbonophosphates compared with isolated [PO4]3−, which leads to the splitting of vibrational modes. For example, this phenomenon was found in vivianite spectra (Piriou and Poullen, 1984), which showed three peaks of the υ3(P–O) at 990, 1053, and 1018 cm−1. Let us consider the spectra of the studied carbonophosphates in order.
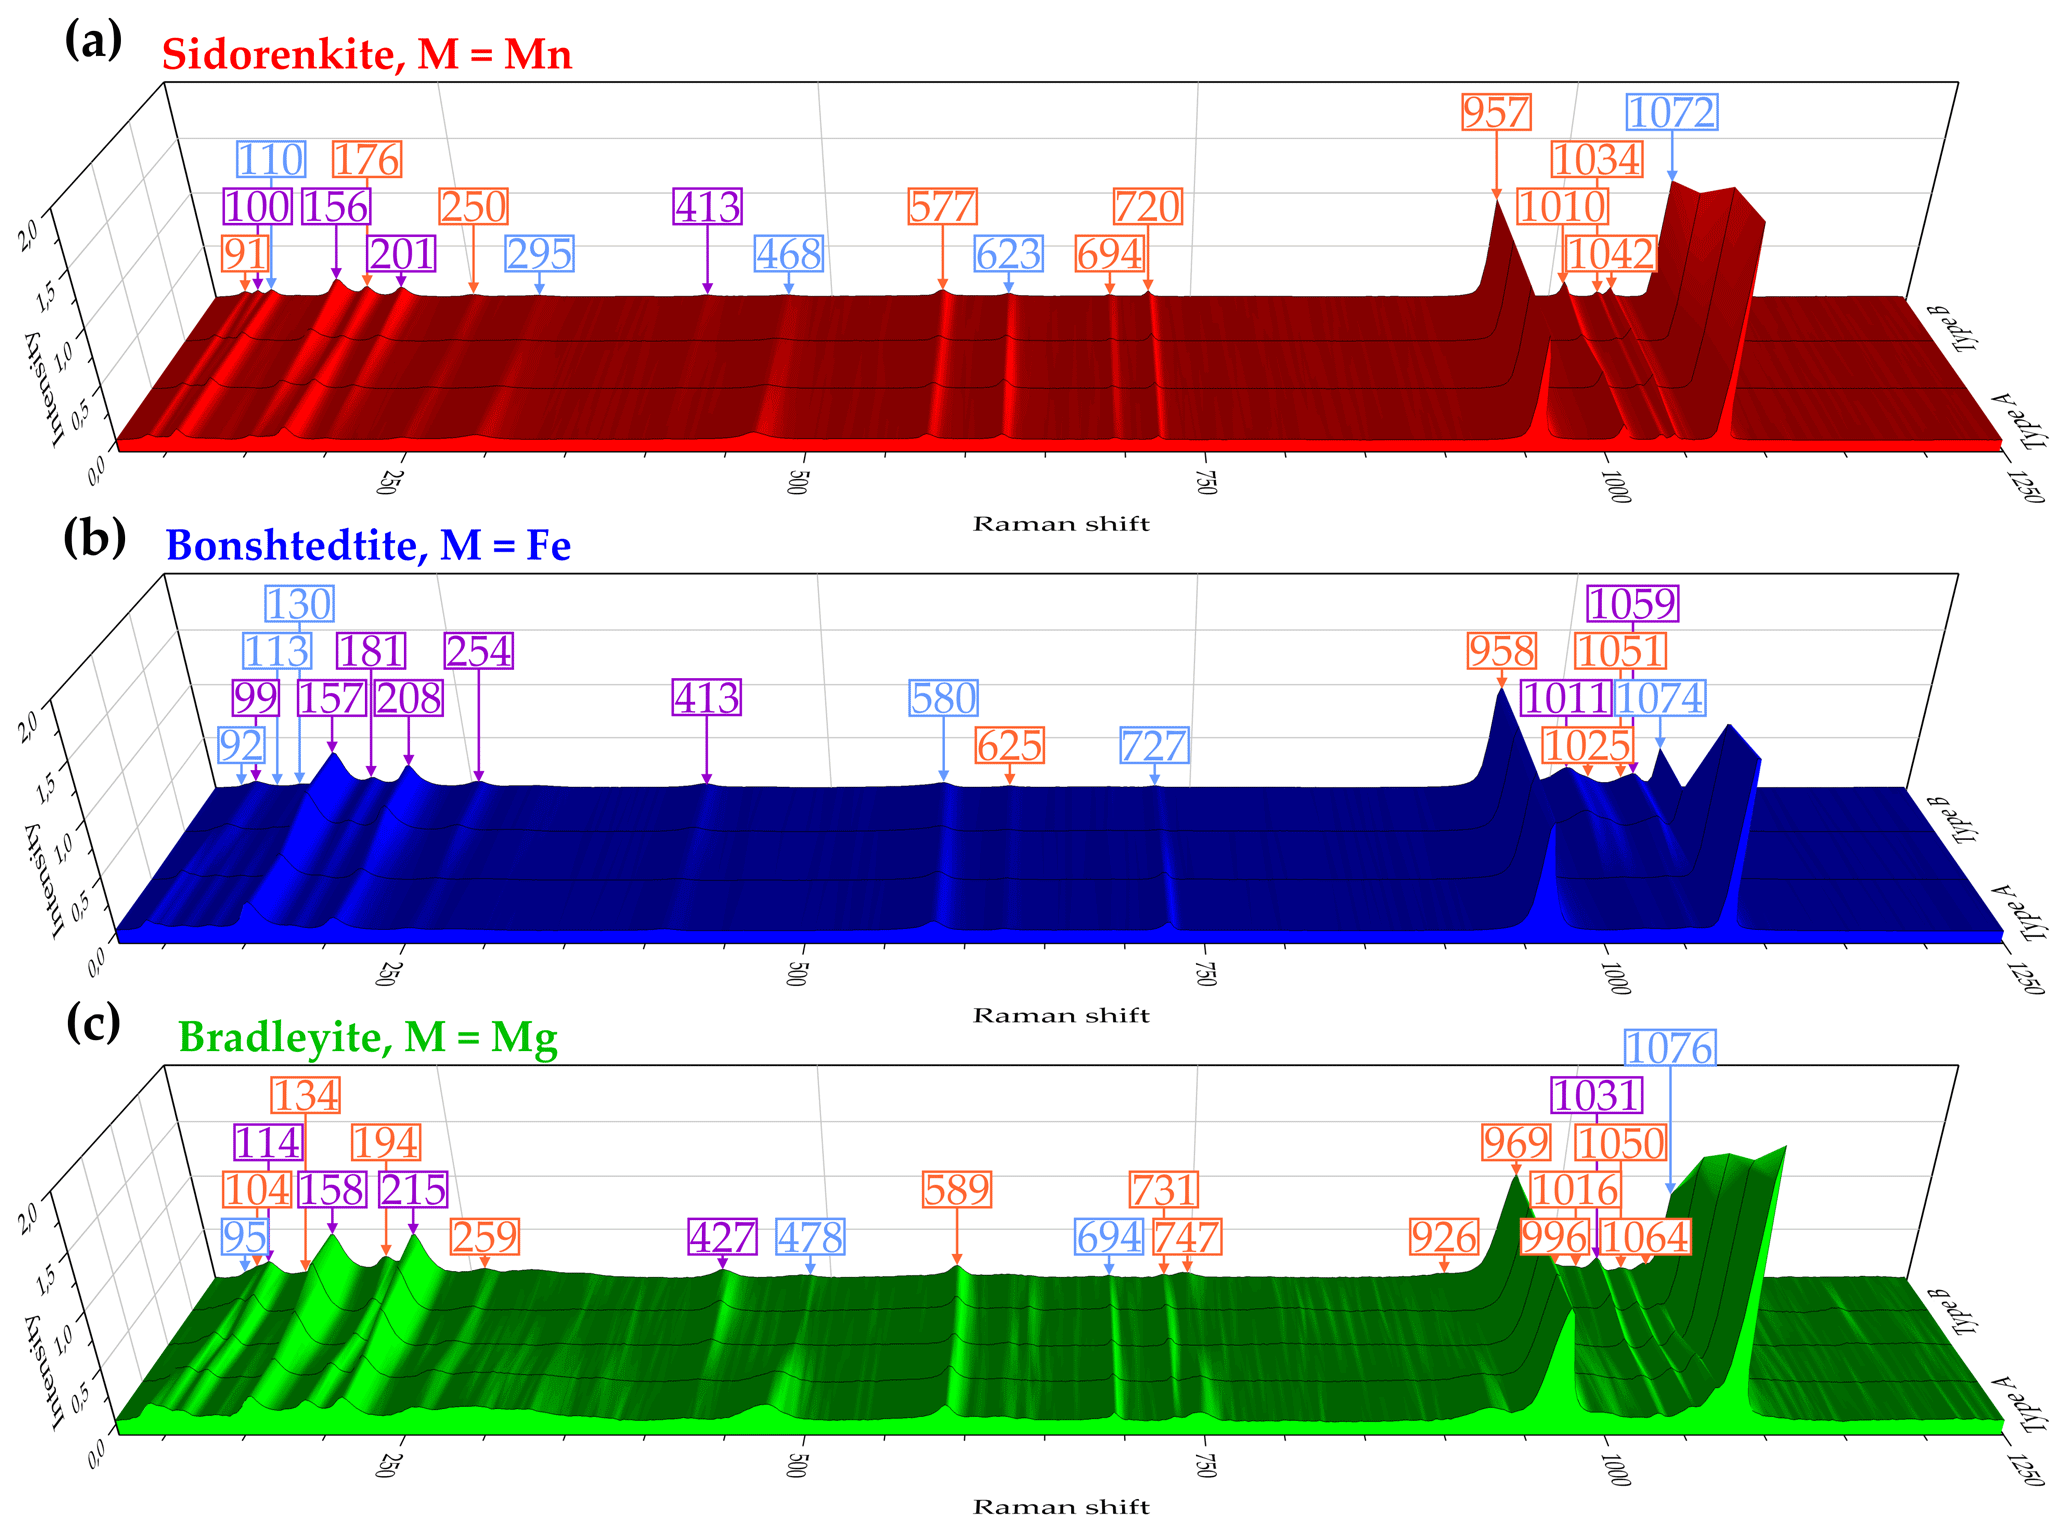
Figure 5Changes in the profile of Raman spectra of (a) sidorenkite, (b) bonshtedtite, and (c) bradleyite upon the transformation of the spectra from type A with to type B with . The intensity value is normalized to the intensity of the main peak of the υ1(P–O) band. The most prominent peaks are marked. Here and in Figs. 6, 8, and 9, (1) the markers of the peaks decreasing from type-A towards type-B spectra are blue, (2) the markers of the peaks increasing from type-A towards type-B spectra are purple, and (3) the markers of both the peaks with stable intensity and those independent of crystallographic orientation are orange.
In both A and B spectra of sidorenkite, the right shoulder of the υ1(P–O) band has a flatter slope than the left one (Fig. 6a). This band incorporates a high peak at 957 cm−1 and a smaller peak at 959 cm−1, with the former being 7–30 times as intense as the latter. The υ1(C–O) band is closer to symmetry but decomposes into two peaks localized at 1071 and 1073 cm−1, which are similar in height (0.4–0.9 to 1, respectively). Between the double main bands, three small but well-pronounced bands occur at frequencies of 1010, 1034, and 1042 cm−1. They are present in both types of sidorenkite spectra. The intensities of these bands are relatively stable and do not exhibit any dependence on the crystallographic orientation.
In bonshtedtite spectra, the υ1(P–O) band decomposes into a high peak at 958 cm−1 and a smaller peak at around 964 cm−1 (Fig. 6b). Due to the difference of 2–5 times in the intensity of these peaks, the υ1(P–O) band of bonshtedtite is noticeably more asymmetric than that of sidorenkite. As in the spectra of the latter, the right shoulder of this band has a smaller slope. The υ1(C–O) band in the bonshtedtite spectra decomposes into two narrow peaks at 1074 and 1076 cm−1, the former being 6–4 times more intense than the latter. The interval between the main bands differs between types A and B of the bonshtedtite spectra. In both types, two barely noticeable but stable intensity peaks at 1025 and 1051 cm−1 were always observed in this region. However, type-B spectra are complemented by two additional peaks at 1011 and 1059 cm−1. Due to higher intensities, they overlap contours of the weaker “stable” peaks (Fig. 6b).

Figure 6Decomposition of type-A (top halves) and type-B (bottom halves) Raman spectra of (a) sidorenkite, (b) bonshtedtite, and (c) bradleyite in the spectral range of 900–1150 cm−1. The intensity value is normalized to the intensity of the main peak of the υ1(P–O) band.
Bradleyite yields the most complex spectral profile in the considered range. Compared to sidorenkite and bonshtedtite spectra, it has a more asymmetric υ1(P–O) band with a flatter left shoulder (Fig. 6c). This asymmetry results from the spatial closeness of a high peak at 970 cm−1 and a smaller peak at 964 cm−1. The υ1(C–O) band in the bonshtedtite spectrum splits into two peaks at 1076 and 1077 cm−1. The segment between the most intense bands from the [PO4]3− and [CO3]2− groups in the bradleyite spectrum contains five peaks at frequencies of 996, 1016, 1131, 1050, and 1064 cm−1. The last three are well pronounced in the spectra of both A and B types. As the spectrum transforms from type A to type B, the peak positioned at 1131 cm−1 gradually increases. The peaks at 996 and 1016 cm−1 vary in shape with no clear dependence on the crystal orientation. In some spectra, they are hardly discernible, while in other spectra, they have the largest width among the five considered peaks and rarely merge. Two additional peaks were found in some bradleyite spectra, namely, a low-intensity broad peak to the left of the υ1(P–O) band at 927 cm−1 and a weak broad peak near the υ1(C–O) band at about 1100–1110 cm−1. No connection was traced between them and types A and B. The peak at 927 cm−1 tends to appear only with an increase in the intensity of the 996 and 1016 cm−1 peaks. Under the same circumstances, several additional peaks appear both in the region of υ2 and υ4 bending modes from the [PO4]3− and [CO3]2− groups (see Sect. 3.2.3) and in the region of the lattice modes (see Sect. 3.2.4).
The analysis performed showed that the υ1(P–O) and υ1(C–O) asymmetry is characteristic of all studied carbonophosphates. An accurate description of them is possible only by decomposing each band into two peaks. Faintly discernible splitting is manifested in the υ1(C–O) band, which always decomposes into two narrow peaks with a distance between the maxima of only 1–2 cm−1. Considering that the resolution of the instrument used for the study is 2 cm−1, the decomposition of this band into two peaks may be an artifact. However, these two peaks with sustained positions were obtained in all mathematical experiments performed. In the υ1(P–O) band, the splitting is more dramatic (Fig. 7). As shown by the example of sidorenkite, this band has strong asymmetry because of an additional peak at 959 cm−1, which coincides with the higher peak of the main bonshtedtite band. The additional bonshtedtite peak shows the same frequency as the additional bradleyite peak (964 cm−1), while the main bradleyite peak shows a higher frequency (969 cm−1). According to the EDX data, the sidorenkite studied contains iron, bonshtedtite has high magnesium content, and bradleyite is rich in iron (see Fig. 2). Isomorphic substitution of the Mn-Fe-Mg type leads to a change in the lengths of the Me2+–O chemical bonds and a shift in O atom coordinates in the mineral lattice. Simultaneously, the centers of mass of molecular bonds are displaced, and the [PO4]3− tetrahedra and [CO3]2− triangles are spatially distorted with violation of their symmetry. The unit cell parameters also change, which can induce splitting (Chukanov and Vigasina, 2020). Thus, the nature of the splitting of the υ1(P–O) and υ1(C–O) bands most likely lies in the influence of isomorphic impurities in the studied samples. Note that no splitting was observed in chemically pure synthetic carbonophosphates (Amaral et al., 2019). The main peak of the υ1(P–O) carbonophosphate band apparently results from O fluctuations associated with the dominant Me2+. The additional peak is determined by the O fluctuations associated with the Me2+ impurity (Fig. 7). Isomorphism is often accompanied by a regular peak shift, as evidenced by feldspars (Freeman et al., 2008) and sulfides (Kharbish et al., 2007). These features can explain the difference in the peak positions in the Raman spectra of the bonshtedtite–bradleyite pair. However, no similar displacement is observed in the sidorenkite–bonshtedtite pair, although the unit cell parameters of sidorenkite differ significantly from those of other carbonophosphates (see Table 1). The bond lengths (e.g., Mn–O and Fe–O bonds) also vary greatly (Tkhy et al., 1984).
In sum, the main difference between the Raman spectra of carbonophosphate phases in the considered range is the position of the υ1(P–O) and υ1(C–O) bands (e.g., bradleyite highly differs from sidorenkite and bonshtedtite), as well as the number of peaks between these two bands.
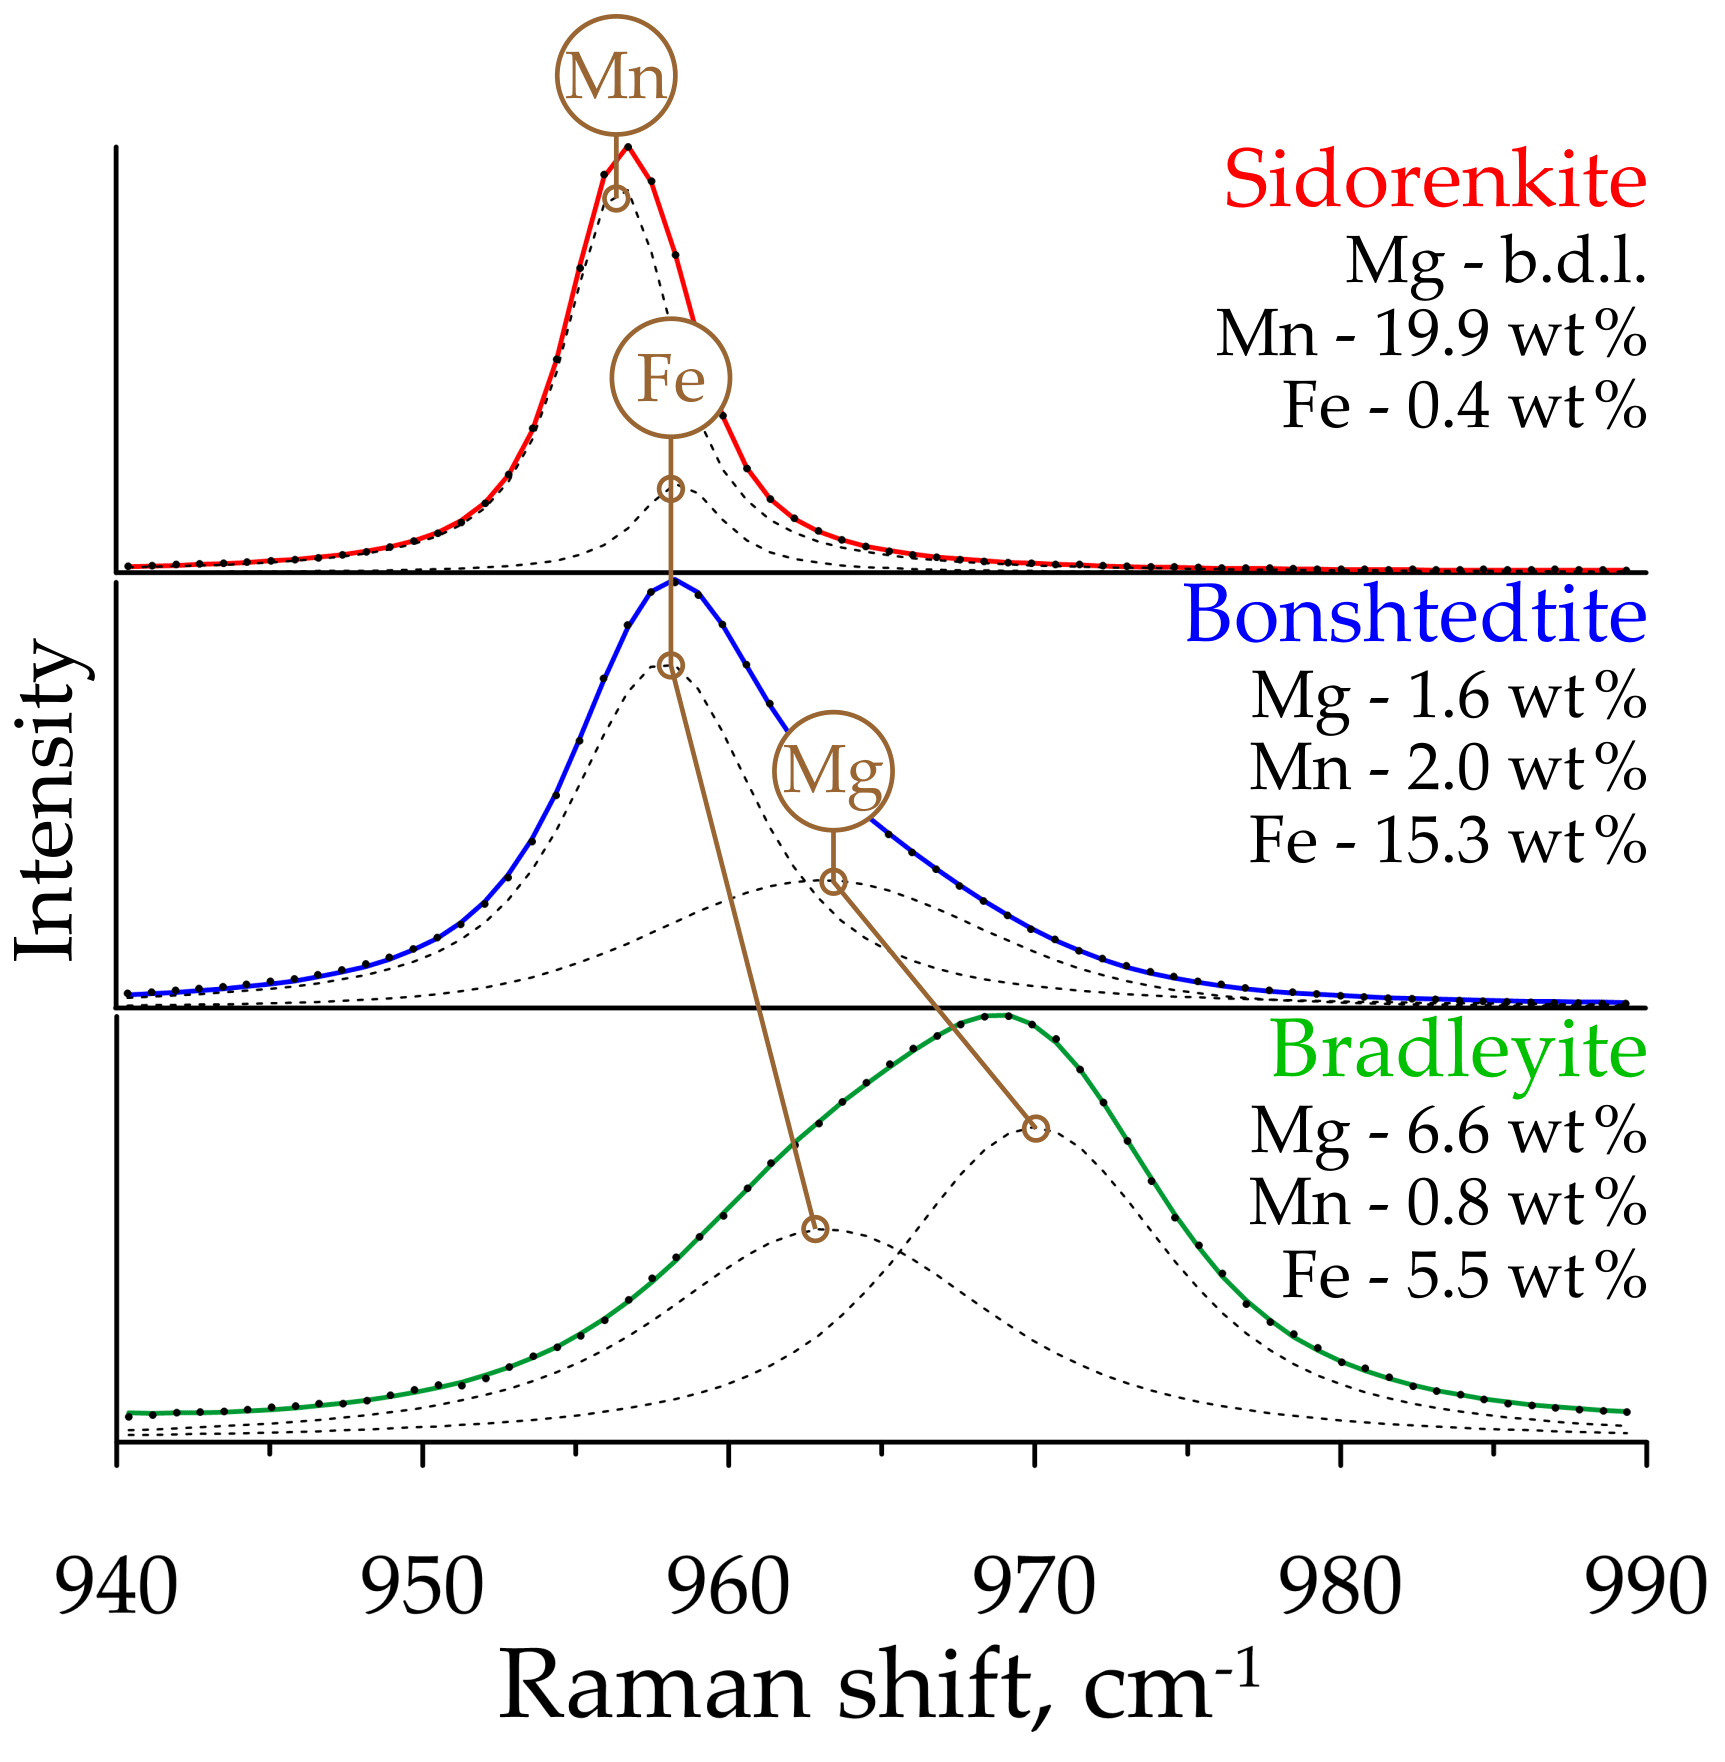
Figure 7Decomposition of the main peak of the υ1(P–O) band in the Raman spectra of the studied carbonophosphates. Brown lines connect the modes from Mg, Fe, and Mn. The shown Mg, Fe, and Mn contents were obtained from the same points as the corresponding Raman spectra.
3.2.3 Bending modes of the [PO4]3− and [CO3]2− groups in the spectral range from 400 to 800 cm−1
As mentioned above, out-of-plane (υ2) and in-plane (υ4) bending modes from the [PO4]3− and [CO3]2− groups occur in the 400–800 cm−1 spectral range of carbonophosphates (Amaral et al., 2019; Frost et al., 2015). Frost et al. (2015) indicated that the peaks at 414 and 469 cm−1 correspond to υ2(P–O) and the peak at 579 cm−1 corresponds to υ4(P–O). The positions of the [PO4]3− group modes point to a similarity to the Raman spectrum of the vivianite mentioned above (Piriou and Poullen, 1984). The spectrum of vivianite contains two peaks with wavenumbers close to 458 and 425 cm−1 attributed to υ2(P–O), as well as four peaks at 539, 572, 580, and 620 cm−1 attributed to υ4(P–O). In the spectra of carbonophosphates, the peaks of the υ2(P–O) band occupy positions at 420±7 cm−1 and 465±13 cm−1, and the peaks of the υ4(P–O) band are located at 583±6 and 624±1 cm−1 (Fig. 8). Frost et al. (2015) also emphasized the absence of the υ2(C–O) band around 800 cm−1, which is also typical of most carbonates (Frezzotti et al., 2012), except for cerussite and aragonite. In the spectra of carbonophosphates, we also did not observe these peaks (see Fig. 5). This phenomenon suggests that the [CO3]2− groups do not change the symmetry in the structure of the considered minerals relative to the free state (Chukanov and Vigasina, 2020). The υ4(C–O) band splits into two peaks with wavenumbers 694 and 725±6 cm−1. The second peak in some bradleyite spectra overlaps with an additional (sometimes more intense) peak positioned at 747 cm−1 (Fig. 8c). The latter peak correlates in intensity with the previously described peak at a frequency of 927 cm−1 (see Sect. 3.2.2).
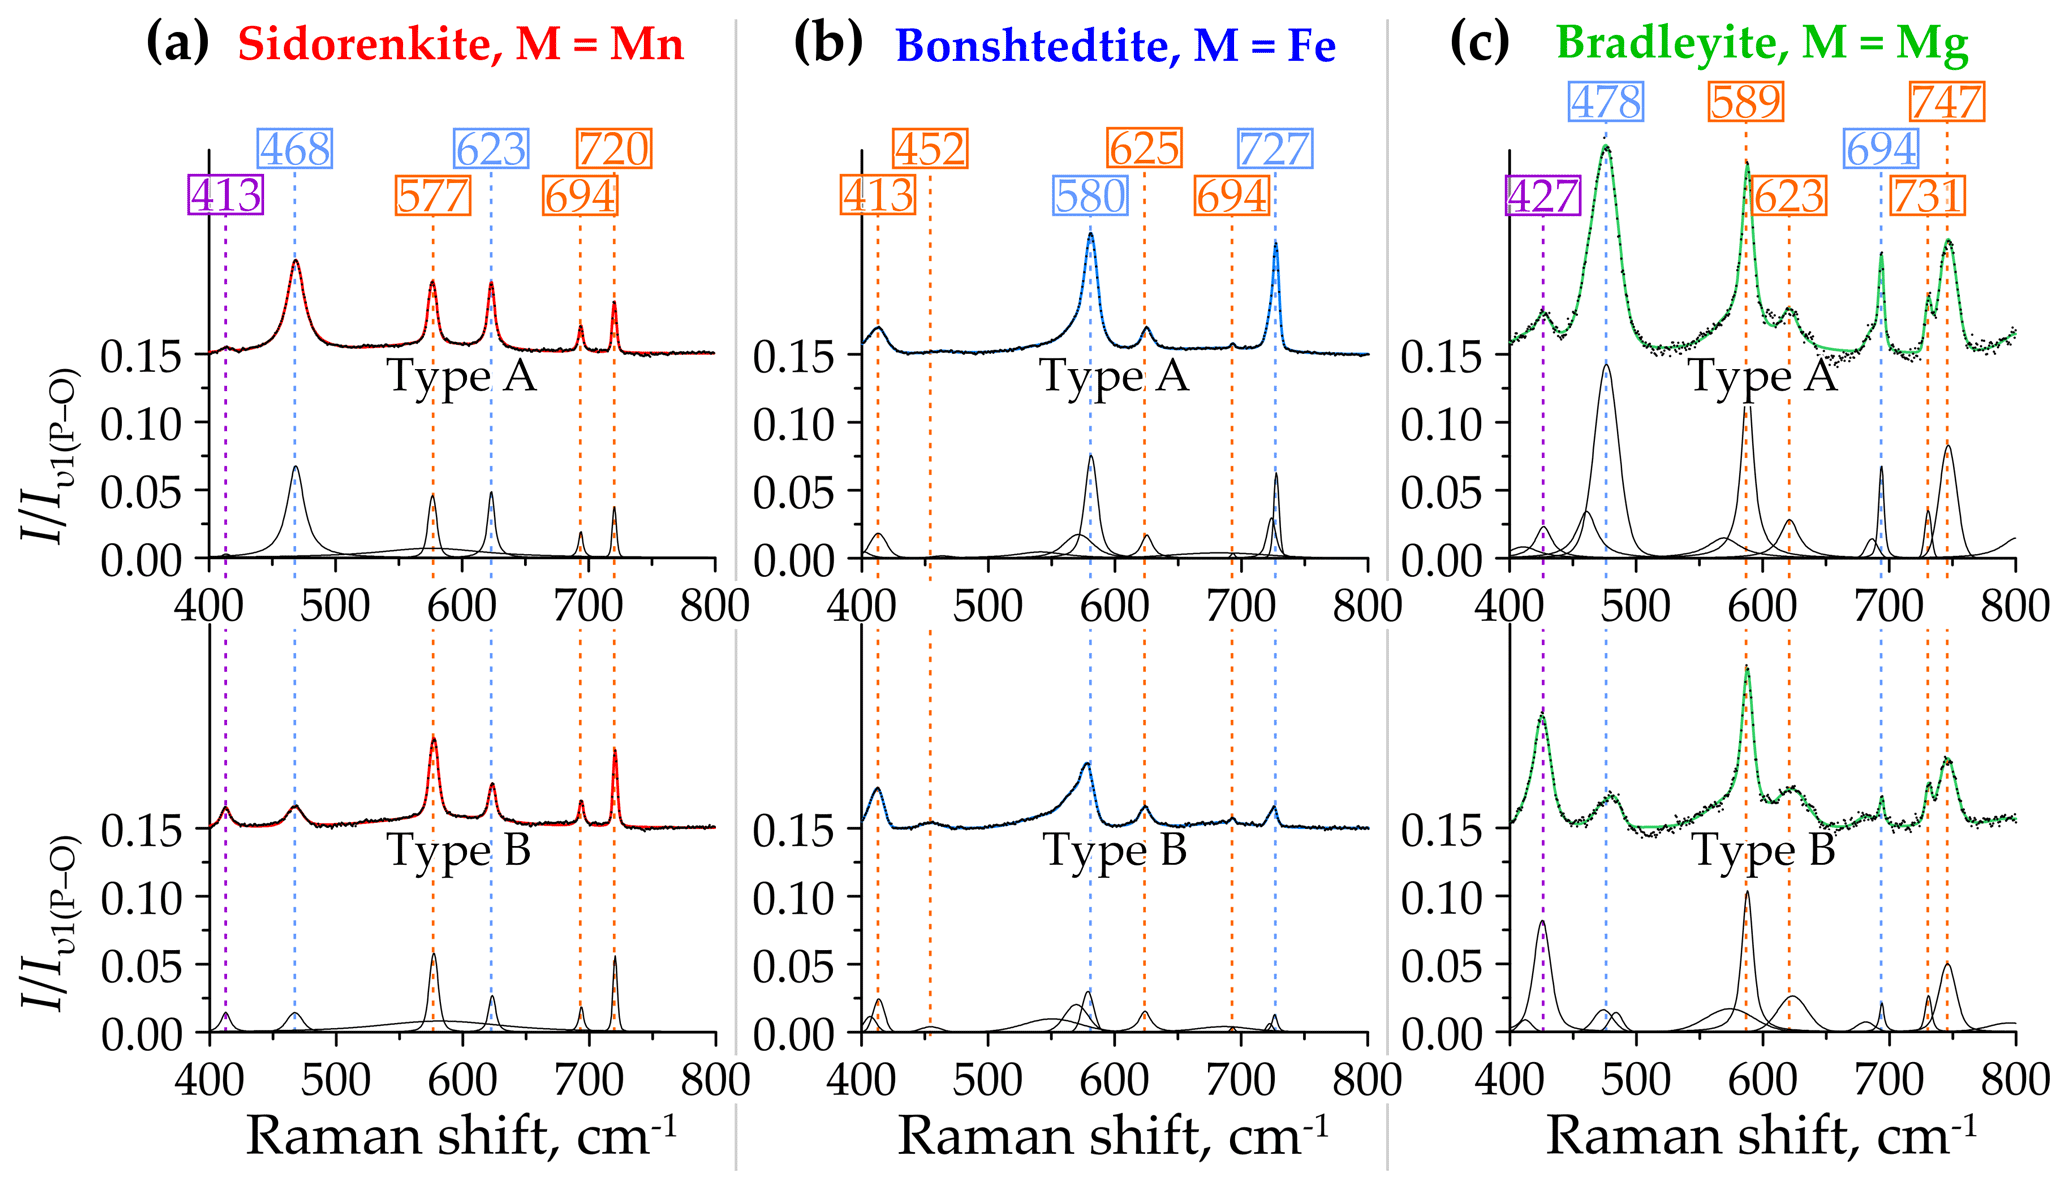
Figure 8Decomposition of type-A (top halves) and type-B (bottom halves) Raman spectra of (a) sidorenkite, (b) bonshtedtite, and (c) bradleyite in the spectral range of 400–800 cm−1. The intensity value is normalized to the intensity of the main peak of the υ1(P–O) band.
Over the entire range from 400 to 800 cm−1, the peak intensities are 0.1 or less compared to the main peak of the υ1(P–O) band. Only in the type-A spectra bradleyite do they sometimes reach 0.15. When passing from type A to type B, the intensity of most peaks either remains almost unchanged or drops sharply. We observed an intensity decrease for the peaks at 468 and 623 cm−1 in sidorenkite spectra (Fig. 8a), at around 580 and 727 cm−1 in bonshtedtite spectra (Fig. 8b), and at 478 and 694 cm−1 in the spectra of bradleyite (Fig. 8c). The exception is the peak at 427 cm−1 from υ2(P–O) in the bradleyite spectra (Fig. 8c), which is 3 times higher in spectra B than in spectra A. Most bands are quite asymmetric in the spectra of bonshtedtite and bradleyite, which contain abundant impurities (see Fig. 8b, c). They all show splitting, probably for the same reason as that given for the υ1(P–O) and υ1(C–O) bands (see Sect. 3.2.2).
In total, the profiles of the Raman spectra of carbonophosphates in the considered range are generally similar. An unusually small peak at 450 cm−1 from the υ2(P–O) mode distinguishes the bonshtedtite spectrum. The bradleyite spectra exhibit some peak shifts and slightly higher relative peak intensities than other carbonophosphates. Compared to type-B spectra, type-A spectra have a more prominent relief in this range.
3.2.4 Lattice modes in the spectral range from 70 to 350 cm−1
The spectral range between 70 and 350 cm−1 contains the maximum number of peaks, which occur close to each other. In this study, we considered such characteristics of the most prominent bands as the position and intensity variations between the A and B spectra. The asymmetry of these peaks was not assessed.
Sidorenkite yields eight distinct peaks in the spectra of both type A and type B in this range. These peaks have the following wavenumbers: 91, 100, 110, 156, 176, 201, 250, and 295 cm−1 (Fig. 9a). The type-B spectra are generally more elevated due to peak growth at 100, 156, and 201 cm−1. Of the listed peaks in the type-A spectra, the maximums are 110 and 176 cm−1, while in the type-B spectra, the maximum is 156 cm−1. In all the spectra of sidorenkite, these peaks are in third place in intensity after the main peaks of the υ1(P–O) and υ1(C–O) bands (about 0.10–0.15 high from the main peak of the υ1(P–O) band).

Figure 9Decomposition of type-A (top halves) and type-B (bottom halves) Raman spectra of (a) sidorenkite, (b) bonshtedtite, and (c) bradleyite in the spectral range of 70–350 cm−1. The intensity value is normalized to the intensity of the main peak of the υ1(P–O) band.
Bonshtedtite has nine distinct peaks in the type-A spectra and only seven peaks in the type-B spectra (Fig. 9b). Peaks at 99, 130, 157, 181, 208, 255, and 295 cm−1 are common. The latter is very broad and is the sum of an intense peak at 295 cm−1 and an additional peak of lower intensity at 279 cm−1. In the type-A spectra, additional peaks were observed at 92 and 113 cm−1. With a change in the crystallographic orientation, their intensity sharply decreases. Eventually, they overlap with the neighboring peak at 99 cm−1. As the spectra change towards type B, the peak at 130 cm−1 also decreases, while almost all other peaks increase. As a result, the type-B spectra show a total intensity of lattice modes that is higher than that of the type-A spectra. Of all peaks considered here, the highest is the one at 157 cm−1. This peak is the third most intense in the Raman spectra of bonshtedtite and 3–4 times less intense than the main peak of the υ1(P–O) band.
For bradleyite, nine pronounced peaks were found in the type-A spectra and eight in the type-B spectra (Fig. 9c). Common are peaks at 95, 104, 114, 158, 194, 215, 259, and 295 cm−1. Like spectra of other carbonophosphates, those of bradleyite in the range of 70–350 cm−1 show a general increase in peak intensity as they approach type B. Only the peak at 95 cm−1 decreases in intensity, while the peaks at 104, 158, and 215 cm−1 increase significantly. Throughout the full Raman spectra of bradleyite, the peaks at 158 and 215 cm−1 rank third in intensity after the main peaks of the υ1(P–O) and υ1(C–O) bands, and in the range under consideration, they are maximal. This is valid for both A and B spectra types. The peak at 134 cm−1 is prominent in the A spectra but hardly distinguishable in the B spectra due to the increased peak at 158 cm−1. Also, several collected spectra showed a peak at 328 cm−1, independent of type A or B. It correlates with the specific additional peak at 927 cm−1 discussed above (see Sect. 3.2.2).
Thus, the profiles of the Raman spectra of carbonophosphates in the considered range have much in common. They primarily differ due to the shift in the frequencies of many peaks. Another notable difference is the lower relative intensity of peaks in sidorenkite spectra compared to other carbonophosphates. Type-B spectra are preferable for studying this range.
3.2.5 Diagnostics of carbonophosphates by Raman spectra
The results obtained from the conducted Raman investigation are summarized in Table 2. Let us now analyze these results to create an algorithm for Raman diagnostics of carbonophosphate phases.
Raman spectroscopy provides reliable determination of the belonging of an unknown mineral to the carbonophosphate group. Minerals that show two intense bands in the spectral range of 950–1100 cm−1 are rare (Frezzotti et al., 2012). A search in the RRUFF Raman database using the CrystalSleuth software (Lafuente et al., 2015) showed that only a few minerals (mainly phosphates, e.g., tinticite, bobierrite, and baricite) have peaks in this region that are comparable in intensity with the type-B spectra of the studied carbonophosphates. Peaks in this range are typical of several minerals that contain both [PO4]3− and [CO3]2− groups: devitoite (Kampf et al., 2010), ramikite-(Y) (McDonald et al., 2013), and skorpionite (Krause et al., 2008). However, the studied carbonophosphates differ from these minerals in the position and intensity of other peaks in the Raman spectrum. It is more difficult to distinguish between them.
Table 2Main Raman vibrations (cm−1) of the synthetic and natural carbonophosphates.
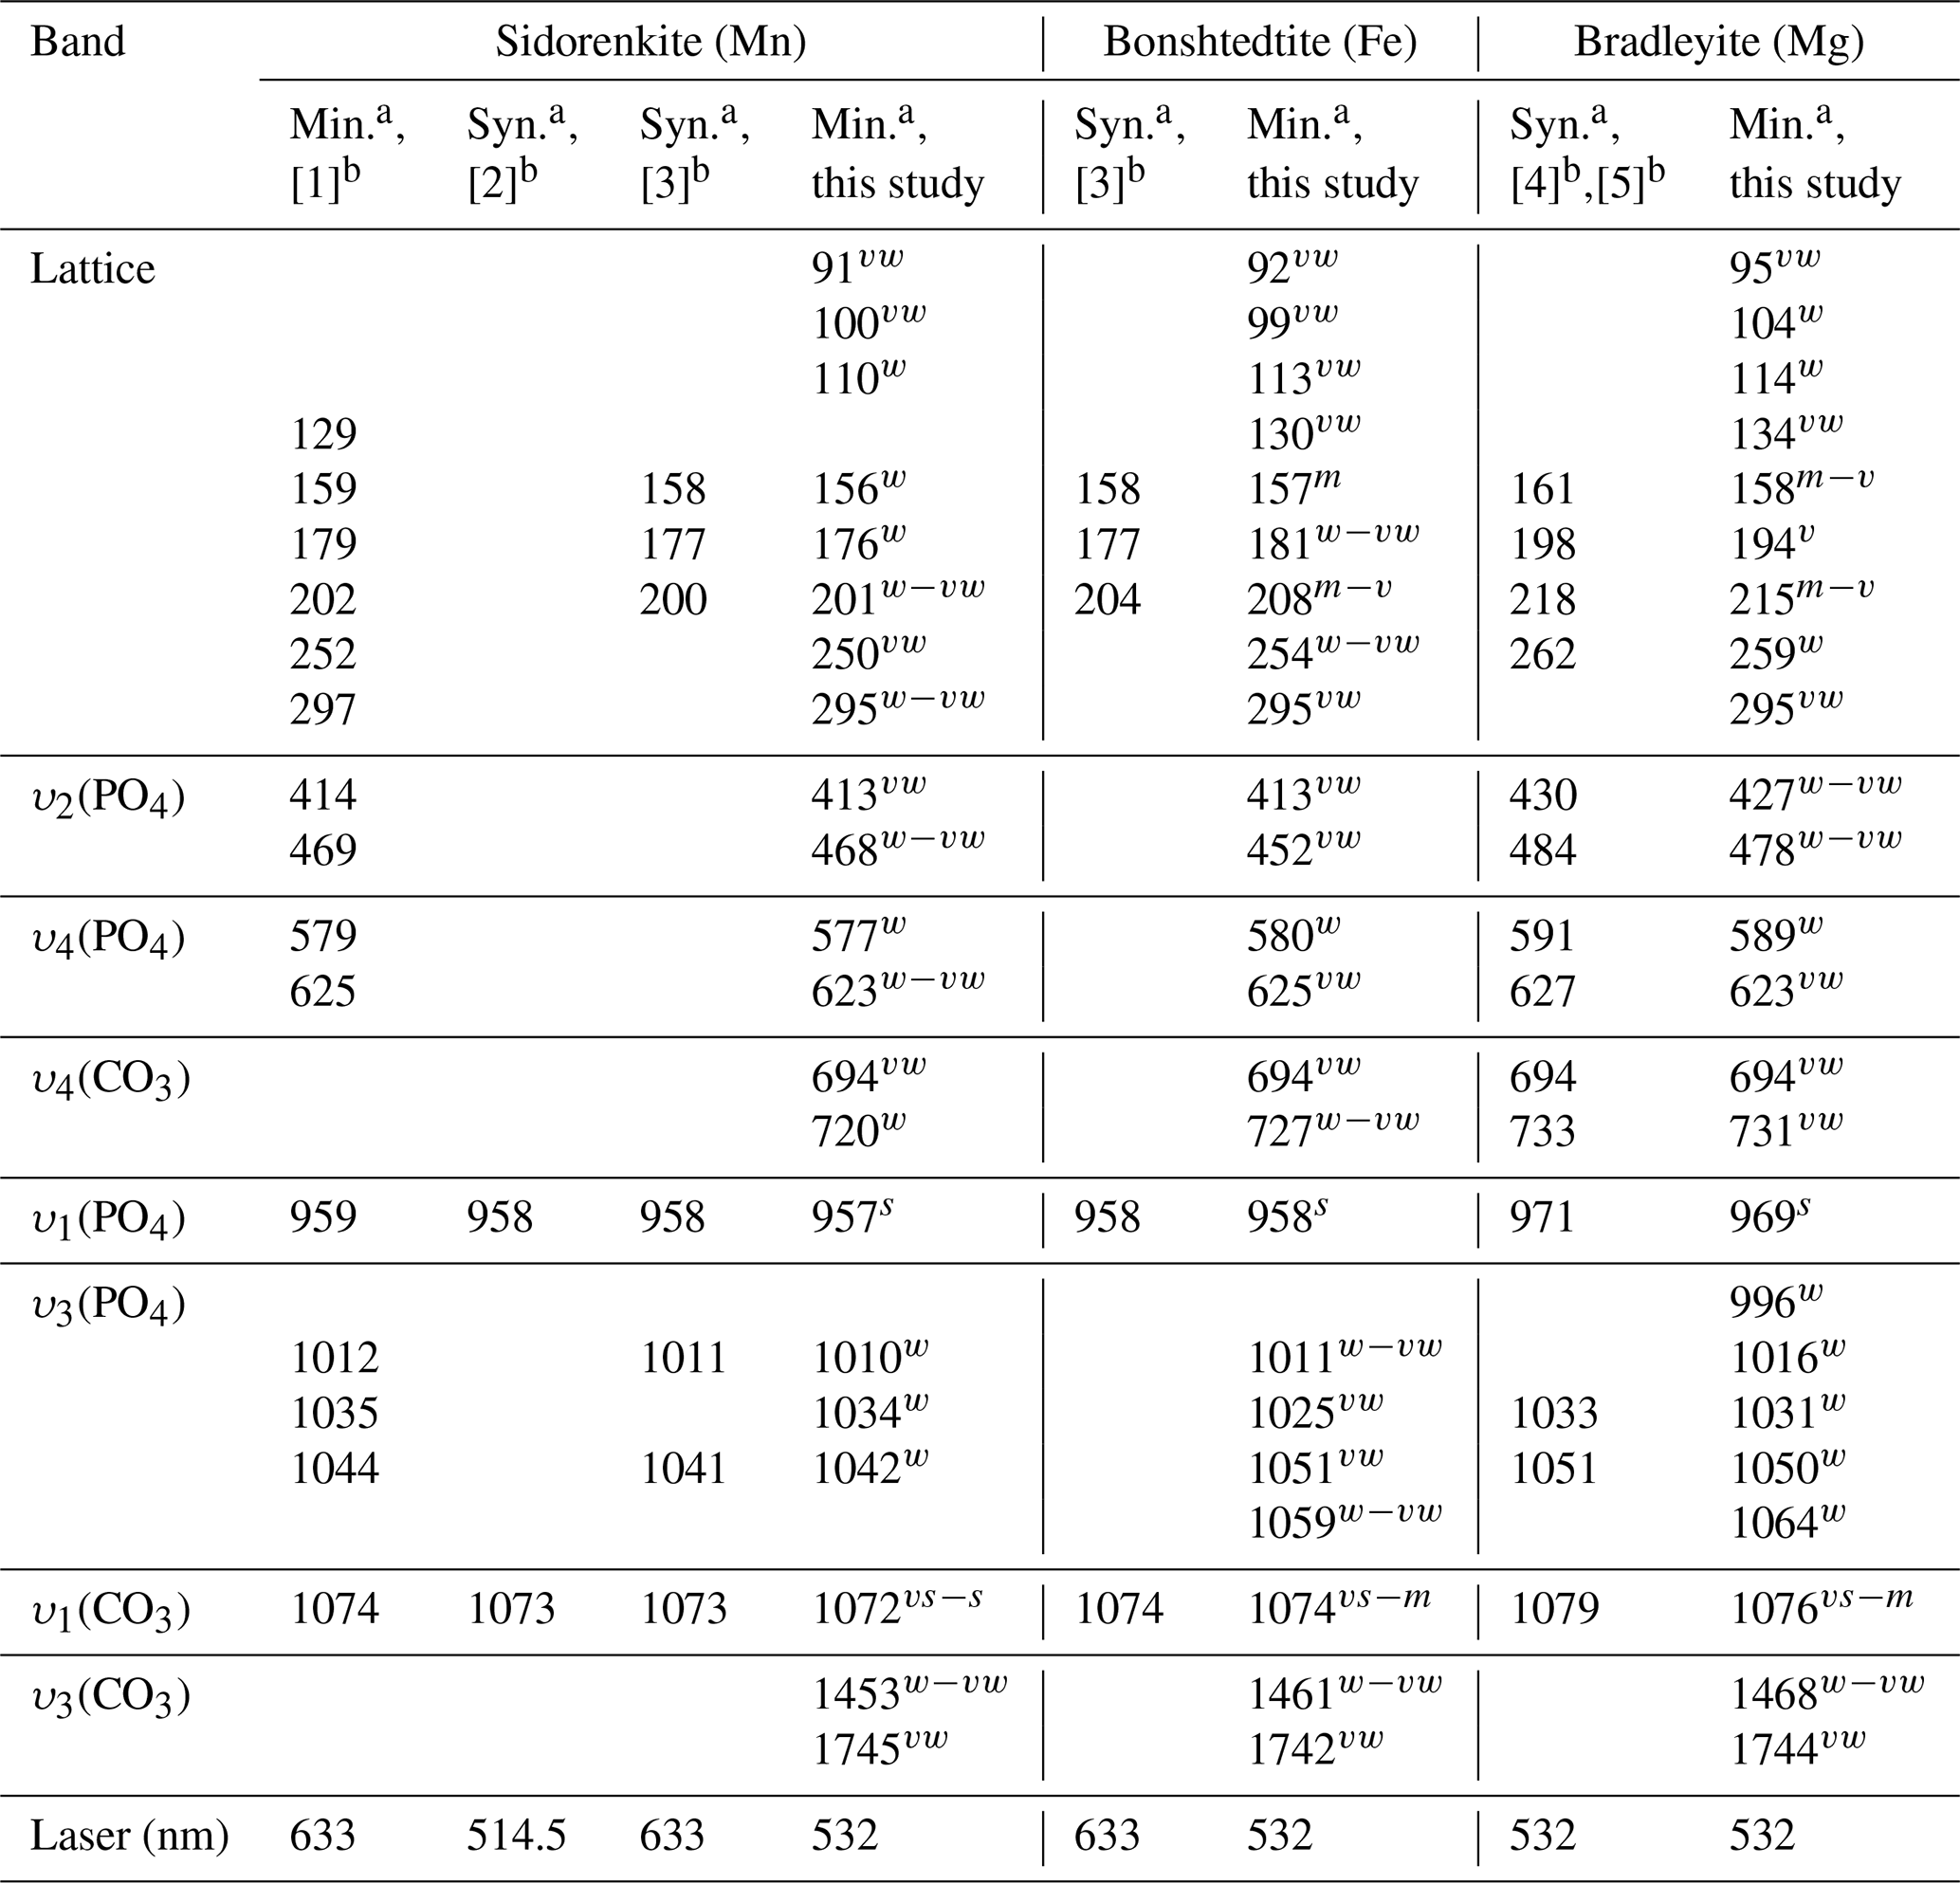
a Min.: natural mineral; Syn.: synthetic compound. b References: [1] Frost et al. (2015), [2] Gao et al. (2018), [3] Amaral et al. (2019), [4] Gao et al. (2015), and [5] Chukanov and Vigasina (2020). The presented frequencies were observed in most spectra. Shoulder frequencies are omitted.
By the position of the main peaks from υ1(P–O) and υ1(C–O) modes, sidorenkite and bonshtedtite spectra overlap within the resolution of the most commonly used Raman spectrometers. Concerning this characteristic, bradleyite stands out, whose bands have a significantly higher frequency. When comparing the results of our study of natural bradleyite with impurities and a synthetic chemically pure compound (see Table 2), we found that the closer bradleyite is to the ideal formula, the higher the frequency. The studied carbonophosphates differ from each other in the number of peaks between the υ1(P–O) and υ1(C–O) bands at frequencies of 964±5 and 1074±3 cm−1, respectively (see Fig. 6). However, Raman diagnostics of carbonophosphates are often used when studying microinclusions in minerals of carbonatites and kimberlites. In these rocks, the overlap of carbonophosphate peaks with the peaks of host minerals and phases coexisting in the inclusion is highly probable. Apatite, monazite, baryte, xenotime, celestine, zircon, diopside, pargasite, and witherite are common in carbonatites and kimberlites. The most intense bands in their spectra range from 970 to 1080 cm−1 (Hurai et al., 2015). The prominent bands of typical phases found in fluid inclusions are also located there. These are sulfate and carbonate ions, arcanite, thenardite, anhydrite, gregoryite, nahcolite, shortite, gaylussite, and others (Hurai et al., 2015). Thus, diagnostics by the peaks between the υ1(P–O) and υ1(C–O) bands can be successful only if it is possible to collect the reference spectrum of “pure” carbonophosphate and this is not complicated by extraneous peaks of neighboring minerals.
Additional information was obtained by analyzing the spectral ranges of 400–800 and 70–350 cm−1. A peak at 725±6 cm−1 should be noted in the former region, as it shifts markedly in the sidorenkite–bonshtedtite–bradleyite series (see Fig. 8, Table 2). In the range of 70–350 cm−1, the positions of three peaks differ significantly between the carbonophosphate phases: 185±9, 208±7, and 255±5 cm−1 (see Table 2). For the correct analysis of these peaks, the sample should be rotated until type-B Raman spectra are obtained with (see Fig. 9).
This study has shown the presence of 21 to 24 bands in the Raman spectra of carbonophosphates with the general formula Na3MCO3PO4 (M is Mn, Fe, and Mg). The two most prominent peaks are parts of bands assigned to the υ1(P–O) and υ1(C–O) stretching modes and are positioned at 964±5 and 1074±3 cm−1, respectively. The υ1(P–O) band has a stable intensity, and the υ1(C–O) band depends on the crystallographic orientation. It was also found that these bands split into a doublet of peaks, which is the result of isomorphism. We propose the following diagnostic algorithm for the sidorenkite–bonshtedtite–bradleyite carbonophosphate series:
-
Examine whether the prominent bands and Raman spectral profile of the tested mineral is characteristic of carbonophosphates (see Fig. 3).
-
Estimate the shift in the main bands in order to check if the tested mineral is bradleyite (see Figs. 6 and 7).
-
Diagnose a mineral up to a species level by analyzing the peaks concentrated between the main bands, provided that the spectrum contains no extraneous peaks (see Fig. 6).
-
Validate diagnosis by the position of the peaks at 185±9, 208±7, 255±5, and 725±6 cm−1 (see Table 2).
The proposed algorithm allows for Raman diagnostics of carbonophosphates in microinclusions even without EDX data. Diagnostics of carbonophosphate phases provide critical petrological information to investigate carbonatites, kimberlites, and other rocks.
All data derived from this research are presented in the enclosed tables and figures. Mineral compositions (EDX) and Raman raw data with spectral artifacts are available in the Supplement.
The supplement related to this article is available online at: https://doi.org/10.5194/ejm-33-283-2021-supplement.
MYS and ENK collected the rock samples and studied the microscopic features. VNB and ENK acquired Raman data. NSV and VVS conducted the EDX and EBSD analysis. ENK, ENF, and VNB contributed to the experimental strategy and interpretations. ENK and ENF designed the research, wrote the article, and finalized the submission. All authors have approved the submitted version.
The authors declare that they have no conflict of interest.
This research has been supported by the Russian Science Foundation (grant no. 19-77-10039) and the Russian Academy of Sciences (grant no. 0226-2019-0053).
This paper was edited by Giuseppe Cruciani and reviewed by two anonymous referees.
Abersteiner, A., Giuliani, A., Kamenetsky, V. S., and Phillips, D.: Petrographic and melt-inclusion constraints on the petrogenesis of a magmaclast from the Venetia kimberlite cluster, South Africa, Chem. Geol., 455, 331–341, https://doi.org/10.1016/j.chemgeo.2016.08.029, 2017.
Abersteiner, A., Kamenetsky, V. S., Kamenetsky, M., Goemann, K., Ehrig, K., and Rodemann, T.: Significance of halogens (F, Cl) in kimberlite melts: Insights from mineralogy and melt inclusions in the Roger pipe (Ekati, Canada), Chem. Geol., 478, 148–163, https://doi.org/10.1016/j.chemgeo.2017.06.008, 2018.
Abersteiner, A., Kamenetsky, V. S., Goemann, K., Giuliani, A., Howarth, G. H., Castillo-Oliver, M., Thompson, J., Kamenetsky, M., and Cherry, A.: Composition and emplacement of the Benfontein kimberlite sill complex (Kimberley, South Africa): Textural, petrographic and melt inclusion constraints, Lithos, 324–325, 297–314, https://doi.org/10.1016/j.lithos.2018.11.017, 2019.
Abersteiner, A., Kamenetsky, V. S., Goemann, K., Kjarsgaard, B. A., Rodemann, T., Kamenetsky, M., and Ehrig, K.: A genetic story of olivine crystallisation in the Mark kimberlite (Canada) revealed by zoning and melt inclusions, Lithos, 358–359, 105405–105405, https://doi.org/10.1016/j.lithos.2020.105405, 2020.
Afanasyev, B. V.: Mineral resources of the alkaline–ultramafic massifs of the Kola Peninsula, Roza Vetrov, St. Petersburg., 224 pp., 2011 (in Russian).
Amaral, I. R., Alencar, R. S., Paraguassu, W., Costa, D. A. S., Costa, L. A. C., Montoro, L. A., and Souza Filho, A. G.: Structural and vibrational properties of carbonophosphates: Na3MCO3PO4 (M = Mn, Fe, Co and Ni), Spectrochim. Acta. A. Mol. Biomol. Spectrosc., 223, 117298, https://doi.org/10.1016/j.saa.2019.117298, 2019.
Anenburg, M., Mavrogenes, J. A., Frigo, C., and Wall, F.: Rare earth element mobility in and around carbonatites controlled by sodium, potassium, and silica, Sci. Adv., 41, eabb6570, https://doi.org/10.1126/sciadv.abb6570, 2020.
Bryant, R. N., Pasteris, J. D., and Fike, D. A.: Variability in the Raman Spectrum of Unpolished Growth and Fracture Surfaces of Pyrite Due to Laser Heating and Crystal Orientation, Appl. Spectrosc., 72, 37–47, https://doi.org/10.1177/0003702817736516, 2018.
Chakhmouradian, A. R. and Zaitsev, A. N.: Calcite – amphibole – clinopyroxene rock from the Afrikanda, Kola Peninsula, Russia: Mineralogy and a possible link to carbonatites. III. Silicate minerals, Can. Mineral., 40, 1347–1374, https://doi.org/10.2113/gscanmin.40.5.1347, 2002.
Chen, H., Hautier, G., and Ceder, G.: Synthesis, Computed Stability, and Crystal Structure of a New Family of Inorganic Compounds: Carbonophosphates, J. Am. Chem. Soc., 134, 19619–19627, https://doi.org/10.1021/ja3040834, 2012a.
Chen, H., Hautier, G., Jain, A., Moore, C., Kang, B., Doe, R., Wu, L., Zhu, Y., Tang, Y., and Ceder, G.: Carbonophosphates: A New Family of Cathode Materials for Li-Ion Batteries Identified Computationally, Chem. Mater., 24, 2009–2016, https://doi.org/10.1021/cm203243x, 2012b.
Chukanov, V. N. and Vigasina, M. F.: Vibrational (Infrared and Raman) Spectra of Minerals and Related Compounds, Springer International Publishing, Cham, Switzerland, 1376 pp., https://doi.org/10.1007/978-3-030-26803-9, 2020.
Downes, H., Balaganskaya, E., Beard, A., Liferovich, R., and Demaiffe, D.: Petrogenetic processes in the ultramafic, alkaline and carbonatitic magmatism in the Kola Alkaline Province: A review, Lithos, 85, 48–75, https://doi.org/10.1016/j.lithos.2005.03.020, 2005.
Fahey, J. J. and Tunell, G.: Bradleyite, a new mineral, sodium phosphate-magnesium carbonate, Am. Minerogist, 26, 646–650, 1941.
Fleck, N., Hobson, T. D. C., Savory, C. N., Buckeridge, J., Veal, T. D., Correia, M. R., Scanlon, D. O., Durose, K., and Jäckel, F.: Identifying Raman modes of Sb2Se3 and their symmetries using angle-resolved polarised Raman spectra, J. Mater. Chem. A, 8, 8337–8344, https://doi.org/10.1039/D0TA01783C, 2020.
Freeman, J. J., Wang, A., Kuebler, K. E., Jolliff, B. L., and Haskin, L. A.: Characterization of natural feldspars by Raman spectroscopy for future planetary exploration, Can. Mineral., 46, 1477–1500, https://doi.org/10.3749/canmin.46.6.1477, 2008.
Frezzotti, M. L., Tecce, F., and Casagli, A.: Raman spectroscopy for fluid inclusion analysis, J. Geochem. Explor., 112, 1–20, https://doi.org/10.1016/j.gexplo.2011.09.009, 2012.
Frost, R. L., López, A., Scholz, R., Belotti, F. M., and Xi, Y.: A vibrational spectroscopic study of the anhydrous phosphate mineral sidorenkite Na3Mn(PO4)(CO3), Spectrochim. Acta. A. Mol. Biomol. Spectrosc., 137, 930–934, https://doi.org/10.1016/j.saa.2014.08.029, 2015.
Gao, J., Huang, W., Wu, X., Fan, D., Wu, Z., Xia, D., and Qin, S.: Compressibility of carbonophosphate bradleyite Na3Mg(CO3)(PO4) by X-ray diffraction and Raman spectroscopy, Phys. Chem. Miner., 42, 191–201, https://doi.org/10.1007/s00269-014-0710-0, 2015.
Gao, J., Huang, W., Wu, X., and Qin, S.: High pressure experimental studies on Na3Fe(PO4)(CO3) and Na3Mn(PO4)(CO3): Extensive pressure behaviors of carbonophosphates family, J. Phys. Chem. Solids, 115, 248–253, https://doi.org/10.1016/j.jpcs.2017.12.046, 2018.
Golovin, V. A., Sharygin, I. S., Kamenetsky, V. S., Korsakov, V. A., and Yaxley, G. M.: Alkali-carbonate melts from the base of cratonic lithospheric mantle: Links to kimberlites, Chem. Geol., 483, 261–274, https://doi.org/10.1016/j.chemgeo.2018.02.016, 2018.
Hautier, G., Jain, A., Chen, H., Moore, C., Ong, S. P., and Ceder, G.: Novel mixed polyanions lithium-ion battery cathode materials predicted by high-throughput ab initio computations, J. Mater. Chem., 21, 17147, https://doi.org/10.1039/c1jm12216a, 2011.
Huang, W., Zhou, J., Li, B., Ma, J., Tao, S., Xia, D., Chu, W., and Wu, Z.: Detailed investigation of Na2.24FePO4CO3 as a cathode material for Na-ion batteries, Sci. Rep.-UK, 4, 1–8, https://doi.org/10.1038/srep04188, 2014.
Hurai, V., Huraiová, M., Slobodník, M., and Thomas, R.: Appendix V – Raman Bands Sorted by Vibrations, in: Geofluids: Developments in Microthermometry, Spectroscopy, Thermodynamics and Stable Isotopes, Elsevier, 369–418, https://doi.org/10.1016/B978-0-12-803241-1.09973-1, 2015.
Kamenetsky, V. S., Grütter, H., Kamenetsky, M. B., and Gömann, K.: Parental carbonatitic melt of the Koala kimberlite (Canada): Constraints from melt inclusions in olivine and Cr-spinel, and groundmass carbonate, Chem. Geol., 353, 96–111, https://doi.org/10.1016/j.chemgeo.2012.09.022, 2013.
Kamenetsky, V. S., Golovin, V. A., Maas, R., Giuliani, A., Kamenetsky, M. B., and Weiss, Y.: Towards a new model for kimberlite petrogenesis: Evidence from unaltered kimberlites and mantle minerals, Earth-Sci. Rev., 139, 145–167, https://doi.org/10.1016/j.earscirev.2014.09.004, 2014.
Kampf, A. R., Rossman, G. R., Steele, I. M., Pluth, J. J., Dunning, G. E., and Walstrom, R. E.: Devitoite, a new heterophyllosilicate mineral with astrophyllite-like layers from eastern Fresno County, California, Can. Mineral., 48, 29–40, https://doi.org/10.3749/canmin.48.1.29, 2010.
Kharbish, S., Libowitzky, E., and Beran, A.: The effect of As-Sb substitution in the Raman spectra of tetrahedrite-tennantite and pyrargyrite-proustite solid solutions, Eur. J. Mineral., 19, 567–574, https://doi.org/10.1127/0935-1221/2007/0019-1737, 2007.
Khomyakov, A. P.: Sidorenkite, Na3Mn(PO4)(CO3), a new mineral, Int. Geol. Rev., 22, 811–814, https://doi.org/10.1080/00206818209466941, 1980.
Khomyakov, A. P.: Bonshtedtite, Na3Fe(PO4)(CO3) – a new mineral, Int. Geol. Rev., 25, 368–372, https://doi.org/10.1080/00206818309466713, 1983.
Khomyakov, A. P., Semenov, E. I., Kazakova, M. E., and Shumyatskaya, N. G.: Sidorenkite, Na3Mn(PO4)(CO3), a new mineral, Zap. Vsesoyuznogo Mineral. Obshchestva, 108, 56–59, 1979 (in Russian).
Khomyakov, A. P., Aleksandrov, V. V, Krasnova, N. I., Ermilov, V. V., and Smolyaninova, N. N.: Bonshtedtite, Na3Fe(PO4)(CO3), a new mineral, Zap. Vsesoyuznogo Mineral. Obshchestva, 111, 486–490, 1982 (in Russian).
Kolesov, B. A., Geiger, C. A., and Armbruster, T.: The dynamic properties of zircon studied by single-crystal X-ray diffraction and Raman spectroscopy, Eur. J. Mineral., 13, 939–948, https://doi.org/10.1127/0935-1221/2001/0013-0939, 2001.
Kosova, V. N. and Shindrov, A. A.: Na3FePO4CO3 as a cathode for hybrid-ion batteries – study of Na+/Li+ electrochemical exchange, Ionics, 25, 5829–5838, https://doi.org/10.1007/s11581-019-03128-9, 2019.
Kramm, U., Kogarko, L. N., Kononova, V. A., and Vartiainen, H.: The Kola Alkaline Province of the CIS and Finland: Precise Rb-Sr ages define 380–360 Ma age range for all magmatism, Lithos, 30, 33–44, https://doi.org/10.1016/0024-4937(93)90004-V, 1993.
Krause, W., Effenberger, H., Bernhardt, H.-J., and Medenbach, O.: Skorpionite, Ca3Zn2(PO4)2CO3(OH)2•H2O, a new mineral from Namibia: description and crystal structure, Eur. J. Mineral., 20, 271–280, https://doi.org/10.1127/0935-1221/2008/0020-1789, 2008.
Krivovichev, V. S., Chernyatieva, A. P., Britvin, S. N., Yakovenchuk, V. N., and Krivovichev, V. G.: Refinement of the crystal structure of bonshtedtite, Na3Fe(PO4)(CO3), Geol. Ore Depos., 55, 669–675, https://doi.org/10.1134/S1075701513080060, 2013.
Lafuente, B., Downs, R. T., Yang, H., and Stone, N.: The power of databases: The RRUFF project, in: Highlights in Mineralogical Crystallography, edited by: Armbruster, T. and Danisi, R. M., DE GRUYTER, Berlin, 1–30, https://doi.org/10.1515/9783110417104-003, 2015.
Litasov, K. D. and Podgornykh, N. M.: Raman spectroscopy of various phosphate minerals and occurrence of tuite in the Elga IIE iron meteorite: Raman spectroscopy of various phosphate minerals, J. Raman Spectrosc., 48, 1518–1527, https://doi.org/10.1002/jrs.5119, 2017.
Loh, E.: Optical vibrations in sheet silicates, J. Phys. C Solid State Phys., 6, 1091–1104, https://doi.org/10.1088/0022-3719/6/6/022, 1973.
McDonald, A. M., Back, M. E., Gault, R. A., and Horváth, L.: Peatite-(Y) and ramikite-(Y), two new Na-Li-Y ± Zr phosphate-carbonate minerals from the Poudrette pegmatite, Mont Saint-Hilaire, Quebec, Can. Mineral., 51, 569–596, https://doi.org/10.3749/canmin.51.4.569, 2013.
Momma, K. and Izumi, F.: VESTA3 for three-dimensional visualization of crystal, volumetric and morphology data, J. Appl. Crystallogr., 44, 1272–1276. https://doi.org/10.1107/s0021889811038970, 2011.
Piriou, B. and Poullen, J. F.: Raman study of vivianite, J. Raman Spectrosc., 15, 343–346, https://doi.org/10.1002/jrs.1250150510, 1984.
Pye, C. C. and Rudolph, W. W.: An ab Initio, Infrared, and Raman Investigation of Phosphate Ion Hydration, J. Phys. Chem. A, 107, 8746–8755, https://doi.org/10.1021/jp035594h, 2003.
Sharygin, V. V. and Doroshkevich, A. G.: Mineralogy of secondary olivine-hosted inclusions in calcite carbonatites of the Belaya Zima alkaline complex, Eastern Sayan, Russia: Evidence for late-magmatic Na-Ca-rich carbonate composition, J. Geol. Soc. India, 90, 524–530, https://doi.org/10.1007/s12594-017-0748-y, 2017.
Tkhy, L. C. T., Nadezhina, T. N., Pobedimskaya, Ye. A., and Khomyakov, A. P.: The crystal-chemical characteristics of bradleyite, sidorenkite and bonshtedtite, Mineral. Zhurnal, 6, 79–84, 1984 (in Russian).
Tlili, A., Smith, D. C., Beny, J.-M., and Boyer, H.: A Raman microprobe study of natural micas, Mineral. Mag., 53, 165–179, https://doi.org/10.1180/minmag.1989.053.370.04, 1989.
Zaitsev, A. N., Sitnikova, M. A., Subbotin, V. V., Fernández-Suárez, J., and Jeffries, T. E.: Sallanlatvi Complex – a rare example of magnesite and siderite carbonatites, in: Phoscorites and Carbonatites from Mantle to Mine: the Key Example ofthe Kola Alkaline Province, edited by: Wall, F. and Zaitsev, A. N., Mineralogical Society of Great Britain and Ireland, London, UK, 201–245, https://doi.org/10.1180/MSS.10.07, 2004.