the Creative Commons Attribution 4.0 License.
the Creative Commons Attribution 4.0 License.
 | 01 Feb 2021
Anisotropic thermal transport properties of quartz: from −120 °C through the α–β phase transition
Frank R. Schilling
Thermal diffusivities of synthetic quartz single crystals have been measured between −120 and 800 ∘C using a laser flash method. At −120 ∘C, the lattice thermal diffusivities are D[001]=15.7(8) mm2 s−1 and D[100]=8.0(4) mm2 s−1 in the [001] and [100] directions, respectively. Between −80 and 560 ∘C, the temperature dependence is well approximated by a dependency (with n=1.824(29) and n=1.590(21) for the [001] and [100] directions), whereas for lower temperatures measured thermal diffusivities show smaller values. The anisotropy of the thermal diffusivity D[001]∕D[100] decreases linearly over T in α- and β-quartz, with a discontinuity at the α–β phase transition at ∘C. In the measured signal–time curves of α-quartz, an unusual radiative heat transfer is observed, which can be linked to the phase transition. However, the effect is already observed far below the actual transition temperature. The standard evaluation procedure insufficiently describes the behaviour and leads to an underestimation of the thermal diffusivity of ≥20 %. Applying a new semi-empirical model of radiation absorption and re-emission reproduces well the observed radiative heat transfer originating in the phase transition. In the β-quartz region, the radiative heat transfer is not influenced by the phase transition effect observed in α-quartz and for the thermal diffusivity evaluation common models for (semi)transparent samples can be used.
- Article
(3122 KB) - Full-text XML
-
Supplement
(420 KB) - BibTeX
- EndNote


Thermal transport properties such as thermal conductivity λ and thermal diffusivity D play an important role in understanding Earth's crust and mantle dynamics and their underlying processes (Čermák, 1982; Lenardic and Kaula, 1995). Furthermore, growing attention is given to a precise knowledge of heat transport in material sciences as well as in engineering (Taylor and Kelsic, 1986; Turner and Taylor, 1991). According to Fourier's law, the heat flux q is equal to the thermal conductivity λ of a material multiplied by the negative temperature gradient in one dimension:
The thermal conductivity quantifies the heat flow through a material. Comparable to chemical concentration equilibration through diffusion, thermal diffusivity D quantifies the temperature equilibration capability.
Thermal conductivity and thermal diffusivity are interrelated through the isobaric specific heat capacity cp and density ρ:
Comparable to the concept of diffusion in the kinetic gas theory, phononic (lattice) heat diffusion in solids is often approximated by (Debye, 1914; Berman, 1976; Kittel, 2005)
with the mean velocity of phonons v and their mean free path length l. Regarding insulated solids, phononic heat transport dominates at low temperatures (e.g. Shankland et al., 1979; Schilling, 1999; Gibert et al., 2005). In earlier studies, heat transfer was often solely related to acoustic phonons (Slack, 1965; Slack and Oliver, 1971; Roufosse and Klemens, 1974), whereas recent studies show that longitudinal and transverse optical phonons need to be taken into account (Hofmeister, 1999, 2006; Esfarjani et al., 2011). With increasing temperature and number of phonons, the phonon–phonon interactions, e.g. three-phonon Umklapp processes, increase (Peierls, 1929; Ross et al., 1984; Kittel, 2005), resulting in a temperature dependence of the thermal diffusivity frequently being approximated by (e.g. Eucken, 1911; Zoth and Haenel, 1988; Seipold, 1992; Clauser and Huenges, 1995)
Even though Fourier's law presumes length independence, heat transport can vary with specimen thicknesses, e.g. due to radiative transport mechanism for optically non-thick conditions (Hofmeister, 2019) and mode mixing effects (Hofmeister et al., 2007; Hofmeister, 2007). Thermal conductivity and thermal diffusivity of crystalline solids are directional, i.e. anisotropic, material properties (except for the cubic system) and can be described by a symmetric tensor of second rank (Nye, 1985).
Kanamori et al. (1968)Beck et al. (1978)Höfer and Schilling (2002)Branlund and Hofmeister (2007)Table 1Published data on thermal transport properties of single-crystal quartz in the [001] and [100] directions.
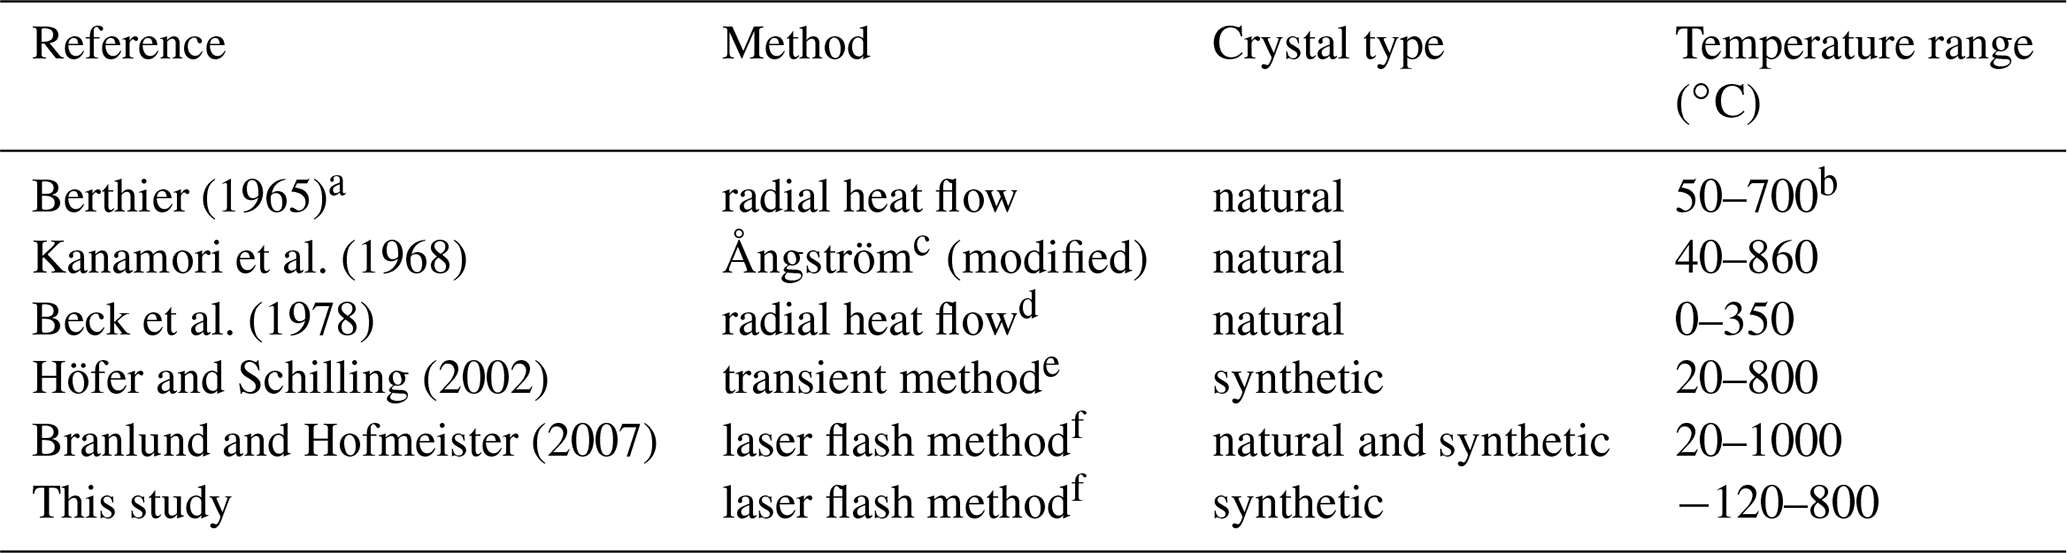
a Cited by Touloukian et al. (1973). b Only direction ⟂ [001] measured over the α–β phase transition up to 700 ∘C. c Carslaw and Jaeger (1959). d Extrapolated from 1.95 GPa (multi-anvil press), converted to D. e Schilling (1999). f Parker et al. (1961).
Quartz is one of the most abundant rock-forming minerals in the Earth's crust (Ronov and Yaroshevsky, 1969; Yaroshevsky and Bulakh, 1994). High geothermal gradients in the uppermost tenths of kilometres (Birch, 1955) demand a detailed knowledge about the thermal transport properties of its constituents (Buntebarth, 1984; Siegesmund, 1996). Thus, quartz plays an important role in developing and testing thermal transport models (Höfer and Schilling, 2002), and detailed information on the single-crystal thermal transport properties is required (Touloukian et al., 1973). In terms of its significance, also for technical applications, single-crystal thermal diffusivity data on quartz are still scarce and restricted to temperatures above 0 ∘C (Table 1). For higher temperatures, formerly reported thermal transport properties (Höfer and Schilling, 2002; Kanamori et al., 1968) contain both contact losses and spurious radiative gains as has been shown by Branlund and Hofmeister (2007).
At ambient pressure, α-quartz (P3221) undergoes a displacive phase transition to β-quartz (P6222) at ∘C (e.g. Le Chatelier, 1890; Bragg and Gibbs, 1925; Dolino, 1990). In the vicinity of the phase transition, an incommensurate phase is observed (Dolino, 1990). Already above ∼540 ∘C, i.e. >30 K below the phase transition, apparent changes of anelastic (thermal expansion) and elastic properties (e.g. elastic constants and therewith acoustic wave velocities) are observed (Raz et al., 2002; Klumbach and Schilling, 2014).
To the best of the authors' knowledge, no thermal diffusivity data of quartz below 0 ∘C have been published so far. Measurements in the [001] and [100] directions crossing the α–β phase transition were reported by different authors: Kanamori et al. (1968), Höfer and Schilling (2002) and Branlund and Hofmeister (2007). The trend of the thermal diffusivity around the α–β phase transition remains uncertain, as a crossover in the direction of maximum thermal diffusivity was reported by Höfer and Schilling (2002). Branlund and Hofmeister (2007) considered this behaviour to be possibly caused by specimen size (thickness) effects. The only data set not being potentially associated with known shortcomings of contact methods, e.g. thermal contact resistance effects (Lee and Hasselman, 1985; Hofmeister, 2007; Abdulagatov et al., 2015), is the one by Branlund and Hofmeister (2007). But with respect to that, Branlund and Hofmeister (2007) noted that the used “model of Mehling et al. (1998) fails to fit the measured signal–time curves near the transition”. The thermal diffusivity behaviour around the α–β phase transition therefore remains unclear.
Phononic heat transport decreases with increasing temperature, approximated by Eq. (5) for the case that all phonon modes are excited. However, this assumption is only valid for high temperatures. At low temperatures, phonon modes freeze out and affect the heat transport properties of the solid (Kittel, 2005). Thus, low-temperature data are of fundamental interest.
The aims of this study are to (1) present low-temperature behaviour of the heat transport in quartz; (2) better understand the thermal diffusivity behaviour through the α–β phase transition (including a possible crossover occurrence, Höfer and Schilling, 2002, and size effects, Hofmeister, 2019) – this requires a new approach to approximate the signal–time data for α-quartz measurements below the α–β phase transition compared to the model used by Branlund and Hofmeister (2007); and (3) review a proposed (Höfer and Schilling, 2002) strong correlation of the phonon velocity and the temperature dependence of the thermal diffusivity. Therefore, thermal diffusivity laser flash data on synthetic quartz single crystals have been collected between −120 and 800 ∘C in different crystallographic directions and at different sample thicknesses (2–10 mm, 10×10 mm cross section). The measurements furthermore allow us to better distinguish between phononic and radiative heat transfer.
2.1 Experimental setup
The thermal diffusivity is measured by laser flash method (Parker et al., 1961) using a Netzsch-Gerätebau MicroFlash laser flash apparatus (LFA) 457. A short (∼0.3 ms) laser pulse (12.7 mm diameter, approximately ∼1 J power output, 1064 nm, IR Sources Inc.) heats up one side of the specimen with thickness d, and the resulting (relative) temperature history is recorded on the opposite (rear) side using an infrared (IR) detector. For low-temperature measurements (–400 ∘C), a HgCdTe (mercury–cadmium–telluride; MCT) IR detector is used; for high T measurements between room temperature (RT) and 800 ∘C, an indium antimonide (InSb) detector is installed. Furnace temperatures are measured close to the specimen using a type-K thermocouple (class 1; DIN EN/IEC 60584-1, 2013). The chamber is continuously flushed with gaseous N2 (99.99 %) with a flow rate of 50 mL min−1. The temperature increase ΔT of the specimen rear side during one of the measurements is ≤1 K, and thermophysical properties () and density ρ are assumed to be constant within ΔT for each diffusivity determination. The used laser flash setup presumes the IR detector voltage outputs to be linear to the temperature increase during one measurement.
In laser flash (LFA) experiments on (semi)transparent insulating solids, three major processes influence the detected signal–time curve: adiabatic lattice (phononic) heat transport, fast radiative transport and heat loss to the surroundings (1–3 in Fig. 1). To isolate the phononic contribution to thermal transport, the signal–time curves (black line; Fig. 1) are approximated by a combination of the adiabatic model given by Parker et al. (1961) (dashed blue line; Fig. 1):
(Q absorbed heat pulse energy per unit area) with a custom heat loss model and a fast radiative portion (dotted orange and dash-dotted red line; Fig. 1). Heat loss from the surfaces of the specimen is approximated by subtracting a proportional temperature difference dTi, heat loss from the temperature Ti for each time interval Δt (Schilling, 1998; Höfer and Schilling, 2002):
with fitting constant h as the only free parameter. This approximation assumes 1-D heat flow and hence mainly heat losses from the front and rear surfaces. This approximation is well fulfilled for thin platelets. For thicker samples, 2-D effects may occur, e.g. if heat losses perpendicular to the assumed 1-D heat flow influence the observed signal.

Figure 1Signal–time curve (black line) measured at 550 ∘C in the laser flash apparatus using the InSb infrared detector. The detector signal (V) is assumed to scale linearly to the temperature. The fitted curve (thick grey line) is the result of a least-squares approximation of the adiabatic model by Parker et al. (1961) (1, dashed blue line) with a fast radiative portion (2, dash-dotted red line, Eq. 8, T≤573 ∘C) and subtracting heat loss from the specimen surface (3, dotted orange). The vertical dotted line denotes the release of the heating laser pulse. T0, rad corresponds to the direct radiative heat transfer at t=0.0 ms (Eq. 8). Tmax is referred to as the theoretical adiabatic maximum temperature of the specimen rear side by lattice (phononic) heat transfer (i.e. excluding heat losses of the sample).
Fitting fast direct radiative heat transfer is different for measurements at temperatures below and above the α–β phase transition (see Fig. 2c, d). For T≤573 ∘C, an absorption/re-emission approximation for semitransparent samples is applied. For T>573 ∘C, the ballistic (boundary-to-boundary) transfer is defined as portion of the fast temperature decrease of the specimen's front surface instantaneously heated by the laser. The corresponding temperature distribution is given in Parker et al. (1961) and in a good approximation represented by .
ti indicates the time steps. Constants approximated during the fit process are T0, which characterizes the initial height of the radiative portion (see inset Fig. 1), τ, which controls the magnitude of the temperature decrease, and b, which is an optional shift of the derived relative T signal. For measurements at temperatures below 150 ∘C, the radiative heat transfer is negligible (Fig. 2b).
Depending on the individual raw data, the signal–time curve is fitted to 5– (with ; Parker et al., 1961) by in-house software using the least-squares Levenberg–Marquardt algorithm (Levenberg, 1944; Marquardt, 1963). A pulse-time correction according to Breuer and Schilling (2019) is applied to each approximation. Thickness corrections with increasing T are applied using linear thermal expansion coefficients αL(T) for the [001] and [100] directions as given by Klumbach (2015) (based on Raz et al., 2002). Reported thermal diffusivities are the average of three independent measurements at the corresponding temperature. The experimental reproducibility is 2 %–3 %, while the accuracy is 5 %, confirmed by measurements on Pyroceram 9606, Inconel 600 and stainless-steel 310 standard samples. Uncertainties can be higher in the vicinity of phase transitions, e.g. due to a pronounced distortion of the signal–time curves (overlap of different heat transport processes) or by using very small (McMasters et al., 2017) and/or thick sample dimensions (Swank and Windes, 2014).
The temperature dependence of the thermal diffusivity D(T) of quartz below 550 ∘C is fitted using the empirical model proposed by Hofmeister et al. (2014) (T in K):
where the FT−G term describes the contribution of lattice phonons to heat transport and the rear high T term (HT) represents a contribution of bulk infrared phonon polaritons. Fitting constants are and H (≥0).
2.2 Samples
For the thermal diffusivity measurements, six 10×10 mm platelets with various thicknesses were prepared from one synthetic quartz single crystal in gem quality supplied by Maicom Quarz (in accordance with DIN EN/IEC 60758, 2016). The specimens were cut so that the direction perpendicular to the surface corresponds to the crystallographic [100] (i.e. a axis) and [001] (i.e. c axis) direction (Table 2), respectively. The angular deviations of the samples were proven by ultrasonic sound velocity measurements and are <1∘. The tabulated thicknesses were measured using a micrometer; the deviation from parallelism is ≤1∘. To reduce radiative heat transfer in LFA measurements (Hasselman and Merkel, 1989), all platelets were sputter coated with Au (99.99 %) using a Denton Vacuum LLC Desk V to ∼0.1 µm (according to the deposition rates given by the manufacturer). To ensure consistent laser pulse absorption (Cernuschi et al., 2002; Stryczniewicz et al., 2017) and to buffer oxygen fugacity at high T (Pertermann et al., 2008), specimens were coated with graphite spray (CRC Industries) of about ∼15 µm thickness per side. Platelet surfaces were slightly roughened to mitigate possible non-uniformity of the laser pulse absorption and to increase the adhesion of the coatings (Branlund and Hofmeister, 2007).
Table 2Specimens and measurement characteristics for the low- and high-temperature thermal diffusivity experiments.
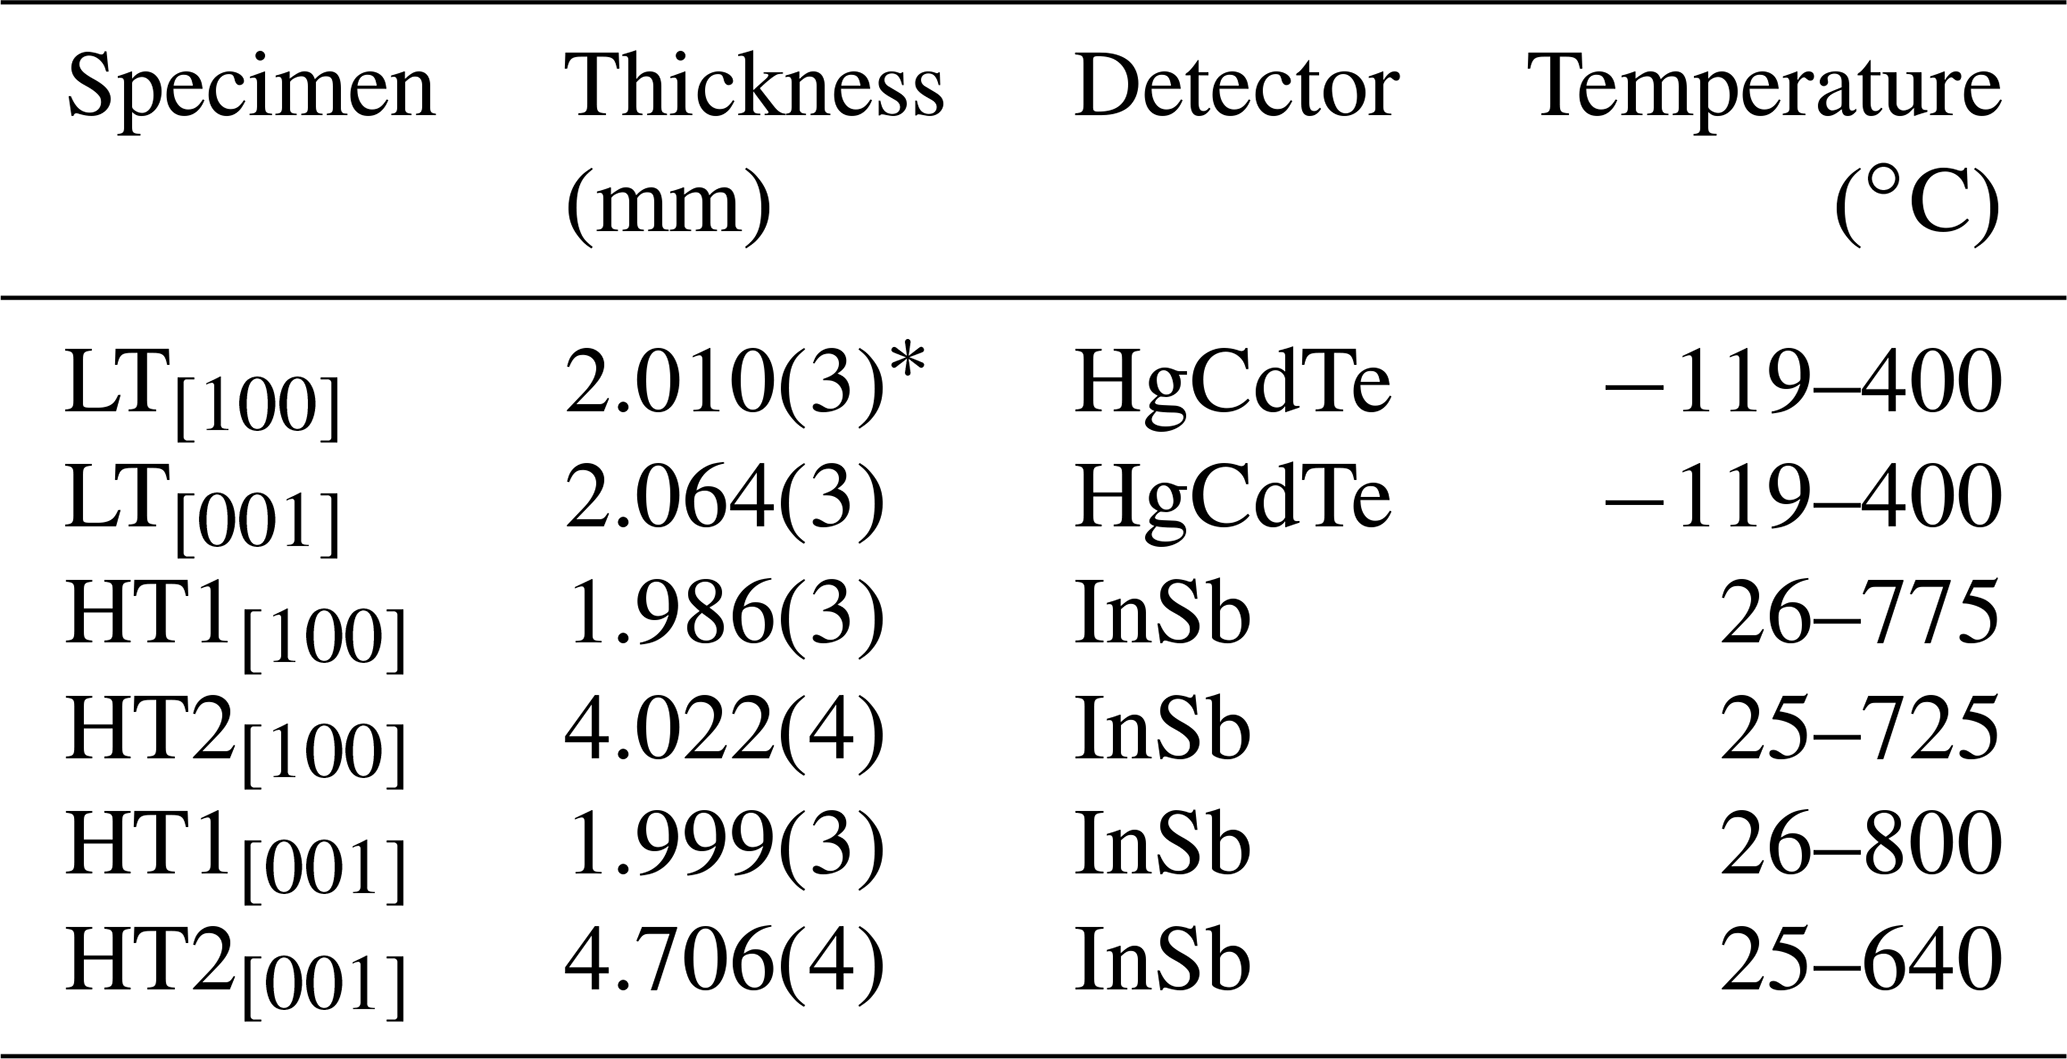
∗ Numbers in parentheses are 1σ standard deviation of the last digits.
The as-derived single-crystal thermal diffusivity data of quartz are shown in Fig. 2a as a function of temperature for the main directions ([001] and [100]; data in Tables S1 and S2 in the Supplement).
The data of high- and low-temperature measurements show a distinct D(T) evolution nearly proportional to 1∕T between −80 and ∼550 ∘C for both crystallographic orientations as expected, e.g. for three-phonon Umklapp processes (Peierls, 1929; Kittel, 2005). The direction of faster temperature equilibration coincides with the 3-fold axis in the [001] direction. In the vicinity of the α–β phase transition, thermal diffusivities stop following the trend of . The data show a further distinct decrease in lattice thermal diffusivity, starting at T∼560 ∘C and reaching its minimum of D[100]∼0.56 mm2 s−1 and D[001]∼0.60 mm2 s−1 at the α–β phase transition temperature (HT2[001]) or slightly above ( ∘C for HT1[001] and 578.0 ∘C for HT1[100] and HT2[100]). After the phase transition, D values sharply increase and stay more or less constant up to 800 ∘C at D[001]∼0.98 mm2 s−1 and D[100]∼0.86 mm2 s−1. Thermal diffusivities in hexagonal β-quartz are about 15 % and 21 % higher for the [001] and [100] directions compared to fitted D values of α-quartz extrapolated to ∘C (black lines; Fig. 2a). In the β phase, the c axis is still the direction of maximum thermal diffusivity. Green and blue areas in Fig. 2a correspond to thermal diffusivity variations (effect of impurities) of quartz single crystals measured by Branlund and Hofmeister (2007). Data of this study lie close to the lower end of these variations and slightly below the thermal diffusivities reported by Kanamori et al. (1968) (leftwards triangles) and Höfer and Schilling (2002) (stars). Data fits (least-squares minimization) according to Eq. (9) for ∘C are presented as black lines for the [001] and [100] directions in Fig. 2a (drawn up to ∘C for illustration). The resultant fit parameters are (D in mm2 s−1; T in K) (R2=0.990) for the [001] direction and (R2=0.996) for the [100] direction, respectively. Fitting the [100] direction, data benefit from including the HT term (see Eq. 9), whereas for c-axis data, the fitting gives . Thus, no improvement of the fit quality is achieved including the high-temperature term for the latter. For ∘C, the measured thermal diffusivities are lower than the data approximations after Eq. (9), especially for the higher diffusive [001] direction.

Figure 2(a) Measured lattice (phononic) thermal diffusivity D of synthetic quartz single crystals between −120 and 800 ∘C over the α–β phase transition at ∘C. Low-temperature data (squares) are shown for the [001] (black filling) and [100] directions (white filling). High-temperature data are shown from 25 to 800 ∘C for specimens HT1 (upwards triangles) and HT2 (downwards triangles). D(T) data fits (black line) after Eq. (9) for T≤550 ∘C in the [001] and [100] directions are shown up to the phase transition at 573 ∘C. Literature data are shown as rightwards triangles – Kanamori et al. (1968), stars – Höfer and Schilling (2002), and leftwards triangles – Branlund and Hofmeister (2007) (“SynQ” specimen). Green and blue areas correspond to the variations of measured D values given by Branlund and Hofmeister (2007) for the [001] and [100] directions. Front sections of specimen HT1[001] raw data signal–time curves (black lines) and data fits (thick grey) are shown for temperatures (b) ∘C, (c) 550 ∘C (with additional raw data shown for 200, 400 and 565 ∘C) and (d) 700 ∘C. Fits of the latter two include a fast radiative heat transfer portion according to Eq. (8) with Ti∝τi (c) and (d), respectively. For details, see the text.
The front parts of raw data signal–time curves are exemplarily shown in Fig. 2b–d for different furnace temperatures. For measurements at low temperatures (Fig. 2b), direct radiative heat transfer is effectively suppressed by the sputtered gold layer and data fittings are independent of Eq. (8). Furthermore, heat losses are marginal within the short time span of low-temperature LFA experiments. For measurements above T∼150–200 ∘C, fast radiative heat transfer is explicitly visible in all signal–time curves and increases with temperature (Fig. 2c). The shape of the radiative heat transfer portion in raw data signal–time curves shows a different behaviour for T≤573 ∘C and T>573 ∘C, which is considered in the applied approximation procedure (Eq. 8) (thick grey lines in Fig. 2c, d). Within the α-quartz phase, the intensities of the radiative heat transfer in signal–time curves decrease only slowly and are characterized by an almost-linear decline with t (Fig. 2c). The origin of this radiation is considered in the quartz sample itself. This type of intrinsic radiation cannot be (effectively) suppressed by the gold layer sputtered on the back side of the specimen.
In contrast, at temperatures above the phase transition, this radiative contribution vanishes. Instead, in the β phase region, the radiative heat transfer shows a rapid drop in intensity well described by a dependence (Fig. 2d) in accordance to a standard boundary-to-boundary (ballistic) transfer. Even though radiative heat transfer is noticeable for temperatures as low as T∼150–200 ∘C, the evaluated lattice (phononic) α-quartz thermal diffusivity is consistently unaffected by radiative transport and well described by Eq. (9) until a stronger decrease in thermal diffusivity starts at ∼560 ∘C (Fig. 2a).
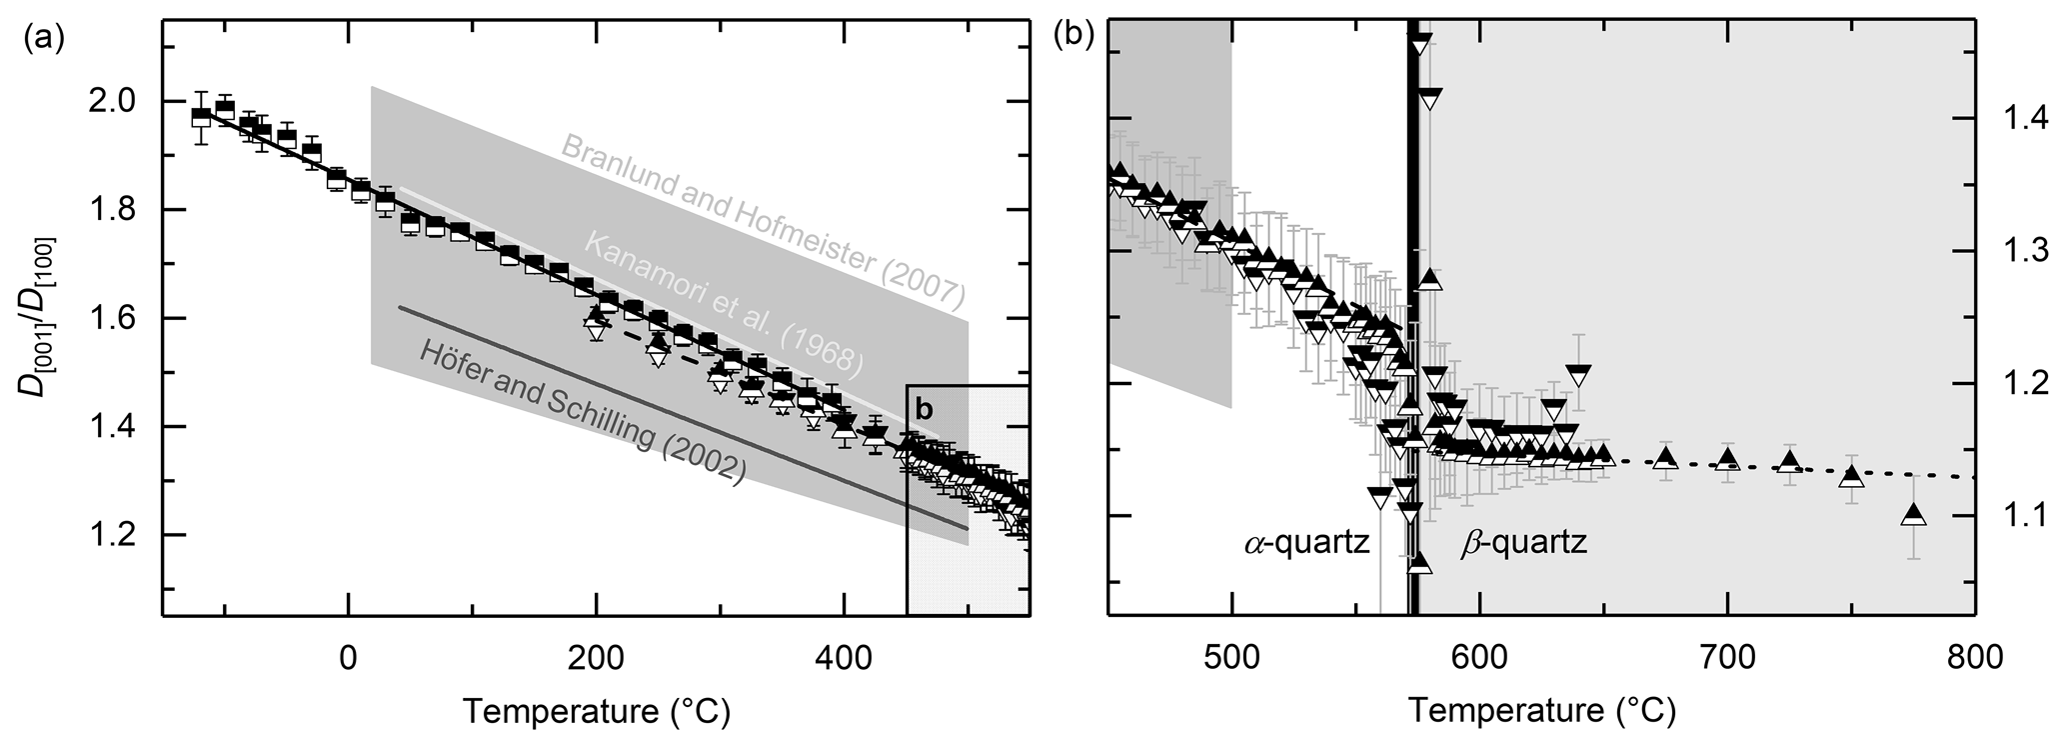
Figure 3Anisotropy of the single-crystal thermal diffusivity of quartz shown as ratio D[001]∕D[100] for measurements at low (squares; a) and high temperatures (upwards triangles for specimens HT1, downwards triangles for HT2, for T≥200 ∘C). The α–β phase transition zone is shown enlarged in panel (b). Solid and dashed black lines represent linear fits to α phase data for T≤510 ∘C and to β phase for T=585–750 ∘C (b; dotted black line).
The anisotropy of the single-crystal thermal diffusivity of quartz is shown in Fig. 3 as D[001]∕D[100]. The anisotropy ratios are well approximated by linear fits in the α- as well as in the β-quartz region (solid and dashed black lines in Fig. 3). The fit to the ratio of LT specimens gives (T in degrees Celsius) (solid black line; Fig. 3a) and for specimens HT1 and HT2 (dashed black line; Fig. 3a, b, T≥200 ∘C). LT as well as HT1/2 anisotropy ratios fit well to the data on anisotropy given by Branlund and Hofmeister (2007) on various quartz samples (grey area; Fig. 3) and data reported by Kanamori et al. (1968) within ∘C. The data on D[001]∕D[100] by Höfer and Schilling (2002) are within the shown anisotropy range (Branlund and Hofmeister, 2007) but up to ∼10 % lower than the data reported in this study. At the phase transition, the anisotropy D[001]∕D[100] rapidly decreases by about 7 % but stays above 1.0 at all temperatures. Thus, in the [001] direction, the highest thermal diffusivity is observed over the whole temperature range and no crossover is observed for any probed specimen with thicknesses d∼2.0–4.7 mm (see Table 2). The slope of the linear fit to the anisotropy ratio D[001]∕D[100] in the β-quartz phase is significantly flatter than for the α phase and gives (dotted black line; Fig. 3b).
The presented data for low-temperature α-quartz thermal diffusivity fit well into the trend of already-published data (see Table 1) at and above room temperature (Fig. 2a). A small systematic offset can be recognized for the data measured with the low- and the high-temperature setup. As the preparation was kept the same for all samples, this offset might be caused by different characteristics (nonlinearity, sensitivity) of the two IR detectors and thus reflects the accuracy of the experiment.
It is noticeable that for low-temperature measurements ( ∘C) the thermal diffusivities are significantly and systematically lower than the data fits according to Eq. (9) (using all data between −120 and 550 ∘C), especially for the higher diffusive c-axis direction. To better understand the origin of this deviation, different considerations are discussed. (a) This behaviour can be caused by the effect of IR detector nonlinearity leading to an underestimation of thermal diffusivity (Hasselman and Donaldson, 1990; Baba and Ono, 2001). Negative impacts assuming a linear detector voltage to temperature output are high especially at the lower end of the IR detectors' operating T range and significant even for low absolute temperature rises ΔT during each measurement (Hasselman and Merkel, 1989; Hoefler and Taylor, 1990). This could also explain the deviation between measurements with low- and high-temperature IR detectors as observed in Fig. 2a, where thermal diffusivities measured with the high T InSb detector (at its low-temperature limit) depict lower values. (b) Specimens measured at low temperatures have a higher ΔT due to smaller heat capacity cp of α-quartz compared to measurements performed at high temperatures (assuming similar pulse energy absorption) (Lord and Morrow, 1957; Akaogi et al., 1995; Chase, 1998). As a consequence of higher ΔT, thermal diffusivity values of α-quartz at very low T are quite possibly too low as they reflect the property at higher temperatures (e.g. see Akoshima et al., 2013). This effect is more pronounced if a strong temperature dependence of thermal diffusivity D is present, as is the case for α-quartz at very low temperatures (see Fig. 2a). But deviations of measured and fitted thermal diffusivities of up to 20 % are very unlikely to be solely caused by detector nonlinearity and effects of an increase in ΔT due to changes in heat capacity at low temperatures. The used model to fit temperature-dependent thermal diffusivities (Eq. 9) is originally tested for T≥25 ∘C (Hofmeister et al., 2014). But this approximation seems to be inappropriate at very low temperatures, i.e. at ∘C for α-quartz. (c) At low temperatures, where an increased portion of the phonon modes is frozen out, the temperature dependence of the heat capacity strongly increases (∝T3 at low T) and likewise the thermal conductivity increases before it reaches a maximum followed by a decrease (Casimir, 1938; Lord and Morrow, 1957; Zeller and Pohl, 1971; Gross and Marx, 2014). Furthermore, with an increasing mean free path length l due to a reduction in phonon–phonon interactions at low temperatures, lattice imperfections and geometrical effects become more and more dominant (de Haas and Biermasz, 1935; Blakemore, 1974; Kittel, 2005). It seems therefore reasonable for the intrinsic D(T) trend to deviate from a behaviour for measurements at low temperatures. Hence, we conclude that the observed behaviour is not the result of experimental uncertainties alone and that the mentioned deviations to the data fits are in part a manifestation of the intrinsic behaviour of α-quartz as a reduced number of phonon modes are excited and the scattering of phonons at 1-D and 2-D defects becomes more dominant at lower temperatures.
With the above exception, fits covering low- and high-temperature measurements up to 550 ∘C are well approximated by the model proposed by Hofmeister et al. (2014) (see black lines; Fig. 2a). The presented high-temperature data have the highest conformity to laser flash data presented by Branlund and Hofmeister (2007) for phonon-dominated heat transfer processes. In contrast, contact methods used by Höfer and Schilling (2002) and Kanamori et al. (1968) only have a good agreement with the data of this study in the lower temperature range (RT to ∼200 ∘C) and show a less pronounced decrease of D(T) towards higher temperatures. This is most likely due to direct radiative heat transfer not (sufficiently) being taken into account in these data sets (Andre and Degiovanni, 1995; Mehling et al., 1998; Branlund and Hofmeister, 2007). A mix of radiative and phononic transfer seems to lead to a positive slope in thermal diffusivities at temperatures above the phase transition, whereas the presented data on lattice thermal diffusivities in this study are in accordance with the data by Branlund and Hofmeister (2007), which indicate D(T) being roughly constant at T>600 ∘C. The thermal diffusivities for α-quartz samples (this study) are up to ∼12 % smaller than the D range of various quartz samples presented by Branlund and Hofmeister (2007) (see green and blue areas; Fig. 2a). Above 573 ∘C, the differences are less distinct and the thermal diffusivities lie at the lower limits of published β-quartz laser flash data. A small but noticeable negative influence, i.e. lowering thermal diffusivity, of the applied graphite coating on the specimens is conceivable (e.g. Albers et al., 2001; Lim et al., 2009) but unable to explain the observed differences alone. Therefore, low(er) thermal diffusivity data of quartz measurements in this study might be caused by low amounts of interstitial ions and the occurrence of phonon scattering at hydroxyls (OH), both decreasing the thermal diffusivity (Branlund and Hofmeister, 2007). This interpretation is further supported by the low-temperature behaviour ( ∘C), where part of the deviation to the applied 1∕Tn approximation is probably caused by defects.
4.1 D(T) around the α–β phase transition
The two recent publications on thermal diffusivity of single-crystal α–β quartz (i.e. studies by Höfer and Schilling, 2002; Branlund and Hofmeister, 2007) show a different behaviour for the crystallographic direction of the maximum thermal diffusivity at elevated temperatures. Branlund and Hofmeister (2007) confirmed measurements by Kanamori et al. (1968) and found that the direction of maximum thermal diffusivity does not change through the phase transition, whereas Höfer and Schilling (2002) presented data where a crossover (i.e. a change in the crystallographic direction of maximum thermal diffusivity) is described.
In this study, measurements on both specimens (HT1 and HT2) show no crossover in the D(T) data at any temperature (Fig. 2a). After Branlund and Hofmeister (2007), the crossover observed in measurements by Höfer and Schilling (2002) can be explained by the specimen dimensions used by the latter. Accordingly, mixing of longitudinal optic (LO) and transverse optic (TO) modes can cause an inflation of D parallel to [100], and thus the observed crossover occurs (Hofmeister, 2007; Hofmeister et al., 2007; Hofmeister, 2019). In order to test this hypothesis of a sample thickness dependence of the crossover, an additional thick quartz sample has been measured over the phase transition using the laser flash method with an increased laser power output of ∼5 J (Fig. 4; data in Table S3). This cubed sample has an edge length of ∼10 mm (10×10 mm cross section), exceeding the thinnest specimens measured by Höfer and Schilling (2002).
In general, thermal diffusivities presented in Fig. 4a show a large variation in D(T), which is due to different measurement techniques and specimens used. Relative trends show that thin specimens measured in this study (e.g. HT1; Fig. 4a) inhere no crossover in the crystallographic direction of maximum thermal diffusivity between α- and β-quartz, similar to the data presented by Kanamori et al. (1968) and Branlund and Hofmeister (2007) (not shown in Fig. 4). The derived anisotropy D[001]∕D[100] is >1.0 at all temperatures (Fig. 4b). For specimens with d=8.5–20 mm measured by Höfer and Schilling (2002) and for the quartz cube (d∼10 mm, this study; Fig. 4a), D(T) data show a crossover around the phase transition with D[100] getting the direction of maximum thermal diffusivity in the β phase. The corresponding anisotropy D[001]∕D[100] is characterized by a drop just under 1.0 for the cubic specimen (Fig. 4b). Thus, increasing the specimen thickness reproduces the crossover formerly being observed. These results are in accordance with the interpretation by Branlund and Hofmeister (2007) that TO–LO mixing significantly affects thermal diffusivity measurements. It should be clarified that for such thick specimens (∼10 mm) measured by LFA method the reproducibility and accuracy of the diffusivity determination is much lower compared to appropriate thin specimens and at the resolution limit of the experiment for the used setup. This is due to the very small rear-side temperature increase for thick samples, synonymous with a low signal-to-noise ratio for the data measured at the IR detector. For the thick samples, modifications of the used simplified 1-D evaluation procedure would be necessary to take 2-D effects into account.
After Hofmeister (2007), limiting the thickness-to-diameter ratio to d∕ø = 0.1 gives intrinsic thermal diffusivities without or at least negligible influence of mode mixing. In this study, all specimens exceed this ratio and have d∕ø ∼0.2–0.5 (see Swank and Windes, 2014; ASTM E1461, 2013). As the results in this study show good agreement with the thermal diffusivity data of single-crystal quartz presented by, e.g. Branlund and Hofmeister (2007), it is concluded that a possible influence of mode mixing on thermal diffusivity LFA measurements is still negligible for quartz specimens at d<5.0 mm with the used experimental setup.
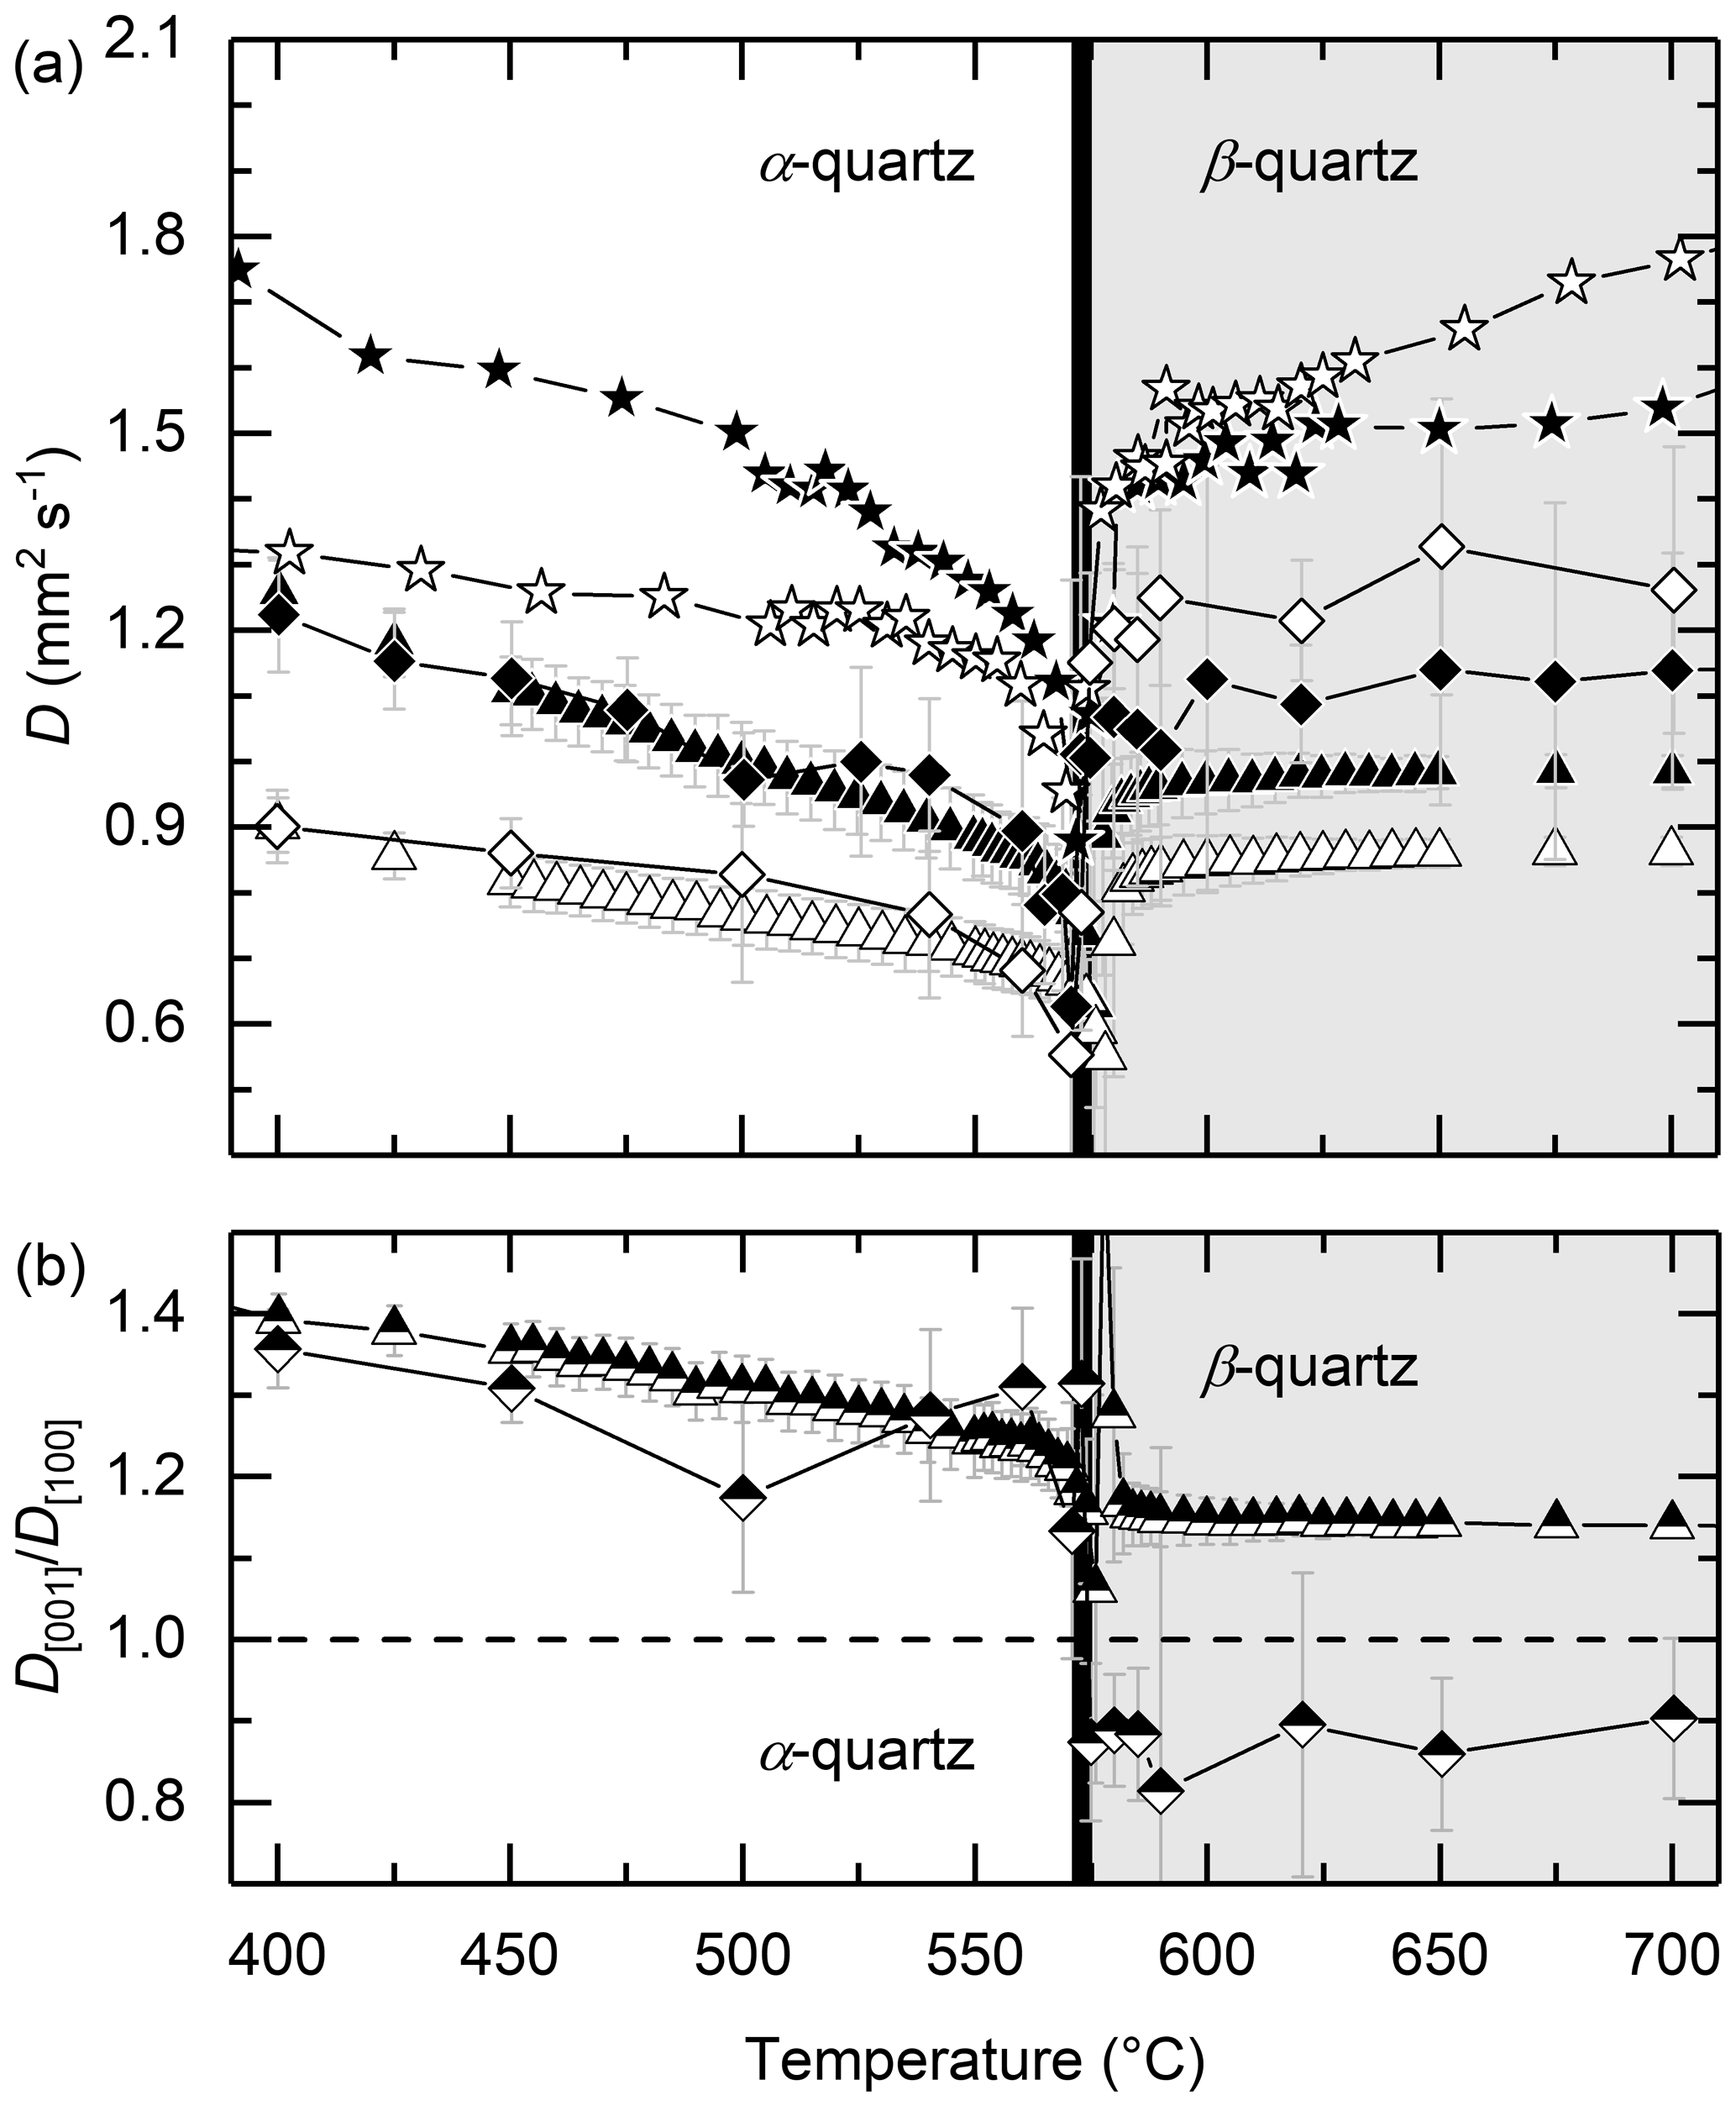
Figure 4(a) Thermal diffusivities in the [001] (black filling) and [100] directions (white filling) measured for a cubic quartz specimen with thickness d∼10 mm (diamonds) in comparison to HT1 data (upwards triangles, this study) and measurements given by Höfer and Schilling (2002) (stars). A crossover in the crystallographic direction of the maximum thermal diffusivity is observed for the thick cubic specimen as it was measured for tall cylinders by Höfer and Schilling (2002). (b) Anisotropy of the thermal diffusivity shown for HT1 (upwards triangles) compared to data of the cubic quartz specimen (diamonds). The crossover in the thermal diffusivity D at the phase transition (a) is represented by a decrease of the anisotropy D[001]∕D[100] below 1.0 (dashed line), whereas the specimen's HT1 anisotropy stays above 1.0 at all temperatures. As indicated by the error bars, the data showing the observed crossover for the thick cubic sample are at the limit of the experimental resolution.
Data fits show that the lowest measured thermal diffusivities lie up to ∼5 K above the actual phase transition temperature of ∘C (except HT2[001]; thermocouple tolerance is ≈2.3 ∘C at 573 ∘C, DIN EN/IEC 60584-1, 2013). As the temperature is recorded close to but not directly at the sample surface, the observed temperature of the thermocouple may record a slightly higher temperature. However, such observation has also been made by Branlund and Hofmeister (2007). The highest amount of direct radiative heat transfer, linked with a maximum distortion in signal–time curves (reducing the accuracy of the derived data), can be assigned to measurements of minimum thermal diffusivity. The observed shift in the minimum thermal diffusivity could therefore be linked to the formation of an incommensurate (inc) phase between ∼573 and ∼574.3∘C (Bachheimer, 1980; Dolino et al., 1983; Dolino, 1990; Klumbach, 2015). Due to the experimental setup with 2 K temperature steps, thermocouple uncertainties and most notably the specimen temperature increase ΔT within each measurement, it is not possible to clearly discriminate such variations and hence processes within this narrow temperature range. In addition, the phase transition temperature could be affected by, e.g. impurities and defects in the crystal.
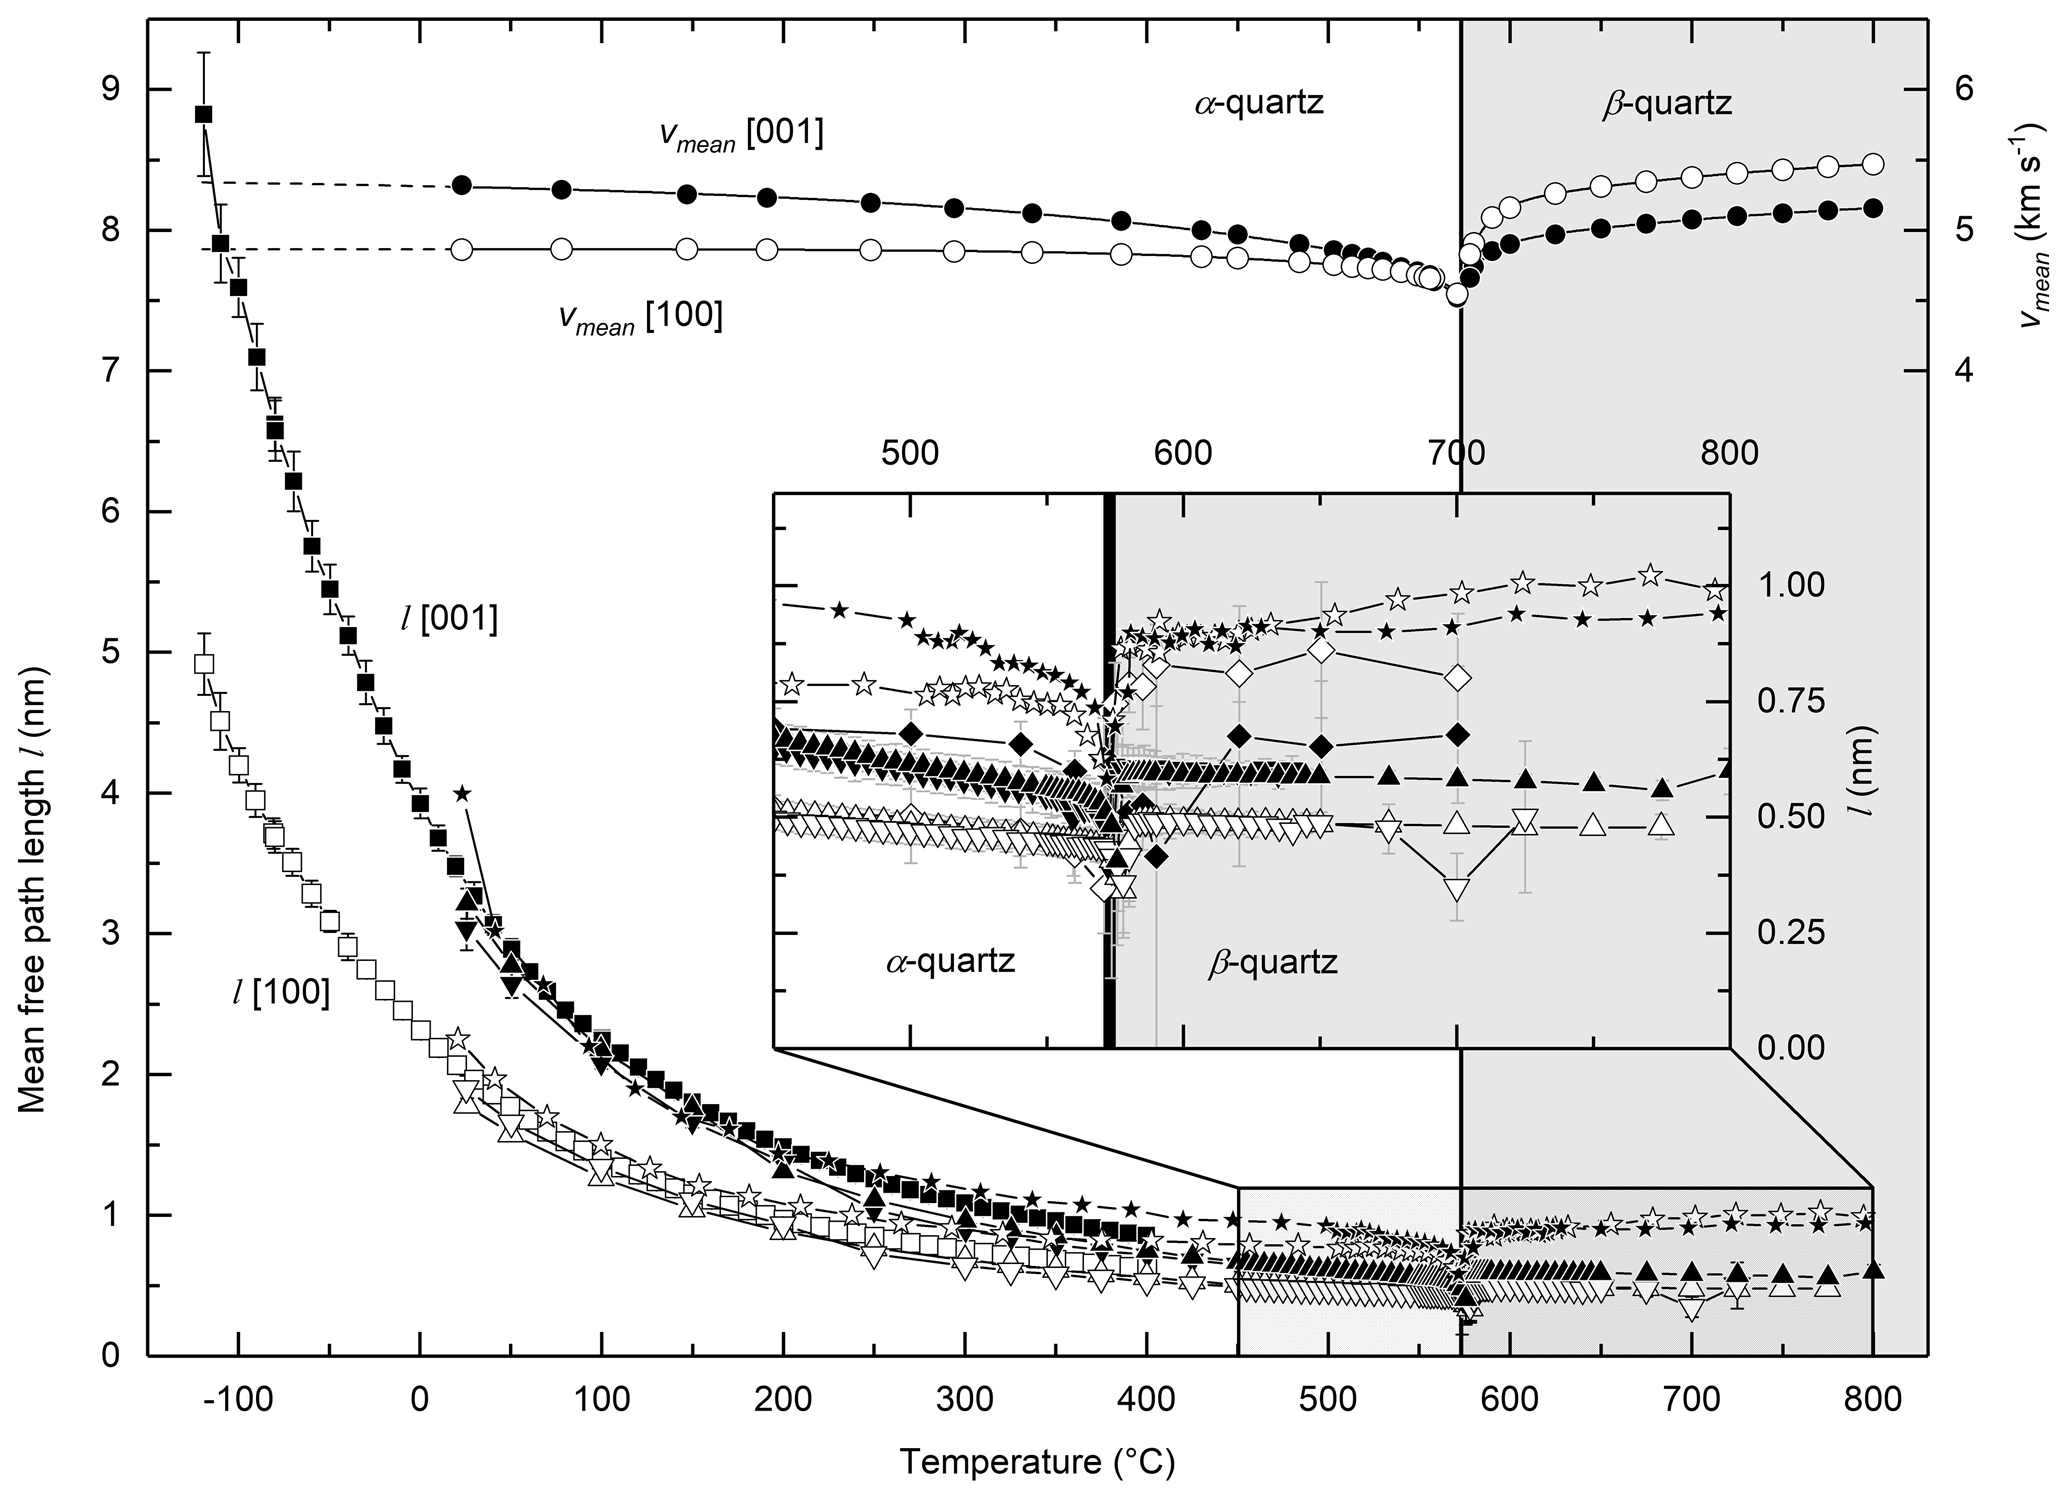
Figure 5Phononic mean free path length l between −120 and 800 ∘C for the [001] (black filling) and [100] directions (white filling) and different specimens: LT (squares), HT1 (upwards triangles) and HT2 (downwards triangles). Calculated after Eq. (4) with vmean (circles) derived from elastic constants given by Kammer et al. (1948); Zubov and Firsova (1962); Ohno (1995). Averaged sound velocities are extrapolated to −120 ∘C (dashed black line). Data given by Höfer and Schilling (2002) are shown as stars for comparison. The mean free path length l of the thick cubic specimen (this study; see Fig. 4a) is given as diamonds (inset).
4.2 What controls thermal diffusivity of quartz
The crossover in vmean at the α–β phase transition of quartz led Höfer and Schilling (2002) to conclude that the crossover in the thermal diffusivity observed for the thick samples is the result of a direct correlation of the thermal diffusivity D and the elastic behaviour (i.e. sound velocities). The single-crystal platelets used in this study are much thinner, better satisfying the hypothesis of 1-D heat transport. Therefore, the observation made by Höfer and Schilling (2002), that the as-derived vmean is the main factor controlling the D(T) behaviour at high temperatures, is verified here.
To derive the mean free path lengths l of quartz in the [100] and [001] directions, Eq. (4) is used as a first approximation. For the mean velocities vmean, the quadratic mean of the directional vp and both vs1 and vs2 sound velocities are used () based on the elastic constants of single-crystal quartz (Kammer et al., 1948; Zubov and Firsova, 1962; Ohno, 1995). For temperatures between −120 and 20 ∘C, the sound velocities are extrapolated using an exponential fit which leads to the solid lines for vmean of α-quartz shown in Fig. 5. The crossover in vmean at the phase transition temperature (Fig. 5) is the result of vp and vs1, vs2 velocities in the [100] direction exceeding the sound velocities in the [001] direction (which in turn expresses a change in elastic constants with T).
The trend of l(T) (Fig. 5) mainly follows that of D(T) (see Fig. 2a). In contrast to the strong variation of the mean free path length l(T) from 8.8 nm (in the [001] direction; 4.9 nm in the [100] direction) to ∼0.5 nm, the mean sound velocities vary only ∼20 % over the entire temperature range (Fig. 5). Thus, it follows that the influence of vmean on D(T) is much less distinct than that of l(T) over the investigated temperature range (including the behaviour during the α–β phase transition). The changes in the sound velocities vmean in quartz are not directly correlated to the mean free path length in thin samples (this study) as deduced by Höfer and Schilling (2002) for thick samples. As a consequence, the thermal diffusivity is mainly related to the mean free path length with minor contribution of the mean phonon sound velocity, assuming 1-D heat transport.
The discussion of Höfer and Schilling (2002) is based on the assumption that acoustic phonons dominate thermal diffusivity of quartz and the mean free path length is strongly dependent on the phonon wavelength. However, the possible size dependence of the measured thermal diffusivities and the missing direct correlation between the sound velocities and the mean free path length can be seen as an indication for 2-D heat transport effects and that longitudinal and transverse optical phonons (especially at elevated temperatures) need to be taken into account to better describe the observed behaviour. This would be in agreement with independent density functional theory calculations and observed phonon lifetimes for other oxides such as magnesium oxide (MgO) (Dekura and Tsuchiya, 2017; Giura et al., 2019). Together with the deviation of the thermal diffusivity from a simple 1∕Tn dependence at low temperatures ( ∘C) and the comparison to data presented by Branlund and Hofmeister (2007), one can conclude that the main portion of the temperature dependence of quartz at elevated temperatures is the result of phonon–phonon interactions, whereas the absolute thermal diffusivity and the low-temperature behaviour indicate a significant influence of 1-D/2-D defects and inclusions, and that the minor variations in the elastic properties have a subordinate influence on the thermal transport behaviour.
4.3 Direct radiative heat transfer
The influence of direct heat transfer by radiation on the raw data signal–time curve in laser flash experiments of (semi)transparent materials is well known (e.g. Andre and Degiovanni, 1995; Mehling et al., 1998). But for materials undergoing phase transitions within the temperature range of thermal diffusivity measurements, it seems likely that underlying processes of radiative heat transfer can be different from those of common ballistic transfer in transparent or semitransparent media. Branlund and Hofmeister (2007) noticed in their study that direct radiative heat transfer exceedingly rises close to the α–β phase transition, unable to get fitted by Mehling et al. (1998)'s model. But this finding was not considered in their evaluation routine, and it is shown here how a separate evaluation procedure can be applied (Figs. 2c–d, 7c). Direct radiative heat declines within a few degrees above the phase transition. Branlund and Hofmeister (2007) assume that the laser pulse triggers an α to β phase transition (in portion) of the sample at and close to the heated surface already at T<573 ∘C. The following β–α inversion is coupled with a release of latent heat observable through a non-ballistic radiative contribution in LFA measurements. This process lasts longer (Fig. 2c, Eq. 8, T≤573 ∘C) than common ballistic direct radiative heat transfer (Fig. 2d, Eq. 8, T>573 ∘C), which represents fast cooling of the specimen front surface after the heating by the laser pulse.
To visualize and better understand the change of heat transfer by radiation in D(T) measurements, the ratio of the direct radiative portion T0, rad (Eq. 8; see inset Fig. 1) to the theoretical adiabatic maximum temperature Tmax on the specimen rear side (see Fig. 1) is shown in Fig. 6 in logarithmic scale (data in the Supplement; Tables S4–S9). Scattering of the data in the low-temperature region is the result of experimental uncertainties (i.e. approaching resolution limit of the detector, T0, rad very small and close to 0 V), exaggerated by the logarithmic scaling.
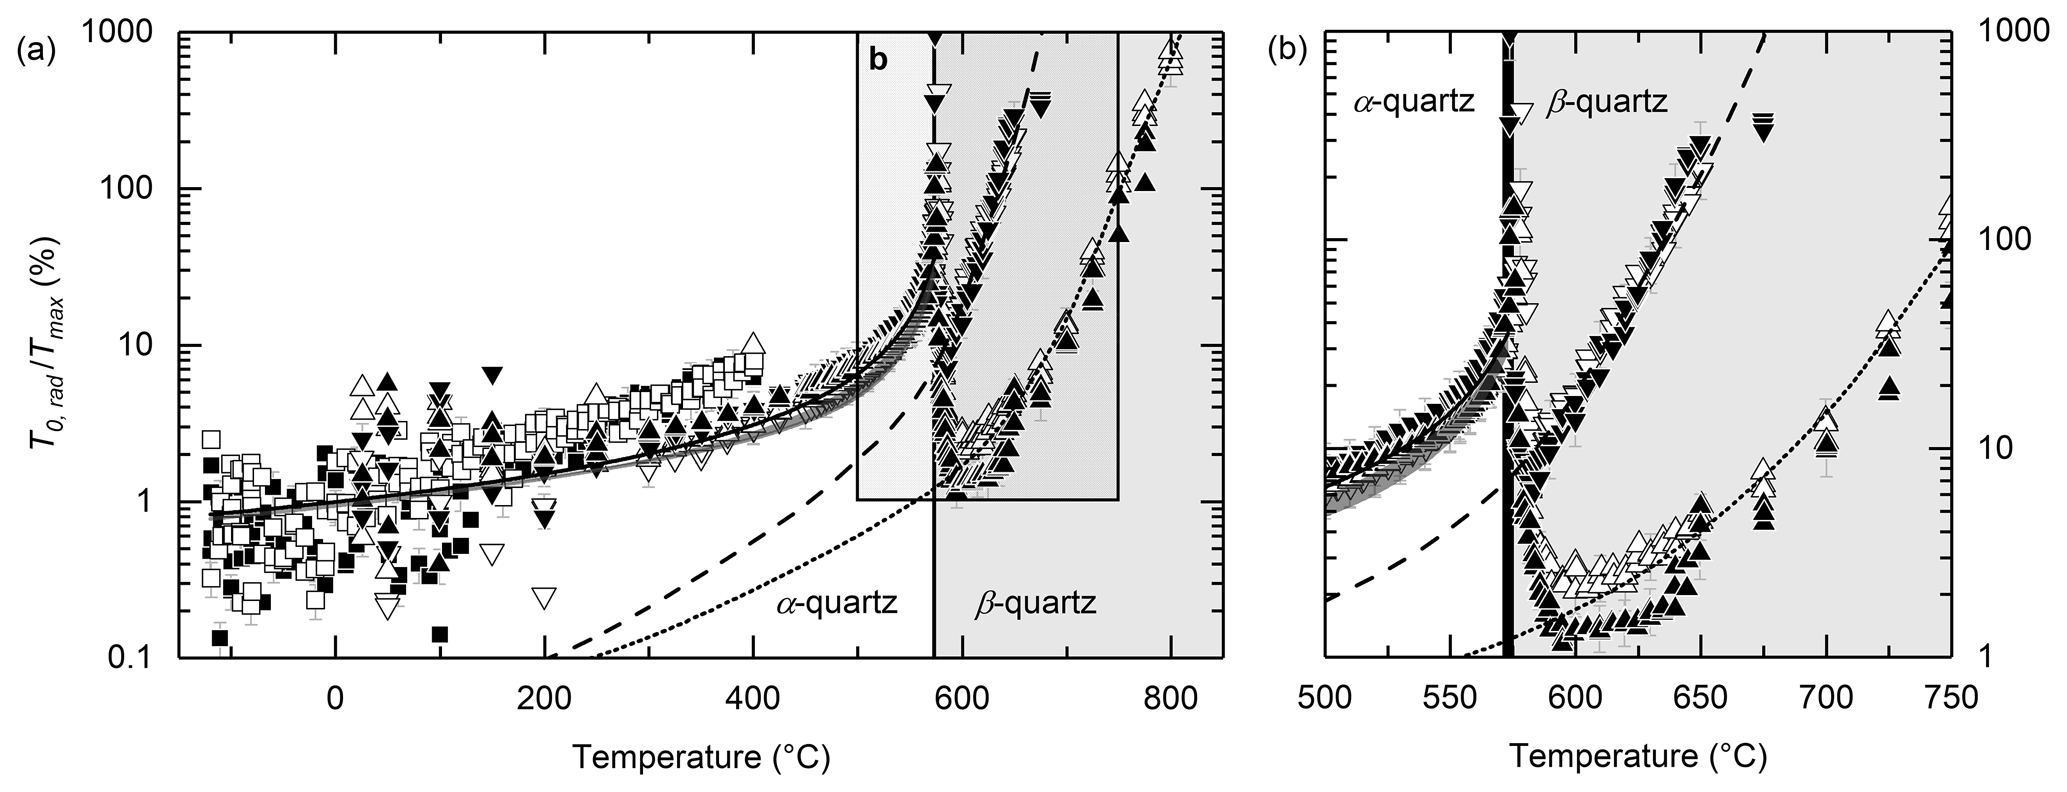
Figure 6(a) Ratio of the direct radiative heat transfer (T0, rad; see Eq. (8) and inset Fig. 1) to the theoretical adiabatic maximum temperature on the specimen rear side Tmax (see Fig. 1) for the [001] (black filling) and [100] directions (white filling) and specimens LT (squares), HT1 (upwards triangles) and HT2 (downwards triangles). The solid line represents a reciprocal fit for T≤573 ∘C; dashed and dotted lines are splines to guide the eyes for direct radiative ballistic (boundary-to-boundary) heat transfer (for details, see the text). For the thick dark grey line, the effect of direct ballistic heat transport is subtracted from the deduced direct radiative heat transfer. The grey line thus represents the net effect of a non-ballistic radiative heat transfer for α-quartz. The behaviour in the vicinity of the α–β phase transition region is shown in detail in panel (b).

Figure 7Comparison of the fit results using different model approaches to approximate HT1 data below and above the α–β phase transition. Panels (a) and (b) illustrate the differences ΔD between thermal diffusivities evaluated by the approximation approach proposed in this study (i.e. accounting for direct radiative heat transfer differently for T≤573 ∘C and T>573 ∘C) and the model for (semi)transparent specimens by Mehling et al. (1998) (as implemented in the manufacturer's software). Exemplary data fits to measurements along the c-axis direction at T=550 ∘C and T=700 ∘C are shown in panels (c) and (d), respectively. The measured IR detector signal–time curves are given as black lines. Data fits to are given as thick grey (this study) and dashed red lines (after Mehling et al., 1998). The front part of the fast radiative heat transfer is shown enlarged in the insets. Corresponding thermal diffusivities are (c) D=0.89(3) mm2 s−1 (this study), D=0.82(5) mm2 s−1 (Mehling et al., 1998), (d) D=0.98(3) mm2 s−1 (this study) and D=0.97(4) mm2 s−1 (Mehling et al., 1998).
The normalized radiation ratio () shows a first strong increase with T up to the phase transition at ∘C. This trend is described by % (solid line; Fig. 6, T in degrees Celsius). No difference can be seen for specimens measured in the [100] (white filling) and [001] directions (black filling) or for measurements on thinner (upwards triangles) and thicker specimens (downwards triangles). The ratios of the data measured with the HgCdTe IR detector for low temperatures (squares) lie slightly above the data measured by InSb detector for T>150 ∘C, which is likely due to different detector characteristics (e.g. sensitivity, nonlinearity). At the α–β phase transition, the radiative contribution reaches its maximum followed by a sharp and distinct decrease within a few Kelvin. In the β-quartz phase, the ratio again shows a strong increase with T but a dependence on specimen thicknesses (upwards/downwards triangles) becomes apparent. Thicker HT2 specimens have a higher onset and stronger increase with T than thinner HT1 specimens, while again no significant differences for different crystallographic directions ([001] and [100]) are present. To guide the eyes, the temperature development of in the β phase is shown by dashed (HT2) and dotted (HT1) lines (Fig. 6) for ∼2 mm and ∼4–4.7 mm thick samples.
The observed strong decrease in the radiation ratio directly after passing the phase transition at 573 ∘C indicates that at least two different mechanisms influence the radiative heat transfer in LFA measurements through the phase transition, also noticeable through the different shapes of the radiative heat transfer portion in the signal–time data comparing Fig. 2c (T<573 ∘C) and Fig. 2d (T>573 ∘C), in the first 200 ms. This is further supported by the fact that there is no dependence on sample thickness d below 573 ∘C but above. The radiation below the transition is supposed to be primarily caused by the phase change itself within the sample and thus non-ballistic (related to the release of latent heat; see above and Branlund and Hofmeister, 2007). This affects laser flash measurements as low as T∼150–200 ∘C (see Figs. 2c, 6), which is well conceivable as the absolute temperatures at the front surface of the specimen initially rise to high values (Parker et al., 1961), well above the phase transition temperature due to the short duration of the laser pulse. That the gold layer on the back side of the specimen cannot suppress this radiative heat generated within the sample below the phase transition might be explained by a decreased Au reflectance for the wavelength of this non-ballistic radiation. However, the effectively suppressed ballistic contribution around 600 ∘C is clear evidence that the thickness of the gold coating is sufficient and that this non-ballistic contribution is not the result of the coating. The net effect of radiative heat transfer originating from the phase transition is approximated by subtracting the ballistic radiative heat transfer (dashed and dotted line; Fig. 6) from the assumed non-ballistic portion (dark grey line in Fig. 6). If this is taken into account (Eq. 8), D(T) data fits according to Eq. (9) describe the measured data well in both crystallographic directions ([001] and [100]) up to T∼560 ∘C (see black lines in Fig. 2a). This indicates that the used semi-empirical approach to consider the radiative heat transfer for T<573 ∘C (Eq. 8) is well suited to describe the measured data while taking latent heat effects into account. In contrast, at higher temperatures (T>573 ∘C), where shows a sample thickness dependence (Fig. 6), the radiation is inferred to be the common boundary-to-boundary (ballistic) radiative heat transfer. This is also supported by the fact that standard evaluation routines accounting for ballistic radiative transfer (Eq. 8 for T>573 ∘C and Mehling et al., 1998) fit the observed signal–time data well (see Figs. 2d, 7d). This direct ballistic radiative heat transfer increasingly inheres the signal–time data towards higher temperatures (around the α–β phase transition and above; dashed and dotted lines in Fig. 6), which is explained by a reduced reflectance of the sputtered Au layer at high temperatures (Loebich, 1972). As the thermal diffusivity D(T) in the β phase shows no specimen thickness dependence but the ratio does, this supports the fact that the model chosen here is well suited to approximate the signal–time curves for thermal diffusivity determination at temperatures above 573 ∘C (see Figs. 2d, 7b, d). A further increase in fit quality may be achieved by mixing the two radiative heat transfer models (Eq. 8) in the temperature range ∼400–573 ∘C as indicated by in Fig. 6.
Against the background of having two different effects contributing to the radiative heat transfer portion in the signal–time curves, measured HT1 data have been re-evaluated using the most frequently used standard fit procedure for (semi)transparent specimens after Mehling et al. (1998). This way, systematic errors for not taking into account the non-ballistic radiative transfer in the data evaluation routine below 573 ∘C can be estimated. The derived differences ΔD between the two model approaches are given as percentages in Fig. 7a, b. For measurements up to ∼200–250 ∘C, the data fits show no significant differences independent of the used fit routine and % (Fig. 7a). At higher temperatures up to 573 ∘C (coinciding with the first rise of radiation ratio ; Fig. 6a), differences in the fitted thermal diffusivities are increasing, exceeding −5 % at T∼500 ∘C, and the maximum is reached at the phase transition with % (Fig. 7b). Negative differences mean that the data approximations of this study (accounting for non-ballistic and ballistic transfer) yield higher thermal diffusivities than fits using the model by Mehling et al. (1998), which only account for standard ballistic radiative transfer. Exemplary signal–time data fits for the two different evaluation routines are presented in Fig. 7c for T=550 ∘C. It shows that the front part of fast radiative heat transfer (inset) is well approximated by the non-ballistic absorption/re-emission model proposed in this study (thick grey line in Fig. 7c) and that the standard model for (semi)transparent specimens improperly approximates the observed behaviour within the first few hundred microseconds (dashed red line; Fig. 7c). The resulting derived thermal diffusivities are in this example D=0.89(3) mm2 s−1 (this study) and D=0.82(5) mm2 s−1 (fit after Mehling et al., 1998), and thus %. Above the phase transition temperature, the derived thermal diffusivity becomes independent of the used fitting procedure for both crystallographic directions. At T=700 ∘C, the fitted signal–time data shown in Fig. 7d reveal that both approximations accounting for ballistic radiative heat transport (Eq. 8 for T>573 ∘C and Mehling et al., 1998) are comparably well with a minor exception for the very first few tens of milliseconds of the model by Mehling et al. (1998). Consequently, there is no significant difference in the deduced diffusivity values independently of the used fitting routine with D=0.98(3) mm2 s−1 (this study) and D=0.97(4) mm2 s−1 (after Mehling et al., 1998), respectively.
In view of the direct radiative heat transfer, it is concluded that laser flash measurements of (semi)transparent specimens can be significantly influenced by phase transitions already far away from the phase transition temperature (i.e. several hundred degrees Celsius) in flash technique measurements. In this case, direct radiative heat transfer in signal–time data has its origin (in parts) in the phase transition itself and is thus supposed to be non-ballistic (e.g. release of latent heat due to inversion of phase transition, Branlund and Hofmeister, 2007, strong variation in heat capacity). This process results in radiative heat transfer signal–time data differently shaped compared to regular boundary-to-boundary (ballistic) radiative heat transfer. Hence, standard fit algorithms are inappropriate and signal–time data affected by phase transitions need to be specifically evaluated using appropriate fit procedures for (semi)transparent specimens.
Laser flash thermal diffusivity measurements were performed on quartz synthetic single crystals between −120 and 800 ∘C. The temperature dependence of the thermal diffusivity D between −80 and 560 ∘C can be approximated by the model of bulk phonon polaritons given by Hofmeister et al. (2014). Low-temperature data show that an extrapolation to lower temperatures of previously measured thermal diffusivity values (at and above room temperature) leads to an overestimation of thermal diffusivity values, especially for temperatures below −80 ∘C. The [001] direction (c axis) shows the maximum thermal diffusivity at all temperatures for samples with thicknesses d≲5 mm (cross section 10×10 mm). The anisotropy of the thermal diffusivity D[001]∕D[100] decreases linearly over the measured temperature range with a discontinuity around the α–β phase transition at 573 ∘C. The latter is linked to a change in the crystallographic direction of maximum averaged sound velocities (crossover), reflecting changes in elastic constants over the phase transition.
A sample thickness dependency of the thermal diffusivity is observed above the phase transition. No crossover in the direction of the maximum thermal diffusivity is observed for sample thicknesses d≲5 mm in laser flash measurements. However, while using a centimetre-sized sample (cross section 10×10 mm), a crossover in thermal diffusivity over the α–β phase transition is observed but at the limit of the experimental resolution.
Direct radiative heat transfer in signal–time curves is fundamentally different in flash measurements for T≤573 ∘C and T>573 ∘C. It was shown that the phase transition has (1) a significant influence on signal–time curves, (2) already at temperatures far below the actual phase change. This is not only supported by the difference in shape of the direct radiation transfer in the raw data but also by a sharp drop of radiative heat transfer intensities just above the phase transition. In the β phase, the intensities of direct radiative heat transfer increase and can be described by common ballistic (boundary-to-boundary) transfer. A comparison of data fits shows that a frequently used model only accounting for boundary-to-boundary radiative heat transport in (semi)transparent specimens is insufficient to adequately consider the supposed non-ballistic radiative heat transfer for T≤573 ∘C originating in the phase transition. An absorption/re-emission approach introduced approximates the observed fast radiative heat transfer well in signal–time curves at temperatures below 573 ∘C.
These findings that radiative heat transport in quartz flash technique raw data is caused by different effects give rise to the assumption that flash method thermal diffusivity measurements on (semi)transparent matter undergoing phase changes are affected in a similar manner even though temperatures are several hundred degrees away from the actual phase transition. This can result in a strong underestimation of the thermal diffusivities when using standard fit routines that cannot separate the different radiative heat transport mechanisms effectively.
Thermal diffusivity signal–time data for low- and high-temperature laser flash measurements are available at https://doi.org/10.5445/IR/1000119716 (Breuer and Schilling, 2020).
The supplement related to this article is available online at: https://doi.org/10.5194/ejm-33-23-2021-supplement.
SB was responsible for data curation, software codes and implementation, visualizations and writing the manuscript. FRS was in charge of funding, providing resources, supervision of the study, and reviewing and editing of the manuscript. SB and FRS together worked on the conceptualization of the study, on the formal analysis of the data, and on the creation of models and methodology, as well as on the validation of research outputs.
The authors declare that they have no conflict of interest.
This work was made possible by a foundation of Martin Herrenknecht. The authors thank Jana Späthe, Ruben Stemmle and Damien Guth for their help in performing the laser flash measurements, and Gemma de la Flor for comments on an early version of the manuscript. The authors gratefully acknowledge the unknown reviewers for their in-depth, constructive and helpful comments on an earlier version of the manuscript. The authors further acknowledge the support by the KIT-Publication Fund of the Karlsruhe Institute of Technology.
The article processing charges for this open-access publication were covered by a Research Centre of the Helmholtz Association.
This paper was edited by Etienne Balan and reviewed by two anonymous referees.
Abdulagatov, I. M., Abdulagatova, Z. Z., Kallaev, S. N., Bakmaev, A. G., and Ranjith, P. G.: Thermal-Diffusivity and Heat-Capacity Measurements of Sandstone at High Temperatures Using Laser Flash and DSC Methods, Int. J. Thermophys., 36, 658–691, https://doi.org/10.1007/s10765-014-1829-4, 2015. a
Akaogi, M., Yusa, H., Shiraishi, K., and Suzuki, T.: Thermodynamic properties of α-quartz, coesite, and stishovite and equilibrium phase relations at high pressures and high temperatures, J. Geophys. Res., 100, 22337–22347, https://doi.org/10.1029/95JB02395, 1995. a
Akoshima, M., Hay, B., Neda, M., and Grelard, M.: Experimental Verification to Obtain Intrinsic Thermal Diffusivity by Laser-Flash Method, Int. J. Thermophys., 34, 778–791, https://doi.org/10.1007/s10765-013-1470-7, 2013. a
Albers, A. P. F., Restivo, T. A. G., Pagano, L., and Baldo, J. B.: Effect of testing conditions on the laser flash thermal diffusivity measurements of ceramics, Thermochim. Ac., 370, 111–118, 2001. a
Andre, S. and Degiovanni, A.: A theoretical study of the transient coupled conduction and radiation heat transfer in glass: phonic diffusivity measurements by the flash technique, Int. J. Heat Mass Tran., 38, 3401–3412, https://doi.org/10.1016/0017-9310(95)00075-K, 1995. a, b
ASTM E1461: Standard Test Method for Thermal Diffusivity by the Flash Method, Tech. rep., ASTM International, https://doi.org/10.1520/E1461-13, 2013. a
Baba, T. and Ono, A.: Improvement of the laser flash method to reduce uncertainty in thermal diffusivity measurements, Meas. Sci. Technol., 12, 2046–2057, https://doi.org/10.1088/0957-0233/12/12/304, 2001. a
Bachheimer, J.: An anomaly in the β phase near the α-β transition of quartz, J. Phys. Lett., 41, 559–561, https://doi.org/10.1051/jphyslet:019800041023055900, 1980. a
Beck, A., Darbha, D., and Schloessin, H.: Lattice conductivities of single-crystal and polycrystalline materials at mantle pressures and temperatures, Phys. Earth Planet. Int., 17, 35–53, https://doi.org/10.1016/0031-9201(78)90008-0, 1978. a
Berman, R.: Thermal conduction in solids, Clarendon Press, Oxford, 1976. a
Birch, F.: Physics of the Crust, Geol. Soc. America., 62, 101–118, 1955. a
Blakemore, J. S.: Solid state physics, Saunders, Philadelphia, 2nd edn., 1974. a
Bragg, W. L. and Gibbs, R. E.: The structure of α and β quartz, Roy Soc Proc, 109, 405–427, https://doi.org/10.1098/rspa.1925.0135, 1925. a
Branlund, J. M. and Hofmeister, A. M.: Thermal diffusivity of quartz to 1,000 ∘C: effects of impurities and the α-β phase transition, Phys. Chem. Min., 34, 581–595, https://doi.org/10.1007/s00269-007-0173-7, 2007. a, b, c, d, e, f, g, h, i, j, k, l, m, n, o, p, q, r, s, t, u, v, w, x, y, z, aa, ab, ac, ad
Breuer, S. and Schilling, F.: Quartz single crystal thermal diffusivity measurements by laser flash method: from −120 ∘C through the α-β phase transition to 800 ∘C, dataset, KITopenData, https://doi.org/10.5445/IR/1000119716, 2020. a
Breuer, S. and Schilling, F. R.: Improving Thermal Diffusivity Measurements by Including Detector Inherent Delayed Response in Laser Flash Method, Int. J. Thermophys., 40, 95, https://doi.org/10.1007/s10765-019-2562-9, 2019. a
Buntebarth, G.: Geothermics: An Introduction, Universitext, Springer-Verlag, Berlin Heidelberg, 1984. a
Carslaw, H. and Jaeger, J.: Conduction of Heat in Solids, Oxford University Press, Oxford, 2nd edn., 1959. a
Casimir, H. B. G.: Note on the conduction of heat in crystals, Physica, 5, 495–500, https://doi.org/10.1016/S0031-8914(38)80162-2, 1938. a
Čermák, V.: Crustal temperature and mantle heat flow in Europe, Tectonophysics, 83, 123–142, https://doi.org/10.1016/0040-1951(82)90012-9, 1982. a
Cernuschi, F., Lorenzoni, L., Bianchi, P., and Figari, A.: The effects of sample surface treatments on laser flash thermal diffusivity measurements, Infrared Phys. Technol., 43, 133–138, https://doi.org/10.1016/S1350-4495(02)00131-7, 2002. a
Chase, M. W. (Ed.): NIST-JANAF Thermochemical Tables, American Chemical Society and the American Institute of Physics for the National Institute of Standards and Technology, Woodbury, New York, 4th edn., 1998. a
Clauser, C. and Huenges, E.: Thermal Conductivity of Rocks and Minerals, in: Rock Physics and Phase Relations: A Handbook of Physical Constants, edited by: Ahrens, T., pp. 105–126, American Geophysical Union, Washington D.C., 1995. a
Debye, P. J. W.: Vortraege ueber die kinetische Theorie der Materie und der Elektrizitaet: Zustandsgleichung und Quantenhypothese, Goettingen, 1914. a
de Haas, W. J. and Biermasz, T.: The thermal conductivity of quartz at low temperatures, Physica, 2, 673–682, https://doi.org/10.1016/S0031-8914(35)90143-4, 1935. a
Dekura, H. and Tsuchiya, T.: Ab initio Lattice Thermal Conductivity of MgO from a Complete Solution of the Linearized Boltzmann Transport Equation, Phys. Rev. B, 95, 184303, https://doi.org/10.1103/PhysRevB.95.184303, 2017. a
DIN EN/IEC 60584-1: Thermocouples – Part 1: EMF specifications and tolerances, Norm, CENELEC European Committee for Electrotechnical Standardization, CLC/TC 65X Industrial-process measurement, control and automation, Brussels, 2013. a, b
DIN EN/IEC 60758: Synthetic quartz crystal – Specifications and guidelines for use, Norm, IEC International Electrotechnical Commission, IEC/TC 49 Piezoelectric devices for frequency control and selection, Brussels, 2016. a
Dolino, G.: The α-inc-β transitions of quartz: A century of research on displacive phase transitions, Phase Transitions, 21, 59–72, https://doi.org/10.1080/01411599008206882, 1990. a, b, c
Dolino, G., Bachheimer, J., and Zeyen, C.: Observation of an intermediate phase near the α-β transition of quartz by heat capacity and neutron scattering measurements, Solid State Commun., 45, 295–299, https://doi.org/10.1016/0038-1098(83)90485-4, 1983. a
Esfarjani, K., Chen, G., and Stokes, H. T.: Heat Transport in Silicon From First-Principles Calculations, Phys. Rev. B, 84, 085204, https://doi.org/10.1103/PhysRevB.84.085204, 2011. a
Eucken, A.: Über die Temperaturabhängigkeit der Wärmeleitfähigkeit fester Nichtmetalle, Ann. Phys., 339, 185–221, https://doi.org/10.1002/andp.19113390202, 1911. a
Gibert, B., Schilling, F. R., Gratz, K., and Tommasi, A.: Thermal diffusivity of olivine single crystals and a dunite at high temperature: Evidence for heat transfer by radiation in the upper mantle, Phys. Earth Planet. Int., 151, 129–141, https://doi.org/10.1016/j.pepi.2005.02.003, 2005. a
Giura, P., Paulatto, L., He, F., Lobo, R. P. S. M., Bosak, A., Calandrini, E., Paolasini, L., and Antonangeli, D.: Multiphonon Anharmonicity of MgO, Phys. Rev. B, 99, 220304, https://doi.org/10.1103/PhysRevB.99.220304, 2019. a
Gross, R. and Marx, A.: Festkörperphysik, De Gruyter, Berlin Boston, 2nd edn., 2014. a
Hasselman, D. P. H. and Donaldson, K. Y.: Effects of detector nonlinearity and specimen size on the apparent thermal diffusivity of NIST 8425 graphite, Int. J. Thermophys., 11, 573–585, https://doi.org/10.1007/BF00500847, 1990. a
Hasselman, D. P. H. and Merkel, G. A.: Specimen Size Effect of the Thermal Diffusivity/Conductivity of Aluminum Nitride, J. Am. Ceram. Soc., 72, 967–971, https://doi.org/10.1111/j.1151-2916.1989.tb06253.x, 1989. a, b
Hoefler, J. J. and Taylor, R. E.: Effects of infrared detector nonlinearity on thermal diffusivity measurements using the flash method, Int. J. Thermophys., 11, 1099–1110, https://doi.org/10.1007/BF00500563, 1990. a
Höfer, M. and Schilling, F.: Heat transfer in quartz, orthoclase, and sanidine at elevated temperature, Phys. Chem. Min., 29, 571–584, https://doi.org/10.1007/s00269-002-0277-z, 2002. a, b, c, d, e, f, g, h, i, j, k, l, m, n, o, p, q, r, s, t, u, v, w, x
Hofmeister, A. M.: Mantle Values of Thermal Conductivity and the Geotherm from Phonon Lifetimes, Science, 283, 1699–1706, https://doi.org/10.1126/science.283.5408.1699, 1999. a
Hofmeister, A. M.: Thermal Diffusivity of Garnets at High Temperature, Phys. Chem. Min., 33, 45–62, https://doi.org/10.1007/s00269-005-0056-8, 2006. a
Hofmeister, A. M.: Pressure dependence of thermal transport properties, P. Natl. Acad. Sci. USA, 104, 9192–9197, https://doi.org/10.1073/pnas.0610734104, 2007. a, b, c, d
Hofmeister, A. M.: Measurements, mechanisms, and models of heat transport, Elsevier, Philadelphia, PA, 1st edn., 2019. a, b, c
Hofmeister, A. M., Branlund, J. M., and Pertermann, M.: 2.19 – Properties of Rocks and Minerals – Thermal Conductivity of the Earth, in: Treatise on Geophysics, edited by: Schubert, G., Elsevier, Amsterdam, 543–577, https://doi.org/10.1016/B978-044452748-6.00048-1, 2007. a, b
Hofmeister, A. M., Dong, J., and Branlund, J. M.: Thermal diffusivity of electrical insulators at high temperatures: Evidence for diffusion of bulk phonon-polaritons at infrared frequencies augmenting phonon heat conduction, J. Appl. Phys., 115, 163517, https://doi.org/10.1063/1.4873295, 2014. a, b, c, d
Kammer, E. W., Pardue, T. E., and Frissel, H. F.: A Determination of the Elastic Constants for Beta-Quartz, J. Appl. Phys., 19, 265–270, https://doi.org/10.1063/1.1715056, 1948. a, b
Kanamori, H., Fujii, N., and Mizutani, H.: Thermal diffusivity measurement of rock-forming minerals from 300 ∘ to 1100 ∘K, J. Geophys. Res., 73, 595–605, https://doi.org/10.1029/JB073i002p00595, 1968. a, b, c, d, e, f, g, h, i
Kittel, C.: Introduction to solid state physics, Wiley, Hoboken, NJ, 8th edn., 2005. a, b, c, d, e
Klumbach, S.: Elasticity and Viscoelasticity of Solid SiO2 as a Function of Frequency and Temperature, PhD thesis, Karlsruhe Institute of Technology, Karlsruhe, 2015. a, b
Klumbach, S. and Schilling, F. R.: Elastic and anelastic properties of α- and b-quartz single crystals, Eur. J. Mineral., 26, 211–220, https://doi.org/10.1127/0935-1221/2014/0026-2362, 2014. a
Le Chatelier, H.: Sur la dilatation du quartz, Bulletin de la Société française de Minéralogie, 13, 112–118, https://doi.org/10.3406/bulmi.1890.2156, 1890. a
Lee, H. L. and Hasselman, D. P. H.: Comparison of Data for Thermal Diffusivity Obtained by Laser-Flash Method Using Thermocouple and Photodetector, J. Am. Ceram. Soc., 68, C-12–C-13, https://doi.org/10.1111/j.1151-2916.1985.tb15255.x, 1985. a
Lenardic, A. and Kaula, W. M.: Mantle dynamics and the heat flow into the Earth's continents, Nature, 378, 709–711, https://doi.org/10.1038/378709a0, 1995. a
Levenberg, K.: A method for the solution of certain non-linear problems in least squares, Quart. Appl. Math., 2, 164–168, https://doi.org/10.1090/qam/10666, 1944. a
Lim, K.-H., Kim, S.-K., and Chung, M.-K.: Improvement of the thermal diffusivity measurement of thin samples by the flash method, Thermochim. Ac., 494, 71–79, https://doi.org/10.1016/j.tca.2009.04.019, 2009. a
Loebich, O.: The Optical Properties of Gold, Gold Bulletin, 5, 2–10, 1972. a
Lord, R. C. and Morrow, J. C.: Calculation of the Heat Capacity of α Quartz and Vitreous Silica from Spectroscopic Data, The Journal of Chemical Physics, 26, 230–232, https://doi.org/10.1063/1.1743274, 1957. a, b
Marquardt, D. W.: An Algorithm for Least-Squares Estimation of Nonlinear Parameters, J. Soc. Ind. Appl. Math., 11, 431–441, https://doi.org/10.1137/0111030, 1963. a
McMasters, R., Harth, Z. J., Taylor, R. P., and Brooke, G. M.: Testing extremely small samples using the flash diffusivity method, International Journal of Numerical Methods for Heat and Fluid Flow, 27, 551–560, https://doi.org/10.1108/HFF-03-2016-0094, 2017. a
Mehling, H., Hautzinger, G., Nilsson, O., Fricke, J., Hofmann, R., and Hahn, O.: Thermal Diffusivity of Semitransparent Materials Determined by the Laser-Flash Method Applying a New Analytical Model, Int. J. Thermophys., 19, 941–949, 1998. a, b, c, d, e, f, g, h, i, j, k, l, m, n, o
Nye, J. F.: Physical properties of crystals: their representation by tensors and matrices, Clarendon Press, Oxford University Press, Oxford, New York, 1985. a
Ohno, I.: Temperature Variation of Elastic Properties of α-Quartz up to the α-β Transition, J. Phys. Earth, 43, 157–169, https://doi.org/10.4294/jpe1952.43.157, 1995. a, b
Parker, W. J., Jenkins, R. J., Butler, C. P., and Abbott, G. L.: Flash Method of Determining Thermal Diffusivity, Heat Capacity, and Thermal Conductivity, J. Appl. Phys., 32, 1679–1684, https://doi.org/10.1063/1.1728417, 1961. a, b, c, d, e, f, g
Peierls, R.: Zur kinetischen Theorie der Wärmeleitung in Kristallen, Ann. Phys., 395, 1055–1101, https://doi.org/10.1002/andp.19293950803, 1929. a, b
Pertermann, M., Whittington, A. G., Hofmeister, A. M., Spera, F. J., and Zayak, J.: Transport properties of low-sanidine single-crystals, glasses and melts at high temperature, Contrib. Mineral. Petrol., 155, 689–702, https://doi.org/10.1007/s00410-007-0265-x, 2008. a
Raz, U., Girsperger, S., and Thompson, A. B.: Thermal expansion, compressibility and volumetric changes of quartz obtained by single crystal dilatometry to 700 ∘C and 3.5 kilobars (0.35 GPa), Tech. rep., ETH Zürich, https://doi.org/10.3929/ethz-a-004392716, 2002. a, b
Ronov, A. B. and Yaroshevsky, A. A.: Chemical Composition of the Earth's Crust, in: Geophysical Monograph Series, edited by: Hart, P. J., pp. 37–57, American Geophysical Union, Washington, D.C., https://doi.org/10.1029/GM013p0037, 1969. a
Ross, R. G., Andersson, P., Sundqvist, B., and Backstrom, G.: Thermal conductivity of solids and liquids under pressure, Rep. Prog. Phys., 47, 1347–1402, https://doi.org/10.1088/0034-4885/47/10/002, 1984. a
Roufosse, M. and Klemens, P. G.: Lattice Thermal Conductivity of Minerals at High Temperatures, J. Geophys. Res., 79, 703–705, https://doi.org/10.1029/JB079i005p00703, 1974. a
Schilling, F. R.: Mineralphysik – Ein mineralogischer Ansatz, Habilitation, Freie Universität Berlin, Berlin, 1998. a
Schilling, F. R.: A transient technique to measure thermal diffusivity at elevated temperatures, Eur. J. Mineral., 11, 1115–1124, https://doi.org/10.1127/ejm/11/6/1115, 1999. a, b
Seipold, U.: Depth dependence of thermal transport properties for typical crustal rocks, Phys. Earth Planet. In., 69, 299–303, https://doi.org/10.1016/0031-9201(92)90149-P, 1992. a
Shankland, T., Nitsan, U., and Duba, A.: Optical absorption and radiative heat transport in olivine at high temperature, J. Geophys. Res., 84, 1603–1610, https://doi.org/10.1029/JB084iB04p01603, 1979. a
Siegesmund, S.: The Significance of rock fabrics for the geological interpretation of geophysical anisotropies, no. 85 in Geotektonische Forschungen, Schweizerbart Science Publishers, Stuttgart, Germany, 1996. a
Slack, G. A.: Thermal Conductivity of Elements with Complex Lattices: B, P, S, Phys. Rev., 139, A507–A515, https://doi.org/10.1103/PhysRev.139.A507, 1965. a
Slack, G. A. and Oliver, D. W.: Thermal Conductivity of Garnets and Phonon Scattering by Rare-Earth Ions, Phys. Rev. B, 4, 592–609, https://doi.org/10.1103/PhysRevB.4.592, 1971. a
Stryczniewicz, W., Zmywaczyk, J., and Panas, A. J.: Inverse problem solution for a laser flash studies of a thin layer coatings, International Journal of Numerical Methods for Heat and Fluid Flow, 27, 698–710, https://doi.org/10.1108/HFF-03-2016-0100, 2017. a
Swank, W. D. and Windes, W. E.: Specimen Size Effects in the Determination of Nuclear Grade Graphite Thermal Diffusivity, in: Graphite Testing for Nuclear Applications: The Significance of Test Specimen Volume and Geometry and the Statistical Significance of Test Specimen Population, edited by Tzelepi, N. and Carroll, M., no. STP 1578 in Selected Technical Papers, ASTM International, West Conshohocken, https://doi.org/10.1520/STP1578-EB, 2014. a, b
Taylor, R. E. and Kelsic, B. H.: Parameters Governing Thermal Diffusivity Measurements of Unidirectional Fiber-Reinforced Composites, J. Heat Transf., 108, 161–165, https://doi.org/10.1115/1.3246881, 1986. a
Touloukian, Y., Powell, R. W., Ho, C., and Nicolaou, M.: Thermal Diffusivity, in: Thermophysical Properties of Matter-The TPRC Data Series, volume 10, Plenum Publishing Corporation, New York, 1973. a, b
Turner, S. P. and Taylor, R.: Thermophysics properties of aluminium titanate, High Temp-High Press, 23, 445–453, 1991. a
Yaroshevsky, A. A. and Bulakh, A. G.: The Mineral Composition of the Earth's Crust, Mantle, Meteorites, Moon, and Planets, in: Advanced Mineralogy: Volume 1 Composition, Structure, and Properties of Mineral Matter: Concepts, Results, and Problems, edited by: Marfunin, A. S., Springer Berlin Heidelberg, Berlin, Heidelberg, 27–36, 1994. a
Zeller, R. C. and Pohl, R. O.: Thermal Conductivity and Specific Heat of Noncrystalline Solids, Phys. Rev. B, 4, 2029–2041, https://doi.org/10.1103/PhysRevB.4.2029, 1971. a
Zoth, G. and Haenel, R.: Appendix, in: Handbook of Terrestrial Heat-Flow Density Determination, edited by: Haenel, R., Stegena, L., and Rybach, L., Solid Earth Sciences Library, Springer, the Netherlands, 449–466, 1988. a
Zubov, V. G. and Firsova, M. M.: Elastic properties of quartz near the α-β transition, Sov. Phys. Cryst., 7, 374–376, 1962. a, b