the Creative Commons Attribution 4.0 License.
the Creative Commons Attribution 4.0 License.
 | 23 Apr 2021
Local mode interpretation of the OH overtone spectrum of 1:1 phyllosilicates
Etienne Balan
Emmanuel Fritsch
Farid Juillot
Thierry Allard
Sabine Petit
Although OH overtone bands of 1:1 phyllosilicates are commonly observed in their near-infrared (NIR) spectra, their interpretation in terms of transitions between specific vibrational states is still uncertain. This situation can be traced back to the coupled nature of the fundamental OH-stretching modes involving the interlayer OH groups of 1:1 phyllosilicates. In this case, the overtone spectra cannot be directly related to their fundamental counterparts observed in the mid-infrared (MIR) spectra. In the present study, we use a parameterized quantum-mechanical approach to compute the vibrational frequencies related to the fundamental and overtone bands in serpentine group and kaolinite group minerals. The simple model is based on a description of the vibrational properties of a cluster of OH groups in terms of harmonically coupled anharmonic oscillators. The comparison of the theoretical results with experimental observations makes it possible to interpret most of the salient features of the overtone spectrum of 1:1 phyllosilicates. Unlike the bands observed in the MIR spectra, the overtone bands observed between 7000 and 7300 cm−1 are related to local transitions from the ground state to the second excitation level of OH groups, whereas the weaker bands observed between 7300 and 7400 cm−1 involve a double excitation to the first vibrational level of OH oscillators. The results also support the assignment of specific overtone bands to the occurrence of substituted divalent cations of transition elements in serpentine group minerals.
- Article
(1012 KB) - Full-text XML
- BibTeX
- EndNote


Near-infrared (NIR) spectroscopy is a versatile tool that has been applied to phyllosilicates in a wide variety of scientific contexts ranging from the mineralogical exploration of planet and asteroid surfaces using remote sensing techniques (e.g. King and Clark, 1989; Bishop et al., 2008; Carter et al., 2013; Greenberger et al., 2015) to detailed studies of their crystal-chemical properties (e.g. Petit et al., 1999, 2004a, b; Bishop et al., 2002; Baron and Petit, 2016; Blanchard et al., 2018), through the monitoring of industrial processes (e.g. Guatame-Garcia et al., 2018), asbestos detection (Lewis et al., 1996) and mining geology applications (e.g. Mathian et al., 2018). The NIR spectra of 1:1 phyllosilicates have also been shown to be sensitive to their stacking pattern and ordering scheme (e.g. Delineau et al., 1994; Madejová et al., 2011; Cheng et al., 2010; Lai et al., 2019; Pineau et al., 2020), enabling the identification of polytypic varieties in complex samples.
The absorption bands observed in the MIR range at ambient temperature are dominated by fundamental transitions occurring from the ground state to the first excited vibrational states. In contrast, the main signals observed in the NIR spectra of phyllosilicates can relate to higher excitation levels of OH vibrational modes. Combination bands observed in the 4200–4700 cm−1 range involve the simultaneous excitation of a stretching and a M–OH bending mode. Overtone bands observed in the 7000–7500 cm−1 range correspond to the double excitation of OH-stretching modes. Focusing on overtone bands, the lower sensitivity of their absorption coefficient to H-bond strength can be useful for chemometric applications (Carteret, 2009). In addition, the anharmonicity of OH bonds can be determined by comparing the overtone frequency (ω2OH) to that of the fundamental mode (ωOH). The anharmonicity parameter has been determined in talc specimens displaying various octahedral and tetrahedral environments, leading to a value of −86.5 ± 3 cm−1 (Petit et al., 2004b), consistent with the general trend observed between OH-stretching frequency and anharmonicity (e.g. Wöhlecke and Kovaìcs, 2001; Szalay et al., 2002).
Compared with talc, the overtone spectrum of 1:1 phyllosilicates is more complex due to the occurrence of several inequivalent OH groups in their primitive cell. Three OH groups, referred to as interlayer OH groups, are located at the top of the di- or tri-octahedral sheet and are hydrogen-bonded with the basal plane of O atoms of the next layer. The other OH group, referred to as the inner OH group, is located inside the layer, between the octahedral and tetrahedral sheets. In lizardite, the three interlayer OH groups are related to each other by a three-fold symmetry axis, whereas the inner OH group is located on the three-fold symmetry axis and oriented perpendicularly to the layers (Mellini and Viti, 1994). In kaolinite group minerals, three inequivalent interlayer OH groups occur and the inner OH group points in a direction parallel to the layers (Blount et al., 1969; Bish, 1993; Bish and Johnston, 1993). The inner OH group in kaolinite group minerals usually leads to well-defined narrow bands in their NIR and MIR spectra. The corresponding anharmonicity parameters were found to be close to those determined for talc samples (Petit et al., 2004b) and consistent with theoretical predictions (Balan et al., 2007), further supporting the assignment of the observed bands to inner OH groups. In contrast, a straightforward correlation of the other overtone bands to those observed in the MIR spectra may prove to be more difficult, a difficulty that can be traced back to the coupled nature of OH-stretching modes involving the interlayer OH groups (e.g. Balan et al., 2002b, 2005). In the case of coupled oscillators, the relations between their overtone and fundamental spectrum are more complex (Child, 1985), and a modelling approach could help improve our understanding of the overtone spectrum of 1:1 phyllosilicates.
In the present study we use a parameterized quantum-mechanical approach to compute the vibrational frequencies related to the fundamental and overtone bands in serpentine group and kaolinite group minerals. The model is based on a local mode description of the vibrational properties of the system, a description well adapted to the modelling of the overtone spectra of molecules (e.g. Child, 1985; Sibert, 2019). The comparison of the theoretical results with experimental observations on reference samples makes it possible to interpret most of the salient features of the overtone spectrum of 1:1 phyllosilicates.
Samples of lizardite and chrysotile have been collected in the saprock of thick Ni-laterite deposits from New Caledonia (samples L1 and C1; Fritsch et al., 2016). The monophasic composition of the samples was cross-checked by Raman spectroscopy, X-ray diffraction and high-resolution transmission electron microscopy (Fritsch et al., 2016). Their chemical composition (Table 1) was determined using a PerkinElmer 1100b atomic-absorption spectrophotometer (AAS) after acid digestion of 1000 mg of a finely powdered aliquot in a high-pressure TFM Teflon vessel using an ETHOS 1600 MILESTONE microwave system. It indicates the presence of minor amounts of transition elements (mostly Fe, Ni and Cr) and aluminium, which occur at higher concentration levels in the lizardite sample than in the chrysotile sample. Kaolinite from Decazeville (France), dickite from Nowa Ruda (Poland) and nacrite from Mesloula (Algeria) are well-ordered reference samples of kaolinite group minerals, which have been previously investigated in the MIR range by Balan et al. (2002a, 2005, 2010, 2014).
Table 1Chemical composition of the serpentine group mineral samples
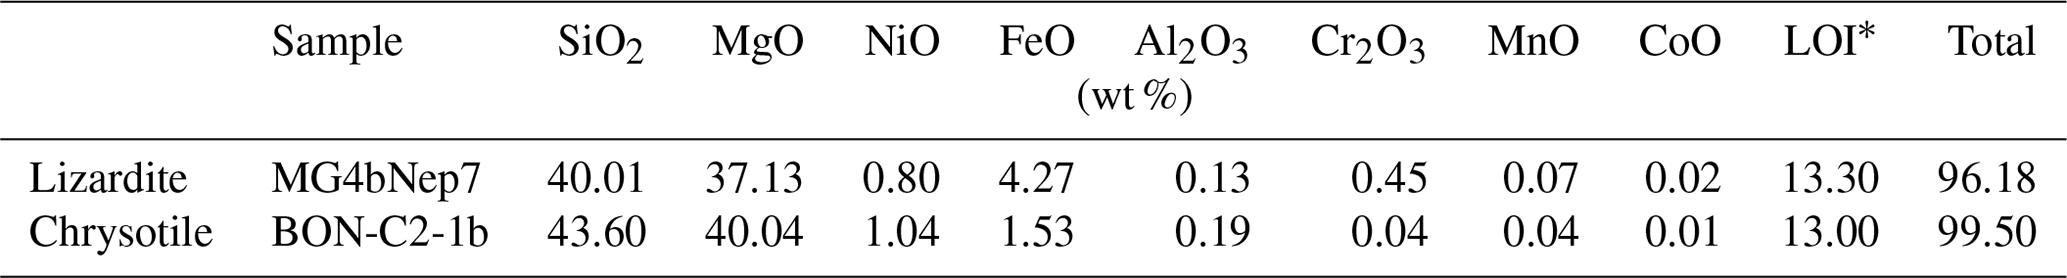
* Loss on ignition.
The mid-infrared (MIR) spectra of serpentine samples have been recorded in the transmission mode on KBr pellets (sample KBr mass ratio ∼ 1 %) using a Thermo Scientific Nicolet 6700 FT-IR spectrometer equipped with an EverGlo source, KBr beam splitter and DTGS-KBr detector at a resolution of 4 cm−1 with co-addition of 100 scans. Near-infrared (NIR) spectra of serpentine samples were recorded on pure powders at a 4 cm−1 resolution in a diffuse reflectance geometry using a Thermo Scientific Nicolet 6700 FT-IR spectrometer equipped with a white light source, a CaF2 beam splitter and an integrating sphere with internal InGaAs detector and reference gold mirror. NIR diffuse reflectance spectra of kaolinite group minerals have been recorded at a 2 cm−1 resolution using a Nicolet 6700 FTIR spectrometer set with a white light source, quartz beam splitter, DTGS-KBr detector, reference Al mirror and Collector II diffuse reflectance accessory.
The vibrational properties of crystals are usually described in a normal mode picture. In this case, the harmonic vibrational modes are obtained from the eigenvectors of the dynamical matrix, whereas the eigenvalues lead to vibrational frequencies. The corresponding scheme is commonly implemented in electronic structure packages, making it possible to compute the infrared and Raman spectra of crystalline and molecular systems from first principles. Application of this approach to 1:1 phyllosilicates has provided a sound picture of their OH-stretching modes in terms of coupled oscillators, consistent with experimental observations (e.g. Balan et al., 2001, 2002b, 2005; Tosoni et al., 2006; Prencipe et al., 2009). It has also provided a quantitative assessment of the macroscopic electrostatic effects related to collective atomic displacements in polar crystals (Farmer, 1998, 2000; Balan et al., 2001, 2002b). However, this approach does not account for the significant anharmonicity of OH bonds. The matching of theoretical OH-stretching frequencies with those of the experimentally observed fundamental absorption bands results from fortuitous but systematic error cancellations (Balan et al., 2007) or requires a post-processing anharmonic correction of frequencies (Tosoni et al., 2006; Prencipe et al., 2009). This weakness is exacerbated when considering higher excitation levels because of the increasing role of anharmonicity in the system dynamic (Child, 1985). In this context, the anharmonic description of the individual OH bonds is mandatory and the vibrational properties of the system can then be retrieved by coupling the corresponding anharmonic oscillators. For example, the anharmonic detuning of O–H vibrations in the overtone spectrum of H2O has been investigated in details by Child and Lawton (1981). The splitting of OH-stretching frequencies observed in the fundamental H2O spectrum is reduced by a factor of 2 in its first overtone spectrum. Accordingly, it can be anticipated that the moderate (∼ 10–30 cm−1) coupling of the interlayer OH-stretching vibrations observed in 1:1 phyllosilicates (Balan et al., 2001, 2002b, 2005) becomes marginal in the description of their overtone spectra, which supports a description of the corresponding vibrational properties in terms of local mode.
However, further assumptions are necessary to build up such a local mode description. The model is restricted to the OH-stretching modes only, which are almost fully decoupled from the other vibrational mode observed at a significantly lower frequency (Balan et al., 2005). The coupling between the anharmonic OH oscillators is also restricted to the first OH neighbours of the same cell, and any long-range collective behaviour is neglected. This second assumption is reasonable for high-frequency weakly dispersing vibrational modes (Salje, 1992) and will be addressed in further detail in the discussion section. Under these two assumptions, the description of the vibrations of interlayer OH groups in 1:1 phyllosilicates is reduced to the treatment of a molecular cluster displaying the three interlayer OH groups of their primitive unit cell. Following Child and Halonen (1984) and Child (1985), the energy levels and vibrational wave functions of the system are obtained as eigenvalues and eigenvectors of an effective Hamiltonian:
where and denote the different OH groups, and the sums run over all possible combinations. is a single-bond oscillator Hamiltonian, and Hαβ describes the harmonic coupling between two different bond oscillators. The single-bond oscillator can be described as a Morse oscillator with eigenstates |nα and eigenvalues:
where ωα is the harmonic vibrational frequency expressed as wavenumbers, ωαχα relates to the potential anharmonicity, and h and c are the Planck constant and the speed of light, respectively. For an isolated oscillator, ωαχα compares directly to the anharmonicity constant experimentally obtained from the analysis of its overtone spectrum: . Therefore, the diagonal matrix elements of the effective Hamiltonian expressed in the local mode product basis |n1n2n3 are
The harmonic coupling terms in the effective Hamiltonian (1) carry selection rules . In the case where ωα≫ωαχα, the dominant coupling occurs within the same overtone manifold defined by , whereas the coupling between states belonging to different manifolds is much weaker and can be neglected in the present case. Accordingly, the off-diagonal matrix elements are
where λα,β is a parameter measuring the coupling between oscillators α and β, and if i=j and if i≠j. Depending on the relative value of anharmonicity and coupling parameters, the system behaviour can thus continuously shift from that of uncoupled anharmonic oscillators (ωαχα≫λ) to that of coupled harmonic oscillators (λ≫ωαχα). In the present study, only the N=0 (ground state), 1 and 2 manifolds are considered as they correspond to the vibrational states involved in the fundamental and first overtone transitions. The effective Hamiltonian built for modelling the overtone spectrum of interlayer OH groups in 1:1 phyllosilicates thus corresponds to a 10×10 symmetric matrix whose diagonalization leads to 10 vibrational levels. Appropriate sets of Hamiltonian parameters (ωα, ωαχα and λ) are then determined by comparing the theoretical predictions to the experimental observations, using a trial-and-error approach.
In lizardite, the three interlayer OH groups are related to each other by a three-fold symmetry axis. For a C3V symmetry, the effective Hamiltonian can be decomposed in submatrices corresponding to the A1 and E irreducible representations, and the corresponding symmetrized expressions are given by Halonen and Child (1983). The symmetrized vibrational quantum states forming the basis can be denoted by the corresponding quantum numbers of the isolated oscillators and by the relevant irreducible representation. In the states belonging to the fully symmetric A1 representation, equal coefficients describe the contributions of each oscillator to the full vibrational state. For the C3V symmetry, it can also be observed that the splitting of A1 and E states belonging to the N=1 manifold is equal to 3λ, whereas the splitting between the |2 0 0 and |1 1 0 type states is approximately equal to 2 ωαχα for small values of λ (Halonen and Child, 1983) (Fig. 1).
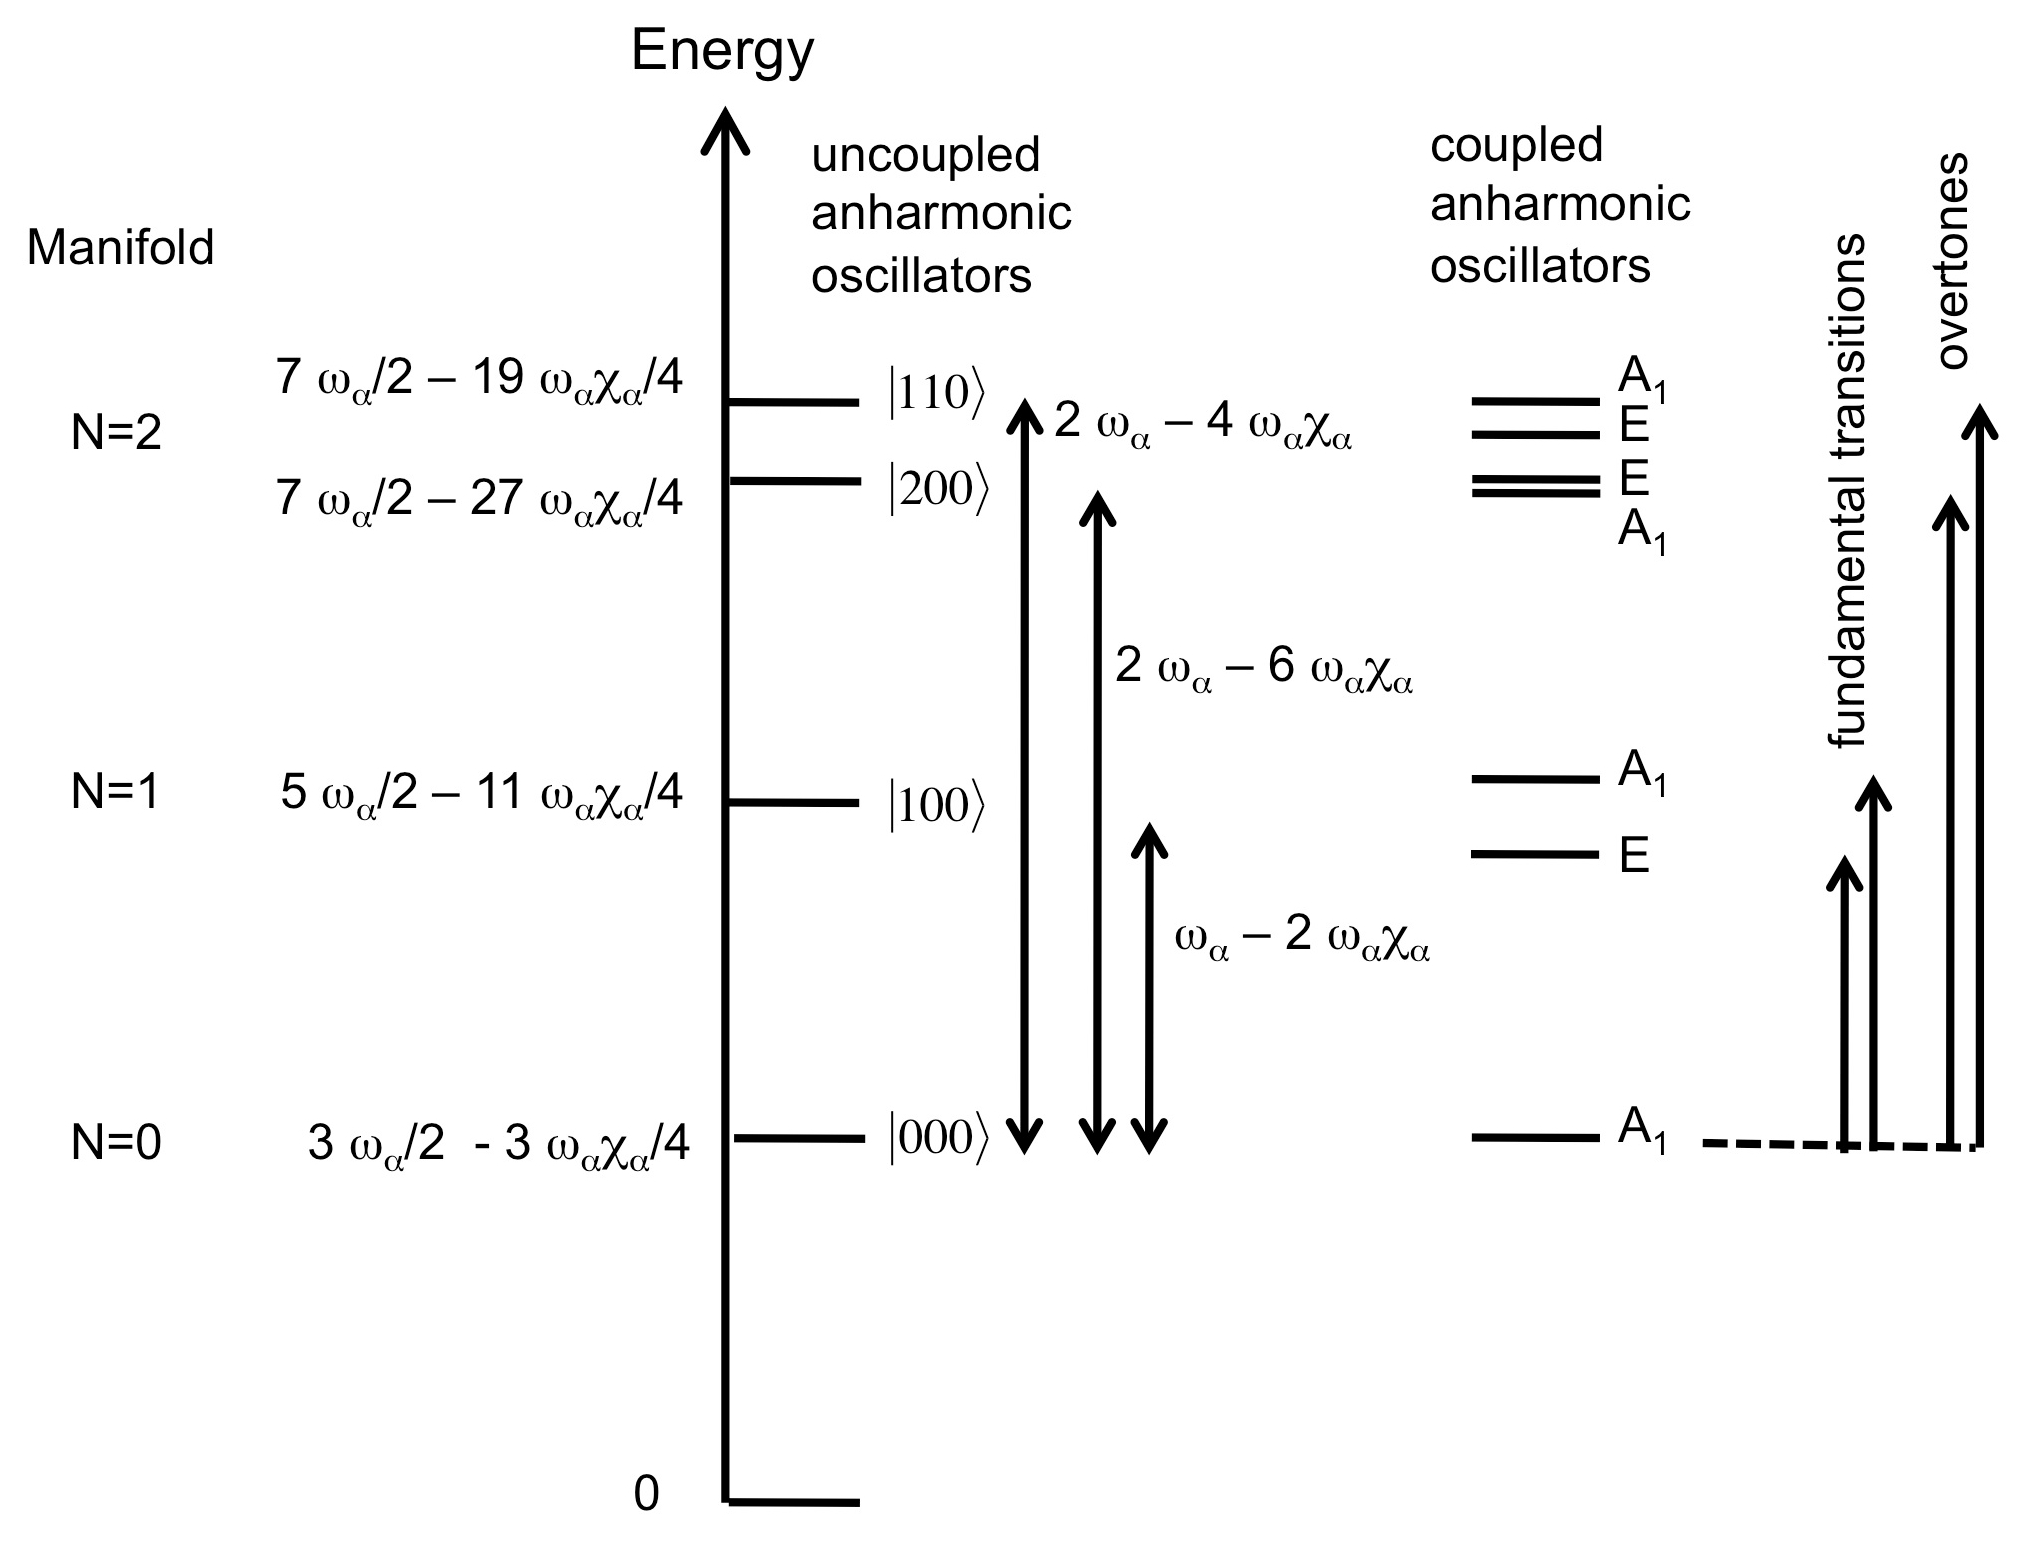
Figure 1Scheme of the respective contribution of harmonic frequencies (ωα), anharmonicity parameters (ωαχα) and mode coupling in determining the energy of observed fundamental and overtone transitions for a C3V symmetry. Note that the figure is not to scale because the harmonic frequencies are significantly larger than the anharmonicity and mode coupling parameters.
Although a full treatment of overtone absorption intensities is beyond the objectives of the present study, they can be qualitatively discussed in the local mode picture following Child and Halonen (1984). The intensity of an overtone transition is determined by the transition moment integral:
where i denotes the ground state, f the excited state and μ the dipole moment function of the system. The transition moment integral thus depends on the electrical anharmonicity, i.e. on the specific expression of the dipole moment function, on the potential anharmonicity, which determines the basis functions related to the isolated anharmonic oscillators, and on the vibrational coupling. Under the assumption that the ground state is well described by the local mode product |0 0 0 and that the dipole moment function is a sum of the individual bond dipole contributions, it can be shown that the intensity of first overtones in molecular systems is concentrated in transitions from ground state to |2 0 0, |0 2 0 or |0 0 2 states (Child and Halonen, 1984).
4.1 Fundamental and first overtone spectrum of OH stretching in 1:1 phyllosilicates
The MIR and NIR spectra of the investigated samples (Fig. 2) are consistent with those previously reported for 1:1 phyllosilicates (e.g. Farmer, 1974; Madejová et al., 2011).
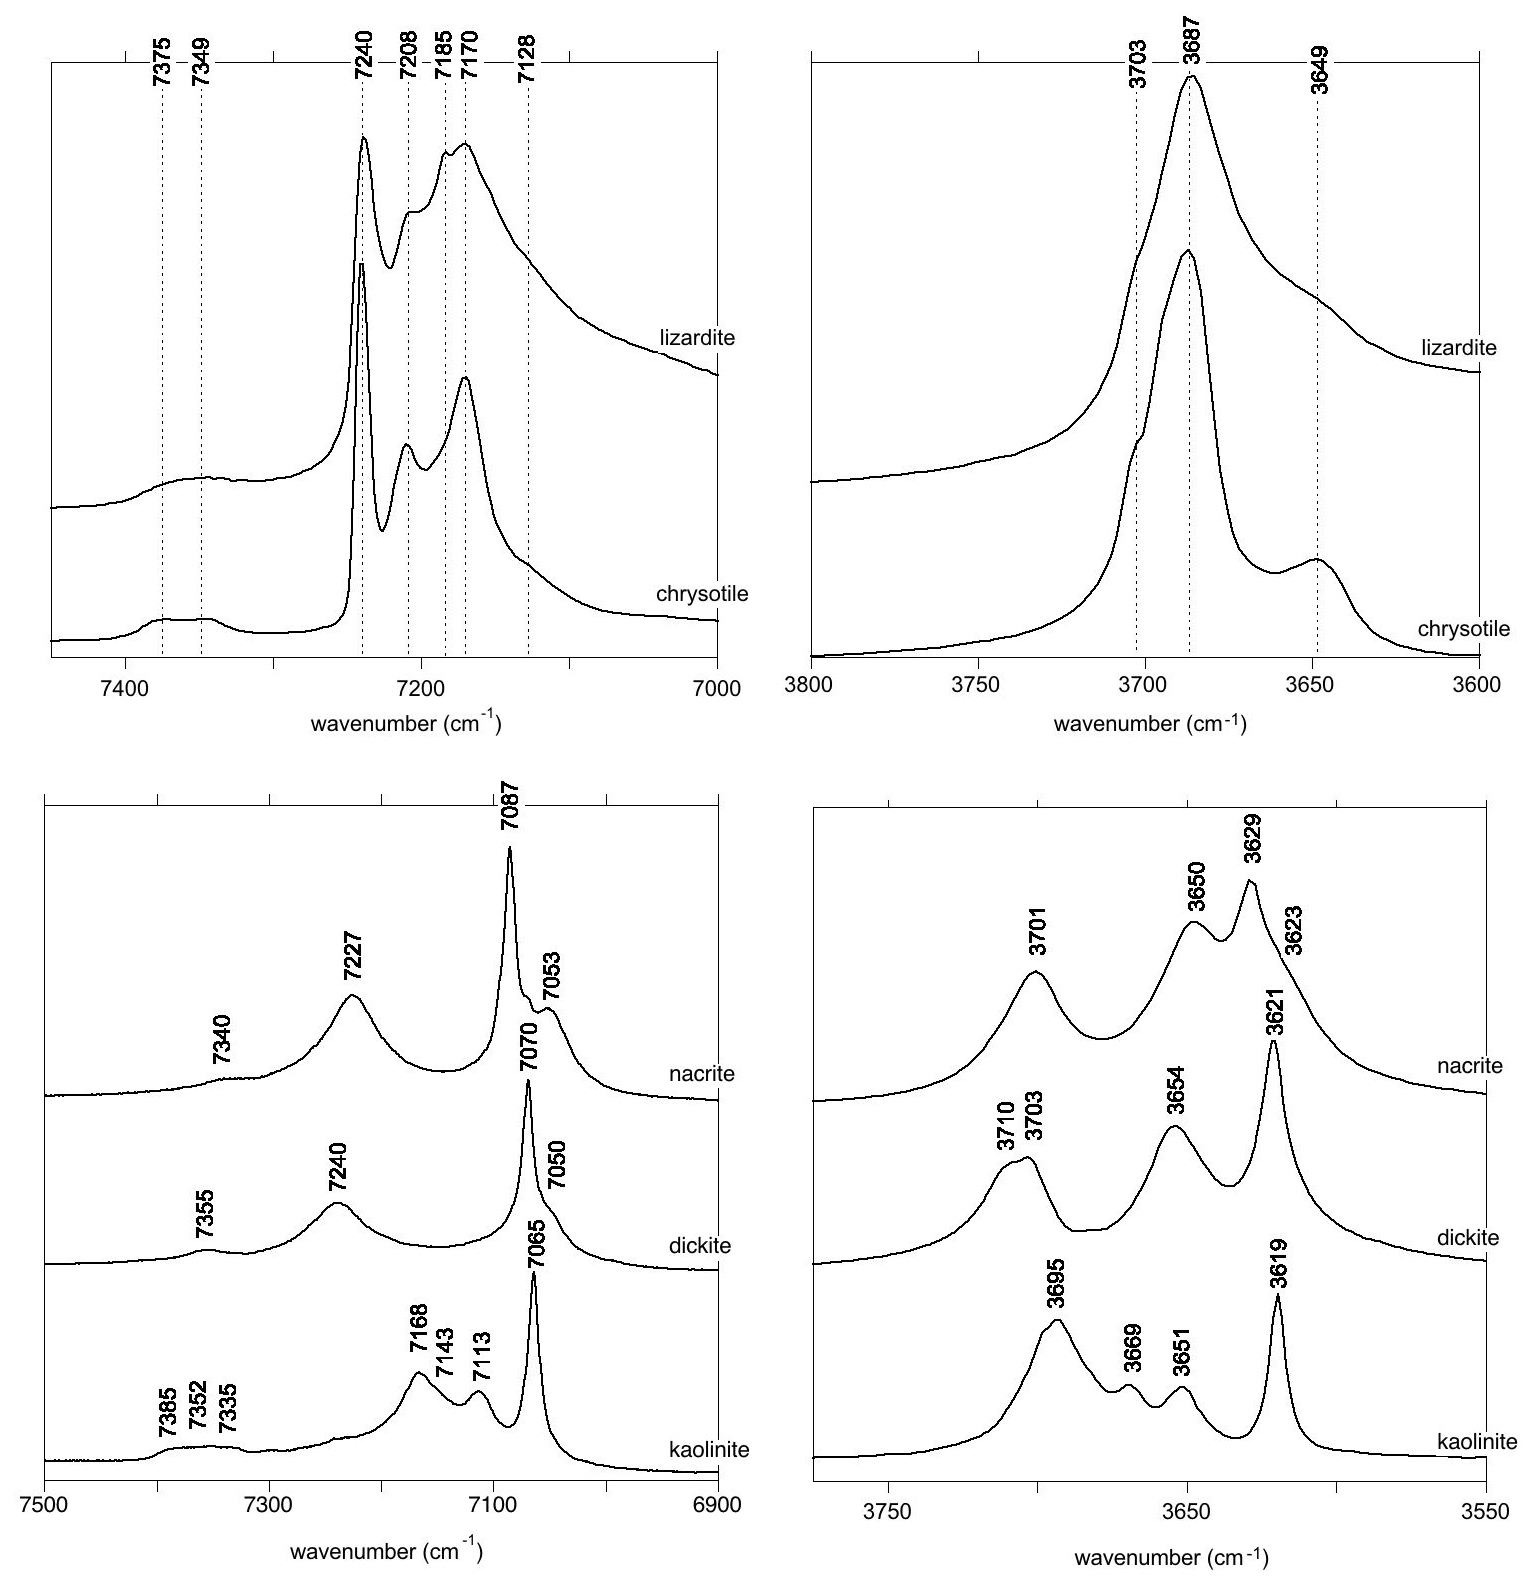
Figure 2MIR and NIR OH-stretching spectra of the investigated serpentine group and kaolinite group mineral samples. The MIR spectra are reported as absorbances and the NIR spectra as log(), where R is the sample reflectance. Spectra are scaled arbitrarily for graphical reasons.
Lizardite displays a band at 3703 cm−1 corresponding to the inner OH group whereas a strong, broader and asymmetric band at 3687 cm−1 is related to the in-phase stretching (A1 representation of 31 m point group) of the interlayer OH groups (Balan et al., 2002b; Prencipe et al., 2009). The degenerate modes corresponding to out-of-phase stretching (E representation) lead to a weaker feature at 3649 cm−1. The chrysotile spectrum displays similar bands with narrower shapes, making it possible to clearly identify their discrete contributions (Fig. 2). As previously discussed (Balan et al., 2002b), the 3687 cm−1 band is inhomogeneously broadened by macroscopic electrostatic effects, whose magnitude can also shift the vibrational frequency by ∼ 20 cm−1. Accordingly, the weak shoulder at ∼ 3695 cm−1 affecting the shape of the main band in the chrysotile spectrum (Fig. 2) will not be discussed in further detail in the present study. Additional band broadening is also expected in the lizardite spectrum due to the higher impurity concentration in the sample (Table 1). The OH overtone spectrum of lizardite displays three major features at 7170, 7208 and 7240 cm−1. A shoulder at 7128 cm−1 and a weaker narrow band at 7185 cm−1 are also observed. Finally, two significantly weaker bands are observed at 7375 and 7349 cm−1. Except the absence of the narrow band at 7185 cm−1, the chrysotile overtone spectrum displays narrower features at frequencies similar to those determined for lizardite (Fig. 2).
In the MIR spectrum of kaolinite group minerals, the narrow absorption band related to the inner OH group is observed at 3619, 3621 and 3629 cm−1 in kaolinite, dickite and nacrite, respectively (Fig. 2). In kaolinite, the coupled motion of the three interlayer OH groups leads to three bands at 3651, 3669 and 3695 cm−1 (Farmer, 1998, 2000; Balan et al., 2001). In dickite and nacrite, the canting of one of the interlayer OH group leads to the decoupling of its stretching motion from that of the two other groups. Its stretching mode is observed at 3703–3710 and 3701 cm−1 in dickite and nacrite, respectively (Balan et al., 2005). A minor coupling of OH motion between adjacent layers in dickite explains the splitting observed at 3703–3710 cm−1 (average frequency 3706.5 cm−1) (Balan et al., 2005, 2010). The in-phase motion of the remaining two interlayer OH groups leads to a band at 3654 and 3650 cm−1 in dickite and nacrite, respectively. The corresponding out-of-phase stretching mode leads to a weaker absorption feature at ∼ 3623 cm−1, strongly overlapping with the inner OH-stretching band in the dickite spectrum. The overtone spectra of kaolinite, dickite and nacrite (Fig. 2) display a narrow band at 7065, 7070 and 7087 cm−1, respectively, that can be related to the inner OH group (Petit et al., 2004b). The kaolinite spectrum displays three bands at 7113, 7143 and 7168 cm−1 and a weaker triplet at 7335, 7352 and 7385 cm−1. The dickite and nacrite spectra share similar features with a band at 7050 and 7053 cm−1, respectively, and another band at 7240 and 7227 cm−1, respectively. Additional weak features are observed at 7355 and 7340 cm−1, respectively. Note that the weak contribution at 7240 cm−1 in the kaolinite spectrum is likely related to the occurrence of a minor quantity of dickite-type stacking in this hydrothermal sample (Balan et al., 1999), a feature frequently revealed in well-ordered kaolinite by low-temperature FTIR spectroscopy (e.g. Johnston et al., 2008; Balan et al., 2014).
4.2 Interpretation of the overtone spectrum of serpentine group minerals
The relatively strong and narrow band observed at 7240 cm−1 in the lizardite and chrysotile spectra is most likely related to the inner OH group (Fig. 3). The isolated character of the inner OH-stretching vibration leads to a straightforward relation between the overtone and fundamental spectra. The frequency of the fundamental transition observed at 3703 cm−1 corresponds to an anharmonicity parameter cm−1. This value is very close to those previously determined for OH groups in phyllosilicates (Petit et al., 2004b), which supports the assignment of the 7240 cm−1 band.

Figure 3Assignment of OH overtone transitions in serpentine group minerals. Transitions calculated for a molecular cluster are indicated by the vertical bars labelled with the corresponding excited state (Table 3). The thick vertical bars denote an expected stronger absorption intensity due to the symmetry of the excited state. Note the bands related to the occurrence of divalent cations (M = Fe2+ and/or Ni2+) substituting for Mg in the tri-octahedral sheet of serpentine group minerals.
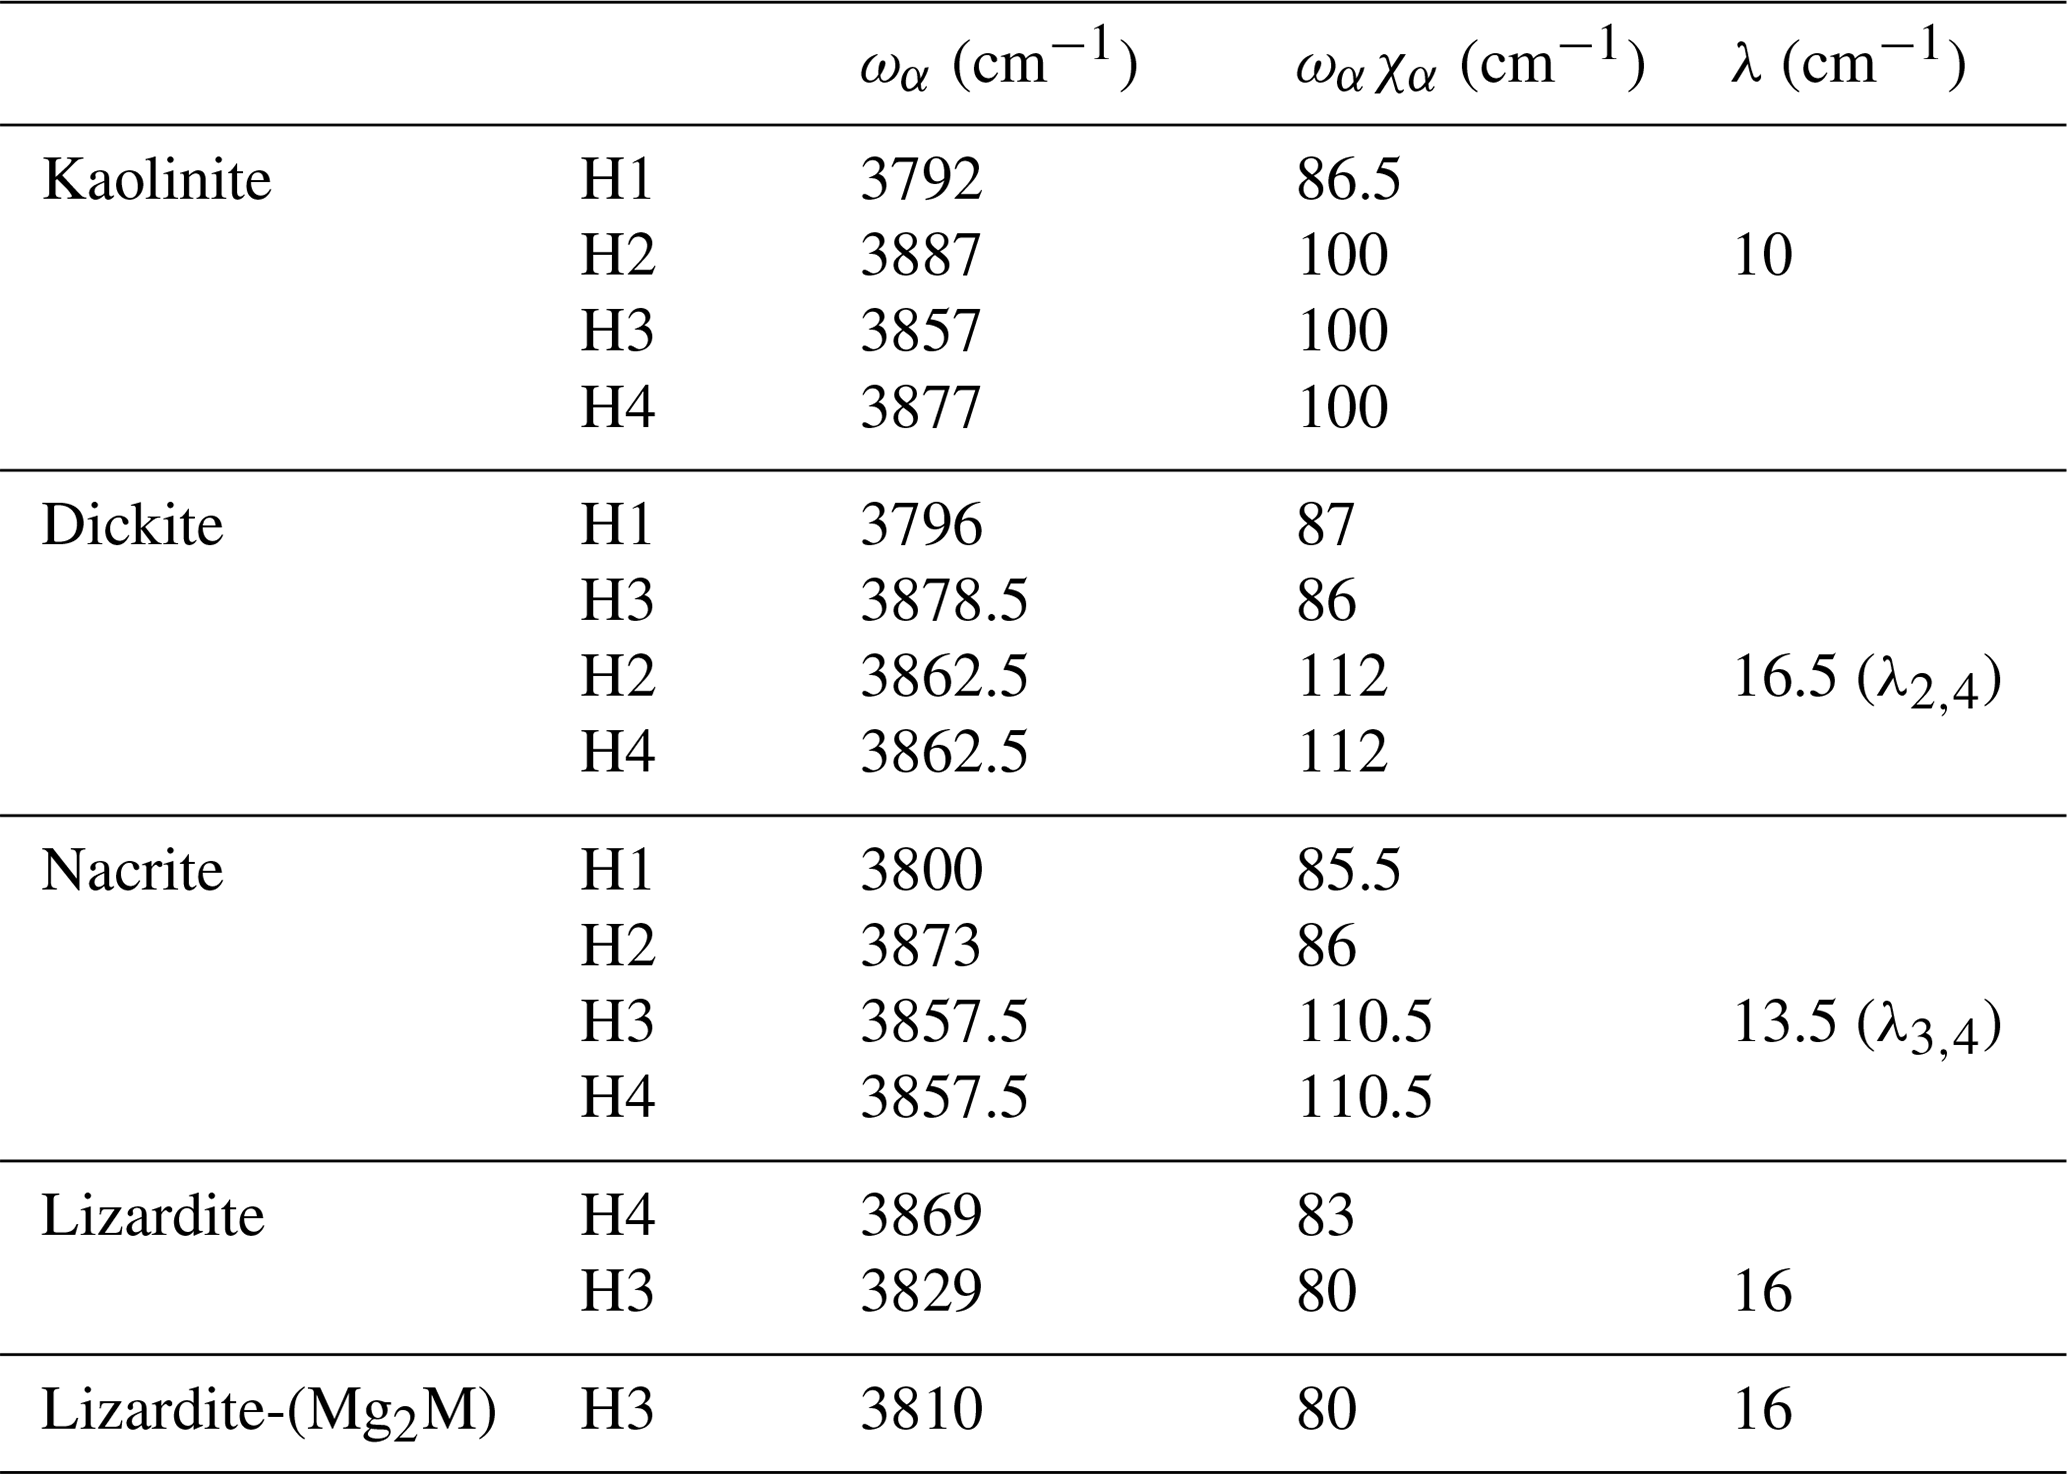
In contrast, it is less easy to establish a direct correlation between overtone and fundamental transitions for the other bands. An additional difficulty arises from the significant width of the MIR signals, making it difficult to accurately determine the frequency of fundamental transitions. Considering both the MIR and NIR spectra, the parameters of the effective Hamiltonian were set to ωα=3829 cm−1, ωαχα=80 cm−1 and λ=16 cm−1 using a trial-and-error approach (Table 2). These parameters lead to fundamental transitions at 3653 and 3701 cm−1, whereas four frequencies of overtone transitions are predicted (Table 3). Recalling that the intensity of overtone bands arises from transitions to |n 0 0-type states rather than to |(n−1) 1 0 type states, the dominant band is expected to correspond to a transition to a state with a predominant |2 0 0 character. In addition, the approximation that the total dipole function in the transition moment integral (Eq. 5) is the sum of individual bond dipole contributions (Child and Halonen, 1984) with nearly parallel orientation implies that states with A1 symmetry will lead to stronger bands than those belonging to the E representations. The corresponding transition to the |2 0 0,A1 state is calculated at 7168 cm−1, matching the frequency of the band experimentally observed at 7170 cm−1 (Table 3, Fig. 3). The eigenstates with dominant |1 1 0 character are observed as weak bands in the 7300–7400 cm−1 range. As discussed above, the transition to the state with A1 symmetry calculated at 7380 cm−1 is expected to be dominant, matching the feature observed at 7375 cm−1.
Table 2Effective parameters of local OH-stretching modes in 1:1 phyllosilicates: harmonic frequencies ωα, anharmonicity constants ωαχα and mode coupling parameters λ. The labels of H atoms correspond to those of Balan et al. (2002b, 2005).
Based on an ideal structure, three bands are thus expected to occur in the overtone spectrum of lizardite. One identified at 7240 cm−1 is related to the inner OH group, whereas the two others identified at 7170 and 7375 cm−1 correspond to transitions to vibrational states involving the interlayer OH groups. Accordingly, the other bands observed in the overtone spectra of the investigated samples (Fig. 3) should stem from their non-ideality. Consistently with the chemical composition of the samples, the band at 7208 cm−1 in the lizardite spectrum can be assigned to an inner OH group in a Mg2M environment, where M denotes a Ni2+ or a Fe2+ cation. The corresponding downshift with respect to the Mg3 environment is 32 cm−1, which is consistent with the downshift of 28 cm−1 reported by Baron and Petit (2016) for synthetic samples of the lizardite–nepouite series. The small and narrow band at 7185 cm−1 (downshift of 55 cm−1) could correspond to an inner OH group in a MgM2 environment (downshift of 62 cm−1; Baron and Petit, 2016), but the occurrence of traces of talc, displaying an overtone band at 7185 cm−1 (Petit et al., 2004b), is more likely, even though these traces go unnoticed in the MIR spectrum.
The occurrence of divalent cationic substitutions in the octahedral sheet is also expected to affect the interlayer OH groups connected to these cations. For a given substituted cation M in the low concentration limit, three interlayer OH groups occur in a Mg2M environment. A new set of the effective Hamiltonian parameters was thus considered, corresponding to a decrease in the harmonic frequency from 3829 to 3810 cm−1 and identical anharmonicity and coupling parameters (Table 2). These parameters lead to fundamental frequencies at 3682 and 3634 cm−1, corresponding to signals overlapping with the stronger bands related to Mg3 environments in the MIR spectra. In contrast, the dominant bands in the overtone spectrum are calculated at 7129 and 7342 cm−1 for the transitions to |2 0 0 and |1 1 0 states, respectively, and match the features observed at 7128 and 7349 cm−1 (Fig. 3). Consideration of the local effect of substituting cations in the octahedral sheet on the interlayer OH groups thus completes the interpretation of the overtone spectrum of the two serpentine samples. Note however that this minimal modification of the effective Hamiltonian neglects the symmetry lowering related to the Fe or Ni for Mg substitution and assumes that the corresponding three OH groups occurring in a Mg2M environment still display similar vibrational properties.
4.3 Interpretation of the overtone spectrum of kaolinite group minerals
In the overtone spectra of kaolinite group minerals (Fig. 4), the bands related to the inner OH group are well identified and lead to anharmonicity parameters of −85 to −87 cm−1, as previously determined by Petit et al. (2004b).

Figure 4Assignment of OH overtone transitions in kaolinite group minerals. Transitions calculated for a molecular cluster are indicated by the vertical bars labelled with the corresponding excited states (Table 3). The thick vertical bars denote an expected stronger absorption intensity due to the symmetry of the excited state. In the model Hamiltonian, the OH3 and OH4 groups of nacrite and OH2 and OH4 groups of dickite are treated as equivalent oscillators. The asterisk indicates the overtone of the inner OH-stretching mode.
Concerning the interlayer OH-stretching modes, the absence of symmetry relations potentially leads to a set of nine parameters in the effective Hamiltonian describing the coupling of the three OH oscillators. Therefore, several assumptions have been made to reduce the number of free parameters. In dickite and nacrite, the stretching of one of the OH groups (H2 in nacrite and H3 in dickite) appears as almost uncoupled from that of the two other groups (Balan et al., 2005), and the related coupling constants have thus been set to zero. In addition, it has been assumed that the two coupled OH groups display identical harmonic frequencies and anharmonicity parameters. Within these approximations, the vibrational states are denoted by three quantum numbers, the first one being related to the uncoupled oscillator and a ± symbol indicating the symmetric or antisymmetric states of the other two coupled OH groups (Fig. 4, Table 3). Using appropriate sets of parameters obtained by a trial-and-error approach (Table 2), the diagonalization of the effective Hamiltonian leads to a very good match between observed and calculated frequencies (Fig. 4, Table 3), supporting the assignment of overtone bands. In the overtone spectrum of dickite, the band observed at 7050 cm−1 is related to a transition to the symmetric state, whereas the band at 7240 cm−1 corresponds to a transition to the |2 0 0 state involving the OH3 oscillator. Interestingly, the presence of the weak band at 7355 cm−1 (Fig. 4) can only be explained by an interaction of the OH3 oscillator with the more strongly coupled OH2 and OH4 oscillators. Although marginally affecting the frequencies (and for this reason the coupling parameter was set to zero in the effective Hamiltonian, Table 2), the non-zero absorption at 7355 cm−1 indicates the simultaneous excitation of OH3 with OH2 or OH4 oscillators. Using a different set of parameters (Table 2), an identical interpretation can be proposed for the overtone spectrum of nacrite (Fig. 4).
Table 3Observed and calculated anharmonic frequencies of vibrational transitions involving interlayer OH in 1:1 phyllosilicates. The coefficients of the dominant contributions to the excited state are indicated. The quantum numbers refer to the isolated oscillators as indicated in the right column.
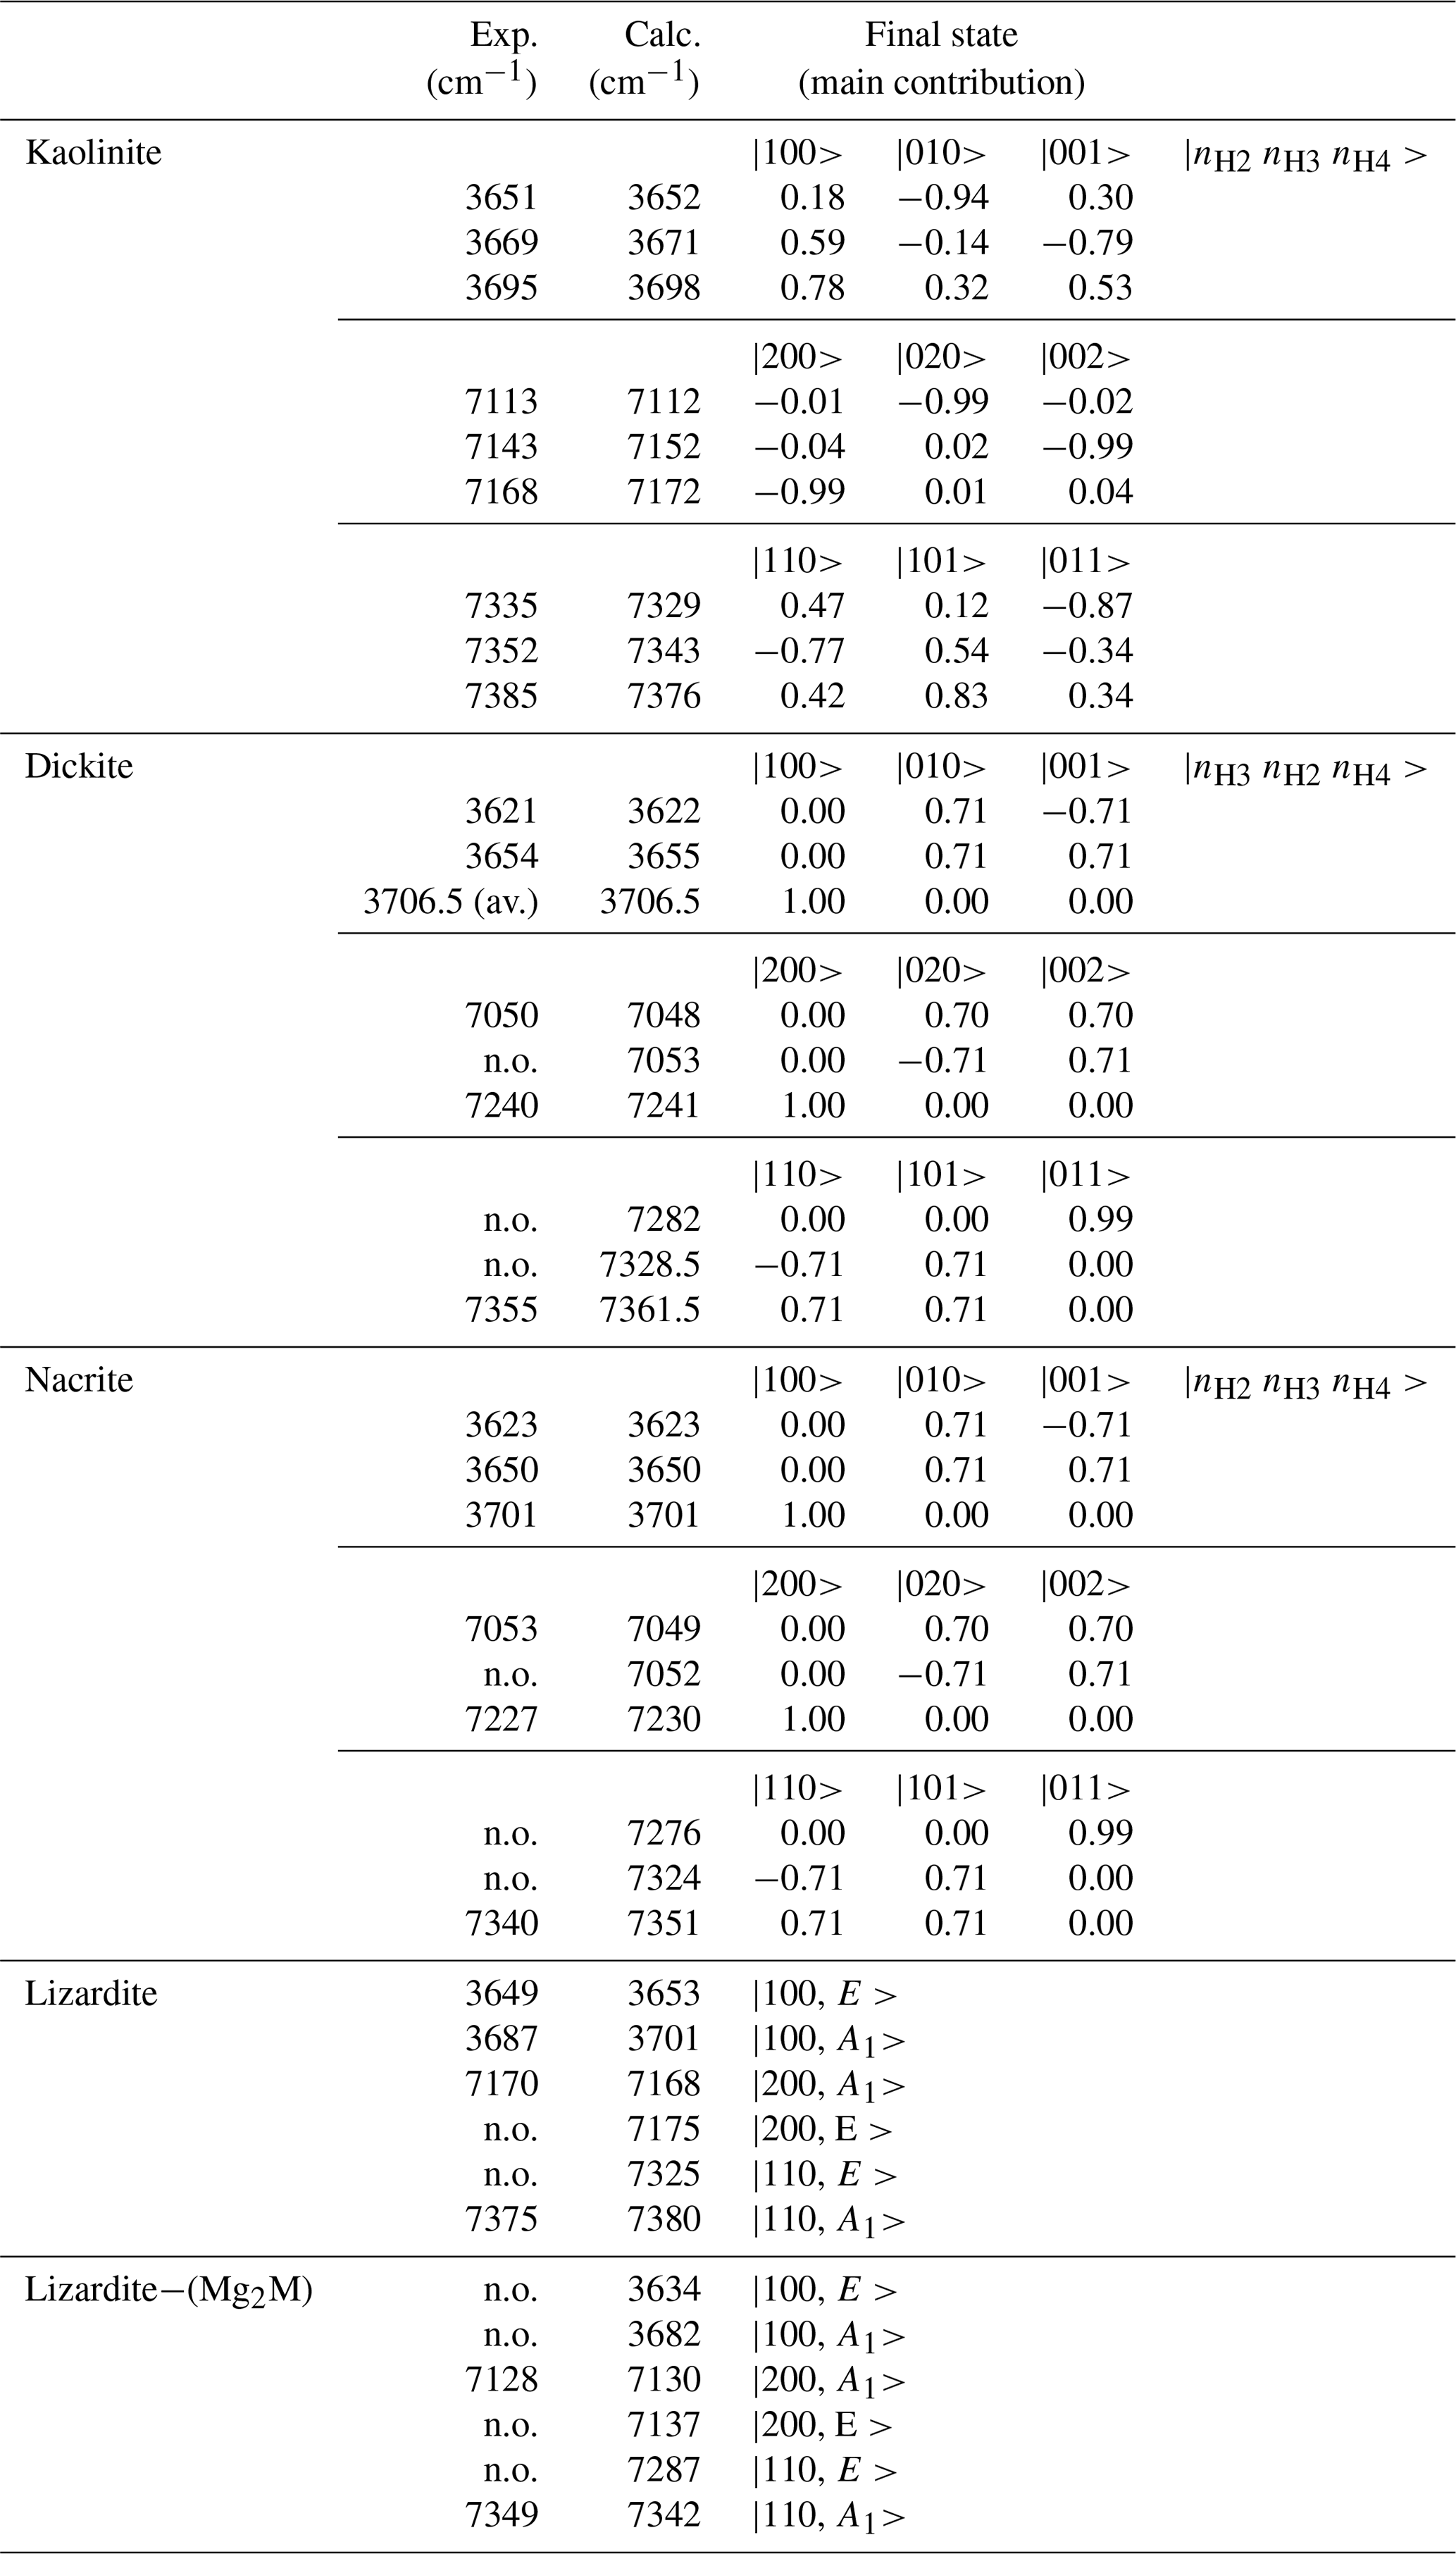
For kaolinite, the three inequivalent OH groups are coupled and it was assumed that they could be described using different harmonic frequencies but with a single value for the anharmonicity parameter and for the coupling constant (Table 2). The harmonic frequencies were assigned to the OH2, OH3 and OH4 groups by considering the respective contributions of these OH groups to the theoretical normal stretching modes determined by Balan et al. (2001). Under these assumptions, the three overtone bands at 7113, 7143 and 7168 cm−1 (Fig. 4) are dominantly related to local transitions to the second excitation level of the OH3, OH4 and OH2 oscillators, respectively, whereas the triplet at 7335, 7352 and 7385 cm−1 stems from transitions to states with dominant |0 1 1, |1 1 0 and |1 0 1 characters (Table 3).
The proposed simple model makes it possible to assign most of the bands observed in the overtone spectrum of 1:1 phyllosilicates in terms of specific transitions from ground to excited vibrational states. Although the parameter values are affected by the assumptions underlining the building of the effective Hamiltonian and by uncertainties in the experimental determination of frequencies related to inhomogeneously broadened bands, they are consistent with general trends describing the properties of OH groups in crystalline solids. The high values of the harmonic frequencies (Table 2) are close to the upper values of the compilation reported by Szalay et al. (2002), which confirms the weakness of hydrogen bonding in these systems. Consistently, the anharmonicity parameters ωαχα ranging between 80 and 112 cm−1 (Table 2) are relatively small for OH groups. The coupling constants (Table 2) range between 10 and 20 cm−1, which corresponds to an intermediate situation between the limit case of uncoupled anharmonic oscillators and that of coupled harmonic oscillators described by Child and Halonen (1984).
Neglecting collective behaviour and phonon dispersion in the system description however deserves further comments. More sophisticated treatments of two-phonon excitations in crystalline solids (e.g. Bogani, 1978a, b; Kimball et al., 1981) and 2D adsorbate systems (Jakob and Persson, 1998) have shown that these excitations are primarily controlled by the respective magnitude of single-bond anharmonicity and interbond coupling, as in the case of molecules (Halonen and Child, 1983). When the bond anharmonicity is strong enough compared with the magnitude of the coupling interaction, a split-off bound state is observed below a two-phonon continuum, and the bound-state frequency approaches that of the doubly excited anharmonic oscillator (Kimball et al., 1981). In systems displaying several oscillators in their primitive cell, the splitting between the bound states is also found to decrease with increasing anharmonicity (Bogani et al., 1984). In contrast, the width of the two-phonon continuum is related to the phonon dispersion pattern, which originates from the interactions between the oscillators. Another feature of condensed systems is the occurrence of non-local absorption mechanisms enhancing the intensity of two-phonon bands, whereas local mechanisms concentrate the intensity in bound states as in molecules (Bogani et al., 1984). Accordingly, the |2 0 0 type excitations identified here using a simple molecular picture can be envisioned as transitions to localized split-off bound states, involving the double excitation of OH oscillators, whereas the |1 1 0 type excitations correspond to transitions to the two-phonon continuum, involving the simultaneous excitation of two coupled OH groups. The observation of relatively well-defined |1 1 0 features in the overtone spectrum of 1:1 phyllosilicates (Figs. 3 and 4) suggests that the corresponding two-phonon densities of states are sharply peaked, which, together with the significant anharmonicity of the OH bond and moderate value of coupling parameters, supports the present mapping of a molecular model on crystal properties.
The present study confirms that a one-to-one relation cannot be directly drawn between the observed fundamental absorption bands and overtone bands in minerals displaying coupled OH groups. The respective magnitude of oscillator anharmonicity and interbond coupling is the key parameter explaining the shape of overtone spectra observed in the near-infrared range. The significant OH anharmonicity leads to the well-defined bands related to 0→2 transitions, whereas the occurrence at higher frequency of the weaker and broader features related to two simultaneous 0→1 transitions attests for the coupling of OH vibrations. Further studies are however required to specify the respective contribution of structural variability, relaxation mechanisms and collective effects in the overtone spectra of minerals. The proposed interpretation of the OH overtone spectrum of 1:1 phyllosilicates should represent a rational basis for investigations aiming at determining the sensitivity of the near-infrared spectra to the structural variability of natural serpentine- and kaolinite group minerals.
The spectra, model parameters and dominant contribution to excited states are reported in the article. Additional requests should be addressed to Etienne Balan.
EB has designed the model. All co-authors have contributed to the experimental measurements, discussion of the results and preparation of the manuscript.
The authors declare that they have no conflict of interest.
We acknowledge Leszek Stoch (University of Mining and Metallurgy, Krakow, Poland), who kindly provided the dickite sample, and O. Kolli (University of Bab Ezzouar, Algiers), who kindly provided the sample of nacrite. Pierre Chansigaud (IC2MP spectroscopy platform, University of Poitiers) and Maxime Guillaumet and Keevin Béneut (IMPMC spectroscopy platform, Sorbonne Université, Paris) are acknowledged for technical assistance in the production of the MIR and NIR spectra.
This research has been supported by the Centre National de la Recherche Scientifique – Institut National des Sciences de l'Univers (project CESSUR “Conditions of formation of Mg/Ni silicate ores from New Caledonia”, 2010) and by the Centre National de Ressources Technologiques “Nickel et son environnement” (project “Ni/Co mineralization factors of laterites derived from ultramafic rocks of New-Caledonia”, 2010–2014)
This paper was edited by Roland Stalder and reviewed by two anonymous referees.
Balan, E., Allard, T., Boizot, B., Morin, G., and Muller, J.-P.: Structural FE3+ in natural kaolinites: New insights from electron paramagnetic resonance spectra fitting at X and Q-band frequencies, Clays Clay Mineral., 47, 605–616, https://doi.org/10.1346/CCMN.1999.0470507, 1999.
Balan, E., Saitta, A. M., Mauri, F., and Calas, G.: First-principles modeling of the infrared spectrum of kaolinite, Am. Mineral., 86, 1321–1330, https://doi.org/10.2138/am-2001-11-1201, 2001.
Balan, E., Allard, T., Morin, G., and Calas, G.: Incorporation of Cr3+ in dickite: a spectroscopic study, Phys. Chem. Miner., 4, 273–279, https://doi.org/10.1007/s00269-001-0231-5, 2002a.
Balan, E., Saitta, A. M., Mauri, F., Lemaire, C., and Guyot, F.: First-principles calculation of the infrared spectrum of lizardite, Am. Mineral., 87, 1286–1290, https://doi.org/10.2138/am-2002-1003, 2002b.
Balan, E., Lazzeri, M., Saitta, A. M., Allard, T., Fuchs, Y., and Mauri, F.: First-principles study of OH stretching modes in kaolinite, dickite and nacrite, Am. Mineral., 90, 50–60, https://doi.org/10.2138/am.2005.1675, 2005.
Balan, E., Lazzeri, M., Delattre, S., Meheut, M., Refson, K., and Winkler, B.: Anharmonicity of inner-OH stretching modes in hydrous phyllosilicates: assessment from first-principles frozen- phonon calculations, Phys. Chem. Miner., 34, 621–625, https://doi.org/10.1007/s00269-007-0176-4, 2007.
Balan, E., Delattre, S., Guillaumet, M., and Salje, E. K. H.: Low-temperature infrared spectroscopic study of OH stretching modes in kaolinite and dickite, Am. Mineral., 95, 1257–1266, https://doi.org/10.2138/am.2010.3447, 2010.
Balan, E., Bish, D. L., and Calas, G.: Kaolin-group minerals: from hydrogen-bonded layers to environmental recorders, Elements, 10, 183–188, https://doi.org/10.2113/gselements.10.3.183, 2014.
Baron, F. and Petit, S.: Interpretation of the infrared spectra of the lizardite-nepouite series in the near and middle infrared range, Am. Mineral., 101, 423–430, https://doi.org/10.2138/am-2016-5352, 2016.
Bish, D. L.: Rietveld refinement of the kaolinite structure at 1.5 K, Clays Clay Miner., 41, 738–744, https://doi.org/10.1346/CCMN.1993.0410613, 1993.
Bish, D. L. and Johnston, C. T.: Rietveld refinement and Fourier-transform infrared spectroscopy study of the dickite structure at low temperature, Clays Clay Miner., 41, 297–304, https://doi.org/10.1346/CCMN.1993.0410304, 1993.
Bishop, J. L., Murad E., and Dyar, M. D.: The influence of octahedral and tetrahedral cation substitution on the structure of smectites and serpentines as observed through infrared spectroscopy, Clay Miner., 37, 617–628, https://doi.org/10.1180/0009855023740064, 2002.
Bishop, J. L., Noe Dobrea, E. Z., McKeown, N. K., Parente, M., Ehlman, B. L., Michalski, J. R., Milliken, R. E., Poulet, F., Swayze, G. A., Mustard, J. F., Murchie, S. L., and Bibring, J.-P.: Phyllosilicate diversity and past aqueous activity revealed at Mawrth Vallis, Mars Science, 321, 830–833, https://doi.org/10.1126/science.1159699, 2008.
Blanchard, M., Méheut, M., Delon, L., Poirier, M., Micoud, P., Le Roux, C., and Martin, F.: Infrared spectroscopic study of the synthetic Mg-Ni talc series, Phys. Chem. Miner., 45, 843–854, https://doi.org/10.1007/s00269-018-0966-x, 2018.
Blount, A. M., Threadgold, I. M., and Bailey, S. W.: Refinement of the cystal structure of nacrite, Clays Clay Miner., 17, 185–194, https://doi.org/10.1346/CCMN.1969.0170307, 1969.
Bogani, F.: Two-phonon resonances and bound-states in molecular crystals. I. General theory, J. Phys. C, 1, 1283–1295, 1978a.
Bogani, F.: Two-phonon resonances and bound-states in molecular crystals. II. Absorption coefficient, J. Phys. C, 11, 1297–1309, https://doi.org/10.1088/0022-3719/11/7/019, 1978b.
Bogani, F., Giua, R., and Schettino, V.: Two-exciton spectra of HCl and HBr crystals, Chem. Phys., 88, 375–389, https://doi.org/10.1016/0301-0104(84)87004-4, 1984.
Carter, J., Poulet, F., Bibring, J.-P., Mangold, N., and Murchie, S.: Hydrous minerals on Mars as seen by the CRISM and OMEGA imaging spectrometers: Updated global view, J. Geophys. Res.-Planet., 118, 831–858, https://doi.org/10.1029/2012JE004145, 2013.
Carteret, C.: Mid- and near-Infrared study of hydroxyl groups at a silica surface: H-Bond effect, J. Phys. Chem. C, 113, 13300–13308, https://doi.org/10.1021/jp9008724, 2009.
Cheng, H., Yang, J., Liu, Q., Zhang, J., and Frost, R. L.: A spectroscopic comparison of selected Chinese kaolinite, coal bearing kaolinite and halloysite: a midinfrared and nearinfrared study, Spectrochim. Acta A, 77, 856–861, https://doi.org/10.1016/j.saa.2010.08.018, 2010.
Child, M. S.: Local mode overtone spectra, Acc. Chem. Res., 18, 45–50, https://doi.org/10.1021/ar00110a003, 1985.
Child, M. S. and Lawton, R. T.: Local and normal vibrational states: a harmonically coupled anharmonic-oscillator model, Faraday Discuss., 71, 273–285, https://doi.org/10.1039/DC9817100273, 1981.
Child, M. S. and Halonen, L.: Overtone frequencies and intensities in the local mode picture, in: Advances in Chemical Physics, edited by: Prigogine, I. and Rice, S., Wiley, vol. 57, https://doi.org/10.1002/9780470142813.ch1, 1984.
Delineau, T., Allard, T., Muller, J.-P., Barres O., Yvon, J., and Cases, J.-M.: FTIR reflectance vs. EPR studies of structural iron in kaolinites, Clays Clay Miner., 42, 308–320, https://doi.org/10.1346/CCMN.1994.0420309, 1994.
Farmer, V. C.: The infrared spectra of minerals, Mineralogical Society, London, https://doi.org/10.1180/mono-4, 1974.
Farmer, V. C.: Differing effect of particle size and shape in the infrared and Raman spectra of kaolinite, Clay Miner., 33, 601–604, 1998.
Farmer, V. C.: Transverse and longitudinal crystal modes associated with OH stretching vibrations in single crystals of kaolinite and dickite, Spectrochim. Acta A, 56, 927–930, https://doi.org/10.1016/S1386-1425(99)00182-1, 2000.
Fritsch, E., Juillot, F., Dublet, G., Fonteneau, L, Fandeur, D., Martin, E., Caner, L. Auzende A-L., Grauby, O., and Beaufort, D.: An alternative model for the formation of hydrous Mg/Ni layer silicates (“deweylite”/“garnierite”) in faulted peridotites of New Caledonia: I. Texture and mineralogy of a paragenetic succession of silicate infillings, Eur. J. Mineral., 28, 295–311, https://doi.org/10.1127/ejm/2015/0027-2503, 2016.
Greenberger, R. N., Mustard, J. F., Cloutis, E. A., Pratt, L. M., Sauer, P. E., Mann, P., Turner, K., Dyar, M. D., and Bish, D. L.: Serpentinization, iron oxidation, and aqueous conditions in an ophiolite: Implications for hydrogen production and habitability on Mars, Earth Planet. Sc. Lett., 416, 21–34, https://doi.org/10.1016/j.epsl.2015.02.002, 2015.
Guatame-García, A., Buxton, M., Deon, F., Lievens, C., and Hecker, C.: Toward an on-line characterization of kaolin calcination process using short-wave infrared spectroscopy, Miner. Process. Extract. Metall. Rev., 39, 420–431, https://doi.org/10.1080/08827508.2018.1459617, 2018.
Halonen, L. and Child, M. S.: Local mode theory for C3V molecules: CH3D, CHD3, SiH3D, and SiHD3, J. Chem. Phys., 79, 4355, https://doi.org/10.1063/1.446317, 1983.
Jakob, P. and Persson, B. N.: Infrared spectroscopy of overtones and combination bands, J. Chem. Phys., 109, 8641, https://doi.org/10.1063/1.477531, 1998.
Johnston, C. T., Elzea-Kogel, J., Bish, D. L., Kogure, T., and Murray, H. H.: Low-temperature FTIR study of kaolin-group minerals, Clays Clay Miner., 56, 470–485, https://doi.org/10.1346/CCMN.2008.0560408, 2008.
Kimball, J. C., Fong, C. Y., and Shen, Y. R.: Anharmonicity, phonon localization, two-phonon bound states, and vibrational spectra, Phys. Rev. B, 23, 4946, https://doi.org/10.1103/PhysRevB.23.4946, 1981.
King, T. V. V., and Clark, R. N.: Spectral characteristics of chlorites and Mg-serpentines using high-resolution reflectance spectroscopy, J. Geophys. Res., 94, 13997–14008, https://doi.org/10.1029/JB094iB10p13997, 1989.
Lai, M., Liao, Z., Zhou, Z., Kao, C., Li, Y., and Wang, H.: Uses of near-infrared transmission spectra for the identification of hydrothermal kaolinite, dickite and kaolinite-dickite, Spectrochim. Acta A, 208, 179–184, https://doi.org/10.1016/j.saa.2018.09.063, 2019.
Lewis, I. R., Chaffin, N. C., Gunter, M. E., and Griffiths, P. R.: Vibrational spectroscopic studies of asbestos and comparison of suitability for remote analysis, Spectrochim. Acta A, 52, 315–328, https://doi.org/10.1016/0584-8539(95)01560-4, 1996.
Madejová, J., Balan, E., and Petit, S.: Application of vibrational spectroscopy (IR and Raman) on the characterization of industrial minerals, EMU Notes in Mineralogy, vol. 9 “Advances in the Characterization of Industrial Minerals”, 171–226, https://doi.org/10.1180/EMU-notes.9, 2011.
Mathian, M., Hebert, B., Baron, F., Petit, S., Lescuyer, J.-L., Furic, R., and Beaufort D.: Identifying the phyllosilicate minerals of hypogene ore deposits in lateritic saprolites using the near-IR spectroscopy second derivative methodology, J. Geochem. Expl., 186, 298–314, 10.1016/j.gexplo.2017.11.019, 2018.
Mellini, M. and Viti, C. Crystal structure of lizardite-1T from Elba, Italy, Am. Mineral., 79, 1194–1198, 1994.
Petit, S., Madejová, J., Decarreau, A., and Martin, F.: Characterization of octahedral substitutions in kaolinites using near infrared spectroscopy, Clays Clay Miner., 47, 103–108, https://doi.org/10.1346/CCMN.1999.0470111, 1999.
Petit, S., Martin, F., Wiewiora, A., De Parseval, P., and Decarreau, A.: Crystal-chemistry of talc: a near infrared (NIR) spectroscopy study, Am. Mineral., 89, 319–326, https://doi.org/10.2138/am-2004-2-310, 2004a.
Petit, S., Decarreau, A., Martin, F., and Robert, R.: Refined relationship between the position of the fundamental OH stretching and the first overtones for clays, Phys. Chem. Miner. 31, 585–592, https://doi.org/10.1007/s00269-004-0423-x, 2004b.
Pineau, M., Baron, F., Mathian, M., Le Deit, L., Rondeau, B., Allard, T., and Mangold, N.: Estimating kaolinite crystallinity using near-infrared spectroscopy, 51st Lunar and Planetary Science Conference, The Woodlands, Houston, Texas, United States, 2020.
Prencipe, M., Noel, Y., Bruno, M., and Dovesi, R.: The vibrational spectrum of lizardite-1T [Mg3Si2O5(OH)4] at the Γ point: A contribution from an ab initio B3LYP calculation, Am. Mineral., 94, 986–994, https://doi.org/10.2138/am.2009.3127, 2009.
Salje, E. K. H.: Hard mode Spectroscopy: Experimental studies of structural phase transitions, Phase Transitions, 37, 83–110, https://doi.org/10.1080/01411599208222888, 1992.
Sibert, E. L.: Modeling vibrational anharmonicity in infrared spectra of high frequency vibrations of polyatomic molecules, J. Chem. Phys, 150, 090901, https://doi.org/10.1063/1.5079626, 2019.
Szalay, V., Kovaìcs, L., Wöhlecke, M., and Libowitzky, E.: Stretching potential and equilibrium length of the OH bonds in solids, Chem. Phys. Lett., 354, 56–61, https://doi.org/10.1016/S0009-2614(02)00099-4, 2002.
Tosoni, S., Doll, K., and Ugliengo, P.: Hydrogen bond in layered materials: Structural and vibrational properties of kaolinite by a periodic B3LYP approach, Chem. Mater., 18, 2135–2143, https://doi.org/10.1021/cm060227e, 2006.
Wöhlecke, M. and Kovaìcs, L.: OH− ions in oxide crystal, Crit. Rev. Solid State, 25, 1–86, https://doi.org/10.1080/20014091104161, 2001.