the Creative Commons Attribution 4.0 License.
the Creative Commons Attribution 4.0 License.
 | 09 Feb 2021
A combined Fourier transform infrared and Cr K-edge X-ray absorption near-edge structure spectroscopy study of the substitution and diffusion of H in Cr-doped forsterite
Michael C. Jollands
Hugh St.C. O'Neill
Andrew J. Berry
Charles Le Losq
Camille Rivard
Jörg Hermann
Single crystals of synthetic Cr-doped forsterite (Cr:Mg2SiO4) containing both Cr3+ and Cr4+ were partially hydroxylated in piston-cylinder apparatuses at 750–1300 ∘C and pressures from 0.5 to 2.5 GPa, with p(H2O) ≈Ptotal. The oxygen fugacity (fO2) was buffered by graphite-water, Ni–NiO, Re–ReO2, Fe2O3–Fe3O4 or Ag–Ag2O, and the silica activity (aSiO2) was buffered by powdered forsterite plus either enstatite (Mg2Si2O6), periclase (MgO) or zircon–baddeleyite (ZrSiO4–ZrO2). Profiles of OH content versus distance from the crystal edge were determined using Fourier transform infrared (FTIR) spectroscopy, and profiles of the oxidation state and coordination geometry of Cr were obtained, at the same positions, using K-edge X-ray absorption near-edge structure (XANES) spectroscopy. The techniques are complementary – FTIR spectroscopy images the concentration and nature of O–H bonds, where Cr K-edge XANES spectroscopy shows the effect of the added H on the speciation of Cr already present in the lattice. Profiles of defect-specific absorbance derived from FTIR spectra were fitted to solutions of Fick's second law to derive diffusion coefficients, which yield the Arrhenius relationship for H diffusion in forsterite:
where is the measured diffusion coefficient in m2 s−1, valid for diffusion parallel to [001] and calibrated between 1000 and 750 ∘C, P and T are in GPa and K, and R is 0.008314 kJK−1 mol−1. Diffusivity parallel to [100] is around 1 order of magnitude lower. This is consistent with previous determinations of H diffusion associated with M-site vacancies. The FTIR spectra represent a variety of Cr-bearing hydrous defects, along with defects associated with the pure Mg–Si–O–H system. It is proposed that all of the defects can form by interaction between the dry lattice, including Cr3+ and Cr4+, and fully hydroxylated M-site vacancies. The initial diffusive wave of hydroxylation is associated with neither reduction nor oxidation of Cr but with Cr4+ changing from tetrahedral to octahedral coordination. Superimposed on the H diffusion and concomitant change in Cr4+ site occupancy, but at a slower rate, producing shorter profiles, is reduction of Cr4+ to Cr3+ and potentially of Cr4+ and Cr3+ to Cr2+. In addition, by comparing FTIR data to trace element contents measured by laser ablation inductively coupled plasma mass spectrometry (LA-ICP-MS), constraints can be placed on absorption coefficients used for converting absorbance to H2O contents – our data support either wavenumber- or defect-dependent values of absorption coefficients. We estimate absorption coefficients of between 60 200 and 68 200 L mol−1 cm−1 for OH− associated with octahedral Cr3+ and an M-site vacancy and 18 700 to 24 900 L mol−1 cm−1 for two OH− associated with octahedrally coordinated Cr4+ and a Si vacancy (i.e. a “clinohumite-type” point defect).
- Article
(8099 KB) - Full-text XML
-
Supplement
(36028 KB) - BibTeX
- EndNote


Many nominally anhydrous minerals can contain H in trace amounts bonded to O on regular crystallographic sites to form O–H structural units (Libowitzky and Beran, 2006). From the perspective of chemical thermodynamics, this O–H substitution depends on the fugacity of H2O (fH2O; Kohlstedt et al., 1996; Padrón-Navarta and Hermann, 2017; Rauch and Keppler, 2002; Tollan et al., 2017; Withers et al., 2011), and this component has accordingly been called “water”. In minerals including, but not limited to, olivine, orthopyroxene, clinopyroxene and garnet, H has been shown to diffuse extremely rapidly (Barth et al., 2019; Demouchy and Mackwell, 2003; Demouchy and Mackwell, 2006; Ferriss et al., 2016; Kohlstedt and Mackwell, 1998; Mackwell and Kohlstedt, 1990; Peslier et al., 2015; Reynes et al., 2018; Stalder and Skogby, 2003; Stalder et al., 2007; Sundvall et al., 2009). Therefore, it should be possible to find combinations of experimental temperature and time where a trace amount of H is added, by diffusion, to the existing point-defect structure of the crystal, with little change to that structure beyond that mandated by the maintenance of charge balance. The O–H bonds formed by this process absorb light at wavelengths in the infrared that are sensitive to their local structural environment, which can be investigated by Fourier transform infrared (FTIR) spectroscopy, revealing the point-defect structure of the crystals (Bai and Kohlstedt, 1993; Jollands et al., 2016a; Le Losq et al., 2019b).
Here we apply this method in conjunction with Cr K-edge X-ray absorption near-edge structure (XANES) spectroscopy to examine the point-defect structure of Cr-doped forsterite, large crystals of which are commercially produced for use in solid-state infrared lasers. Studying such crystals is also useful from a mineralogical perspective given that Cr3+ has been identified as a significant facilitator of H substitution in olivine (Tollan et al., 2018; Tollan et al., 2015).
The main goals of this study are (1) to further constrain H diffusivities in trace-element-doped forsterite, following on from Padrón-Navarta et al. (2014) and Jollands et al. (2016b); (2) to assess how hydroxylation affects the pre-existing defect structure of forsterite by combining data from Cr K-edge XANES and FTIR spectroscopy; (3) to address the mechanisms by which various hydroxyl-bearing point defects form in response to hydroxylation; and (4) to provide new constraints on the values of infrared absorption coefficients by relating FTIR spectra to laser ablation inductively coupled plasma mass spectrometry (LA-ICP-MS) data. This combination of FTIR and XANES spectroscopy, a first for this type of study, reveals new details about how Cr substitutes into anhydrous forsterite and how this changes with hydroxylation (XANES spectra) while also providing insights into H diffusion and substitution mechanisms (FTIR spectra).
2.1 Starting materials and experiments
The starting material was a slab of single-crystal blue/purple Cr-doped forsterite with three mutually orthogonal faces parallel to (001), (010) and (100). This material is produced for solid-state lasers. The lasing capability of such Cr-doped forsterite was first assumed to be related to Cr3+ (Petričević et al., 1988b) and then tentatively to tetrahedrally coordinated Cr4+ (Petričević et al., 1988a), which was later confirmed by electron paramagnetic resonance (EPR) spectroscopy (Hoffman et al., 1991; Whitmore et al., 1993). Whilst Cr4+ is now agreed to be the lasing ion, these crystals also contain much octahedrally coordinated Cr3+, to the extent that the Cr3+ content can be around an order of magnitude greater than the Cr4+ content (Chen and Boulon, 2003). There is some uncertainty about the mechanism by which Cr4+ is incorporated into these crystals, which are grown from melts that are likely to contain only Cr3+ and Cr6+, and potentially minor Cr2+ (Berry et al., 2006; Schreiber and Haskin, 1976). Some suggest that Cr is initially incorporated as octahedrally coordinated Cr3+, which then oxidises to Cr4+ and simultaneously moves to the tetrahedral site, whereas others propose that Cr substitutes directly as tetrahedrally coordinated Cr4+ (Chen and Boulon, 2003; Dudnikova et al., 2005, 2010; Rager et al., 1991). Importantly, the Cr-doped forsterite used in this study should contain both octahedrally coordinated Cr3+ and tetrahedrally coordinated Cr4+.
The crystal slab was cut into ∼ 1–1.5 mm cubes with faces parallel to those of the starting material, using a 120 µm thick diamond-impregnated wafering blade attached to a low-speed circular saw. Laser ablation inductively coupled plasma mass spectrometry (LambdaPhysik Compex 193 nm ArF laser, with a dual-volume Laurin Technic cell coupled to an Agilent 7700x quadrupole mass spectrometer) analyses of the crystal showed that it is near-pure Mg2SiO4, with 159.3 ± 0.4 µg g−1 Cr, 5.5 ± 0.4 µg g−1 Fe and 16.8 ± 0.3 µg g−1 Al. Note that the Al content, on a molar basis, is around 20 % of the Cr content. Other elements analysed (Ni, Co, Mn, Ti, Sc and V) are below 1 µg g−1.
The cubes were hydroxylated in piston-cylinder apparatuses at experimental conditions summarised in Table 1. We use “hydroxylate” rather than “hydrate” or “hydrogenate” because hydroxyl groups are formed in the experiments. This does not imply that the diffusing species is OH−. Most experiments were done at low temperatures (750–1000 ∘C), but two were at higher temperatures (1200–1300 ∘C), herein “low-T” and “high-T” experiments, respectively. Low-T experiments followed the methodology described in Jollands et al. (2016b), whereby crystals were packed into a 6.3 mm outer diameter (OD) silver capsule (based on the design of Hack and Mavrogenes, 2006), along with a solid-state fO2 buffer, and surrounded either by powders of MgO (periclase, per) powder or Mg2SiO4–Mg2Si2O6 (forsterite-enstatite, fo-en) powder. The latter was synthesised from reagent-grade MgO and SiO2 powders, which were mixed by grinding under acetone, pressed into pellets in a tungsten carbide dye, sintered at 1400 ∘C in air for ∼ 24 h, and then reground. The pyroxene produced is actually a two-phase mixture of protoenstatite and clinoenstatite from the partial inversion of protoenstatite during cooling (cf. Jollands et al., 2014), but this transforms to orthoenstatite at the P–T conditions used for hydroxylation (e.g. Choudhury and Chaplot, 2000), and hence the experiments are described simply as fo-en buffered or fo-per buffered, respectively. One experiment used ZrSiO4–ZrO2 (zrc-bdd) instead of per or fo-en to buffer the aSiO2 at an intermediate value, using material synthesised for a previous study (Jollands et al., 2014). The solid-state fO2 buffer in most experiments was Ni–NiO, but Ag–Ag2O, Fe2O3–Fe3O4, Re–ReO2 or graphite were also used.
Table 1Experimental conditions and diffusion coefficients determined from FTIR spectra. H concentrations and all uncertainties (2σ from curve fitting alone is generally between 0.02 and 0.1) are not given here, for brevity, but can be found in the Supplement. Experiments denoted HYCRa# were done before the XANES session, and experiments denoted HYCRb# were done after the session. Blank cells mean that the concentrations were too low to obtain satisfactory fits to the diffusion profiles. All diffusion profiles were determined from spectra recorded in 1D except for sample HYCRa09, which was extracted from a 2D map.

a The experiment was commenced with Mg2SiO4–SiO2.xH2O, and then it is assumed that the buffering condition is equivalent to fo-en. The defect identities are described in the text. b “Sum” is the sum of the absorbance of the 24 resolved peaks, converted to total absorbance. Silica activities calculated from Holland and Powell (1998) and O'Neill (2006). Oxygen fugacities were calculated for Ni–NiO: O'Neill and Pownceby (1993); Ag–Ag2O: Assal et al. (1997) – this is estimated; Fe2O3–Fe3O4: Hemingway (1990); Re–ReO2: Pownceby and O'Neill (1994); graphite: Connolly and Cesare (1993).
A few drops of de-ionised water (∼ 30 µL) were added to the crystal–powder mix, to the point that the powder was visibly water-saturated. The capsules were then lidded, swaged closed and placed into a (15.9 mm) MgO–graphite–NaCl assembly, wrapped in Teflon foil and run in a Boyd-type end-loaded piston cylinder. Around 0.2 GPa of pressure was applied at room temperature, after which the temperature was increased at 100 ∘C min−1 whilst slowly applying pressure, with the aim of approximately following an H2O isochore. The final pressures were 0.5, 1.5 or 2.5 GPa. The temperature was controlled using a type-B (Pt–Rh) thermocouple, with the hot junction located in a hole in the capsule lid. Experiments were ended by turning off the power and then slowly depressurising. The charges were removed from the assembly and the capsules recovered, cleaned and pierced with a 1 mm drill bit and then opened using a lathe. The fluid phase prevents sintering of the buffer powder to the crystal, and the crystals were retrieved by placing the opened capsules in a beaker of water in an ultrasonic bath, upon which the crystals and buffering powder would easily separate. The loose crystals were oriented using the characteristic Si–O overtones in the 1625–2150 cm−1 region of the polarised FTIR spectra (Asimow et al., 2006) and then mounted in 1′′ (25 mm) diameter epoxy discs (i.e. as conventional for electron microprobe analysis), such that the (010) face of the crystal was parallel to the surface of the mount. The mounted crystals were ground down to 300–500 µm thickness to produce a section that was a slice through the core of the cube. Both sides of the mount were then polished to obtain doubly polished thick sections for FTIR spectroscopy, with successive grades of polishing grit (generally down to 1 µm diamond) on cloth laps.
The two high-T experiments used 3.5 mm OD Pt capsules, with a layer of Ni–NiO powder to buffer fO2. Crystals were packed in silicic acid, which provides a source of H2O and maintains high aSiO2. These were run in MgO–graphite–Pyrex–NaCl assemblies at 1200 and 1300 ∘C, both for 15 min. A ∼ 0.5 mm MgO spacer was placed between the hot junction of the thermocouple and the capsule. The ramp rate was 100 ∘C min−1, and thus the ramp-up times were non-negligible relative to the dwell time. The silicic acid sintered during each experiment. The Pt capsule was cut and peeled away to leave a cylinder of sintered SiO2 within which the forsterite crystal was embedded but not visible. The cylinder was cautiously ground down to locate the crystal, whereupon the grinding angle was adjusted such that the ground face was approximately parallel to the crystal face. Then, the crystal-sintered powder couple was mounted in epoxy and prepared as described above. Fortuitously, both were exposed on planes parallel to (010), as with the low-temperature experiments.
2.2 Analytical methods
2.2.1 Fourier transform infrared (FTIR) spectroscopy
Unpolarised transmission FTIR spectra were recorded using a Bruker Hyperion microscope with a liquid nitrogen-cooled MCT detector coupled to a Bruker Tensor spectrometer. Samples were mounted onto an automated XYZ stage inside a measurement chamber that was continuously purged with dry air. Most measurements comprised 128 spectra with an effective spectral resolution of 2 cm−1.
Initially, maps were acquired (2D arrays of spectra) using a 50×50 µm aperture and 50 µm steps in both the x and y directions. The maps were mainly used to determine where to subsequently acquire the profiles so as to avoid cracks and other imperfections. Then, to produce profiles, spectra were generally recorded using a 25×150 µm aperture, with the long axis oriented parallel to the crystal edge. The interaction volume between the beam and sample, i.e. the effective spatial resolution, should be roughly Gaussian, with a full width at half maximum (FWHM) greater than 25 µm. This is due to divergence of the beam, which will have a larger effect for thick samples than thin samples. We cannot directly assess the FWHM of our analyses, but Ni and Zhang (2008) calculated that a ∼ 250 µm thick sample measured with a 20 µm aperture gave a FWHM of ∼ 30 µm, and Jollands et al. (2019) determined that a ∼ 500 µm thick section yielded a ∼ 50 µm FWHM, albeit with different samples and analytical setups. The majority of profiles were acquired parallel to the [001] direction, with some recorded parallel to [100]. Diffusional anisotropy in this system is well documented (Demouchy and Mackwell, 2003, 2006; Jollands et al., 2016b) but was not the main purpose of this study. Spectra were generally recorded every 5–10 µm.
Spectra were corrected for atmospheric H2O and CO2, and the background was subtracted using a concave rubber-band correction, with 64 baseline points and three iterations. These corrections were done using OPUS Spectroscopy software (Bruker). The corrected spectra were then normalised to 1 cm thickness using the relationship between the integrated area of the 1625–2150 cm−1 Si–O overtone region and the thickness of olivine samples derived by Shen et al. (2014), whereby thickness (µm) = integrated area (cm−2) ×0.553. This relationship was derived using natural olivine, but comparing the modelled thickness with thickness measured using a micrometer (Table S2) suggests that it is also appropriate for pure forsterite. The reason for using the thickness derived from the Si–O overtones rather than thickness measured using a micrometer is that it naturally accounts for any deviations in thickness across the sample, which may include rounded edges associated with polishing on cloth laps, or non-parallel faces, given that all thick sections were prepared by hand. Then, each spectrum was resolved into a series of Gaussian peaks that were identified by fitting a “reference” spectrum, which results from the sum of several spectra that were chosen to represent the variety of bands observed in all samples (Fig. S1 in the Supplement). Gaussian peak shapes resulted in a better fit to the data than Lorentzian shapes, assessed visually.
The peak positions and widths (σ) obtained from the fit of the reference spectrum were then used to peak fit all other spectra, wherein only the peak heights were allowed to vary. All peak fitting was done automatically using least squares regression, in MATLAB (inbuilt function lsqnonlin). This peak fitting method is a trade-off between internal consistency, which is better when the positions and widths of the Gaussian curves are fixed, and goodness of fit, which is better when the peak positions and widths are allowed to vary freely. For the purposes of our diffusion modelling, internal consistency is considered more important than the goodness-of-fit statistic.
To adequately describe all spectra, 24 peaks were needed. Many of these are small and/or form shoulders on other peaks. Where possible, peaks were grouped together based on their identification from previous studies as belonging to the same class of defect. Peaks with unknown or ambiguous identities (e.g. where two peaks have nearly the same centroid) were grouped by (1) their behaviour during diffusion (profile shapes), (2) their behaviour at the interface (relative concentrations as a function of P, T and aSiO2) and (3) their wavenumbers. The peak assignments are presented in Table 2, with the justification for these assignments, as well as for the notation, given in Sect. 4.1.
Table 2Peaks assigned to the different defects, or groups, described and justified in the discussion. These are given in Kröger–Vink notation by the end-member formula and in the commonly used square bracket shorthand notation based on Kovács et al. (2010). is notated both as [Cr], i.e. the Cr version of the Kovács et al. (2010) [Ti] defect, and [CrCH-PD], i.e. the Cr version of the Jollands et al. (2016b) [TiCH-PD]. This notation is given for reference and comparison only and is not used in this text. The “m-bands” show humped (rim-to-core) or M-shaped (rim-to-rim) profiles. These are described using a lower-case, italic m to avoid confusion with the M-vacancy mechanism. “o-bands” describe the broad group “other”.
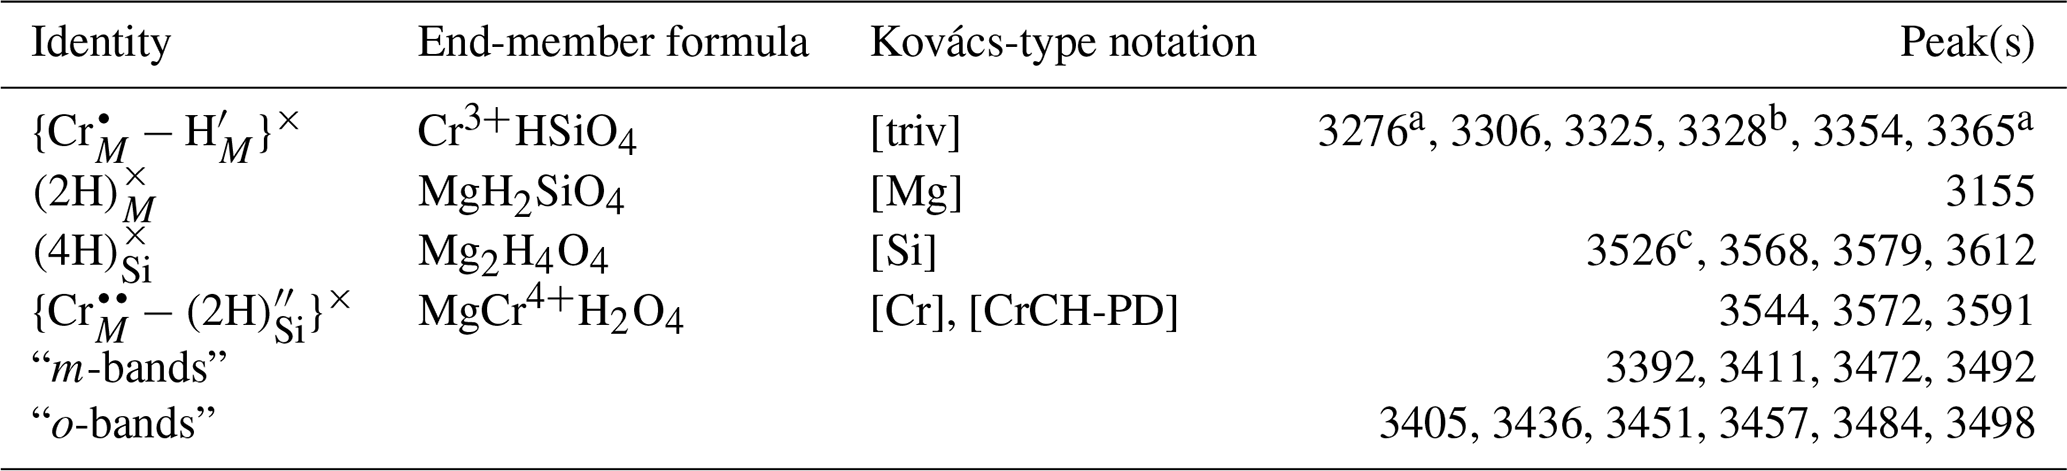
a Minor peaks assigned to based on wavenumber and diffusion profile shapes but not identified by Berry et al. (2007). b Low-intensity broad peak required for a satisfactory fit of this region. c Might also be assigned to the o-bands.
The integrated absorbance of each peak was converted to total absorbance using unpolarised reference spectra recorded from the (100), (010) and (001) planes (Fig. 1). These reference spectra were obtained from three crystals run in a single experiment, mounted in three perpendicular orientations, and mapped by FTIR spectroscopy yielding three 2D arrays of spectra. Spectra showing contamination from epoxy (generally absorbance > 0.05 cm−1 at 3640 and 3381 cm−1) were removed from the three arrays. From each of the three arrays, the 10 spectra with the greatest thickness-normalised integrated absorbance in the 3260–3380 cm−1 region were averaged to give reference spectra. The peak fitting routine was then applied to these three spectra, as described above, and peak-specific total absorbance was calculated. Conversion factors were calculated as the number that peak-specific absorbance from spectra recorded from the (010) plane needs to be multiplied by to obtain peak-specific total absorbance. These factors were between 1.8 and 2.9. It is important to emphasise that the factors are peak-specific rather than defect-specific. It was not possible to satisfactorily resolve, or determine conversion factors for, the many small peaks in the ∼ 3400–3500 cm−1 region, given that some of them only appear away from the interface. Therefore, an average conversion factor of 1.81 was used for all of these peaks (Fig. 1); this was determined by trapezoidal numerical integration of the 3380–3510 cm−1 wavenumber region for each of the three reference spectra. The relative absorbance derived from unpolarised spectra is consistent with that derived from polarised spectra. Peak-specific polar plots are given in Figs. S2, S3 and S4. For example, the 3612 cm−1 peak shows the greatest absorbance with and negligible absorbance with and , which is consistent with it only being present in unpolarised spectra acquired from the (001) and (010) planes (Fig. 1).
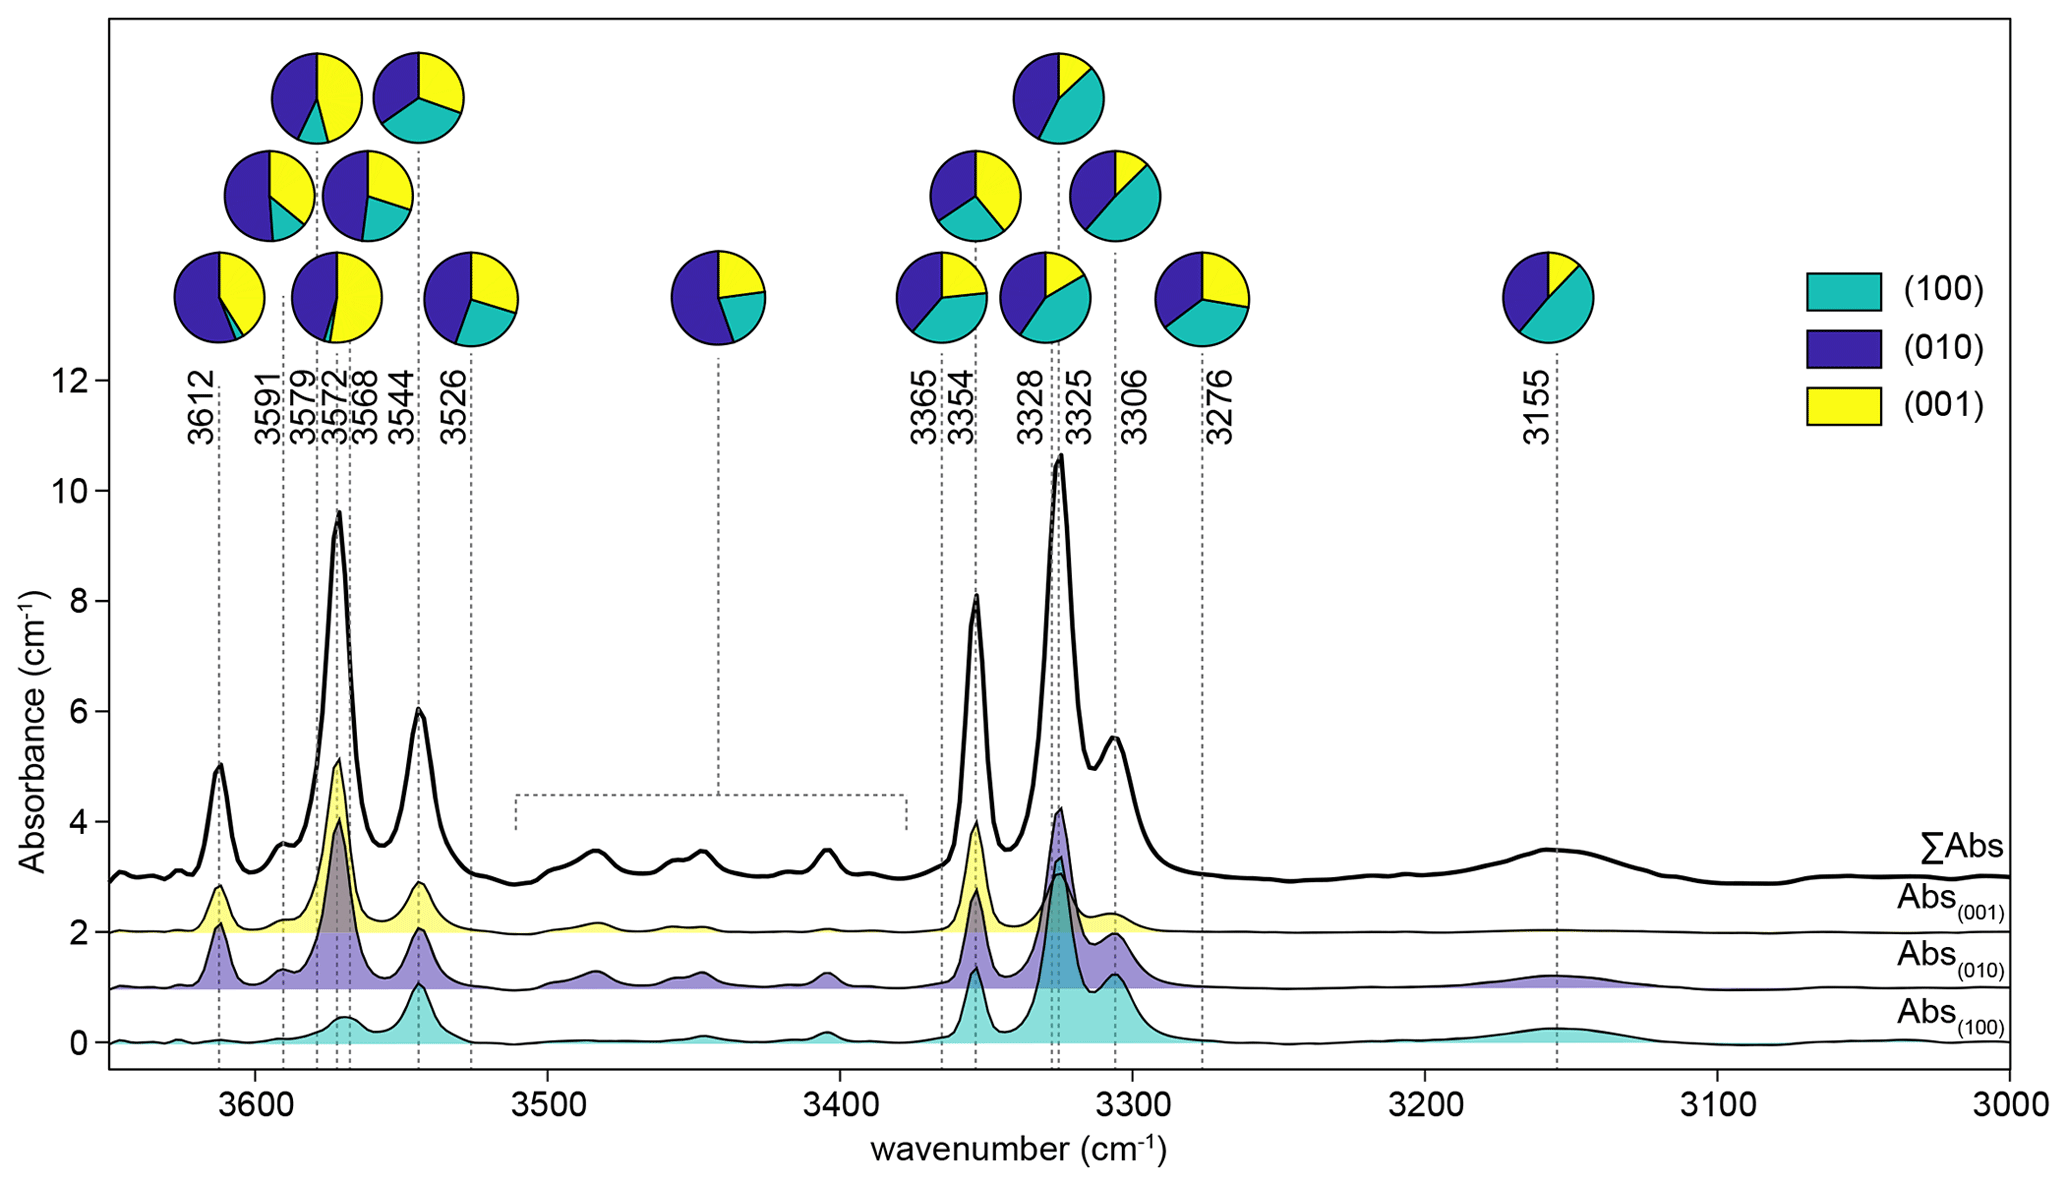
Figure 1Unpolarised spectra recorded for three perpendicular planes from the sample from experiment HYCRa6. The top spectrum is the total absorbance, calculated as the sum of the other three. The three recorded spectra were then resolved into Gaussian peaks by peak fitting, and the relative peak heights in each orientation are shown as pie charts. The 3380–3510 cm−1 region was numerically integrated.
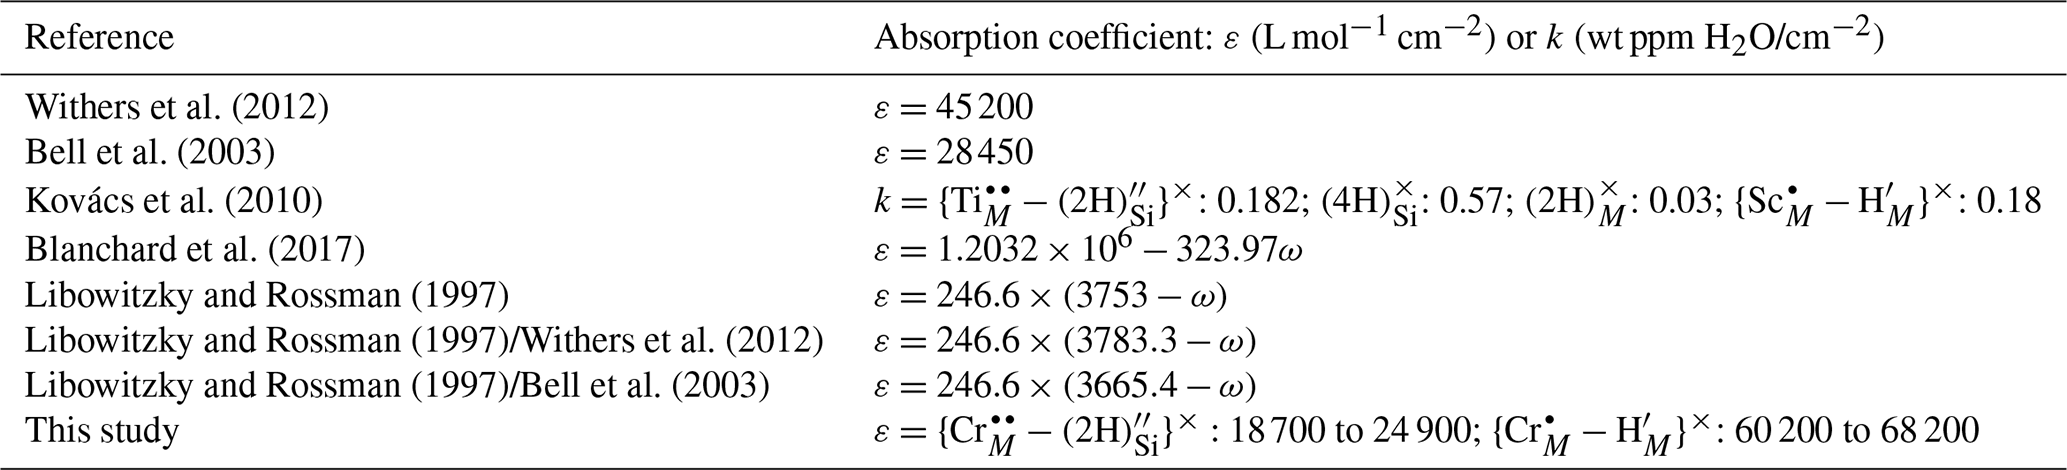
Then, peaks were grouped into defects, and defect-specific total absorbance was calculated. Initial diffusion modelling, described in Sect. 2.3, used defect-specific total absorbance rather than wt ppm. H2O – an absorption coefficient is required to convert absorbance to concentration. Absorption coefficients are still to some extent controversial, so, in this study, we test several different absorption coefficients from the literature, which are given in Table 3 and discussed in Sect. 4.3.
Table 3Absorption coefficients. Where appropriate, ω is the wavenumber in cm−1. The Blanchard et al. (2017) calibration is based on their Fig. 8 and provided by Marc Blanchard (personal communication, 2020).
2.3 X-ray absorption near-edge structure (XANES) spectroscopy
Cr K-edge XANES spectra were recorded in fluorescence mode at beamline ID21 (Cotte et al., 2017) of the European Synchrotron Radiation Facility in Grenoble, France. High-energy harmonics were removed by using a Ni-coated stripe on the primary mirror. The excitation energy was selected using a N2 gas flow-cooled Si(220) monochromator calibrated to 5989.2 eV at the first inflexion point of a Cr foil XANES spectrum, recorded in transmission mode. The beam was focused to ∼ 0.3 × 0.8 µm (full width at half maximum) using Kirkpatrick–Baez mirrors, giving a flux of ∼ 4 × 10¹⁰ photons s−1. The absorption length (penetration depth) of Cr K-edge X-rays in Mg2SiO4 is ∼ 40 µm. Samples were mounted at ∼ 60∘ to the incident beam and 50∘ to a single-element silicon drift diode detector (Bruker XFLASH 5100), with an active area of 80 mm2. The distance between the detector and sample was adjusted to ensure that the dead time was within the linear range of the electronics and approximately constant for all samples. Spectra were recorded in continuous mode from 5959 to 6088 eV, with a constant step size of 0.2 eV, with 100 ms dwell time per step, giving a total spectral acquisition time of 65 s. Typically, 10 spectra were recorded. All spectra were normalised to the incidence photon flux and corrected for dead time.
For each sample, the near-interface region was located using a visible light microscope, and then coarse qualitative X-ray fluorescence (XRF) maps (10–20 µm pixel size) of the crystal–epoxy interface were acquired. Finer-scale maps (1 µm pixel size) were then acquired and the location of the first (“interface”) analysis point was selected 5 µm from the crystal–epoxy boundary. Where the boundary was not satisfactorily parallel (∼ 1–2∘ was permitted), the sample was removed from the chamber, rotated, reinserted, and these steps repeated. Due to time limitations profiles were only recorded parallel to [001].
The possibility of beam damage was tested in three ways. Firstly, the beam was left dwelling on one point in the crystal, and the intensity associated with the energy of the white line (edge crest), which was at 6009 eV, was counted as a function of time. A ∼ 6 % decrease in intensity was observed over 750 s of acquisition. Following this test, a set of 10 spectra was recorded at this position. Secondly, the stage was moved to a new position at the same distance from the interface as in the first test, and a set of 10 spectra were recorded directly. Thirdly, a series of 10 spectra were recorded at points spaced 2 µm apart, with the stage being moved parallel to the crystal interface between each acquisition. Along with the decrease in intensity at the white line, a clear change in the shape of the pre-edge feature was also observed (Fig. S5). Therefore, to minimise the potential for beam damage, the third method was adopted. Ten spectra were recorded at each distance from the interface before moving perpendicular to the interface (parallel to [001]; see Fig. S6). The spectra acquired in this way were averaged using PyMCA (Solé et al., 2007). The resulting spectrum was reduced using the standard normalisation procedure of the Athena software package (Ravel and Newville, 2005) and then was background-corrected using a linear regression fit through the pre-edge region (5990–6008 eV) and a polynomial regression fit through the post-edge region (6029–6088 eV), aiming for a horizontal post-edge. Spectra were smoothed by an interpolative method with three repetitions using Athena.
Appropriate standards were not available for two main reasons. Firstly, we are not aware of a matrix-matched standard for octahedrally coordinated Cr4+, which we suggest was formed during the experiments, as discussed below. Spectra from the interfaces of samples CODE4 and CODE13 from Jollands et al. (2018), which should be appropriate standards for Cr3+ and Cr2+, were not orientation-matched to the samples from this experimental study.
Instead, end-member spectra were calculated as follows. A principal component analysis (PCA) was performed to determine the number of contributions necessary to explain the variance of the XANES spectra. This was done using the scikit-learn Python package (Pedregosa et al., 2011). One component explained most of the variance (> 99.5 %), such that all of the XANES spectra can be considered a mixture of two end-member contributions.
To extract the two end-member spectra, an alternating least square multivariate curve resolution method (ALS-MCR) was used, implemented in the pyMCR library (Camp, 2019). ALS-MCR is an extension of the non-negative matrix factorisation (NMF) approach (see Murphy, 2012, for details). In this approach, spectra are assumed to be a linear mixture of end-member components, as supported by the PCA results. Using this method, it is possible to obtain both the fractions and the shapes of these components. Non-negative and normalised constraints were applied, and a maximum of 100 iterations were performed. A critical point when performing ALS-MCR is to appropriately initialise the algorithm, which requires either starting fractions or starting partial components. In our case, the MCR-ALS algorithm was initiated using partial XANES spectra derived from a preliminary NMF analysis performed using the scikit-learn library. For linear problems, such an approach has been used, for example, to extract the redox state of iron in mid-ocean ridge basalts from their Raman spectra (Le Losq et al., 2019a).
The calculated end-member spectra are denoted “1” and “2” (Fig. 2), where the absorption edge of “1” has a lower energy than that of “2”, and “1” has no pre-edge feature compared to a large pre-edge in “2”. Whilst, from the presence of the pre-edge feature, it appears that “2” may be dominated by Cr4+ in tetrahedral coordination and that “1” is likely to represent a mixture of octahedrally coordinated Cr3+ and Cr4+, it is important to emphasise that in our case we cannot exactly quantify what these end-members physically represent. They are used here to assist with data interpretation but cannot be used to quantify the proportions of Cr2+, Cr3+ and Cr4+.

Figure 2Cr K-edge XANES spectra of Cr4+-bearing compounds (CrO2 and Ba2Ge0.1Cr0.9O4) from Pantelouris et al. (2004). Note the intense pre-edge feature associated with tetrahedral Cr4+; 12.6 eV has been added to the energy values from Pantelouris et al. (2004), determined by approximating the difference between the position of the first derivative of their Cr metal spectrum (their Fig. 8) and 5989.2 eV (the energy calibration of the monochromator in our study). These spectra are not appropriate for use as standards in our study given that the Cr has a different coordination environment. (b) XANES spectra from experimental samples and standards. (a) Cr metal, Cr2+ and Cr3+ in pure forsterite from Jollands et al. (2018). Calculated end-member spectra (marked “1” and “2”). “Interface” spectra were acquired 5 µm from the true interface. The upper spectra marked “interfaces” were from 1.5 GPa samples, fo-en and Ni–NiO, at 750, 850 (unmarked) and 1000 ∘C. The next set is for samples from 1.5 GPa experiments, fo-en, 850 ∘C. Low fO2: graphite, high: Ag–Ag2O, intermediate curve: Re–ReO2. Also shown are some spectra from samples HYCRa9 (24 h, 850 ∘C, Ni–NiO, zrc-bdd) and HYCRa3 (12 h, 850 ∘C, Ni–NiO, fo-en), both showing core-to-rim variations in the pre-edge feature intensity, the edge position, and position of the white line.
With these two end-member spectra, linear combination fitting using least squares regression was done to extract the relative proportions of the two end-members and the associated uncertainties.
2.4 Diffusion modelling
Complex H diffusion mechanisms may be expected due to the multiplicity of H substitution mechanisms revealed by the FTIR spectra, but from a phenomenological perspective, the empirical absorption, and hence concentration, profiles should still be described by Fick's second law:
where is the macroscopic diffusion coefficient, comparable to of Kohlstedt and Mackwell (1998). The relationship between these values and site-specific diffusion will be addressed in future work.
Where core spectra showed zero or near-zero absorbance in the O–H stretching region, profiles of absorbance in the O–H stretching region versus distance from the crystal interface were fitted to the 1D, concentration-independent diffusion, constant boundary condition, semi-infinite solution (2), for either half profiles (rim to core),
or full profiles (rim to rim),
(Carslaw and Jaeger, 1959; Crank, 1975), where C(x,t) is the concentration at position x and time t, Crim and Ccore are the concentrations at the crystal rim and core, respectively, and X is the total rim-to-rim length of the profile, which was also extracted from curve fitting.
If the core spectra showed non-zero absorbance, the use of Eqs. (2) and (3) is inappropriate. In these cases, the data were fitted to a 1D explicit finite-difference approximation of Fick's second law, where diffusion is assumed to be independent of concentration.
Due to a non-zero beam-sample interaction volume, all profiles should be stretched out to some extent. However, using the interaction volume estimated by Jollands et al. (2019) for similar samples, from a ∼ 400 µm diffusion profile should be overestimated by less than 0.01 log units and ∼ 0.1 log units for a ∼ 150 µm profile (Ganguly et al., 1988, formulation). These potential inaccuracies are negligible relative to other uncertainties, so no correction was made.
3.1 FTIR interface spectra and profile shapes
Example FTIR spectra are shown in Fig. 3, with a peak fitted spectrum shown in Fig. 4. An example profile of FTIR spectra as a function of distance from the crystal edge is presented in Fig. 5. Example 2D maps of the absorbance of selected peaks are shown in Fig. S7. Figure 6 shows the relationships between the experimental fO2, T, P and aSiO2 on defect-specific absorbance at the crystal interface. “Interface” is not the true interface but refers to the FTIR spectrum acquired closest to the crystal edge. Figure 7 shows profiles for different defects determined by FTIR spectroscopy along with a profile of end-member proportions determined by XANES. The identification of the resolved peaks is justified in the discussion (Sect. 4.1).
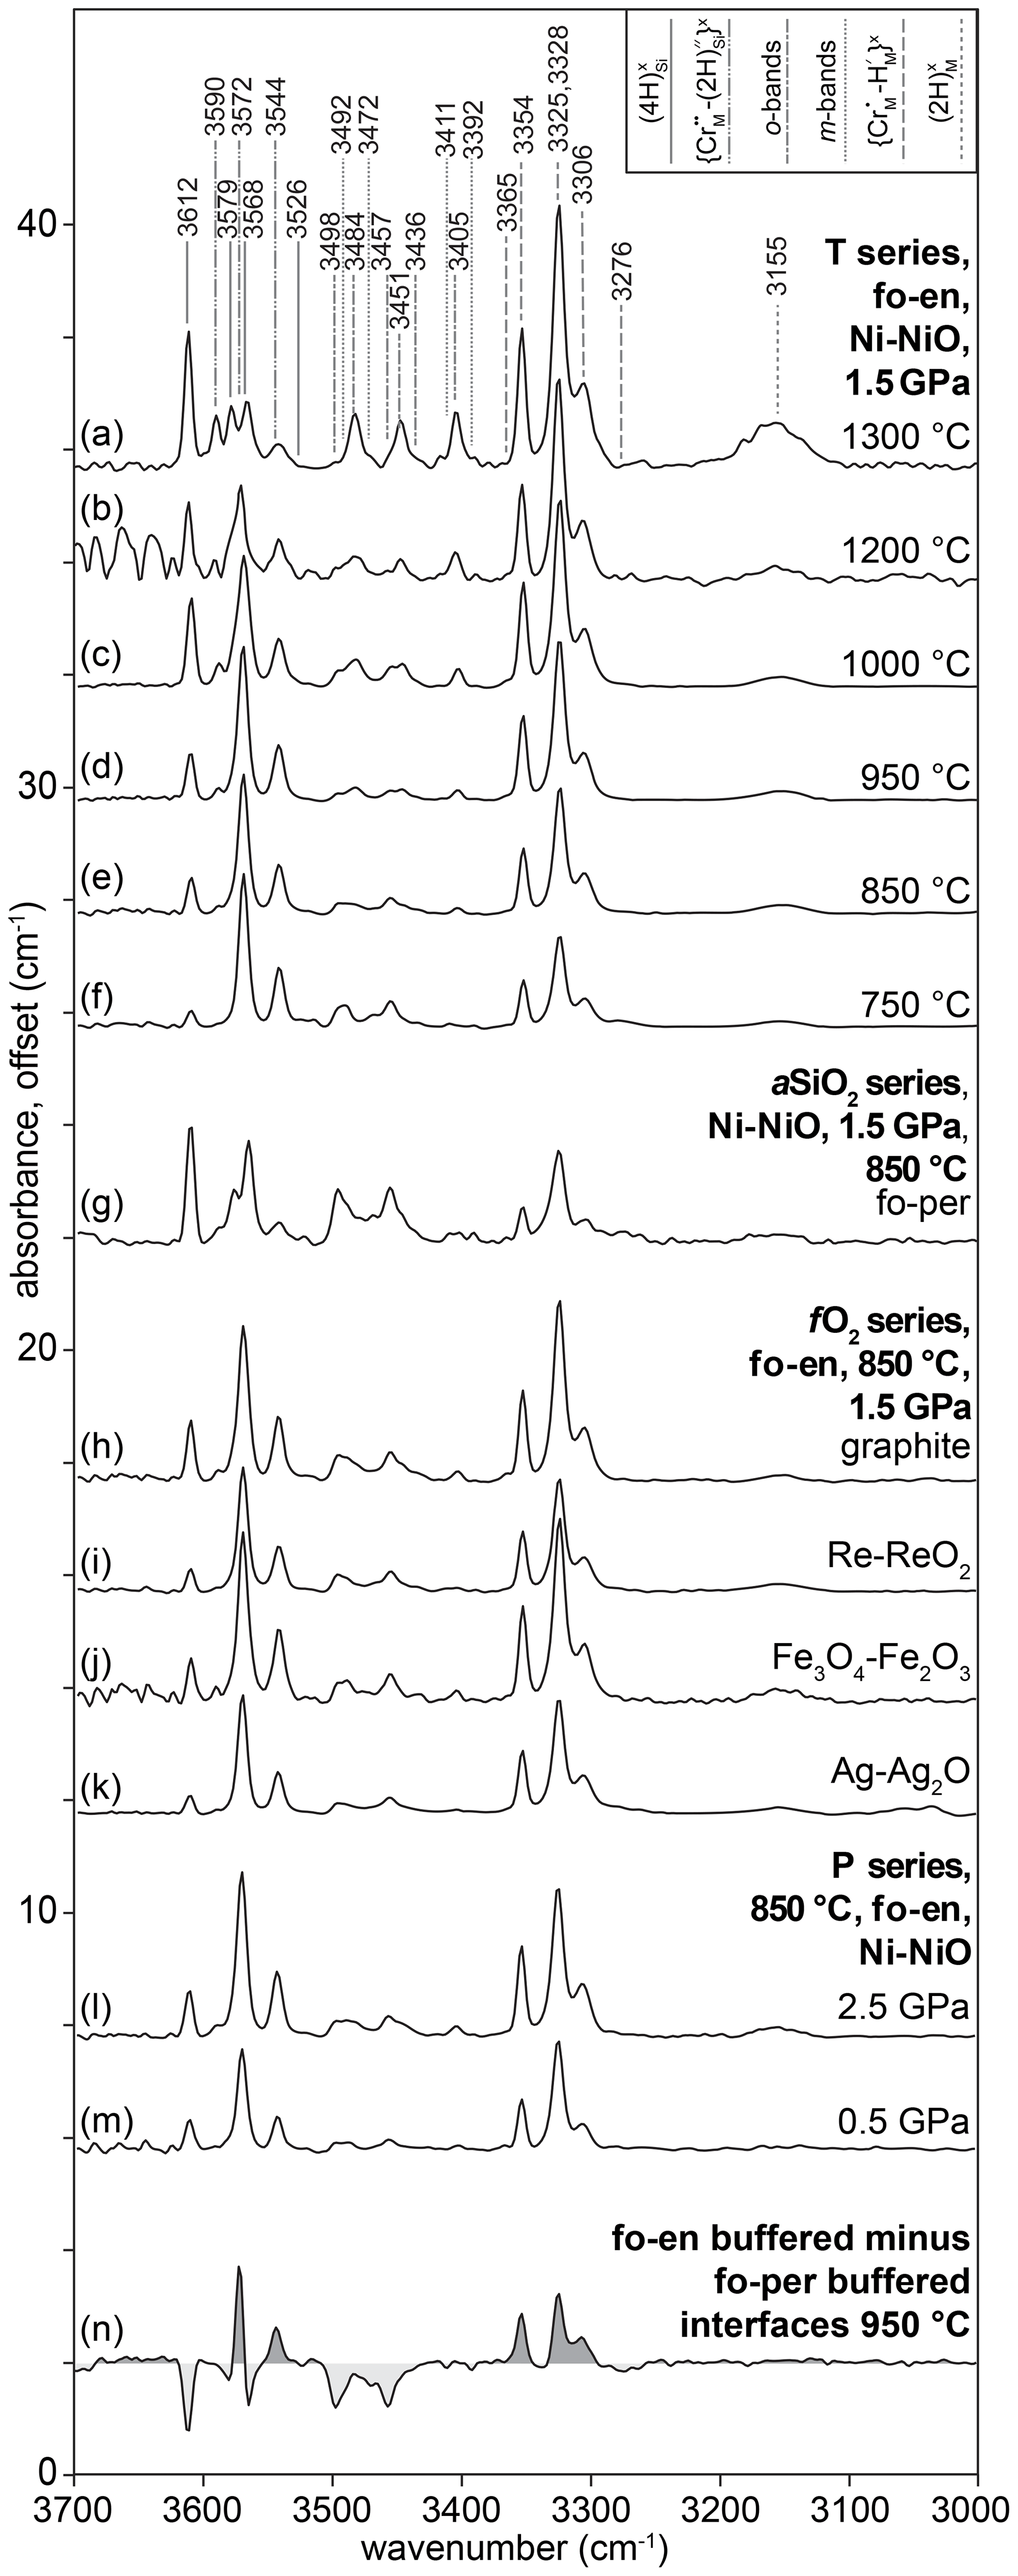
Figure 3FTIR spectra, offset for clarity. (a–m) Examples of spectra recorded at the crystal “interface”. In (a–m), these were acquired at ∼ 30 µm from the true interface and represent the first spectrum in a profile without any contamination from epoxy resin. The spectra are separated into groups, with an offset of 4 between groups, based on the variable being investigated. Spectrum (n) shows the difference between interface spectra from samples buffered by fo-en or fo-per at 950 ∘C. Areas shaded dark grey show greater absorbance in enstatite-buffered conditions; light grey areas are associated with greater absorbance in periclase-buffered conditions.
Most interface FTIR spectra are dominated by peaks associated with (3276, 3306, 3325, 3328, 3354, 3365 cm−1). The absorbance associated with this defect increases with increasing aSiO2, temperature and pressure. All interface spectra show peaks due to (3544, 3572, 3591 cm−1), although these are only visible following peak fitting in spectra from the high-T samples. Their intensity increases with decreasing T, increasing P and increasing aSiO2. The resolved peaks overlap with peaks (3526, 3568, 3579, 3612 cm−1), also in the ∼ 3600 cm−1 region, but these can be easily distinguished given their opposite dependence on aSiO2. The absorbance at the interface increases with decreasing aSiO2, increasing P and T. Most interface spectra show the defect (3155 cm−1). Its absorbance increases with increasing P and T. There is no clear dependence on aSiO2, but, given its intensity, this may be due to the peak being only just resolvable from the background in several experiments. All interface spectra show the so-called o-bands (3405, 3436, 3451, 3457, 3484, 3498 cm−1). Their absorbance increases with decreasing aSiO2, increasing T and P. The m-bands cannot be distinguished at the interface without peak fitting. There is no resolvable effect of fO2 on the intensity of any resolved peaks.
In the samples from the low-T experiments (1000 ∘C or lower), profiles of absorbance associated with the , , , and o-bands all decrease smoothly from rim to core (Figs. 5, 7). In the maps, this is expressed as bowl shapes (some example maps are presented in Fig. S7). The profiles for all defects are consistently longer parallel to [001] than [100]. The so-called m-bands (3392, 3411, 3472, 3492 cm−1) show M-shaped profiles in rim-to-rim transects (humped profiles in core-to-rim transects), increasing from the rim inwards and then decreasing towards the core.
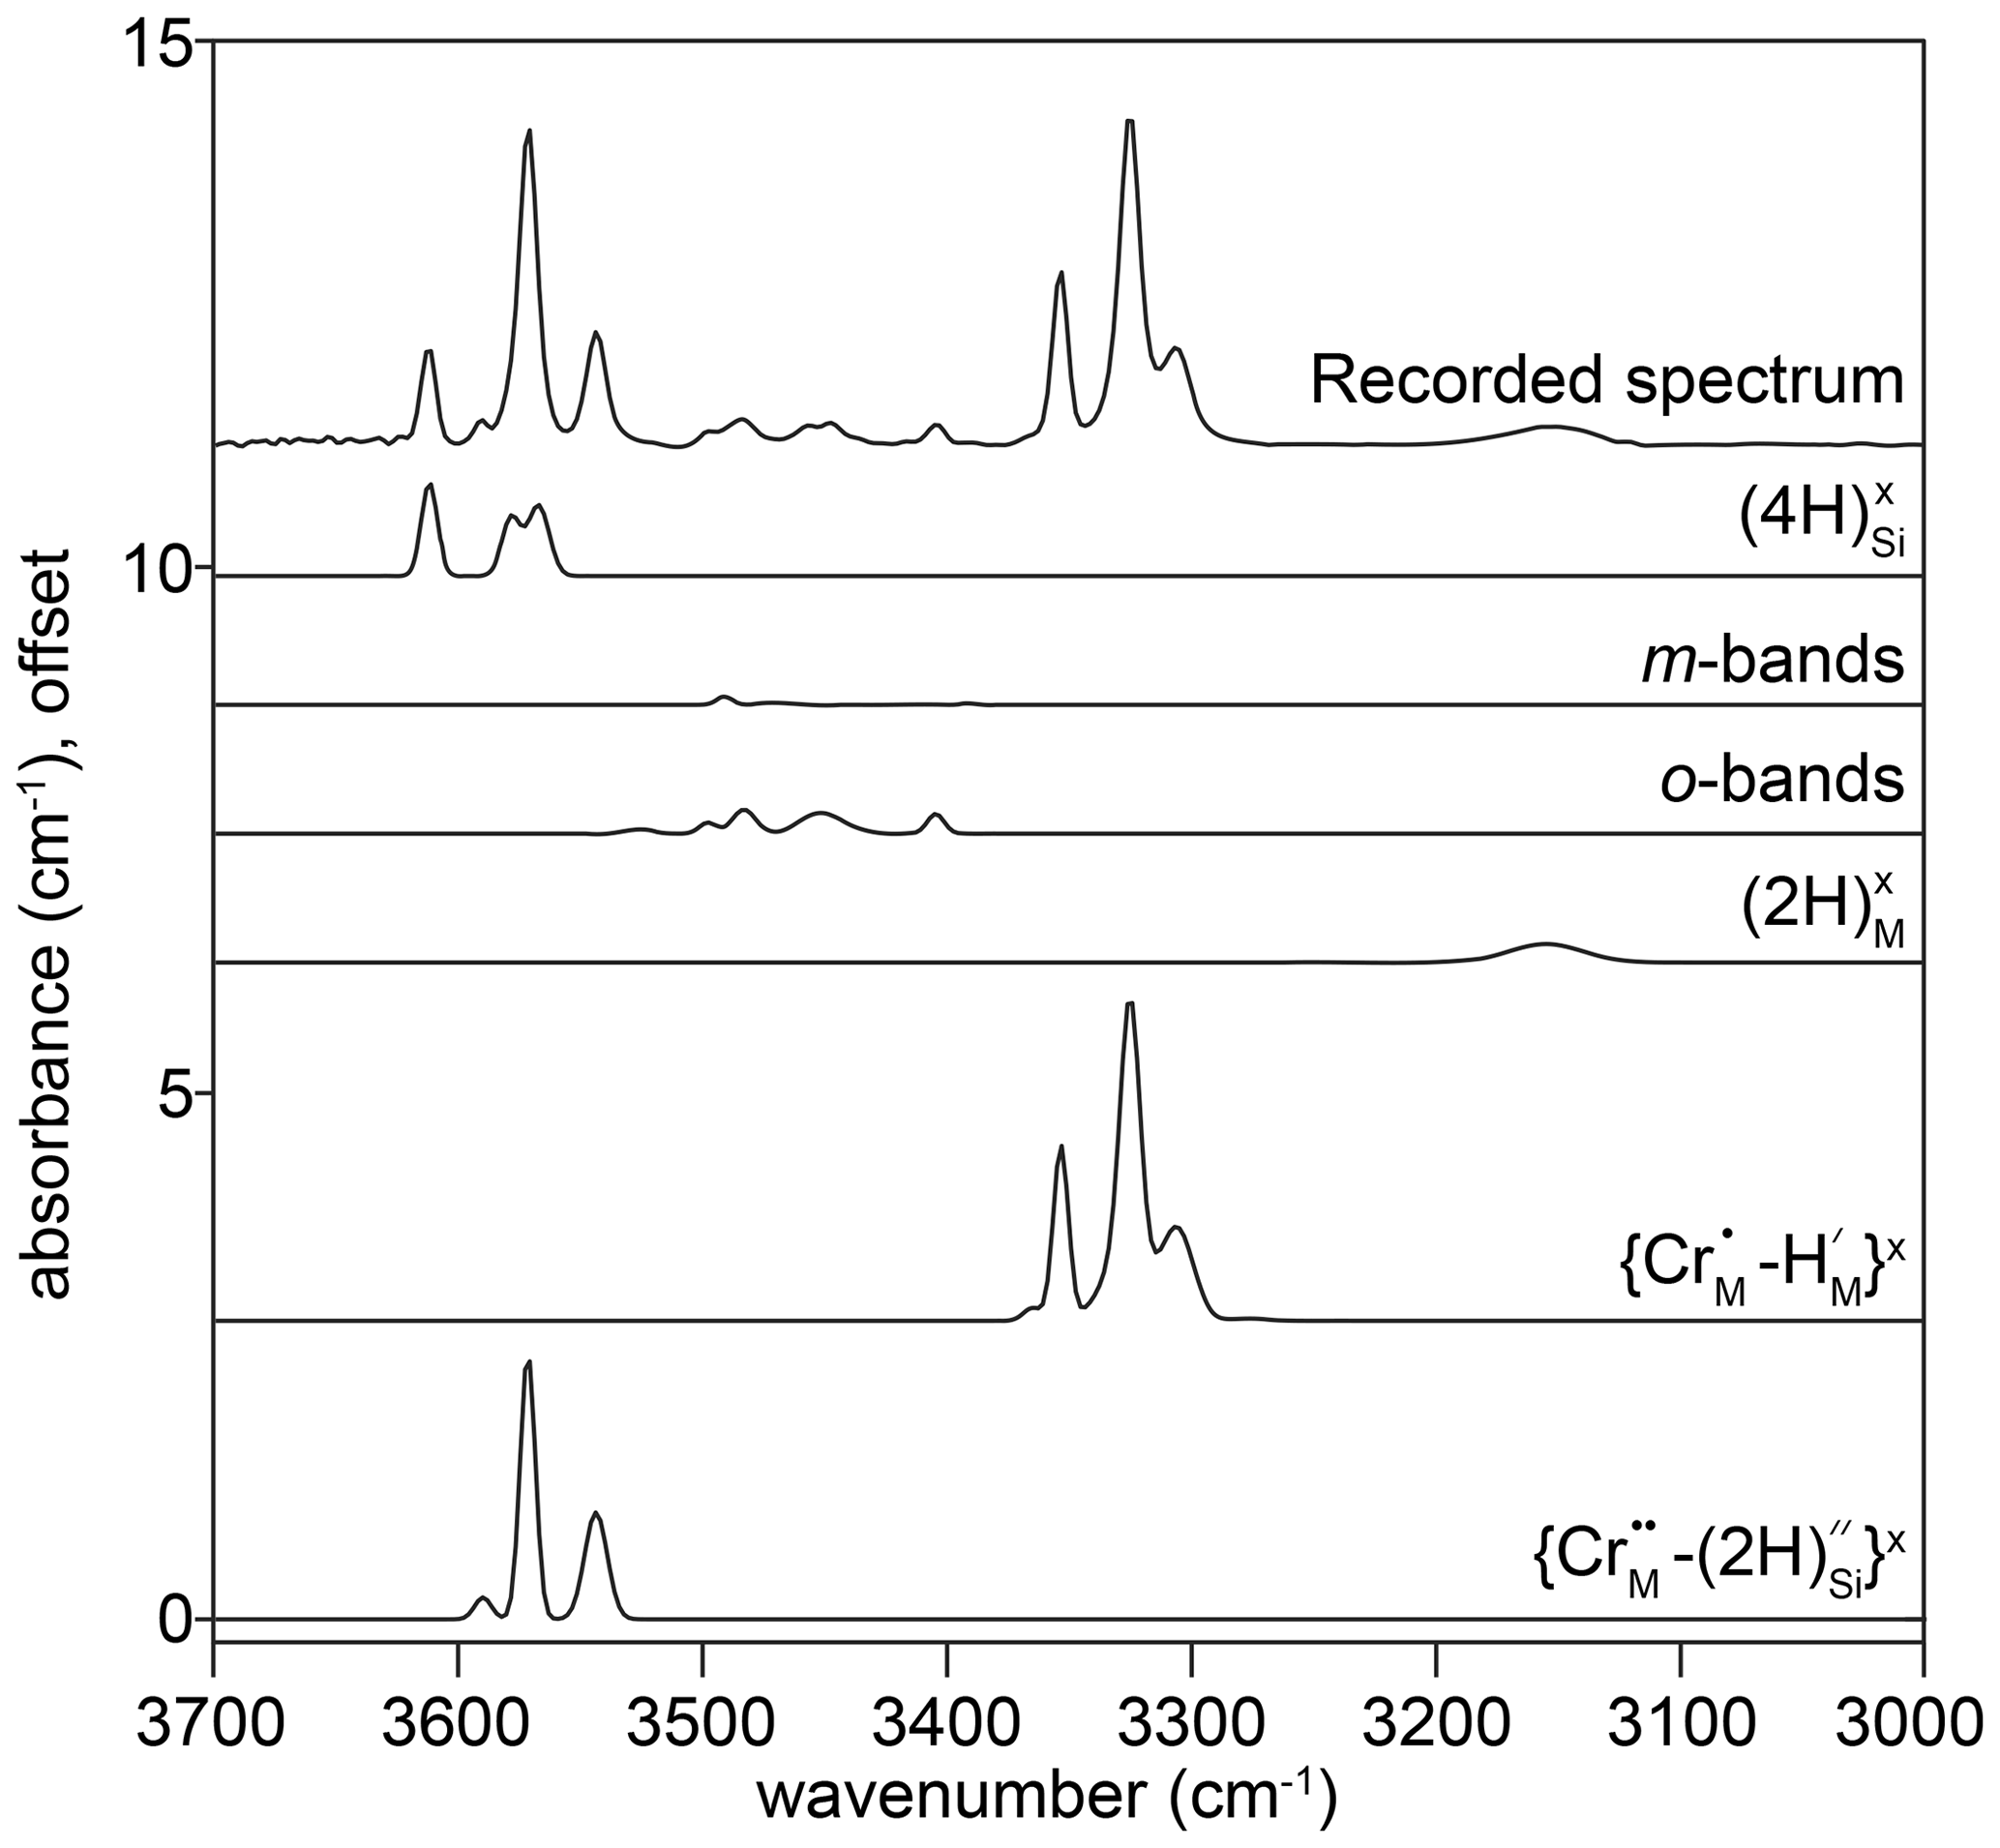
Figure 4The FTIR spectrum recorded at the interface of sample HYCRa06 (950 ∘C, 1.5 GPa, Ni–NiO, fo-en), resolved into 24 peaks, which were then grouped into six associations. The peak identities, or proposed identities, are given. The recorded spectrum is also shown in Fig. 3d.
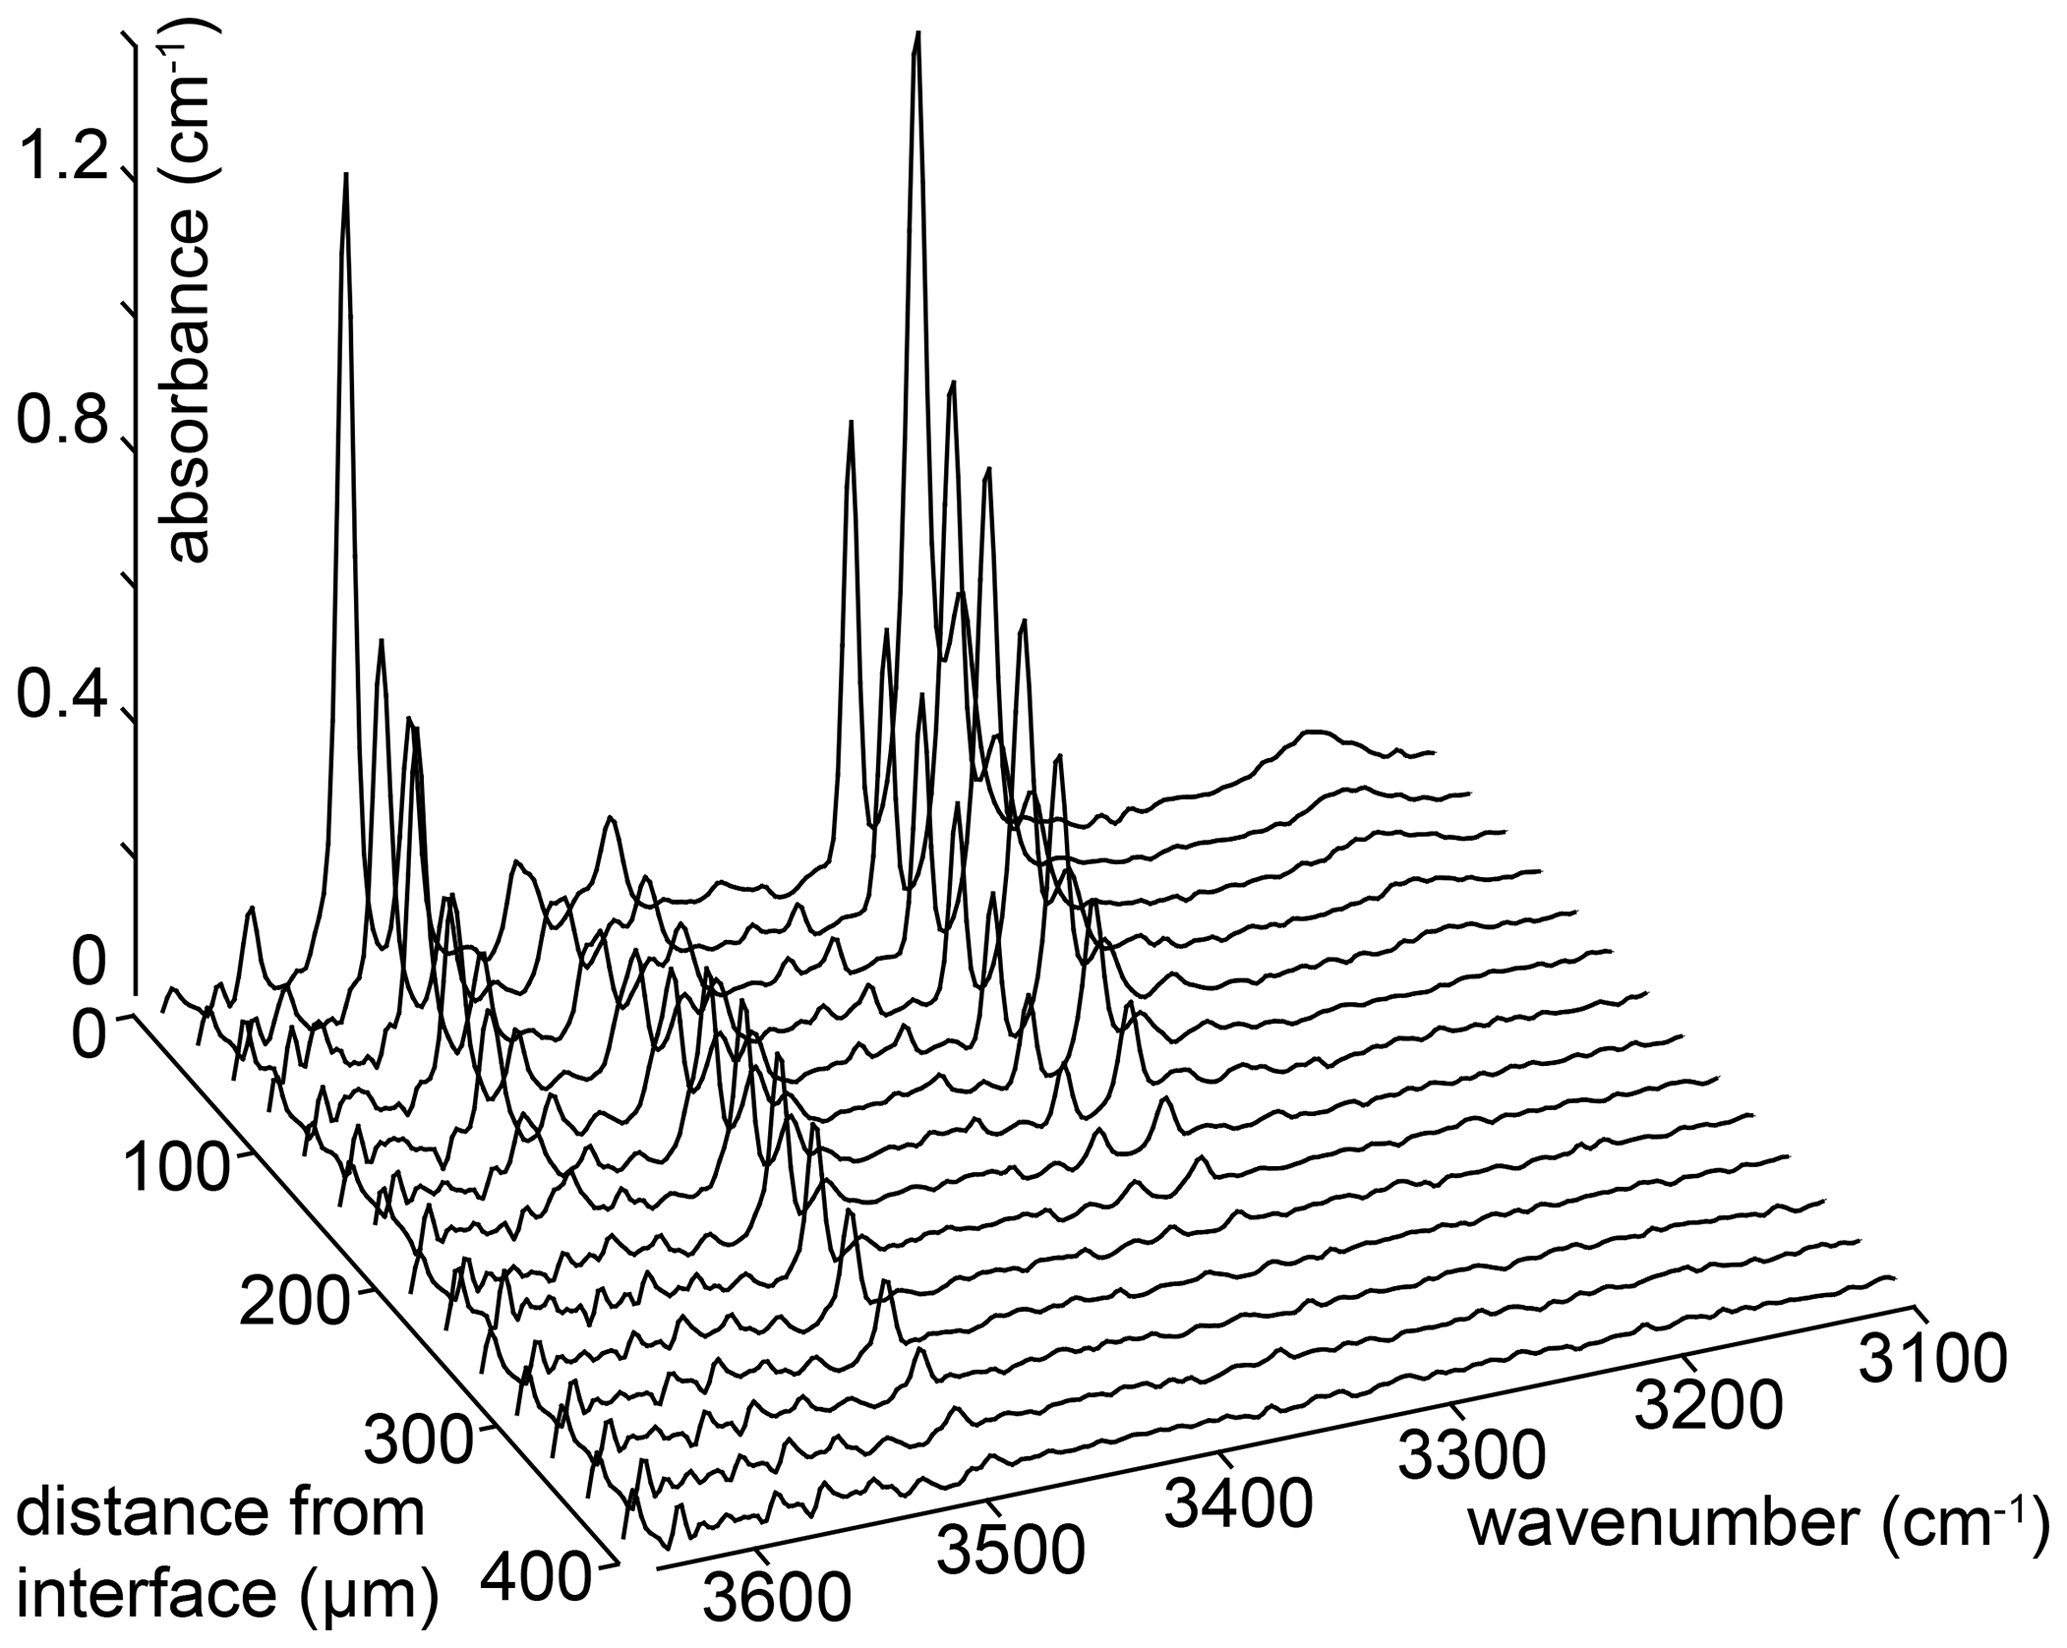
Figure 5An example of a series of FTIR spectra recorded as a function of distance from the crystal edge. The number of spectra in the series has been reduced by a factor of 3 for clarity. These spectra are from sample HYCRa3 (850 ∘C, Ni–NiO, 1.5 GPa, fo-en, 43 200 s).
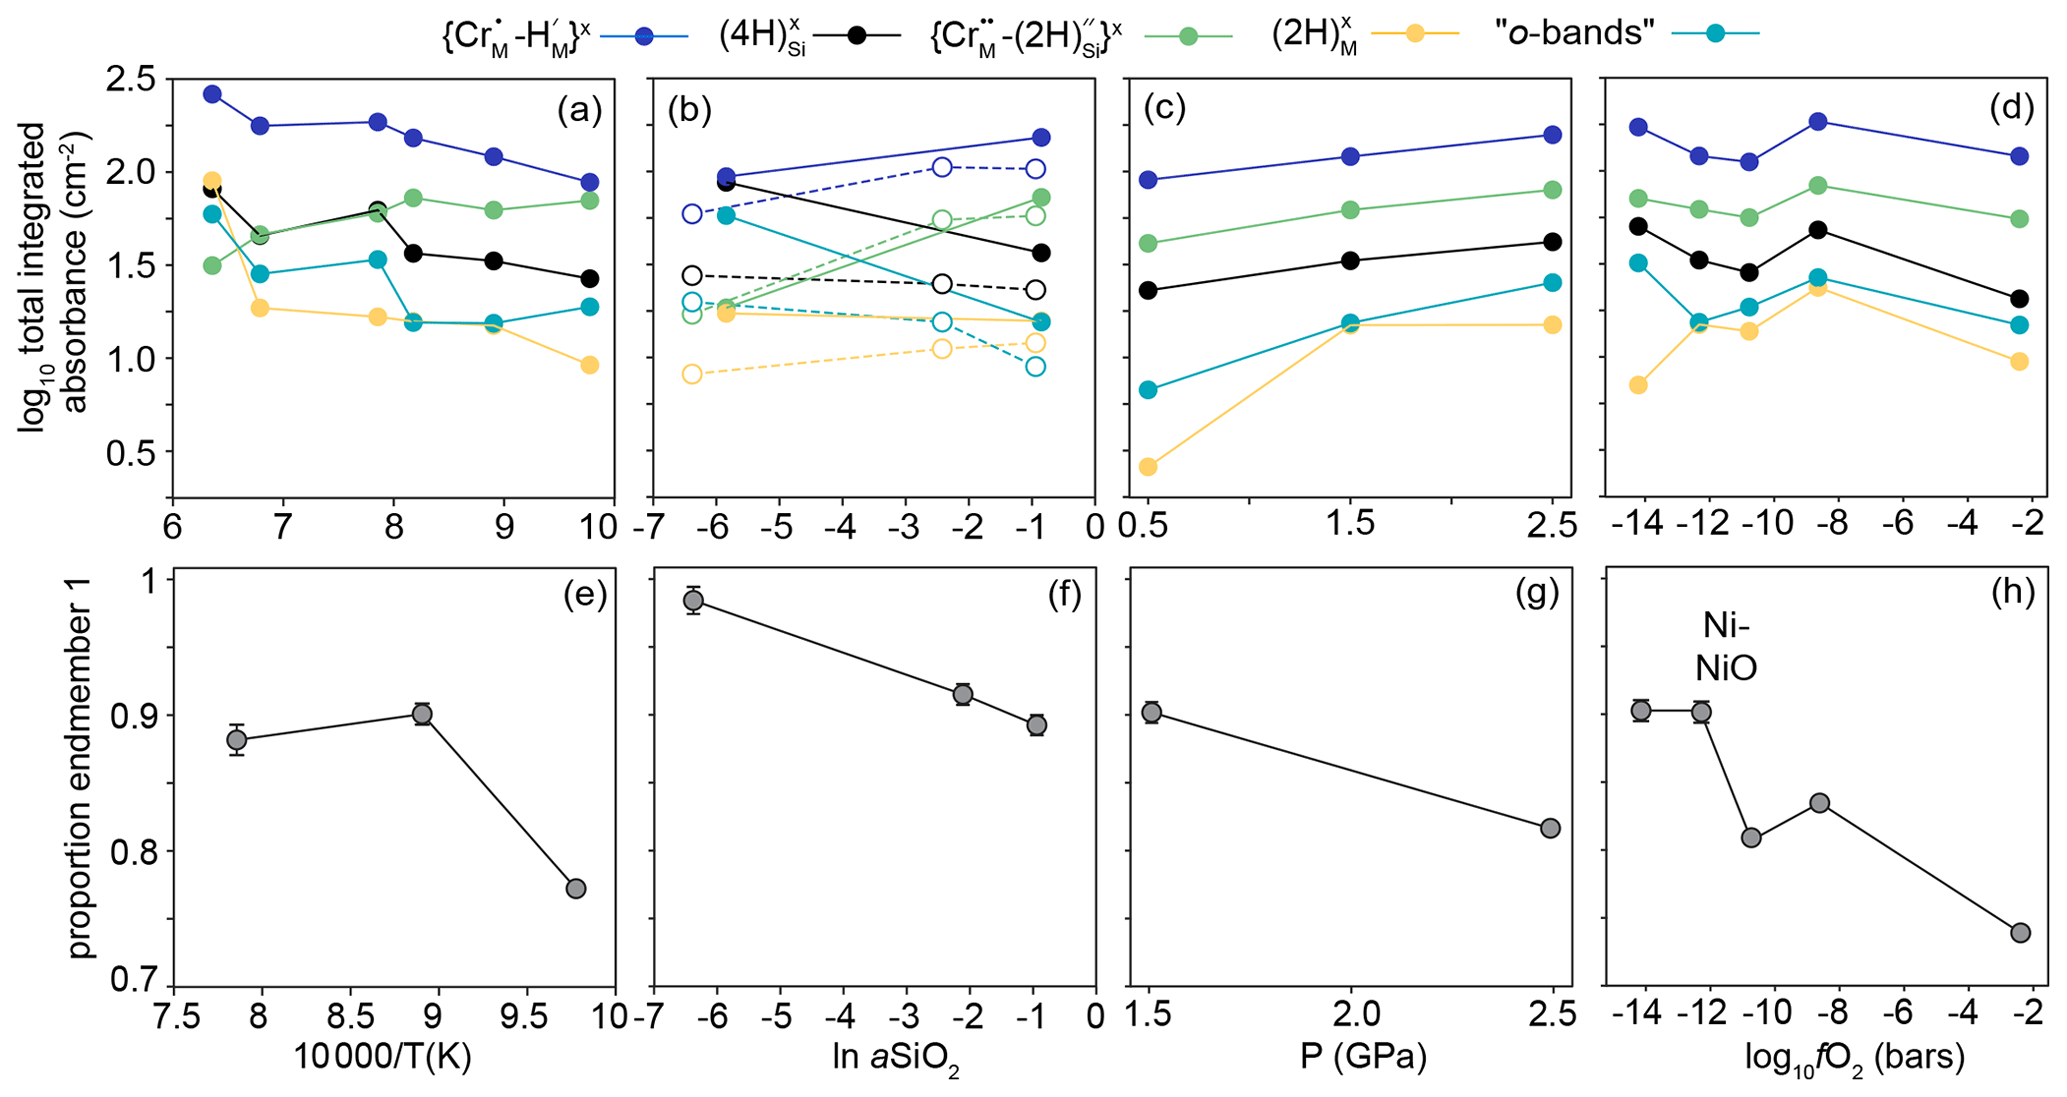
Figure 6The effect of (a) temperature, (b) aSiO2, (c) P and (d) fO2 on the integrated total absorbance from FTIR spectra recorded at the interface (corrected for orientation and thickness) for the peaks associated with the five defect types expressed at the interface (not including m-bands). Lines between the data points are for a visual guide only. In (b), the filled circles and solid lines relate to samples from the 950 ∘C experiments and open circles and dashed lines to samples from 850 ∘C experiments. (e), (f), (g) and (h) are equivalent to (a), (b), (c) and (d), respectively, and show the proportion of end-member 1 from linear combination fitting of XANES spectra. See Fig. 9 for examples of linear combination fitting.

Figure 7Profiles obtained from XANES and FTIR spectra of the same sample (as shown in Fig. 5, HYCRa3, 850 ∘C, Ni–NiO, 1.5 GPa, enstatite buffer, 43 200 s). (a) The proportion of end-member 1 determined by linear combination fitting of the XANES spectra (see Fig. 9 for examples of linear combination fitting). (b) The intensity of FTIR peaks corresponding to different defects, as well as sum of absorbance (∑abs), offset for clarity. Fits to Eq. (2) are shown by the solid lines. All points < 200 µm from the interface were not included in the “m-bands” fit. Uncertainties associated with peak fitting are smaller than the symbols.
The samples from the high-T experiments show complex behaviour, with none of the resolved defects decreasing smoothly from rim to core. Two types of behaviour can be distinguished in the rim-to-rim profile of the sample from the 1200 ∘C experiment (Fig. 8a). In the core region (zone 1, Fig. 8a), , and show smooth decreases towards the core, but none have zero core contents. In the near-interface region (zone 2 in Fig. 8a), decreases towards the interface, giving an M-shaped profile. Conversely, the m-bands, which consistently have M-shaped profiles in samples from low-T experiments, are nearly absent. This is accompanied by a change in the slope of the and profiles, which become steeper towards the interface. There is also increased absorbance associated with and o-bands. The sample from the 1300 ∘C experiment is broadly similar but with the addition of a third class of behaviour in the near-interface region (zone 3 in Fig. 8b). In this region, the , absorbance decreases towards the interface, the , and O-band absorbance profiles flatten, and increases.
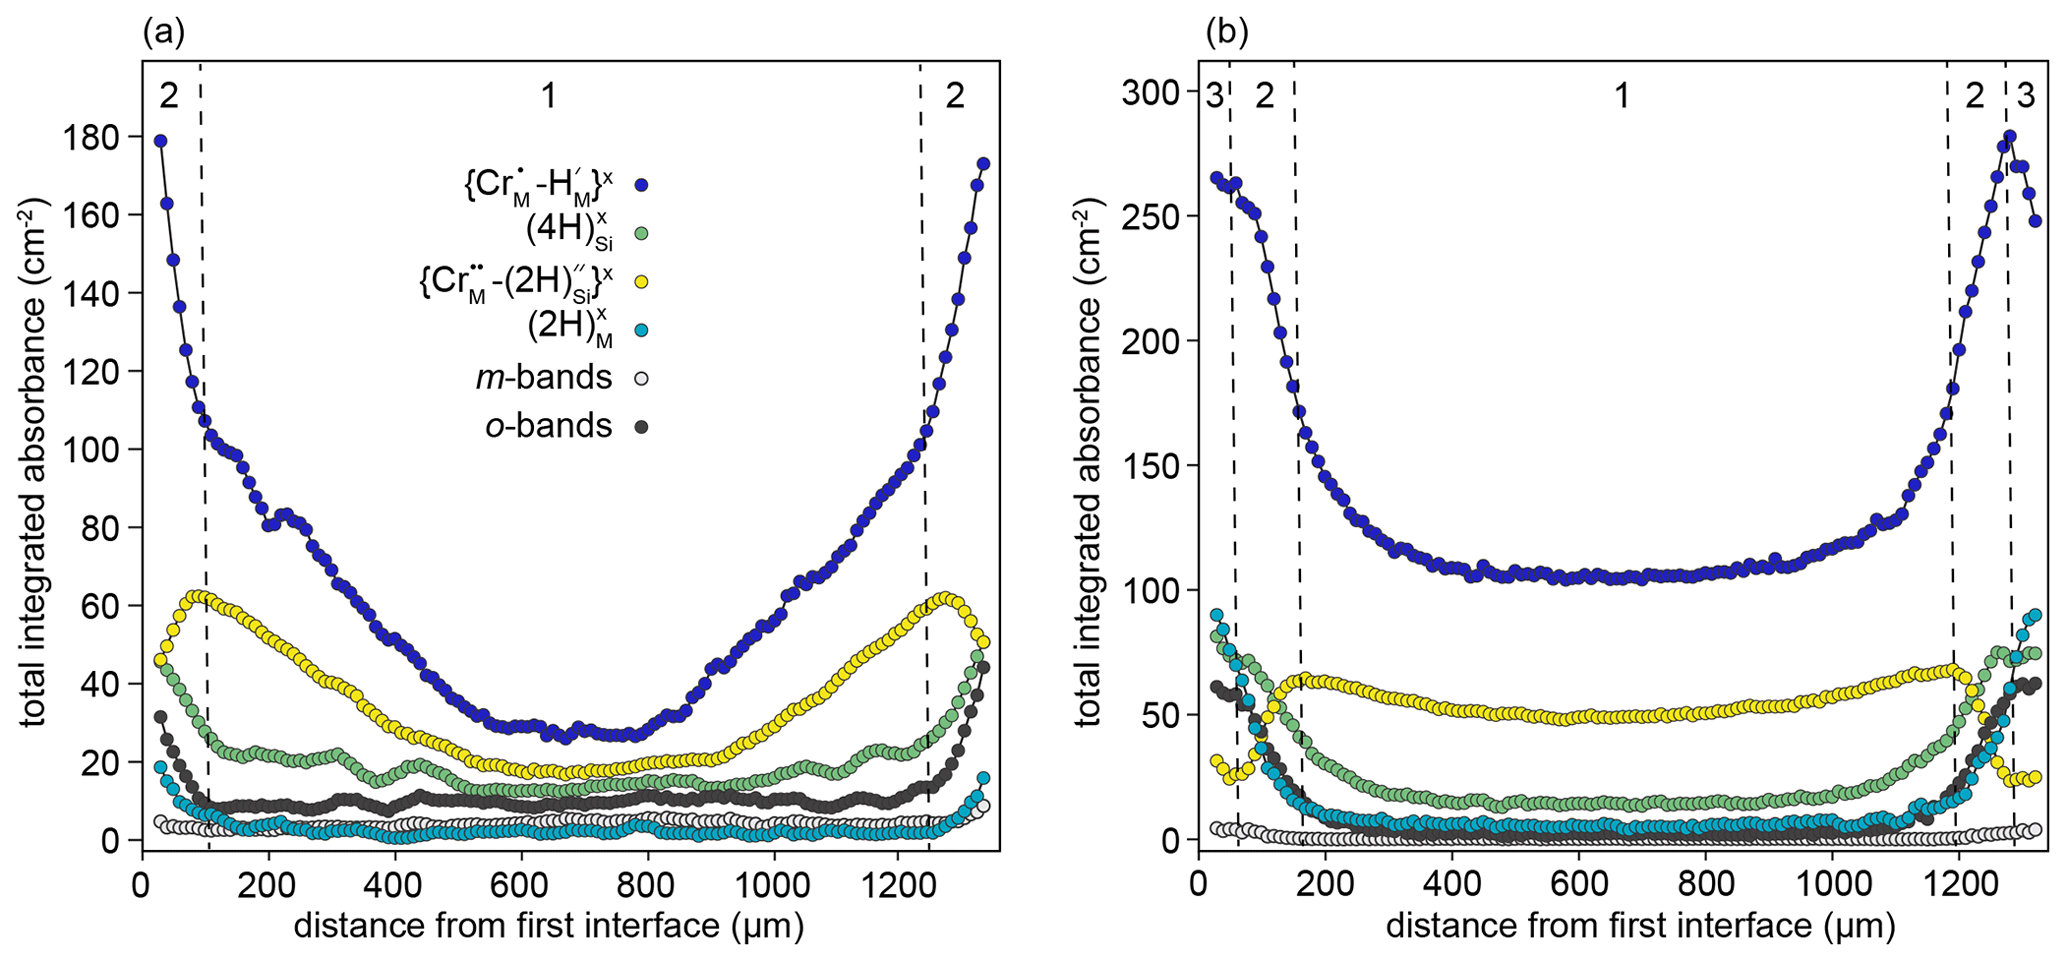
Figure 8Rim-to-rim profiles of FTIR bands assigned to different defects for samples prepared at (a) 1200 ∘C and (b) 1300 ∘C. Zones 1, 2, and 3 are defined by the dashed lines and represent core, transitional, and interface regions. Note that the zone “1”–“2” boundaries are further into the crystal than designated by the XANES data: this is due to the higher experimental temperature.
3.2 XANES spectra and profiles of Cr speciation
Examples of XANES spectra from samples, standards (both recorded and calculated) and spectra reproduced from Pantelouris et al. (2004) are presented in Fig. 2 (note that the energy calibration in Pantelouris et al. (2004) was corrected by defining the energy of the first derivative of Cr metal (their Fig. 8) to be at 5989.2 eV as for our monochromator energy calibration). Examples of linear combination fits are shown in Fig. 9.

Figure 9Examples of Cr K-edge XANES spectra (light green, solid line) recorded at (a) 5 µm and (b) 505 µm from the interface of sample HYCRa5. The spectra were fitted (dark green, dashed line) using a linear combination of end-members 1 (blue) and 2 (yellow). The residual is shown in black.
Spectra from the crystal cores show a pre-edge feature comprising a doublet at ∼ 5991 and 5993 eV. This pre-edge feature is consistent with the presence of the lasing ion, tetrahedrally coordinated Cr4+, based on comparison with the XANES spectra of compounds where Cr4+ occupies tetrahedral sites, namely Sr2Cr4+O4, Ca2Ge0.8CrO4 and Ba2Ge0.1CrO4 (Pantelouris et al., 2004). It is notable that IVCr5+- and IVCr6+-bearing compounds also show an intense pre-edge feature (Pantelouris et al., 2004), but the presence of Cr5+ and Cr6+ in similar forsterite crystals has been ruled out by EPR studies (e.g. Rager et al., 1991).
The white line of these crystal core spectra is at ∼ 6009 eV (Fig. S8a). Sutton et al. (1993) presented a relationship between the energy of the white line and the valence state of Cr (their Fig. 7d). After energy calibration using the Cr0 spectrum of Berry and O'Neill (2004) to give coherence with the monochromator calibration used in this study, the white line of Cr4+ in Sutton et al. (1993) is at ∼ 6008.5–6010 eV in our energy reference framework, confirming that our recorded spectra do indeed correspond to Cr4+.
The pre-edge feature decreases in intensity from the cores to rims of all crystals studied. The length scale over which the feature returns to the intensity associated with the crystal cores (i.e. that of the initial condition) is broadly consistent with the length scale of profiles determined by FTIR spectroscopy.
In the near-interface region, the pre-edge feature continues to decrease in intensity towards the interface (Fig. 2). The intensity of this pre-edge feature is lowest in interface spectra recorded on samples from experiments conducted either at high temperatures or low fO2 (Fig. 2). The interface spectrum from the 1000 ∘C sample lacks the feature completely. This is accompanied by a shift in the position of the edge and the white line to lower energy; the lower values for the white line are < 6008 eV. This shift is generally ascribed to a decrease in the mean valence state of Cr (Sutton et al., 1993; Bell et al., 2014).
Two spectra and their linear combination fits are shown in Fig. 9, with the results of linear combination fitting for all recorded spectra presented in Fig. 10 (sample-specific in Fig. S9). The proportions of the different end-member spectra obtained by linear combination fitting along rim-to-core profiles show two regions, divided by a break in slope. We denote the regions on either side of this break in slope as “1” (closer to the core) and “2” (closer to the rim). In zone “2”, shown by grey shading in Fig. 10, there is a steep decrease of up to 0.25 in the proportion of end-member 1. This zone is less than ∼ 30 µm wide. Then, in zone “1”, the decrease in the proportion of end-member 1 becomes more gradual, falling by around 0.1 over ∼ 300–600 µm. As well as being divided by the break in slope of end-member proportions, it is also notable that the decrease in the intensity of the pre-edge feature and the shift of the white line to lower energy occurs almost entirely in zone “2”, i.e. the near-interface region. The distinction between zones “1” and “2” is corroborated by the trends in Fig. S8, which shows that the zone “1”–“2” boundary, as well as being associated with a decrease in the intensity of the pre-edge feature and the energy of the white line (Fig. S8a), is also expressed as a change in the relative intensity of the two peaks comprising the pre-edge doublet (Fig. S8c) and the energy of the edge (energy at normalised intensity = 0.8, Fig. S8b and d).
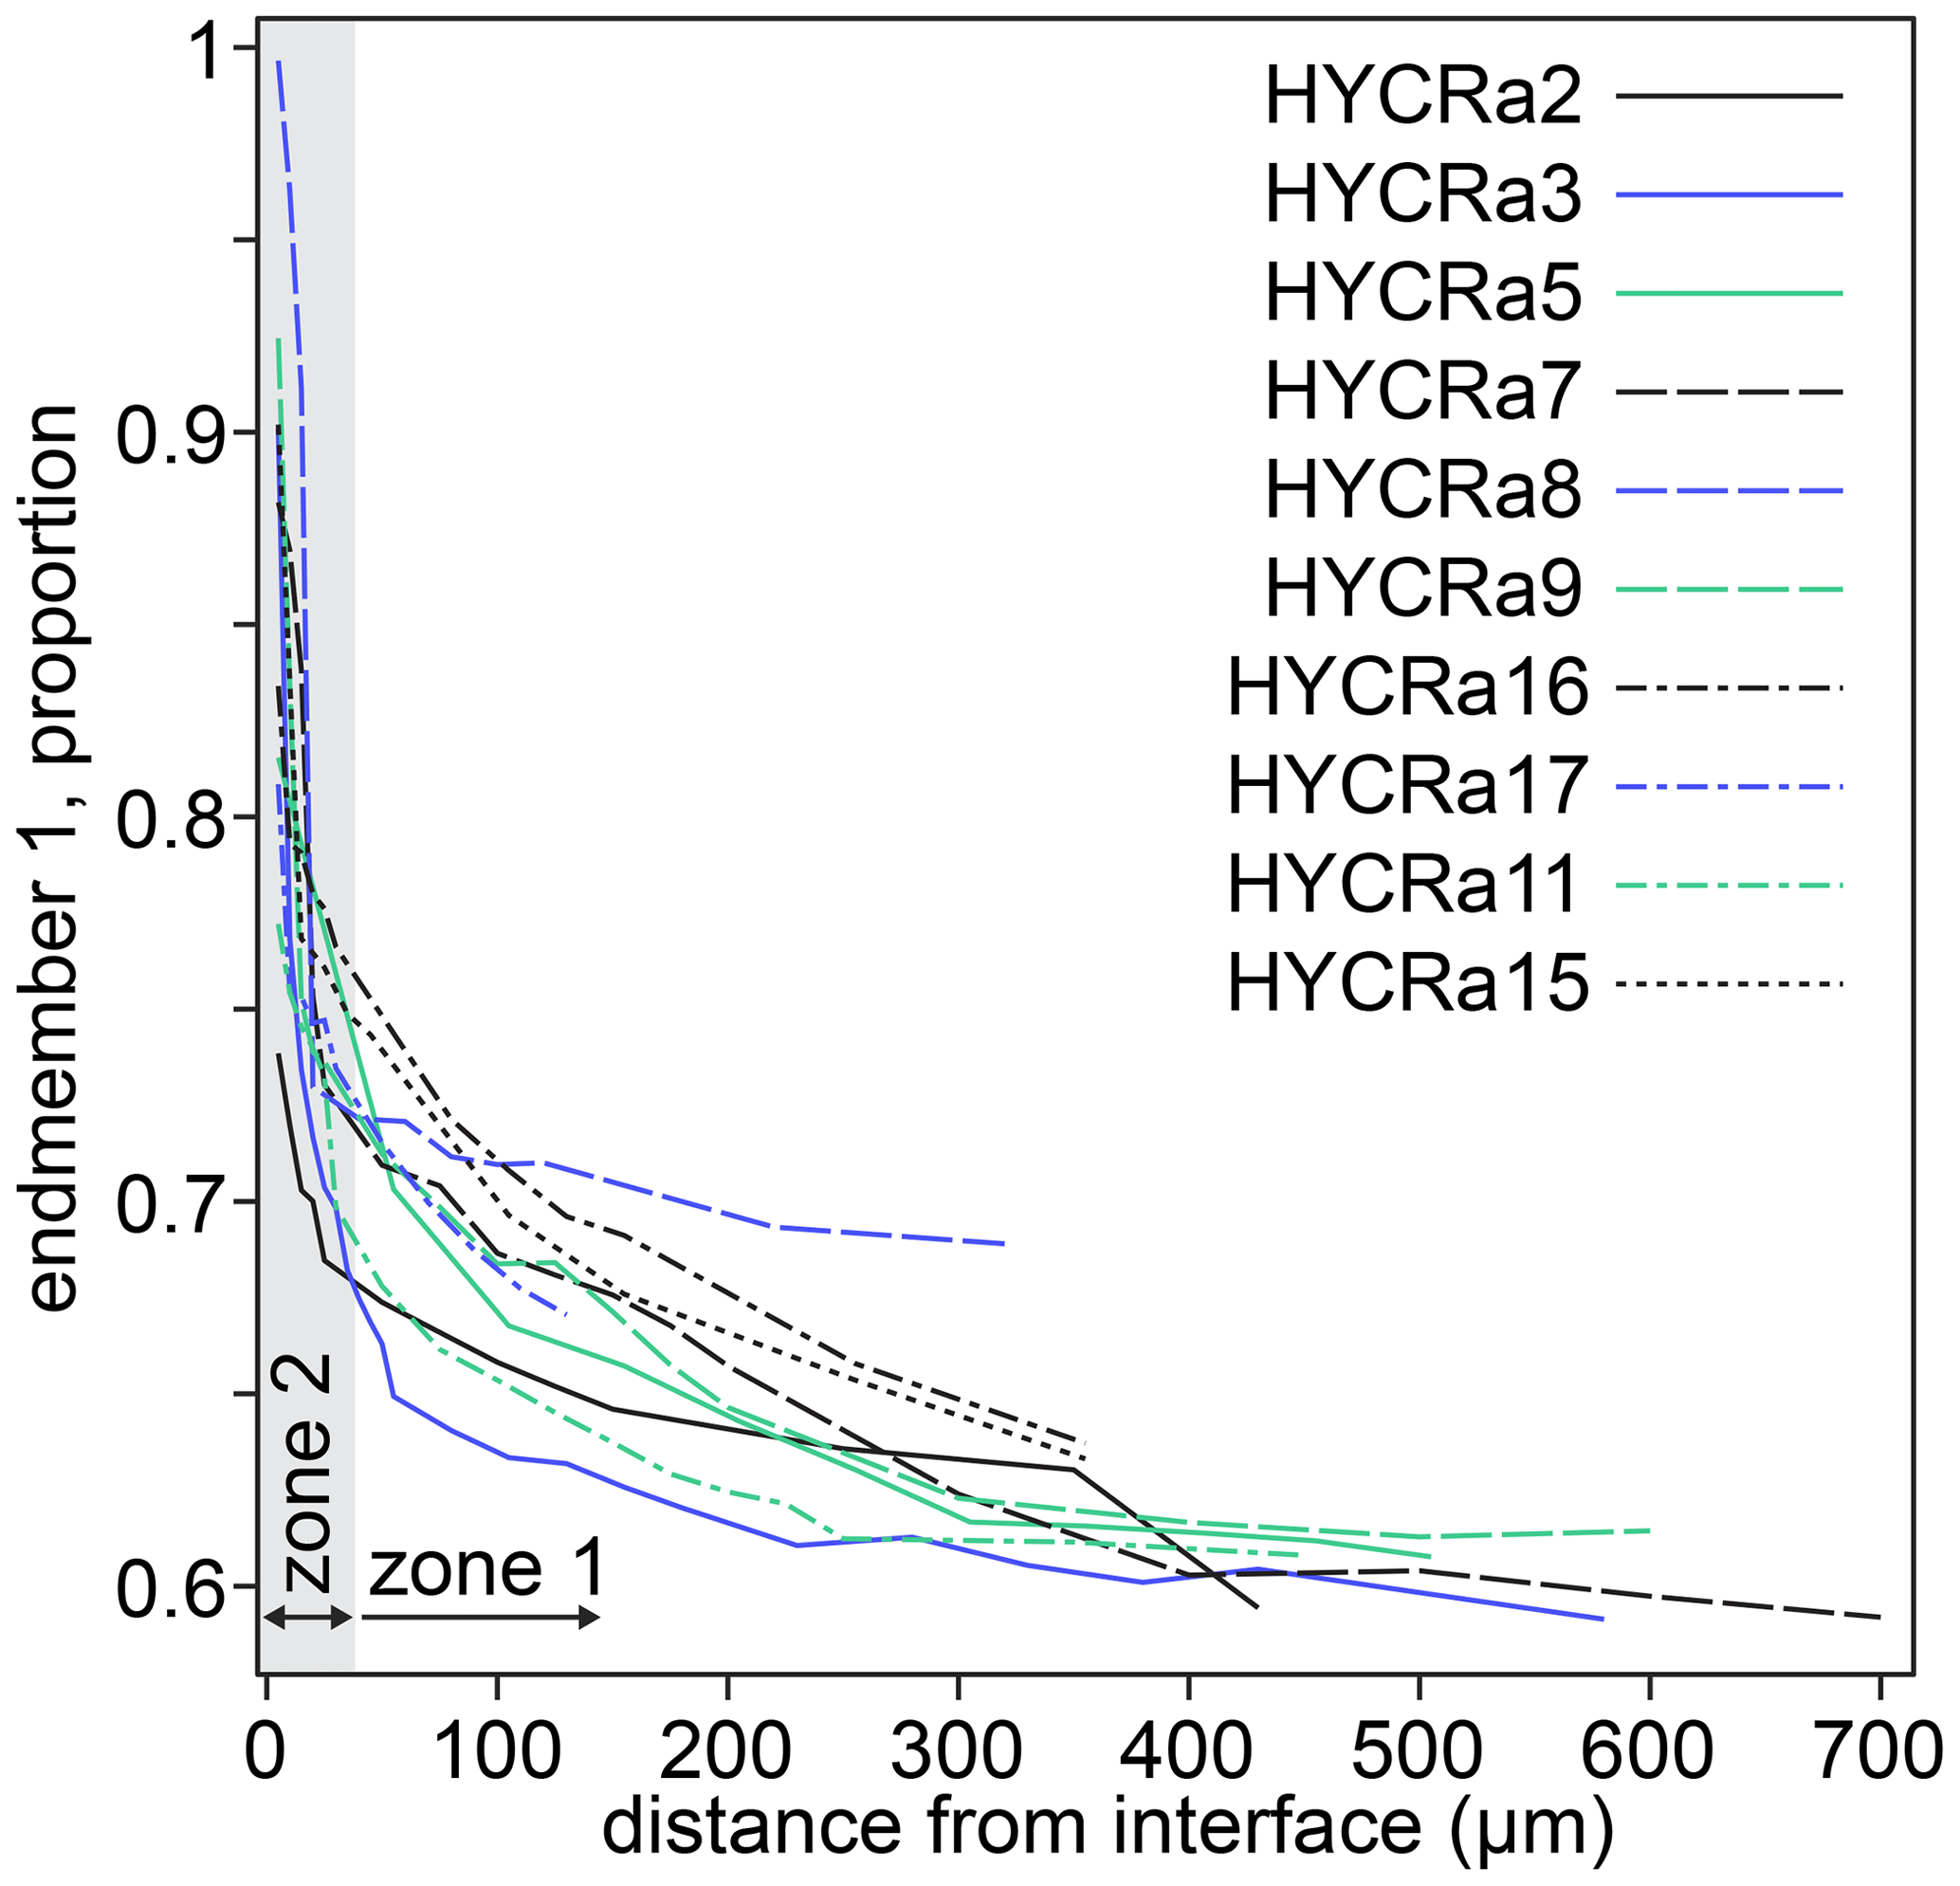
Figure 10The proportion of end-member 1 as a function of distance from the interface for all crystals studied. The designation of zones 1 and 2 is approximate (30 µm from the interface) and based on the break in slope observed in almost all profiles. Further information regarding the change in behaviour between zones 1 and 2 is given in Fig. S9. The relative uncertainties (2σ) from linear combination fitting are generally 0.2 %–1.5 %. These are given in the Supplement.
3.3 XANES-FTIR direct comparison
Transmission FTIR spectra were recorded from the whole thickness of the sample, whereas XANES spectra are only derived from the top tens of µm, but our analytical strategy was aimed at making the two directly comparable. This is based on the assumption that, by preparing a 300–500 µm thick section from the core of a 1–1.5 mm cube, we can effectively reduce the 3D diffusion geometry to a 2D problem. We assume that the FTIR spectra that represent the whole integrated thickness of the thick section should be the identical to FTIR spectra recorded from any given sub-section of the thick section, as long as its faces are parallel to those of the original.
The thickness-normalised total integrated absorbance for the , , and defects, determined from FTIR spectra, is plotted against the proportion of end-member 1, determined from XANES spectra, in Fig. 11. The comparison required the defect-specific total integrated absorbance to be determined from FTIR spectra as a function of distance from the interface for each sample, and then this was linearly interpolated onto a vector of the positions of XANES analyses. This method implicitly assumes that the positions of both XANES and FTIR spectra are given by their midpoint, and both have zero volume. Because they are derived by interpolation, the data in Fig. 11 are only from regions of the crystals where both XANES and FTIR spectra were available, which effectively excludes all XANES spectra in zone 2 (see Figs. 7, 10), given the relatively poor spatial resolution of the FTIR technique.
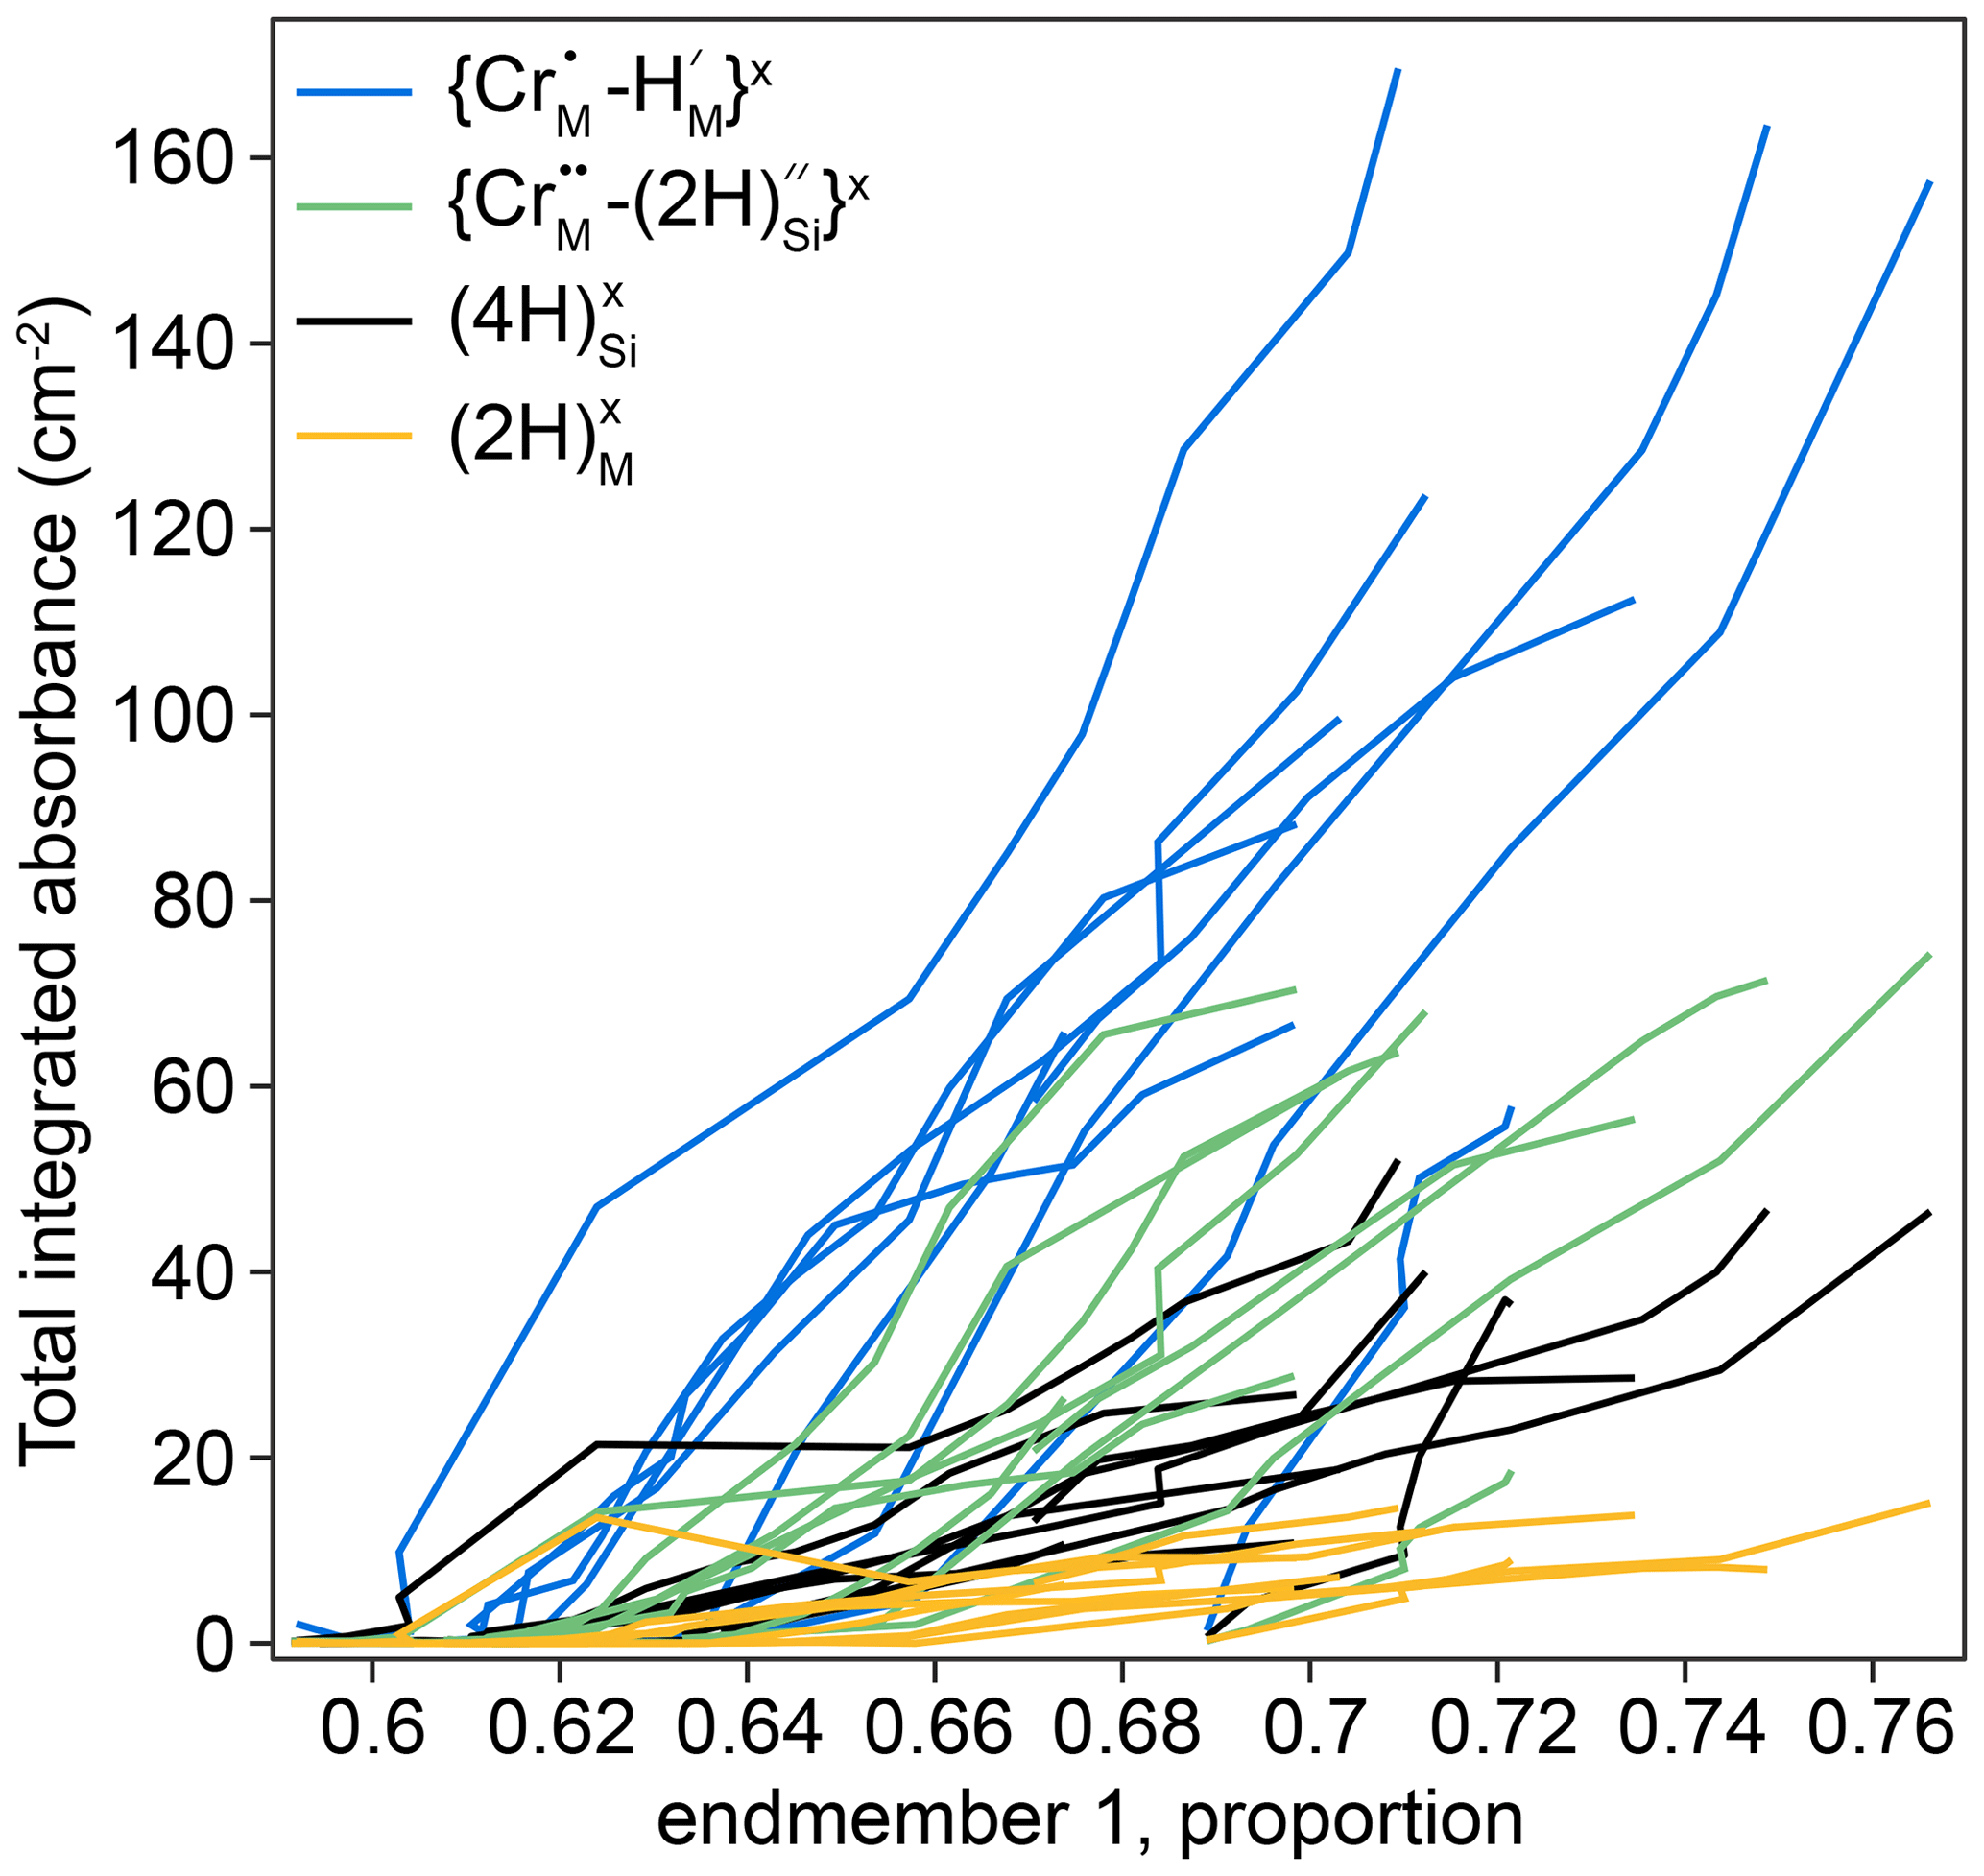
Figure 11The defect-specific integrated total FTIR absorbance versus the proportion of component 1 in the XANES spectra. The lower left represents the crystal cores (low absorbance, low end-member 1), and the upper right represents the rims (high absorbance, high end-member 1). All curves are broadly linear. Relative uncertainties in linear combination fitting are mostly 0.2 %–1.5 %; these are presented in the Supplement. An expanded version of the same figure separated into individual experiments is given in Fig. S11.
Increased hydrogen contents are associated with a decrease in the intensity of the pre-edge feature and/or a shift of the edge to lower energy which represent an increase in the proportion of end-member 1.
3.4 Diffusion coefficients
Extracted for the major defects, , , and , as well as the bands showing humped profiles, and the total absorbance, are given in Table 1. An expanded version of the same table including interface concentrations (both in terms of absorbance and wt ppm H2O from all published absorption coefficients in Table 3) and uncertainties is given in the Supplement. Table 1 only includes the data from low-T experimental samples, because diffusion coefficients could not be extracted from the high-T samples due to their highly irregular profile geometries (Fig. 8). This complexity indicates that the assumption of constant diffusivities (Eqs. 2 and 3) is not applicable. In addition, the elevated O–H concentrations in the crystal cores indicate non-negligible 3D effects.
As expected for Arrhenian behaviour, diffusivities vary proportionately to the inverse of temperature (Fig. 12). Activation energies, volumes and pre-exponential factors were extracted for diffusion associated with each defect individually and the sum of absorbance associated with all defects, using Eq. (4) – these are given in Table 4. The reference pressure is 1.5 GPa.
This fit includes data from samples at all the fO2 and aSiO2 conditions studied, as these variables do not have a discernible influence on diffusivities. Given that the defects all have Ea, log and ΔV within uncertainty, a fit was also done incorporating data from all defects (profiles from all defects were given equal weight), giving a final Ea of 224 ± 12 kJ mol−1 (1σ), log of −2.5 ± 0.6, and ΔV of 4.0 ± 2.0 kJ GPa−1 mol−1 (4.0 ± 2.0 cm3 mol−1, 0.4 ± 0.2 kJ kbar−1 mol−1), which fall within uncertainty of the equivalent curve from Demouchy and Mackwell (2006) (, log) and Jollands et al. (2016b) (, log). The ΔV is positive when all diffusion coefficients are fitted together, but several individual defects show ΔV within uncertainty of zero.
Table 4Fitting parameters associated with Eq. (4), for individually resolved defects, for ∑abs, whereby s associated with the sum of absorbance of all defects was fitted together (not including any wavenumber specificity), and ∑[defects], where all extracted s were fitted together. Uncertainties are 1σ. The reference pressure is 1.5 GPa.
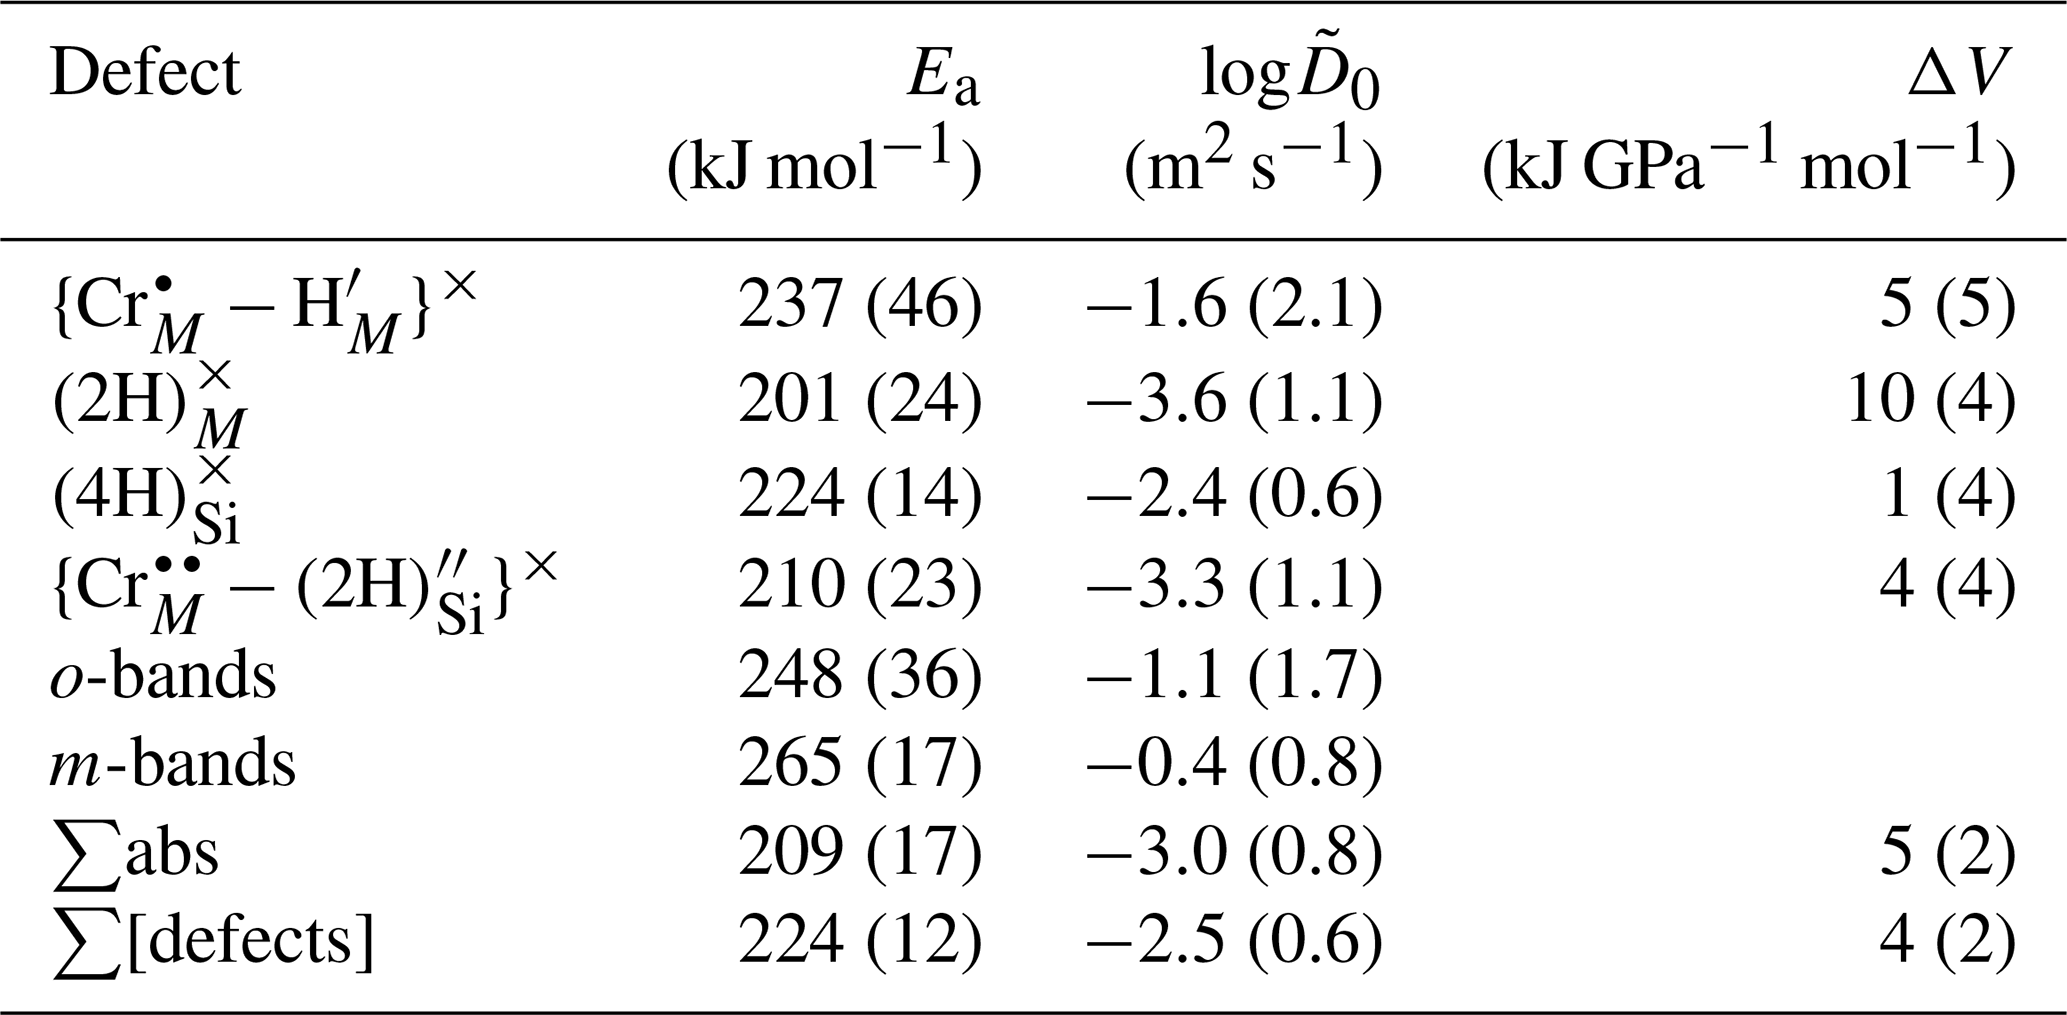
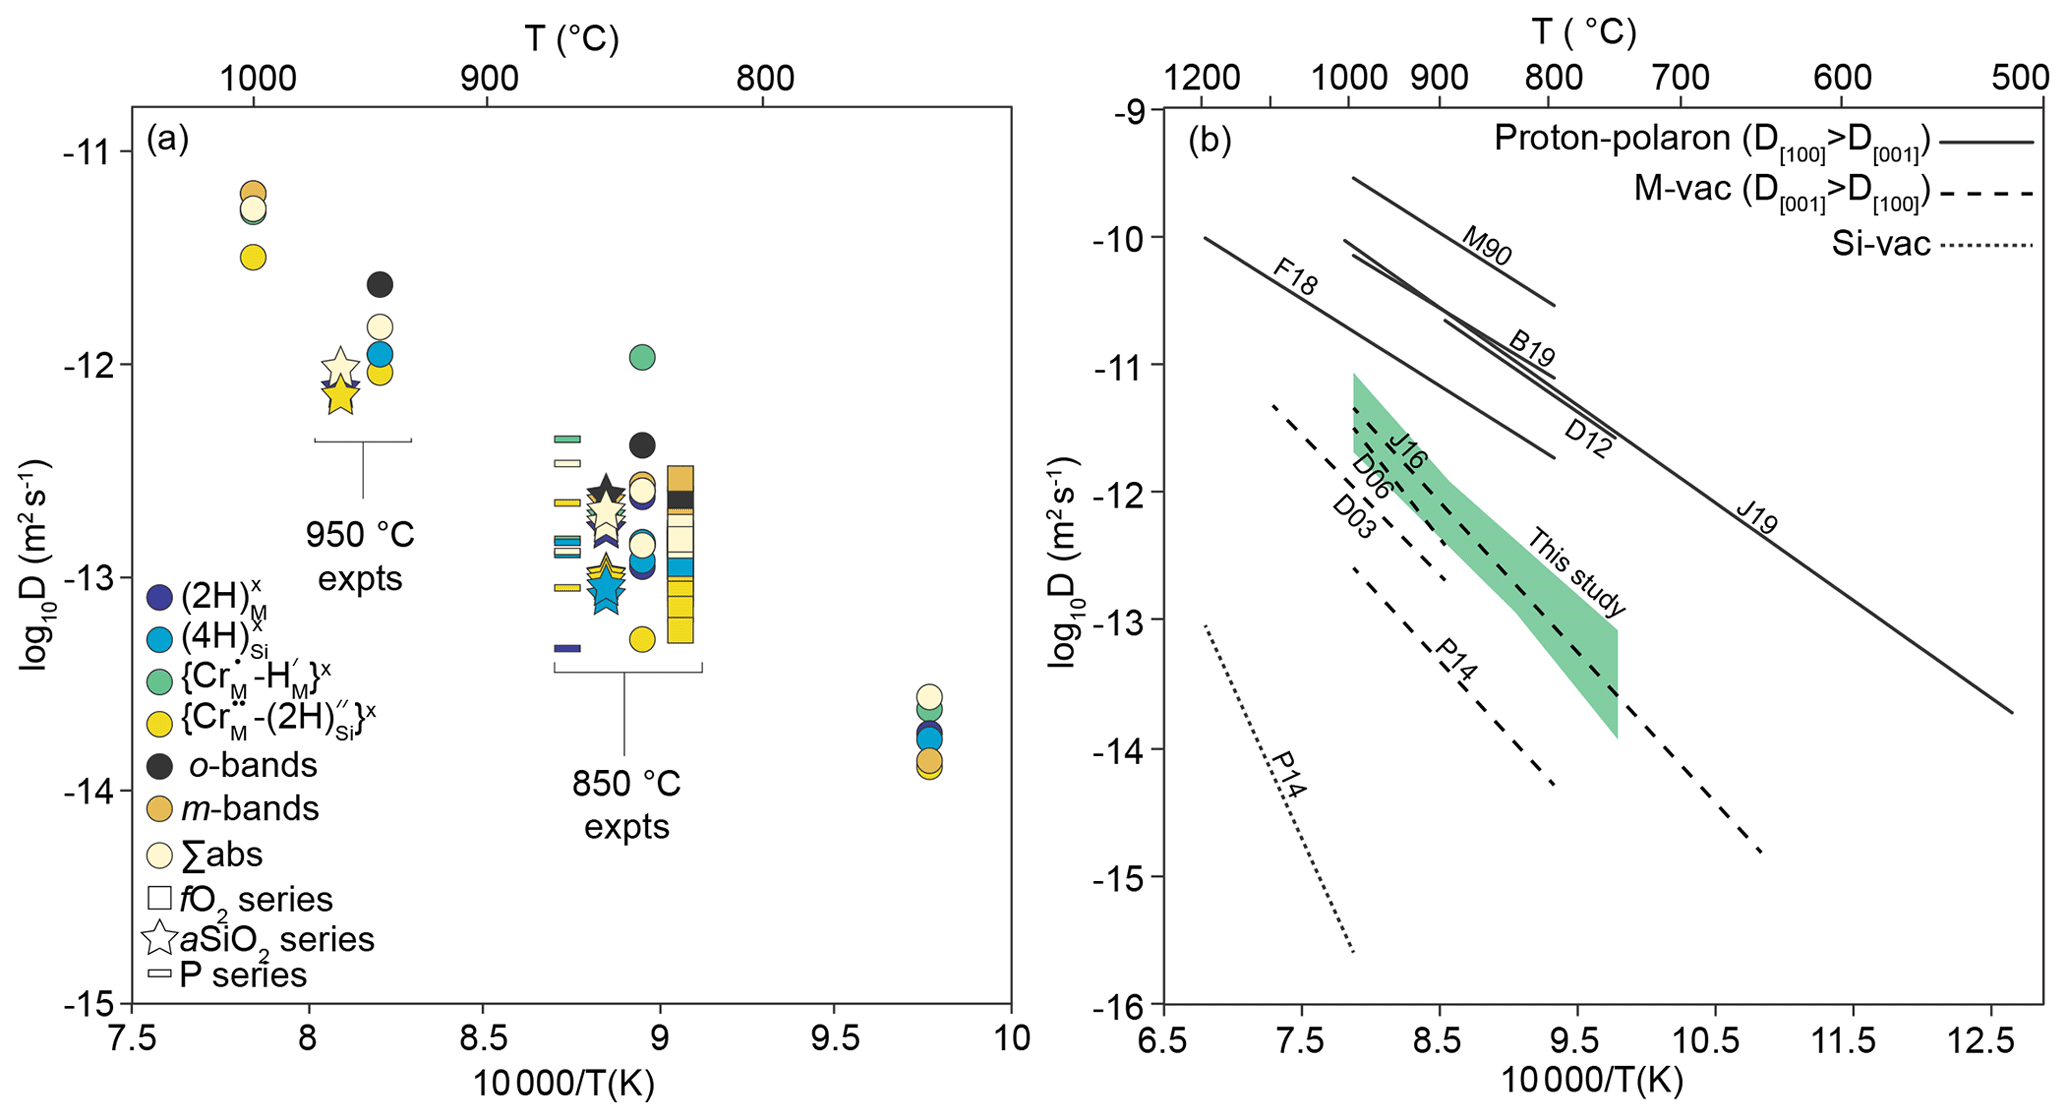
Figure 12(a) Diffusion coefficients as a function of inverse temperature, for five resolved defects, and total H. Also shown are data from experiments conducted at different fO2 (squares), aSiO2 (stars) and pressure (rectangles). Points from 850 and 950 ∘C experiments are offset for clarity. See the Supplement for uncertainties. (b) from this study along with from other studies. The shaded area represents the range of Arrhenius parameters in Table 4. Data are grouped into three associations: (1) where (proton–polaron mechanism); (2) where (M-vacancy mechanism); and (3) the Si-vacancy mechanism, only observed in pure, MgO-buffered forsterite. M90: Mackwell and Kohlstedt (1990); B19: Barth et al. (2019); F18: Ferriss et al. (2018); D12: Du Frane and Tyburczy (2012); J19: Jollands et al. (2019); J16: Jollands et al. (2016b); D06: Demouchy and Mackwell (2006); D03: Demouchy and Mackwell (2003); P14: Padrón-Navarta et al. (2014).
Whilst diffusive anisotropy was not the focus of this study, the data, where available, show that is around 1 order of magnitude greater than .
4.1 Justification for the point defect assignments
The FTIR spectra comprise at least 24 peaks, representing at least six different point defect types (Tables 2, 4). The following peak identifications are presented first in Kröger–Vink (Kröger and Vink, 1956) notation. This is limited by the convention that either the crystallographic sites on which the substitution occurs are specified or that the substitution is simply called “interstitial”, which is difficult to apply rigorously in the case of H substituting to form O–H structural elements. We present the Kröger–Vink notation in three ways – firstly where H is considered “interstitial”, with subscript “i”, secondly where H is in the form of an OH− group in the place of O2−, and thirdly where the H+ are assumed to occupy a lattice site. Herein, for brevity, we use the latter, i.e. where H+ is associated with a lattice site according to the requirements of maintaining local charge balance in the crystal structure. This should not be taken as a suggestion that H+ truly occupies the lattice sites, rather that the H+ ions should be closely associated with O2− ions, as expected, and as has been well shown from ab initio calculations (e.g. Blanchard et al., 2017). We do not differentiate between the different M and O sites. Additionally, defects are given as the equivalent thermodynamic components, which give the stoichiometry of the substitution without the details of how the substitution occurs in the crystal structure. All reactions will be written using both the Kröger–Vink notation and as thermodynamic components.
The majority of the FTIR absorbance (> 90 %) is associated with four peak groupings, three of which have been previously ascribed to point defects. Firstly, there is the fully hydroxylated Si vacancy, assigned from its association with low aSiO2 in the system (Mg,Fe)O–SiO2–H2O (Matveev et al., 2001), their response to changing aSiO2 (Lemaire et al., 2004; Berry et al., 2005), fH2O (Tollan et al., 2017) and ab initio calculations (Balan et al., 2011).
Secondly, assigned due to the relationship between the band area and aSiO2 (Matveev et al., 2001; Lemaire et al., 2004), we have 2H+ associated with an M-site vacancy.
Thirdly, there is H+ charge compensating Cr3+ and an M-site vacancy. This group was identified based on FTIR spectra of a series of synthetic forsterite crystals doped with various trivalent cations, including Cr3+ (Berry et al., 2007) and theoretical spectra (Blanchard et al., 2017).
The fourth association is associated with the intense peaks at 3544 and 3572 cm−1. Peak fitting reveals a third peak with similar behaviour at 3590 cm−1. Their intensities decrease smoothly from rim to core in samples from low-T experiments. These peaks are differentiated from the ( peaks in the same region by their opposite dependence on aSiO2 (Fig. 3). We designate this as a so-called “Cr-clinohumite”-type defect, analogous to the “Ti-clinohumite” point defect often observed in natural and synthetic olivine (e.g. Ferriss et al., 2018; Jollands et al., 2016b; Tollan et al., 2018). This is also suggested to be a major host of upper mantle water (Berry et al., 2005). In this defect, Cr4+ replaces Mg2+ and is charge-balanced by 2H+ replacing Si4+.
This defect should show a higher concentration in enstatite-buffered versus periclase-buffered conditions, if it forms from pre-existing .
From Eq. (5b), assuming mole fraction (X) and activity (a) are proportional for the two Cr4+-bearing defects, and assuming constant fH2O, we can derive
Thus the concentration of is expected to increase with increasing aSiO2, which is consistent with our data (Fig. 3). This, and the similarity between these peaks and the peak doublet at 3572 and 3525 cm−1, support the proposition that the peaks at 3544, 3572 and 3590 cm−1 represent a defect. This is supported by the XANES spectra, which show the absence of the pre-edge feature in rim spectra (see the spectra labelled “rim” in the two lowermost groups of spectra in Fig. 2b). These rim spectra are associated with the highest concentration of H. The absence of a pre-edge feature is attributed to Cr having moved from tetrahedral to octahedral coordination. This is consistent with Eq. (5). No other 4+ cations have yet been demonstrated to form this type of defect, although it is worth noting that V doped forsterite shows bands at 3553, 3567, 3577 and 3591 cm−1 (Fig. 4 of Berry et al., 2007) that may be due to . Note that according to guidelines from the International Union of Pure and Applied Chemistry for Kröger–Vink notation, V represents vanadium, whereas V, italicised, is a vacancy. These bands, especially in terms of relative band heights, cannot be ascribed to , and the experiments were fO2-buffered by Re–ReO2, where V4+ should be stable (Mallmann and O'Neill, 2009).
The assignments described above leave 12 peaks, which generally make up less than 10 % of the absorbance in FTIR spectra. These peaks can be broadly divided into two classes of behaviour.
First, we have the bands denoted as “o-bands”, which form a triplet or doublet between 3400 and 3510 cm−1. We resolve these into six peaks, but there are likely more. This is not the first time these bands have been observed (Fig. 13), although their origin has not been discussed previously, presumably because their intensities are small compared to the other peaks. Berry et al. (2007) synthesised pure forsterite doped with a variety of trivalent cations. Their samples doped with Lu, Tm, Dy, Gd, Sm, In, Ga, Fe, Mn, Cr and Al all show relatively intense bands at ∼ 3405, 3448 and 3483 cm−1. Several of the Berry et al. (2007) samples show additional bands: In- and Ga-doped (3419, 3430 cm−1), Fe-doped (3458, 3500, 3508 cm−1), Mn-doped (3418, 3434, 3502 cm−1), and Cr-doped (3417, 3469, 3478, 3490, 3518, 3522 cm−1). Along with the explicitly doped element, several of the Berry et al. (2007) samples contained several wt ppm of Fe. None contained > 1 wt ppm Al as a contaminant. Tollan et al. (2017) presented polarised spectra containing bands at 3405, 3448 and 3485 cm−1 following synthesis of Sc-doped forsterite at high aH2O (0.5). These bands showed the greatest absorbance with , and they were not clearly visible in undoped or Ti-doped forsterite synthesised from the same silica and magnesia sources. The intensity of these bands in Tollan et al. (2017) is highly sensitive to aH2O, suggesting a defect that contains multiple hydrogen ions. Lemaire et al. (2004) observed similar bands (3405, 3441, 3448, 3468, 3478 and 3484 cm−1), again most intense with , in nominally pure synthetic forsterite, with an inverse relationship between their intensity and silica activity, as with our data (Fig. 6). The wavenumbers from the FTIR spectra of Lemaire et al. (2004) were extracted from their Fig. 3 using ImageJ (Schindelin et al., 2015).
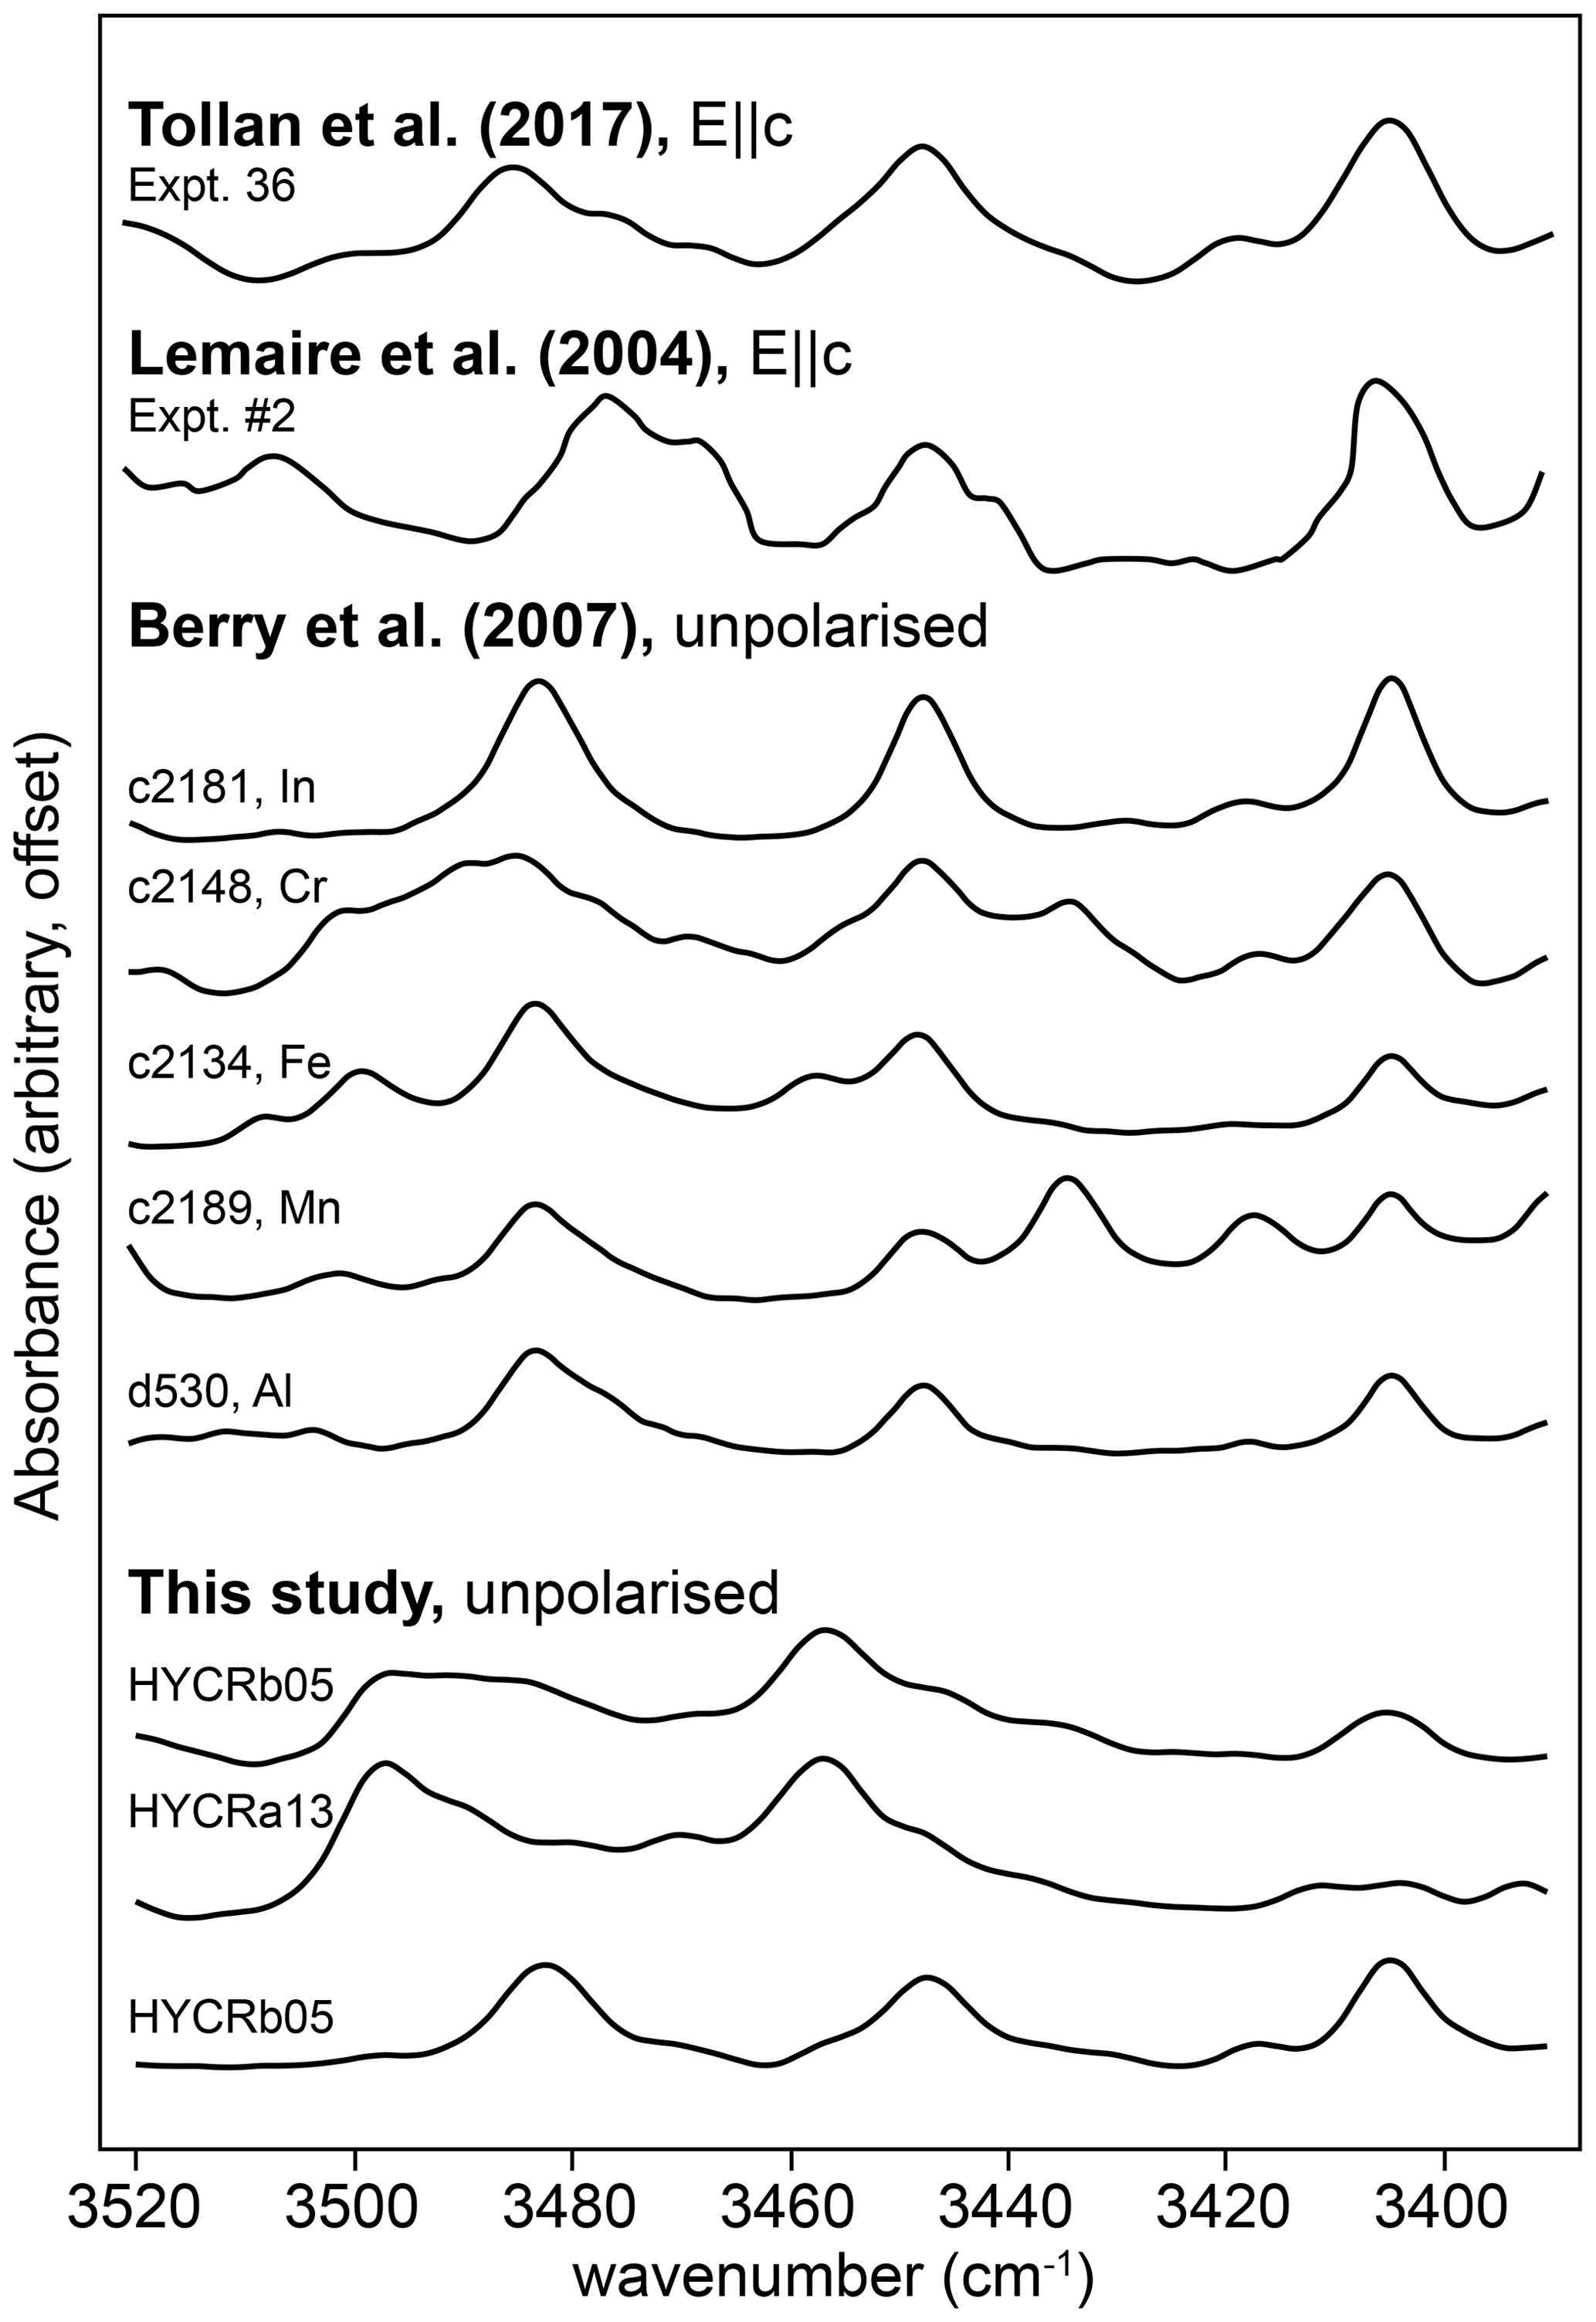
Figure 13The 3390–3520 cm−1 region of the FTIR spectra from three interface measurements, along with the same region from several published spectra. See Fig. 6 of Tollan et al. (2017), Fig. 4 of Berry et al. (2007) and Fig. 3 of Lemaire et al. (2004) for the original spectra.
Taking these observations all together, there are very few feasible defects that can be invoked for these bands – the defect is likely to involve trivalent cations and the Si site, in order to have the observed negative dependence on aSiO2. The former assumes that some ppm level of contamination was present in the Lemaire et al. (2004) samples but not in the undoped Tollan et al. (2017) samples.
Firstly, we suggest that H+ and a trivalent cation (generically, R3+) could replace Si4+.
This is considered highly unlikely for Cr3+ given its extreme octahedral site preference (Papike et al., 2005), but the Fe3+ and Al3+ equivalents and are more reasonable. If these were to form from a Tschermaks defect, which should be the stable Al substitution mechanism (Bussweiler et al., 2017; Coogan et al., 2014; De Hoog et al., 2010; Zhukova et al., 2017), there should be a positive relationship between its concentration and aSiO2, or, if it forms from a defect where R3+ is octahedrally coordinated, balanced by an octahedral site vacancy, the opposite dependence should be observed. Alternatively, 3H+ and a trivalent cation could replace Si4+ and Mg2+.
The concentration of this defect should be inversely proportional to aSiO2, if it forms from , or independent of aSiO2 if forming from a Tschermaks defect. Therefore, depending on the nature of the R3+ in the starting material, the concentrations of both and can be either proportional to, inversely proportional to, or independent of aSiO2. We might then suggest that the reason for the number and complex behaviour of these o-band peaks relates to the large number of potential configurations – the 3400–3510 cm−1 region in our samples could contain peaks associated with, for example, but not limited to, , and . Whilst this explanation is broadly consistent with our results and those of Berry et al. (2007), Tollan et al. (2017), and Lemaire et al. (2004), these assignments are not consistent with ab initio calculations (Blanchard et al., 2017).
The final bands are those that show M-shaped profiles on rim-to-rim profiles from low-T samples (the “m-bands”). Absorbance increases from the rim inwards and then decreases again towards the core. These peaks are generally associated with the highest apparent diffusivities, which are generally ∼ 0.1–0.2 orders of magnitude higher than those associated with any other peak. Because these bands are generally absent at the interface, it is not possible to use the effects of P, T, aSiO2 or fO2 on their concentration to assist in identifying them. All that we can state about these bands is that the defect with which they are associated must be relatively unstable compared to the other defects, and thus it is annihilated as the main wave of H+ moves into the crystal.
4.2 Comparison with previous diffusion coefficients
There exist three other determinations of H diffusion in pure forsterite associated with the M-vacancy diffusion mechanism, wherein H is associated with M site vacancies. These are (1) Demouchy and Mackwell (2003), wherein “pure” forsterite was hydroxylated at 900–1110 ∘C and 0.2–1.5 GPa; (2) Padrón-Navarta et al. (2014), who synthesised pure or Ti-doped forsterite and then dehydroxylated it in air at 800–1000 ∘C, and Jollands et al. (2016b), who doped pure forsterite with Ti3+ and Ti4+ at 1500 ∘C and then hydroxylated the crystals at 650–1000 ∘C and 1.5–2.5 GPa. Demouchy and Mackwell (2003) and Jollands et al. (2016b) provide diffusivities parallel to the main crystallographic axes, and Padrón-Navarta et al. (2014) quote bulk/average diffusivities, which can be broadly considered to be between and if . The diffusivities are shown along with experimentally determined H diffusivities for other proposed diffusion mechanisms in Fig. 12b.
The results from this study overlap with the of Jollands et al. (2016b), which is unsurprising given that the experimental and analytical approaches were almost identical. This suggests either that the presence of Ti in the previous study did not affect , or that Ti and Cr have the same effect on . The s in this study are higher by around half an order of magnitude than of Demouchy and Mackwell (2003) and an order of magnitude greater than the bulk diffusion coefficients from Padrón-Navarta et al. (2014). Our diffusivities also overlap with those of Demouchy and Mackwell (2006) determined using Fe-bearing olivine rather than pure forsterite.
4.3 Constraints on absorption coefficients, and the CrCr ratio of the starting material
The Beer–Lambert law states that the total integrated absorbance (A) of a band associated with OH in a FTIR spectrum is proportional to the concentration of water () and the path length (sample thickness, d), with the proportionality described by an absorption coefficient, ε (L mol−1 cm−2):
In our case, A is derived from unpolarised measurements acquired from the (010) plane and then converted to total absorbance, as described above. A density of 3.225 g cm−3 was used for pure forsterite (Fisher and Medaris, 1969).
Considerable discrepancies between different experimental and theoretical calibrations of these absorption coefficients have been, and remain, a major barrier to accurate quantification of the water content of olivine, and the nominally anhydrous minerals in general. For olivine we have several options when converting absorbance to water concentration. Bell et al. (2003) and Withers et al. (2012) each provide a single absorption coefficient, of 28 450 and 45 200 L mol−1 cm−2, respectively, which is a very large disagreement if they refer to the same O–H substitution. Libowitzky and Rossman (1997) suggest absorption coefficients are wavenumber-dependent, in line with Paterson (1982). Conversely, Kovács et al. (2010) found that different defects can have different absorption coefficients, even if their bands occur at almost identical wavenumbers. Furthermore, because Withers et al. (2012) synthesised olivine containing only defects in the ∼ 3500–3600 cm−1 range ( defects, according to the discussion above), it may also be reasonable to adjust the intercept of the Libowitzky and Rossman (1997) relationship, which was determined primarily using hydrous phases, to fit the Withers et al. (2012) data. Likewise, as Bell et al. (2003) determined their absorption coefficients using three olivine crystals with mostly defects (note the ∼ 3525 and 3572 cm−1 doublet in their Fig. 4), and as their absorption coefficient agreed nearly perfectly with that for this defect from Kovács et al. (2010), it might also be reasonable to pin the Libowitzky and Rossman (1997) relationship with 28 450 L mol−1 cm−2 at 3550 cm−1 – this was used by Jollands et al. (2016b). The absorption coefficients are given in Table 3 and the differences between calibrations shown in Fig. 14a.
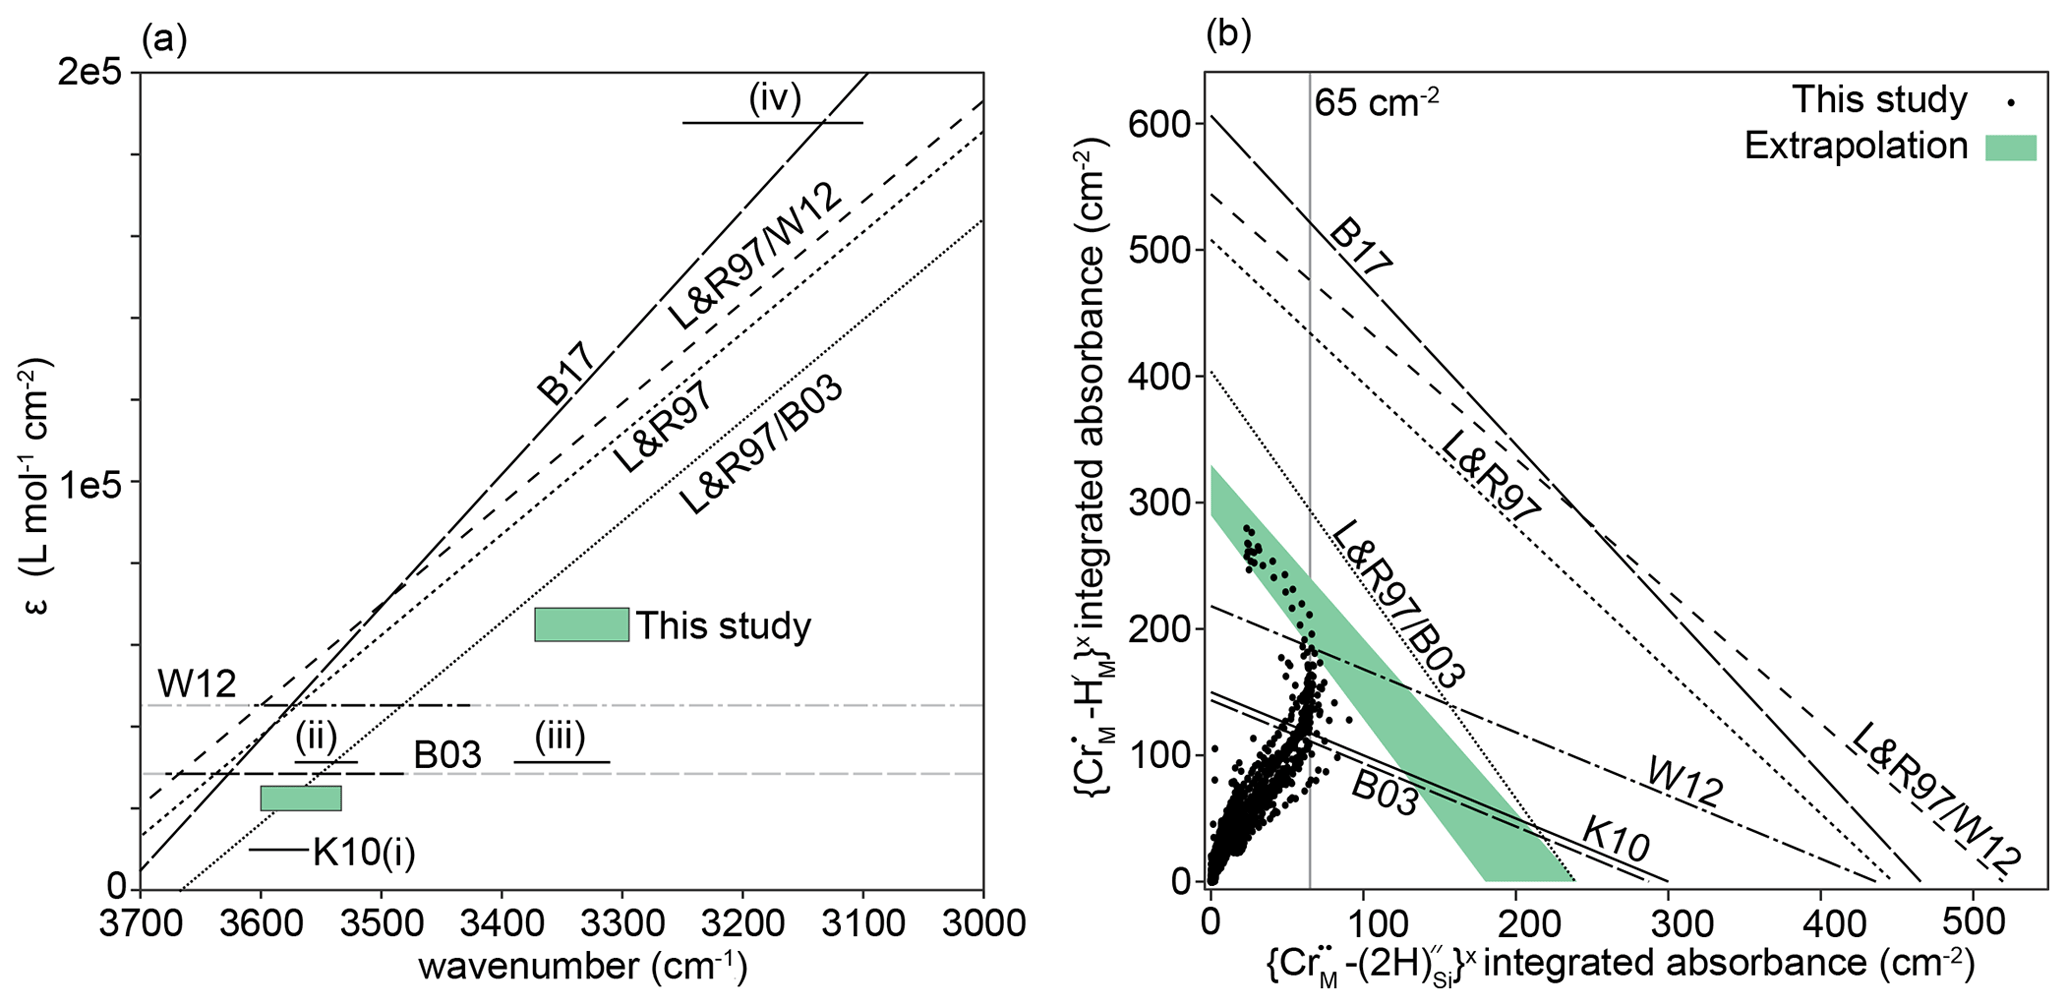
Figure 14(a) Published absorption coefficients. K10 (solid lines, i–iv) are from Kovács et al. (2010), for defects: (i) , (ii) , (iii) , (iv) . B03 is the wavenumber-independent absorption coefficient from Bell et al. (2003), and W12 is the same from Withers et al. (2012). The black sections of these lines represent the wavenumbers of bands in their analysed samples; grey sections are extrapolations. L&R97 is the wavenumber-dependent relationship from Libowitzky and Rossman (1997), L&R97/W12 is the L&R97 relationship pinned to the W12 data at 3600 cm−1, and L&R97/B03 is the L&R97 relationship pinned to the B03 data at 3550 cm−1. B17 is the wavenumber-dependent relationship from Blanchard et al. (2017). The green boxes represent absorption coefficients extracted from our data – the lower left box is for , the upper right box for . (b) The integrated total absorbance for versus that for , from this study (points) and using the absorption coefficients in Table 3, assuming 27.7 wt ppm H2O associated with and 55.4 wt ppm H2O associated with , joined by straight lines (see text for details). The green band represents our best estimation of an extrapolation of the upper limb of the boomerang-shaped trend to the axes.
Data from this study can be used to place some additional constraints on absorption coefficients. The total Cr content of the starting material used in the experiments is known (160 wt ppm). Following experiments, this Cr will be a mixture of Cr3+ and Cr4+, with, potentially, some Cr2+ in the high-T samples. In a (hypothetical) fully hydroxylated sample with only Cr3+, the absorbance associated with should be equivalent to 27.7 wt ppm H2O, noting that contains one H, whereas H2O contains two. Similarly, a fully hydroxylated sample with only Cr4+ (as ) should contain 55.4 wt ppm H2O.
With these values, and published absorption coefficients (ε), Eq. (7) allows the absorbance (A) of and associated with fully hydroxylated samples where Cr is all Cr3+ and Cr4+, respectively, to be calculated. In a fully hydroxylated sample where Cr is a mixture of Cr3+ and Cr4+, the absorbance of and should fall on a straight line between the absorbance associated with the pure Cr3+ and Cr4+ end-members, in a plot of absorbance () against absorbance ().
Figure 14b shows the relationship of versus , based on the peak fitting procedure, for all recorded spectra. Our data define a boomerang-shaped trend. The lower limb represents the majority of spectra, which show partial hydroxylation, with the upper limb representing total or near-total hydroxylation. Of particular interest are the spectra showing near-total hydroxylation, most of which come from the two high-T experiments, as they can be used to constrain the absorption coefficients. The FTIR profiles of such samples are complex, showing both evidence of simple hydroxylation and changing Cr oxidation states. The interface between zones “1” and “2”, in both of the high-T samples, show approximately the same total integrated absorbance associated with (∼ 65 cm−2), suggesting that effectively all Cr4+ is . Furthermore, the absorbance at the interfaces of the 1000 and 950 ∘C low-T samples have similar values (see Fig. S10). At the interface between zones “2” and “3” of the 1300 ∘C sample, the absorbance appears to plateau (Fig. 8), suggesting near-total hydroxylation of Cr3+, before some Cr3+ is potentially reduced to Cr2+ in zone “3”.
Therefore, if the absorption coefficients are correct, we expect that the absorbance of and extracted from the spectra, should fall onto, the lines between the absorbances associated with the hypothetical pure Cr3+ and Cr4+ end-members, under the limiting assumption of total hydroxylation, or, more realistically, just below these lines if hydroxylation is incomplete or some Cr is Cr2+. This is not the case (Fig. 14b). The lines defined by the Bell et al. (2003), Withers et al. (2012) and Kovács et al. (2010) calibrations fall below our data spread, suggesting that these all overestimate the amount of water, i.e. ε is too low. The calibrations of Libowitzky and Rossmann (1997), Blanchard et al. (2017) and Libowitzky and Rossmann (1997) pinned to Withers et al. (2012) all appear to considerably underestimate the amount of water, i.e. they suggest that only half of the Cr is hydroxylated, which is not consistent with our observations. The Libowitzky and Rossmann (1997) curve pinned to Bell et al. (2003) shows the closest agreement with our data.
We can also use our data to determine approximate absorption coefficients for the and defects, by extrapolating the upper limb of the boomerang-shaped correlation in Fig. 14b to the axes. This was done visually, shown by the shaded region in Fig. 14b. From the intercepts, we propose that ε for is between 60 200 and 68 200 L mol−1 cm−1 and between 18 700 and 24 900 L mol−1 cm−1 for , and these ranges are plotted in Fig. 14a. The results support either a wavenumber-dependent or defect-specific calibration, albeit at lower ε values than the previous determinations (Blanchard et al., 2017; Libowitzky and Rossmann, 1997). The boomerang-shaped trend in Fig. 14b, and the near constancy of the absorbance associated with between zones “1” and “2” in different samples are compelling evidence for complete, or near-complete hydroxylation of Cr. However, if this assumption were to be incorrect, then the H2O content would be lower and ε higher. At the very least, these values are minima for the absorption coefficient. We note that we are able to propose absorption coefficients using our dataset only because we (1) have LA-ICP-MS data to compare to our FTIR spectra; (2) have a homogeneous starting material; (3) pass all spectra through a peak fitting routine to remove interferences from overlapping peaks; (4) have developed relationships to determine total absorbance from absorbance measured on the (010) plane with unpolarised light and (5) have experiments at a variety of P–T–aSiO2 conditions, enabling peaks to be assigned to previously unidentified defects.
With these constraints, we can speculate as to the CrCr content of the starting material. It was noted above that the samples from 950, 1000, 1200 and 1300 ∘C experiments all showed the same maximum absorbance associated with of around 65 cm−2. If we take this value and apply ε of 18 700 and 24 900 L mol−1 cm−1, we obtain H2O contents of between 14.6 and 19.5 wt ppm H2O, i.e. 1.62 to 2.16 wt ppm H. This is equivalent to 42.2–56.2 wt ppm Cr4+, thus suggesting CrCr for the starting material of 0.65–0.74. Such hydroxylation experiments may therefore provide an independent method to determine CrCr in lasing forsterite.
4.4 Defect formation by inter-site reaction
There are three possible pathways for H chemical diffusion in olivine (not including H self-diffusion as inferred from 1H–2H exchange): these are (1) the proton–polaron exchange, (2) diffusion of hydrogen associated with the exchange of metal vacancies for divalent cations on the M sites () and (3) as (2) with silicon vacancies (). The proton–polaron mechanism invokes the exchange of protons for polarons (electron holes). In natural olivine, this means that a proton hop is accompanied by the reduction of Fe3+ to Fe2+ adjacent to the new location of the H+ and oxidation of Fe2+ to Fe3+ adjacent to its old location.
If a defect cannot form directly from diffusion associated with one of these pathways, over a reasonable timescale, then it must form by inter-site reaction or defect rearrangement (see, for example, Jollands et al., 2016b, Tollan et al., 2018, and Ferriss et al., 2018). At the temperature–time conditions of our low-T experiments, the only viable diffusion mechanism that could be observed by transmission FTIR spectroscopy is that associated with M-site vacancies. Our system is Fe-free, so the proton–polaron mechanism cannot be invoked. Likewise, the Cr equivalent of the proton–polaron mechanism, whereby proton hopping would be accompanied by Cr3+ reduction seems unlikely, given the low Cr contents and thus dilute distribution of Cr3+. At the other extreme, the Si-vacancy mechanism is so slow (Padrón-Navarta et al., 2014) that any profiles would be immeasurably short, at least in our experiments.
If the M-vacancy pathway is the only viable diffusion mechanism, then if we assume simple diffusive behaviour, the only defects that should show diffusion profiles are the hydroxylated M-vacancies (), i.e. the low broad bands at 3160 cm−1. However, we also observe bands associated with trivalent Cr (), Si vacancies (), a potential defect, and other unidentified defects. In a previous study, Jollands et al. (2016b) proposed that a similar trivalent defect () could also form diffusion profiles by H hopping between and defects (see their Eq. 8). In fact, this was unlikely in these previous experiments. The crystals had ∼ 300–400 wt ppm Ti, of which the majority was assumed to be Ti3+. Even if all Ti were Ti3+, and this Ti were completely evenly distributed, then there would only have been one Ti3+ per ∼ 250 unit cells, i.e., around 6 unit cells between each Ti in each direction. Because diffusivity is proportional to jump distance, even if H could hop directly between Ti3+ ions, there is low probability that this mechanism would show the same diffusivity as the defect, which is likely to move by short range exchange. Such a mechanism is similarly unlikely in our experiments, based on the Cr content, which is even lower than the Ti content in the Jollands et al. (2016b) samples.
Instead, we suggest that these defects can form by a combination of diffusion and inter-site reaction, where all diffusion is associated with .
Assuming that the starting material contains both octahedrally coordinated Cr3+ and tetrahedrally coordinated Cr4+, then the defect can form, when free phases such as H2O, MgO and SiO2 cannot be invoked (i.e. inside the crystal), from the dry Cr3+ defect and a fully hydroxylated M-site vacancy:
This is equivalent to Eq. (8) of Tollan et al. (2018) and Eq. (9) of Jollands et al. (2016b). The defect can, likewise, form by a reaction between the dry Cr4+ defect and a hydroxylated M vacancy:
This is equivalent to Eq. (9) of Tollan et al. (2018) and Eq. (11) of Jollands et al. (2016b). The formation of the defects is less clear-cut. One possibility is that it occurs by interaction between and :
Otherwise, its formation could be associated with the non-negligible Al content or some intrinsic defect, e.g. Eq. (11) from Tollan et al. (2018):
If the O-band defects are , then these can also form by interaction between and pre-existing Tschermak defects:
Equation (12) can also occur in two steps, where forms as an intermediate product:
Then
In Eq. (8), Cr3+ remains stationary, as does the generic R3+ in Eqs. (12), (13) and (14). In Eq. (10), Cr4+ moves from one site to another, but only needs to hop once. Therefore, these defects, and potentially the defect as well, can form by interaction of the defects already present in the crystal with . There only needs to be a single diffusion pathway, involving the exchange of with , to form a multitude of defects in these experiments. Note especially that none of the above reactions lead to a change in the valence state of Cr, but do change the coordination environment of Cr4+. Also, we reemphasise that this discussion does not imply that other pathways do not exist – the exchange of with has been observed by Padrón-Navarta et al. (2014), for example, but the associated diffusivity is so low (> 4 order of magnitude lower than the s measured in this study) that no profile should form over the duration of our experiments.
4.5 Preserving metastable point defects and behaviour at the near-interface region
A major advantage of our analytical approach is that we are able to observe behaviour occurring on two spatial scales. FTIR spectroscopy allows the determination of profiles of the order of hundreds of µm, but it cannot image the area close to the crystal interface because the minimum beam width is > 10 µm (see above). Instead, in this region the behaviour of Cr can be imaged by XANES spectroscopy. Additionally, in the high-T samples the near-interface region is stretched in length, allowing information to be gleaned by FTIR. These samples were prepared after the XANES session, so XANES spectra are not available.
The inference from previous work on Cr oxidation states in olivine (e.g. Mallmann and O'Neill 2009) indicates that Cr4+ should not be a stable valence state at any of the experimental conditions, perhaps excluding the highest fO2 experiment (Ag–Ag2O buffer). Yet the evidence shows that Cr4+ is preserved, forming a defect, rather than being instantly reduced to Cr3+ or Cr2+. Moreover, there is no effect of the experimental fO2 on either the FTIR spectra acquired closest to the interface (Fig. 6), or the extracted diffusivities (Table 1). This shows that H diffusion occurs more rapidly than redox changes are transmitted into the crystal, and thus Cr4+ is metastably preserved far outside of its normal stability range. This inference is also supported by the lack of correlation between the interface defect and fO2. If the external fO2 is rapidly communicated into the crystal, then the concentration of should decrease with fO2 as Cr3+ reduces to Cr2+. A similar observation was reported by Jollands et al. (2016b), where Ti3+ remained following hydroxylation experiments buffered by Ag–Ag2O. As we discussed above, this is reasonable if we assume that the mobile species is , since there is no obvious mechanism by which can reduce or oxidise Cr2+, Cr3+ or Cr4+ within the crystal whilst maintaining site, charge and mass balance. In pure forsterite, there is also no obvious interface reaction by which the fO2 can appreciably change the concentration of , from which the other defects should form. In contrast, the externally buffered aSiO2, as well as the experimental T and P, appear to be communicated into the crystal at the same rate as H diffusion. This is shown by the correlations between aSiO2, T, P and defect-specific integrated absorbance (Fig. 6). The formation of at the interface involves extraction of Mg from its usual site and thus must be aSiO2-dependent.
This reaction should also be temperature-dependent, as well as dependent on fH2O and hence pressure. If the interface concentration of is altered, this should in turn change the concentration of the other defects via Eqs. (9)–(14). Note that Eq. (15) implies no dependence on fO2, in accordance with observation.
This lack of fO2 dependence suggests that no proton–polaron type diffusion pathway is available. If such a pathway were active, we should expect the external fO2 to be rapidly communicated into the crystal. At the interface, a potential reaction reducing Cr3+ to Cr2+ without any mass transfer except that of H+ is the following.
Once formed, the protons should be capable of rapidly diffusing into the crystal, reducing Cr3+ to Cr2+. This would be clear from the edge position of the XANES spectra, which would be correlated with the experimental fO2 in zone 2 (Figs. 10, S11), which it is not. Therefore, it appears that the extent of the proton–polaron mechanism was negligible in our experiments. However, this should not be taken to suggest that such a mechanism cannot exist in other systems. In these experiments, the Cr content, i.e. the species that can reduce or oxidise, is far lower than the Fe content of natural olivine. As described above, the spacing between Cr ions and their nearest neighbours is considerable, so they can probably be considered disconnected. This is not the case for Fe in natural olivine.
The previous discussion considers the behaviour at the near interface of the low-T samples, as imaged by FTIR spectroscopy. Profiles obtained from XANES spectra show different behaviour given the higher spatial resolution of the technique – there is an increase in the proportion of end-member 1 in the near-interface region (zone “2” in Fig. 10), the whole extent of which falls below the effective spatial resolution of FTIR spectroscopy. This end-member is characterised by the absence of a pre-edge feature and a shift of the absorption edge to lower energy, implying a reduction in the mean valence of Cr. In contrast to the FTIR data, the interface XANES spectra show a clear fO2 dependence (Fig. 6). Several possible reactions can be constructed to describe this behaviour. For example, at the interface, Cr4+ can reduce to Cr3+, here using the wet end-members.
FTIR spectra from the high-T samples (zone “2”, Fig. 8) show an increase in absorbance towards the interface associated with , and , apparently at the expense of , which decreases. This suggests that a possible alternative to Eq. (17) could be the following.
Furthermore, a reaction forming Cr2+, i.e. , at the expense of may be possible. In the 1300 ∘C sample, the content decreases slightly in the region within ∼ 50 µm of the interface, resulting in M-shaped profiles (zone “3” in Fig. 8). If we assume that dehydroxylation of to is unlikely at the experimental conditions, which were water-saturated, such that fH2O remained high throughout, then an explanation for the decrease could be reduction of Cr3+ to Cr2+.
These are not equivalent to Eq. (16), in that they require transfer of Mg, whereas the former only involved transfer of H. Such reactions could explain the relationship between the proportion of end-member 1 (from XANES spectra) on fO2, and the FTIR interface spectra of samples from the high-T experiments. Evidence for a mechanism allowing the Cr valence state change to propagate into the crystal comes from the high-T FTIR interface spectra over a length scale tens of µm from the crystal interface, but also from the XANES interface spectra that were recorded ∼ 5 µm away. However, it remains unresolved what this mechanism is.
Regardless of this major issue, the important observation is that we observe at least two, and possibly three, different types of behaviour. FTIR spectra from the low temperature samples show only the mechanism with the highest diffusivity, which is interpreted to represent simple exchange, and associated rearrangement to form other defects, but without any oxidation or reduction of Cr. Then, a mechanism associated with slower diffusion, observed in the near-interface XANES spectra of the low-T samples, and the FTIR spectra of the high-T samples, appears to be associated with reduction of Cr.
An extension of this observation is that the interface concentrations determined by FTIR, at least in the low temperature samples, are far from equilibrium. Such experiments as these cannot, therefore, be used to assess equilibrium partitioning behaviour. This is likely to be the reason why the slopes in the absorbance versus pressure plot (Fig. 6) are parallel, where the slope should be considerably steeper than (Tollan et al., 2017). Care must be taken when interpreting data from hydroxylation experiments in the framework of equilibrium partitioning.
This study has demonstrated, for the first time, that XANES and FTIR spectroscopy can be used as complementary techniques for studying H diffusion in nominally anhydrous minerals. The FTIR spectra show how H substitutes into a crystal during diffusion, while XANES spectra show what this does to the species that are already in the crystal. The techniques have different spatial resolutions, such that XANES spectroscopy can be used to analyse near-interface regions of crystals that are too small for transmission FTIR spectroscopy to provide meaningful information.
From this study, we can conclude the following.
-
The measured diffusivity of H in Cr-doped forsterite containing Cr4+ is similar to that in Ti-doped forsterite.
-
The addition of H causes a change in the coordination environment of Cr4+ from tetrahedral to octahedral, forming a Cr analogue of the so-called “Ti-clinohumite” point defect.
-
Hydrogen diffusion in forsterite at the previously determined M-site diffusivity (Demouchy and Mackwell, 2003; Jollands et al., 2016b; Padrón-Navarta et al., 2014) is not associated with reduction or oxidation of Cr. Instead, reduction or oxidation is associated with a slower diffusivity than that associated with H on M-sites.
-
A single absorption coefficient cannot be used for the whole OH stretching region of olivine.
-
All hydrous defects observed in this study can potentially form by interaction between fully hydroxylated M-site vacancies and pre-existing dry defects, and thus only one diffusion pathway is necessary.
-
The FTIR absorption coefficients for are between 60 200 and 68 200 L mol−1 cm−1, and that for is between 18 700 and 24 900 L mol−1 cm−1.
-
Hydroxylation coupled to FTIR spectroscopy could provide an independent method to EPR and XANES spectroscopy for quantifying Cr3+ and Cr4+ contents of Cr-doped forsterite grown for lasing purposes.
All XANES and FTIR spectra are available in the Supplement.
The supplement related to this article is available online at: https://doi.org/10.5194/ejm-33-113-2021-supplement.
Study conceptualisation was by MCJ and HO. Experiments (design and execution) and analyses (FTIR and LA-ICP-MS) were performed by MCJ. XANES analyses were performed by MCJ, AJB, HO, and CR. Extraction of end-member spectra was done by CLL. Interpretation of results and manuscript preparation were done by all the authors.
The authors declare that they have no conflict of interest.
This article is part of the special issue “Probing the Earth: experiments and mineral physics at mantle depths”. It is not associated with a conference.
We thank Dave Clark and Dean Scott for experimental assistance at the Australian National University and Pete Tollan for providing published spectra. Anne Peslier and an anonymous reviewer are acknowledged for providing comments that improved the quality of the manuscript.
Michael C. Jollands acknowledges an International Postgraduate Research Fellowship from the Australian Government and a Swiss National Science Foundation Postdoc Mobility Fellowship (P400P2_183872). We acknowledge travel funding provided by the International Synchrotron Access Program (ISAP) managed by the Australian Synchrotron, part of ANSTO, and funded by the Australian Government. Charles Le Losq acknowledges funding from the Chaire d'Excellence IdEX Université de Paris, ANR-18-IDEX-0001.
This paper was edited by Didier Laporte and reviewed by Anne Peslier and one anonymous referee.
Asimow, P. D., Stein, L. C., Mosenfelder, J. L., and Rossman, G. R.: Quantitative polarized infrared analysis of trace OH in populations of randomly oriented mineral grains, Am. Mineral., 91, 278–284, https://doi.org/10.2138/am.2006.1937, 2006.
Assal, J., Hallstedt, B., and Gauckler, L. J.: Thermodynamic assessment of the silver-oxygen system, J. Am. Ceram. Soc., 80, 3054–3060, https://doi.org/10.1111/j.1151-2916.1997.tb03232.x, 1997.
Bai, Q. and Kohlstedt, D. L.: Effects of chemical environment on the solubility and incorporation mechanism for hydrogen in olivine, Phys. Chem. Miner., 19, 460–471, https://doi.org/10.1007/BF00203186, 1993.
Balan, E., Ingrin, J., Delattre, S., Kovács, I., and Blanchard, M.: Theoretical infrared spectrum of OH-defects in forsterite, Eur. J. Mineral., 23, 285–292, https://doi.org/10.1127/0935-1221/2011/0023-2090, 2011.
Barth, A., Newcombe, M., Plank, T., Gonnermann, H., Hajimirza, S., Soto, G. J., Saballos, A., and Hauri, E.: Magma decompression rate correlates with explosivity at basaltic volcanoes – Constraints from water diffusion in olivine, J. Volcanol. Geoth. Res., 387, 106664, https://doi.org/10.1016/j.jvolgeores.2019.106664, 2019.
Bell, A. S., Burger, P. V., Le, L., Shearer, C. K., Papike, J. J., Sutton, S. R., Newville, M., and Jones, J.: XANES measurements of Cr valence in olivine and their applications to planetary basalts, Am. Mineral., 99, 1404–1412, https://doi.org/10.2138/am.2014.4646, 2014.
Bell, D. R., Rossman, G. R., Maldener, J., Endisch, D., and Rauch, F.: Hydroxide in olivine: a quantitative determination of the absolute amount and calibration of the IR spectrum, J. Geophys. Res.-Sol. Ea., 108, 2105, https://doi.org/10.1029/2001JB000679, 2003.
Berry, A. J. and O'Neill, H. S. C.: A XANES determination of the oxidation state of chromium in silicate glasses, Am. Mineral., 89, 790–798, https://doi.org/10.2138/am-2004-5-613, 2004.
Berry, A. J., Hermann, J., O'Neill, H. S. C., and Foran, G. J.: Fingerprinting the water site in mantle olivine, Geology, 33, 869–872, https://doi.org/10.1130/G21759.1, 2005.
Berry, A. J., O'Neill, H. S. C., Scott, D. R., Foran, G. J., and Shelley, J. M. G.: The effect of composition on Cr2+/Cr3+ in silicate melts, Am. Mineral., 91, 1901–1908, https://doi.org/10.2138/Am.2006.2097, 2006.
Berry, A. J., O'Neill, H. S. C., Hermann, J., and Scott, D. R.: The infrared signature of water associated with trivalent cations in olivine, Earth Planet. Sc. Lett., 261, 134–142, https://doi.org/10.1016/J.Epsl.2007.06.021, 2007.
Blanchard, M., Ingrin, J., Balan, E., Kovács, I., and Withers, A. C.: Effect of iron and trivalent cations on OH defects in olivine, Am. Mineral., 102, 302–311, https://doi.org/10.2138/am-2017-5777, 2017.
Bussweiler, Y., Brey, G., Pearson, D., Stachel, T., Stern, R., Hardman, M., Kjarsgaard, B., and Jackson, S.: The aluminum-in-olivine thermometer for mantle peridotites – Experimental versus empirical calibration and potential applications, Lithos, 272, 301–314, https://doi.org/10.1016/j.lithos.2016.12.015, 2017.
Camp, C. H.: pyMCR: A Python Library for MultivariateCurve Resolution Analysis with Alternating Regression (MCR-AR), J. Res. Natl. Inst. Stan., 124, 1–10, https://doi.org/10.6028/jres.124.018, 2019.
Carslaw, H. S., and Jaeger, J. C.: Conduction of heat in solids, Oxford University Press, Oxford, UK, 1959.
Chen, W. and Boulon, G.: Growth mechanism of Cr: forsterite laser crystal with high Cr concentration, Opt. Mater., 24, 163–168, https://doi.org/10.1016/S0925-3467(03)00120-4, 2003.
Choudhury, N. and Chaplot, S. L.: Free energy and relative stability of the enstatite Mg2Si2O6 polymorphs, Solid State Commun., 114, 127–132, https://doi.org/10.1016/S0038-1098(00)00027-2, 2000.
Connolly, J. and Cesare, B.: COHS fluid composition and oxygen fugacity in graphitic metapelites, J. Metamorph. Geol., 11, 379–388, https://doi.org/10.1111/j.1525-1314.1993.tb00155.x, 1993.
Coogan, L. A., Saunders, A. D., and Wilson, R. N.: Aluminum-in-olivine thermometry of primitive basalts: Evidence of an anomalously hot mantle source for large igneous provinces, Chem. Geol., 368, 1–10, https://doi.org/10.1016/j.chemgeo.2014.01.004, 2014.
Cotte, M., Pouyet, E., Salomé, M., Rivard, C., De Nolf, W., Castillo-Michel, H., Fabris, T., Monico, L., Janssens, K., and Wang, T.: The ID21 X-ray and infrared microscopy beamline at the ESRF: status and recent applications to artistic materials, J. Anal. Atom. Spectrom., 32, 477–493, https://doi.org/10.1039/C6JA00356G, 2017.
Crank, J.: The Mathematics of Diffusion, 2nd Edn., Oxford University Press, Oxford, UK, 1975.
De Hoog, J. C., Gall, L., and Cornell, D. H.: Trace-element geochemistry of mantle olivine and application to mantle petrogenesis and geothermobarometry, Chem. Geol., 270, 196–215, https://doi.org/10.1016/j.chemgeo.2009.11.017, 2010.
Demouchy, S. and Mackwell, S.: Water diffusion in synthetic iron-free forsterite, Phys. Chem. Miner., 30, 486–494, https://doi.org/10.1007/s00269-003-0342-2, 2003.
Demouchy, S. and Mackwell, S.: Mechanisms of hydrogen incorporation and diffusion in iron-bearing olivine, Phys. Chem. Miner., 33, 347–355, https://doi.org/10.1007/s00269-006-0081-2, 2006.
Dudnikova, V. B., Gaister, A. V., Zharikov, E. V., Senin, V. G., and Urusov, V. S.: Chromium distribution between forsterite and its melt: Dependence on Chromium content in melt and redox conditions, Geokhimiya, 43, 519–526, 2005.
Dudnikova, V. B., Zharikov, E. V., and Urusov, V. S.: Concentration of Cr4+ impurity ions and color centers as an indicator of saturation of forsterite crystals Mg2SiO4 with oxygen, Phys. Solid State, 52, 1865–1873, https://doi.org/10.1134/S1063783410090131, 2010.
Du Frane, W. L. and Tyburczy, J. A.: Deuterium-hydrogen exchange in olivine: Implications for point defects and electrical conductivity, Geochem. Geophy. Geosy., 13, Q03004, https://doi.org/10.1029/2011GC003895, 2012.
Ferriss, E., Plank, T., and Walker, D.: Site-specific hydrogen diffusion rates during clinopyroxene dehydration, Contrib. Mineral. Petr., 171, 1–24, 2016.
Ferriss, E., Plank, T., Newcombe, M., Walker, D., and Hauri, E.: Rates of dehydration of olivines from San Carlos and Kilauea Iki, Geochim. Cosmochim. Ac., 242, 165–190, https://doi.org/10.1016/j.gca.2018.08.050, 2018.
Fisher, G. W. and Medaris Jr., L. G.: Cell dimensions and X-ray determinative curve for synthetic Mg-Fe olivines, Am. Mineral., 54, 741–753, 1969.
Ganguly, J., Bhattacharya, R., and Chakraborty, S.: Convolution effect in the determination of compositional profiles and diffusion coefficients by microprobe step scans, Am. Mineral., 73, 901–909, 1988.
Hack, A. C. and Mavrogenes, J. A.: A cold-sealing capsule design for synthesis of fluid inclusions and other hydrothermal experiments in a piston-cylinder apparatus, Am. Mineral., 91, 203–210, https://doi.org/10.2138/Am.2006.1898, 2006.
Hemingway, B. S.: Thermodynamic Properties for Bunsenite, Nio, Magnetite, Fe3O4, and Hematite, Fe2O3, with Comments on Selected Oxygen Buffer Reactions, Am. Mineral., 75, 781–790, 1990.
Hoffman, K. R., Casas-Gonzalez, J., Jacobsen, S. M., and Yen, W. M.: Electron-paramagnetic-resonance and fluorescence-line-narrowing measurements of the lasing center in Cr-doped forsterite, Phys. Rev. B, 44, 12589–12592, https://doi.org/10.1103/PhysRevB.44.12589, 1991.
Holland, T. J. B. and Powell, R.: An internally consistent thermodynamic data set for phases of petrological interest, J. Metamorph. Geol., 16, 309–343, https://doi.org/10.1111/j.1525-1314.1998.00140.x, 1998.
Jollands, M., O'Neill, H. S. C., Van Orman, J., Berry, A., Hermann, J., Newville, M., and Lanzirotti, A.: Substitution and diffusion of Cr2+ and Cr3+ in synthetic forsterite and natural olivine at 1200–1500 ∘C and 1 bar, Geochim. Cosmochim. Ac., 220, 407–428, https://doi.org/10.1016/j.gca.2017.09.030, 2018.
Jollands, M. C., O'Neill, H. S. C., and Hermann, J.: The importance of defining chemical potentials, substitution mechanisms and solubility in trace element diffusion studies: the case of Zr and Hf in olivine, Contrib. Mineral. Petr., 168, 1–19, https://doi.org/10.1007/s00410-014-1055-x, 2014.
Jollands, M. C., Hermann, J., O'Neill, H. S. C., Spandler, C., and Padrón-Navarta, J. A.: Diffusion of Ti and some Divalent Cations in Olivine as a Function of Temperature, Oxygen Fugacity, Chemical Potentials and Crystal Orientation, J. Petrol., 57, 1983–2010, https://doi.org/10.1093/petrology/egw067, 2016a.
Jollands, M. C., Padrón-Navarta, J. A., Hermann, J., and O'Neill, H. S. C.: Hydrogen diffusion in Ti-doped forsterite and the preservation of metastable point defects, Am. Mineral., 101, 1560–1570, https://doi.org/10.2138/am-2016-55681571, 2016b.
Jollands, M. C., Kempf, E., Hermann, J., and Müntener, O.: Coupled inter-site reaction and diffusion: Rapid dehydrogenation of silicon vacancies in natural olivine, Geochim. Cosmochim. Ac., 262, 220–242, https://doi.org/10.1016/j.gca.2019.07.025, 2019.
Kohlstedt, D. L., Keppler, H., and Rubie, D. C.: Solubility of water in the α, β and γ phases of (Mg,Fe)2SiO4, Contrib. Mineral. Petr., 123, 347–357, https://doi.org/10.1007/s004100050161, 1996.
Kohlstedt, D. L. and Mackwell, S. J.: Diffusion of hydrogen and intrinsic point defects in olivine, Z. Phys. Chem., 207, 147–162, https://doi.org/10.1524/zpch.1998.207.Part_1_2.147, 1998.
Kovács, I., O'Neill, H. S. C., Hermann, J., and Hauri, E. H.: Site-specific infrared O-H absorption coefficients for water substitution into olivine, Am. Mineral., 95, 292–299, https://doi.org/10.2138/am.2010.3313, 2010.
Kröger, F. A. and Vink, H. J.: Relations between the Concentrations of Imperfections in Crystalline Solids, in: Solid State Phys., 3, 307–435, https://doi.org/10.1016/S0081-1947(08)60135-6, 1956.
Le Losq, C., Berry, A. J., Kendrick, M. A., Neuville, D. R., and O'Neill, H. S. C.: Determination of the oxidation state of iron in Mid-Ocean Ridge basalt glasses by Raman spectroscopy, Am. Mineral., 104, 1032–1042, https://doi.org/10.2138/am-2019-6887, 2019a.
Le Losq, C., Jollands, M. C., Tollan, P. M. E., Hawkins, R., and O'Neill, H. S. C.: Point defect populations of forsterite revealed by two-stage metastable hydroxylation experiments, Contrib. Mineral. Petr., 174, 53, https://doi.org/10.1007/s00410-019-1590-6, 2019b.
Lemaire, C., Kohn, S., and Brooker, R.: The effect of silica activity on the incorporation mechanisms of water in synthetic forsterite: a polarised infrared spectroscopic study, Contrib. Mineral. Petr., 147, 48–57, https://doi.org/10.1007/s00410-003-0539-x, 2004.
Libowitzky, E. and Beran, A.: The structure of hydrous species in nominally anhydrous minerals: Information from polarized IR spectroscopy, Rev. Mineral. Geochem., 62, 29–52, https://doi.org/10.1515/9781501509476-006, 2006.
Libowitzky, E. and Rossman, G. R.: An IR absorption calibration for water in minerals, Am. Mineral., 82, 1111–1115, https://doi.org/10.2138/am-1997-11-1208, 1997.
Mackwell, S. J. and Kohlstedt, D. L.: Diffusion of hydrogen in olivine: Implications for water in the mantle, J. Geophys. Res.-Sol. Ea., 95, 5079–5088, https://doi.org/10.1029/JB095iB04p05079, 1990.
Mallmann, G. and O'Neill, H. S. C.: The Crystal/Melt Partitioning of V during Mantle Melting as a Function of Oxygen Fugacity Compared with some other Elements (Al, P, Ca, Sc, Ti, Cr, Fe, Ga, Y, Zr and Nb), J. Petrol., 50, 1765–1794, https://doi.org/10.1093/Petrology/Egp053, 2009.
Matveev, S., O'Neill, H. S. C., Ballhaus, C., Taylor, W. R., and Green, D.: Effect of silica activity on OH− IR spectra of olivine: implications for low-aSiO2 mantle metasomatism, J. Petrol., 42, 721–729, https://doi.org/10.1093/petrology/42.4.721, 2001.
Murphy, K. P.: Machine learning: a probabilistic perspective, MIT press, 2012.
Ni, H. and Zhang, Y.: H2O diffusion models in rhyolitic melt with new high pressure data, Chem. Geol., 250, 68–78, https://doi.org/10.1016/j.chemgeo.2008.02.011, 2008.
O'Neill, H. S. C. and Pownceby, M. I.: Thermodynamic Data from Redox Reactions at High-Temperatures, 1. An Experimental and Theoretical Assessment of the Electrochemical Method Using Stabilized Zirconia Electrolytes, with Revised Values for the Fe-FeO, Co-CoO, Ni-NiO and Cu-Cu2O Oxygen Buffers, and New Data for the W-WO2 Buffer, Contrib. Mineral. Petr., 114, 296–314, https://doi.org/10.1007/Bf01046533, 1993.
Padrón-Navara, J. A. and Hermann, J.: A Subsolidus Olivine Water Solubility Equation for the Earth's Upper Mantle, J. Geophys. Res. Sol.-Ea., 122, 9862–9880, 2017.
Padrón-Navarta, J. A., Hermann, J., and O'Neill, H. S. C.: Site-specific hydrogen diffusion rates in forsterite, Earth Planet Sc. Lett., 392, 100–112, https://doi.org/10.1016/j.epsl.2014.01.055, 2014.
Pantelouris, A., Modrow, H., Pantelouris, M., Hormes, J., and Reinen, D.: The influence of coordination geometry and valency on the K-edge absorption near edge spectra of selected chromium compounds, Chem. Phys., 300, 13–22, https://doi.org/10.1016/j.chemphys.2003.12.017, 2004.
Papike, J., Karner, J., and Shearer, C.: Comparative planetary mineralogy: Valence state partitioning of Cr, Fe, Ti, and V among crystallographic sites in olivine, pyroxene, and spinel from planetary basalts, Am. Mineral., 90, 277–290, https://doi.org/10.2138/am.2005.1779, 2005.
Paterson, M. S.: The determination of hydroxyl by infrared absorption in quartz, silicate glasses and similar materials, B. Mineral., 105, 20–29, 1982.
Pedregosa, F., Varoquaux, G., Gramfort, A., Michel, V., Thirion, B., Grisel, O., Blondel, M., Prettenhofer, P., Weiss, R., and Dubourg, V.: Scikit-learn: Machine learning in Python, J. Mach. Learn. Res., 12, 2825–2830, 2011.
Peslier, A. H., Bizimis, M., and Matney, M.: Water disequilibrium in olivines from Hawaiian peridotites: Recent metasomatism, H diffusion and magma ascent rates, Geochim. Cosmochim. Ac., 154, 98–117, https://doi.org/10.1016/j.gca.2015.01.030, 2015.
Petričević, V., Gayen, S. K., and Alfano, R. R.: Laser action in chromium-activated forsterite for near-infrared excitation: Is Cr4+ the lasing ion?, Appl. Phys. Lett., 53, 2590–2592, https://doi.org/10.1063/1.100536, 1988a.
Petričević, V., Gayen, S. K., Alfano, R. R., Yamagishi, K., Anzai, H., and Yamaguchi, Y.: Laser action in chromium-doped forsterite, Appl. Phys. Lett., 52, 1040–1042, https://doi.org/10.1063/1.99203, 1988b.
Pownceby, M. I. and O'Neill, H. S. C.: Thermodynamic Data from Redox Reactions at High-Temperatures, 4. Calibration of the Re-ReO2 Oxygen Buffer from EMF and NiO+Ni-Pd Redox Sensor Measurements, Contrib. Mineral. Petr., 118, 130–137, https://doi.org/10.1007/Bf01052864, 1994.
Rager, H., Taran, M., and Khomenko, V.: Polarized optical absorption spectra of synthetic chromium doped Mg2SiO4 (forsterite), Phys. Chem. Miner., 18, 37–39, https://doi.org/10.1007/BF00199041, 1991.
Rauch, M. and Keppler, H.: Water solubility in orthopyroxene, Contrib. Mineral. Petr., 143, 525–536, https://doi.org/10.1007/s00410-002-0365-6, 2002.
Ravel, B. and Newville, M.: ATHENA, ARTEMIS, HEPHAESTUS: data analysis for X-ray absorption spectroscopy using IFEFFIT, J. Synchrotron Radiat., 12, 537–541, https://doi.org/10.1107/S0909049505012719, 2005.
Reynes, J., Jollands, M., Hermann, J., and Ireland, T.: Experimental constraints on hydrogen diffusion in garnet, Contrib. Mineral. Petr., 173, 69, https://doi.org/10.1007/s00410-018-1492-z, 2018.
Schindelin, J., Rueden, C. T., Hiner, M. C., and Eliceiri, K. W.: The ImageJ ecosystem: An open platform for biomedical image analysis, Mol. Reprod. Dev., 82, 518–529, https://doi.org/10.1002/mrd.22489, 2015.
Schreiber, H. D. and Haskin, L. A.: Chromium in basalts: Experimental determination of redox states and partitioning among synthetic silicate phases, Lunar and Planetary Science Conference Proceedings, Houston, Texas, 15–19 March 1976, 1221–1259, 1976.
Shen, T., Hermann, J., Zhang, L., Padrón-Navarta, J. A., and Chen, J.: FTIR spectroscopy of Ti-chondrodite, Ti-clinohumite, and olivine in deeply subducted serpentinites and implications for the deep water cycle, Contrib. Mineral.Petr., 167, 1–15, https://doi.org/10.1007/s00410-014-0992-8, 2014.
Solé, V., Papillon, E., Cotte, M., Walter, P., and Susini, J.: A multiplatform code for the analysis of energy-dispersive X-ray fluorescence spectra, Spectrochim. Acta B, 62, 63–68, https://doi.org/10.1016/j.sab.2006.12.002, 2007.
Stalder, R. and Skogby, H.: Hydrogen diffusion in natural and synthetic orthopyroxene, Phys. Chem. Miner., 30, 12–19, https://doi.org/10.1007/s00269-002-0285-z, 2003.
Stalder, R., Purwin, H., and Skogby, H.: Influence of Fe on hydrogen diffusivity in orthopyroxene, Eur. J. Mineral., 19, 899–903, 2007.
Sundvall, R., Skogby, H., and Stalder, R.: Hydrogen diffusion in synthetic Fe-free diopside, Eur. J. Mineral., 21, 963–970, https://doi.org/10.1127/0935-1221/2007/0019-1780, 2009.
Sutton, S. R., Jones, K. W., Gordon, B., Rivers, M. L., Bajt, S., and Smith, J. V.: Reduced Chromium in Olivine Grains from Lunar Basalt 15555 – X-Ray Absorption near Edge Structure (XANES), Geochim. Cosmochim. Ac., 57, 461–468, https://doi.org/10.1016/0016-7037(93)90444-2, 1993.
Tollan, P. M. E., O'Neill, H. S. C., Hermann, J., Benedictus, A., and Arculus, R. J.: Frozen melt-rock reaction in a peridotite xenolith from sub-arc mantle recorded by diffusion of trace elements and water in olivine, Earth Plan. Sc. Lett., 422, 169–181, https://doi.org/10.1016/j.epsl.2015.03.055, 2015.
Tollan, P. M. E., Smith, R., O'Neill, H. S. C., and Hermann, J.: The responses of the four main substitution mechanisms of H in olivine to H2O activity at 1050 ∘C and 3 GPa, Prog. Earth Planet. Sci., 4, 14, https://doi.org/10.1186/s40645-017-0128-7, 2017.
Tollan, P. M. E., O'Neill, H. S. C., and Hermann, J.: The role of trace elements in controlling H incorporation in San Carlos olivine, Contrib. Mineral. Petr., 173, 89, https://doi.org/10.1007/s00410-018-1517-7, 2018.
Whitmore, M. H., Sacra, A., and Singel, D. J.: Electron paramagnetic resonance spectroscopy of tetrahedral Cr4+ in chromium-doped forsterite and åkermanite, J. Chem. Phys., 98, 3656–3664, https://doi.org/10.1063/1.464043, 1993.
Withers, A., Hirschmann, M., and Tenner, T.: The effect of Fe on olivine H2O storage capacity: Consequences for H2O in the martian mantle, Am. Mineral., 96, 1039–1053, https://doi.org/10.2138/am.2011.3669, 2011.
Withers, A. C., Bureau, H. L. N., Raepsaet, C., and Hirschmann, M. M.: Calibration of infrared spectroscopy by elastic recoil detection analysis of H in synthetic olivine, Chem. Geol., 334, 92–98, https://doi.org/10.1016/j.chemgeo.2012.10.002, 2012.
Zhukova, I., O'Neill, H., and Campbell, I. H.: A subsidiary fast-diffusing substitution mechanism of Al in forsterite investigated using diffusion experiments under controlled thermodynamic conditions, Contrib. Mineral. Petr., 172, 53, https://doi.org/10.1007/s00410-017-1365-x, 2017.