the Creative Commons Attribution 4.0 License.
the Creative Commons Attribution 4.0 License.
 | 23 Dec 2020
Grain boundary diffusion and its relation to segregation of multiple elements in yttrium aluminum garnet
Joana Polednia
Ralf Dohmen
Katharina Marquardt
We studied grain boundary diffusion and segregation of La, Fe, Mg, and Ti in a crystallographically defined grain boundary in yttrium aluminum garnet (YAG). Bi-crystals were synthesized by wafer bonding. Perpendicular to the grain boundary, a thin-film diffusion source of a La3.60Al4.40O12 was deposited by pulsed laser deposition. Diffusion anneals were performed at 1000 and 1450 ∘C. Via a gas phase small amounts of elements were added during the experiment. The element concentration distributions in our bi-crystals were mapped using analytical transmission electron microscopy (ATEM). Our results show strong segregation of La and Ti at the grain boundary. However, in the presence of Ti, the La concentrations dropped below the detection limit. Quantitative element distribution profiles along and across the grain boundary were fitted by a numerical diffusion model for our bi-crystal geometry that considers the segregation of elements into the grain boundary. The shape of the diffusion profiles of Fe requires the presence of two diffusion modes, e.g., the co-diffusion of Fe2+ as well as Fe3+. The absence of a detectable concentration gradient along the grain boundary in many experiments allows a minimum value to be determined for the product of sDgb. The resulting sDgb are a minimum of 7 orders of magnitude larger than their respective volume diffusion coefficient, specifically for La = 10−14 m2 s−1, Fe = 10−11 m2 s−1, Mg = Si = 10−12 m2 s−1, and Ti = 10−14 m2 s−1 at 1450 ∘C. Additionally, we model the effect of convolution arising from the given spatial resolution of our analysis with the resolution of our modeled system. Such convolution effects result in a non-unique solution for the segregation coefficient, e.g., for example for Mg between 2–3. Based on our data we predict that bulk diffusion of impurities in a mono-phase polycrystalline aggregate of YAG is effectively always dominated by grain boundary diffusion.
- Article
(6290 KB) - Full-text XML
- BibTeX
- EndNote


Grain boundary diffusion and segregation are of fundamental interest as they have a significant influence on many processes in engineering and geologically relevant materials (e.g., Herzig and Mishin, 2005; Ikesue and Aung, 2008; Mishin et al., 1997). Grain boundary diffusion and segregation may govern element transport in bulk rocks, especially at lower temperatures, and therefore it is relevant for geothermometry, geospeedometry, and geochronology. It is potentially responsible for chemical fractionation on larger spatial scales (e.g., Dohmen and Chakraborty, 2003; Dohmen and Milke, 2010). Furthermore, the grain boundary diffusion and segregation of elements influence the applicability, purity, and lifetime of engineering materials, such as laser ceramics (Ikesue et al., 1995; Ikesue and Aung, 2006, 2008). Grain boundaries have a less ordered structure compared to the crystal lattice and also larger interatomic distances. Therefore, in natural systems and generally impure systems, incompatible elements segregate to the grain boundary and consequently change the chemistry of the grain boundary compared to the crystal interior (grain). Strong segregation can be responsible for a significant increase in the efficiency of diffusive transport within polycrystalline materials (Dohmen and Milke, 2010). For example, experimental studies have demonstrated that grain boundary diffusion of siderophile elements and carbon in polycrystalline MgO provides an efficient mechanism to exchange these elements between the mantle and the core even on the kilometer scale within reasonable timescales (Hayden and Watson, 2007, 2008). Furthermore, segregated elements can change the grain boundary structure by influencing atomic bonds and/or vacancy concentrations (Hiraga et al., 2007; Mei and Kohlstedt, 2000). Thus, physical grain boundary properties change as a consequence of segregation. Such properties include cohesion, mobility (Raabe et al., 2014), microhardness (Kingery, 1974), energy, grain boundary sliding, fracture, and grain growth (Hiraga et al., 2003, 2004). Overall, trace elements at grain boundaries can influence bulk physical properties of polycrystalline materials, such as creep behavior (Hiraga et al., 1997; Ikuhara et al., 2001; Yasuda et al., 2004; Zisner and Tagai, 1968), hardness, viscosity, and electrical conductivity.
Experiments that aim to study the relationship between segregation and grain boundary diffusion are limited because of the inherent experimental and analytical challenges. Most studies investigating grain boundary diffusion in the presence of impurities used polycrystalline materials. Their setup permitted only the product of grain boundary width, δ; the segregation coefficient, s; and the grain boundary coefficient, Dgb to be determined (e.g., Mishin and Herzig, 1999). Several studies indicate that segregation can occasionally decelerate grain boundary diffusion. This has been attributed to “trapping” of elements at specific sites (e.g., Esin and Bokstein, 2012; Mishin and Herzig, 1999; Nakagawa et al., 2007). As an explanation, it has been suggested that atoms at grain boundary sites with a strong binding energy (Mishin and Herzig, 1999) exhibit longer residence times compared to atoms at grain boundary sites where binding energies are lower. Mütschele and Kirchheim (1987) suggested that stronger deceleration occurs where concentrations of the diffusing element are lower; it is concentration-dependent. Yttrium aluminum garnet (YAG) is one of the most extensively used laser media for high-powered lasers, either as single crystals or as polycrystalline ceramics (Geusic et al., 1964; Ikesue et al., 1995; De With and van Dijk, 1984). In the latter case, the properties of the polycrystal are governed by grain boundaries, which separate randomly oriented crystallites. This is most pronounced in nano-crystalline materials, as the interfacial area increases with decreasing grain size (Irifune et al., 2016).
In general, laser ceramics provide valuable advantages over classic single crystals (Cheo, 1988; Ikesue et al., 1995, 2006; Ikesue and Aung, 2006, 2017; Irifune et al., 2016). The three main advantages of laser ceramics compared to single crystals are (i) lower costs, shorter production time, and production in large quantities (Prasad et al., 2009); (ii) the production of laser media with complex shapes (Ikesue and Aung, 2008; Sanghera et al., 2012); and (iii) dopant concentrations >9 times higher than in single crystals can be achieved (Ikesue et al., 2006; Ikesue and Aung, 2008; De With and van Dijk, 1984). According to Ikesue et al. (2006) “higher Nd doping allows the Nd:YAG to absorb light more effectively from the excitation source laser diode”. YAG is commonly doped with a variety of elements that differ in ionic radius from Y to Al. Dopant elements range from elements of high solubility in the host's lattice, such as Yb3+, to elements of low solubility, such as La3+ (Muñoz-García et al., 2010; Sekita et al., 1991). Yb3+ can easily be exchanged with Y3+ due to its similar ionic radius and equal valence state (Marquardt et al., 2010, 2011a, b; Shannon, 1976) while La enters the YAG lattice only in limited concentrations. Density-functional theory calculations predict that the YAG lattice can accept La concentrations of only up to 0.6 at. % at static conditions; Nd concentrations may reach up to 2.7 at. % (Klimm et al., 2007). Lanthanum is a candidate element to improve the optical properties of YAG lasers because it acts as a sintering aid, which supports the densification and formation of a pore-free polycrystal (Liu et al., 2012). Additionally, it can shift the laser emission to longer wavelengths (Holloway and Kestigian, 1969; Robertson et al., 1981). MgO also seems to support sintering in various materials, including YAG (Li et al., 2010).
The presence of specific impurities in ceramics can either intensify laser emission as a result of the emission–reabsorption phenomena (“sensitization”) (Korzhik et al., 1992; Marfunin, 1979), simply shift the laser emission, or quench it. Note that the laser emission of YAG is suppressed (quenched) in the presence of Fe3+ (Korzhik et al., 1992; Kvapil et al., 1983; Marfunin, 1979). Trace elements responsible for either quenching or intensifying laser emission can be incorporated into a YAG ceramic by diffusion – either on purpose or accidentally. Therefore, understanding their diffusive behavior can improve application techniques. Additionally, densification of ceramics is controlled by diffusion both along the grain boundaries and through the grain. YAG sintering is rate-limited by Y3+ transport or transport of dopants such as rare earth elements because these elements diffuse slowly due to their large ionic size and mass (Boulesteix et al., 2009; Jiménez-Melendo et al., 2004).
Several studies focused on volume diffusion in YAG using both computational (Li et al., 2012) and experimental methods (Cherniak, 1998; Haneda et al., 1984; Peters and Reimanis, 2003; Marquardt et al., 2010). Investigations of grain boundary diffusion are more scarce for YAG. Interdiffusion of Yb–Y along YAG grain boundaries (Jiménez-Melendo et al., 2004; Marquardt et al., 2011a) and oxygen tracer diffusion in YAG grain boundaries (Sakaguchi et al., 1996) were measured. With knowledge of grain boundary diffusion coefficients and volume diffusion coefficients, total diffusion distances in a polycrystalline material can be calculated and element distributions can, therefore, be predicted. Fujioka et al. (2015) measured total diffusion distances for Yb in YAG sintered with different techniques. In summary, the effect of additional elements on diffusion and the role of segregation have been left largely unaddressed in the literature.
Here we designed experiments to investigate the relationship between grain boundary diffusion, segregation, specific grain boundary orientation, and multiple elements simultaneously. This is possible by combining the synthesis of YAG bi-crystals with controlled grain boundary orientations (Marquardt et al., 2010), versatile thin-film production of refractory materials using pulsed laser deposition (e.g., Dohmen et al., 2002), and high-resolution analysis of element concentration distributions by analytical transmission microscopy (e.g., Meissner et al., 1998; Marquardt et al., 2011a, b). Our experimental approach allows Dgb to be determined, as well as the s of several impurities in YAG bi-crystals and the quantification of the interaction of multiple elements on transport rates. We focused on La, Fe, Mg, and Ti as these elements vary both in ionic size and charge. We numerically solved the diffusion equation for an adaption of the classical Fisher model for segregating elements to fit the experimental data and evaluated the role of analytical convolution effects of the TEM analysis. We present an approach where s and Dgb can be determined independently of each other. The experimental conditions are directly relevant for the densification process of YAG ceramics – the most important mechanism for creating translucent laser ceramics.
2.1 Starting material
The diffusion couples (Fig. 1a) for our La diffusion experiments were produced analogous to Marquardt et al. (2011a). In short, crystal wafers were cut from a YAG single crystal, grown by the Czochralski technique (Czochralski, 1918; Linares, 1964; Müller, 2007) at the Leibniz Institut für Kristallzüchtung, Berlin. The wafer faces are oriented close to the (210) plane (3∘ off). These wafers were polished to atomic flatness. The arithmetic average roughness value (Ra) of the crystal wafers was measured with interferometry and yielded about 0.34 nm. Using the “wafer direct bonding” method (Gösele et al., 1999; Heinemann et al., 2005; Plößl and Kräuter, 1999; Reiche, 2006; Tong et al., 1995), we produced bi-crystals following the recipe given by Hartmann et al. (2010). The resulting grain boundary is a near Σ5 (021)/[100] grain boundary. The Σ value describes the reciprocal density of coinciding lattice sites (Hartmann et al., 2010) of both adjacent crystal lattices. In the grain boundary discussed here, the adjacent crystal lattices are rotated by 36.9∘ about the [100] axis (Σ5 grain boundary (Campell, 1996)). Additionally, the lattices were rotated by 6.5∘ about the [021] direction, which was confirmed by TEM measurements. The boundary plane is the (021) common to both crystals. We deposited a thin film by pulsed laser deposition (PLD) (Sankur and Hall, 1985; Cheung and Sankur, 1988; Dohmen et al., 2002) at Ruhr University Bochum using polycrystalline La3Al5O12 target material. The deposition was performed at room temperature. For quality control the deposition runs were accompanied by a thin-film deposition onto a Si wafer (10×10 mm). The Si wafer and one of the bi-crystals were used as reference material to characterize the physical state and composition of the film after deposition and before the diffusion anneal. For the experiment the thin film was deposited perpendicular to the grain boundary (Fig. 1a) and served as a diffusion source. The synthetic YAG bi-crystal ( mm) obtained a thin film, and after the annealing and conclusion of the experiment and analyses, this bi-crystal was ground down, re-polished and used for a second thin-film deposition and experimental run . We produced two sets of bi-crystal samples with a thin-film thicknesses of approximately 50 and 500 nm (Table 1).
Table 1Experimental conditions, sample IDs, and corresponding FIB lamella numbers.
Electron microprobe analysis (EMPA) was only performed on the approximately 1 µm thick film on the silicon wafer. Wavelength dispersive EMPA was calibrated using the following standards, a 12 wt. % La2O3 containing glass for La calibration, a silicon wafer for Si calibration (as a cross-check), and an andradite garnet for Al calibration. A ZAF correction was performed (e.g., Goldstein, 1977). We subtracted the Si signal from the results, as it originated exclusively from the silicon wafer, and normalized the measured La2O3 and Al2O3 to a total of 100 wt. %. The formula was normalized to 12 oxygen atoms. Averaging >80 measurements yielded a thin-film composition of La3.60Al4.40O12. The resulting thin film shows elevated La content and slightly reduced Al content compared to the target material used for PLD.
2.2 Diffusion anneals
Experiments were performed in a vertical tube furnace in air and at temperatures of 1000 and 1450 ∘C. Experiments at 1450 ∘C were conducted for durations of 30 min and 24.1 h (2 experiments), respectively, and one experiment at 1000 ∘C was performed for 24.1 h. After inserting an Al2O3 rod, which carried the crucible with the sample, into the alumina furnace tube, the desired temperature was reached within approximately 3 min. This time was subtracted from the total experimental duration. The temperature was measured with a type-B thermocouple (6 % Rh∕Pt, 30 % Rh∕Pt) and is accurate to within ±0.5 % according to ITS-90 tolerances. The different samples with respective experimental conditions are summarized in Table 1. In all experiments, either a Pt wire was wrapped around the bi-crystal or the bi-crystal was placed on top of a Pt foil to prevent physical contact and/or reaction with the Al2O3 crucible.
3.1 Transmission electron microscopy (TEM)
Electron transparent lamellae were cut perpendicular to the thin film and parallel to the grain boundary (Fig. 1a) using the focused ion beam (FIB) technique (Overwijk, 1993; Phaneuf, 1999; Wirth, 2004). Site-specific sections, 20 µm×15 µm, with a constant thickness between 30–100 nm were used to characterize the atomic scale by high-resolution TEM (HRTEM) and energy dispersive X-ray spectroscopy (EDS) before and after diffusion annealing.

Figure 1Schematic bi-crystal. (a) Experimental setup with thin film (upper drawing) and close-up of electron transparent TEM lamella produced by FIB used for analyses. The TEM lamella exemplifies a specimen after a diffusion experiment. Compositional differences are indicated in variations of red. (b) Schematic of the experimental geometry indicating our definition of the measurement direction. The diffusion profiles across the grain boundary were extracted in equal distances Δd matching the length of the lamella. The diffusion profiles were integrated parallel to the x direction; this is illustrated schematically by dashed lines. Additionally, profiles along the grain boundary were extracted.
We used a Titan FEI G2 80–200 microscope at 200 kV, which is equipped with a field-emission high brightness electron gun (X-FEG) as an electron source for the TEM investigation. Image delocalization is expected in the HRTEM images as the spherical aberration coefficient (Cs) is 1.3 mm. Delocalization increases with increasing Cs and decreasing wavelength, λ (analogue to decreasing accelerating voltage). Moreover, it depends on two additional parameters: (i) the spatial frequency in the reciprocal space that shall be resolved and (ii) the defocus setting. Delocalization is larger for larger reciprocal lattice vectors.
The Gatan Digital Micrograph software was used to analyze transmission electron micrographs and the ESPRIT software (version 1.9) from Bruker Nano to acquire and quantify element concentration distribution maps. These maps were acquired using energy dispersive X-Ray spectroscopy in scanning (S)TEM mode. A condenser lens (C2) of 50 µm, a gun lens value of 3, and a spot size of 3 resulted in a screen current of ∼0.16 nA. The TEM is equipped with a Super-X detector (Schlossmacher et al., 2010). The ronchigram (Ronchi, 1964) was used to correct astigmatism and focus the electron probe. The actual resolution is a convolution of the point resolution of the STEM beam (down to 160 pm) and the chosen scan dimensions (magnification) that control the pixel size of the element distribution map.
3.2 Spectrum imaging method
The excitation volume of the primary electron beam was simulated with the Monte Carlo method using the CASINO software (Drouin et al., 2007). At the stated conditions of 200 kV and for the present elements the diameter of the radially symmetric volume was found to be approximately 1.9 nm (full width at half maximum of the intensity distribution). In the present STEM element distribution maps, the pixel size is the spatial resolution-limiting factor (Van Dyck and de Jong, 1992; de Jong and Van Dyck, 1993) and was 3.6×3.6 nm2 and in a test run, we used a pixel size of ca. 20×20 nm2. Typical map dimensions were about 3×2 µm2 (700×400 pixels). Stable mapping was achieved for up to 12 h of acquisition. To evade electron channeling, we avoided two-beam conditions (Bragg) or in-zone-axis orientations. The sample was oriented to have the grain boundary plane parallel to the incident beam. In each pixel of the map, a complete X-ray spectrum is stored (Bruker Nano GmbH, 2011).
Profiles are located along and perpendicular to the grain boundary (Fig. 1b). To improve the signal ∕ noise ratio for cross sections across the grain boundary we averaged over 40 nm parallel to the grain boundary. All extracted profiles consist of one EDS spectrum per point. Every spectrum was individually analyzed in a procedure that accounts for Bremsstrahlung, background, deconvolution. Bremsstrahlung was modeled using Kramer's law (Bruker Nano GmbH, 2011; Kramers, 1923) and fitted to five energy-windows at 0.196–0.216, 2.819–4.075, 7.356–7.556, 9.620–9.819, and 13.898–14.466 keV that were free of element-specific X-ray lines. We quantified following X-Ray emission lines: O (K series), Fe (K series), Mg (K series), Al (K series), Si (K series), Y (K series), La (L series), Ti (K series). We excluded C (K series), Cu (K series), Co (K series), Ga (K series), and Pt (L series), being components of surface coating, sample holder, or FIB contaminants. The former elements were deconvoluted and quantified, whereas the latter ones were only deconvoluted as they do not originate from the sample itself. Element concentrations were determined from intensity ratios using the method of Van Cappellen and Doukhan (1994), where absorption and fluorescence were fitted using the thin-foil approximation taking the Al∕O ratios determined by EMPA and a sample density of 4.56 g cm−3 into account. Thickness variations of the lamellae, which can potentially cause artifacts, were excluded by thickness mapping using zero-loss-filtered TEM (EFTEM).
From sample TH_9_2 (Table 1) two lamellae were prepared. A STEM element distribution map was collected from each lamella. A total of 12 profiles perpendicular (across) to the grain boundary were extracted in distances Δd=100 nm (Fig. 1b) and one was extracted along the grain boundary. For sample TH_9_3 (Table 1), 10 profiles perpendicular to the grain boundary (Δd=100 nm) and one along the grain boundary were extracted from two maps of two individual lamellae. For sample TH_9_4 (Table 1) five profiles perpendicular to the grain boundary (Δd=500 nm) and one along the grain boundary were analyzed. For sample TH_9_5 (Table 1) 20 profiles perpendicular to the grain boundary (Δd=100 nm) and one along the grain boundary were quantified from two adjacent maps.
3.3 Numerical modeling of diffusion in bi-crystals for segregating elements
We developed a numerical diffusion model to simulate concentration contours, which accounts for impurities in a cross section of a bi-crystal. By fitting the observed concentration profiles with these simulations, we can in principle determine Dvol, Dgb, and the segregation factor, s. In the model, the products δs and δsDgb are independent input parameters and hence at known δ we can determine s. The model is a modified version of the Fisher model (Fisher, 1951), where the grain boundary is treated as a one-dimensional diffusion medium located between two adjacent crystals. These crystals have isotropic diffusion properties (only strictly applicable for cubic crystals such as YAG) and they are treated as two-dimensional diffusion media (Fig. 2).
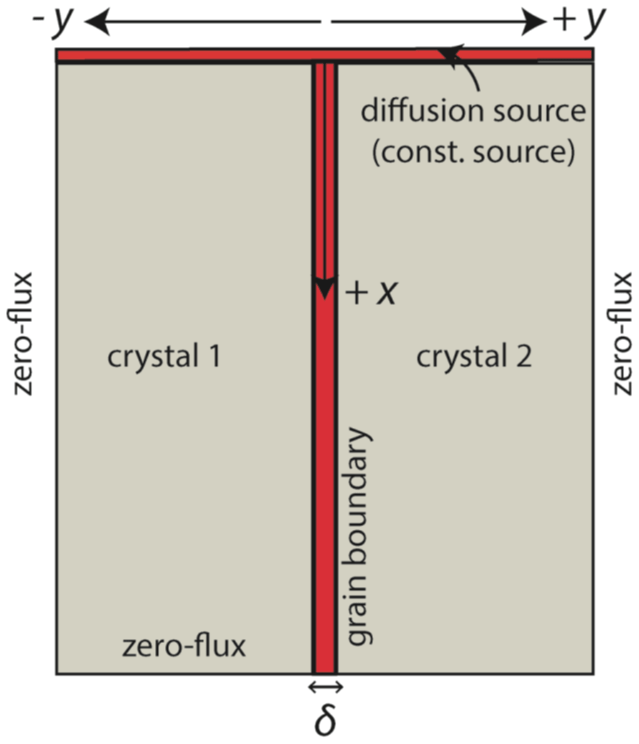
Figure 2Diffusion model with the definition of variables and numerical boundary conditions. The grain boundary has an assigned grain boundary width δ. Within the region of the grain boundary, Eq. (3) is solved and Dgb is obtained. In the crystal interiors (crystal 1 and crystal 2), Eq. (1) is solved to determine Dvol.
Lattice (volume) diffusion is governed by the 2D version of Fick's second law (Eq. 1), and diffusion along the grain boundary is governed by a modified 1D version of Fick's second law (Eq. 2):
Cgb and Cvol are the concentrations of the impurity in the grain boundary and crystal volume, respectively; Dgb and Dvol are diffusion coefficients in grain boundary and volume, respectively; δ is the grain boundary width; and x and y are space coordinates (x parallel to grain boundary and y perpendicular to grain boundary) as illustrated in Figs. 1 and 2. Element diffusion normal to the grain boundary (into or out of the grain boundary slab) is often referred to as leakage flux (Dohmen and Milke, 2010; Mishin et al., 1997) and it is named so from here. It is incorporated as the second term on the right side of Eq. (2). In our modified model, the presence of equilibrium segregation according to Gibbs (1966) is considered, while in the Fisher model, segregation is ignored. Here, two assumptions are made: (i) a local thermodynamic equilibrium exists between grain boundary and the adjacent crystal, and (ii) grain boundary segregation follows a Henry-type isotherm (e.g., Mishin and Herzig, 1999). The latter assumption implies that the segregation coefficient is independent of the dopant concentration and hence only a function of temperature and pressure and does not change along the grain boundaries. Therefore, for local equilibrium at the grain boundary, all x and t must obey . As a consequence, the grain boundary width, δ, is replaced by the product δs in the leakage flux of the Fisher model (Eq. 2).
We solve Eqs. (1) and (2) numerically with an explicit finite difference method. In the numerical model, the bi-crystal is a finite system with dimensions dx and ±dy, which are smaller than the real dimensions of the bi-crystal to reduce the calculation time. The initial concentration of the impurity in the crystal is constant ( for all x and y). As justified later by our experimental observations we treat the thin film as an infinite source and hence fix the initial concentration at the bi-crystal surface at a constant value ( for all y and t). At the other boundaries of this system, we assume a zero-flux condition. This boundary condition is justified for the boundary at if the diffusion penetration distance within the crystal lattice is much smaller than dy, , and for the boundary at x=dx if the diffusion penetration distance within the grain boundary is much smaller than dx, which depends on the kinetic regime (Kaur et al., 1995). Our code was benchmarked with the analytical Whipple–Le Claire solution of the Fisher model (Le Claire, 1963; Whipple, 1954) by setting s=1.
3.4 Fitting procedure
The numerous profiles of each experiment were fitted simultaneously, and individual C0 and C1 are set to the measured values. For one crystal domain we set dx=60 µm and dy=1200 nm. For symmetry reasons, we mirrored the simulation result at the grain boundary plane. The number of nodes in the mesh of our finite difference code was chosen by a compromise between minimizing the calculation time and increasing the spatial resolution of the concentration contours. Typical mesh sizes were –4 nm in agreement with the experimental spatial resolution. The extent of the time step is chosen according to the stability criterion, i.e., (e.g., Crank, 1975).
Our model allows fitting of Dgb, Dvol, and δs simultaneously. The multiple quantitative 1D profiles perpendicular to the grain boundary (Fig. 1b) and the 1D profile measured along the grain boundary were compared to the corresponding simulated profiles as extracted from the 2D simulations. The input parameters Dgb, Dvol, and δs were optimized until all profiles are simultaneously reproduced, which was visually confirmed. To test the sensitivity of our model to changes of individual parameters, these parameters were slightly varied (see Figs. 11 and 13). Based on these detailed sensitivity tests done for all the simulations it is evident that we obtain strong constraints for the diffusion coefficients. Consequently, this procedure allows accurate reproduction of 2D diffusion data sets with our compliant 2D diffusion model.
4.1 Grain boundary and thin-film composition/texture
TEM was used to characterize the grain boundary prior to and after diffusion annealing. Figure 3a, c, d show representative contacts of the adjacent crystals before diffusion annealing; the grain boundary is perfectly straight. No voids, pores, dislocations, or secondary phases are present. However, we detected strain shadows that have a periodicity of 38–40 nm at the grain boundary in agreement with Hartmann et al. (2010). The thin films were initially amorphous and display constant thickness (Fig. 3b).
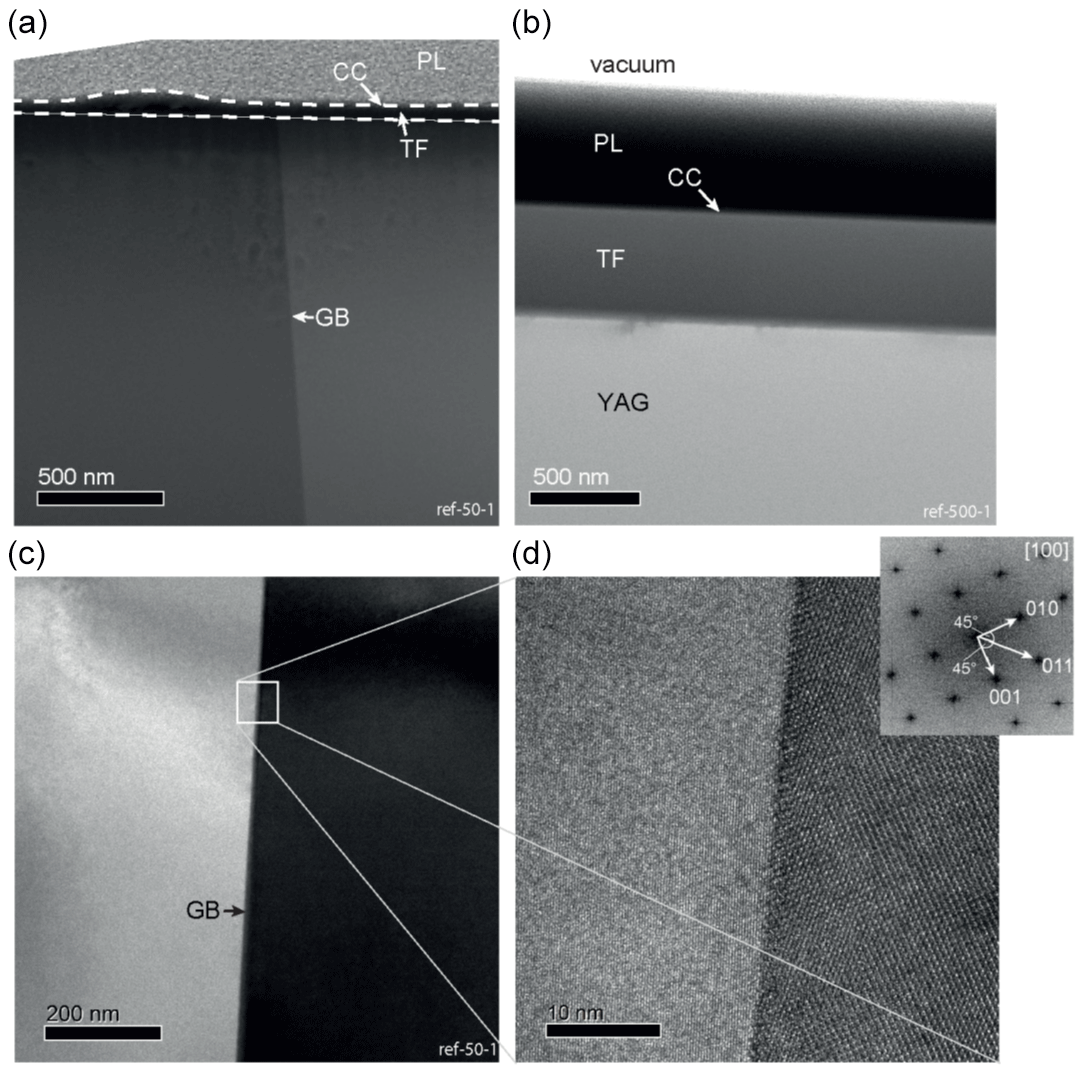
Figure 3TEM micrographs of the reference samples. TF: thin film, CC: carbon coating, and PL: platinum layer created by FIB preparation. (a) High-angle annular dark-field (HAADF) micrograph of sample ref-50-1. The thin film is 50 nm thick and amorphous. The hump on the thin film is caused by an irregularity in the carbon coating (b) bright field (BF) micrograph of sample ref-500-1: the thin film is 500 nm thick and amorphous. (c) BF micrograph of the grain boundary area of sample ref-50-1. (d) HRTEM micrograph, where the right crystal is oriented along the [100] zone axis. The grain boundary is straight and does not show any holes or voids.
After annealing no secondary phases or dislocations along the grain boundaries and no evidence for grain boundary migration were observed. Bi-crystal grooving and an associated faceting (Fig. 4) were always detected. These facets are {101} planes and they frame the thin film from two sides. The grooves are accompanied by an accumulation of thin-film material inside the groove.
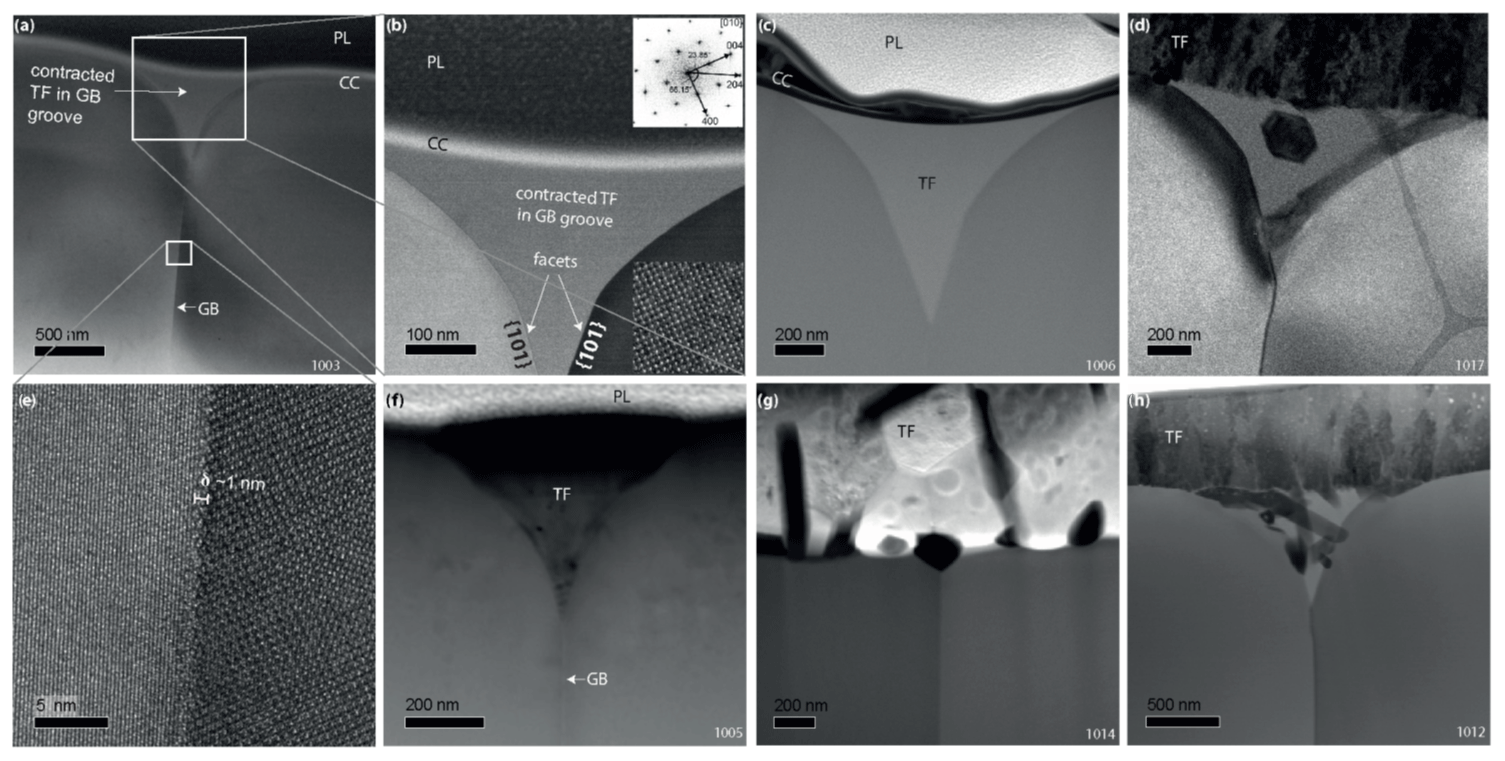
Figure 4TEM micrographs taken after the experiments. TF: thin film, CC: carbon coating, and PL: platinum layer created by FIB preparation. (a) BF micrograph of sample TH_9_2 (1003), which was annealed 24.1 h at 1450 ∘C. The originally 50 nm thick film contracted into the grain boundary groove (middle) and is amorphous. (b) BF micrograph corresponding to the upper rectangle of (a) with the right grain oriented along the [010] zone axis. The FFT is calculated from the inserted HRTEM of the right crystal. (c) HAADF micrograph of sample TH_9_3 (1006) annealed 24.0 h at 1450 ∘C. The thin film contracted into the grain boundary groove (middle) and is amorphous. (d) BF micrograph of sample TH_9_4 annealed 24 h at 1000 ∘C. The thin film is thicker compared to (a), (c), and (f) and crystallized out of the groove. A single euhedral crystal can be observed within the groove. (e) HRTEM micrograph of the grain boundary illustrated in (a). (f) HAADF micrograph of sample TH_9_2 (1005). (g) HAADF micrograph of sample TH_9_5 (1014). The thin film is well crystallized, and the groove is comparably small. (h) BF micrograph of sample TH_9_4 (1012) annealed 24.0 h at 1000 ∘C. The thin film is thicker compared to (a) and crystallized; several crystals can be observed in the groove, surrounded by an amorphous melt residue.
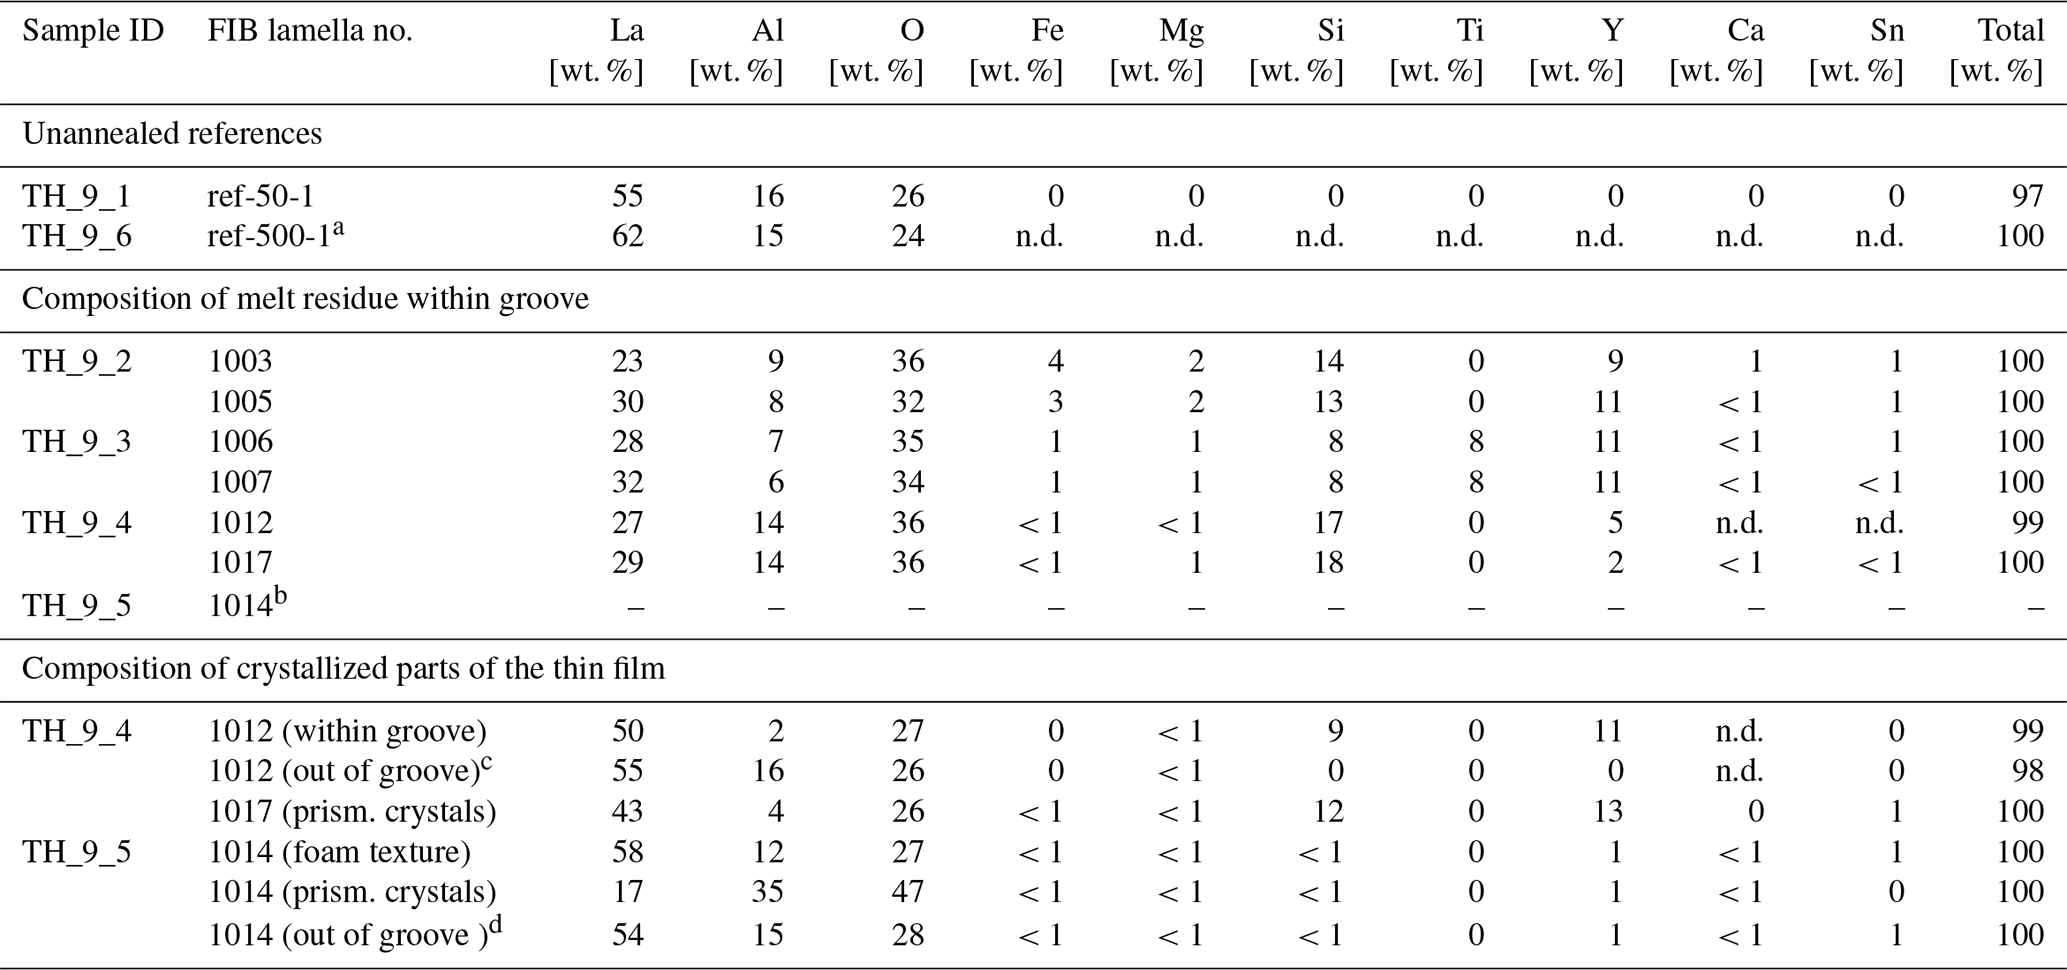
The texture and geometry of the film varied depending on the temperature, annealing time, and thickness of the film. The two films with 500 nm thickness were stable during the entire experiment while the 50 nm thick film tended to shrink and to form droplets on the bi-crystal's surface (de-wetting phenomenon). As a result, part of the YAG's surface was exposed. For example in the 24 h experiments (TH_9_2 and TH_9_3) the bi-crystal shows a groove that is filled with thin-film material, while the crystal surface on both sides of the groove was not covered by any film material. In the experiments with the 500 nm film, the crystal surface outside the groove remained covered with a constantly thick layer. In all experiments the film material in the groove remained mainly amorphous, with crystals forming occasionally (Fig. 4d, h). At 1000 ∘C, outside the groove, the material fully crystallized to a polycrystalline assemblage (sample TH_9_4, Fig. 4d, h). Here long-prismatic crystals grew from the surface and from the interface between thin film and crystal towards the center of the thin film (Fig. 4h), whereas newly formed crystals within the groove are still surrounded by an amorphous matrix. The highest crystallization degree was observed in sample TH_9_5 which was annealed for 0.5 h at 1450 ∘C. Two phases occur in the polycrystalline part of the 500 nm thick thin film: (i) prismatic crystals yielding a lower La concentration compared to the bulk and (ii) crystals that show a polygonal texture with 120∘ triple junctions (Fig. 4g). In this case, the La concentration is higher than the bulk La concentration in the film (Fig. 5). Furthermore, the groove in TH_9_5 is the smallest one that has formed.
Table 2Composition of the unannealed thin film, the amorphous residue within groove, and the crystallized parts of the thin film.
a Thick reference thin film on a silicon wafer measured by EMPA, O calculated (n.d. stands for not detected).
b Amorphous residue area too small for measuring accurately.
c Measured outside the groove: one phase.
d Measured outside the groove, both phases combined (ca. 90:10 ratio).
The composition of the thin film varies with location both inside and outside of the groove and was monitored for all experiments. The analytical results are summarized in Table 2. The thin-film compositions changed significantly during the experiments and thus differ from the initial thin-film composition of La3.60Al4.40O12. This indicates that the diffusion couple was not a closed system during the experiments and elements including Fe, Mg, Si, and Ti, as well as Sn, entered the thin film to different degrees. The source for these elements is likely the furnace atmosphere or the Pt wire (at least for Fe + Sn). Even samples TH_9_2 and TH_9_3 annealed at identical T=1450 ∘C for the same run duration have different compositions within the groove. The strongest contamination of the thin film is observed for sample TH_9_2 where Fe, Mg, Si, and Ca (+ Sn) were found in the thin film, whereas sample TH_9_3 contained much less Fe, Mg, and Si but strong Ti contamination. The thin film of TH_9_5 also annealed at 1450 ∘C but for a much shorter time does not show any contamination except Sn. Possible reasons could be either a cleaner furnace atmosphere or the shorter duration of the experiment. Note that the thin film of TH_9_5 is a factor of 10 thicker than those of sample TH_9_2 and TH_9_3 and therefore any contamination in the thin film might be more strongly diluted. However, TH_9_4 with the same thin-film thickness as TH_9_5 and annealed at a much lower T=1000 ∘C also has a thin film with strong contamination but only for Si. In addition to the contaminants, Y entered the thin film in all samples as could be expected by the exchange of La and contaminants by Y between the thin film and the bi-crystal as controlled by interdiffusion within the crystal volume and the grain boundary. While the contaminations were not on purpose, they allowed unique insight into the segregation and interaction of elements with different charge and ionic size during grain boundary diffusion in such a well-defined diffusion geometry. In sample TH_9_2 the thin film acts as a source of La, Fe, Mg, and Si. In sample TH_9_3 the thin film is mostly a source for La and Ti. In experiment TH_9_4 the thin film is a source for La and Si, while in experiment TH_9_5 is a pure La diffusion experiment.
Figure 5EDX analysis of the thin film in sample TH_9_5 (1014). (a) TEM EDX La element map of the crystallized thin film. (b) EDX spectra of two distinct areas in the thin film: the prismatic crystal and the foam texture part with 120∘ triple junctions, respectively.
4.2 Compositional profiles within the bi-crystals
4.2.1 Experiment TH_9_2: 1450 ∘C, 24.1 h
The compositional maps of several lamellae of the same sample are almost identical and therefore each of them is representative for the whole sample. For sample TH_9_2 the concentrations of La, Fe, Mg, Si, and Ti in the grain boundary is higher than in the crystal and constant over the entire length of the lamellae in the x direction (3.5 µm). A decrease in concentration along the grain boundary was not detectable (Fig. 6). Volume diffusion profiles of Mg and Si have the same length and shape close and further away from the diffusion source; they are considerably shorter compared to the Fe diffusion profiles. La shows a strong localization at the grain boundary; it could not be detected in the crystal volume in the estimated detection limit of approximately 0.2 wt. % and within the approximate spatial resolution of 4 nm. The major cations of the YAG bi-crystal, Y and Al, both show a slight concentration decrease towards the film and the grain boundary (Fig. 6). The diffusion profile lengths are similar to those of Fe. In addition, the concentrations of Y and Al are slightly reduced within the grain boundary compared to the adjacent crystal volume. This indicates interdiffusion of Y3+ and Al3+ against mostly Fe (most likely Fe3+) within the crystal volume. Note that the profile shapes of Fe differ compared to those of Mg (Fig. 7); they show a discernable kink approximately at the end of the Mg profile. To test if iron occurs in different valence states, we performed electron energy loss spectroscopy (EELS), but the concentrations are too low to detect the iron core-loss peak at the grain boundary or in the thin film.
Figure 62D STEM EDX element distribution maps of sample TH_9_2 (1005). The maps are false-color maps, the EDS signals have been quantified using ESPRIT with a quantification method as given in Sect. 3.2. Red indicates high concentrations and black indicates low concentrations of the elements as specified.
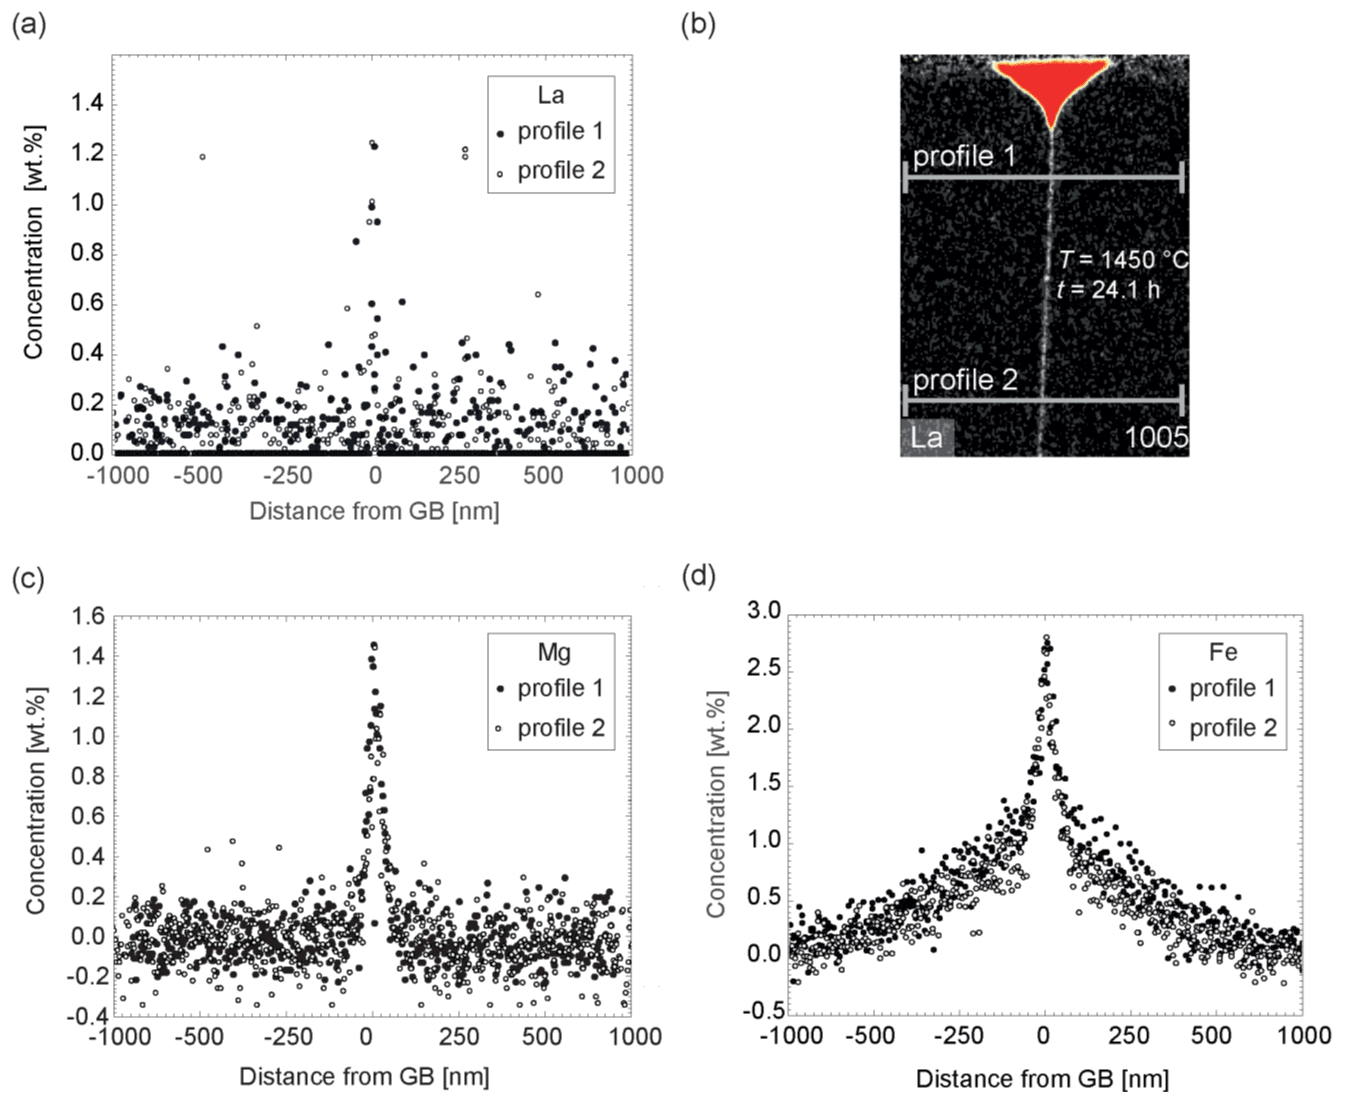
Figure 7Diffusion profiles perpendicular to grain boundary of sample TH_9_2 (1005). Panels (a), (c), and (e) are extracted from quantified 2D STEM EDS elemental maps (b) measured at a distance of 500 and 2000 nm from the diffusion source (profile 1, profile 2). The concentrations in each profile are integrated over 40 nm in the x direction, parallel to the grain boundary. The counting error is smaller than the symbols in the profiles. (a) La profiles, (b) STEM element distribution map indicating the location of the extracted profiles, (c) Mg profiles, (d) Fe profiles.
4.2.2 Experiment TH_9_3: 1450 ∘C, 24.1
The concentration of Fe, Mg, and Si within the groove was lower here compared to sample TH_9_2, but otherwise no significant difference was found for these elements in terms of shape of the concentration profiles and maps. This experiment differs because of the presence of Ti. It is remarkable that the presence of Ti has significant impact on La. La diffusion and segregation seems inhibited. La could not be detected with certainty (Fig. 8) anywhere except in the groove. The presence of Ti poses an analytical problem because the Kα Ti peak at 4.510 keV and the Lα La peak at 4.645 keV overlap. In the experiment TH_9_3 the Lα La peak is only present (if at all) as a small shoulder of the Kα Ti peak (Fig. 8b). The Lα peak of La is the strongest peak within the measured energy range of 0–20 keV and further La peaks cannot be used for deconvolution and quantification because of too low intensities or true absence. The presence of Ti in this sample increases the detection limit for La to a roughly estimated value of 0.5 wt. %. Quantification is difficult because part of the Ti peak can be misinterpreted as a La signal. Analogous to sample TH_9_2, where the concentrations of the elements in the grain boundary are constant over the entire length of the crystal, here, in sample TH_9_3, Fe, Mg, Si, and Ti have higher concentrations in the grain boundary than in the crystal; the concentrations are constant over the entire length of the lamellae in the x direction (8 µm). A decrease in concentration along the grain boundary was not detectable (Fig. 8).
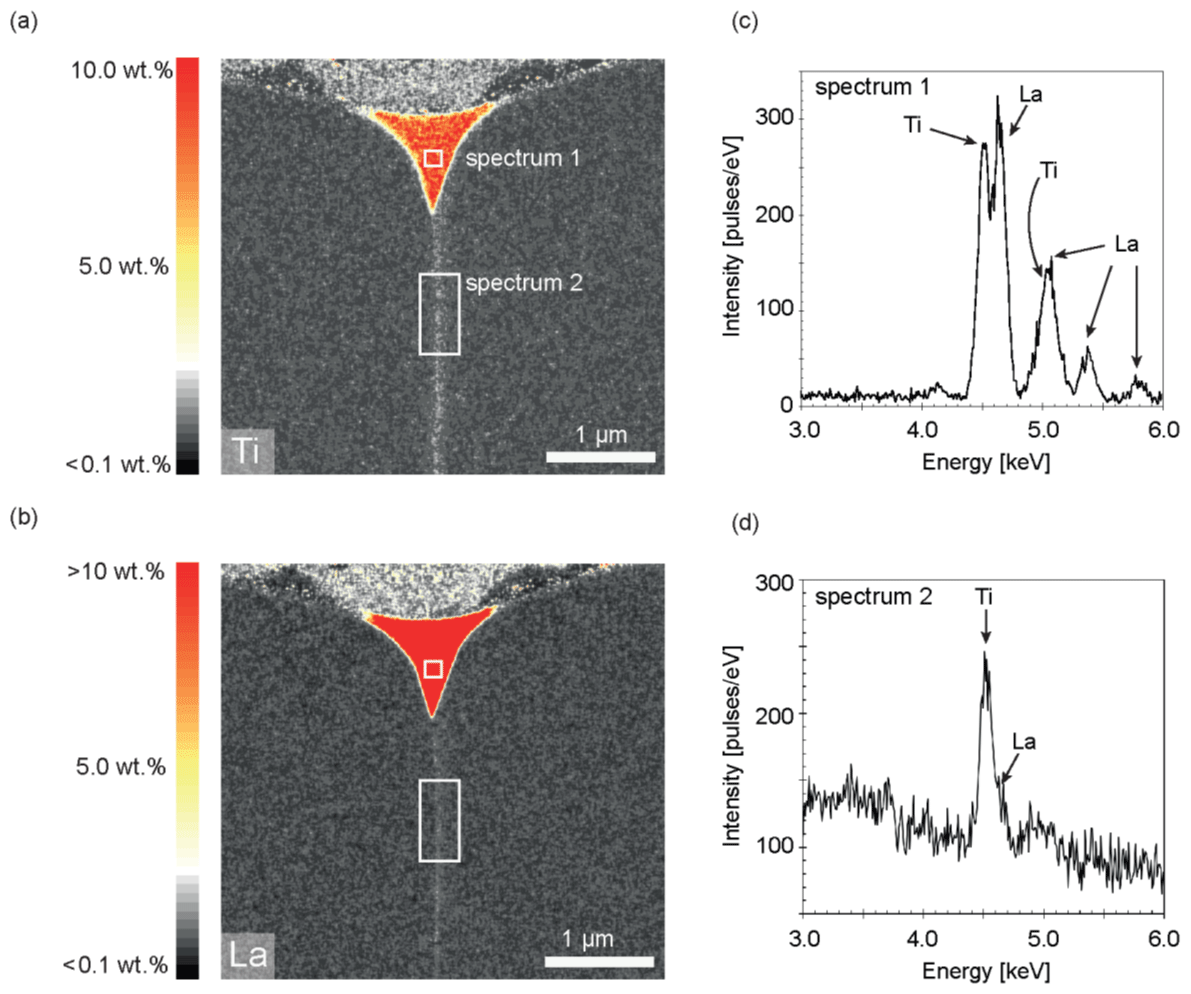
Figure 82D STEM maps of the Ti-containing sample TH_9_3 (1006). The EDX data have been quantified using ESPRIT and a similar quantification method to that given in Sect. 3.2. (a) Ti element concentration map, (b) La element concentration map. The maps are false-color maps: red indicates high concentration and black low concentration of the indicated element. Apparent concentrations in the grain boundary are an artifact of data processing because part of the Ti peak can be misinterpreted as a La signal. (c) EDX spectrum 1 of the thin film within the groove indicated in (a) and (b) showing the Ti Kα peak at 4.510 keV; the La Lα at 4.645 keV; the smaller La Lβ1, Lβ2, and Lγ1 peaks; and the shoulder of the Ti Kβ peak. (d) EDX spectrum 2 of the grain boundary area indicated in (a) and (b) showing the overlap of the Ti Kα and the La Lα peak.
4.2.3 Experiment TH_9_5: 1450 ∘C, 0.5 h
Tn contrast to TH_9_2 and TH_9_3, experiment TH_9_5 was free of Ti, Fe, and Mg. Consequently element distribution maps for La only were obtained. Analogous to the other two experiments, La could be only detected within the grain boundary and the thin film. The La concentration decreased with increasing distance from the source (Fig. 9), which is a consequence of the shorter duration of this experiment. The La concentration measured close to the source was determined to be 1.9 wt. %, decreasing to below the detection limit (≈0.2 wt. %) at 2.5 µm distance from the groove.
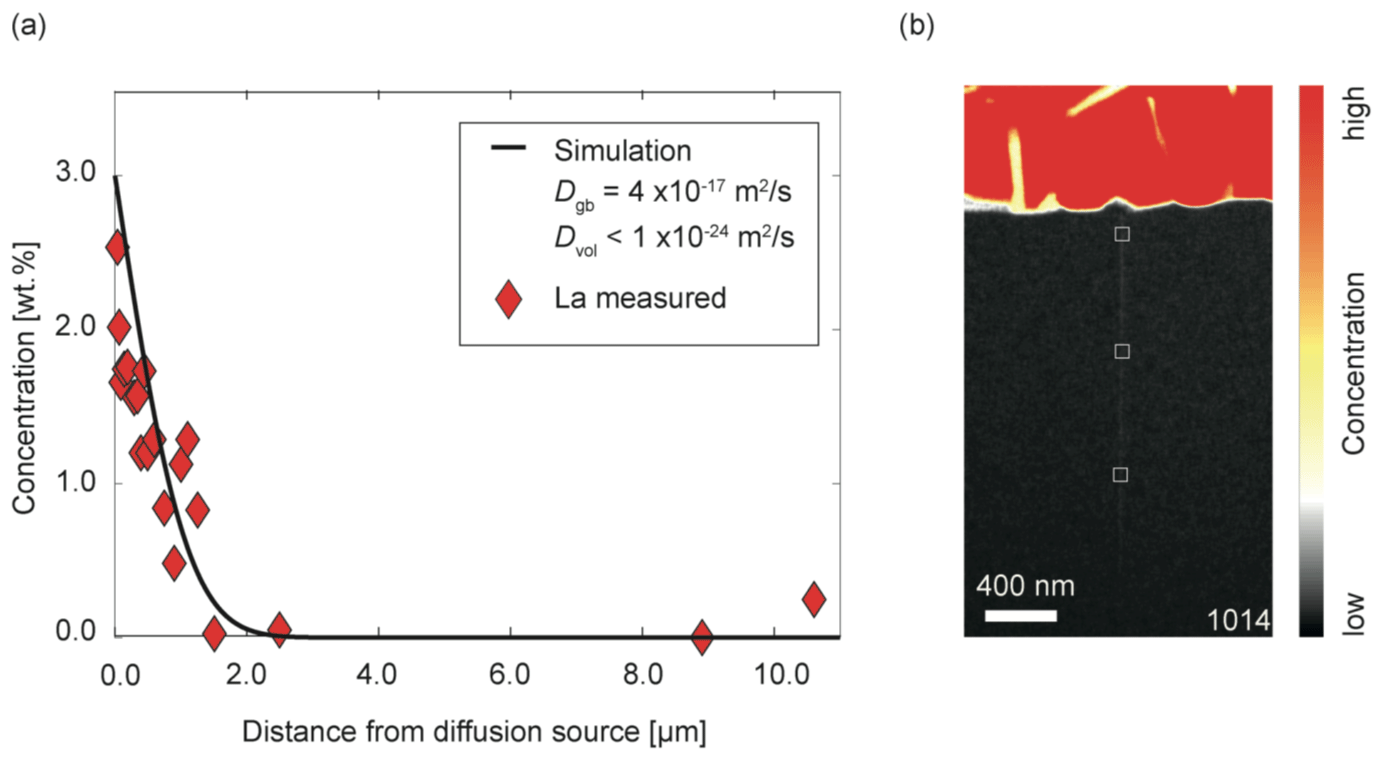
Figure 9(a) La concentration profile along grain boundary of sample TH_9_5 (1014) in wt. %. Each diamond shows the quantitative concentration of La (signals were integrated over 8×8 nm) at the respective distances from the groove. This is indicated schematically in (b). (b) Element concentration map of La. Red indicates high concentrations and black indicates low concentrations of La.
4.2.4 Experiment TH_9_4: 1000 ∘C, 24 h
The only cations detected in the grain boundary in addition to Y and Al are La and Si. These are also enriched in the thin film. La concentration reached a constant 1.5 wt. % inside the grain boundary over the entire length of the lamella in the x direction (7 µm). A Mg diffusion profile from the thin film–bi-crystal interface into the bi-crystal allowed the determination of the volume diffusion coefficient for Mg. This flat diffusion profile for La yields a minimum Dgb similar to the diffusion coefficient obtained from the experiment at 1450 ∘C.
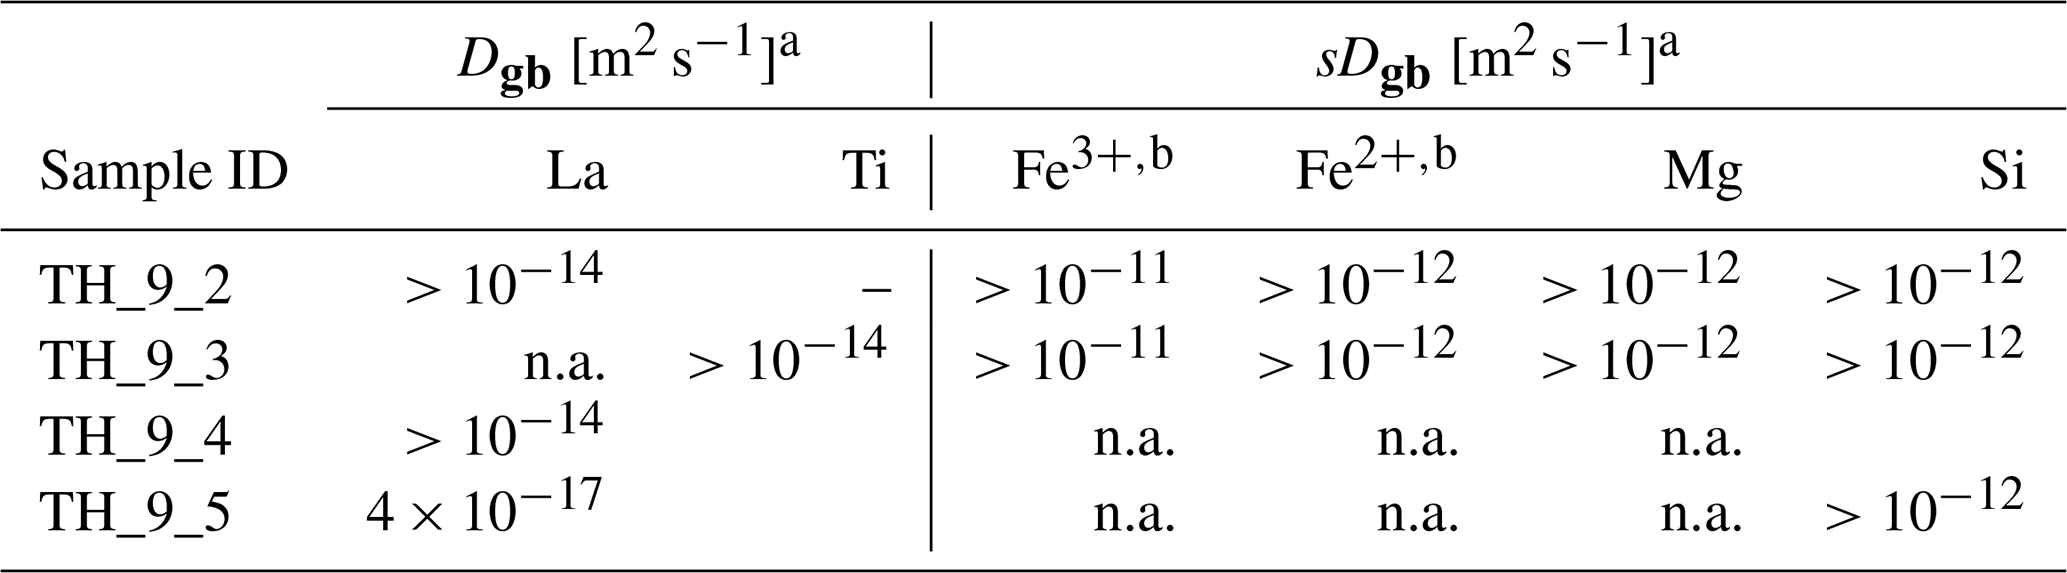
Table 3Grain boundary diffusion rates of multiple elements in YAG. The abbreviation n.a. means not assigned because the concentration is below the detection limit.
a δ=1 nm. b Fe2+/Fe3+ was not resolved.
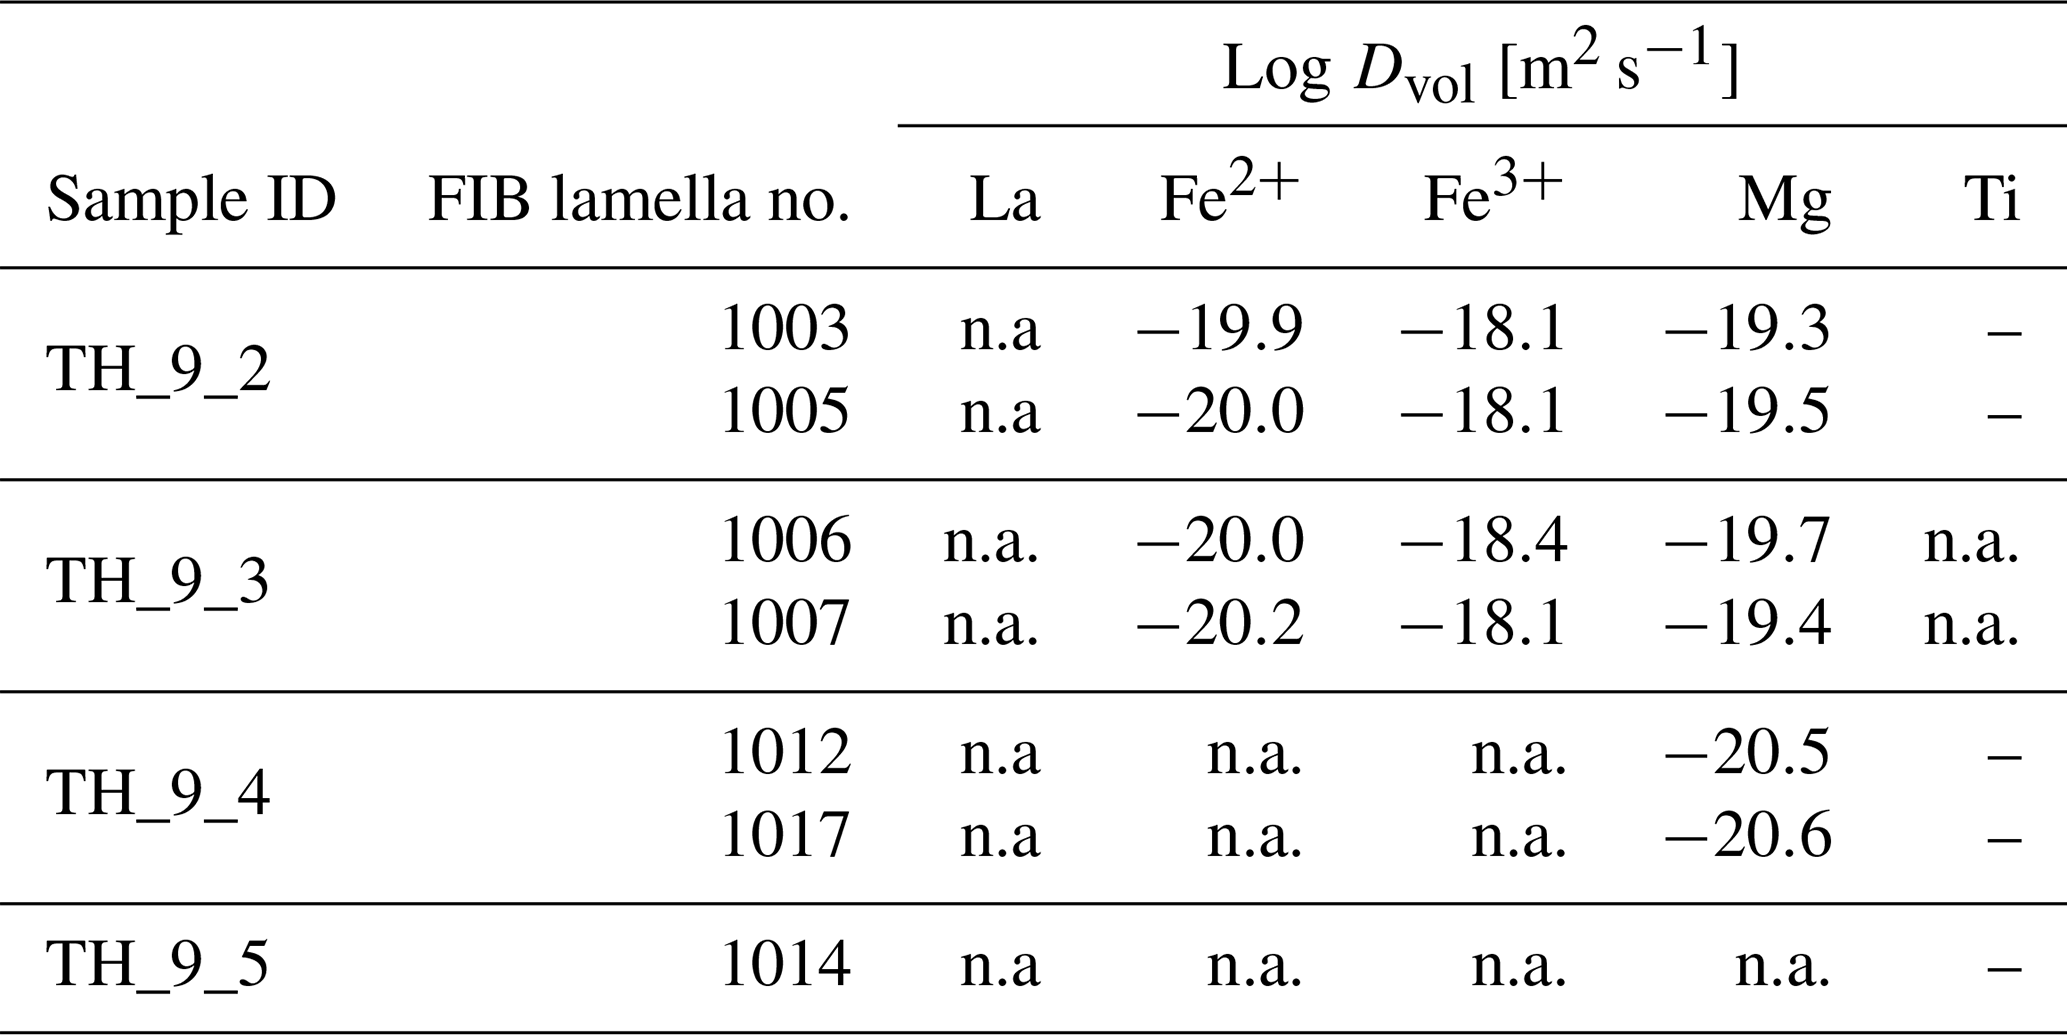
Table 4Volume diffusion rates of multiple elements in YAG. The abbreviation n.a. means not assigned because the concentration is below the detection limit.
4.3 Fitting results
The finally obtained values for Dvol and the product sDgb are summarized in Tables 3 and 4, respectively, and plotted in Fig. 10. For the elements La and Ti that segregate strongly into the grain boundary and where we do not detect any concentration profile within the crystal volume we can ignore the leakage flux (Eq. 2) from the grain boundary into the volume and simulate diffusion just within the grain boundary as a one-dimensional medium. This situation corresponds to the kinetic C regime as it was defined for diffusion in a bi-crystal by Mishin and Razumovskii (1992), in which we could directly obtain Dgb independent of s and δ. However, for samples TH_9_2 and TH_9_3 we can only estimate a minimum Dgb due to the lack of a measurable concentration gradient within the grain boundary. For the shorter experiment at 1450 ∘C we determined Dgb of La as m2 s−1, which is significantly smaller than the minimum estimate we obtain from the two longer experiments, which is m2 s−1. Because of the negligible concentration gradient of Fe, Ti, Mg, and Si within the grain boundary for the 24.1 h experiments we could again only estimate here a minimum value for the product sDgb. This minimum estimate depends on the respective volume diffusion coefficient as the leakage flux reduces the efficiency of diffusive transport along the grain boundary. Therefore, the minimum sDgb increases with increasing Dvol (Table 4).
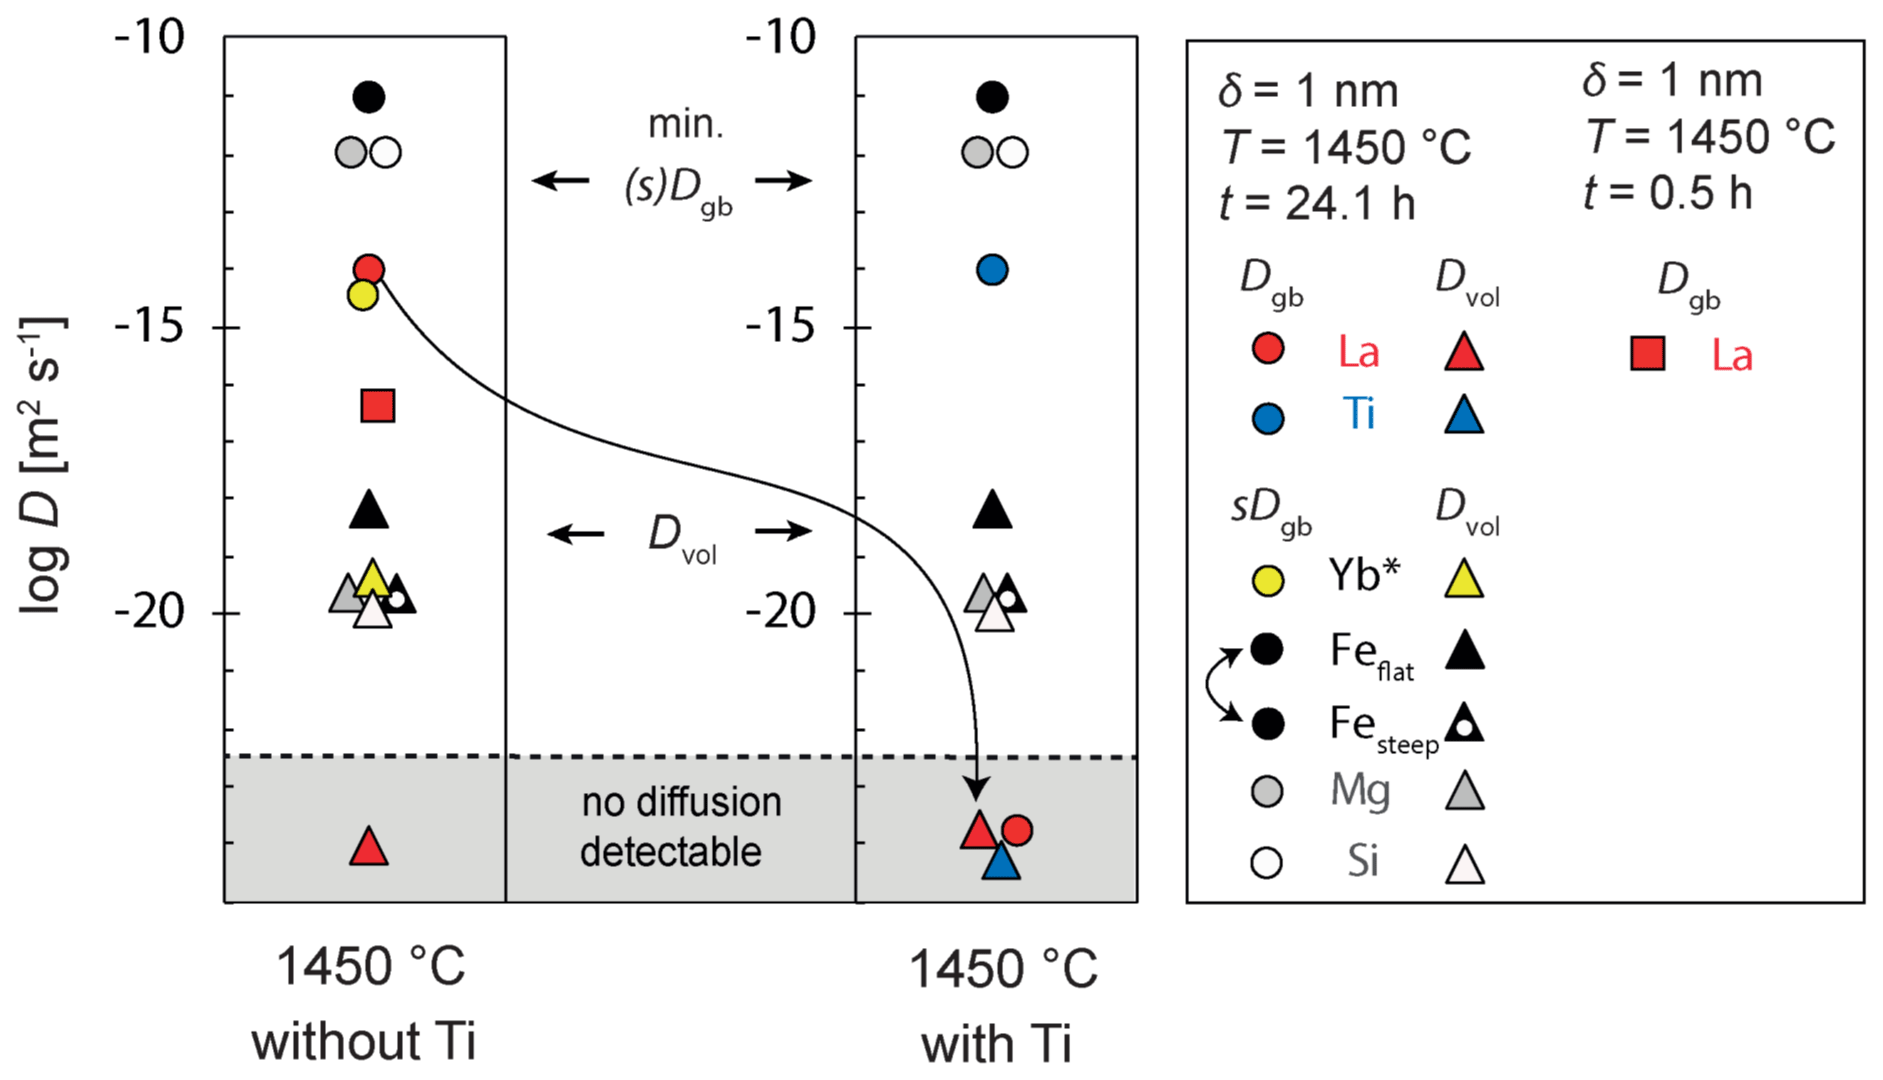
Figure 10Dvol and sDgb results at 1450 ∘C. Results from sample TH_9_2 and TH_9_3 are indicated with dots (sDgb and Dgb) and triangles (Dvol). The result from the short experiment (sample TH_9_5) is indicated with a square. For La and Ti, we could directly obtain Dgb independent of s and δ because a type-C regime was assumed. sDgb of Fe2+ and Fe3+ are not distinguishable in the measured profiles. * Yb data are from Marquardt et al. (2011a). Yb has a comparable ionic radius as Y and does not segregate at the grain boundary (s=1).
The Fe profile cannot be fitted by a constant volume diffusion coefficient as shown in Fig. 11. Instead, the steep part close to the grain boundary and the flatter part within the crystal are modeled separately. The best fit to the experimental data was obtained using two different volume diffusion coefficients, Dvol, where the two resulting profiles were subsequently summed up. (steep) yielded m2 s−1, which is similar to , while (flat) yielded m2 s−1 (Fig. 11). This diffusion profile allows differentiation between m2 s−1 and m2 s−1 – thus a diffusion rate differences of half an order of magnitude is discernable. The agreement between our model and experiment was visually evaluated. To test the sensitivity of this procedure we compared its result to the result of a least-squares error minimization procedure and obtain the same result within 0.2 log units.
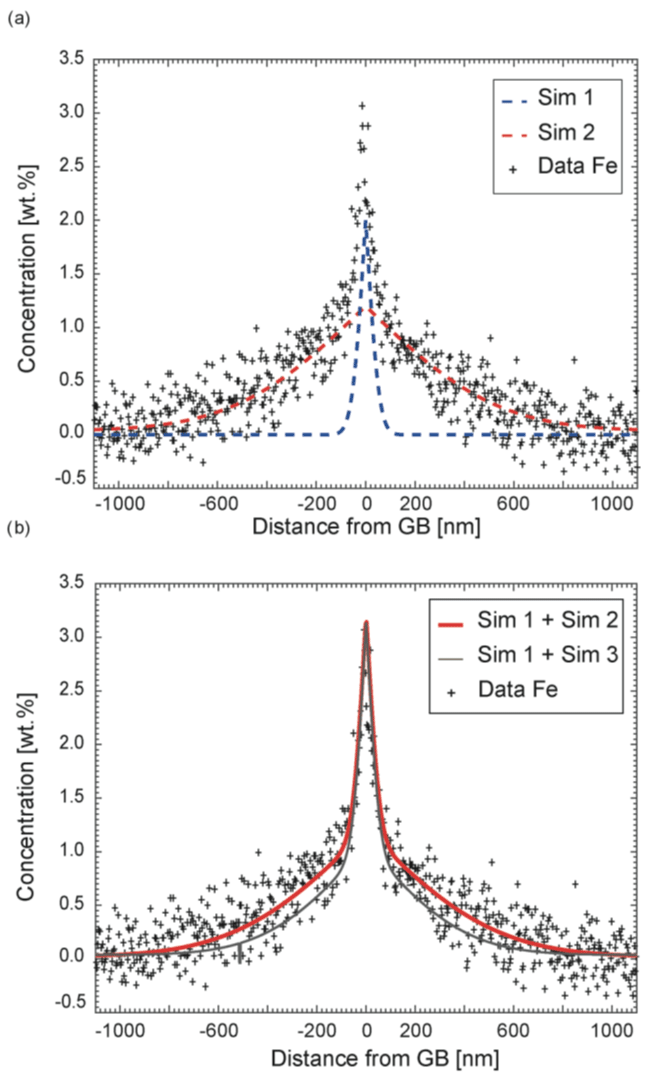
Figure 11Experimental Fe diffusion profile (TH_9_2, 1005, 1000 nm from the groove), which can be simulated only if two independent and different diffusion coefficients are assumed for iron. In all simulations shown, sDgb is fixed to 10−11 m2 s−1, whereas Dvol was varied. Sim 1: m2 s−1, Sim 2: m2 s−1, Sim 3: m2 s−1. The counting error is smaller than the symbol size. (a) A simulation with m2 s−1 (Sim 1) reproduces the steep part of the experimental profile close to the grain boundary. The flatter part of the concentration profile can be approximately fitted with m2 (Sim 2). (b) The sum of the two simulated profiles reproduces the overall Fe profile (bold red line, Sim 1 + Sim 2). Keeping all other boundary conditions constant, the two diffusion coefficients are well constrained by the quality of the fit. Another simulated profile (thin black line, Sim 1 + Sim 3) is added to illustrate the sensitivity of the visual fitting procedure. The lower profile clearly does not reproduce the data as well as the upper profile (thick, red).
5.1 Thin-film crystallization
Marquardt et al. (2011a) have shown that thin films of ytterbium aluminum garnet (YbAG) crystallize epitaxially on the YAG after 2 h at 1450 ∘C in air conditions. The solidus temperature for the La2O3–Al2O3 system is close to 1800 ∘C (Fabrichnaya et al., 2006) and significantly higher than the experimental temperatures. However, the present work shows that the La-rich films do not fully crystallize and form different microstructures depending on annealing time, temperature, and thickness of the thin film. The originally 50 nm thick thin film accumulated in the simultaneously forming groove and remained amorphous. This agrees with general observations of dewetting, where thinner films show stronger dewetting (Thompson, 2012). Other researchers made similar observations and suggested that crystallization of YAG is kinetically constrained due to its large, complex unit cell, which contains both four- and six-coordinate aluminum ions (Caslavsky and Viechnicki, 1980). The main problem here is that considerable amounts of Si, Mg, and Fe entered the film that lowered the solidus temperatures compared to the pure La2O3–Al2O3 system. For example Sadiki et al. (2006) show that the presence of SiO2 in the ternary system La2O3–Al2O3–SiO2 can lead to glass formation at 1300 ∘C at 30 wt. % SiO2 content. The presence of other elements like Fe or Mg may further reduce the eutectic melting temperature and explain why the crystallization within the groove is impeded. This theory is further supported by the observation that the thin film shows the highest degree of crystallization in the pure experiment TH_9_5, although it was only annealed for 0.5 h. Notably, this experiment developed the smallest groove, which indicates a freely proceeding crystallization. A higher melting point of the thin film and thus decreased kinetics in the amorphous phase presumably did not allow a larger groove to grow.
The structural variations of the thin film (e.g., amorphous vs. partially crystallized) do not affect the diffusion experiment or the coefficients determined in the YAG bi-crystal. Diffusion in the thin film is more efficient compared to diffusion in the crystalline lattice and hence not rate limiting. Therefore, we model the system using constant-source boundary conditions. The fact that our model can represent the diffusion as constant source shows that a variation of the source structure outside the groove has no effect on element transport, and our chosen boundary conditions are well supported. In the case where the YAG surface is not covered by the thin film (50 nm thin film), interdiffusion is taking place at the surface layer of the YAG directly with the gas phase.
5.2 Sources of impurities
The simulations for the experiments at 1450 ∘C indicate that all diffusing elements behaved as if they originated from a constant concentration source at the interface between grain boundary and source. If the concentration at this interface would have significantly changed during the experiment it should be visible in the concentration profiles along the grain boundary and other locations in the sample. The rapid supply of Fe, Si, Ti, and Mg is the result of fast surface diffusion along the YAG surface and from within the thin film after absorption from the gas phase. For the duration of the experiments, the reservoir of Fe, Mg, and Ti can be considered as infinite. Different experimental histories of the used furnace before the respective diffusion anneal resulted in different degrees of contaminations (Table 2). In addition, experiments with the thicker film show a lower degree of contamination, which could be explained by the less efficient exchange of elements from the gas phase through the film and into the grain boundary. In experiments with thinner thin films, the bi-crystals surface is directly exposed to the furnace atmosphere, and elements are more efficiently transported to the grain boundary. The lower contamination of the experiment at 1000 ∘C can be explained by the significantly lower mobilization of elements into the gas phase at the much lower temperatures. The typically high evaporation enthalpies and correspondingly low vapor phase concentrations can make the exchange rate with the gas phase inefficient compared to solid-state diffusion rates (Dohmen et al., 2003).
The thin film in all cases remained amorphous at 1450 ∘C. It behaves effectively as an infinite reservoir for La because (i) of its high concentration in the film compared to the total concentration of La within the grain boundary and (ii) no La could be detected within the lattice. The latter could be explained by either a very high segregation factor and a concentration of La below the detection limit within the crystal or a small Dvol (assuming a segregation coefficient of 1) or both.
Although thin-film thicknesses and element concentrations in the thin film and at the surface of the bi-crystal vary among the different experiments, the obtained results provide insight into the relative mobility of different elements within the grain boundary. Possible interactions of these elements and coupled diffusion mechanisms can be evaluated. These experiments show that grain boundaries can act as sinks of impurities, which can profoundly affect the diffusivities of other elements and impact the physical properties, such as sintering.
5.3 Convolution effect on element maps and determination of the segregation coefficient
Segregation occurs in the narrow region of the grain boundary of ∼1 nm in width. Therefore, idealized profiles of segregating elements across grain boundaries are very steep within the region of the grain boundary as shown in Fig. 12. Due to convolution, they appear to flatten out as was illustrated for example by Ganguly et al. (1988) for EMPA measurements of diffusion profiles. Convolution of the analytical measurement can make detection and quantification of the segregation coefficient difficult or impossible in cases where the element concentration within the crystal volume is zoned. The convolution effect is less problematic in thermodynamic equilibrium where the integration of the signal relative to the background of the crystal allows a quantification of the segregation coefficient (e.g., Hiraga and Kohlstedt, 2007). Here we evaluate for which specific situations the limited spatial resolution of our measurements still allows grain boundary segregation to be measured.
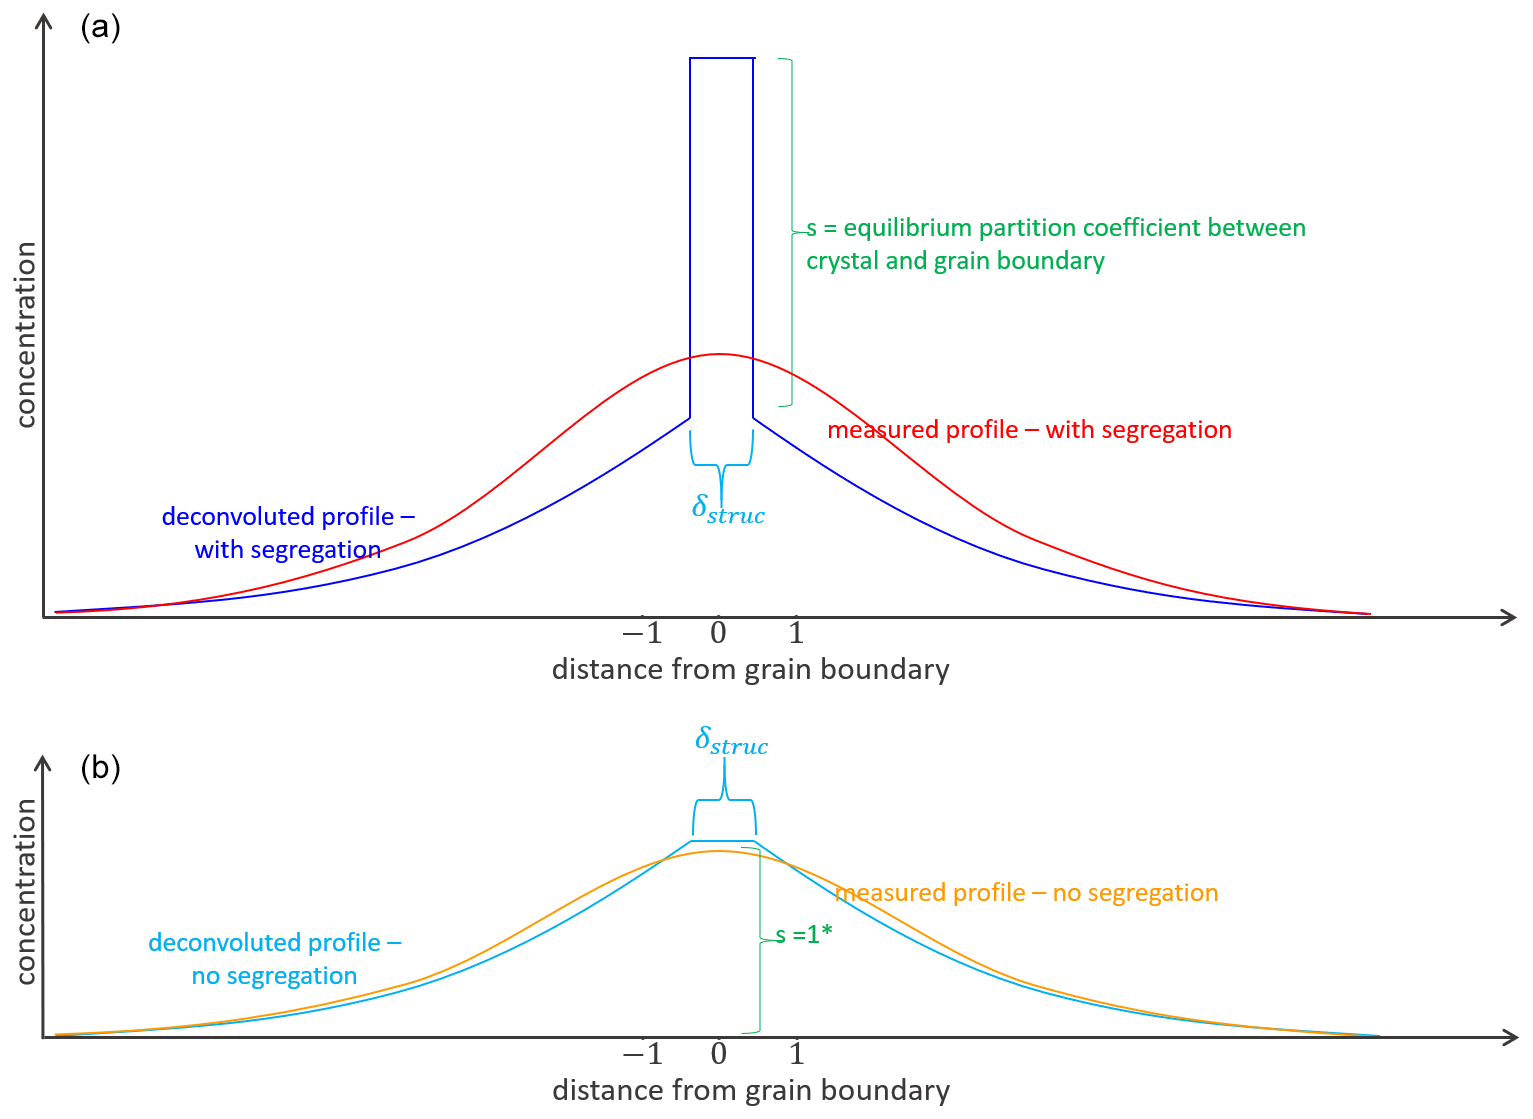
Figure 12Concept of diffusion profile shapes with segregation (a) and without segregation (b). δ: structural grain boundary width, s: segregation coefficient. The blue lines in upper and lower image illustrate idealized concentration distribution across the grain boundary without any convolution effect, the red and orange lines indicate the concentration distribution of measured profiles and show the effect of convolution, for example spatial resolution. * Analytical grain boundary diffusion solution of Whipple and Le Claire (Le Claire, 1963; Whipple, 1954); s=1.
To show the effect of convolution on diffusion profiles (Ganguly et al., 1988), we convoluted simulated diffusion profiles with a Gaussian function according to Eq. (4) in Hofmann (1994). We use a convolution parameter, σ, of 4 nm according to the pixel size of the analytical data.
Figure 13a shows that segregation and the associated kink in the diffusion profile, assuming a segregation coefficient of 2, can only be resolved if the diffusion distance in the y direction (Fig. 1) is large. When the diffusion distance is short, no kink can be resolved. As a result, segregation with small segregation coefficients cannot be determined. Therefore, long experiment durations can be advantageous for measuring segregation coefficients. While the data collected are not ideal, they still allow a range of detectable segregation coefficients to be evaluated and allow the quality of different experimental setups to be judged. In Fig. 13b we show profiles with different segregation coefficients for a constant Dvol. Note that because the measured Mg profile cannot be fitted for large s, s must be <3 for the given Dvol. We can conclude that segregation can be detected in two situations: (i) if the segregation coefficient is large enough (but still the concentrations in the volume can be detected unlike in the presented case for La) and/or (ii) if the diffusion depth in the y direction (Fig. 1) is relatively large.
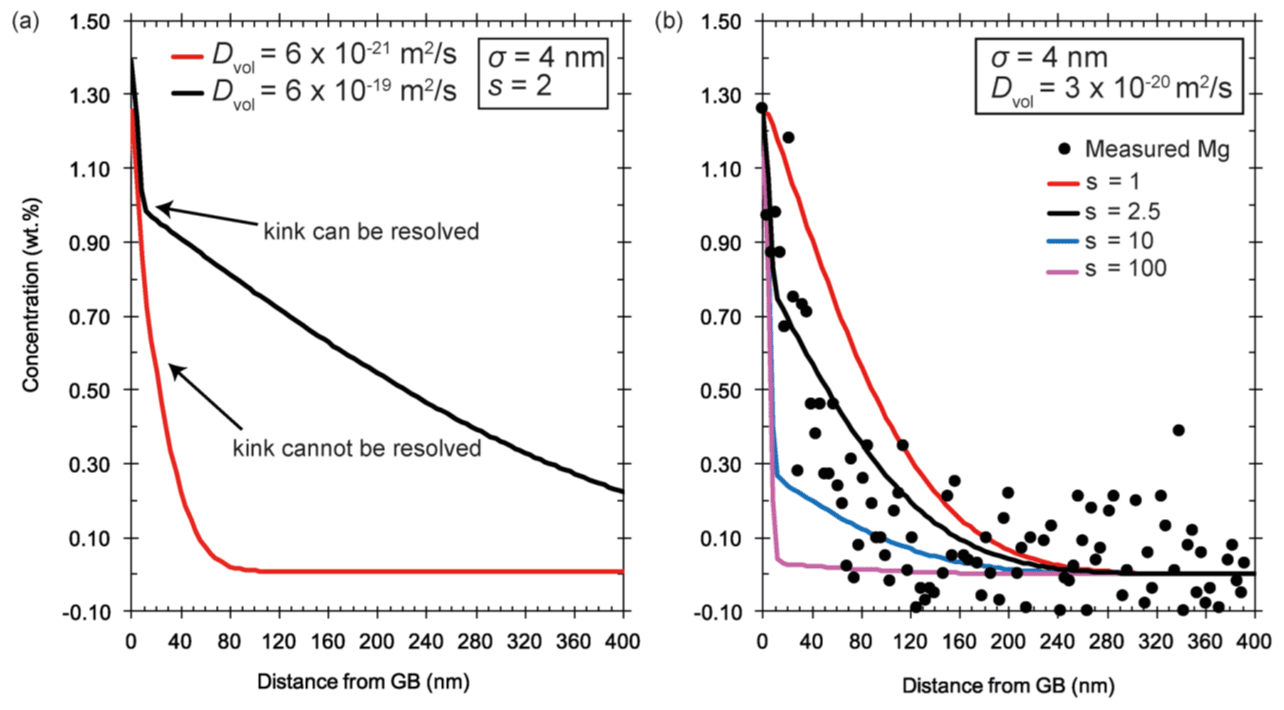
Figure 13Convoluted profiles and the effect of the profile shape on the estimation of s. (a) Small s (such as 2) can be only detected when the profile is sufficiently long. (b) The experimental Mg data (black dots) can be fitted only if s is between 2–3.
5.4 Diffusion mechanisms
YAG has a cubic structure containing three different oxygen polyhedra. Y3+ ions occupy dodecahedral sites, and Al3+ ions occupy octahedral and tetrahedral sites in the ratio of 2:3. Since the ionic radii of Y3+ ions and ions of rare-earth are relatively close,35 trivalent ions can replace Y3+ ions to a certain degree, but for La it is very limited (e.g., Muñoz-García et al., 2010). In the present case, the exchange of Y3+ by La3+ appears to be limited to the grain boundary. Other elements like Mg, Si, and Fe visibly diffused into the crystal volume. In these volume diffusion profiles, the shape of the Fe profile is different compared to the other elements. Similar profile shapes have been observed in other cases (e.g., Beyer et al., 2019) where elements diffused by two mechanisms related to two different element speciations within the materials. Here we speculated that Fe is present as Fe2+ as well as Fe3+ diffusing by different rates such that the measured profile is a combination of the respective individual profiles. Potential associated substitution mechanisms could be, as follows:
where the latter substitution is equivalent to the incorporation of a pyrope ((Mg3Al2Si3O12) or almandine (Fe3Al2Si3O12) component into the garnet. We think that this coupled diffusion of the pyrope/almandine and YAG component is reflected by the similar length of the diffusion profiles within the volume of Mg, Si, and the steep part of the Fe profile. The longer and flatter part of the Fe profile could then reflect the simple exchange with of Fe3+ with Al3+. The slower diffusion rates of the pyrope/almandine–YAG diffusion couple is reasonable since it involves diffusion of Si4+, which as a cation with higher charge is more strongly bonded than those of di- and trivalent cations (e.g., Brady and Cherniak, 2010). As a consequence, without the presence of Si in the film, elements like Mg or Fe2+ could not have diffused into the YAG volume. This hypothesis could be tested in future experiments.
5.5 Presence of Ti
The two experiments, performed under identical conditions but with different contaminants, serve as an example of the effect of Ti in the diffusion source on the grain boundary diffusion of other elements like La, Fe, and Mg. The presence of Ti in sample TH_9_3 inhibits La diffusion or segregation along the grain boundary as observed at various positions cut from the same sample. Presumably, this inhibition mechanism is related to a so-called “site competition” or mutual interactions between simultaneously segregating elements. Ti has a smaller ionic radius than La, and this facilitates a higher jump frequency at the grain boundary; thus the grain boundary sites available for segregation are more rapidly accessible for Ti than for La. Due to its high charge of 4+, multiple bonds may form within the grain boundary and thus change its structure significantly. These multiple bonds may prohibit La segregation because breaking up of these bonds might be necessary. Any atom substitution is described in relation to a perfect reference structure with defined atomic positions, volume, and charge. But, in contrast to the crystal lattice, there is no defined reference structure for most grain boundaries. Generally, grain boundaries have a higher volume and may exhibit a space-charge layer. The incorporation of Ti4+ could be a hint for charge balancing of a previously negatively charged grain boundary. Principally, the concentration of Fe3+ could affect La3+ diffusion, but in the present study, no effect was observed. However, we detected the lowest La diffusion rates in the pure experiment TH_9_5, which could indicate that the various impurities (and especially Si, which was always present as contamination) can accelerate La diffusion. This conclusion is especially intriguing if we place it in context with the idea that grain boundaries may to some extent be regarded as the transition from crystalline to amorphous (e.g., Gleiter and Chalmers, 1972; Chadwick and Smith, 1976). The more incompatible elements are present, the more the grain boundary structure might be considered amorphous, allowing for faster transport.
In summary, grain boundary diffusion and segregation processes are already described as complex for metals and alloys (e.g., Grabke, 1989; Guttmann, 1995; Hofmann, 1987; Hofmann and Leiĉek, 1996; Krasko, 1993; Seah and Lea, 1975) and appear even more complex for ceramics. These complex processes impact the material properties significantly and affect, for example, grain size, sintering temperatures (Huang and Raether, 2009), and embrittlement (Krasko, 1993). The effect on the material properties depends on the respective type of impurity. It has been speculated that the site-competition effect can be used to clean grain boundaries of “unwanted” impurities. For rock samples, a very diverse behavior of elements in grain boundaries can be expected depending on the trace and minor element composition of the sample.
5.6 Segregation and bulk diffusion
Segregation of incompatible elements into the grain boundary diffusion is relevant for the storage capacity of such elements in rocks (Hiraga and Kohlstedt, 2007) and can dominate the bulk diffusion rate in a polycrystalline material (e.g., Mishin et al., 1997; Dohmen and Milke, 2010). In addition, several studies propose that segregation decelerates grain boundary diffusion (Mütschele and Kirchheim, 1987; Nakagawa et al., 2007) or enhances element transport along the grain boundaries (Mütschele and Kirchheim, 1987). The effect of segregation on the diffusion rate could be concentration-dependent (Mütschele and Kirchheim, 1987), with high concentrations of segregated atoms leading to an increase in grain boundary diffusion of the segregating element. Our data indeed suggest an enhanced Dgb of La subsequently increasing the effective transport rate. From the short experiment at 1450 ∘C, TH_9_5, we obtain a much smaller Dgb of La = m2 s−1 compared to the longer experiments where we can infer a m2 s−1. In the later stage, the La concentration in the grain boundary is high compared to the initial state. The enhancement mechanism could be understood as (i) an initial segregation mechanism, in which La occupies all energetically favorable sites and (ii) after a critical La concentration is reached, fast transport is facilitated. The fast grain boundary diffusion rate of La appears to be not affected by co-diffusion of elements like Fe, Mg, or Si but Ti as discussed in the section before. It should be also noted that our observed grain boundary diffusion rates are much higher compared to those obtained by Marquardt et al. (2011a) for Yb–Y interdiffusion in YAG grain boundaries. At the same run conditions and the same grain boundary orientation, Dgb for Y–Yb was determined to be m2 s−1 (Fig. 10). However, in the clean La experiment TH_9_5, the La diffusion rates are 2 orders of magnitude slower than the Yb diffusion rates described by Marquardt et al. (2011a).
Due to the convolution effects of the EDX mappings (see Sect. 5.3) we can estimate only a range of segregation coefficients for Fe, Mg, and Si, which are between 2–3. We could not detect any La or Ti within the crystal volume, which could be explained by very strong segregation, meaning that the equilibrium concentration of these elements adjacent to the grain boundary is below the detection limit, or the volume diffusion coefficient was m2 s−1. It is probably a combination of a very high segregation coefficient and a low volume diffusion coefficient for La and Ti that is responsible for their negligible leakage flux perpendicular to the grain boundary.
Sintering temperatures for YAG ceramics lie around 1700–1750 ∘C (Ikesue and Aung, 2006, 2017; Taira, 2007) and are followed by an annealing step at lower temperatures, commonly at 1450 ∘C (e.g., Li et al., 2010; Liu et al., 2012). The obtained data, therefore, are of direct relevance for understanding the densification of YAG ceramics – the most important mechanism for creating translucent laser ceramics – which was found to be controlled by grain boundary diffusion at the experimental conditions of 1450–1550 ∘C (Boulesteix et al., 2009). Diffusion of impurities like La, Fe, or Mg appear to enhance the mobility of Y and Al along the grain boundary significantly (Fig. 6) when compared to experiments with Yb–Y interdiffusion. Therefore, doping with such elements might help to accelerate a grain boundary diffusion controlled sintering process.
The diffusive transport of elements (or isotopes) through a polycrystalline assemblage is dependent on the volume fraction of the grain boundaries fgb (basically determined by the grain size), Dvol, Dgb, and finally the segregation coefficient, s. A simplified formula to assign a mono-phase polycrystalline system a bulk diffusion property, Dbulk, is given by the modified relation of Hart (1957) as suggested by Mortlock (1960), which is given in the inset of Fig. 14. We could not apply this relation to estimating the bulk diffusion rates of La in YAG polycrystals as we do not know the respective s and Dvol for La. Our experimental observations, however, suggest a very high ratio of sDgb∕Dvol, and hence bulk diffusion of La should be strongly controlled by grain boundary diffusion. Assuming δ=1 nm, grain sizes >0.1 µm, and s<100, the factor 1 – sfgb≈1, and from the relation of Mortlock (1960) it follows that . If sD a significant contribution to the bulk diffusion flux comes from grain boundary diffusion. Here we illustrate in Fig. 14 with the relation of Mortlock (1960) how the ratio of Dbulk∕Dvol changes as a function of s and the grain size for a given ratio of , which we obtained for Fe using the minimum estimate for Dgb. Based on these input data we predict that bulk diffusion of impurities in polycrystalline YAG is strongly dominated by grain boundary diffusion for any realistic grain size. The resulting diffusion distance at 1450 ∘C calculated with after 10, 100, and 1000 h is 1, 3, and 10 µm for a polycrystalline aggregate with a grain size of 1 mm. The diffusion distance for a polycrystalline aggregate with a grain size of 1 µm after 10, 100, and 1000 h is 30, 100, and 320 µm.

Figure 14Dependency of Dbulk on grain size and segregation coefficient. For calculating the bulk diffusion coefficient, Dgb and Dvol from the experimentally determined Fe diffusion at 1450 ∘C were used. Dbulk is calculated according to a modified Hart equation (Hart, 1957) as suggested by Mortlock (1960). It governs the mobility of elements in a polycrystalline aggregate, and hence it controls when non-touching grains can exchange elements with each other. The equation is applicable for the type-A and type-A′ kinetic regimes.
We have successfully explored a new experimental approach to study the diffusion of impurities within grain boundaries. Due to the extremely efficient grain boundary diffusion rates concentration gradients along the grain boundary within the dimensions of the FIB lamellae were not observed. Deeper parts of the sample might be investigated by preparing several cross sections parallel to the film before sampling using the FIB technique. In future studies, the experimental durations can be optimized to obtain concentration gradients within the grain boundary. In addition, the chemical environment in the furnace can be designed to control the type of impurities incorporated into the sample.
We show that elements with low solubility in the crystal lattice can be transported with tremendous efficiency along a grain boundary. Hence, high dopant levels in the grain boundary of elements, such as La in YAG polycrystals, are easy to obtain when grain sizes are small. The effective grain boundary width in the system studied is <4 nm. Certain elements can influence segregation and diffusion behavior of other elements. For example, the presence of Ti inhibits La entering the grain boundary. In the present work, we observed for Mg and Fe a very high sDgb∕Dvol of up to 109, which results in Dbulk controlled by grain boundary diffusion. Elements like La might be transported even more efficiently due to their stronger segregation into the grain boundary.
Although this study was performed on a synthetic bi-crystal of YAG, our general observations seem applicable to garnet and other minerals.
Data sets underlying this research are available upon request.
KM conceptualized the research, obtained the funding, and administrated and supervised the research activity. KM designed and prepared the YAG bi-crystal. RD supervised the thin-film depositions by pulsed laser ablation. KM and JP carried out the pulsed laser depositions at RUB, supported by RD. JP designed the diffusion experiments and carried them out. RD developed the model code and JP performed the simulations. KM and JP analyzed the data with TEM. JP, RD, and KM validated the overall reproducibility of results. JP prepared the paper with contributions from all co-authors.
The authors declare that they have no conflict of interest.
This paper is the result of the experiments and analysis carried out by Joana Polednia, Ralf Dohmen, and Katharina Marquardt at Ruhr-Universität Bochum, Germany; Bayerisches Geoinstitut, Bayreuth, Germany; and Imperial College London, respectively. However, the paper does not purport to represent the views or the official policy of any member of these institutes.
We acknowledge support by the German Science Foundation through grant MA 6287/3 to Katharina Marquardt and INST 91/315-1 FUGG to Daniel J. Frost. Joana Polednia thanks the German Mineralogical Society for travel support, and Schreiber & Knödler for supporting the TEM lamellae preparation.
The funding was obtained through the Deutsche Forschungsgemeinschaft (DFG) (grant no. MA 6287/3-1).
This paper was edited by Monika Koch-Müller and reviewed by Jibamitra Ganguly and one anonymous referee.
Beyer, C., Dohmen, R., Rogalla, D., Becker, H. W., Marquardt, K., Vollmer, C., Hagemann, U., Hartmann, N., and Chakraborty, S.: Lead diffusion in CaTiO3: A combined study using Rutherford backscattering and TOF-SIMS for depth profiling to reveal the role of lattice strain in diffusion processes, Am. Mineral., 104, 557–568, https://doi.org/10.2138/am-2019-6730, 2019.
Boulesteix, R., Maître, A., Baumard, J. F., Rabinovitch, Y., Sallé, C., Weber, S., and Kilo, M.: The effect of silica doping on neodymium diffusion in yttrium aluminum garnet ceramics: implications for sintering mechanisms, J. Eur. Ceram. Soc., 29, 2517–2526, https://doi.org/10.1016/j.jeurceramsoc.2009.03.003, 2009.
Brady, J. B. and Cherniak D. J.: Diffusion in Minerals: An Overview of Published Experimental Diffusion Data, Rev. Mineral. Geochem., 72, 899–920, https://doi.org/10.2138/rmg.2010.72.20, 2010.
Bruker Nano GmbH: QUANTAX Microanalysis based on energy-dispersive spectrometry, User Manual, Bruker Nano GmbH, Berlin, Germany, 2011.
Campell, G. H.: Σ5 (210)/[001] Symmetric tilt grain boundary in yttrium aluminum garnet, J. Am. Ceram. Soc., 79, 2883–2891, https://doi.org/10.1111/j.1151-2916.1996.tb08722.x, 1996.
Caslavsky, J. L. and Viechnicki, D. J.: Melting behaviour and metastability of yttrium aluminium garnet (YAG) and YAlO3 determined by optical differential thermal analysis, J. Mater. Sci., 15, 1709–1718, https://doi.org/10.1007/BF00550589, 1980.
Chadwick, G. A. and Smith, D. A. (Eds.): Grain boundary structure and properties. Academic Press, London/ New York/ San Francisco, 1976.
Cheo, P. K. (Ed.): Handbook of Solid-State Lasers, CRC Press, New York, 1988.
Cherniak, D. J.: Rare earth element and gallium diffusion in yttrium aluminum garnet, Phys. Chem. Miner., 26, 156–163, https://doi.org/10.1007/s002690050172, 1998.
Cheung, T. J. and Sankur, H.: Growth of thin films by laser-induced evaporation, Crit. Rev. Solid State Mater. Sci., 15, 63–109, https://doi.org/10.1080/10408438808244625, 1988.
Crank, J.: The Mathematics of Diffusion, Oxford University Press, New York, 1975.
Czochralski, J.: Ein neues Verfahren zur Messung der Kristallisationsgeschwindigkeit der Metalle, Zeitschrift für Phys. Chemie, 92U, 219–221, https://doi.org/10.1515/zpch-1918-9212, 1918.
de Jong, A. F. and Van Dyck, D.: Ultimate resolution and information in electron microscopy II. The information limit of transmission electron microscopes, Ultramicroscopy, 49, 66–80, https://doi.org/10.1016/0304-3991(93)90213-H, 1993.
De With, G. and van Dijk, H. J. A.: Translucent Y3Al5O12 ceramics, Mater. Res. Bull., 19, 1669–1674, https://doi.org/10.1016/0025-5408(84)90245-9, 1984.
Dohmen, R. and Chakraborty, S.: Mechanism and kinetics of element and isotopic exchange mediated by a fluid phase, Am. Mineral., 88, 1251–1270, https://doi.org/10.2138/am-2003-8-908, 2003.
Dohmen, R. and Milke, R.: Diffusion in polycrystalline materials: grain boundaries, Mathematical Models, and Experimental Data, Rev. Mineral. Geochem., 72, 921–970, https://doi.org/10.2138/rmg.2010.72.21, 2010.
Dohmen, R., Becker, H.-W., Meißner, E., Etzel, T., and Chakraborty, S.: Production of silicate thin films using pulsed laser deposition (PLD) and applications to studies in mineral kinetics, Eur. J. Mineral., 14, 1155–1168, https://doi.org/10.1127/0935-1221/2002/0014-1155, 2002.
Dohmen, R., Chakraborty, S., Palme, H., and Rammensee, W.: Role of element solubility on the kinetics of element partitioning: In situ observations and a thermodynamic kinetic model. J. Geophys. Res.-Sol. Ea., 108, 2157, https://doi.org/10.1029/2001JB000587, 2003.
Drouin, D., Couture, A. R., Joly, D., Tastet, X., Aimez, V., and Gauvin, R.:, CASINO V2.42 – A Fast and Easy‐to‐use Modeling Tool for Scanning Electron Microscopy and Microanalysis Users, Scanning, 29, 92–101, https://doi.org/10.1002/sca.20000, 2007.
Esin, V. A. and Bokstein, B. S.: Effect of atomic interaction on grain boundary diffusion in the B regime, Acta Mater., 60, 5109–5116, https://doi.org/10.1016/j.actamat.2012.06.011, 2012.
Fabrichnaya, O., Zinkevich, M., and Aldinger, F.: Thermodynamic assessment of the systems La2O3-Al2O3 and La2O3-Y2O3, Int. J. Mater. Res., 97, 1495–1501, https://doi.org/10.3139/146.101411, 2006.
Fisher, J. C.: Calculation of diffusion penetration curves for surface and grain boundary diffusion, J. Appl. Phys., 22, 74–77, https://doi.org/10.1063/1.1699825, 1951.
Fujioka, K., Sugiyama, A., Fujimoto, Y., Kawanaka, J., and Miyanaga, N.: Ion diffusion at the bonding interface of undoped YAG/Yb:YAG composite ceramics, Opt. Mater., 46, 542–547, https://doi.org/10.1016/j.optmat.2015.05.023, 2015.
Ganguly, J., Bhattacharya, R. N., and Chakraborty, S.: Convolution effect in the determination of compositional profiles and diffusion coefficients by microprobe step scans, Am. Mineral., 73, 901–909, 1988.
Geusic, J. E., Marcos, H. M., and Van Uitert, L. G.: Laser oscillations in Nd-doped yttrium aluminum, yttrium gallium and gadolinium garnets, Appl. Phys. Lett., 4, 182–184, https://doi.org/10.1063/1.1753928, 1964.
Gibbs, G. B.: Grain boundary impurity diffusion, Phys. status solidi, 16, K27–K29, https://doi.org/10.1002/pssb.19660160143, 1966.
Gleiter, H. and Chalmers, B.: Grain-boundary diffusion, Prog. Mater. Sci., 16, 77–112, 1972.
Goldstein, J. I.: Quantitative X-ray analysis in the electron microscope, Scanning Electron Microsc., 3rd edn., 315–324, ISBN 978-1-4615-0215-9, 1977.
Gösele, U., Tong, Q.-Y., Schumacher, A., Kräuter, G., Reiche, M., Plößl, A., Kopperschmidt, P., Lee, T.-H., and Kim, W.-J.: Wafer bonding for microsystems technologies, Sensors Actuators A Phys., 74, 161–168, https://doi.org/10.1016/S0924-4247(98)00310-0, 1999.
Grabke: Surface and grain boundary segregation on and in iron and steels, ISIJ Int., 29, 529–538, https://doi.org/10.2355/isijinternational.29.529, 1989.
Guttmann, M.: Thermochemical interactions versus site competition in grain boundary segregation and embrittlement in multicomponent systems, Le J. Phys. IV, 5, 85–96, https://doi.org/10.1051/jp4:1995707, 1995.
Haneda, H., Miyazawa, Y., and Shirasaki, S.: Oxygen diffusion in single crystal yttrium aluminum garnet, J. Cryst. Growth, 68, 581–588, https://doi.org/10.1016/0022-0248(84)90465-2, 1984.
Hart, E. W.: On the role of dislocations in bulk diffusion, Acta Metall., 5, 597, https://doi.org/10.1016/0001-6160(57)90127-X, 1957.
Hartmann, K., Wirth, R., and Heinrich, W.: Synthetic near Σ5 (210)/[100] grain boundary in YAG fabricated by direct bonding: Structure and stability, Phys. Chem. Miner., 37, 291–300, https://doi.org/10.1007/s00269-009-0333-z, 2010.
Hayden, L. A. and Watson, E. B.: A diffusion mechanism for core–mantle interaction, Nature, 450, 709–711, 2007.
Hayden, L. A. and Watson, E. B.: Grain boundary mobility of carbon in Earth's mantle: a possible carbon flux from the core, P. Natl. Acad. Sci. USA, 105, 8537–8541, 2008.
Heinemann, S., Wirth, R., Gottschalk, M., and Dresen, G.: Synthetic [100] tilt grain boundaries in forsterite: 9.9 to 21.5∘, Phys. Chem. Miner., 32, 229–240, https://doi.org/10.1007/s00269-005-0448-9, 2005.
Herzig, C. and Mishin, Y.: Grain boundary diffusion in metals, in: Diffusion in condensed Matter, edited by: Heitjans, P. and Kärger, J., Springer-Verlag, Berlin, Heidelberg, Germany, 337–366, 2005.
Hiraga, T. and Kohlstedt, D. L.: Equilibrium interface segregation in the diopside-forsterite system I: Analytical techniques, thermodynamics, and segregation characteristics, Geochim. Cosmochim. Ac., 71, 1266–1280, https://doi.org/10.1016/j.gca.2006.11.019, 2007.
Hiraga, K., Yasuda, H. Y., and Sakka, Y.: The tensile creep behavior of superplastic tetragonal zirconia doped with small amounts of SiO2, Mater. Sci. Eng. A, 234–236, 1026–1029, https://doi.org/10.1016/S0921-5093(97)00339-0, 1997.
Hiraga, T., Anderson, I. M., and Kohlstedt, D. L.: Chemistry of grain boundaries in mantle rocks, Am. Mineral., 88, 1015–1019, https://doi.org/10.1038/nature02259, 2003.
Hiraga, T., Anderson, I. M., and Kohlstedt, D. L.: Grain boundaries as reservoirs of incompatible elements in the Earth's mantle, Nature, 427, 699–703, https://doi.org/10.1038/nature02259, 2004.
Hiraga, T., Hirschmann, M. M., and Kohlstedt, D. L.: Equilibrium interface segregation in the diopside-forsterite system II: Applications of interface enrichment to mantle geochemistry, Geochim. Cosmochim. Ac., 71, 1281–1289, https://doi.org/10.1016/j.gca.2006.11.020, 2007.
Hofmann, S.: Thermodynamics of interfacial segregation in metals and ceramics, J. Chim. Phys., 84, 141–147, https://doi.org/10.1051/jcp/1987840141, 1987.
Hofmann, S.: Atomic mixing, surface roughness and information depth in high-resolution AES depth profiling of a GaAs/AlAs superlattice structure, Surf. Interface Anal., 21, 673–678, https://doi.org/10.1002/sia.740210912, 1994.
Hofmann, S. and Leiĉek, P.: Solute segregation at grain boundaries, Interface Sci., 3, 241–267, https://doi.org/10.1007/BF00194704, 1996.
Holloway, W. W. and Kestigian, M.: Optical properties of cerium-activated garnet crystals, J. Opt. Soc. Am., 59, 60–63, https://doi.org/10.1364/JOSA.59.000060, 1969.
Huang, X. and Raether, F.: Role of impurities in the sintering behavior and properties of lead zirconate titanate ceramics, J. Am. Ceram. Soc., 92, 2011–2016, https://doi.org/10.1111/j.1551-2916.2009.03155.x, 2009.
Ikesue, A. and Aung, Y. L.: Synthesis and performance of advanced ceramic lasers, J. Am. Ceram. Soc., 89, 1936–1944, https://doi.org/10.1111/j.1551-2916.2006.01043.x, 2006.
Ikesue, A. and Aung, Y. L.: Ceramic laser materials, Nat. Photonics, 2, 721–727, https://doi.org/10.1038/nphoton.2008.243, 2008.
Ikesue, A. and Aung, Y. L.: Synthesis of Yb:YAG ceramics without sintering additives and their performance, J. Am. Ceram. Soc., 100, 26–30, https://doi.org/10.1111/jace.14588, 2017.
Ikesue, A., Kinoshita, T., Kamata, K., and Yoshida, K.: Fabrication and optical properties of high-performance polycrystalline Nd:YAG ceramics for solid-state lasers, J. Am. Ceram. Soc., 78, 1033–1040, https://doi.org/10.1111/j.1151-2916.1995.tb08433.x, 1995.
Ikesue, A., Aung, Y. L., Taira, T., Kamimura, T., Yoshida, K., and Messing, G. L.: Progress in ceramic lasers, Annu. Rev. Mater. Res., 36, 397–429, https://doi.org/10.1146/annurev.matsci.36.011205.152926, 2006.
Ikuhara, Y., Yoshida, H., and Sakuma, T.: Impurity effects on grain boundary strength in structural ceramics, Mater. Sci. Eng. A, 319–321, 24–30, https://doi.org/10.1016/S0921-5093(01)01035-8, 2001.
Irifune, T., Kawakami, K., Arimoto, T., Ohfuji, H., Kunimoto, T., and Shinmei, T.: Pressure-induced nano-crystallization of silicate garnets from glass, Nat. Commun., 7, 13753, https://doi.org/10.1038/ncomms13753, 2016.
Jiménez-Melendo, M., Haneda, H., and Nozawa, H.: Ytterbium cation diffusion in yttrium aluminum garnet (YAG) – implications for creep mechanisms, J. Am. Ceram. Soc., 84, 2356–2360, https://doi.org/10.1111/j.1151-2916.2001.tb01014.x, 2004.
Kaur, I., Mishin, Y., and Gust, W. (Eds.): Fundamentals of grain and interphase boundary diffusion, Wiley, Chichester, UK, 1995.
Kingery, W. D.: Plausible concepts necessary and sufficient for interpretation of ceramic grain-boundary phenomena: II, solute segregation, grain-boundary diffusion, and general discussion, J. Am. Ceram. Soc., 57, 74–83, https://doi.org/10.1111/j.1151-2916.1974.tb10818.x, 1974.
Klimm, D., Ganschow, S., Pajączkowska, A., and Lipińska, L.: On the solubility of Nd3+ in Y3Al5O12, J. Alloys Compd., 436, 204–208, https://doi.org/10.1016/j.jallcom.2006.07.001, 2007.
Korzhik, M. V., Livshits, M. G., Minkov, B. I., and Pavlenko, V. B.: Influence of Fe3+ impurity ions on the lasing characteristics of crystals, Sov. J. Quantum Electron., 22, 24–26, https://doi.org/10.1070/QE1992v022n01ABEH003328, 1992.
Kramers, H. A.: XCIII. On the theory of X-ray absorption and of the continuous X-ray spectrum, London, Edinburgh, Dublin Philos. Mag. J. Sci., 46, 836–871, https://doi.org/10.1080/14786442308565244, 1923.
Krasko, G. L.: Site competition effect of impurities and grain boundary stability in iron and tungsten, Scr. Metall. Mater., 28, 1543–1548, https://doi.org/10.1016/0956-716X(93)90589-K, 1993.
Kvapil, J., Kvapil, J., Kubelka, J., and Autrata, R.: The role of iron ions in YAG and YAP, Cryst. Res. Technol., 18, 127–131, https://doi.org/10.1002/crat.2170180120, 1983.
Le Claire, A. D.: The analysis of grain boundary diffusion measurements, Br. J. Appl. Phys., 14, 351–356, https://doi.org/10.1088/0508-3443/14/6/317, 1963.
Li, Y., Zhou, S., Lin, H., Hou, X., Li, W., Teng, H., and Jia, T.: Fabrication of Nd:YAG transparent ceramics with TEOS, MgO and compound additives as sintering aids, J. Alloys Compd., 502, 225–230, https://doi.org/10.1016/j.jallcom.2010.04.151, 2010.
Li, Z., Liu, B., Wang, J., Sun, L., Wang, J., and Zhou, Y.: Mechanism of intrinsic point defects and oxygen diffusion in yttrium aluminum garnet: First-principles investigation, J. Am. Ceram. Soc., 95, 3628–3633, https://doi.org/10.1111/j.1551-2916.2012.05440.x, 2012.
Linares, R. C.: Growth of garnet laser crystals, Solid State Commun., 2, 229–231, https://doi.org/10.1016/0038-1098(64)90369-2, 1964.
Liu, W., Li, J., Jiang, B., Zhang, D., and Pan, Y.: Effect of La2O3 on microstructures and laser properties of Nd:YAG ceramics, J. Alloys Compd., 512, 1–4, https://doi.org/10.1016/j.jallcom.2011.09.038, 2012.
Marfunin, A. S. (Ed.): Spectroscopy, Luminescence and Radiation Centers in Minerals, Springer-Verlag, Berlin, Heidelberg, 1979.
Marquardt, K., Petrishcheva, E., Abart, R., Gardés, E., Wirth, R., Dohmen, R., Becker, H.-W., and Heinrich, W.: Volume diffusion of ytterbium in YAG: thin-film experiments and combined TEM-RBS analysis, Phys. Chem. Miner., 37, 751–760, https://doi.org/10.1007/s00269-010-0373-4, 2010.
Marquardt, K., Petrishcheva, E., Gardés, E., Wirth, R., Abart, R., and Heinrich, W.: Grain boundary and volume diffusion experiments in yttrium aluminium garnet bicrystals at 1,723 K: a miniaturized study, Mineral. Petrol., 162, 739–749, https://doi.org/10.1007/s00410-011-0622-7, 2011a.
Marquardt, K., Ramasse, Q. M., Kisielowski, C., and Wirth, R.: Diffusion in yttrium aluminium garnet at the nanometer-scale: Insight into the effective grain boundary width, Am. Mineral., 96, 1521–1529, https://doi.org/10.2138/am.2011.3625, 2011b.
Mei, S. and Kohlstedt, D. L.: Influence of water on plastic deformation of olivine aggregates: 1. Diffusion creep regime, J. Geophys. Res.-Sol. Ea., 105, 21457–21469, https://doi.org/10.1029/2000JB900179, 2000.
Meissner, E., Sharp, T. G., and Chakraborty, S.: Quantitative measurement of short compositional profiles using analytical transmission electron microscopy, Am. Mineral., 83, 546–552, https://doi.org/10.2138/am-1998-5-614, 1998.
Mishin, Y. and Herzig, C.: Grain boundary diffusion: recent progress and future research, Mater. Sci. Eng. A, 260, 55–71, https://doi.org/10.1016/S0921-5093(98)00978-2, 1999.
Mishin, Y. M. and Razumovskii, I. M.: Analysis of an asymmetrical model for boundary diffusion, Acta Metall. Mater., 40, 597–606, https://doi.org/10.1016/0956-7151(92)90409-8, 1992.
Mishin, Y., Herzig, C., Bernardini, J., and Gust, W.: Grain boundary diffusion: fundamentals to recent developments, Int. Mater. Rev., 42, 155–178, https://doi.org/10.1179/095066097790093226, 1997.
Mortlock, A. J.: The effect of segregation on the solute diffusion enhancement due to the presence of dislocations, Acta Metall., 8, 132–134, https://doi.org/10.1016/0001-6160(60)90099-7, 1960.
Müller, G.: Review: The Czochralski method – Where we are 90 years after Jan Czochralski's invention, Cryst. Res. Technol., 42, 1150–1161, https://doi.org/10.1002/crat.200711001, 2007.
Muñoz-García, A. B., Pascual, J. L., Barandiarán, Z., and Seijo, L.: Structural effects and 4f-5d transition shifts induced by la codoping in Ce-doped yttrium aluminum garnet: First-principles study, Phys. Rev. B, 82, 1–8, https://doi.org/10.1103/PhysRevB.82.064114, 2010.
Mütschele, T. and Kirchheim, R.: Segregation and diffusion of hydrogen in grain boundaries of palladium, Scr. Metall., 21, 135–140, https://doi.org/10.1016/0036-9748(87)90423-6, 1987.
Nakagawa, T., Sakaguchi, I., Shibata, N., Matsunaga, K., Mizoguchi, T., Yamamoto, T., Haneda, H., and Ikuhara, Y.: Yttrium doping effect on oxygen grain boundary diffusion in α-Al2O3, Acta Mater., 55, 6627–6633, https://doi.org/10.1016/j.actamat.2007.08.016, 2007.
Overwijk, M. H. F.: Novel scheme for the preparation of transmission electron microscopy specimens with a focused ion beam, J. Vac. Sci. Technol. B, 11, 2021–2024, https://doi.org/10.1116/1.586537, 1993.
Peters, M. I. and Reimanis, I. E.: Grain boundary grooving studies of yttrium aluminum garnet (YAG), J. Am. Ceram. Soc., 72, 2002–2004, https://doi.org/10.1111/j.1151-2916.2003.tb03390.x, 2003.
Phaneuf, M. W.: Applications of focused ion beam microscopy to materials science specimens, Micron, 30, 277–288, https://doi.org/10.1016/S0968-4328(99)00012-8, 1999.
Plößl, A. and Kräuter, G.: Wafer direct bonding: Tailoring adhesion between brittle materials, Mater. Sci. Eng. R Reports, 25, 1–88, https://doi.org/10.1016/S0927-796X(98)00017-5, 1999.
Prasad, N. S., Trivedi, S., Kutcher, S., Wang, C.-C., Kim, J.-S., Hommerich, U., Shukla, V., and Sadangi, R.: Development of ceramic solid state laser host materials, in: Proceedings Volume 7193, Solid State Lasers XVIII: Technology and Devices, edited by: Clarkson, W. A., Hodgson, N., and Shori, R. K., Proc. SPIE 7193, Solid State Lasers XVIII: Technology and Devices, 71931X (28 February 2009), p. 71931X, https://doi.org/10.1117/12.813785, 2009.
Raabe, D., Herbig, M., Sandlöbes, S., Li, Y., Tytko, D., Kuzmina, M., Ponge, D., and Choi, P. P.: Grain boundary segregation engineering in metallic alloys: A pathway to the design of interfaces, Curr. Opin. Solid State Mater. Sci., 18, 253–261, https://doi.org/10.1016/j.cossms.2014.06.002, 2014.
Reiche, M.: Semiconductor wafer bonding, Phys. status solidi, 203, 747–759, https://doi.org/10.1002/pssa.200564509, 2006.
Robertson, J. M., van Tol, M. W., Smits, W. H., and Heynen, J. P. H.: Colorshift of the Ce3+ emission in monocrystalline epitaxially grown garnet layers, Philips J. Res., 36, 15–30, 1981.
Ronchi, V.: Forty years of history of a grating interferometer, Appl. Optics, 3, 437, https://doi.org/10.1364/AO.3.000437, 1964.
Sadiki, N., Coutures, J. P., Fillet, C., and Dussossoy, J. L.: Crystallization of lanthanum and yttrium aluminosilicate glasses, J. Nuclear Mater., 348, 70–78, https://doi.org/10.1016/j.jnucmat.2005.09.003, 2006.
Sakaguchi, I., Haneda, H., Tanaka, J., and Yanagitani, T.: Effect of composition on the oxygen tracer diffusion in transparent yttrium aluminium garnet (YAG) ceramics, J. Am. Ceram. Soc., 79, 1627–1632, https://doi.org/10.1111/j.1151-2916.1996.tb08774.x, 1996.
Sanghera, J., Kim, W., Villalobos, G., Shaw, B., Baker, C., Frantz, J., Sadowski, B., and Aggarwal, I.: Ceramic Laser Materials, Materials, 5, 258–277, https://doi.org/10.3390/ma5020258, 2012.
Sankur, H. and Hall, R. L.: Thin-film deposition by laser-assisted evaporation, Appl. Optics, 24, 3343–3347, https://doi.org/10.1364/AO.24.003343, 1985.
Schlossmacher, P., Klenov, D. O., Freitag, B., Von Harrach, S., and Steinbach, A.: Nanoscale chemical compositional analysis with an innovative S/TEM-EDX system, Microsc. Anal. Nanotechnol. Suppl., 24, S5–S8, 2010.
Seah, M. P. and Lea, C.: Surface segregation and its relation to grain boundary segregation, Philos. Mag., 31, 627–645, https://doi.org/10.1080/14786437508226543, 1975.
Sekita, M., Haneda, H., Shirasaki, S., and Yanagitani, T.: Optical spectra of undoped and rare-earth-(=Pr, Nd, Eu, and Er) doped transparent ceramic Y3Al5O12, J. Appl. Phys., 69, 3709–3718, https://doi.org/10.1063/1.348959, 1991.
Shannon, R. D.: Revised effective ionic radii and systematic studies of interatomic distances in halides and chalcogenides, Acta Crystallogr. Sect. A, 32, 751–767, https://doi.org/10.1107/S0567739476001551, 1976.
Taira, T.: RE3+-ion-doped YAG ceramic lasers, IEEE J. Sel. Top. Quantum Electron., 13, 798–809, https://doi.org/10.1109/JSTQE.2007.897174, 2007.
Thompson, C. V.: Solid-state dewetting of thin films, Annu. Rev. Mater. Res., 42, 399–434, https://doi.org/10.1146/annurev-matsci-070511-155048, 2012.
Tong, Q. Y., Gösele, U., Martini, T., and Reiche, M.: Ultrathin single-crystalline silicon on quartz (SOQ) by 150 ∘C wafer bonding, Sensors Actuators A Phys., 48, 117–123, https://doi.org/10.1016/0924-4247(94)00984-P, 1995.
Van Cappellen, E. and Doukhan, J. C.: Quantitative transmission X-ray microanalysis of ionic compounds, Ultramicroscopy, 53, 343–349, https://doi.org/10.1016/0304-3991(94)90047-7, 1994.
Van Dyck, D. and de Jong, A. F.: Ultimate resolution and information in electron microscopy: general principles, Ultramicroscopy, 47, 266–281, https://doi.org/10.1016/0304-3991(92)90202-U, 1992.
Whipple, R. T. P.: Concentration contours in grain boundary diffusion, London, Edinburgh, Dublin Philos. Mag. J. Sci., 45, 1225–1236, https://doi.org/10.1080/14786441208561131, 1954.
Wirth, R.: Focused Ion Beam (FIB): A novel technology for advanced application of micro- and nanoanalysis in geosciences and applied mineralogy, Eur. J. Mineral., 16, 863–876, https://doi.org/10.1127/0935-1221/2004/0016-0863, 2004.
Yasuda, S., Yoshida, H., Yamamoto, T., and Sakuma, T.: Improvement of high-temperature creep resistance in polycrystalline Al2O3 by cations co-doping, Mater. Trans., 45, 2078–2082, https://doi.org/10.2320/matertrans.45.2078, 2004.
Zisner, T. and Tagai, H.: High-temperature creep of polycrystalline magnesia: I, effect of simultaneous grain growth, J. Am. Ceram. Soc., 51, 303–310, https://doi.org/10.1111/j.1151-2916.1968.tb15943.x, 1968.