the Creative Commons Attribution 4.0 License.
the Creative Commons Attribution 4.0 License.
 | 21 Sep 2026
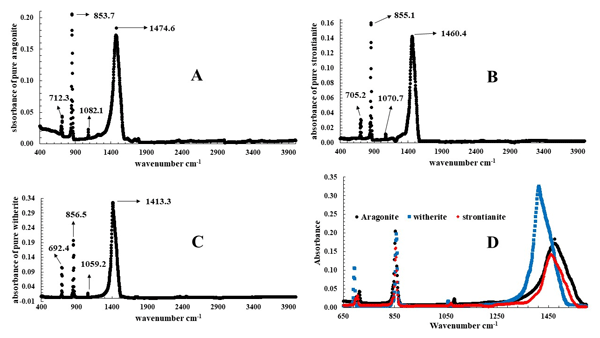
Quantitative analysis of aragonite-group carbonates synthetic mixtures using attenuated total reflection Fourier transform infrared
Mahmoud Alkhatib
Nabil Thabteh
Fuad Al-Rimawi

Aragonite is the second most abundant calcium carbonate (CaCO3) mineral in the natural environment. Aragonite usually incorporates other trace elements such as strontium (Sr) and barium (Ba) or co-precipitates with other minerals such as strontianite (SrCO3) and witherite (BaCO3). In this work, attenuated total reflection Fourier transform infrared (ATR-FTIR) spectroscopy proved to be a promising method for analysing aragonite-group carbonates. The technique is simple, rapid, and accurate and requires little to no sample preparation, making it a practical alternative to X-ray diffraction (XRD) for rapid qualitative and quantitative analysis of aragonite sediments as important indicators of precipitation conditions. To reduce instrumental and methodological variations, the quantitative analysis relied on absorbance ratios at characteristic wavenumbers instead of absolute absorbance values. Linear calibration relationships between weight percentages and absorbance ratios were obtained over a wide compositional range, with high coefficients of determination (R2). As examples, the following equations were obtained for quantitative determination of (SrCO3) and (BaCO3): weight % of SrCO3 in aragonite mixture = with R2=0.9932, where x is absorbance at 1474.6 cm−1 absorbance at 855.1 cm−1, while the weight % of witherite in aragonite mixture = with R2=0.9783, where x is absorbance at 853.7 cm−1 absorbance at 856.5 cm−1. It should be noted that this study only deals with pure physical mixtures of aragonite group minerals and not with solid solutions. The new method should be calibrated for natural samples.
- Article
(1084 KB) - Full-text XML
- BibTeX
- EndNote


The polymorphs of calcium carbonate (CaCO3), especially calcite (Cal) and aragonite (Ar), are the most abundant and most reactive minerals in the natural environment and are, among others, dominant components of marine sediments (Morse and Mackenzie, 1990). For this reason, the precipitation of CaCO3 in aqueous solution has many applications in geochemistry (Alkhatib, 2016). Among all CaCO3 polymorphs, Cal is the most abundant and most thermodynamically stable. The second most abundant CaCO3 polymorph is Ar (Plummer and Busenberg, 1982). Aragonite is produced biogenically by unicellular and multicellular calcifying organisms or by inorganic precipitation processes. Usually, Ar preferentially incorporates other trace elements, especially alkaline-earth metals like Ba2+ and Sr2+. The extent of trace element incorporation reflects the environmental conditions of the precipitation process (AlKhatib and Eisenhauer, 2017b; Mavromatis et al., 2018; Dietzel et al., 2004). Thus, it is important to determine the quantity of these trace elements in Ar and if there is a possibility for these elements to precipitate independently as strontianite or witherite rather than to incorporate them in Ar crystals. Strontianite is considered to be an impurity that is crystallized during the precipitation processes. When the ratio is larger than ∼0.67, strontianite will precipitate as an independent mineral, whereas, for a smaller ratio, Sr will be incorporated into the Ar structure (Holland et al., 1963). Quantitative incorporation of strontium ions in Ar, synthesized by Plummer and Busenberg (1987), was measured using FT-Raman and infrared spectroscopic by Alia et al. (1997). They found that, with increasing Sr2+ content, the wavenumber shifts to lower values, and the peaks became broader.
Qualitative analysis of various carbonates minerals, as well as the quantitative determination of Cal in binary mixtures with Ar and dolomite, has been reported by Chester and Elderfield (1967) and Brusentsova et al. (2010). Quantitative analysis of calcium carbonate polymorphs (Cal, Ar, and vaterite) in synthetic binary mixtures was performed using the ratio of absorbance at selected wavenumbers in the mid-infrared (IR) region. In Cal–Ar mixtures, the Ar content was determined from the absorbance ratio at 1080 and 876 cm−1. For Ar–vaterite mixtures, the Ar concentration was calculated using the absorbance ratio at 1785 and 873 cm−1, whereas, in vaterite–Cal mixtures, the Cal content was determined from the absorbance ratio at 745 and 876 cm−1 (Xyla and Koutsoukos, 1989).
Tatzber et al. (2007) quantified calcium carbonate in soils using Fourier transform infrared (FTIR) spectroscopy based on absorption bands at 875 and 2506 cm−1. Similarly, Veerasingam and Venkatachalapathy (2014) quantitatively determined Cal in marine sediments using the characteristic carbonate absorption bands at 1460 cm−1, corresponding to stretching vibrations, and 880 cm−1, corresponding to bending vibrations. Dos Santos et al. (2021) employed FTIR spectroscopy combined with partial least squares (PLS) regression models for the quantitative determination of CaCO3 in cement.
FTIR spectroscopy has also been widely applied for the qualitative identification of carbonate minerals. For example, Stanienda-Pilecki (2019) used this technique to distinguish carbonate minerals with varying magnesium contents, including huntite, dolomite, high-Mg Cal, and low-Mg Cal. An increase in Mg2+ substitution for Ca2+ within the crystal structure was found to shift the absorption bands toward higher wavenumbers. Furthermore, Vagenas et al. (2003) achieved the simultaneous quantitative determination of Cal, Ar, and vaterite in ternary mixtures by developing a set of equations based on Beer's law in the mid-IR region, utilizing absorption bands at 745, 713, and 700 cm−1.
Since attenuated total reflection Fourier transform infrared (ATR-FTIR) is an applicable, easy, fast, and low-cost method for quantitative determination of carbonate minerals, it can be used as an alternative method of X-ray diffraction for quantitative determination of Ar-group carbonate sediments. The natural Ar-group carbonates, including Ar (CaCO3), strontianite (SrCO3), and witherite (BaCO3), occur in an orthorhombic crystal structure. The novelty of this work is to construct calibration curves for quantifying strontianite and witherite in Ar mixtures using absorbance ratios of two Ar peaks relative to strontianite or witherite peaks rather than absolute absorbance in order to reduce variability from measurement conditions. Absorbance ratios at specific wavenumbers were plotted against the weight percent of the minor phase to build the calibration curves. Two different binary synthetic mixtures of Ar-group carbonates were prepared and quantitatively analysed using the calibration curves.
2.1 Chemicals and reagents
For precipitating different carbonate minerals, we followed the experimental setup of AlKhatib and Eisenhauer (2017a) as shown in (Fig. 1).
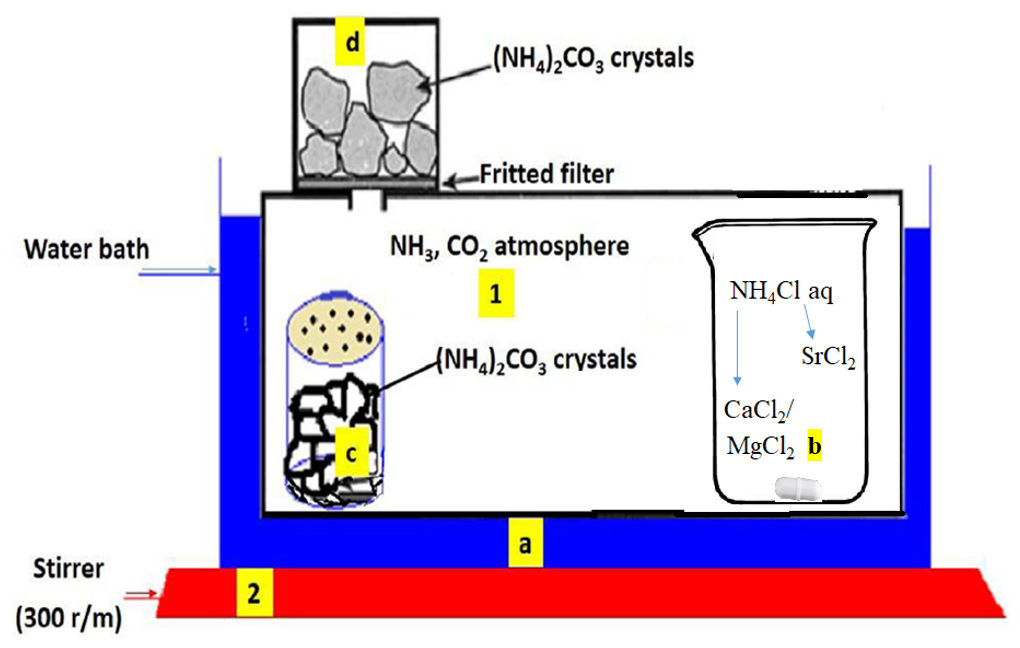
Figure 1Schematic design of the experimental setup: (1) the reaction chamber which is a sealed plastic container consisting of a copper tubing (a) where water is circulating to keep a constant temperature, (b) a beaker that contains the reacting solution, (c) a beaker that contains some ammonium carbonate granules that decompose spontaneously to provide ammonia and carbon dioxide gases, and (d) a fritted filter funnel that also contains some ammonium carbonate granules; (2) magnetic stirrer.
Pure Ar is precipitated at 25 °C as described by AlKhatib and Eisenhauer (2017b). The [] ratio in the buffered aqueous solution with NH4Cl has been set to 3:1 in order to precipitate Ar instead of Cal. The solution is composed of 0.395 M NH4Cl, 20 mM CaCl2, and 60 mM MgCl2. The composition of Ar was assessed by ICP-MS (Inductively Coupled Plasma Mass Spectrometry) and X-ray diffraction, and the result of these minerals as indicated by this reference was 100 % Ar Pure strontianite has been prepared as described in Alkhatib et al. (2022). The reacting solution is composed of 0.395 M NH4Cl and 20 mM SrCl2. The composition of strontianite was also assessed by ICP-MS and X-ray diffraction, and the result of these minerals as indicated by this reference was 100 % strontianite. All of the mentioned chemicals, as well as BaCO3, are ACS grade of Merck, and all solutions were prepared using deionized water (18.2 MΩ). The reaction solutions to produce Ar and strontianite were stirred with a magnetic stirrer at 300 rounds per minute overnight to produce appreciable quantity of minerals.
Different binary Ar mixtures (Ar strontianite and Ar witherite) were prepared at different mass percentages. Each mixture of total mass of 1.0 g was mixed thoroughly for 30 min using a mortar and pestle to ensure a homogeneous mixture.
2.2 FTIR instrument and method specifications
The instrument used in this study is Bruker Tensor II A225/Q Platinum ATR, Multiple Crystal CRY:Diamo.
The method specifications applied were as follows: resolution of 1 cm−1; sample scan time of 60 s; background scan time of 60 s; MIR (Mid-Infrared) source settings inclusive of a KBr beamsplitter, an aperture setting of 6 mm, a detector setting of ET-DLa TGS [intemal], a scanner velocity of 7.5 KHz, a wanted high-frequency limit of 8000, and a laser wavenumber of 11 704.13 cm−1; double-sided forward–backward acquisition mod; a phase resolution of 32; 1316 phase interferogram points; a power spectrum phase correction mode; a Blackman-Hamis 3-Tem apodization function; a zero-filling factor of 2; an interferogram size of 10 532 points; and an FT size of 16 K. Data points of absorption were saved from 4000 to 400 cm−1. Each sample was measured three times, and the average values of absorption at specific wavenumbers are reported in Table 1.
Table 1Absorption of Ar mixtures as a function of weight % of strontianite and witherite at significant wavenumbers of the minerals.
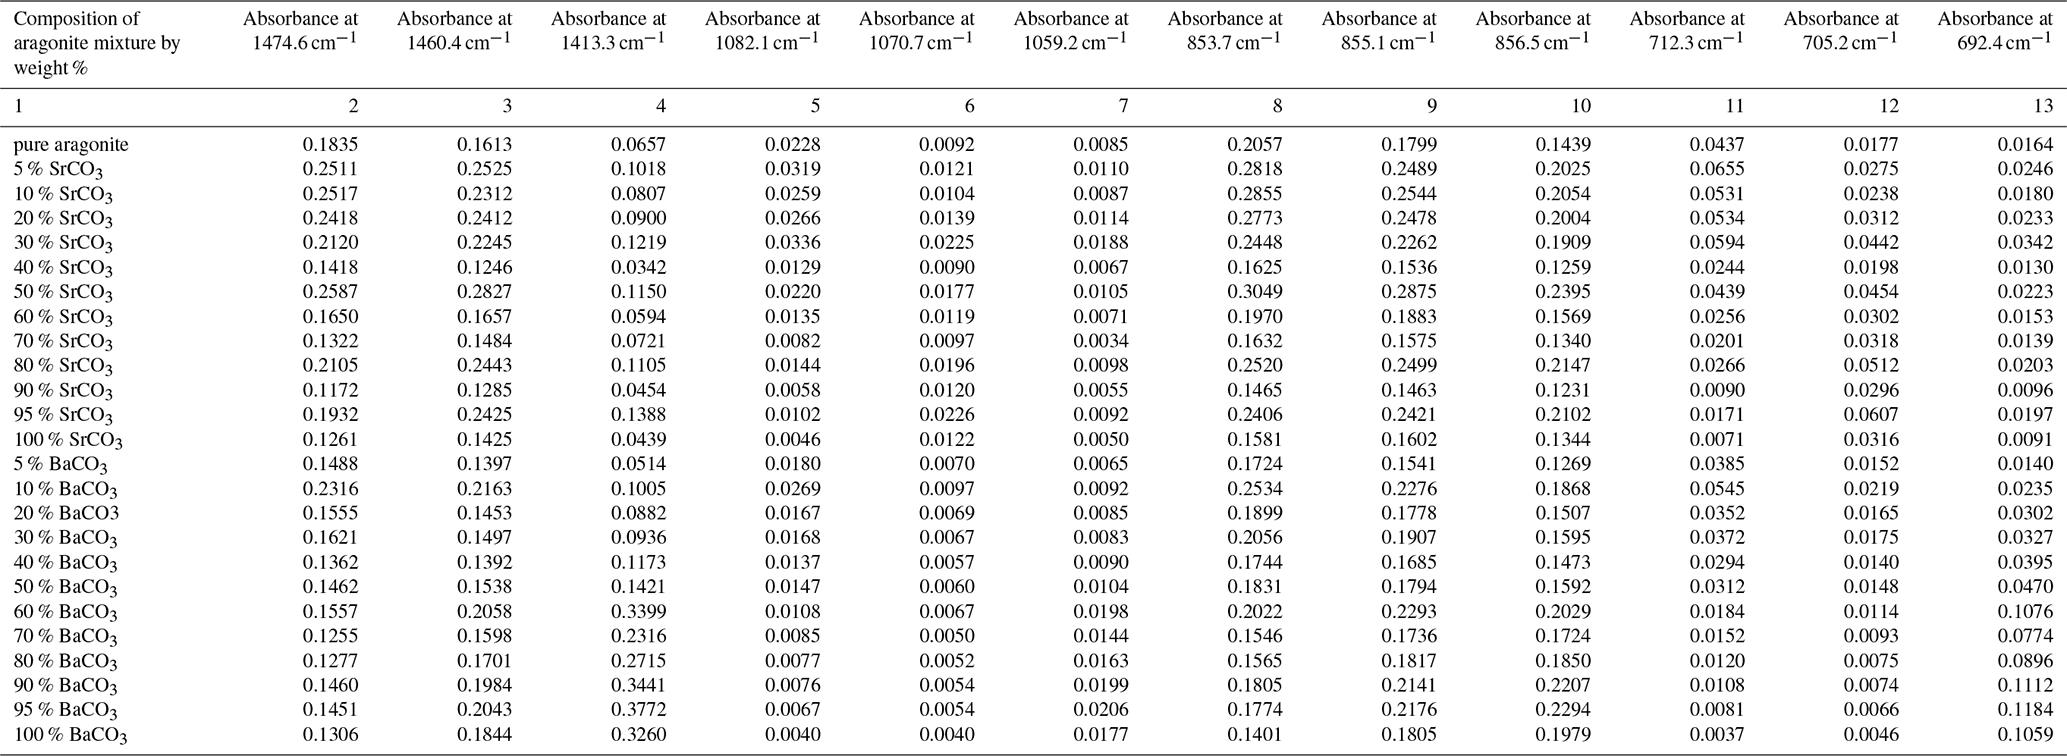
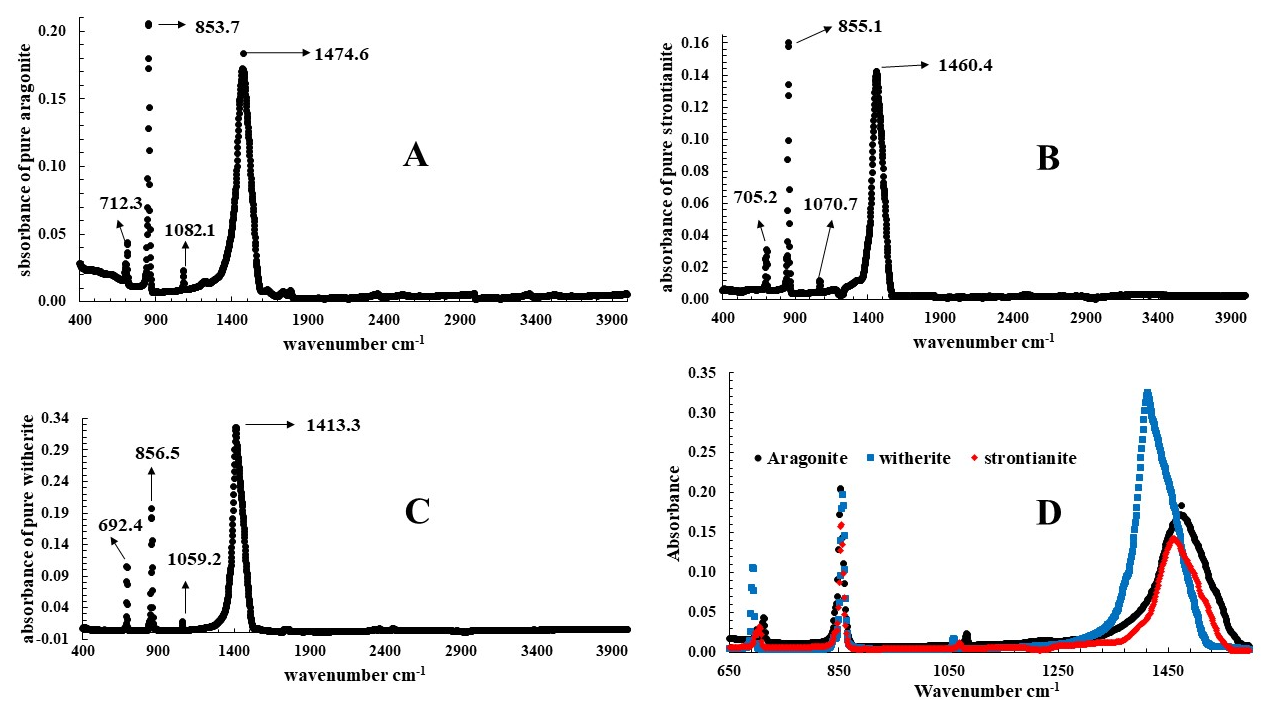
Figure 2The IR spectra of pure Ar (A), pure strontianite (B), and pure witherite (C) and the combined spectrum (D).
Table 2The absorbance ratios of Ar–strontianite mixtures at certain wavenumbers as a function of the weight % of strontianite.
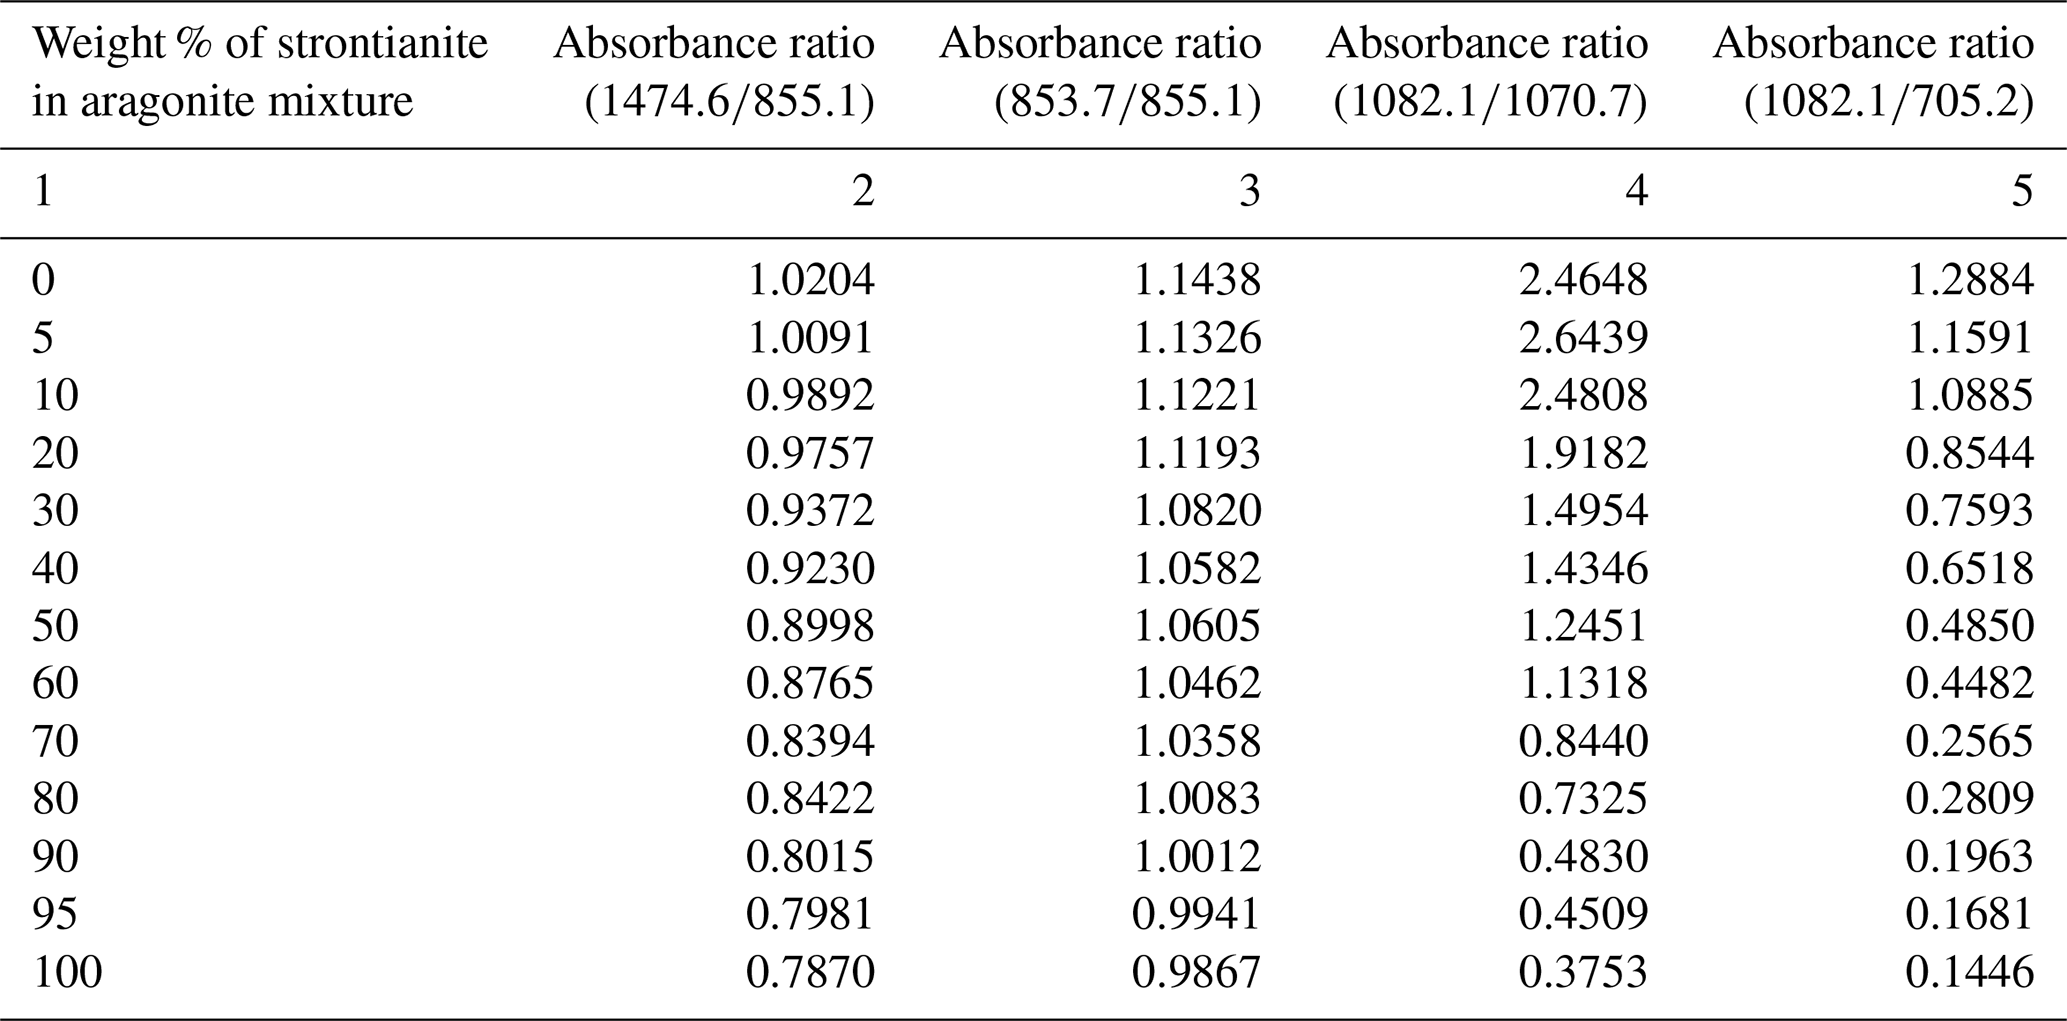
Note: values in column 2 = values column 2 in Table 1 values column 9 in Table 1. Values in column 3 = values column 8 in Table 1 values column 9 in Table 1. Values in column 4 = values column 5 in Table 1 values column 6 in Table 1. Values in column 5 = values column 5 in Table 1 values column 12 in Table 1.
Table 3Absorbance ratios of aragonite–witherite mixtures at certain wavenumbers as a function of the weight % of witherite.
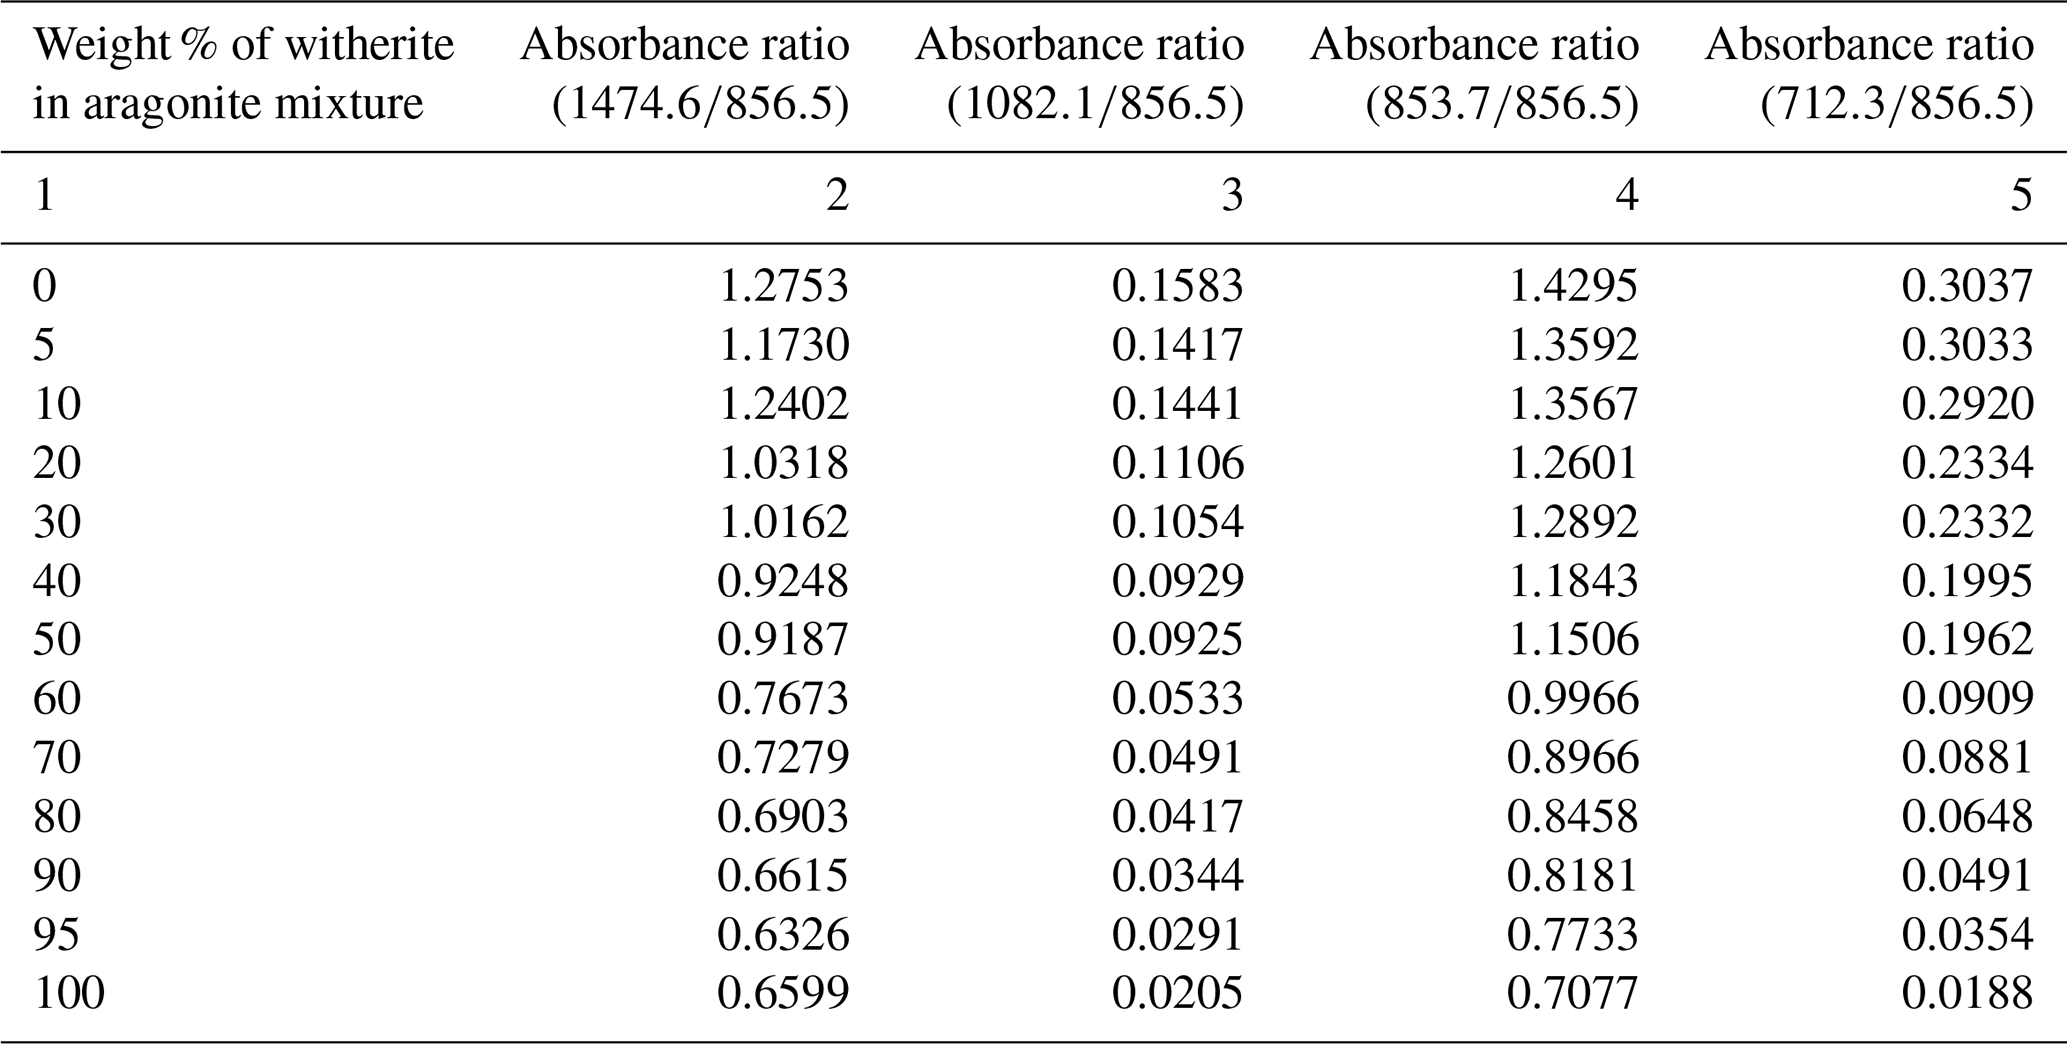
Note: values in column 2 = values column 2 in Table 1 values column 10 in Table 1. Values in column 3 = values column 5 in Table 1 values column 10 in Table 1. Values in column 4 = values column 8 in Table 1 values column 10 in Table 1. Values in column 5 = values column 11 in Table 1 values column 10 in Table 1.
The IR spectra of Ar-group carbonates (Ar, strontianite, and witherite) are very similar, as shown in Fig. 2; however, the absorption peaks generally shift toward lower wavenumbers as the atomic mass of the metal cation increases. The absorption peaks of Ar are a strong, sharp peak at 1474.6 cm−1; a weak, sharp peak at 1082.1 cm−1; a strong, sharp peak at 853.7 cm−1; and a weak, sharp peak at 712.3 cm−1 (Fig. 2A). The absorption peaks of strontianite are a strong, sharp peak at 1460.4 cm−1; a weak, sharp peak at 1070.7 cm−1; a strong, sharp peak at 855.1 cm−1; and a weak, sharp peak at 705.2 cm−1 (Fig. 2B). The absorption peaks of witherite are a strong, sharp peak at 1413.3 cm−1; a weak, sharp peak at 1059.2 cm−1; a strong, sharp peak at 856.5 cm−1; and a weak, sharp peak at 692.4 cm−1 (Fig. 2C). This general shift toward lower wavenumbers as the atomic mass of the metal cation increases is in good agreement with what was previously observed from the far-IR spectra of carbonate minerals by Alia et al. (1997), and this can be explained by the fact that, as the size of the metal ion increases, the bond strength decreases, and, as a result, the vibrational frequency decreases. The data points of absorption for different Ar mixtures as a function of weight % are listed in Table 1.
Table 4Calibration curve equations, by which quantitative determination of strontianite and witherite can be estimated in Ar mixtures.
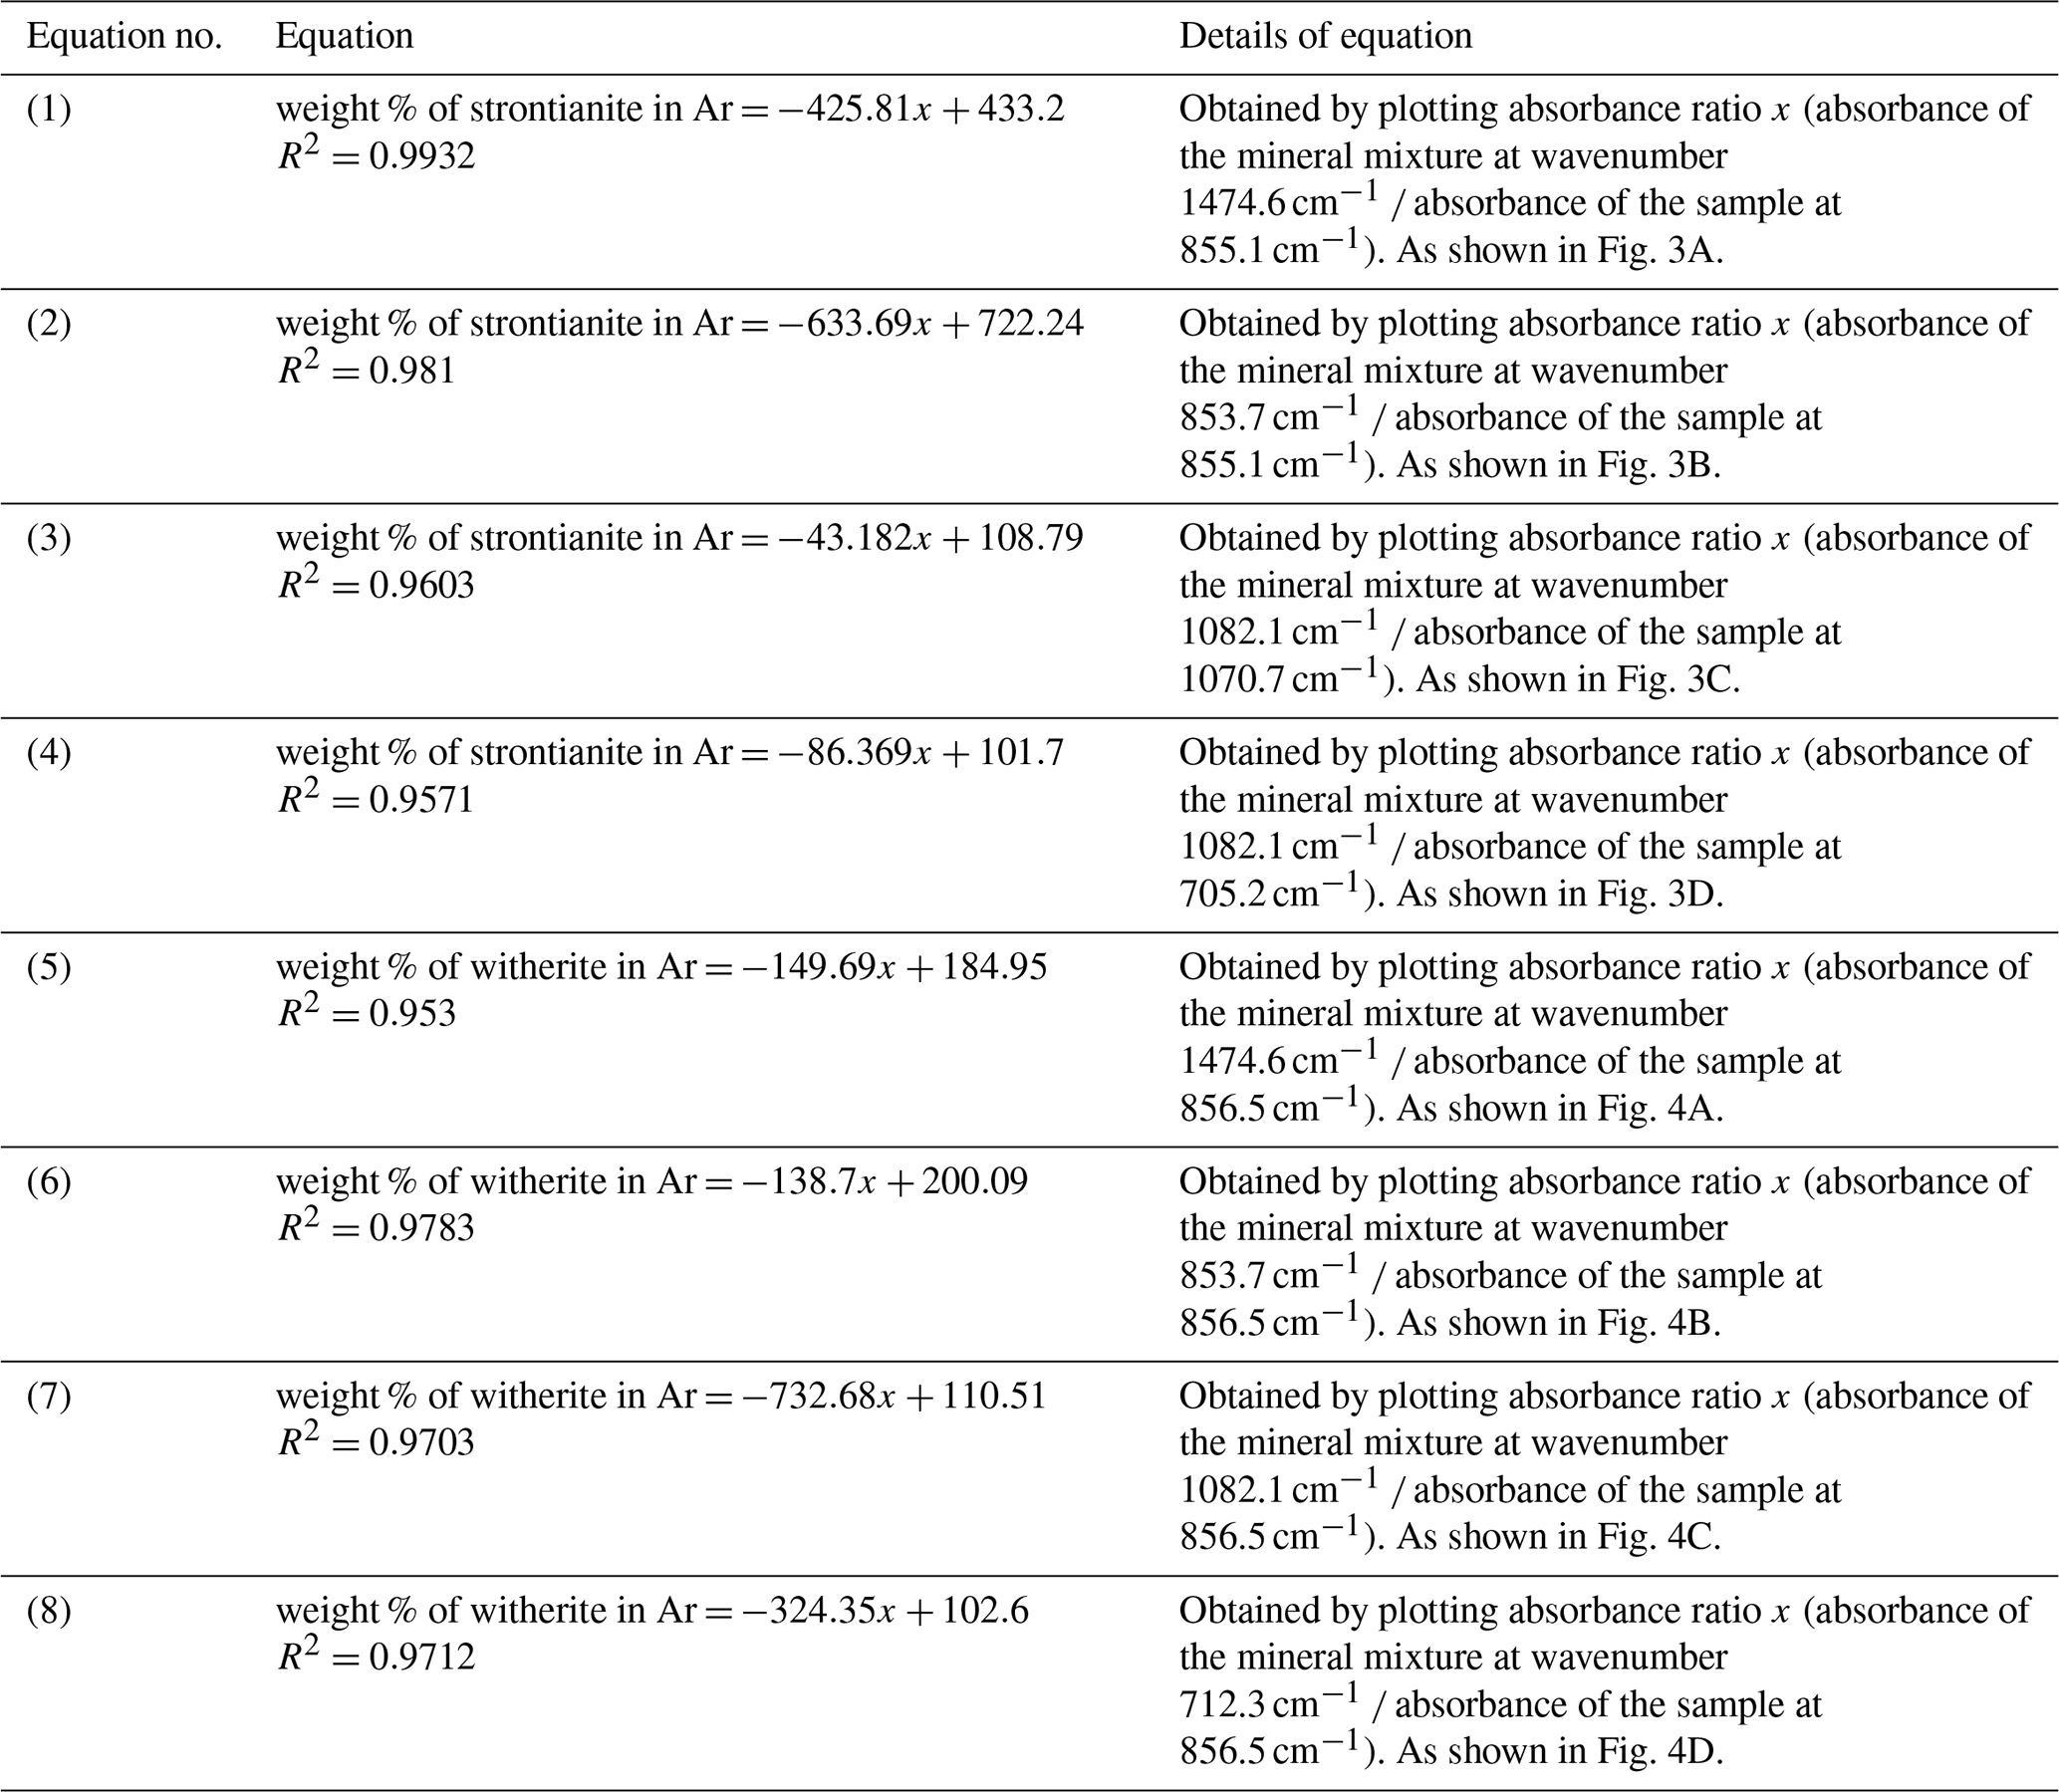
For the quantitative determination of strontianite and witherite in Ar-bearing mechanical mixtures, calibration curves were constructed using absorbance ratios rather than the direct relationship between mineral absorbance and concentration. Specifically, the absorbance of Ar at a selected characteristic band was normalized to the absorbance of strontianite or witherite at their corresponding characteristic bands. The absorbance ratios of Ar – at one of its absorption peaks – relative to the absorbance of strontianite or witherite in the Ar mixtures at their corresponding absorption peaks were used. Table 2 shows the absorbance ratios of Ar–strontianite mixtures at selected wavenumbers as a function of the weight % of strontianite, while Table 3 shows the absorbance ratios of Ar–witherite mixtures at selected wavenumbers as a function of the weight % of witherite. The baseline for each spectrum was acquired prior to each measurement. Absorbance ratios rather than absolute absorbance were used in this work because the absorbance at a certain wavenumber for the same sample can change slightly from one measurement to another. It also changes depending on the method used for measuring the IR spectrum (ATR, liquid film, CCl4 solution, KBr, etc.) and will undoubtedly vary slightly from one instrument to another. Therefore, as a form of normalization, absorbance ratios at specific wavenumbers as a function of mineral weight % in Ar mixtures were adopted for constructing the calibration curves for the quantitative determination of strontianite and witherite in Ar. Four calibration curves, as shown in Fig. 3, were derived, with R2 values ranging between 0.993 and 0.957, and their mathematical equations are summarized in Table 4. Using these equations, the quantitative determination of strontianite in Ar can be performed. Similarly, for the quantitative determination of witherite in Ar, four calibration curves, as shown in Fig. 4, were derived with R2 values ranging between 0.978 and 0.953, and their mathematical equations are also summarized in Table 4.
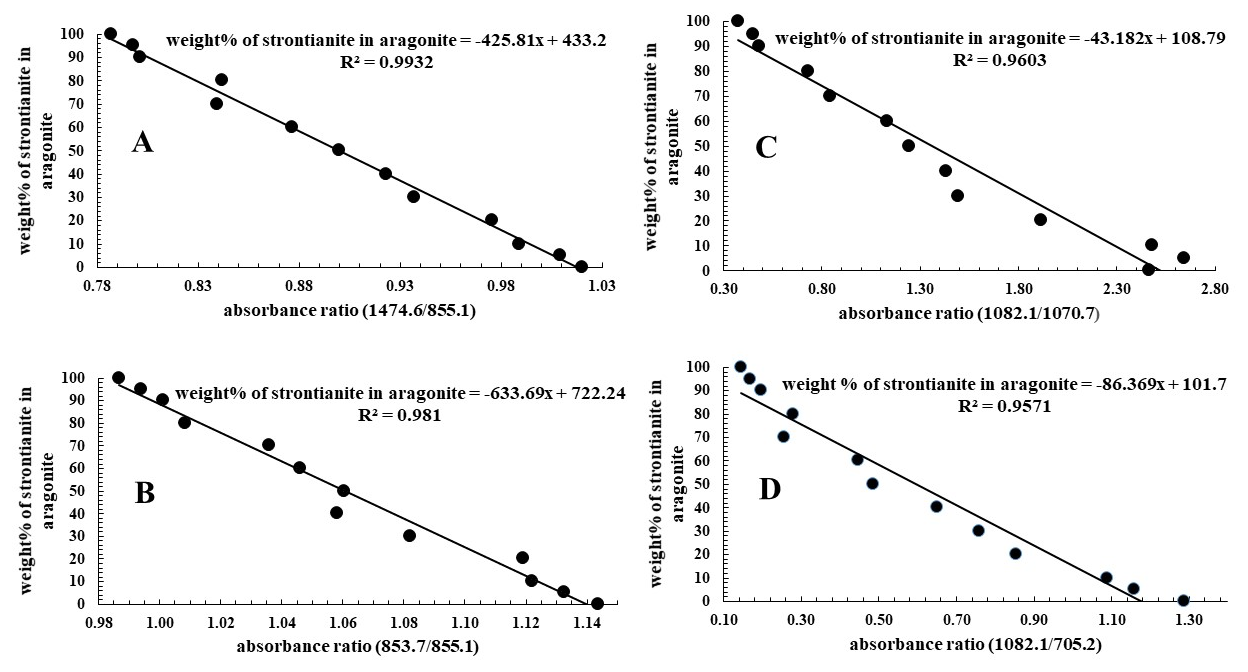
Figure 3Calibration curve equations, by which quantitative determination of strontianite in Ar mixtures can potentially be calculated. Data of these curves can be obtained from Table 2.
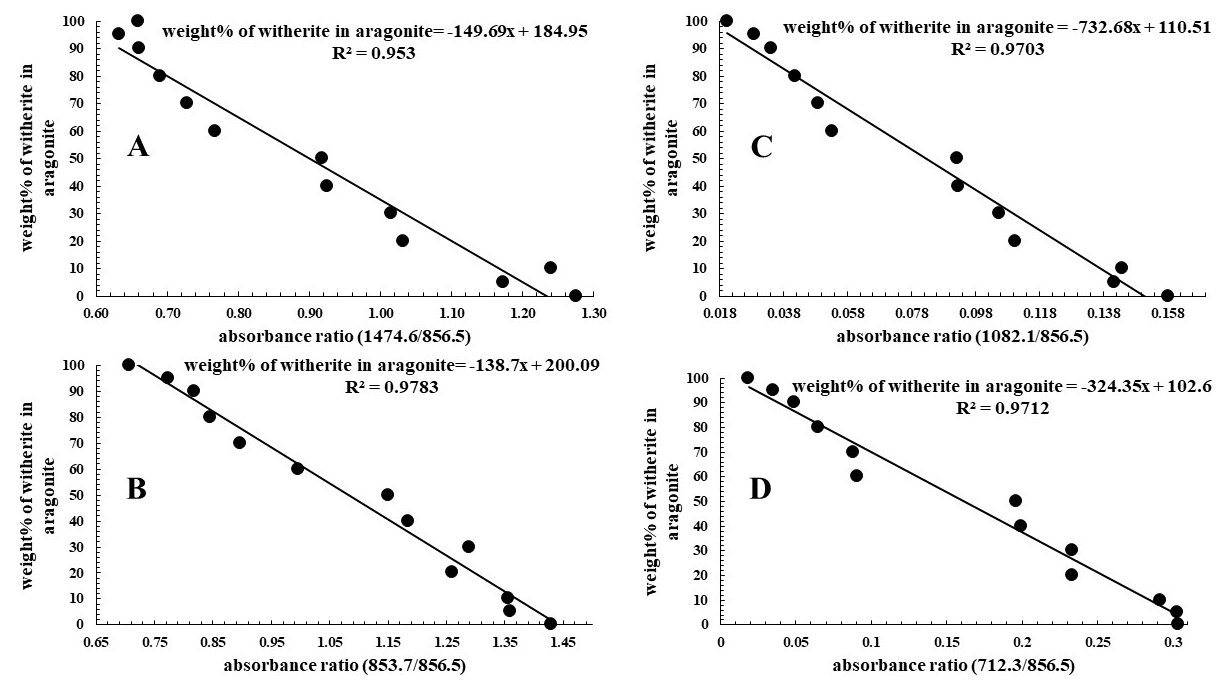
Figure 4Calibration curve equations, by which quantitative determination of witherite in Ar mixtures can be potentially calculated. Data of these curves can be obtained from Table 3.
To assess the uncertainty associated with the developed calibration models, least-squares linear regression was performed for each calibration curve. In addition to the regression equation and coefficient of determination (R2), the standard error (SE) of the slope and intercept and the standard error of the estimate (SEE) were calculated. These parameters provide quantitative estimates of the uncertainty of the fitting procedure and the predictive performance of each calibration model. As summarized in the revised Table 4, the standard errors of the slopes ranged from 2.65 to 38.59, whereas the SEE ranged from 3.05 wt % to 7.37 wt %. The relatively small uncertainties, together with the high coefficients of determination (R2=0.953–0.993), indicate that the proposed calibration equations provide reliable quantitative estimation of strontianite and witherite contents in synthetic aragonite mixtures.
It should be noted that this study deals with artificial physical mixtures of pure minerals and not with natural samples. Natural samples commonly contain a variety of trace elements, particularly alkaline-earth elements such as magnesium (Mg), strontium (Sr), and barium (Ba), as well as other elements including lithium (Li), boron (B), cadmium (Cd), uranium (U), and thorium (Th) (Alkhatib, 2016). The presence of these foreign metal ions within the crystalline structure of Ar-group minerals may cause slight shifts in the wavenumbers of the maximum absorption peaks. Consequently, this can influence the absorption intensity and, therefore, affect the applicability of the equations derived in this work for the quantitative analysis of binary Ar-group minerals. As a result, the derived equations may not fully comply with the of natural mineral samples without additional adjustments.
Accordingly, the application of these equations to natural Ar samples may require a suitable normalization procedure. Our future work will focus on addressing this issue through the synthesis of minerals under conditions that closely mimic natural precipitation environments. Additionally it will be interesting to investigate the effect of trace elements on changes in wavenumber values or the locations of absorption maxima in future work.
Nevertheless, Eqs. (1)–(8) demonstrate direct quantitative relationships that can be reliably applied to the quantitative analysis of pure artificial mineral mixtures. Such applications have significant potential in both medical and industrial fields. Our study represents an initial step toward establishing FTIR spectroscopy as a simple, cost-effective, and direct analytical method, which may open broad opportunities for further scientific investigations and future applications.
The ATR-FTIR spectroscopic technique is a suitable, fast, reliable, and cost-effective method for the quantitative determination of strontianite and witherite minerals that are physically mixed, and, with certain modifications, in future work it can be used for quantitative analysis of co-precipitated Ar sediments. The shifts in the carbonate absorption bands enable discrimination between Ar, strontianite, and witherite. The use of absorbance ratios allows robust calibration curves that can be used for the determination of these three Ar-group carbonates. This method can serve as an alternative to X-ray diffraction for rapid qualitative and quantitative analysis of Ar-group carbonates, particularly when rapid screening or large numbers of samples are involved.
Beyond its application in quantification, this method has important geochemical significance as it enables assessment of the distribution of barium and strontium carbonates within aragonitic sediments. This, in turn, provides improved insight into carbonate sedimentation processes and their associated environmental implications.
All data generated and analysed during this study are included in this published article. No additional code or datasets are required to reproduce the results.
MA and MQ conceptualized the study and designed the experiments. NT and FAR carried out the experiments and collected the data. All of the authors performed the analyses and interpreted the results. MA drafted the paper, and MQ reviewed and edited it. All of the authors approved the final version of the paper.
The contact author has declared that none of the authors has any competing interests.
Publisher's note: Copernicus Publications remains neutral with regard to jurisdictional claims made in the text, published maps, institutional affiliations, or any other geographical representation in this paper. The authors bear the ultimate responsibility for providing appropriate place names. Views expressed in the text are those of the authors and do not necessarily reflect the views of the publisher.
The authors gratefully acknowledge the Department of Chemistry and Chemical Technology at Al-Quds University for their support.
This paper was edited by Tiziana Boffa Ballaran and reviewed by Monika Koch-Müller and one anonymous referee.
Alia, J. M., De Mera, Y. D., Edwards, H. G. M., Martín, P. G., and Andrés, S. L.: FT-Raman and infrared spectroscopic study of aragonite-strontianite (CaxSr1− xCO3) solid solution, Spectrochim. Acta A, 53, 2347–2362, https://doi.org/10.1016/S1386-1425(97)00175-3, 1997.
Alkhatib, M.: Trace element and isotope measurement on artificially precipitated calcium carbonate, Doctoral dissertation, https://oceanrep.geomar.de/id/eprint/33466/1/Alkhatib_Thesis.pdf (last access: 10 July 2026), 2016.
AlKhatib, M. and Eisenhauer, A.: Calcium and strontium isotope fractionation in aqueous solutions as a function of temperature and reaction rate; I. Calcite, Geochim. Cosmochim. Ac., 209, 296–319, https://doi.org/10.1016/j.gca.2016.09.035, 2017a.
AlKhatib, M. and Eisenhauer, A.: Calcium and strontium isotope fractionation during precipitation from aqueous solutions as a function of temperature and reaction rate; II. Aragonite, Geochim. Cosmochim. Ac., 209, 320–342, https://doi.org/10.1016/j.gca.2017.04.012, 2017b.
Alkhatib, M., Qutob, M., Alkhatib, S., and Eisenhauer, A.: Strontium isotope fractionation during precipitation of strontianite in aqueous solutions as a function of temperature and reaction rate, Chem. Geol., 587, 120625, https://doi.org/10.1016/j.chemgeo.2021.120625, 2022.
Brusentsova, T. N., Peale, R. E., Maukonen, D., Harlow, G. E., Boesenberg, J. S., and Ebel, D.: Far infrared spectroscopy of carbonate minerals, Am. Mineralog., 95, 1515–1522, https://doi.org/10.2138/am.2010.3380, 2010.
Chester, R. and Elderfield, H.: The application of infra‐red absorption spectroscopy to carbonate mineralogy, Sedimentology, 9, 5–21, https://doi.org/10.1111/j.1365-3091.1967.tb01903.x, 1967.
Dietzel, M., Gussone, N., and Eisenhauer, A.: Co-precipitation of Sr2+ and Ba2+ with aragonite by membrane diffusion of CO2 between 10 and 50 C, Chem. Geol., 203, 139–151, https://doi.org/10.1016/j.chemgeo.2003.09.008, 2004.
dos Santos, V. H. J. M., Pontin, D., Ponzi, G. G. D., e Stepanha, A. S. D. G., Martel, R. B., Schütz, M. K., Einloft, S. M. O., and Dalla Vecchia, F.: Application of Fourier Transform infrared spectroscopy (FTIR) coupled with multivariate regression for calcium carbonate (CaCO3) quantification in cement, Constr. Build. Mater., 313, 125413, https://doi.org/10.1016/j.conbuildmat.2021.125413, 2021.
Holland, H. D., Borcsik, M., MuNozt, J., and Oxburghs, U. M.: The coprecipitation of Sr+2 with aragonite and of Ca+2 with strontianite between 90 ° and 100 °C, Geochim. Cosmochim. Ac., 27, 957–977, https://doi.org/10.1016/0016-7037(63)90105-4, 1963.
Mavromatis, V., Goetschl, K. E., Grengg, C., Konrad, F., Purgstaller, B., and Dietzel, M.: Barium partitioning in calcite and aragonite as a function of growth rate, Geochim. Cosmochim. Ac., 237, 65–78, https://doi.org/10.1016/j.gca.2018.06.018, 2018.
Morse J. W. and Mackenzie, F. T.: Geochemistry of Sedimentary Carbonates, Elsevier, Amsterdam, ISBN 9780444887818, 1990.
Plummer, L. N. and Busenberg, E.: The solubilities of calcite, aragonite and vaterite in CO2–H2O solutions between 0 and 90 °C, and an evaluation of the aqueous model for the system CaCO3–CO2–H2O, Geochim. Cosmochim. Ac., 46, 1011–1040, https://doi.org/10.1016/0016-7037(82)90056-4, 1982.
Plummer, L. N. and Busenberg, E.: Thermodynamics of aragonite-strontianite solid solutions: Results from stoichiometric solubility at 25 and 76 C, Geochim. Cosmochim. Ac., 51, 1393–1411, https://doi.org/10.1016/0016-7037(87)90324-3, 1987.
Stanienda-Pilecki, K. J.: The importance of Fourier-Transform Infrared Spectroscopy in the identification of carbonate phases differentiated in magnesium content, Spectroscopy, 6, https://www.spectroscopyonline.com/view/spec0619-pilecki (last access: 11 October 2026), 2019.
Tatzber, M., Stemmer, M., Spiegel, H., Katzlberger, C., Haberhauer, G., and Gerzabek, M. H.: An alternative method to measure carbonate in soils by FT-IR spectroscopy, Environ. Chem. Lett., 5, 9–12, https://doi.org/10.1007/s10311-006-0079-5, 2007.
Vagenas, N. V., Gatsouli, A., and Kontoyannis, C. G.: Quantitative analysis of synthetic calcium carbonate polymorphs using FT-IR spectroscopy, Talanta, 59, 831–836, https://doi.org/10.1016/S0039-9140(02)00638-0, 2003.
Veerasingam, S. and Venkatachalapathy, R.: Estimation of carbonate concentration and characterization of marine sediments by Fourier transform infrared spectroscopy, Infrared Phys. Techn., 66, 136–140, https://doi.org/10.1016/j.infrared.2014.06.005, 2014.
Xyla, A. G. and Koutsoukos, P. G.: Quantitative analysis of calcium carbonate polymorphs by infrared spectroscopy, J. Chem. Soc. Farad. T. 1, 85, 3165–3172, https://doi.org/10.1039/F19898503165, 1989.