the Creative Commons Attribution 4.0 License.
the Creative Commons Attribution 4.0 License.
 | 22 Jul 2026
Thermally activated multistep alteration of Fe2+-bearing fluorophlogopite revealed by in situ Raman spectroscopy
Christian Reinberg
Stylianos Aspiotis
Thomas Malcherek
Stefan T. M. Peters
Boriana Mihailova
Elucidating the temperature-induced structural and crystallochemical transformations in phlogopite mineral species with a partial substitution of Fe2+ for Mg at the M(1,2) sites and occupancy disorder at the X site can help in better understanding the transport phenomena in the lithosphere and mantle metasomatism. Here we present the results from in situ temperature-dependent Raman spectroscopy on fluorophlogopite with Fe2+ content of ∼ 0.15 atoms per formula unit (apfu) and hydroxyl-group content of ∼ 0.40 apfu. A few heating–cooling runs were conducted in air up to different temperatures, with the highest temperature achieved being 1450 K. The chemical composition and crystal structure before and after cooling down from 1450 K to room temperature were probed by wavelength-dispersive electron microprobe analysis (WD-EMPA) and single-crystal X-ray diffraction (XRD), respectively. The anomalies in the temperature dependencies of phonons reveal a sequence of heating-induced changes in phlogopite: (1) near 550–650 K structural instability related to interlayer interactions occurs, which activates the mobility of interlayer K+ cations. This process is reversible up to ∼ 1100 K, and, hence, diffusion of K+ can potentially contribute to phlogopite electrical conductivity between ∼ 650–1100 K. (2) At ∼ 1150 K all H+ cations delocalize, including those from OH groups linked to MgMgMg chemical configurations, and therefore can also act as charge carriers. (3) Between 1300 and 1450 K irreversible Fe2+ → Fe3+ oxidation develops, confirmed by a permanent resonance Raman-scattering signal after cooling down to room temperature, along with a subtle decrease in the unit-cell volume. Simultaneously, partial dehydrogenation and dehydroxylation take place as only 65 % of the hydroxyl groups recover at room temperature. The Raman-scattering data also suggest a minor loss of K+ (∼ 0.02 apfu) from the mica structure, whereas WD-EMPA indicates no change in the content of F− within uncertainties. A partial thermal decomposition of fluorophlogopite occurs above 1300 K, leading to the formation of a minor amount of nano-sized forsterite (∼ 1 % in volume), which nucleates mainly on the sample surface parallel to the cleavage plane.
- Article
(6635 KB) - Full-text XML
-
Supplement
(1639 KB) - BibTeX
- EndNote


Phlogopite, the magnesian end member of the biotite group (approximate formula AKM(Mg,Fe2+)(AlSi3)O(OH,F)2), is a common potassium-rich layered silicate (see Fig. 1) present in various geological settings, ranging from ultra-potassic basaltic rocks to metamorphic terranes and metasomatised mantle regions (Zanetti et al., 1999; Motoyoshi and Hensen, 2001; Fumagalli et al., 2009; Fritschle et al., 2013; Steenstra et al., 2024). Substitution of fluorine (F) for hydroxyl groups at the anionic X site can enhance the thermal stability of phlogopite (Tutti et al., 2000; Motoyoshi and Hensen, 2001). Sun et al. (2022) suggested that the temperature stability range increases by at least 100 K, when F-rich phlogopite with 4.1 weight percent (wt %) F is compared to the F-poor counterpart. Very recently, Steenstra et al. (2024) quantified the relationship between the breakdown temperature of phlogopite and incorporated F amount, proposing a gradient of 55 K wt %−1 F. Hence, the broad pressure–temperature (p–T) stability range allows phlogopite to carry volatiles to depths of roughly 180–200 km (Li et al., 2016; Kawamoto, 2006), making this mineral an important contributor to the volatile cycling as it can deliver both hydrous and halogen species into the upper mantle through subduction zones (Zheng et al., 2016).
The presence of X-site F− not only affects the thermal stability of phlogopite but also impacts mineral conductivity properties at elevated temperatures, which in turn may contribute to the anomalies in lithospheric rock electrical conductivity (Li et al., 2016, 2017). Phlogopite has unusually high electrical conductivity at temperatures above 900 K (Li et al., 2016), which gradually increases with the F content (Li et al., 2017). Moreover, phlogopite exhibits significant electrical-conductivity anisotropy, but, interestingly, at low temperatures the electrical conductivity is highest along the direction perpendicular to the monoclinic (110) crystallographic plane and lowest along the direction normal to (001), whereas above 1000 K the anisotropy in electrical conductivity reverses (Li et al., 2016). The chemically induced diffusion of F− is also anisotropic, resembling the trend of the low-temperature electric-conductivity anisotropy, but the electrical conductivity calculated from fluorine diffusivity data is considerably lower than the measured electrical conductivity on phlogopite with the same content of F (Zhang et al., 2022). The latter indicates that below 1000 K fluorine anions are not the chief charge carriers. Another important source of electrical conductivity is thermally induced H+ migration within the crystal structure, which has been reported for several phyllosilicates, e.g. Fe-bearing muscovite, talc, and antigorite (Zhang et al., 2006, 2010; Reynard et al., 2011; Wang and Karato, 2013). Furthermore, interlayer potassium cations (K+) can be mobilized at high temperatures and, hence, can contribute to electrical conductivity. However, Na/K substitution disorder at the A site slightly reduces the electrical conductivity, which has been attributed to the formation of local structural distortions due to the smaller radius of Na+ and subsequent slowdown of interlayer-cation migration (Guseinov, 2018). On the other hand, the presence of divalent iron (Fe2+) at the octahedral M site seems to increase the conductivity of biotite (Guseinov, 2018). Indeed, thermally activated hopping of electrons/electron holes between MO6 octahedra in Fe2+-containing complex hydrous silicates with layered and stripe-like structure results in polaron conductivity (Goddat et al., 1999; Katsura et al., 2009). Based on the low activation energy derived from electrical-conduction experiments, temperature-induced formation of polarons (coupled electron–phonon excitations) has been assumed for several ferromagnesian phyllosilicates (Reynard et al., 2011; Wang and Karato, 2013) and amphiboles (Hu et al., 2018). However, only recently, the occurrence of FeO6-related small polarons was detected via thermally activated direction-dependent resonance Raman scattering (RRS) in amphiboles (Mihailova et al., 2021, 2022; Rösche et al., 2022; Bernardini et al., 2023, 2024; Della Ventura et al., 2025), and the development of highly anisotropic electric conductivity in Fe-rich amphiboles was directly correlated with the formation of polarons with mutually aligned dipoles (Bernardini et al., 2025).
On the other hand, pressure and grain size are of limited importance compared to the effect of the temperature and chemical composition of silicate minerals on the electrical conductivity within the uppermost 100 km. For example, in experiments on single-crystal amphibole, Hu et al. (2018) demonstrated that pressure variations between 0.5 and 2.0 GPa had a marginal effect on conductivity relative to temperature, whereas Xu et al. (2000) showed the negligible effect of pressure on olivine conductivity under upper-mantle conditions. Moreover, upper-mantle lithologies typically contain crystals larger than 5 µm, for which electrical conductivity values do not substantially change with increasing grain size (Yang and Heidelbach, 2012).
The complexity of phenomena that may take place in F-bearing magnesian biotite at elevated temperatures calls for improving our understanding of the temperature dependence of atomic dynamics as phonons play an important role in phase transitions, oxidation processes, diffusion processes, and structure breakdown. Previous studies of ferroan phlogopite (Fe apfu), based on neutron diffraction analyses and Fourier transform infrared (FTIR) spectroscopy (Chon et al., 2006), showed that at 773 K the MO6 geometry changes and the O–H bonds re-orient slightly; these changes were attributed to the onset of Fe oxidation and dehydrogenation next to MgMgFe chemical configurations. Combined thermogravimetric and X-ray diffraction (XRD) analyses on Fe-containing fluorophlogopite (Fe apfu) further revealed that MFeOHFeO2− reaction occurs near 773–873 K (Tutti et al., 2000). On the other hand, anomalies in the temperature dependence of Raman-active phonon modes of the same fluorophlogopite species indicated a possible phase transformation near 640 K, which does not involve a significant symmetry change (Tutti and Lazor, 2008). An independent FTIR study of Fe2+-poor phlogopite (Fe apfu) also suggested that local structural modifications within the T(Si,Al)O4 sheets already take place at 600 K (Zhang et al., 2016). Recent study by Sun et al. (2022) on F-poor and F-rich phlogopite confirmed small discontinuities near 673–773 K in the temperature trends of the wavenumbers of some Raman-active phonon modes, but the complementary XRD analyses did not reveal any structural phase transition at these temperatures; nevertheless, both Raman spectroscopy and XRD showed that the breakdown of phlogopite structure starts at 1273 K, and forsterite was the only detected crystalline phase as a result of the phlogopite thermal decomposition. It was also found that XF− enhances the thermal stability of phlogopite because it retards the phonon softening with temperature increase (Libowitzky, 1999; Sun et al., 2022).
It should be emphasized that, so far, the temperature dependence of the lowest-energy Raman-active phonon mode (below 100 cm−1), involving layer out-of-plane translations (McKeown et al., 1999), has not been considered, although this phonon mode might be sensitive to interlayer interactions and temperature-induced K+ cation rearrangements. The latter may be mirrored also by the hard mode near 739 cm−1, which was shown to be sensitive to the A-site occupancy of biotite (Aspiotis et al., 2022). Furthermore, attention has not been paid to possible RRS from thermally activated FeO6-related polarons. Thus, to address these open questions and gain a deeper insight into the atomistic mechanism of temperature-induced structural and chemical changes in Fe2+-bearing Mg-dominant mica, we have applied in situ high-temperature Raman spectroscopy to fluorophlogopite with MFe apfu and X(OH apfu up to 1450 K in the spectral range down to 15 cm−1. The goals were (i) to analyse in detail the atomic dynamics of fluorophlogopite at elevated temperatures and (ii) to explore possible thermal activation of charge carriers in trioctahedral mica.
2.1 Sample locality, preparation, and characterization
A natural fluorophlogopite sample from the Cardiff Uranium Mine, Ontario, Canada, from the collection of the Museum of Nature Hamburg – Mineralogy, was used in this study. The Cardiff Uranium mine lies within the Precambrian Grenville Province, which hosts several similar fluorine- and uranium-rich metasomatic deposits. Phlogopite at Cardiff occurs within fluorine-rich metasomatic and hydrothermal veins developed along syenite gneiss–marble contacts, where F-bearing fluids produced assemblages including phlogopite, fluorapatite, fluorite, scapolite, and humite-group minerals (Robinson and Hewitt, 1959). A euhedral single crystal with dark-brownish colour and a pseudo-hexagonal tabular shape (dimensions ∼ 26 × 24 × 6 mm3; see Fig. 1) was selected for the experiments. Rectangular cuts parallel to the cleavage plane were prepared with a diamond wire saw. The size of the cuts was approximately 3 × 2 × 0.15 mm3, with the shorter edge parallel to the monoclinic (110) crystallographic plane.
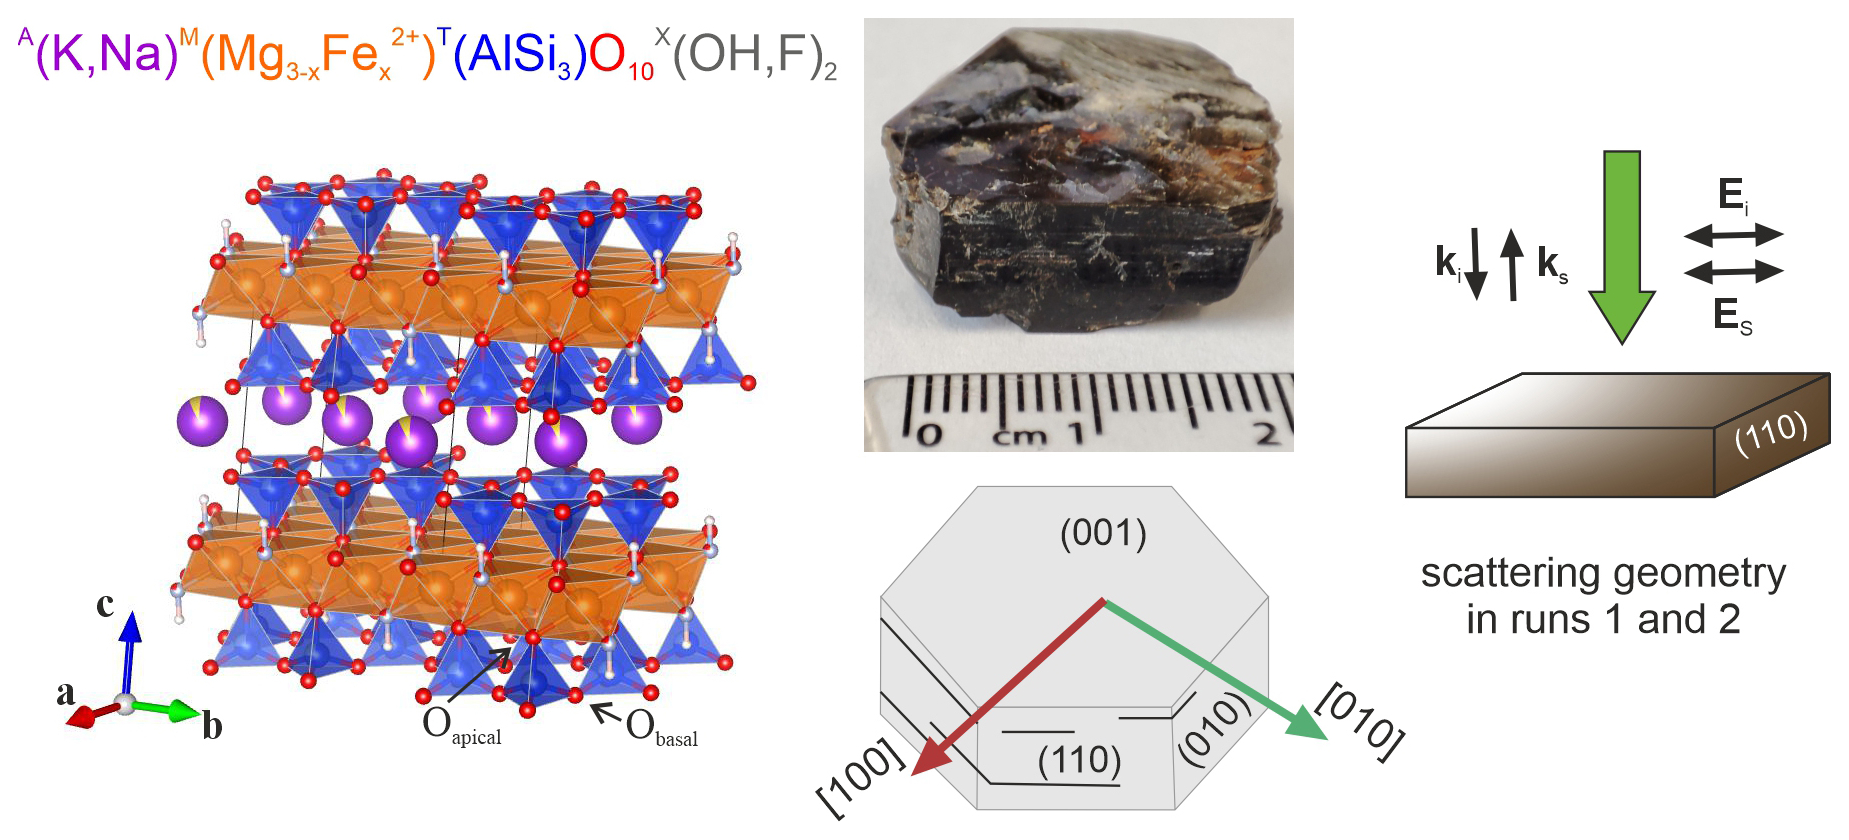
Figure 1Atomic structure of pristine fluorophlogopite studied here (plot prepared with the VESTA software package, Momma and Izumi, 2008), optical image of the specimen, and a sketch of the crystal morphology with labelled crystallographic planes and directions, as well as of the Raman-scattering geometry.
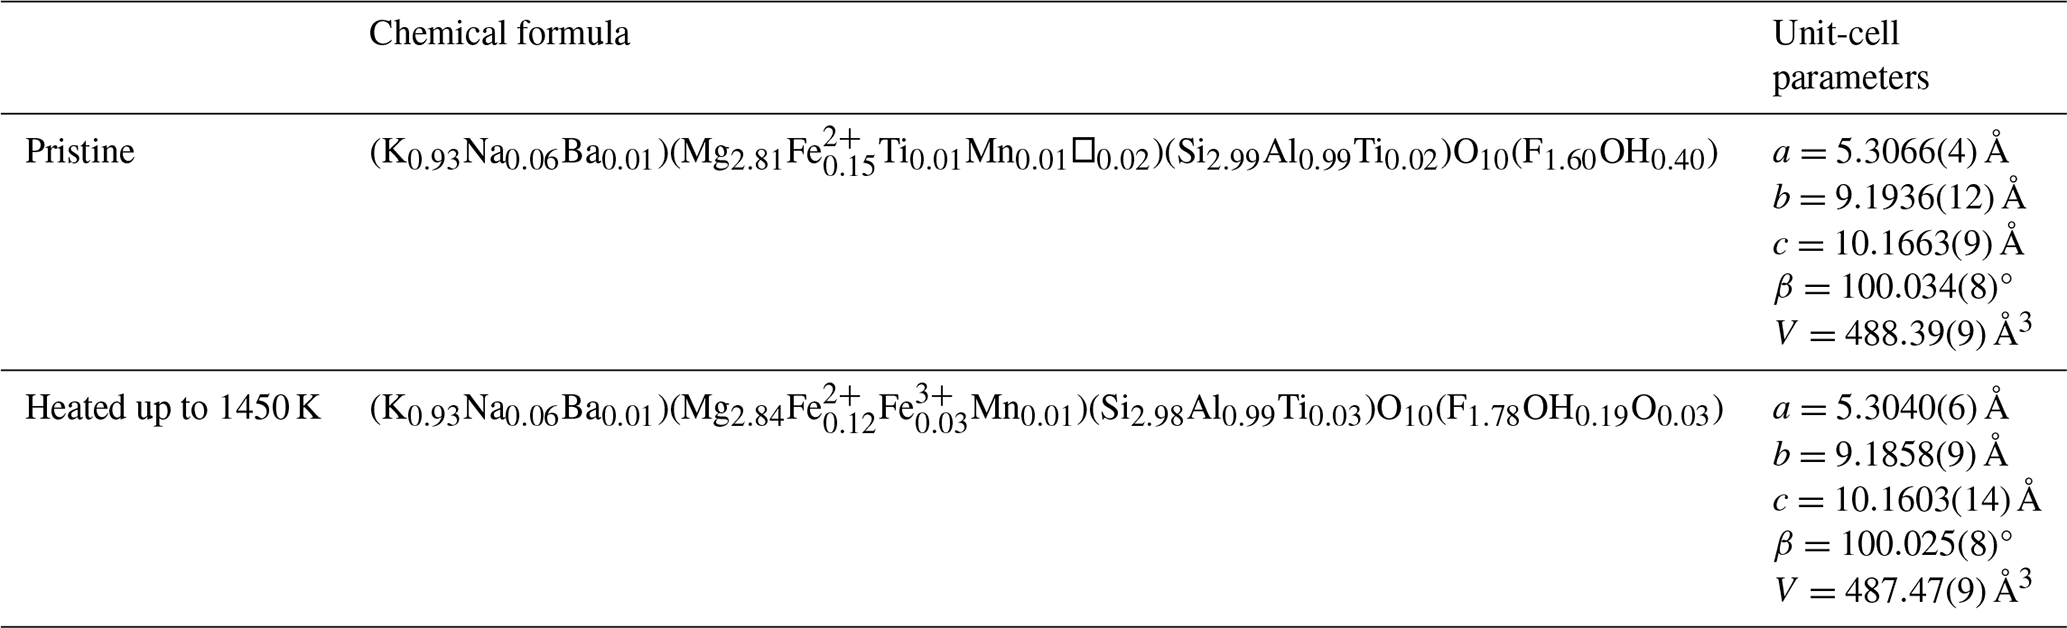
The chemical composition of an untreated specimen, as well as of the specimen heated to 1450 K (the maximum temperature reached in our experiments), was determined via wavelength-dispersive electron microprobe analysis (WD-EMPA). Data were collected with a Cameca SX-100 scanning electron microscope system operating at 15 kV accelerating voltage and 20 nA beam current. To avoid sample overheating and subsequent mobilization of light elements, the beam was defocused to a spot with a linear size of ∼ 10 µm on the sample surface. The employed standards were LiF for F (F Kα); albite for Na (Na Kα); MgO for Mg (Mg Kα); corundum for Al (Al Kα); andradite for Si (Si Kα), Ca (Ca Kα), and Fe (Fe Kα); vanadinite for Cl (Cl Kα); orthoclase for K (K Kα); MnTiO3 for Ti (Ti Kα) and Mn (Mn Kα); NiO for Ni (Ni Kα); olivenite for Cu (Cu Kα); Pb-containing glass for Zn (Zn Kα); SrTiO3 for Sr (Sr Lα); and Ba-containing glass for Ba (Ba Lα) and Cr2O3 for Cr (Cr Kα). The acquisition times were 20 s for Mg, Al, Si, K, Ca, and Fe; 30 s for Na, Cl, and Ti; 60 s for Mn, Ni, Cu, Zn, Sr, Ba, and Cr; and 120 s for F. The detection limits are 250 ± 50 ppm for Na, Mg, Al, Cl, K, Ca, Ti, Cr, and Ni; 350 ± 50 ppm for Si and Cu; 500 ± 50 ppm for Mn, Zn, Sr, and Ba; 800 ± 50 ppm for Fe; and 4200 ± 200 ppm for F. Measurements were done in 20 separate points. The results in average oxide wt % are given in Table S1 in the Supplement. The amounts of MFe3+ and X(OH)− were calculated using the charge balance approach of Li et al. (2020), as described in detail in Aspiotis et al. (2022); titanium (Ti) oxidation state was assumed to be 4+, after Scordari et al. (2013). The calculated crystallochemical formula of the untreated specimen (see Table 1) confirms that the sample studied here is OH-rich fluorophlogopite, according to the currently accepted IMA nomenclature (Rieder et al., 1998).
The atomic structure of pristine fluorophlogopite, as well as of the specimen recovered from 1450 K, was analysed by single-crystal XRD. Measurements were conducted using a Nonius KappaCCD single-crystal diffractometer with graphite-monochromated Mo Kα radiation. A full sphere of diffraction data was measured for both the untreated and heated crystal up to θmax=30°. Pixel intensities have been integrated and corrected using the Eval15 suite of programs (Schreurs et al., 2010). Crystal structure refinement was carried out using Jana2006 (Petříček et al., 2014) based on scattering factors for the uncharged atoms. The structure could be refined in , suggesting that the studied fluorophlogopite sample belongs to the most common 1M polytype (e,g. Deer et al., 2013). The unit-cell parameters are given in Table 1. Further refinement details are summarized in Table S2 in the Supplement. The crystallographic information files (CIFs) are also included in the Supplement. Minor OH content was refined assuming full occupancy of the X site by fluorine and oxygen. The O–H distance was restrained to 1 Å, and isotropic hydrogen displacement was coupled to the displacement of XO by a factor of 1.2. In the heat-treated sample the hydrogen position was fixed using a geometric constraint involving the neighbouring M1 and M2 sites. The M1 and M2 sites were assumed to be fully occupied by Mg2+ and Fe2+, while the interlayer site was assumed to be fully occupied by K and Na. The tetrahedral-site occupancy was kept constant at 75 % Si and 25 % Al.
Table 1Crystallochemical formula derived from EMPA data and unit cell parameters refined in of untreated and heat-treated fluorophlogopite studied here, according to the XRD analysis.
2.2 Raman spectroscopy
2.2.1 In situ temperature-dependent experiments
Raman spectra were collected with a Horiba Jobin-Yvon T64000 triple-monochromator system equipped with 1800 grooves mm−1 holographic gratings, a Symphony LN2-cooled charge-coupled device (CCD) detector, and an Olympus BH41 confocal microscope, using a Linkam TS1200 EV-1015 heating stage with a temperature accuracy of 1 K. The Raman scattering was excited with the green line (λ=514.532 nm) of a Coherent Innova 90C FreD Ar+ laser. The laser was focused through an Olympus super-long-working-distance objective 50× (numerical aperture (NA) 0.35) on the sample surface to a spot with a diameter of ∼ 2 µm and a laser power of 7.9 mW. The Raman spectrometer was calibrated using the 520.5 cm−1 Raman peak of a silicon wafer. The spectral resolution was ∼ 2 cm−1, while the instrumental peak position accuracy was ∼ 0.35 cm−1. Parallel polarized spectra (incident-light polarization Ei parallel to scattered-light polarization Es) were conducted in backscattering geometry (incident-light wave vector ki antiparallel to scattered-light wave vector ks) with ki perpendicular to the cleavage plane (monoclinic (001) crystallographic plane) and Ei along the monoclinic [110], [010], or [100] crystallographic directions (see the sketch in Fig. 1). The Raman-scattering data were collected in the range of 15–1215 and 3470–3820 cm−1, with an acquisition time of 60 s over five accumulations to improve the signal-to-noise ratio. Four temperature runs (see Table 2) were conducted in air with a heating rate of 20 K min−1 and a cooling rate of 50 K min−1. A stabilization time of 5 min at the desired temperature was upheld before collecting the Raman spectra. Runs 1 and 2 were conducted on two different rectangular flakes from the same cut of the single crystal, whereas runs 3 and 4 were performed on a third flake from the same cut. Above 1200 K, black-body emission was collected with the laser turned off and subsequently subtracted from the sample spectrum. The Raman spectra measured at each temperature were baseline corrected with a polynomial function, with temperature reduced to account for the Bose–Einstein distribution of phonons, and were fitted with pseudo-Voigt peak-shape functions PV (L and G stand for Lorentz and Gauss peak-shape functions, respectively, while μ is a variable weight coefficient) to determine the peak positions ω, full widths at half maximum (FWHMs), and integrated intensities I. The data evaluation was carried out through the OriginPro 2024 software package.
2.2.2 Raman mapping at room temperature
To check for possible spatial heterogeneities due to partial thermal decomposition, the sample heated up to 1450 K was subjected to Raman mapping using WITec alpha300R Confocal Raman Microscope equipped with a solid-state laser emitting at 532.14 nm, a 1800 grooves mm−1 grating, a Peltier-cooled CCD camera, and a Zeiss objective 100× (NA = 0.90). The lateral spatial resolution of the system approaches the diffraction limit of 0.306 µm. The spectrograph was calibrated to the emission lines of an lamp. The instrumental spectral resolution and peak-position precision were ∼ 3 and ∼ 0.4 cm−1, respectively. Two-dimensional (2D) mappings on the sample surface parallel to the cleavage plane, as well as in-depth line scans along the normal to the cleavage plane (001)⊥, were conducted in a scattering geometry corresponding to that in runs 1 and 2 (see Fig. 1) using an output laser power of 10 mW and an acquisition time of 20 s.
Table 2Temperature ramps of in situ Raman spectroscopic experiments in backscattering geometry (k ki), with ki⊥ (001) and Ei Es.

* c: measured on cooling; ** 294 (after ∼ 15 h): measured at room temperature, approximately 15 h after the completion of the temperature run.
3.1 Raman peak assignment and phonon expandabilities
According to group-theory analysis, biotite of symmetry exhibits 30 Raman-active modes: 16 Ag + 14 Bg. The H+ cations participate in 2Ag + Bg modes, while K+ and M1-site cations do not participate in Raman-active modes (Kroumova et al., 2003; Aspiotis et al., 2022). The parallel polarized Raman spectra are dominated by the fully symmetrical Ag modes, which have four non-zero, non-equivalent polarizability tensor components (αxx, αyy, αzz, and αxz), and, hence, the Raman peak intensities may vary depending on the crystal orientation in relation to ki and Ei. However, our previous study on series of biotite samples revealed that when -ki ks ⊥ (001), as with the backscattering geometry used here, the parallel polarized Raman spectra remain nearly the same upon rotation of the crystal around the laser beam direction, indicating that αxx≈ αyy (Aspiotis et al., 2022). Indeed, the room-temperature parallel polarized spectra measured with Ei [110], Ei [010], or Ei [100] exhibit only subtle differences in the relative intensities (see Fig. S1 in the Supplement).
The observed Raman peaks were attributed to specific atomic vibrations following the peak assignment in previous studies (Loh, 1973; Tlili et al., 1989; McKeown et al., 1999; Scordari et al., 2006; Lacalamita et al., 2011; Aspiotis et al., 2022). The OH-stretching peak at 3710 cm−1 is generated by hydroxyl groups in MgMgMg–OH−–K–OH− local configurations. The broad weak peak at 3698 cm−1 is most probably dominated by OH stretching of MgMgMg–OH−–K–F− local configurations, but Fe2+MgMg–OH−–K–OH− local configurations can also contribute to this Raman scattering (Lacalamita et al., 2011; Aspiotis et al., 2022). Lattice dynamics calculations of phlogopite (McKeown et al., 1999) demonstrated that the peaks in the range of 900–1200 cm−1 are generated by TO4-stretching modes, those in the range of 600–800 cm−1 are dominated by T–Obridging–T bending and bending and/or stretching vibrations, whereas the MO6 vibrations contribute mainly to the range below 350 cm−1. Note that in phyllosilicates the TO4 tetrahedra form a two-dimensional network of six-membered rings, and, therefore, the T–Obridging–T-bending vibrations can also be considered to be TO4 ring modes, as labelled in Fig. 2; in particular the strongest peak at 684 cm−1 results from the ring Obridging-breathing mode of Ag symmetry (Aspiotis et al., 2022). The lowest-energy peak at 92 cm−1 is attributed to the Ag mode involving T4O10 sheet and X anion translations perpendicular to the cleavage plane (McKeown et al., 1999), and, hereafter, we will refer to this mode as layer out-of-plane translations (see Fig. 2).
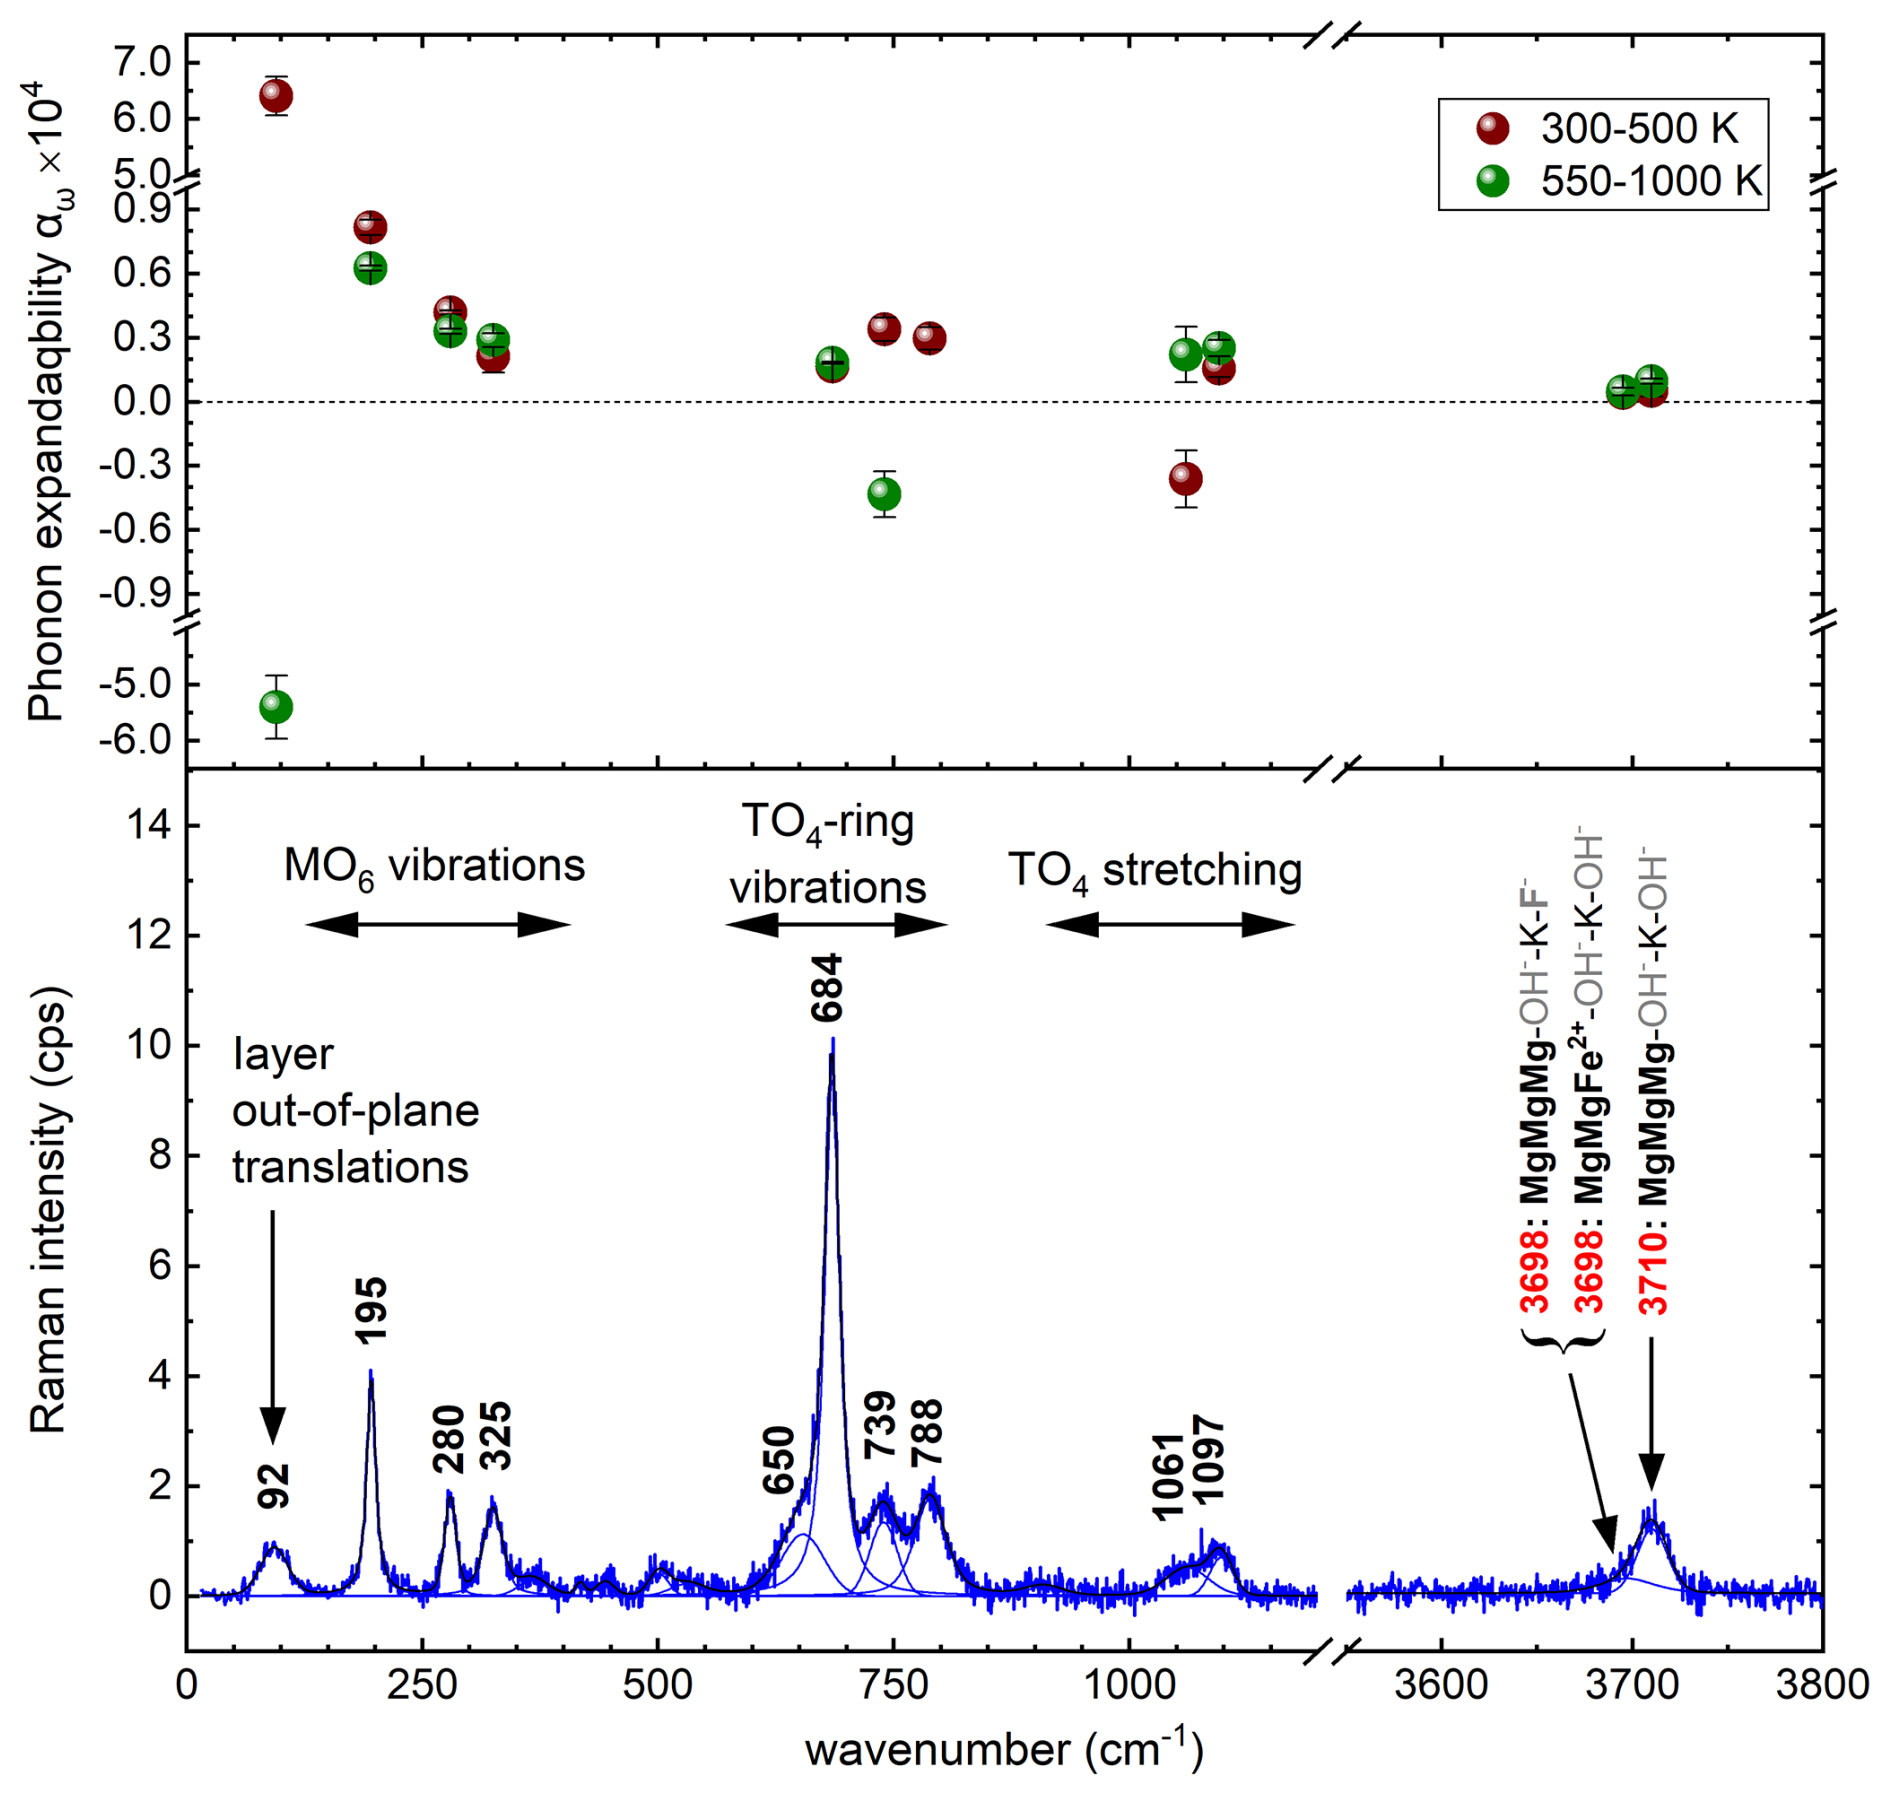
Figure 2Parallel polarized Raman spectrum of fluorophlogopite measured at room temperature with Ei [110] along with the fitting peak functions and phonon expandabilities derived from the corresponding linear trends in the range of 300–500 K (brown spheres) and 550–1000 K (green spheres). αω above 550 K is not given for the phonon mode at ∼ 788 cm−1 because the dispersion of the ω(T) data points is large, and the R2 factor of the linear fit is unsatisfactory.
Previous studies indicated that the electrical conductivity below 1000 K, as well as the chemical diffusion of F−, is strongest along [110] (Li et al., 2016; Zhang et al., 2022). Thus, we have chosen to perform detailed temperature runs with the Ei [110]. Due to prolonged acquisition time at each temperature, the Raman-scattering measurements were done on two separate days on two different specimens (one day per run, runs 1 and 2; see Table 2), but the data were fully reproducible within the overlapping temperature range. Figure 3a shows selected temperature-dependent Raman spectra measured between 300 and 1450 K. The Raman spectra for the complete heating–cooling sequences for run 1 (300–1100 K) and run 2 (300–1450 K) are presented in Figs. S2–S5 in the Supplement. All temperature-induced spectral changes up to 1100 K were fully reversible on subsequent cooling down (see Fig. 3b) apart from the tiny increase in the wavenumber of the peaks at ∼ 739 and 788 cm−1. A list of all peak positions and FWHMs, along with their uncertainties, is presented in the spreadsheets “Parameters run 1” and “Parameters run 2” in Table S3 of the Supplement.
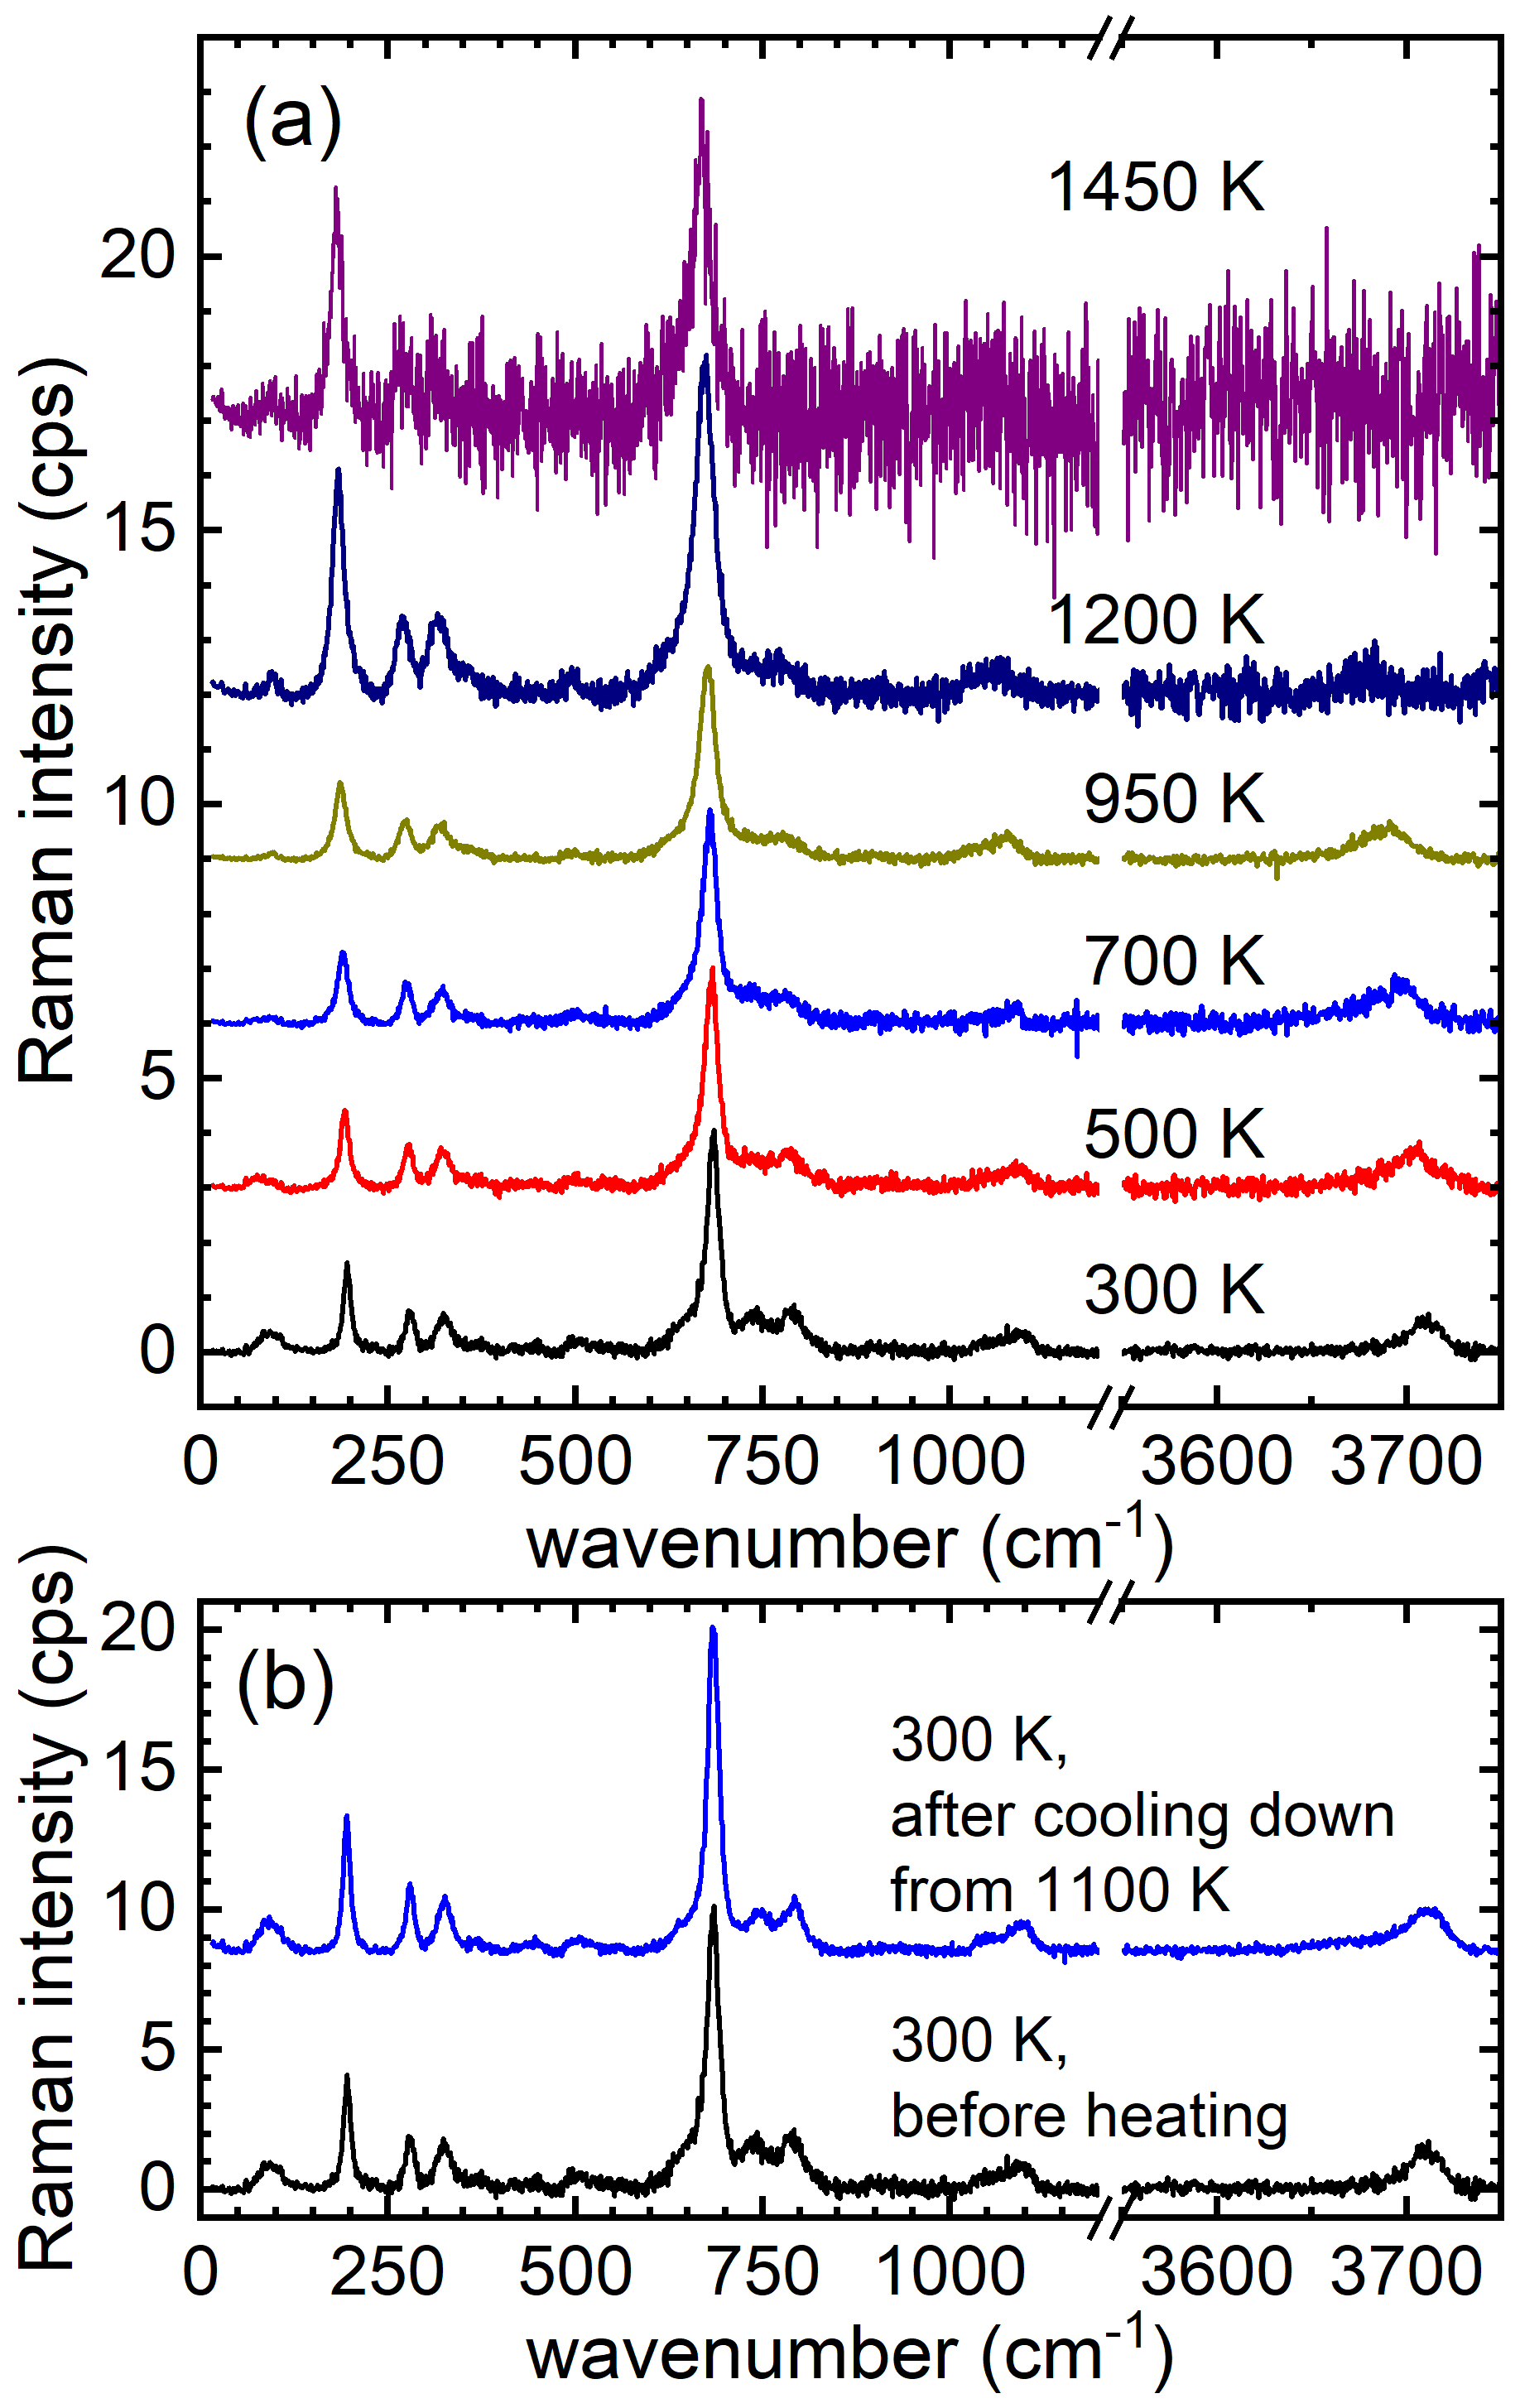
Figure 3(a) Selected Raman spectra measured at different temperatures with Ei [110] and (b) the spectra measured at 300 K before and after the heating–cooling cycle up to 1100 K. Spectra are vertically offset for clarity.
To track the response of the crystal atomic dynamics to a temperature increase, we have considered phonon expandabilities defined as (Rösche et al., 2022), which can be calculated from linear fits to ω(T) data points, using the relation . The complete dataset of the calculated αω values, where ω0 and are accompanied by their uncertainties, designated as Δω0 and ), is provided in the spreadsheet “Phonon expandabilities” of Table S3 in the Supplement. A few peaks showed distinct ω(T) trends in the range of 300–500 and 550–1000 K and, correspondingly, different αω (see Fig. 2, upper plot). It should be noted that, as defined, positive αω values correspond to a trivial positive volume thermal expansion as ω of the corresponding phonon mode is downshifted with the temperature increase due to enlargement of the interatomic distances and consequent weakening of the atomic bond strength. In the temperature range of 300–500 K, most of the analysed Raman-active phonon modes exhibit conventional positive phonon expandabilities, the values of which decrease with the increase in phonon wavenumber, similarly to magnesian amphiboles (Rösche et al., 2022). Only the TO4 stretching mode at ∼ 1061 cm−1, comprising mainly vibrations of the TO4 apical oxygen atoms (McKeown et al., 1999), exhibits a negative αω value in the range of 300–500 K, indicating strengthening of the T–Oapical bond with temperature increase. As apical oxygen atoms are shared between MO6 octahedra and TO4 tetrahedra (see Fig. 1), we suggest that heating up to ∼ 500 K initiates weakening of the M–Oapical–T interactions as a consequence of enhanced enlargement of MO6 volume. Above 500 K the phonon expandability of T–Oapical bond stretching at ∼ 1061 cm−1 becomes the same as that of the TO4 stretching at 1097 cm−1, which consists of T–Obasal bond stretching (McKeown et al., 1999). Below 550 cm−1 the lowest-energy mode at ∼ 92 cm−1 (layer out-of-plane translations) exhibits a phonon expandability, which is 1 order of magnitude higher than the αω values of the higher-energy modes and becomes negative above 550 K. Moreover, the phonon expandability of the T–O–T bending mode at 739 cm−1, whose wavenumber is sensitive to the A-site occupancy (Aspiotis et al., 2022), also becomes negative above 550 K, which further suggests ongoing dynamical instabilities in the temperature range 550–1000 K. It is worth noting that, despite the low intensity of the Raman peaks at ∼ 739 and 788 cm−1, their positions remain clearly distinct within uncertainties at any measured temperature between 550 and 1000 K (see Table S3 in the Supplement).
3.2 Thermally activated interlayer processes
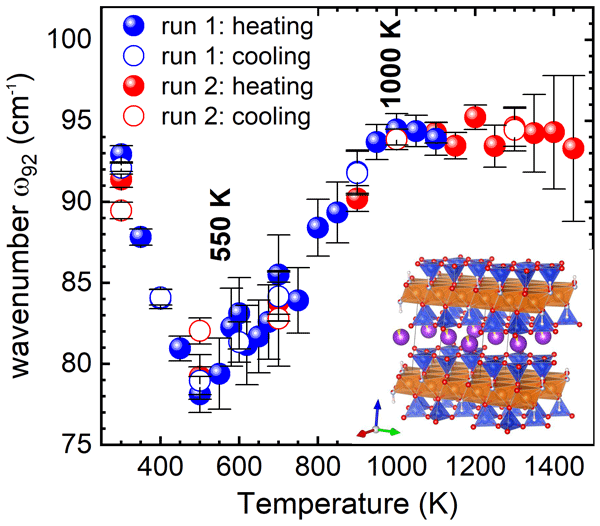
Further insights into the temperature-induced transformation processes can be derived from the temperature dependences of the wavenumber and FWHM of the layer out-of-plane translational mode (Fig. 4). The ω92(T) trend shows a plateau-like minimum between 450–550 K, and FWHM95(T) shows a maximum near 600–650 K, which is a classic example of a phonon-mode-driven phase transition (Husson, 1998; Margaritescu et al., 2018; Morana et al., 2023). This observation, coupled with the change in sign of the αω values at 550 K for this Raman vibrational mode, clearly indicates the occurrence of phonon-driven structural transformations at 550–650 K. It is most probable that this phase transition was mirrored by the hard phonon modes reported by Tutti and Lazor (2008) and Zhang et al. (2016). The excess in FWHM92 with respect to a parabolic baseline vanishes at 1000 K, where the anomalous increase in ω92 with increasing temperature also stops, indicating that the transformation processes are complete. Another interesting point is that, between 300 and 1000 K, the baseline of FWHM92 decreases anomalously. Commonly, the phonon FWHM should increase with temperature because of the phonon–phonon interactions and the ensuing phonon decay (Kuzmany, 2009). A decrease in the FWHM would indicate a structural ordering process, which is hardly probable at elevated temperatures. Another plausible explanation is that at 300 K the peak at 92 cm−1 consists of two overlapping components, the energetic difference of which (i.e. Δω) is less than the FWHM of the individual components, and, as a result, they appear as one broad peak. With a temperature increase the two components equalize in energy (i.e. Δω=0), effectively leading to a narrower peak. Given that the peak at 92 cm−1 arises from layer out-of-plane translations, one can speculate that the initial subtle splitting in energy is due to coexisting polytypes or lower translation symmetry along the c axis on a relatively short length scale, below the sensitivity of in-house XRD, which diminishes on heating. Indeed, the structural differences between the unit layers of 1M and 2M1 polytypes consist of tiny displacements of the apical oxygen atom (O3), as well as of the X-site anion (O4) (Takeda and Ross, 1975). The former would affect the intra-layer octahedral–tetrahedral interactions, whereas the latter would impact the interlayer interactions as the A-site cations lie just above and below the X site (Takeda and Ross, 1975). The anomalous negative phonon expandability of the T–Oapical bond stretching at 1061 cm−1 up to 500 K does reveal initial weakening of the octahedral–tetrahedral linkages, while the ω92(T) and FWHM92(T) trends clearly show ongoing interlayer structural instabilities between ∼ 300–1000 K, which should also affect the interlayer K+ cations.
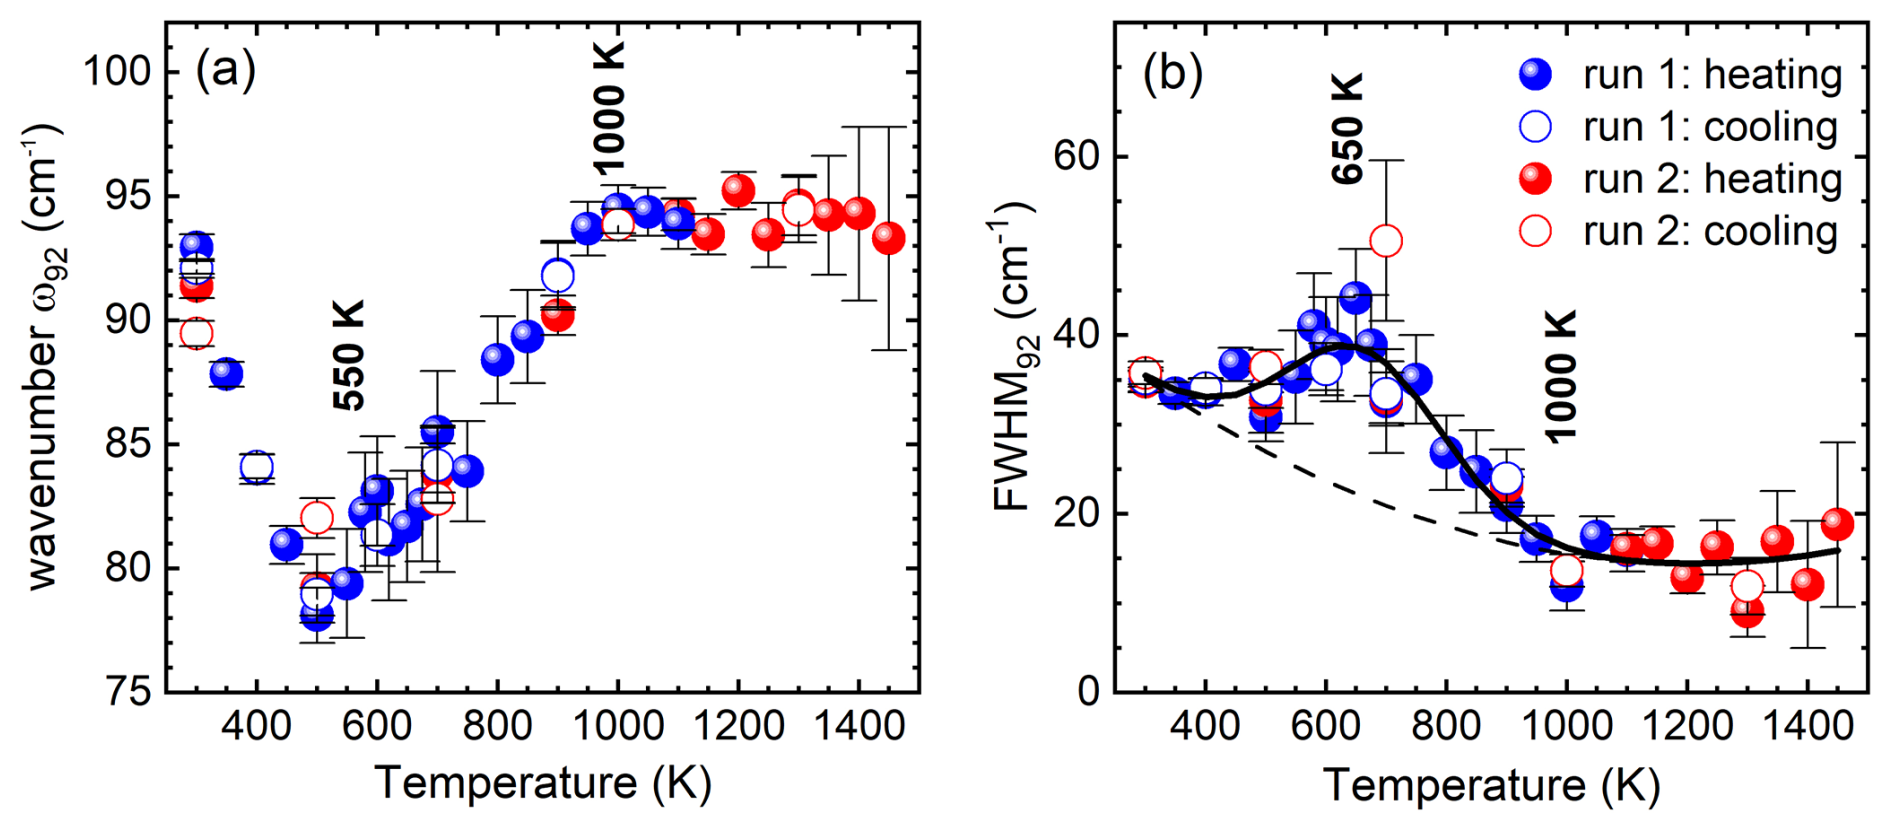
Figure 4Temperature dependence of (a) the wavenumber and (b) the FWHM of the layer out-of-plane translational mode up to 1100 K (run 1, blue symbols) and up to 1450 K (run 2, red symbols). The open symbols of both runs represent data collected during cooling. Dashed and solid lines in (b) are parabolic baseline and Gaussian function fitting the FWHM92(T) data points.
Raman-active phonon modes involving vibrations of A-site cations are symmetry-forbidden; however, one can indirectly derive information about the thermal behaviour of the K+ cations from the wavenumber of the T–Obridging–T mode at ∼ 739 cm−1, which is sensitive to the A-site occupancy (Aspiotis et al., 2022). As can be seen in Fig. 5a, ω739(T) has a clear minimum near 650 K, and it anomalously increases with increasing temperature up to 1050 K. Previously we have demonstrated that ω739 increases with the increase in A-site vacancies (Aspiotis et al., 2022). Hence, the ω739(T) trend suggests that, in the range of 650–1050 K, the interactions between the K+ cations and T4O10 sheets weaken considerably due to the ongoing rearrangements in the layer staking, which, in turn, leads to K+ mobilization in the interlayer space. This highlights that, between ∼ 650 and ∼ 1050 K, delocalized K+ cations can act as charge carriers enhancing the electrical conductivity (Li et al., 2016). On cooling down, ω739(T) shows hysteresis and does not completely recover. Using the relation between ω739 and the amount of AK+ (xK) for phlogopite, (Aspiotis et al., 2022), the loss of AK+ after cooling down from 1450 K is approximately 0.02 apfu, i.e. 2 % K+ loss. Although the slight decrease in K content cannot be observed by EMPA due to the typical uncertainty of 1 %–2 % (see Table S1), the apparent ω739 upshift implies such a loss of K. For the sample recovered from 1100 K the change in ω739 corresponds to a K+ loss less than 0.01 apfu.
The temperature dependence of the ratio between the sum of the integrated intensities of the OH stretching and the sum of the integrated intensities of the framework vibrations, i.e. of all peaks between 15–1215 cm−1, indicates a subtle but steady increase with temperature up to 1100 K for run 1. This trend could not be observed for run 2 due to the different kinetics resulting from the smaller number of steps within the 300–1100 K temperature range despite the fact that the heating rate was kept constant at 20 K min−1. Nevertheless, a sharp increase can be spotted between 1100 and 1150 K during run 2 (red symbols in Fig. 5b). We attribute this to intensified amplitudes of the H+ vibrations just before H+ cations to de-bond from the X-site O2−, similarly to the thermally induced H+ delocalization in amphiboles (Della Ventura et al., 2018; Rösche et al., 2022). Above 1150 K the OH-stretching peaks completely disappear, but they reappear on subsequent cooling down, indicating that between 1150 and 1450 K all H+ cations are mobilized and can contribute considerably to phlogopite conductivity. In addition, the intensity ratio also exhibits a maximum near 550–650 K, which could further mark the onset of dynamic instability related to interlayer rearrangements and mobilization of AK+ cations. Within uncertainties, the intensity ratio completely recovers on cooling down from 1100 K, but after cooling from 1450 K it decreases to 0.035(8) against the initial value of 0.051(6). The change in the intensity ratio indicates 35 ± 10 % reduction in OH− groups. The onset temperature of dehydroxylation (1100 K) is close to the temperature of 1150 K, above which potassium leakage is enhanced (see Fig. 5a), which suggests that the release of OH− groups facilitates the escape of K+ ions from the mica structure. There is a fractional amount of lost OH− that exceeds that of ejected K+ cations, indicating additional high-temperature processes causing a reduction in hydroxyl groups.
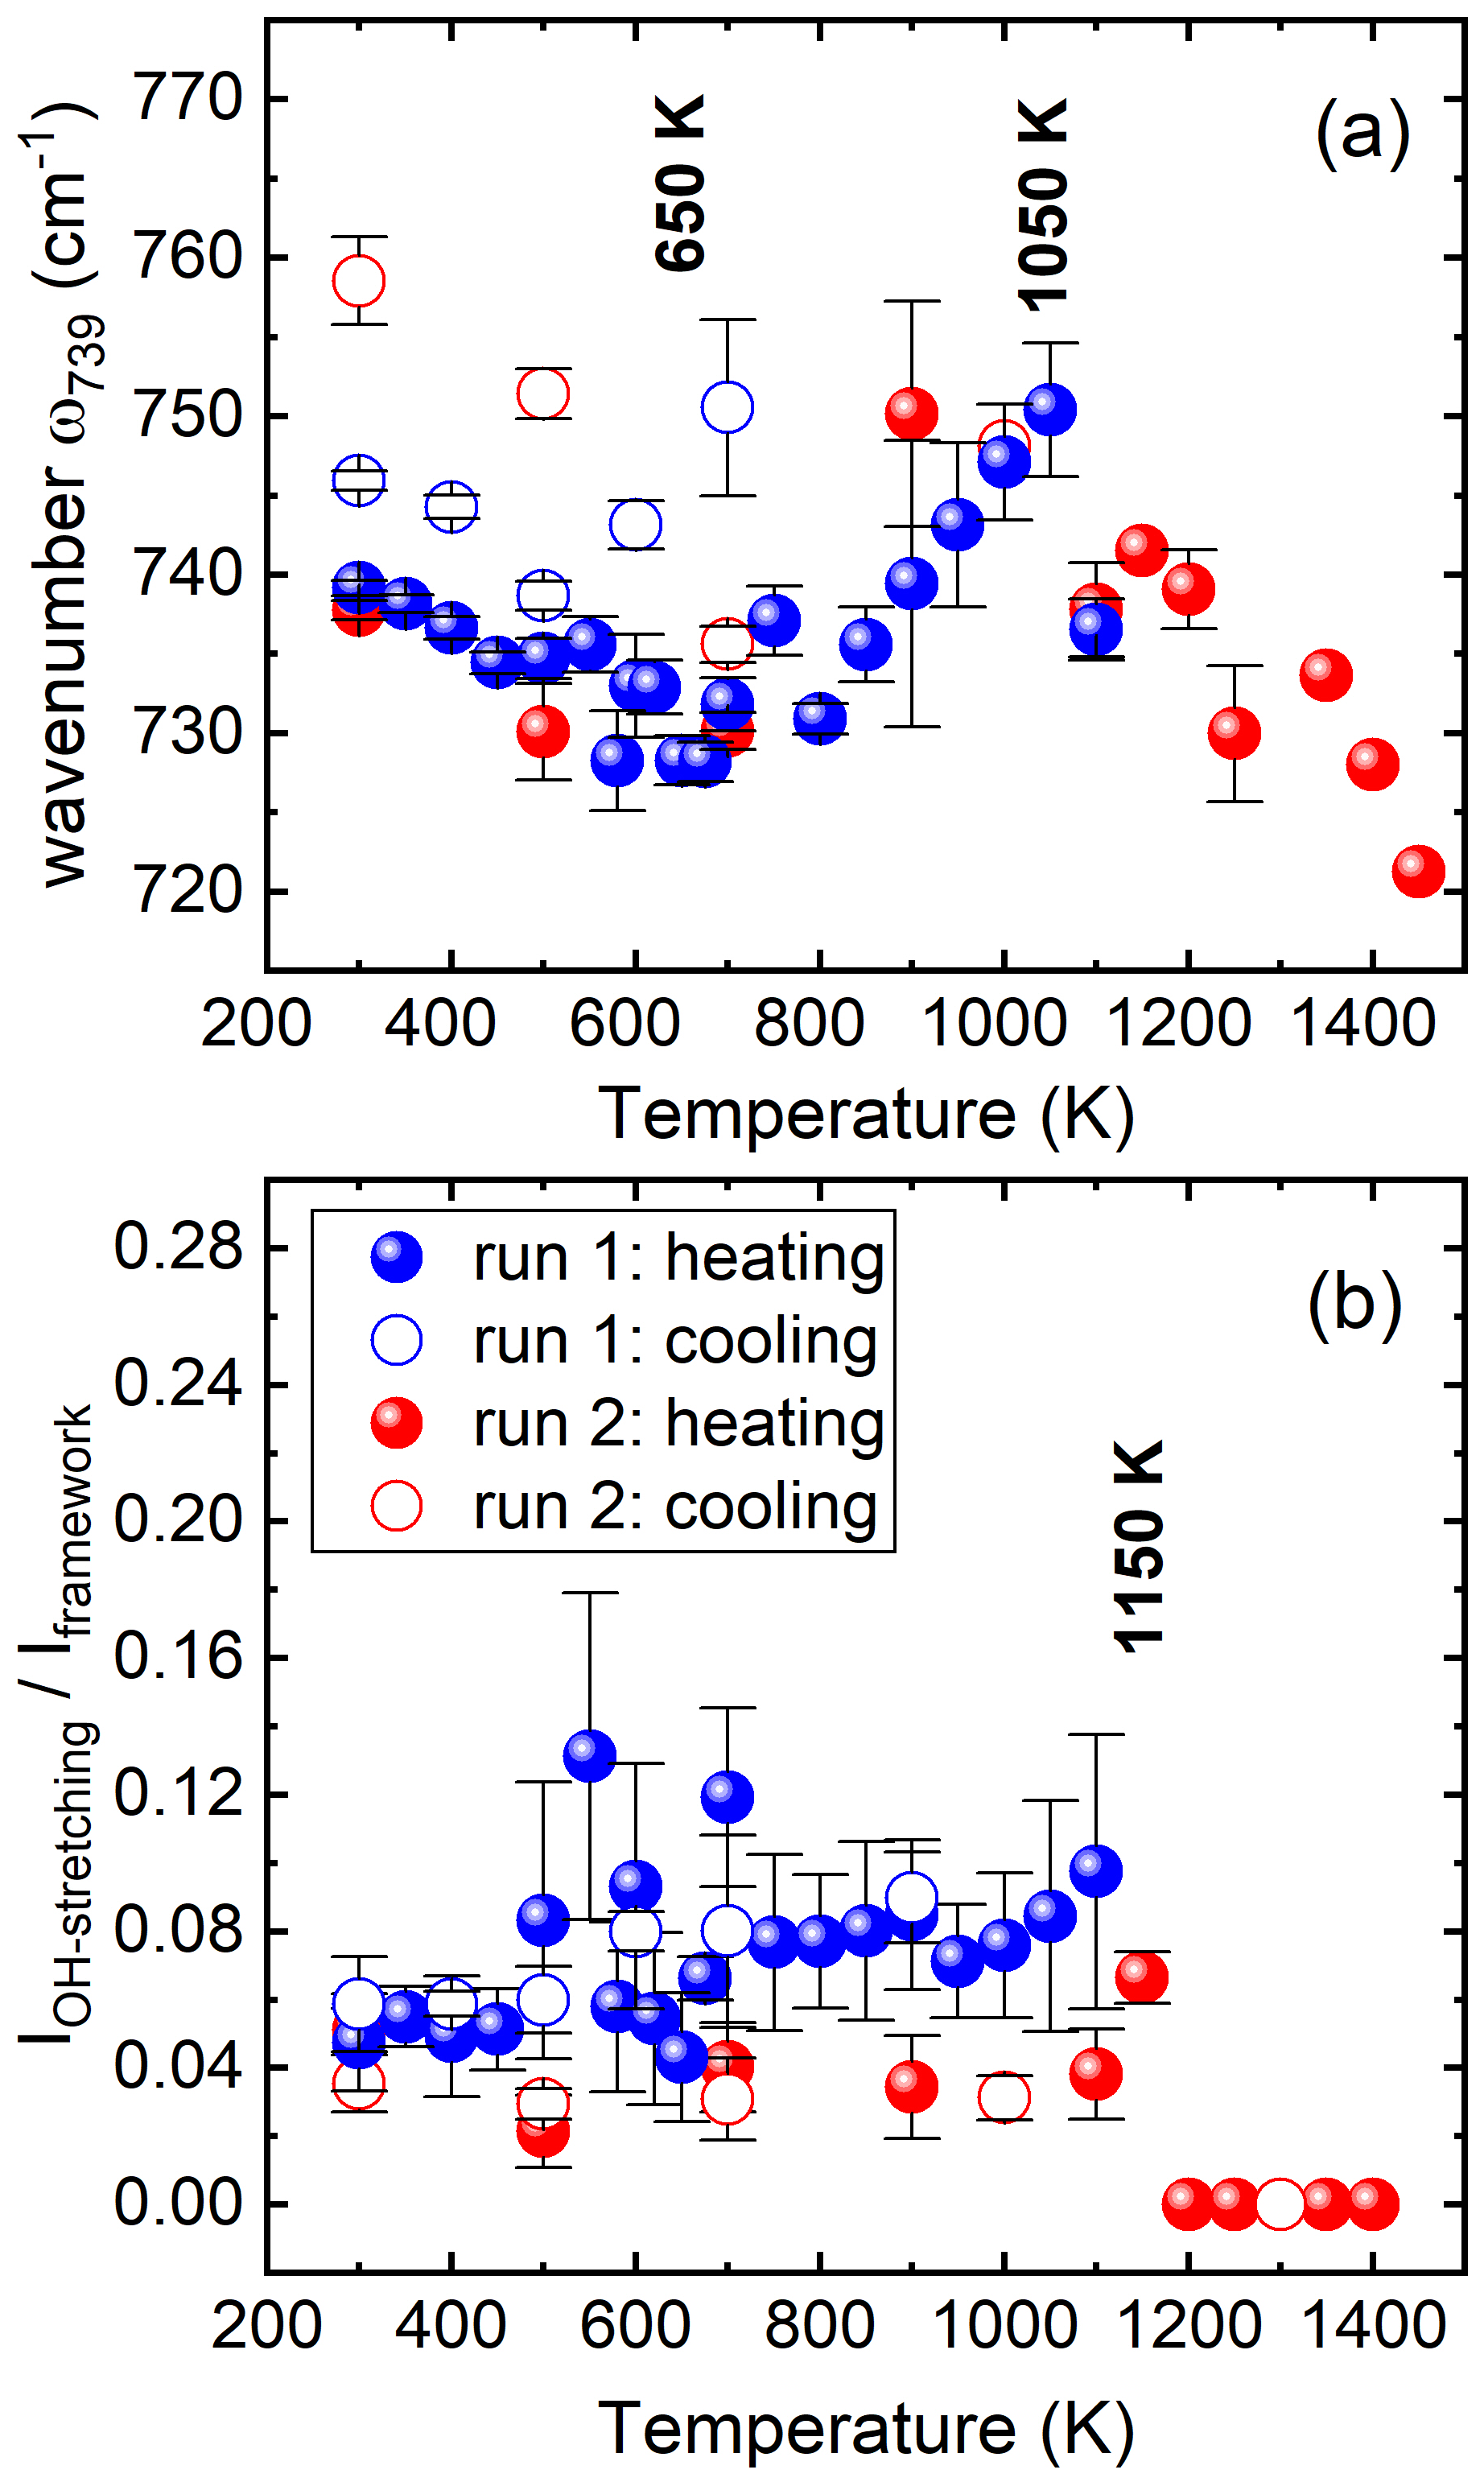
Figure 5Temperature dependence of (a) the wavenumber of the T–Obridging–T mode sensitive to A-site occupancy and (b) the intensity ratio between the OH stretching and framework vibrations up to 1100 K (run 1, blue symbols) and up to 1450 K (run 2, red symbols). The open symbols of both runs represent data collected during cooling.
3.3 Thermally induced oxidation of MFe2+
In magnesian amphiboles the occurrence of Fe Fe3+ oxidation could be detected via the appearance of an extra RRS signal near 600 cm−1 (Rösche et al., 2022), originating from FeO6-related polaron (longitudinal optical polar phonon coupled with electron). Under normal (non-resonance) conditions, polar optical phonons in centrosymmetrical crystals, such as phlogopite (), are infrared-active but not Raman-active. They become allowed by symmetry when coupled with excited electrons because then the selections rules are changed, and, for Fe-rich amphiboles, this leads to a complete change of the spectrum profile when the polarization of the incident light Ei is parallel to the polaron dipoles (Mihailova et al., 2021; Bernardini et al., 2023, 2024). For Fe2+-bearing Mg-rich hydrous silicates, as in the fluorophlogopite sample studied here, RRS signals are expected to appear as additional peaks without changing the overall spectral profile (Rösche et al., 2022).
Extra RRS signals could not be resolved in the high-temperature spectra of phlogopite, but a weak extra RRS signal at 602 cm−1 was detected at room temperature after cooling down from 1450 K (see Fig. 6a), indicating irreversible Fe Fe3+ oxidation. The oxidation of Fe in complex silicates containing TO4 rings is also mirrored by the minimum in the temperature dependence of the wavenumber of the TO4 ring breathing mode, which is caused by a local change in the ring puckering to adopt to the smaller size of adjacent Fe3+O6 octahedra (e.g. Watenphul et al., 2017; Della Ventura et al., 2018; Mihailova et al., 2022). Such a minimum is observed for Fe-containing fluorophlogopite at 1300 K (see Fig. 7), suggesting that this is the temperature of the beginning of irreversible Fe oxidation in the studied single-crystal sample. Since only 5 % of the M sites are occupied by Fe2+ in the pristine phlogopite sample studied, the MO6-related phonon modes may not show detectable anomalies at the temperature of Fe oxidation. Yet, a minimum in ω325(T) at 1300 K (see Fig. 7b), as well as a subtle maximum in FWHM195 cm−1 (Fig. 7c), was detected, indicating a local structural transformation, most probably related to the shrinking of the MO6 octahedra when Fe2+ irreversibly transforms into Fe3+. These two MO6-related phonon modes also exhibit anomalies near 580 K (see Fig. 7). The ω325(T) trend shows a weak minimum, while the mode near 195 cm−1 exhibits a kink in its FWHM near 580 K (see Fig. 7), indicating a change in the channel of phonon decay (Kuzmany, 2009), and its phonon expandability is reduced above 550 K (see Fig. 2). These anomalies around 580 K of the MO6-related phonon modes might be due to the interlayer instabilities or the onset of polaron formation, i.e. the onset of reversible Fe Fe3+ reaction.
To double check whether reversible onset of Fe2+ ↔ Fe3+ exchange can be detected above 550 K, we have performed in situ Raman-scattering experiments with a different orientation of the incident light polarization Ei. As has been said above, the Raman-active phonon modes of biotite do not show any anisotropy in intensities within the plane parallel to the cleavage plane. However, biotite is well known for its pleochroism, i.e. strong anisotropy in optical absorption along [100] and [010]. The anisotropy in the electron density of states may affect the orientation of polaron dipoles and, thus, the appearance of thermally activated RRS signals related to reversible Fe2+ ↔ Fe3+ oxidation in the Raman spectra. Hence, we heated the sample up to 1000 K when Ei was along [010] (run 3), as well as along [100] (run 4). However, no RRS signal was resolved at 1000 K (Fig. 6b). Further studies on biotite with a larger amount of MFe2+ are necessary to thoroughly check if reversible Fe2+ ↔ Fe3+ oxidation occurs in mica, similarly to amphiboles (Della Ventura et al., 2018; Mihailova et al., 2021; Bernardini et al., 2023, 2024, 2025).
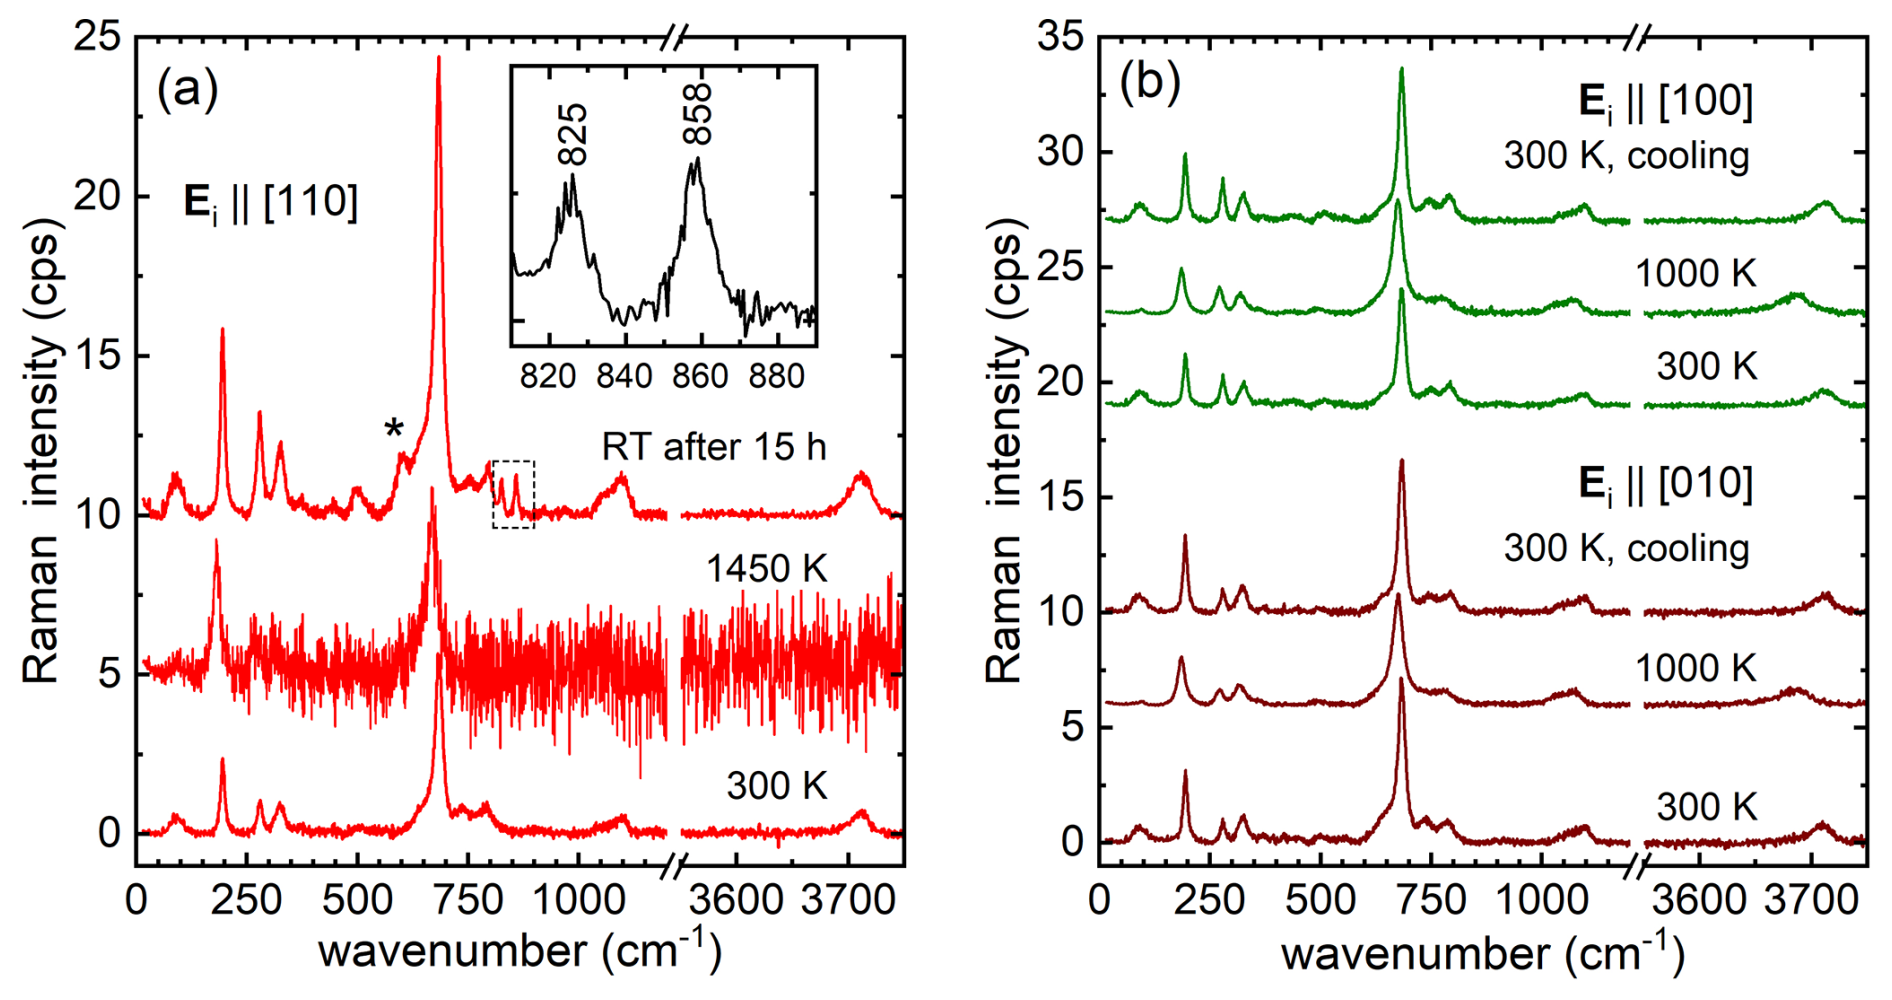
Figure 6(a) Spectra measured in run 2, as well as in (b) runs 3 and 4. The asterisk in (a) marks the RRS signal at 603 cm−1 resolved in the room-temperature (RT) spectra after cooling down from 1450 K. The insert shows the spectral profile marked with a dashed rectangle in (a) on an enlarged scale. Spectra are vertically offset for clarity.
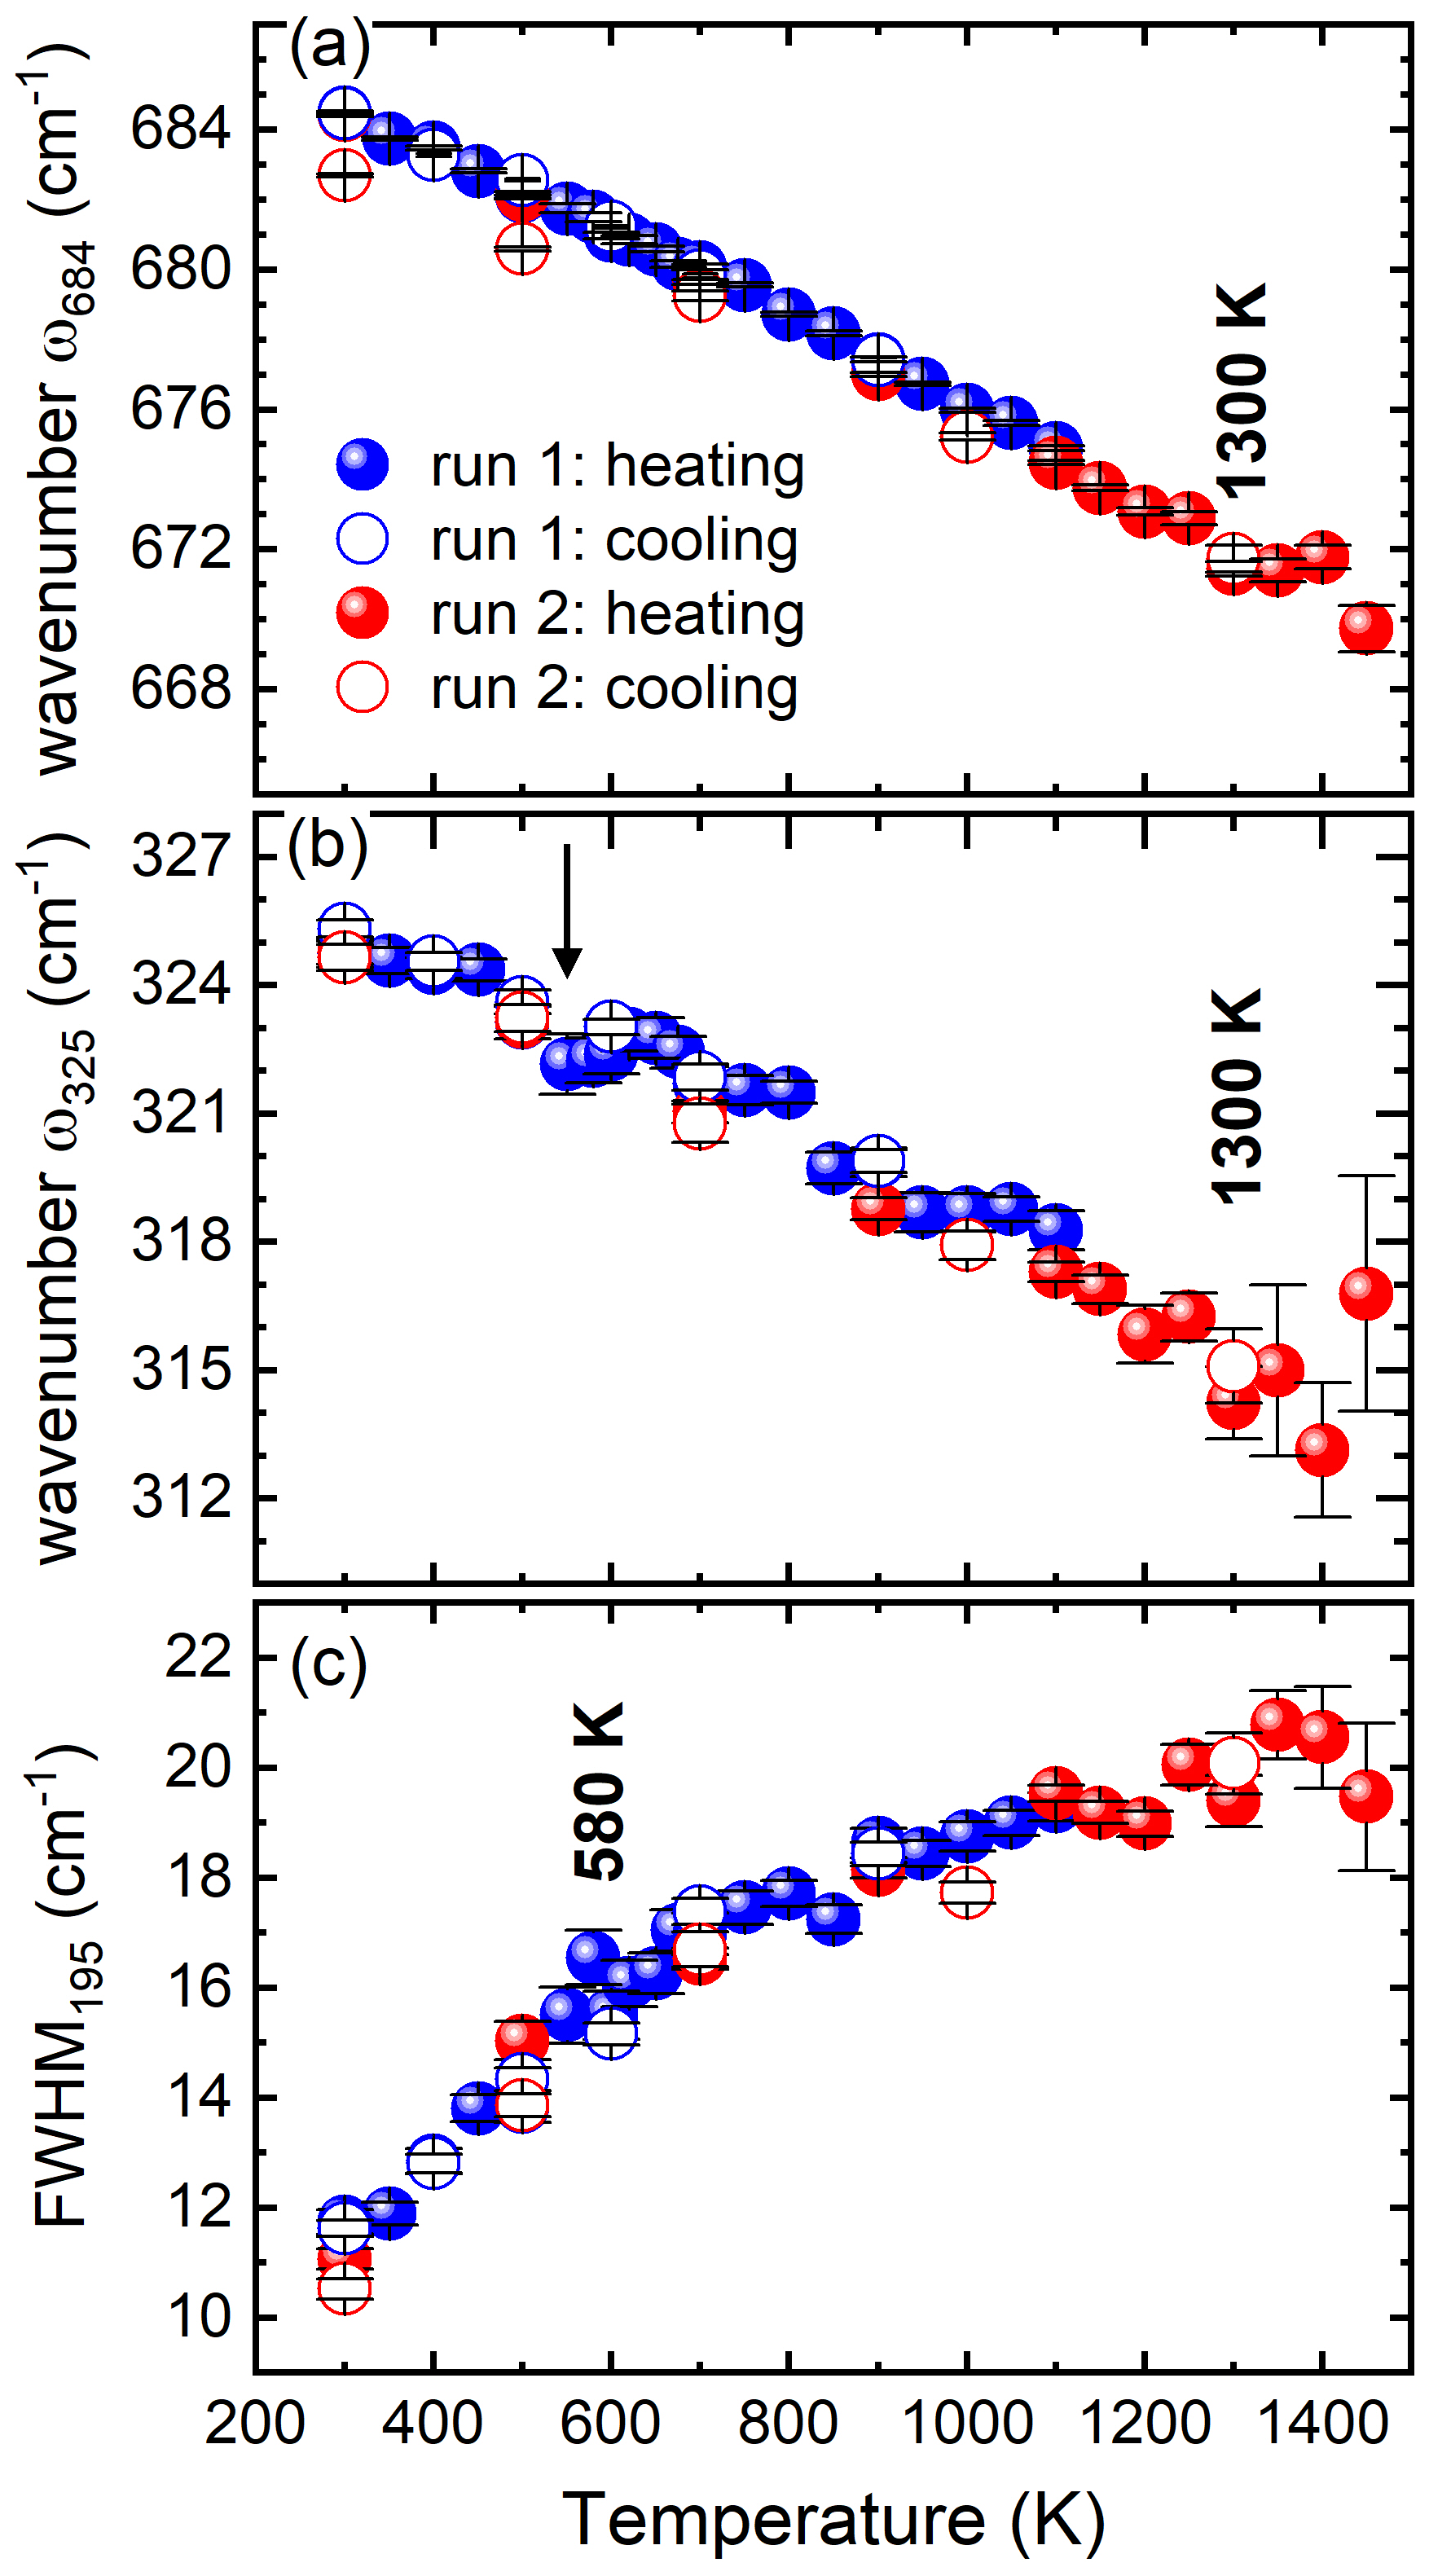
Figure 7Temperature dependence of (a) the wavenumber of the TO4 ring breathing mode at 684 cm−1, (b) the wavenumber of the MO6 mode at 325 cm−1, and (c) the FWHM of the phonon mode at 195 cm−1. The arrow marks the subtle minimum near 580 K in ω325(T).
3.4 Partial structural breakdown of phlogopite at high temperatures
The room-temperature Raman spectrum of fluorophlogopite heated up to 1450 K shows two weak extra peaks at ∼ 825 and 858 cm−1 (see Fig. 6a), which are assigned to forsterite (Mg2SiO4) with an end-member composition (Kuebler et al., 2006; do Nascimento-Diaz et al., 2021). A thermal decomposition of fluorophlogopite to forsterite has been previously detected by Raman spectroscopy and XRD, starting around 1273 K for both F-poor and F-rich phlogopite and being completed at ∼ 1373 K for F-poor phlogopite only (Sun et al., 2022). We analysed the specimen recovered from 1450 K by EMPA and singe-crystal XRD. The results are given in Tables 1 and 2, as well as in Tables S1 and S2 in the Supplement. Thermally induced cracks can be clearly seen in the backscattered electron image (compare Fig. 8b and c), but, overall, the specimen appears to be chemically homogenous, and spatial areas rich in forsterite were not detected within a spatial resolution of 10 µm. Olivine was also not detected by XRD. The XRD analysis indicates only a subtle reduction in the unit-cell volume, which is consistent with the partial oxidation of Fe and a reduction in hydroxyl groups derived from EMPA (see Table 1). Simulations of the measured room-temperature Raman spectrum of fluorophlogopite recovered from 1450 K with weighted spectra of pristine phlogopite and forsterite measured under the same experimental conditions indicate that only a minor fraction of ∼ 1 % of fluorophlogopite decomposed to forsterite (Fig. 8a). The fact that forsterite cannot be resolved by XRD suggests that forsterite grains are of small size, on the nanometre scale, below the detection limit of in-house XRD experiments. An open question remains regarding how exactly phlogopite decomposes to forsterite as no other crystalline phases resulting from the phlogopite structure breakdown were detected (Sun et al., 2022). A simple chemical reaction for the phlogopite end-member composition would be KMg3AlSi3O10(OH)2 → Mg2SiO4 + amorphous KMgAlSi2O7 + H2O↑. Although, in general, Raman spectroscopy can probe non-crystalline phases, we could not detect any additional Raman signals that might be related to amorphous silicate, probably because of the weak signal of amorphous material, if any, and the small fraction of decomposed fluorophlogopite. It is worth noting that Trønnes (2002) has suggested that phlogopite in mineral assemblages can break down to forsterite and pyrope, but our experiments on single-crystal fluorophlogopite did not show any traces of garnet as a solid-phase decomposition product, in accordance with the results by Sun et al. (2022).
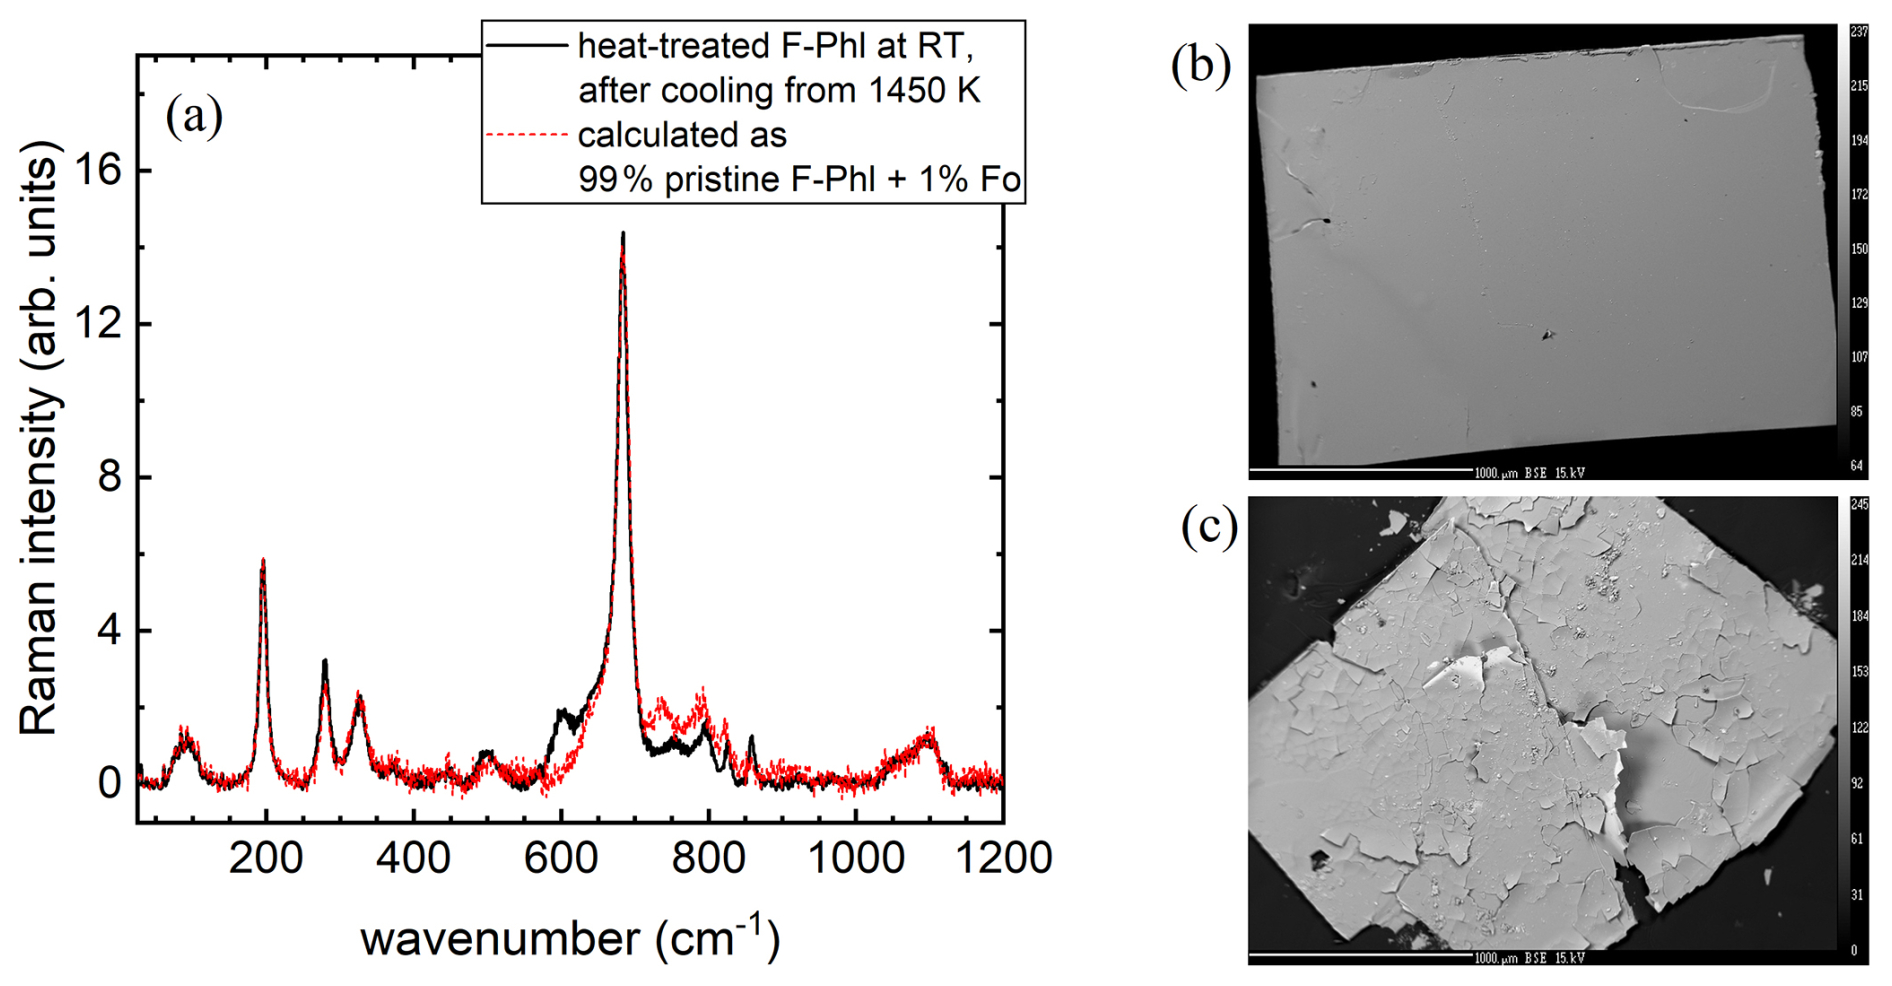
Figure 8(a) Room-temperature spectrum of fluorophlogopite (F-Phl) measured after cooling down from 1450 K (black line in a) compared to a simulated spectrum calculated from spectra of pristine F-Phl and forsterite (Fo) measured under the same experimental conditions using . (b) Backscattered electron images of pristine F-Phl and (c) heated up to 1450 K; scale bars in both (b) and (c) correspond to 1000 µm.
In order to better follow the spatial distribution of forsterite, we have performed Raman mapping at room temperature on the fluorophlogopite specimen heated up to 1450 K using a microscope with enhanced confocality. Quite surprisingly, at first glance, the spectra collected on the surface with a confocal WITec alpha300R Raman spectrometer and 100 × (NA = 0.90) objective showed much stronger forsterite peaks (Fig. 9a) than the spectra collected with a long-working-distance objective 50 × (NA = 0.35) in in situ temperature-dependent Raman-scattering experiments (see Sect. 2.2.1). It should be emphasized that at room temperature we have collected multiple single-point spectra with the Horiba T64000 spectrometer and objective 50 × to verify the reproducibility of the spectra. To check if the difference in the spectra measured with the two spectrometers was due to different spatial resolution, we have conducted in-depth z-line scans and (x,y)-2D mapping, with an in-depth step size between 0.45 and 1 µm and a lateral step size of 0.5 µm, using a WITec alpha300R spectrometer. These analyses reveal that forsterite is formed mainly on the surface parallel to the cleavage plane, and an exponential fit to the experimentally determined intensity ratio against the distance from the sample surface (Fig. 9b) indicates that the forsterite fraction already decays at a depth of ∼ 0.56 ± 0.03 µm, as determined by the exponential depth decay constant (see figure caption of Fig. 9). Lateral (x,y) Raman maps on the intensity ratio conducted on the sample surface (Fig. 9c) indicate frail submicron-level inhomogeneous distribution of forsterite, even when a threshold ρ value of the intensity ratio in the Raman map is chosen to correspond to a superficial layer of 100 nm in thickness (Fig. 9d). If a ρ value of 0.1, corresponding to a 1 µm thick layer, is considered then the inhomogeneity in the Raman map vanishes, emphasizing that the olivine is formed on the surface.
Overall, understanding the factors that govern the stability and thermal activation of charge carriers of fluorophlogopite is essential for interpreting geological processes in deep-Earth and subduction zones, where hydrous silicates can be regarded to be highly effective metasomatic agents for the lithospheric mantle wedge. The initial weakening of tetrahedral–octahedral sheet interactions below 500 K, triggering the potassium mobilization at 550–650 K, may facilitate the onset of K release into the mantle wedge at higher temperatures. Progressive H+ delocalization at ∼ 1150 K and irreversible MFe MFe3+ oxidation starting at ∼ 1300 K reflect the development of possible charge carriers prior to fluorophlogopite decomposition. Furthermore, the development of local structural and crystallochemical defects, as revealed by in situ Raman spectroscopy, implies that metasomatism of the mantle wedge may develop over a much wider temperature range and consequently span a larger depth profile than previously thought based mainly on established pressure–temperature stability fields of defect-free minerals. Further substitution of F− for OH− will bring these crystallochemical transformations to even greater depths compared to stoichiometric phlogopite, critically extending fluorophlogopite stability fields during subduction and modulating deep volatile cycling (Sun et al., 2022; Steenstra et al., 2024).
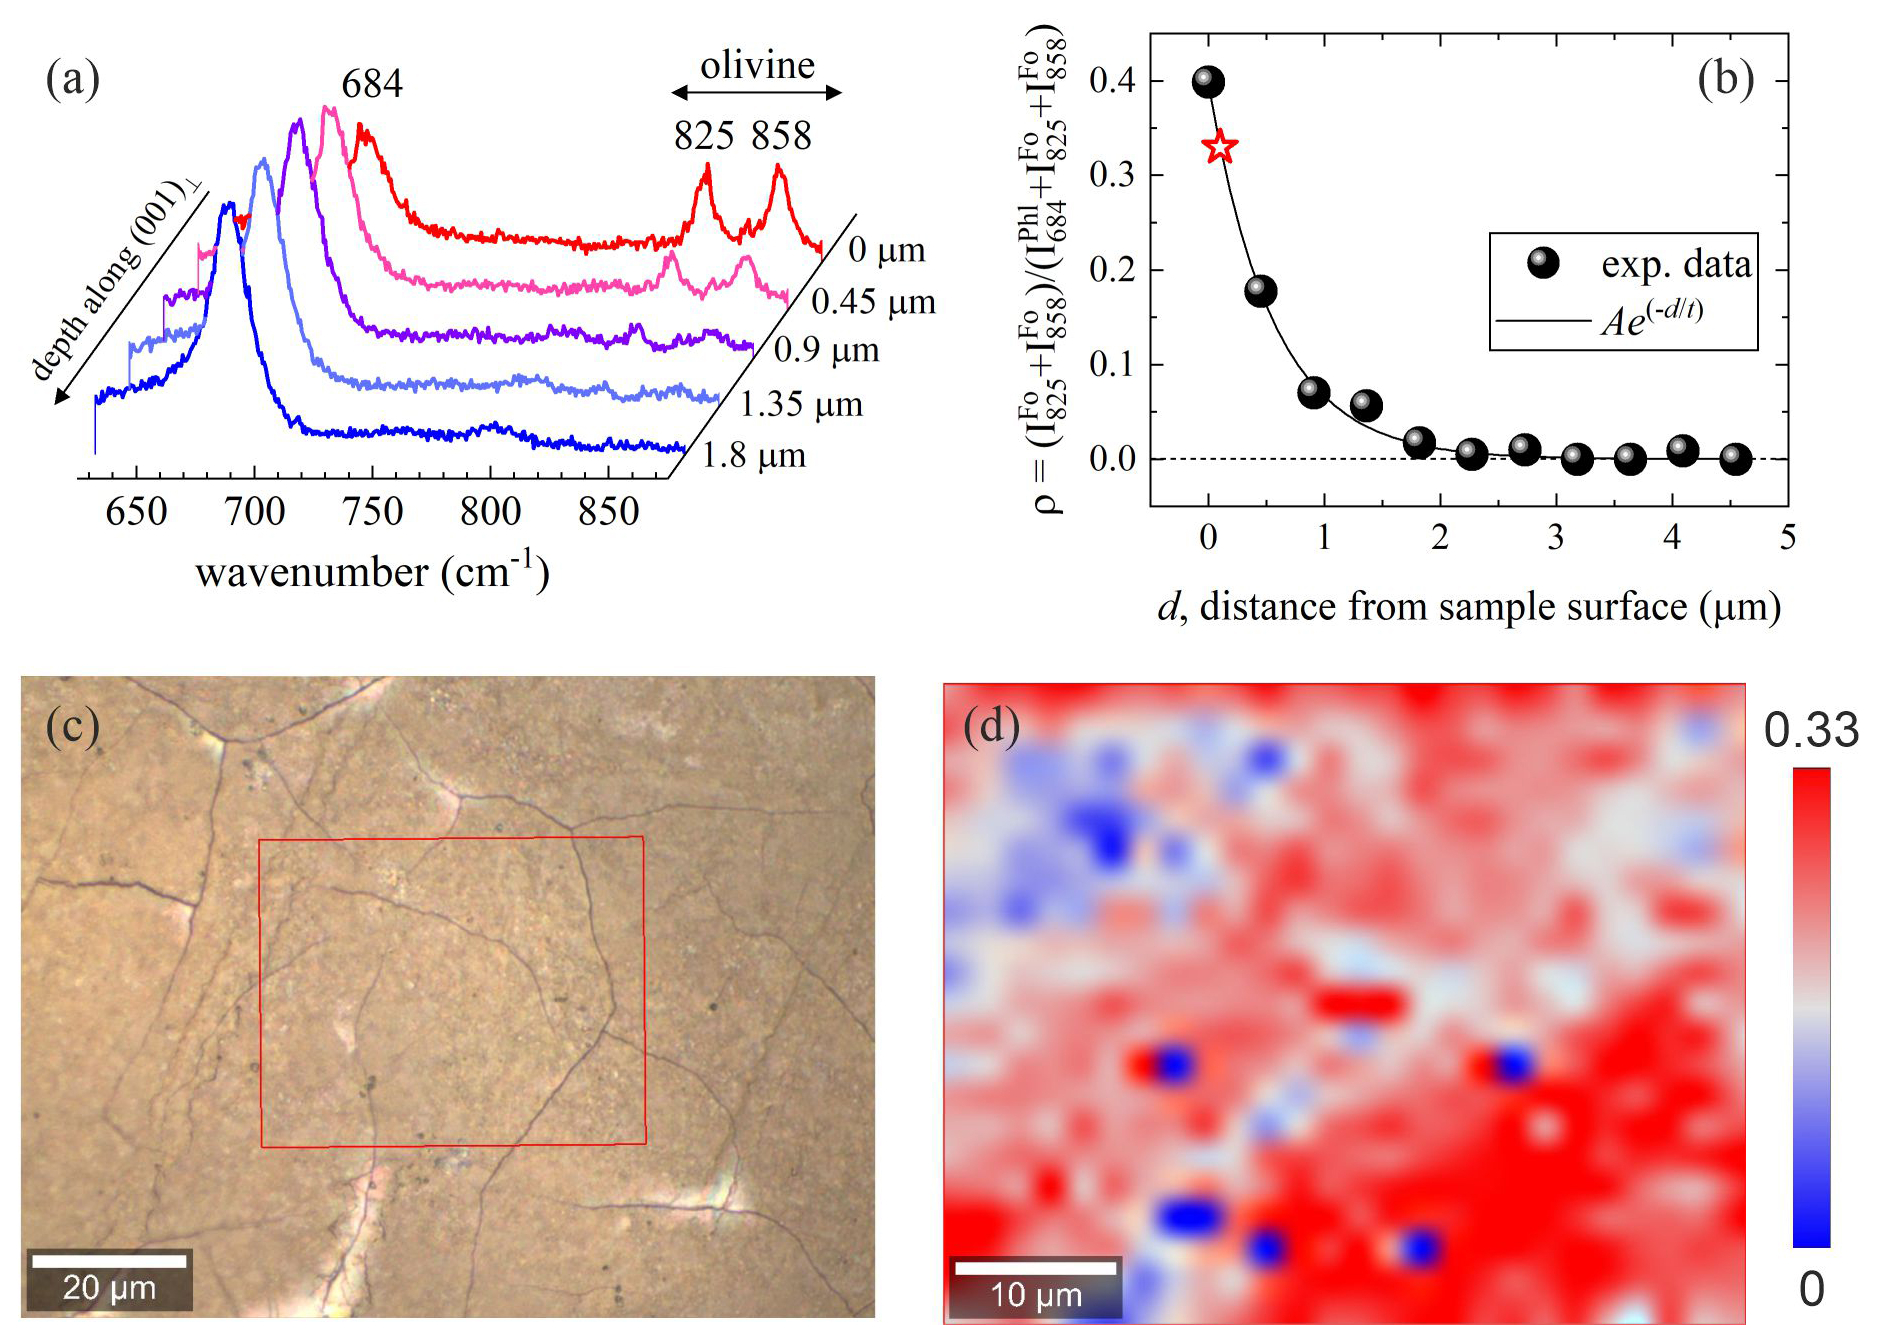
Figure 9(a) Room-temperature Raman spectra of fluorophlogopite heated at 1450 K measured at different distances from the sample surface; (b) intensity ratio , quantifying the in-depth distribution of relative amount of forsterite (Fo) versus phlogopite(Phl), along with an exponential fit ) (solid line) to experimental data points (spheres); (c) optical image of the sample surface; and (d) Raman map of the intensity ratio ρ measured on the sample surface from the area marked with a red rectangle in (c). The threshold ρ value of 0.33 corresponds to a depth of 100 nm, and it is marked with a red star in (b).
Our in situ high-temperature Raman spectroscopic study reveals that Fe2+- and OH-bearing fluorophlogopite undergoes multiple transformations on heating in air up to 1450 K:
-
up to ∼ 500 K – an initial decline in intralayer interactions between the tetrahedral and octahedral sheets;
-
at 550–650 K – a phonon-driven structural transformation, allowing for mobilization of interlayer A-site cations;
-
at ∼ 1150 K – delocalization of H+;
-
at ∼ 1300 K – irreversible exchange MFeFe3+;
-
at 1400–1450 K – a partial decomposition of fluorophlogopite to nano-sized forsterite, which is formed predominantly within a superficial layer parallel to the cleavage plane; since no loss of fluorine was detected in the sample recovered from 1450 K, one can suggest that the structural collapse is triggered by the process of dehydroxylation.
We could not detect any spectral or crystallochemical changes suggesting diffusion or leakage of fluorine anions in the studied temperature range up to 1450 K. However, the temperature dependencies of phonon modes sensitive to the A-site occupancy and O–H bonds provide direct evidence for the existence of at least two types of thermally activated charge carriers: (i) between 500–650 and ∼ 1050 K potassium cations are mobilized in the interlayer space and can contribute considerably to the conductivity parallel to the cleavage plane; (ii) hydrogen cations between ∼ 1150 and 1450 K are fully delocalized as a large fraction of H+ (∼ 65 %) does not leave the crystal and therefore can also contribute to the high-temperature conductivity of phlogopite. It should be highlighted that the activation of the latter charge carriers at elevated temperatures is mostly dependent on experimental duration; content of mixed-valence elements such as Fe; and external environment, i.e. oxidizing conditions. Moreover, anomalies in the temperature dependence of the TO4 ring breathing mode indicate that a thermal activation of FeO6-related polarons may happen between 580 and 1300 K, whereas above 1300 K the already delocalized electrons eject the crystal bulk, and polaron conductivity would no longer be possible. Finally, it should be mentioned that the specific temperature ranges of different stages of transformation of fluorophlogopite are likely to be influenced by the initial content of MFe2+ and X(OH)− and the environmental atmosphere.
Data derived from this research are presented in the paper and the Supplement. Additional data are available upon request from the corresponding author.
The supplement related to this article is available online at https://doi.org/10.5194/ejm-38-461-2026-supplement.
BM initiated the project. CR and SA carried out the Raman spectroscopic experiments and data analyses, as well as the EMP data evaluation. TM performed the XRD analyses. STMP provided the samples. SA and BM prepared the manuscript with contributions from CR, TM, and STMP. All of the authors discussed and interpreted the results.
The contact author has declared that none of the authors has any competing interests.
Publisher's note: Copernicus Publications remains neutral with regard to jurisdictional claims made in the text, published maps, institutional affiliations, or any other geographical representation in this paper. The authors bear the ultimate responsibility for providing appropriate place names. Views expressed in the text are those of the authors and do not necessarily reflect the views of the publisher.
Financial support by the Deutsche Forschungsgemeinschaft (grant nos. MI 1127/13-1, INST 152/1028-1 FUGG, and EXC 2176) is gratefully acknowledged. We thank Stefanie Heidrich and Peter Stutz, University of Hamburg, for the help with the WD-EMPA measurements and sample preparation. The authors are grateful to two anonymous reviewers for the constructive suggestions, which have improved the clarity and quality of this paper. All of the minerals analysed in this study are from the collection of the Museum of Nature Hamburg – Mineralogy, Leibniz Institute for the Analysis of Biodiversity Change.
This research has been supported by the Deutsche Forschungsgemeinschaft (grant nos. MI 1127/13-1, INST 152/1028-1 FUGG, and EXC 2176, project no. 390893796).
This paper was edited by Qun-Ke Xia and reviewed by two anonymous referees.
Aspiotis, S., Schlüter, J., Redhammer, G. J., and Mihailova, B.: Non-destructive determination of the biotite crystal chemistry using Raman spectroscopy: how far we can go?, Eur. J. Mineral., 34, 573–590, https://doi.org/10.5194/ejm-34-573-2022, 2022.
Bernardini, S., Della Ventura, G., Schlüter, J., and Mihailova, M.: Thermally-activated electron hopping in Fe-rich amphiboles: Implications for the high-conductivity anomalies in subduction zones, Geochem., 83, 125942, https://doi.org/10.1016/j.chemer.2022.125942, 2023.
Bernardini, S., Della Ventura, G., Schlüter, J., Hawthorne, F. C., and Mihailova, B.: The effect of the A-site cations on the charge-carrier mobility in amphiboles, Am. Mineral., 109, 1545–1553, https://doi.org/10.2138/am-2023-9138, 2024.
Bernardini, S., Della Ventura, G., Hawthorne, F. C., Marcelli, A., Salvini, F., and Mihailova, B.: The effect of anisotropic electrical conductivity of amphiboles on geophysical anomalies observed in subduction zones, Sci. Rep., 15, 14244, https://doi.org/10.1038/s41598-025-98025-9, 2025.
Chon, C.-M., Lee, C.-K., Song, Y., and Kim S. A.: Structural changes and oxidation of ferroan phlogopite with increasing temperature: in situ neutron powder diffraction and Fourier transform infrared spectroscopy, Phys. Chem. Miner., 33, 289–299, https://doi.org/10.1007/s00269-005-0045-y, 2006.
Deer, W. A., Howie, R. A., and Zussman, J. (Eds.): An introduction to the rock-forming minerals, Berforts Information Press, Stevenage, Hertfordshire, UK, 506 pp., ISBN 978-0903056-33-5, 2013.
Della Ventura, G., Mihailova, B., Susta, U., Guidi, M. C., Marcelli, A., Schlüter, J., and Oberta, R.: The dynamics of Fe oxidation in riebeckite: A model for amphiboles, Am. Mineral., 103, 1103–1111, https://doi.org/10.2138/am-2018-6382, 2018.
Della Ventura, G., Oberti, R., Misiti, V., Radica, F., Redhammer, G. J., Bernardini, S., Boiocchi, M., and Mihailova, B.: The oxidation of Fe in riebeckite at 0.7 GPa, Eur. J. Mineral., 37, 535–547, https://doi.org/10.5194/ejm-37-535-2025, 2025.
do Nascimento-Diaz, B. L., Donato, T. P., Zucolotto, M. E., and de Carvalho dos Anjos, V.: Raman spectral peak positions of olivine (Fo-Fa) as fast methodology for classifying chondrites, J. Raman Spectrosc., 52, 1206–1211, https://doi.org/10.1002/jrs.6114, 2021.
Fritschle, T., Prelević, D., Foley, S. F., and Jacob, D. E.: Petrological characterization of the mantle source of Mediterranean lamproites: Indications from major and trace elements of phlogopite, Chem. Geol., 353, 267–279, https://doi.org/10.1016/j.chemgeo.2012.09.006, 2013.
Fumagalli, P., Zanchetta, S., and Poli, S.: Alkali in phlogopite and amphibole and their effects on phase relations in metasomatized peridotites: a high-pressure study, Contrib. Mineral. Petrol., 158, 723–737, https://doi.org/10.1007/s00410-009-0407-4, 2009.
Goddat, A., Peyronneau, J., and Poirier, J. P.: Dependence on pressure of conduction by hopping of small polarons in minerals of the Earth's lower mantle, Phys. Chem. Miner. 27, 81–87, https://doi.org/10.1007/s002690050243, 1999.
Guseinov, A. A.: Dependence of electrical conductivity of mica on interlayer cations, Adv. Eng. Res., 182, https://doi.org/10.2991/ciggg-18.2019.26, 2018.
Hu, H., Dai, L., Li, H., Sun, W., and Li, B.: Effect of dehydrogenation on the electrical conductivity of Fe-bearing amphibole: implications for high conductivity anomalies in subduction zones and continental crust, Earth Planet. Sci. Lett., 498, 27-37, https://doi.org/10.1016/j.epsl.2018.06.003, 2018.
Husson, E.: Raman spectroscopy applied to the study of phase transitions, Key Eng. Mater., 155–156, 1–40, https://doi.org/10.4028/www.scientific.net/KEM.155-156.1, 1998.
Katsura, T., Yoshino, T., Manthilake, G., and Matsuzaki, T.: Electrical conductivity of the major upper mantle minerals: a review, Russ. Geol. Geophys. 50, 1139–1145, https://doi.org/10.1016/j.rgg.2009.11.012, 2009.
Kawamoto, T.: Hydrous phases and water transport in the subducting slab, in: Water in nominally anhydrous minerals, edited by: Keppler, H. and Smyth J. R., Rev. Mineral. Geochem., The mineralogical Society of America, Virginia, 273–289, https://doi.org/10.2138/rmg.2006.62.12, 2006.
Kroumova, E., Aroyo, M.I., Perez-Mato, J.M., Kirov, A., Capillas, C., Ivantchev, S., and Wondratschek, H.: Bilbao Crystallographic Server: useful databases and tools for phase-transition studies. Ph. Transit., 76, 155–170, https://doi.org/10.1080/0141159031000076110, 2003.
Kuebler, K. E., Jolliff, B. L., Wang, A., and Haskin L. A.: Extracting olivine (Fo-Fa) compositions from spectral peak positions, Geochim. Cosmochim. Ac., 70, 6201–6222, https://doi.org/10.1016/j.gca.2006.07.035, 2006.
Kuzmany, H. (Ed.): Solid-state spectroscopy: An introduction, Springer-Verlag Berlin Heidelberg, Germany, 550 pp., ISBN 978-3-642-01478-9, 2009.
Lacalamita, M., Schingaro, E., Scordari, F., Ventruti, G., Fabbrizio, A., and Pedrazzi, G.: Substitution mechanisms and implications for the estimate of water fugacity for Ti-rich phlogopite from Mt. Vulture, Potenza, Italy, Am. Mineral., 96, 1381–1391, https://doi.org/10.2138/am.2011.3772, 2011.
Li, X., Zhang, C., Behrens, H., and Holtz, F.: Calculating biotite formula from electron microprobe analysis data using a machine learning method based on principal components regression, Lithos, 356–357, 105371, https://doi.org/10.1016/j.lithos.2020.105371, 2020.
Li, Y., Yang, X., Yu, J.-H., and Cai, Y.-F.: Unusually high electrical conductivity of phlogopite: the possible role of fluorine and geophysical implications, Contrib. Mineral. Petrol., 171, 37, https://doi.org/10.1007/s00410-016-1252-x, 2016.
Li, Y., Jiang, H., and Yang, X.: Fluorine follows water: effect on electrical conductivity of silicate minerals by experimental constraints from phlogopite, Geochim. Cosmochim. Ac., 217, 16–27, https://doi.org/10.1016/j.gca.2017.08.020, 2017.
Libowitzky, E.: Correlation of O-H stretching frequencies and O-H…O hydrogen bond lengths in minerals, Monatsh. Chem., 130, 1047–1059, https://doi.org/10.1007/BF03354882, 1999.
Loh, E.: Optical vibrations in sheet silicates, J. Phys. C: Solid State Phys., 6, 1091–1104, https://doi.org/10.1088/0022-3719/6/6/022, 1973.
Margaritescu, I., Datta, K., and Mihailova, B.: Multistep coupling of preexisting local ferroic distortions in PbTiO3 above the Curie temperature, J. Phys. Condens. Matter, 30, 435401, https://doi.org/10.1088/1361-648X/aae344, 2018.
McKeown, D. A., Bell, M. I., and Etz, E. S.: Raman spectra and vibrational analysis of the trioctahedral mica phlogopite, Am. Mineral., 84, 970–976, doi.org/10.2138/am-1999-5-634, 1999.
Mihailova, B., Della Ventura, G., Waeselmann, N., Xu, W., Schlüter, J., Galdenzi, F., Marcelli, A., Redhammer, G.J., Boiocchi, M., and Oberti, R.: Atomistic insight into lithospheric conductivity revealed by phonon-electron excitations in hydrous iron-bearing silicates, Commun. Mater. 2, 1–10, https://doi.org/10.1038/s43246-021-00161-y, 2021.
Mihailova, B., Della Ventura, G., Waeselmann, N., Bernardini, S., Xu, W., and Marcelli, A.: Polarons in rock-forming minerals: physical implications, Condens. Matter, 7, 68, https://doi.org/10.3390/condmat7040068, 2022.
Momma, K. and Izumi, F.: VESTA: a three-dimensional visualization system for electronic and structural analysis, J. Appl. Crystallogr., 41, 653–658, https://doi.org/10.1107/S0021889808012016, 2008.
Morana, M., Angel, R. J., Alvaro, M., and Mihailova, B.: High-temperature behavior of quartz-in-garnet system revealed by in situ Raman spectroscopy, Phys. Chem. Miner., 50, 21, https://doi.org/10.1007/s00269-023-01246-5, 2023.
Motoyoshi, Y. and Hensen, B.J.: F-rich phlogopite stability in ultra-high-temperature metapelites from the Napier Complex, East Antarctica, Am. Mineral., 86, 1404–1413, https://doi.org/10.2138/am-2001-11-1209, 2001.
Petříček, V., Dušek, M., and Palatinus, L.: Crystallographic computing system JANA2006: General features, Z. Kristallogr., 229, 345–352, https://doi.org/10.1515/zkri-2014-1737, 2014.
Reynard, B., Mibe, K., and Van de Moortèle, B.: Electrical conductivity of the serpentinised mantle and fluid flow in subduction zones, Earth Planet. Sci. Lett., 307, 387–394, https://doi.org/10.1016/j.epsl.2011.05.013, 2011.
Rieder, M., Cavazzini, G., D'Yakonov, Y. S., Frank-Kamenetskii, V. A., Gottardi, G., Guggenheim, S., Koval, P. V., Müller, G., Neiva, A. M. R., Radoslovich, E. W., Robert, J.-L., Sassi, F. P., Takeda, H., Weiss, Z., and Wones, D. R.: Nomenclature of the micas, Clays Clay Miner., 46, 586–595, https://doi.org/10.1346/CCMN.1998.0460513, 1998.
Robinson, S. C. and Hewitt, D. F.: Uranium deposits of Bancroft region, Ontario (No. A/CONF. 15/P/224; AECL-634), Geological Survey of Canada; Ontario Dept. of Mines, Can., https://www.osti.gov/biblio/4262349 (last access: 21 July 2026), 1959.
Rösche, C., Waeselmann, N., Petrova, N., Malcherek. T., Schlüter, J., and Mihailova B.: Oxidation processes and thermal stability of actinolite, Phys. Chem. Miner., 49, 47, https://doi.org/10.1007/s00269-022-01223-4, 2022.
Schreurs, A. M. M., Xian, X., and Kroon-Batenburg, L. M. J.: EVAL15: a diffraction data integration method based on ab initio predicted profiles, J. Appl. Crystallogr., 43, 70–82, https://doi.org/10.1107/S0021889809043234, 2010.
Scordari, F., Ventruti, G., Sabato, A., Bellatreccia, F., Della Ventura, G., and Pedrazzi, G.: Ti-rich phlogopite from Mt. Vulture (Potenza, Italy) investigated by a multianalytical approach: Substitutional mechanisms and orientation of the OH dipoles, Eur. J. Mineral., 18, 379–391, https://doi.org/10.1127/0935-1221/2006/0018-0379, 2006.
Scordari, F., Schingaro, E., Ventruti, G., Nicotra, E., Viccaro, M., and Mazziotti Tagliani, S.: Fluorophlogopite from Piano delle Concazze (Mt. Etna, Italy): Crystal chemistry and implications for the crystallization conditions, Am. Mineral., 98, 1017–1025, https://doi.org/10.2138/am.2013.4225, 2013.
Steenstra, E. S., Klaver, M., Berndt, J., Flemetakis, S., Rohrbach, A., and Klemme, S.: Thermal stability of F-rich phlogopite and K-richterite during partial melting of metasomatized mantle peridotite with implications for deep Earth volatile cycles, J. Geophys. Res.-Sol. Ea., 129, e2023JB028202, https://doi.org/10.1029/2023JB028202, 2024.
Sun, J., Yang, Y., Ingrin, J., Wang, Z., and Xia, Q.: Impact of fluorine on the thermal stability of phlogopite. Am. Mineral., 107, 815–825, https://doi.org/10.2138/am-2022-8051, 2022.
Takeda, H. and Ross, M.: Mica polytypism: dissimilarities in the crystal structures of coexisting 1M and 2M1 biotite, Am. Mineral., 60, 1030–1040, 1975.
Tlili, A., Smith, D. C., Beny, J.-M., and Boyer, H.: A Raman microprobe study of natural micas, Mineral. Mag., 53, 165–179, https://doi.org/10.1180/minmag.1989.053.370.04, 1989.
Trønnes, R.: Stability range and decomposition of potassic richterite and phlogopite end members at 5–15 GPa, Mineral. Petrol., 74, 129–148, https://doi.org/10.1007/s007100200001, 2002.
Tutti, F. and Lazor, P.: Temperature-induced phase transition in phlogopite revealed by Raman spectroscopy, J. Phys. Chem. Solids, 69, 2535–2539, https://doi.org/10.1016/j.jpcs.2008.05.009, 2008.
Tutti, F., Dubrovinsky, L. S., and Nygren, M.: High-temperature study and thermal expansion of phlogopite, Phys. Chem. Miner., 27, 599–603, https://doi.org/10.1007/s002690000098, 2000.
Wang, D. and Karato, S.-I.: Electrical conductivity of talc aggregates at 0.5 GPa: influence of dehydration, Phys. Chem. Miner., 40, 11–17, https://doi.org/10.1007/s00269-012-0541-9, 2013.
Watenphul, A., Malcherek, T., Wilke, F. D. H., Schlüter, J., and Mihailova, B.: Composition – thermal expandability relations and oxidation processes in tourmaline studied by in situ Raman spectroscopy, Phys. Chem. Miner., 44, 735–748, https://doi.org/10.1007/s00269-017-0894-1, 2017.
Xu, Y., Shankland, T. J., and Duba, A. G.: Pressure effect on electrical conductivity of mantle olivine, Phys. Earth Planet. Inter., 118, 149–161, https://doi.org/10.1016/S0031-9201(99)00135-1, 2000.
Yang, X. and Heidelbach, F.: Grain size effect on the electrical conductivity of clinopyroxene, Contrib. Mineral. Petrol., 163, 939–947, https://doi.org/10.1007/s00410-011-0707-3, 2012.
Zanetti, A., Mazzucchelli, M., Rivalenti, G., and Vannucci, R.: The Finero phlogopite-peridotite massif: an example of subduction-related metasomatism, Contrib. Mineral. Petrol., 134, 107–122, https://doi.org/10.1007/s004100050472, 1999.
Zhang, K., Liu, H., Ingrin, J., Zhang, B., and Yang, X.: Chemical diffusion of fluorine in phlogopite, Geochim. Cosmochim. Ac., 333, 95–106, https://doi.org/10.1016/j.gca.2022.06.039, 2022.
Zhang, M., Hui, Q., Lou, X.-J., Redfern, S. A. T., Salje, E. K. H., and Tarantino, S. C.: Dehydroxylation, proton migration, and structural changes in heated talc: an infrared spectroscopic study, Am. Mineral., 91, 816–825, https://doi.org/10.2138/am.2006.1945, 2006.
Zhang, M., Redfern, S. A. T., Salje, E. K. H., Carpenter, M. A., and Hayward, C. L.: Thermal behavior of vibrational phonons and hydroxyls of muscovite in dehydroxylation: in situ high-temperature infrared spectroscopic investigations, Am. Mineral., 95, 1444–1457, https://doi.org/10.2138/am.2010.3472, 2010.
Zhang, M., Tarantino, S.C., Su, W., Lou, X., Ren, X., Salje, E. K. H., Carpenter, M. A., and Redfern, S. A. T.: Optical phonons, OH vibrations, and structural modifications of phlogopite at high temperatures: an in-situ infrared spectroscopic study, Am. Mineral., 101, 1873–1883, https://doi.org/10.2138/am-2016-5630, 2016.
Zheng, Y., Chen, R., Xu, Z., and Zhang, S.: The transport of water in subduction zones, Sci. China Earth Sci., 59, 651–682, https://doi.org/10.1007/s11430-015-5258-4, 2016.