the Creative Commons Attribution 4.0 License.
the Creative Commons Attribution 4.0 License.
 | 13 Jul 2026
Hydrothermal quartz genesis revealed by the combination of SEM charge contrast maps, FTIR mapping, and LA-ICP-MS trace element geochemistry
Nils B. Gies
Thomas Pettke
Jörg Hermann
Magmatic–hydrothermal ore deposits, such as pegmatites, are an increasingly important source of metals and critical elements for the development of green-energy resources. The geochemical processes at the magmatic–hydrothermal transition influence the degree of element enrichment in these ores. Quartz is a mineral that grows throughout the complete crystallization sequence of granitic pegmatites. Tracking the systematics of trace element incorporation into the quartz crystal structure throughout the magmatic–hydrothermal pegmatite evolution may offer unprecedented insights into pegmatite genesis.
Quartz crystals from the Rosina pegmatite, Elba, Italy, and from the Misox pegmatite, Ticino, Switzerland, were mapped using scanning electron microscopy (SEM) charge contrast imaging and Fourier transform infrared (FTIR) spectroscopy to determine the distribution of OH coupled to Li, B, and Al. Trace element laser ablation inductively coupled plasma mass spectroscopy (LA-ICP-MS) spot measurements were done on the same quartz crystals, navigated by the spatial distribution of zonation observed via FTIR maps. In Rosina quartz, total Li, B, Al, and Ti mass fractions are higher in the cores of the zoned crystals when compared to the rims, whereas in Misox quartz, the total Li, B, and Al increase from core to rim. In both Rosina and Misox quartz, OH coupled to Li, B, and Al closely follows the zonation of the total trace element contents. Lithium, B, and Al coupled to OH represent 5 %–30 % of the coupled substitutions in quartz. Thus, OH-related point defects provide another tool for provenance and ore body prospecting studies. In Rosina quartz, the LiOH defect is dominant in the FTIR spectra, which is rare for quartz and only characteristic for evolved pegmatitic quartz crystals.
Temperature estimates of quartz formation were constrained by Ti-in-quartz geothermometry, linking the observed geochemical processes to the pressure–temperature conditions at which they took place. Rosina quartz formed at pressures of 2.3 kbar and temperatures between 590 (core) and 330 (rim) °C, while Misox quartz formed at pressures of 5–6 kbar and temperatures between 520 (core) and 300 (rim) °C (calculated at TiO2 activity of 0.5). Relative temperatures consistently decrease from core to rim, and absolute temperatures are uncertain due to the difficulty of constraining the activity of Ti during quartz crystallization. The trace element evolution during quartz crystallization was spatially resolved and tracked through the complete quartz crystal growth period of the pegmatites. Trace elements in quartz crystals from Rosina record a prominent change in incorporation at the core–rim transition, while the interpretation of quartz trace element patterns in Misox quartz is further complicated by twinning patterns. These results show that a combination of quartz FTIR and LA-ICP-MS analyses successfully constrains the changes in the geochemical environment during ore body formation. In particular, Li enrichment in combination with H2O contents in quartz might be useful in the study of detrital quartz when prospecting for Li-rich pegmatites or other economically significant magmatic–hydrothermal ore deposits.
- Article
(23524 KB) - Full-text XML
-
Supplement
(8137 KB) - BibTeX
- EndNote


Quartz is an abundant and widespread mineral in various geological settings (e.g. Götze, 2009; Shah et al., 2022), including a significant range of hydrothermal ore deposits. It can grow over a wide temperature range often spanning across the magmatic–hydrothermal transition (Audétat and Pettke, 2003; Zajacz et al., 2008). As such, quartz can record important changes in the chemistry of the crystallizing fluids which are crucial in the formation of ore deposits associated with evolved magmas, including granitic pegmatites (e.g. Breiter et al., 2017; Peterková and Dolejš, 2019), skarns (e.g. Chang and Meinert, 2004), magmatic–hydrothermal porphyry, and vein-type ore deposits (e.g. Audétat et al., 1998; Landtwing et al., 2005; Mao et al., 2018). The potential of quartz as a tracer of the geochemical evolution of ore-forming fluids is still underutilized due to low trace element contents, often below the detection limits of analytical methods. The significant economic value of quartz as a raw material and its capability to serve as an important mineralogical and geochemical tracer of ore-forming processes have recently fostered interest in understanding quartz trace element incorporation and formation (e.g. Götze and Möckel, 2012; Götze et al., 2021).
Over the last 2 decades, advances in analytical techniques have spurred extensive research into trace element incorporation into quartz to help in the identification of potential sources of high-purity quartz raw materials (e.g. Müller et al., 2012, 2021). Demand for high-purity quartz has risen significantly, driven by its crucial role in high-tech industries, particularly in developing sustainable energy solutions (Pan et al., 2022). The most promising sources of high-purity quartz are found in granitic pegmatites (Larsen et al., 2000; Müller et al., 2008, 2015). Besides quartz, granitic pegmatites provide a wide range of critical raw materials, including Li, Cs, Rb, Be, B, P, Mo, Sn, W, Nb, Ta, rare earth elements (REEs), and U (Dill, 2015; Goodenough et al., 2019). The rapid growth in Li demand, driven by its extensive use in rechargeable batteries for electric vehicles, smartphones, and other electronic devices, has positioned it as a key component in the renewable-energy transition. This shift has prompted a renewed interest in lower-grade pegmatitic Li deposits previously deemed to be unprofitable (e.g. Dini et al., 2022). In highly evolved, Li-enriched pegmatites, Li minerals such as spodumene and Li micas form. It is more difficult to determine the enrichment of Li in the fluid phase prior to the saturation of Li minerals, except for cases where pristine fluid inclusion records are available. Quartz can incorporate Li as a trace element and is stable throughout the fractionation sequence from hydrous granitic melts to pegmatites. Therefore, quartz is a potential monitor for such Li enrichment. Lithium is incorporated into quartz through mechanisms involving Al or hydrogen (Kats, 1962; Stalder, 2021). To understand the Li systematics in quartz at decreasing temperatures it is thus crucial to understand the relationships of H, Ti, Al, B, and Li in quartz.
Hydrogen (H) in quartz occurs primarily through incorporation of molecular H2O (such as fluid inclusions) and hydroxyl (OH) point defects (Stalder, 2021). Fluid inclusions are the dominant form of H2O in quartz (e.g. Bambauer, 1961; Müller and Koch-Müller, 2009; Kronenberg et al., 2017), often hosting a significant amount of alkali metals in the fluid (Audétat et al., 1998, and many subsequent fluid inclusion laser ablation inductively coupled plasma mass spectroscopy (LA-ICP-MS) data contributions (Heinrich et al., 1999; Pan et al., 2019; Yuan et al., 2023)). Structurally bound H is mainly incorporated into the quartz structure through hydroxyl (OH) point defects, commonly expressed as an H2O component in µg g−1. Figure 1 illustrates the different mechanisms of trace element incorporation into quartz. There are several “dry” defects possible in quartz, not involving any H (Fig. 1b, c, d). The most common mechanism of structurally bound H incorporation into quartz is coupled substitutions with trivalent cations such as Al3+ and B3+ substituting for Si4+ (Aines and Rossman, 1984; Stalder, 2021; Fig. 1f). In such coupled substitutions, hydrogen usually bonds to oxygens of the SiO4 tetrahedra to satisfy the local charge balance. An additional mechanism involves the breaking of an Si–O–Si bond into two silanol groups: Si-O-H + H-O-Si (Brunner et al., 1961; Griggs and Blacic, 1965; Jollands et al., 2020) (Fig. 1e). In such a defect, an H+ can be substituted with Li+, providing a link between H2O as a geochemical component (i.e. structurally bound hydrogen) and Li in quartz.

Figure 1The left-side panels in each subfigure represent an overview of the quartz crystal structure framework in the a1–a2 plane, perpendicular to the c axis. (a) Isovalent substitution mechanism for incorporation of tetravalent cations into the Si site of the quartz structure; (b) incorporation of trivalent cations in the tetrahedral Si site locally charge compensated for by the protonation of one of the O atoms or Li+ in the interstitial channels. (c) A coupled substitution between two neighbouring SiO4 tetrahedra, where one Si4+ is substituted for a trivalent and the other for a pentavalent cation. (d) Breaking of an Si–O–Si bond and formation of two silanol groups as proposed by Brunner et al. (1961). Some of the H+ in such a defect might be replaced by Li+.
Fourier transform infrared (FTIR) spectroscopy is a powerful method for detecting OH-related substitutions in quartz. A broad absorption band in the 3000–3800 cm−1 range is caused by molecular H2O, where structurally bound OH groups display sharper, characteristic absorption bands related to specific point defects (e.g. Kats, 1962; Chakraborty and Lehmann, 1976a, b). The most common OH defect is associated with Al3+ substituting for Si4+, charge-balanced by an adjacent proton (AlOH defect), typically producing a sharp absorption band at 3378 cm−1, accompanied by bands at 3310 and 3440 cm−1 forming the Al triplet (Kats, 1962). Other prominent OH defects include the LiOH band at around 3480 and 3510 cm−1 (Brunner et al., 1961; Kats, 1962) and the BOH band at 3595 cm−1 (Staats and Kopp, 1974; Müller and Koch-Müller, 2009). The positions of all three bands of the Al triplet, the 3480 cm−1 LiOH band, and the 3595 cm−1 BOH band were confirmed by density functional theory (DFT) calculations (Jollands et al., 2020), whereas the 3510 cm−1 LiOH band was not addressed. These spectral features can serve as diagnostic indicators of the defect chemistry and can be used to infer the pressure–temperature–fluid evolution of the quartz host. Accurate absorption band assignment and interpretation require well-calibrated FTIR data and often comparison with experimentally synthesized analogues or natural samples of known composition and history (e.g. Stalder and Konzett, 2012; Frigo et al., 2016; Potrafke et al., 2019). FTIR spectroscopy enables both qualitative (OH defect species) and quantitative (OH defect content) determination of hydrous defects in nominally anhydrous minerals (Paterson, 1982) and has been applied to the magmatic–hydrothermal crystallization history (e.g. Breiter and Müller, 2009; Baron et al., 2015; Stalder et al., 2017; Tumaini et al., 2025).
The objective of this study is to obtain compositional data on quartz from pegmatitic veins to constrain the evolution of the hydrothermal fluid responsible for the formation of miarolitic cavities. By better understanding the incorporation of trace elements into quartz during hydrothermal crystallization, we aim to demonstrate the usefulness of quartz as a tracer of fluid evolution in pegmatites as examples of hydrothermal ore deposits. Scanning electron microscopy (SEM) charge contrast images of free-grown miarolitic quartz crystals serve as the first-order visualization of chemical growth zonation in quartz, offering constraints on relative compositional changes recorded with progressive crystal growth. Detailed information on the chemical zonation of OH related to Li, B, and Al, as well as total H2O, was then obtained using FTIR mapping, showing the spatial distribution of different structural defects in the same quartz crystals. SEM and FTIR images were then used as the basis for precise placement of LA-ICP-MS spot measurements in specific growth zones and points of interest in quartz crystals. LA-ICP-MS measurements of quartz crystals provide total trace element contents, including Ti, which can be used as a temperature proxy, constraining the formation temperature of quartz in pegmatites during cooling. The combination of total trace element mass fractions measured via LA-ICP-MS and the Li, B, and Al mass fractions associated with OH defects measured via FTIR enable tracking of changes in the mechanisms of trace element incorporation into the quartz crystal structure through time. Using such a novel multi-method approach to study quartz in pegmatites proves to be an essential tool to better understand pegmatite formation, the chemistry of ore-forming hydrothermal fluids, and the enrichment of key elements such as Li and B.
2.1 Samples
Individual, free-grown miarolitic quartz crystals or pieces thereof from two pegmatite localities (Rosina pegmatite, Elba, Italy, and Misox pegmatite, Swiss Alps) were cut parallel to the c axis to prepare doubly polished thick sections of 200 to 500 µm thickness.
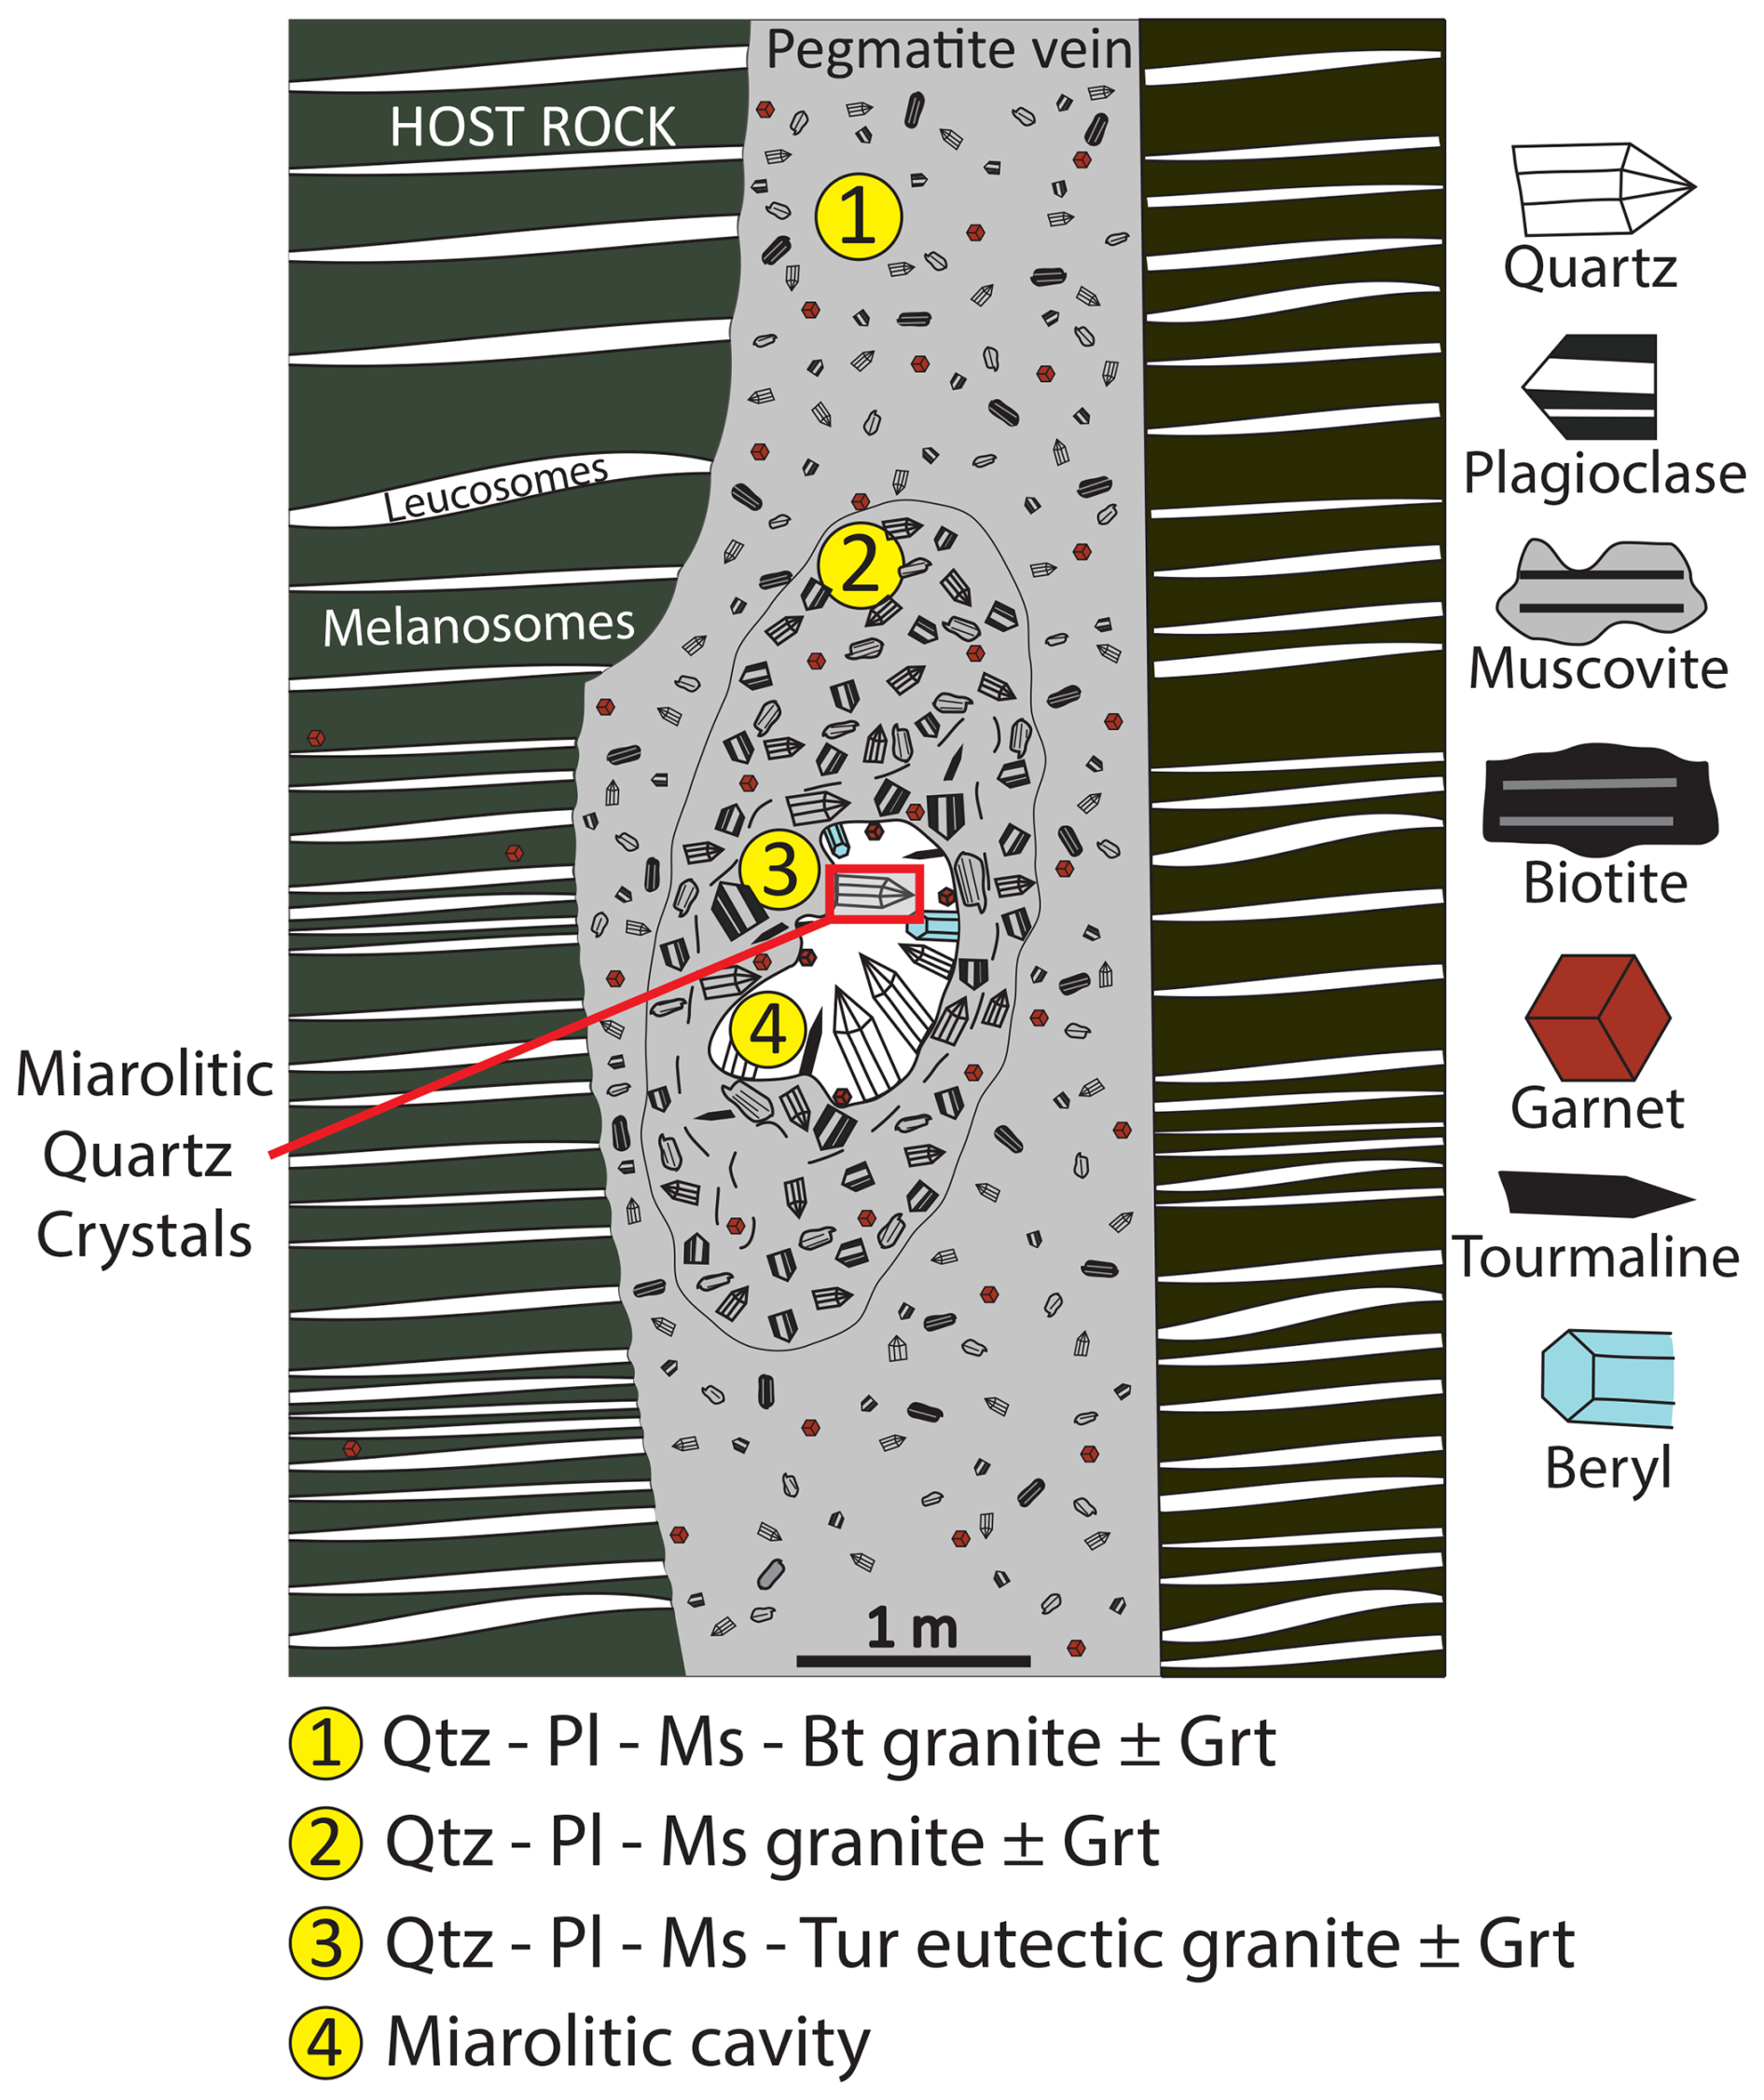
The Rosina pegmatite is a complexly and asymmetrically zoned, lithium–caesium–tantalum (LCT) pegmatite with several gem-bearing miarolitic cavities (Pezzotta, 2000). The main pegmatite dyke shows variable thickness, between 0.5 and 2 m. The Rosina pegmatite is emplaced into the San Piero facies of the Mt. Capanne monzogranite. The Mt. Capanne pluton formed through several pulses of S-type magma being emplaced between 7.3 to 7.0 Ma based on zircon U–Pb geochronology (Barboni et al., 2015), with San Piero facies being the youngest intrusion. Based on fluid inclusion studies of quartz, tourmaline, andalusite, and plagioclase in the leucogranitic dykes and pegmatite–aplite dykes in the Mt. Capanne pluton, Bakker and Schilli (2016) determined the temperature and pressure of pegmatite emplacement to be between 670 and 720 °C and 2.7 to 2.3 kbar. A sketch of Rosina pegmatite, with marked locations of studied quartz crystals, is shown in Fig. 2. We sampled three distinct miarolitic cavities in the complexly zoned Rosina pegmatite. The biggest miarolitic cavity, found in the core zone of the pegmatite, also bears the most evolved mineral assemblage, consisting of quartz, plagioclase, Li–Mn tourmalines, petalite, pollucite, and lepidolite (Orlandi and Pezzotta, 1996; Pezzotta, 2000). The second sampled miarolitic cavity is found at the border between the wall and the intermediate zone of the pegmatite body, where the assemblage is dominated by albite and quartz, with less white mica and black to pale-blue tourmaline. The third miarolitic cavity is found in a satellite vein of the Rosina main pegmatite body and has spessartine present in the assemblage.

The pegmatites of Misox valley, located in the Ticino region of Switzerland, are emplaced in the Simano Nappe of the Lepontine dome in the Central European Alps. The Lepontine dome exhibits a metamorphic gradient from migmatites in the south to lower amphibolite–greenschist facies in the north. The peak temperature reported for the migmatites along the southern margin of the dome is at ca. 700±50 °C (Burri et al., 2005). This peak temperature metamorphism lasted from around 32 to 22 Ma, shown by allanite (Gregory et al., 2012) and zircon (Rubatto et al., 2009) ages. These ages and distribution of zircon overgrowths suggested multiple melting episodes driven by fluid-assisted and muscovite dehydration partial melting at around 700±50 °C and 6 to 8 kbar (Burri et al., 2005; Berger et al., 2008; Rubatto et al., 2009). With no clear link to any nearby granitic pluton, the S-type magmas responsible for the formation of pegmatites in Misox are interpreted to have originated from partial melting at greater depths. Additionally, the pegmatites of Misox are renowned for producing quality mineral specimens of beryl, tourmaline, and garnet (Stroppini, 2019). The geological setting of the Misox pegmatites provides a unique opportunity to study the processes governing the formation and evolution of pegmatitic systems within the context of the tectono-metamorphic history of the central European Alps. Pegmatitic veins cutting orthogneisses in the Simano nappe of the Lepontine dome were dated to 23 to 21.5 Ma based on zircon U–Pb geochronology (Tagliaferri et al., 2023). A sketch of the studied Misox pegmatite vein is shown in Fig. 3. In the studied pegmatite vein, only one miarolitic cavity has been discovered so far, and all the studied quartz crystals are from the same miarolitic cavity assemblage (Stroppini, 2019).
The studied quartz crystals are free grown, often exceeding 10 cm in length. The images of representative quartz crystals are shown in Fig. 4, and the list of samples studied is presented in Table 1.
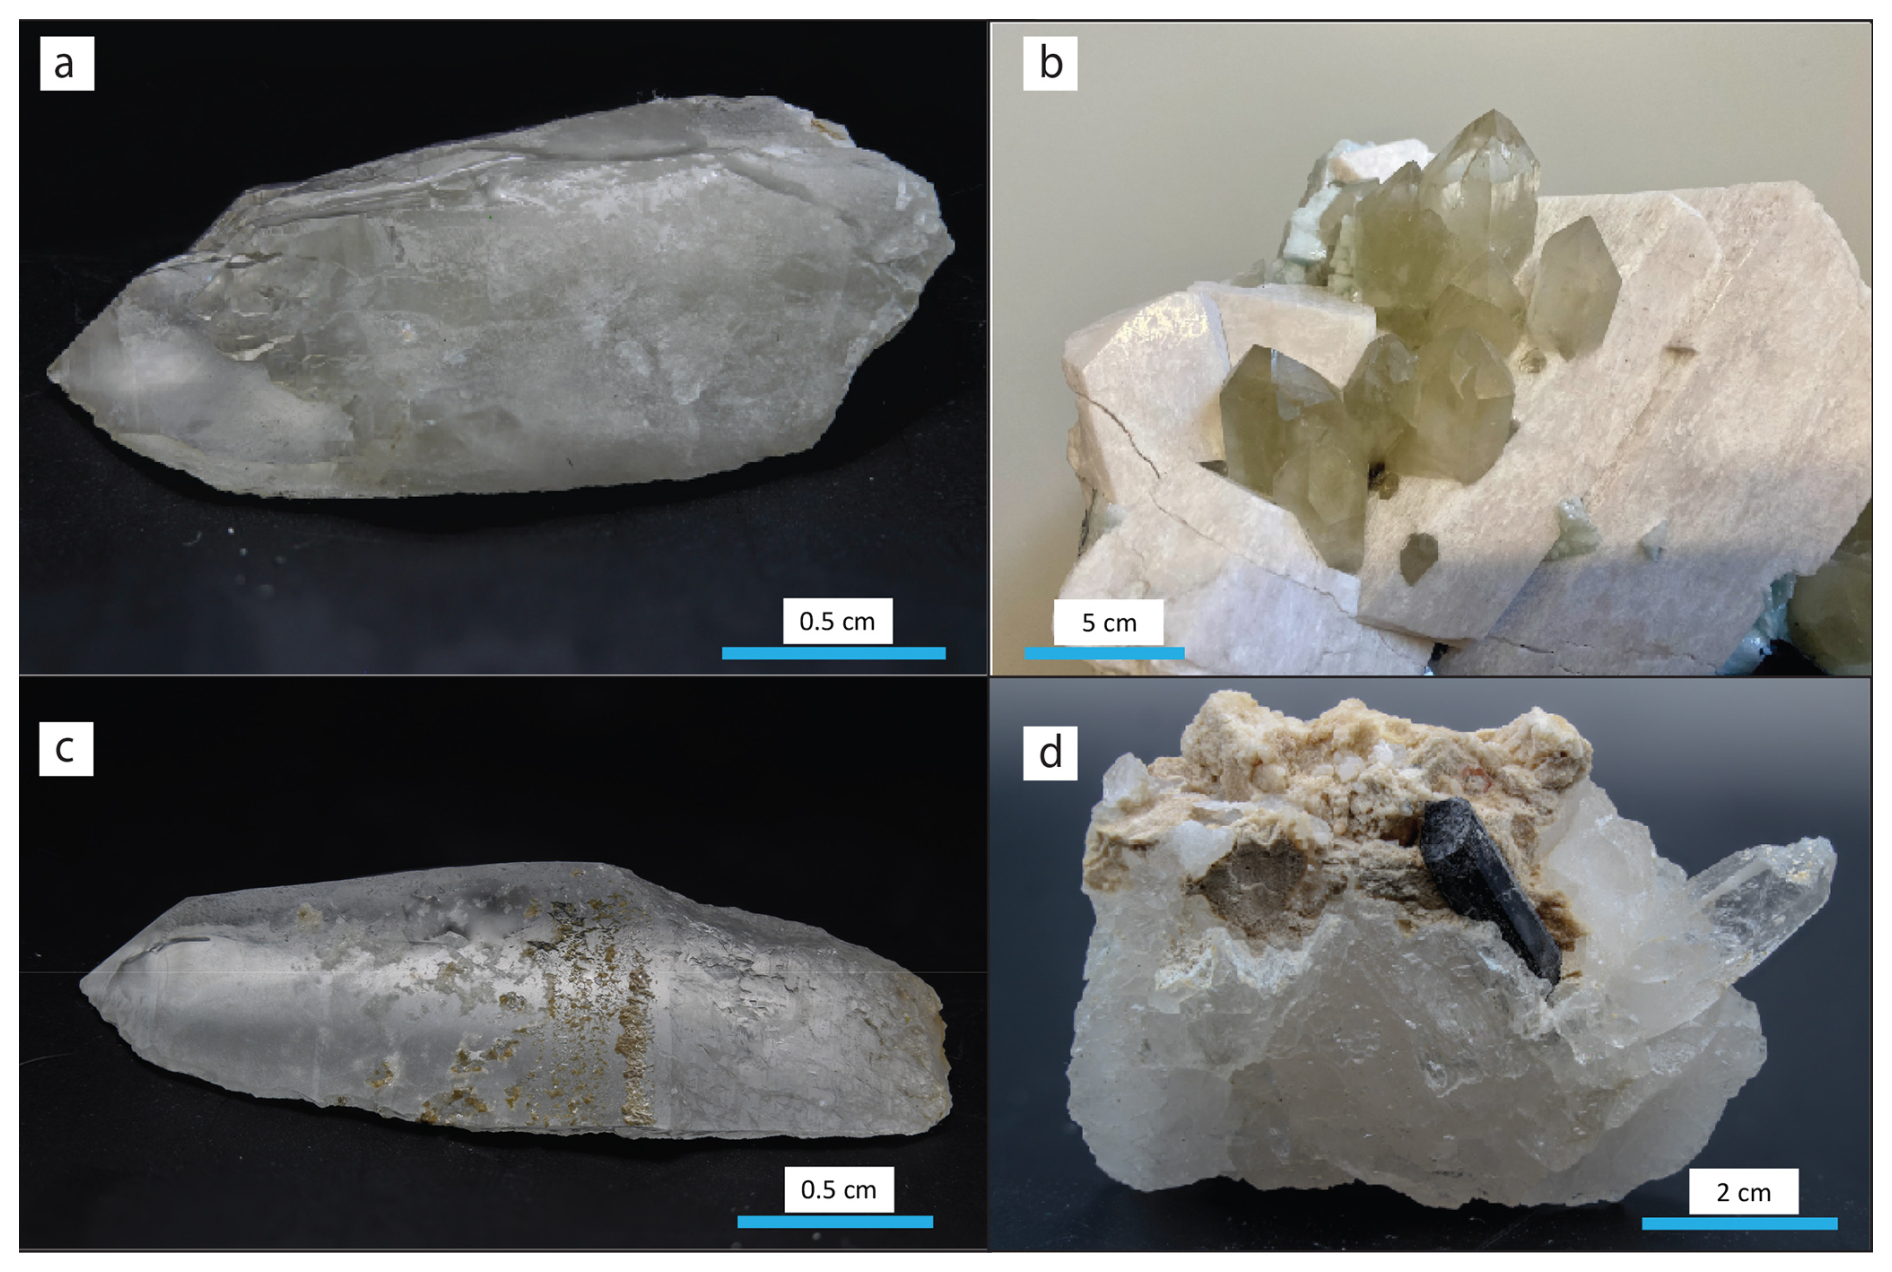
Figure 4(a) A cut half of the crystal MB-IT-ROS1, Rosina Pegmatite. (b) A representative association with quartz from the miarolitic cavity of the core zone of Rosina pegmatite (provided by Federico Pezzotta). (c) A cut half of the crystal MB-CH1, Misox Pegmatite. (d) A representative association with quartz from the miarolitic cavity of the Misox pegmatite (provided by Angelo Stroppini) with a black tourmaline and beige feldspars intergrown with quartz.
Table 1List of studied quartz samples together with their description and notes on their mineral associations.

2.2 Optical scans and SEM charge contrast imaging (CCI)
Optical scans of quartz sections were done using an Olympus BX50 microscope equipped with a microscopic image analyser (MIA) scan stage. Stacked images, with 15 % overlap, were composed using between 50 and 800 single images depending on the size of individual quartz crystals.
SEM charge contrast imaging (CCI) of entire ∼4.5 cm crystals was acquired at low magnification to cover the complete thin section (image stacking). CCIs were collected according to the procedure described by Lehmann et al. (2009). Uncoated doubly polished thin sections were imaged using a Zeiss Evo 50 SEM, located at the Institute of Geological Sciences, University of Bern. The operating conditions were set to an accelerating voltage of 14 kV, a gas pressure of 10 Pa, a sample current of 2.3 nA, and a spot size of 567 nm. Laboratory air was used as the chamber gas, and the scan rate was set to 420 µs per pixel. CCIs were collected with a gaseous scintillation detection system (GSD), which detects the photons produced by excitation reactions of nitrogen gas and secondary electrons (Morgan and Phillips, 2006). Mosaics of CCIs were composed together with 15 % overlap using built-in Zeiss SEM software.
Charge contrast imaging of quartz was chosen as an alternative to cathodoluminescence (CL) imaging because of its potential to reveal compositional variations at a comparable resolution to CL on the same system (Lehmann et al., 2009). While the secondary electrons, which are generated by the electron beam, react very similarly to photons produced in CL imaging and thus reveal the same compositional variation, they have a significantly smaller interaction volume (Griffin, 2000; Watt et al., 2000).
2.3 LA-ICP-MS quartz measurements
Trace element contents of quartz were measured at the Institute of Geological Sciences, University of Bern, using a Resonetics RESOlutionSE 193 nm excimer laser system combined with an Agilent 7900 quadrupole ICP-MS system. The laser system is equipped with a S-155 dual volume constant geometry ablation cell (Laurin Technic, Australia). The ICP-MS was optimized for low oxide production ( %) and robust plasma conditions monitored by a sensitivity ratio >0.97). The atmosphere in which ablation was performed consisted of pure He (0.4 L min−1), into which Ar (0.86 L min−1) and N2 (0.003 L min−1) were admixed at the exit of the ablation cell. The beam size was 32–100 µm depending on the size of pure quartz domains or zoning as revealed on charge contrast images. Pre-ablation of the measurement spot was performed to clean the surface and was done with a slightly larger beam size compared to the actual measurement. The laser repetition rate was 5 Hz, and the fluence on the sample was ∼18 J cm−2. The total acquisition time was ∼100 s, with gas background being measured for 50 s, 10 s of washout after pre-ablation, and 30–40 s of sample signal. GSD-1G was used as the external standard to calibrate analyte sensitivities. Data reduction was performed using the SILLS software (Guillong et al., 2008) with 95 % confidence limit of detection (LOD) filtering calculated according to the formulation reported in Pettke et al. (2012). Internal standardization was done using total element oxides of 100 wt %.
The placement of the LA-ICP-MS measurements on all samples was guided based on the zonation observed in SEM charge contrast and FTIR maps, overlain onto the optical microscope scan of the crystals. The placement of measurement spots aimed for full coverage of features observed on maps and avoidance of healed cracks (seen on charge contrast images with dark quartz fillings) and other kinds of damaged parts of the crystal detected in FTIR images (see below). All quartz trace element contents, as well as associated FTIR spectra quantifications and results of TiQ thermometry calculations, are available in Table S1 in the Supplement. Binary plots were generated using MinPlotX (Walters and Gies, 2025).
2.4 Quartz measurements via FTIR spectroscopy
Transmission FTIR mapping of quartz crystals was carried out at the Institute of Geological Sciences of the University of Bern using a Bruker Tensor II spectrometer with a globar infrared source and a KBr beam splitter, coupled to a Bruker Hyperion 3000 microscope and a liquid-nitrogen-cooled mercury cadmium telluride (MCT) detector. The sample was placed in a closed Plexiglas chamber, which was purged with nitrogen gas during measurements to limit the effect of changing atmospheric CO2 and H2O. Because of the large size of the quartz crystals, most maps were acquired using the single MCT detector with an aperture of between 40 and 75 µm, 4 cm−1 wavenumber resolution, and four scans between 600 and 6000 cm−1. All FTIR maps were acquired with linearly polarized light, with the electric vector E parallel to no (i.e. perpendicular to the crystallographic c axis). The atmospheric correction and baseline correction were performed in OPUS® version 8.5. The baseline correction was performed using the concave rubber-band method with 64 points and four iterations. The spectra were then exported and further processed with the software SpecXY (Gies et al., 2024).
All spectra were normalized to 1 cm thickness, and the integrated absorbances for different maps were generated by extracting the chosen part of the signal, performing a linear baseline correction between the end points of the linear baseline range, and integrating the selected integration range. The average spectra of the LA-ICP-MS spot positions were extracted from the maps using the region of interest (ROI) circle tool of SpecMaps and exported to SpecDB, where the integrated absorbance and H2O content in µg g−1 were calculated for each extracted mean spectrum. The applied linear baseline ranges, integration ranges, band positions, absorbance coefficients, correction factors, and references for the calculation of OH coupled to Li, B, and Al, as well as total OH absorbance from FTIR measurements, are provided in Table 2.
Pleochroism of the different OH defects was accounted for by applying directional weighting factors that reflect the orientation of the OH dipole relative to the crystallographic c axis. For LiOH and AlOH defects, absorbance is confined to E⊥c, with no contribution for polarization E∥c, corresponding to weighting factors of 1 and 0, respectively. In contrast, BOH defects exhibit absorbance in both directions, with weighting factors of for E⊥c and for E∥c, reflecting the distribution of OH dipole orientations (after Baron et al., 2015; Potrafke et al., 2019).
Defect-specific factors (Fdefect) relate the integrated absorbance to OH contents expressed as H2O equivalent concentration by accounting for the molar mass of H2O (), quartz density (ρQtz), and the integrated molar absorption coefficient of the respective OH defect (ε) (Eq. 1a). The orientation coefficient (Korientation) corrects the maximum polarized absorbance measured (absorbance ∥a) by incorporating the relative contributions of the ordinary and extraordinary polarization components (Eq. 1b).
Total H2O mass fractions [µg g−1] associated with each point defect () were therefore obtained by multiplying the maximum polarized absorbance (Fabsorbance) by the orientation coefficient Korientation, which accounts for both the reconstruction of the total integrated absorbance from polarized measurements and the integrated molar absorption coefficient. The differences in anisotropic behaviour of the BOH defect in comparison to AlOH and LiOH defects are expressed in the different Korientation obtained by the added contribution of Ane.
The final calculation for the molar AlOH, LiOH, and BOH concentrations was done by multiplying the values of total integrated absorbance by a thickness-normalized maximum absorbance, calculated according to the following formula (Eq. 1c):
where is the molar mass of H2O (18.01528 g mol−1, ρQtz is the density of quartz (2.650 g cm−3), ε is the integrated molar absorption coefficient for the selected band, 106 is the conversion factor to convert the units into mug g−1, A is the integrated polarized absorbance, and t is the thickness in cm.
The absorption coefficients from Jollands et al. (2020) were used for the quantification of LiOH, BOH, and AlOH defect concentrations. The absorption coefficient for the AlOH region was modified to be between the values of 174 000 and 218 000 cm−2 L (mol H2O)−1, whereas the values of 161 000 and 80 000 cm−2 L (mol H2O)−1 were used for the LiOH and BOH defect, respectively.
Finally, profiles were extracted from the maps referenced to the rim of the crystal using the stripe profile method of SpecMaps.
In Table S1 in the Supplement, all integrated absorbances used for quantification are reported, as well as values for H2O, Li, B, and Al mass fractions associated with each defect.
Table 2List of integration ranges for baselines and peaks of each OH defect with band positions from the literature, absorption coefficients used, and Fdefect values used for quantification of OH defects.

* Misox band positions and Rosina band positions stated in brackets. a: Brunner et al. (1961); b: Kats (1962); c: Staats and Kopp (1974); d: Müller and Koch-Müller (2009); e: Jollands et al. (2020).
3.1 Quartz SEM charge contrast images
Overview SEM charge contrast images reveal details of the compositional zonation of quartz crystals. Quartz from the Rosina pegmatite shows internal zonation, often with typical core–rim domains (Fig. 5a). Oscillatory zoning is present only in smaller quartz crystals from Rosina, for example, in sample MB-IT-R2-QC (Fig. 5b). The cores have a brighter contrast than the rims, indicating higher trace element contents in the cores of the crystals. The bases of individual quartz crystals commonly display a network of dark, irregular domains resembling quartz-filled cracks. The abundance of these domains prominently diminishes towards the tips of the crystals.
Quartz crystals from the Misox pegmatite show significantly more complex zonation patterns (Fig. 5c). While the common core–rim zonation pattern is visible, distinct domains of crystal growth, belonging to two different crystals, twinned according to the Dauphiné law, are observed. Dauphiné-twinned quartz domains incorporate different amounts of trace elements, resulting in different contrasts of the same growth zone for different twin domains (Fig. 5d; Lehmann et al., 2009; this work). The tips of the quartz crystals generally show brighter contrast in comparison to the cores of the crystals. Moreover, oscillatory zoning is evident within twin domains (Fig. 5c). While cracking is still present in the bases of the crystals (not illustrated here), cracks are much less abundant compared to quartz samples from the Rosina pegmatite.
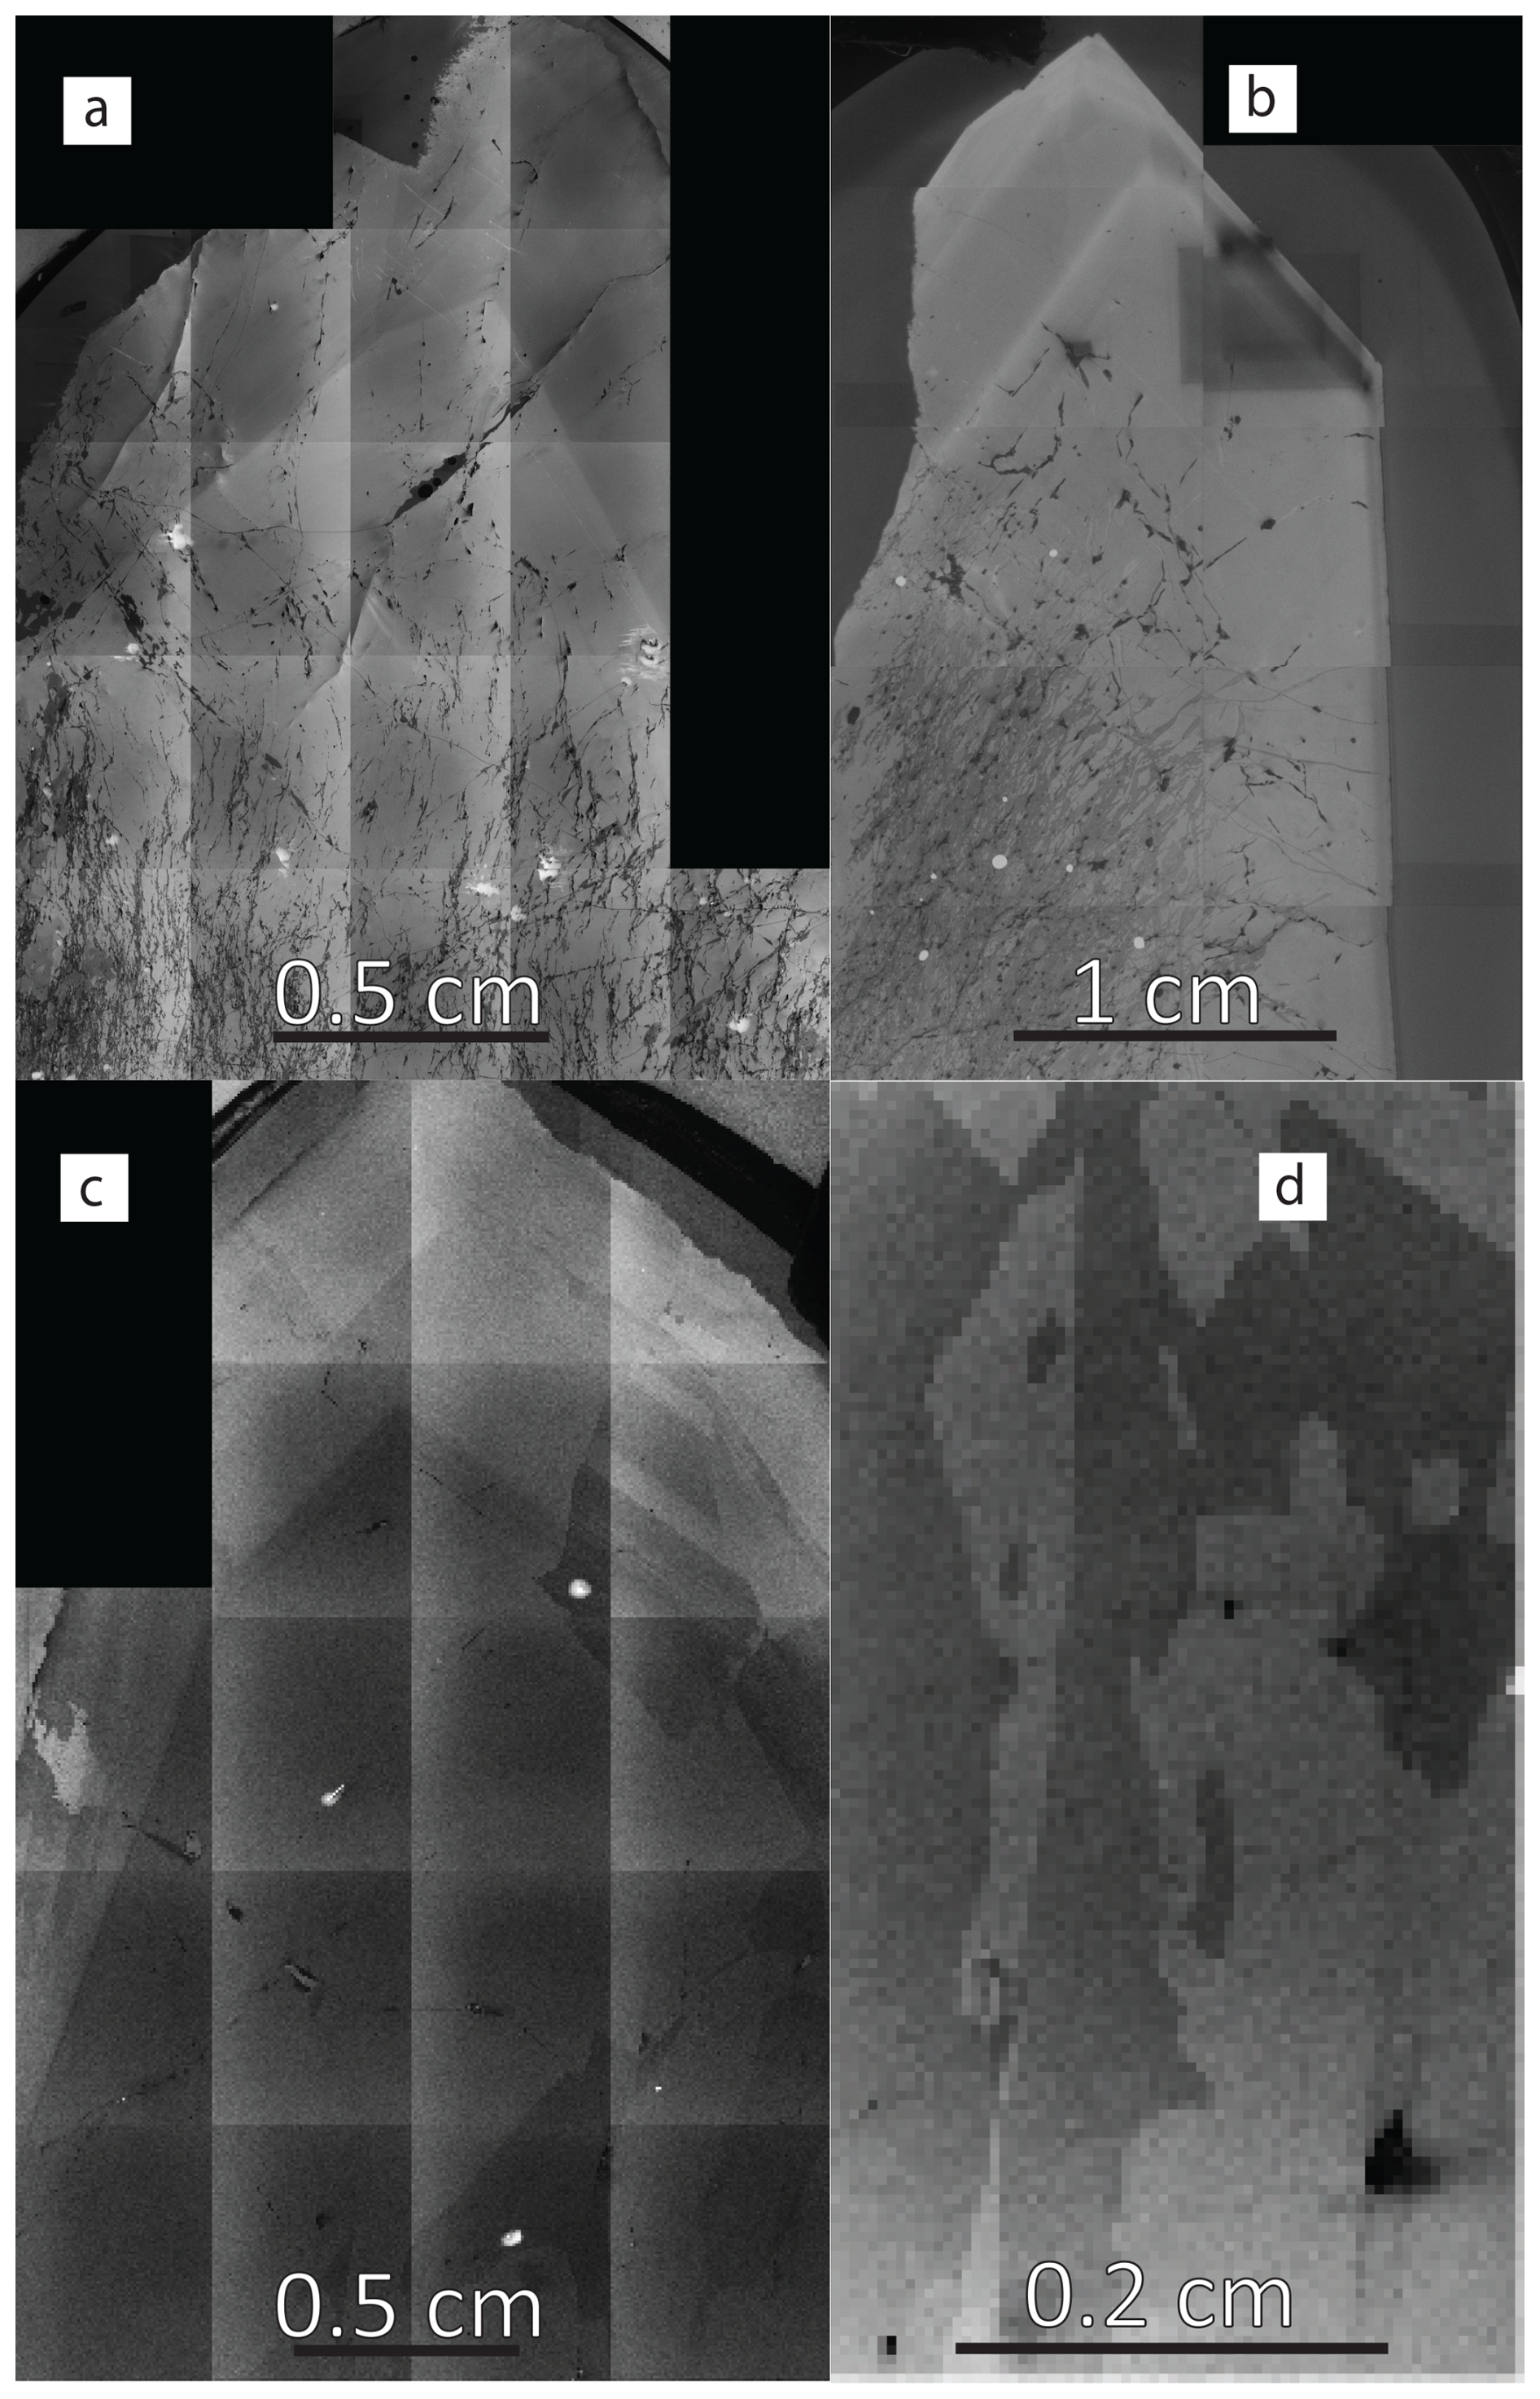
Figure 5SEM charge contrast images of samples. (a) MB-IT-ROS1 from the Rosina pegmatite with a typical core–rim zonation with a brighter core and a darker rim. (b) MB-IT-R2-QC from the Rosina pegmatite with three distinct growth zones. (c) Tip of the crystal sample MB-CH1 from the Misox pegmatite showing the core–rim zonation with a dark core and a brighter rim, with oscillatory zoning in one of the twin domains. (d) Detail from the SEM charge contrast image of the core of the crystal sample MB-CH1, showing the presence of Dauphiné twin domains even in the core of the crystal. The contrast of the images was enhanced to better illustrate the zone differences. The original SEM scans without enhanced contrast, together with all the other SEM charge contrast images of sampled quartz crystals, are provided in Sect. S1 in the Supplement.
3.2 Quartz FTIR mapping
Based on the results of the SEM charge contrast images, areas for FTIR mappings of quartz crystals were selected. Figure 6 displays a representative FTIR spectrum of quartz from Rosina and from Misox pegmatites, illustrating absorption bands at different wavenumbers assigned to specific OH-related defects. The Misox quartz is characterized by high absorption of Al- and Li-related OH bands, whereas the BOH defect is barely detected. In contrast, the B- and Li-related defects are more prominent in the Rosina quartz, while AlOH defects are less prominent. It is important to note that the dominance of the LiOH defect in the FTIR spectra of quartz is rather rare and only restricted to evolved pegmatitic environments.

Figure 6Representative maximum polarized FTIR spectra in the H2O region of quartz from (a) the core and rim of Rosina quartz (sample MB-IT-ROS1) and (b) the core, middle section, and rim of Misox quartz (MB-CH3). The infrared (IR) absorption of the BOH defect shows higher absorbance in the Rosina sample, while the absorption of the AlOH defects, as well as of the LiOH defect, shows higher absorbance in the Misox sample. An additional figure, showing the differences between the measurements done parallel to no and ne, as well as overlaid integration ranges, is provided in Sect. S2 in the Supplement.
The zonation observed in integrated maps of FTIR polarized band absorptions was directly correlated with SEM charge contrast images of the corresponding area in the quartz crystals (Figs. 7 and 8). The polarized FTIR maps of selected regions of Rosina quartz crystals reveal that brighter SEM charge contrast regions correlate with higher absorbance (Fig. 7). The FTIR map of the integrated B–OH absorbance reveals an oscillatory zoning pattern, different from the core–rim zonation pattern revealed by the SEM charge contrast images, as well as integrations based on other peaks in the FTIR spectrum (Fig. 7). The maps of the integrated LiOH, BOH, and AlOH absorbance of quartz crystals from Rosina show a maximum of 1.9, 3.3, and 8.9 µg g−1 of OH-coupled Li, B, and Al, respectively (Table S1). These values decrease by up to an order of magnitude in the rim of the crystals (Fig. 7). The sum of total Li-, B-, and Al-defect-related structural H2O mass fractions calculated according to Jollands et al. (2020) reaches up to 12 µg g−1 in the core zone and drops to between 2 and 5 µg g−1 in the rim of the Rosina quartz crystals (Fig. 7). The total H2O calculated by the method of Thomas et al. (2009) has significantly higher values for the same analyses, reaching up to 97 µg g−1 in the core zone and dropping to between 3 and 7 µg g−1 in the rim of the Rosina quartz crystals (Table S1).
The FTIR maps of selected regions of Misox quartz crystals reveal that brighter SEM charge contrast domains again correlate with higher absorption band intensities (Fig. 8). The Al defect is much more pronounced in Misox samples than in Rosina (Fig. 6). The zonation observed in Misox quartz crystals is significantly more complex than zonations in Rosina quartz. The zonation between the core and the rim of the crystals is still visible, showing higher amounts of OH defects and total H2O mass fractions in the rims of the crystals. As seen in SEM charge contrast images, all quartz crystals from Misox display Dauphiné law twinning, showing different trace element incorporation in neighbouring domains of the twins. This is also seen in the FTIR maps (Fig. 8). Furthermore, within a single twin domain, crystals exhibit oscillatory zoning that spans both the core and the rim of the crystal (e.g. zonation observed within the domain marked in blue in Fig. 8b). The OH-coupled Li, B, and Al absorbance integration maps of quartz crystals from Misox yield maximum mass fractions in the tips of the crystals, amounting up to 5.8, 1.5, and 68 µg g−1, respectively. A sum of total Li-, B-, and Al-defect-related structural H2O reaches up to 51 µg g−1 in Misox quartz crystals (Fig. 8). The total H2O calculated by the method of Thomas et al. (2009) has, once again, significantly higher values for the same analyses, reaching up to 125 µg g−1 (Table S1).

Figure 7(a) Stacked transmitted light MIA photomicrographs of the quartz crystal MB-IT-ROS1 from a core zone miarolitic cavity of Rosina pegmatite. A dashed black line shows the corner of the crystal covered in epoxy resin during sample preparation, which is therefore missing from the other subfigures. (b) SEM charge contrast image of the same crystal. (c–f) FTIR maps of the tip of the same crystal integrated for a region of AlOH, LiOH, BOH, and total H2O absorption bands in the FTIR spectrum. The location of the FTIR map is marked on the optical scan and SEM charge contrast images with a red rectangle. All the FTIR scans of quartz crystals from both localities are reported in Sect. S3 in the Supplement.

Figure 8(a) Transmitted-light MIA optical scan of the quartz crystal MB-CH3 from a miarolitic cavity of Misox pegmatite with the SEM CCI region of (B) marked in red. (b) SEM charge contrast image of the same crystal with the FTIR analysed region in red. A single twin domain, spanning both the core and the rim zones of the crystal, is outlined in blue. (c–f) FTIR maps integrated for a region of AlOH, LiOH, BOH, and total H2O absorption bands in the FTIR spectrum. The difference in the FTIR integrated absorption for each peak, as well as the sum of OH-related defects, reveals prominent differences in trace element incorporation in adjacent twin domains of the same growth zone.
3.3 Quartz LA-ICP- MS trace element data
The highest measured LA-ICP-MS trace element contents are present in the cores of the quartz crystals from Rosina. Measured element mass fractions in Rosina quartz range from 11 to 450 µg g−1 Li, 1 to 36 µg g−1 B, 43 to 1780 µg g−1 Al, and 0.16 to 12 µg g−1 Ti, <0.004 to 0.4 µg g−1 Ga, and 1.4 to 11.7 µg g−1 Ge.
The Li and Al contents in quartz are always linearly correlated (Fig. 9a, b). In Rosina samples, this correlation follows the 1:1 molar ratio closely. Both Li and Al, as well as Ga mass fractions, are highest in the core of the quartz sample from the core zone of the Rosina pegmatite (Fig. 9, Table S1). All the samples show a linear correlation trend between Ga and Li. The sample from the core zone of the Rosina pegmatite, however, follows a linear correlation with a different slope, incorporating less Ga per mol of Li (Fig. 9c).
In Misox quartz samples, LA-ICP-MS element mass fractions range from 0.5 to 100 µg g−1 Li, 0.05 to 11 µg g−1 B, 4.5 to 760 µg g−1 Al, and 0.02 to 5.7 µg g−1 Ti. In Misox quartz, all trace elements, including Ti, display lower contents in crystal cores, increasing towards the complexly zoned tips of the crystals. While, within each quartz crystal from Misox, the molar Li to Al is still strongly correlated linearly, the ratio does not follow a 1:1 line like in Rosina samples but rather incorporates variably less Li per mole of Al (Fig. 9b). In Misox, Ga and Ge mass fractions in quartz reach up to 0.01 and 7 µg g−1, respectively.

Figure 9(A) Li vs. Al from LA-ICP-MS spot measurements in quartz from Rosina pegmatite. (B) Li vs. Al from LA-ICP-MS spot measurements in Misox quartz samples. (C) Ga vs. Li from LA-ICP-MS spot measurements in quartz samples from Rosina pegmatite. Note that the molar 1:1 line is outside the plot area here.
There is a clear difference between the two localities in terms of trace element incorporation into quartz. Rosina quartz samples are more enriched in Ga, Ti, B, and Li compared to quartz from Misox (Fig. 10). Gallium, Ge, Al, and total H2O all increase from core to rim in Misox quartz but decrease from core to rim in Rosina quartz (Fig. 8a, b, d).
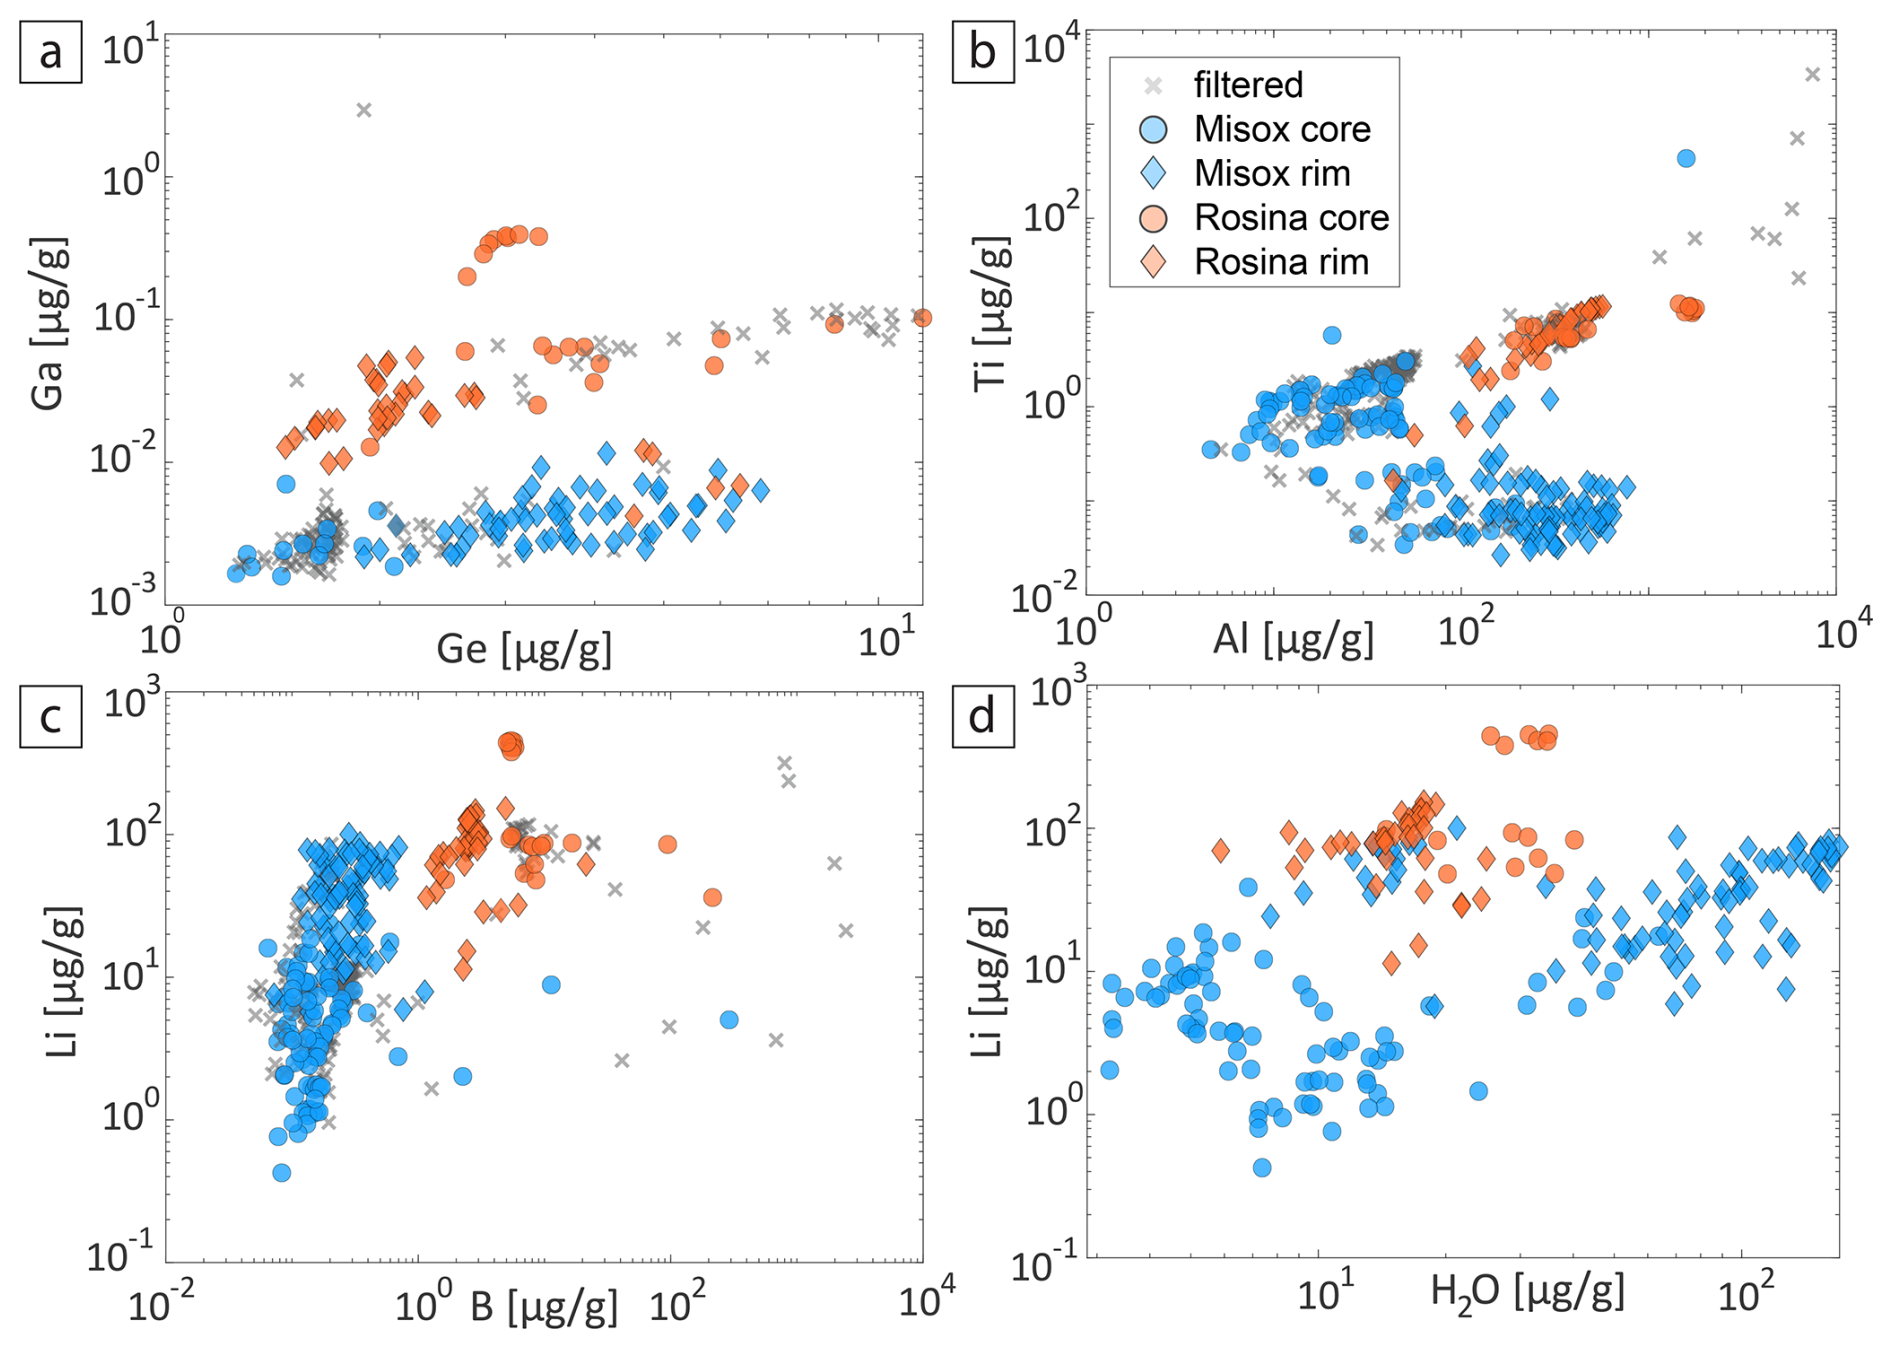
Figure 10Comparison of trace element mass fractions in quartz crystals from Rosina (orange symbols) and Misox (blue symbols): (a) Ga vs. Ge, (b) Ti vs. Al, (c) Li vs. B, and (d) Li vs. H2O from La-ICP-MS spot analyses correlated with FTIR spectra in Table S1. Grey symbols represent outlier data for which inclusion signals were observed in the LA-ICP-MS transient signal or in the FTIR spectra. Circles belong to measurements in core zones, and diamonds represent those of rims of quartz crystals.
3.4 Ti-in-quartz thermometry
Titanium contents decrease from the core to the rim of the quartz crystals in both localities. This trend is much more obvious in quartz from Rosina, where, in all samples, it gradually decreases from core to rim, irrespective of the lateral position of the transect through the crystal (Fig. 11). The total Ti mass fractions in quartz crystals from Rosina range from 12.4 to 0.16 µg g−1 (Table S1). Titanium distribution in Misox quartz correlates with extensive twinning domains and complex zoning displayed by the crystals (Fig. 12). The highest Ti mass fractions are generally found in the cores of the crystals, reaching up to 3.2 µg g−1 Ti in sample MB-CH10B. At the rims of the crystals, the Ti mass fractions drop down to 0.03 µg g−1. However, in some samples, such as in MB-CH3, it rises again up to 2.7 µg g−1 in the latest rims of the crystal (Table S1).
Temperatures during quartz crystallization were calculated using the Ti-in-Quartz (TiQ) thermometer from Huang and Audétat (2012). Pressure for Rosina pegmatite formation was estimated to 2.3 kbar, which is assumed to be the lower end of pressure of formation of pegmatitic veins in San Piero facies of Mt. Capanne pluton (Bakker and Schilli, 2016), and Ti activity in the system was assumed to be 0.5 based on the presence of ilmenite in the pegmatite mineral assemblage, identified from scanning electron microscope energy dispersive X-ray spectroscopy (SEM-EDS) spectra. The resulting temperatures are presented in Table S1, including temperatures calculated with the thermometer proposed by Zhang et al. (2020) for comparison. Temperatures decrease from the core to the rim of the crystals in all quartz samples from Rosina. The temperatures obtained by TiQ thermometry range from 590 to 450 °C for the quartz from the core zone of the Rosina pegmatite (Fig. 11). This quartz crystal records the highest temperature of all quartz crystals analysed. TiQ temperatures decrease from the core to the rim of the crystal, without abrupt changes as displayed by other trace element data; there is no sudden drop in temperature recorded at any point. All the other samples from Rosina yield TiQ temperatures between 560 and 320 °C, along with the same gradual decrease from core to rim.
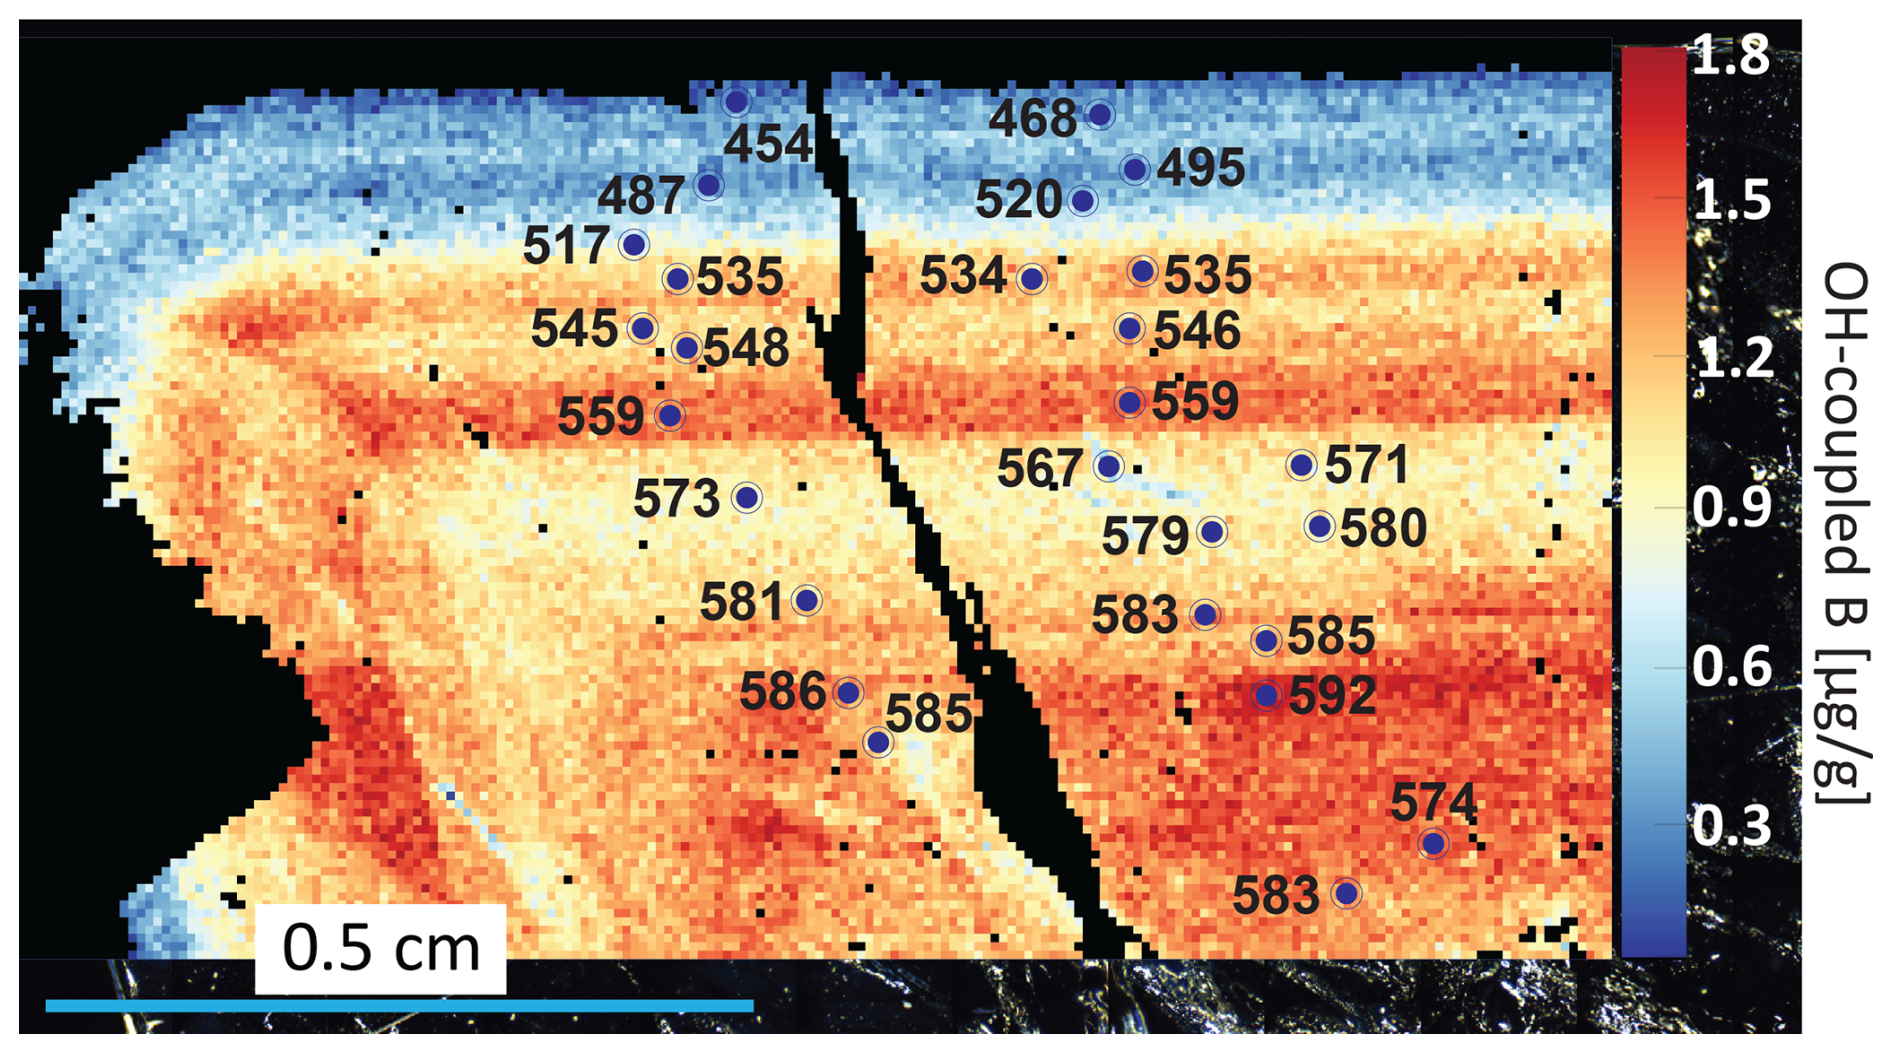
Figure 11Apparent TiQ temperatures calculated from LA-ICP-MS spot analyses in a quartz crystal from Rosina (sample MB-IT-ROS1) overlaid onto a BOH defect integration FTIR map. The BOH defect map was used since it best shows the crystal zonation. The Ti mass fractions for all spot measurements of this quartz crystal range from 1.96 to 12.4 µg g−1. These Ti mass fractions correspond to temperatures ranging from 592 °C at the core of the crystal to 454 °C at the outermost rim of the crystal.
For the Misox pegmatite, pressure was estimated to be 5 kbar, slightly lower than the lowest estimated pressure conditions of partial melting of migmatite leucosomes in the Lepontine dome (Burri et al., 2005), and the same Ti activity of 0.5 was assumed based on the presence of ilmenite in the pegmatite mineral assemblage, which was identified based on the EDS spectra on the SEM scans. The resulting temperatures are presented in Table S1, including temperatures calculated with the thermometer proposed by Zhang et al. (2020) for comparison. These temperatures indicate a gradual decrease from the core to the rim of the crystals in all samples. The quartz from the miarolitic cavity of the Misox pegmatite gives TiQ temperatures of between 545 and 315 °C when going from the core to the rim of the crystal (Fig. 12) (see the Discussion section for an interpretation).
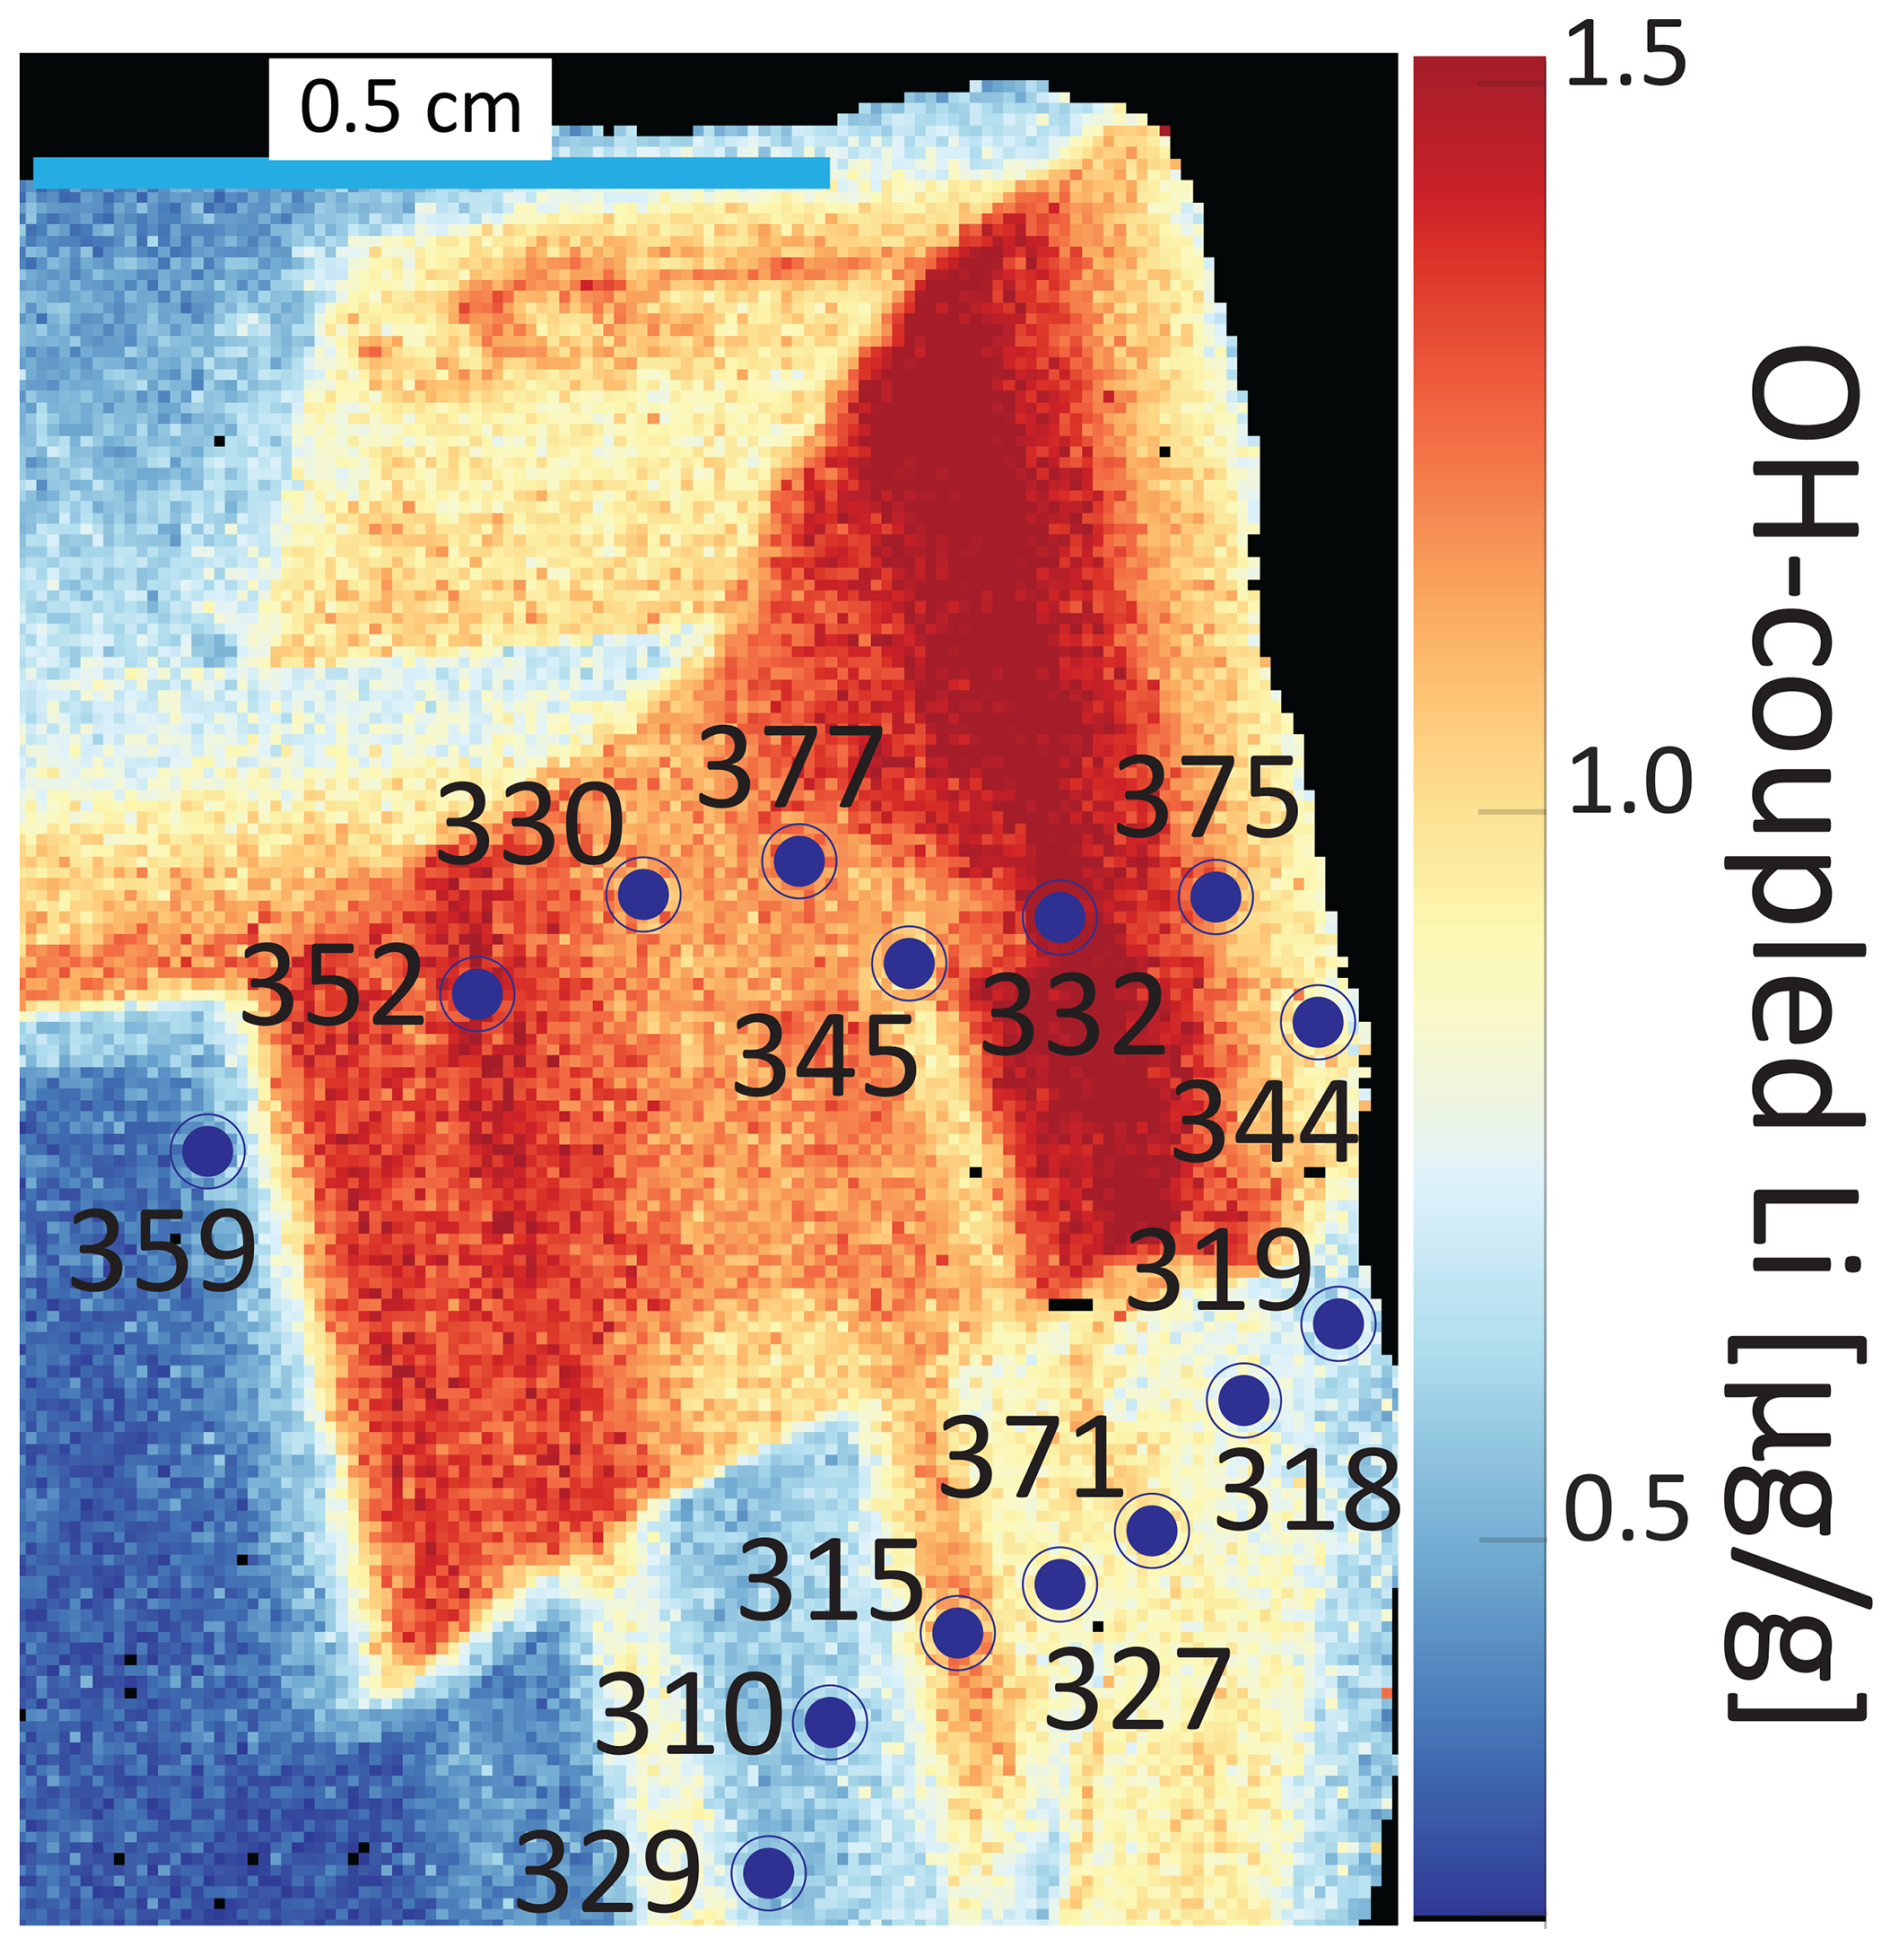
Figure 12TiQ temperatures calculated from LA-ICP-MS spot analyses of a part of the quartz from Misox (sample MB-CH1). The LiOH defect map was used since it best shows the crystal zonation. The Ti mass fractions for all spot measurements of this quartz crystal range from 0.03 to 1.8 µg g−1. These Ti mass fractions correspond to temperatures ranging from 505 °C at the core of the crystal to 318 °C at the far rim of the crystal. Note the strong influence of crystal twinning domains and oscillatory zoning within twin domains on the Ti mass fractions, consequently affecting the TiQ calculated temperatures.
The combination of quartz FTIR maps and trace element measurements provides insight into changes in the geochemical environment during the crystallization of hydrothermal (ore) deposits. In both localities, the changes in trace element incorporation into the quartz crystal structure reflect the changes in the P–T–X conditions of pegmatite formation. As quartz is a widespread mineral across all stages of evolved magma and granitic pegmatite formation (and many other hydrothermal ore deposits), it proves to be a powerful proxy to better understand their genesis. We discuss the reliability of FTIR H2O quantification and the significance of FTIR and LA-ICP-MS data and then combine these to assess the charge balance for the trace element inventory measured. This is followed by the discussion regarding the results of TiQ thermometry.
4.1 Reliability of FTIR H2O quantification
Quantifying H2O and corresponding OH-coupled Li, B, and Al contents in quartz using FTIR involves several challenges. A strict protocol was followed for sample preparation, of the analytical method, and quantification calibration, which is now addressed in detail.
Firstly, we used only oriented crystals, cut parallel to the c axis, and measured the FTIR spectra in polarized light with E⊥c to obtain the best possible signal-to-noise ratio. The orientation of the quartz crystal relative to the infrared beam can significantly affect absorbance and, thus, resulting OH quantification. Using maximum polarized FTIR measurements to quantify OH content in quartz represents the best-controlled approach. In this configuration, the optical anisotropy of quartz is accounted for by aligning the sample to enhance the OH-related absorption features, minimizing orientation-related variability. In this section, the absorbance for E∥c can also be measured, testing the different anisotropies of the BOH peak with respect to the LiOH and AlOH peaks (Sect. S2 in the Supplement).
Points with large H2O broadband contributions were filtered out of the dataset by masking all of the pixels with absorbance higher than the signal noise in the range between 3200 and 3100 cm−1. This process by itself removed a significant portion of uncertainty elaborated upon by Stalder (2021). The linear baseline was used to avoid the addition of minor H2O broadband contribution to the integration of the respective bands. This was tested using selected spots and comparing different methods. The quantification of H2O in BOH defects using a maximum polarized measurement resulted in less than 10 % difference when compared to values obtained from spectra averaged over measurements parallel to no and ne following the approach by Stalder (2021). However, the AlOH and LiOH absorption in spots with high total OH absorbance differ more significantly when compared to the no–ne method (Sect. S2 in the Supplement). This is not only a result of imperfect absorbance along no but also likely a combination of higher signal noise and higher H2O broadband contribution. Therefore, if the signal noise is higher, the no–ne method might also have a larger error. This is further supported by a greater difference between the quantification of H2O using the sum of defects from Jollands et al. (2020) and Thomas et al. (2009) at higher defect concentrations. Nevertheless, in all cases, the uncertainty regarding the absorption coefficients (Table 2) is still far greater than the difference in results when comparing the two methods just addressed (Stalder, 2021; this work).
Because of extreme concentrations of fluid inclusions in some areas of the quartz crystals, peak deconvolution of the FTIR spectra was not done. The H2O mass fractions were calculated based on absorption coefficients from Jollands et al. (2020) applied to integration ranges covering targeted absorption bands for all samples. This is especially problematic for the quantification of AlOH because the absorption peak positions of the Al triplet may shift. Jollands et al. (2020) provide two different absorption coefficients for the 3382 and 3306 cm−1 peaks; 174 000 and 218 000 cm−2 L (mol H2O)−1, respectively. In this study, we used an intermediate absorption coefficient of 180 000 cm−2 L (mol H2O)−1 for the complete integration range of the AlOH triplet. However, even when using either end-member coefficient from Jollands et al. (2020) instead of the intermediate value employed here, the resulting variation in H2O mass fractions related to AlOH remains minor – typically no more than ∼15 µg g−1 (∼10 % relative), even for the highest AlOH absorption. This difference is negligible in the context of total Al mass fractions in quartz, which can reach up to ∼1800 µg g−1.
4.2 Correlation of FTIR and LA-ICP-MS trace element measurements
Combining the LA-ICP-MS and FTIR measurements of quartz gives us a unique opportunity to study the quartz crystallization environment. By measuring the total trace element mass fractions via LA-ICP-MS and the H2O mass fraction that is coupled to Li, B, and Al mass fractions via FTIR we are able to track the changes in the crystallizing environment and the changes in the mechanisms of their incorporation into the quartz crystal structure.
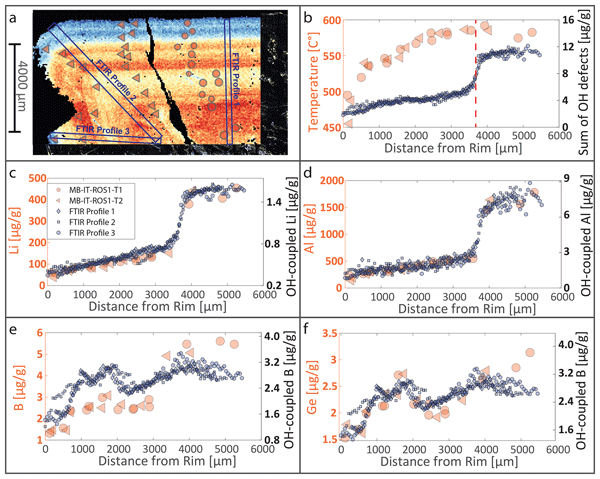
Assuming the complete growth zone of a single quartz crystal grew at the same time – thus, under constant P–T–X conditions – one can compare single LA-ICP-MS spot measurements and their total trace element mass fractions with the FTIR spectra of each pixel with the same distance from the rim of the crystal. This way, a transect of total trace element contents measured by LA-ICP-MS can be overlapped with the integrated mass fractions of OH-coupled Li, B, and Al and total H2O (Fig. 13).
Aluminium and Li mass fractions measured via FTIR follow the trend of total mass fractions of these elements measured via LA-ICP-MS. Such a correlation between the total and H2O-coupled mass fractions of trace elements shows that the Al and Li incorporations into quartz are closely related to each other throughout the whole crystallization sequence (Fig. 13c, d). Germanium seems to follow a very similar zonation pattern through the quartz crystal when compared to B (Fig. 13e, f). The correlation between the total and OH-coupled B is not as clear as that for Li and Al because of lower contents and associated higher noise. While the FTIR data record three local mass fraction maxima for the BOH defect (at around 1000, 1800, and 3800 µm from the rim of the crystal), the first two local maxima are not discernible in LA-ICP-MS spot measurements (Fig. 13e). This shows the capability of FTIR measurements to offer additional information on crystal chemical zonation in comparison to single spot analyses from LA-ICP-MS.
Figure 13b shows that the sudden decrease in Li, Al, and H2O mass fractions in quartz is not related to a drastic decrease in crystallization temperature, thus suggesting that parameters other than temperature dominate OH-related trace element incorporation. Possibilities include the transition from α to β quartz, the magmatic–hydrothermal transition, or the crystallization of one or more new minerals (such as lepidolite) that affects the Li–Al–OH distribution between minerals. A detailed study of fluid inclusions is needed to clarify this issue.
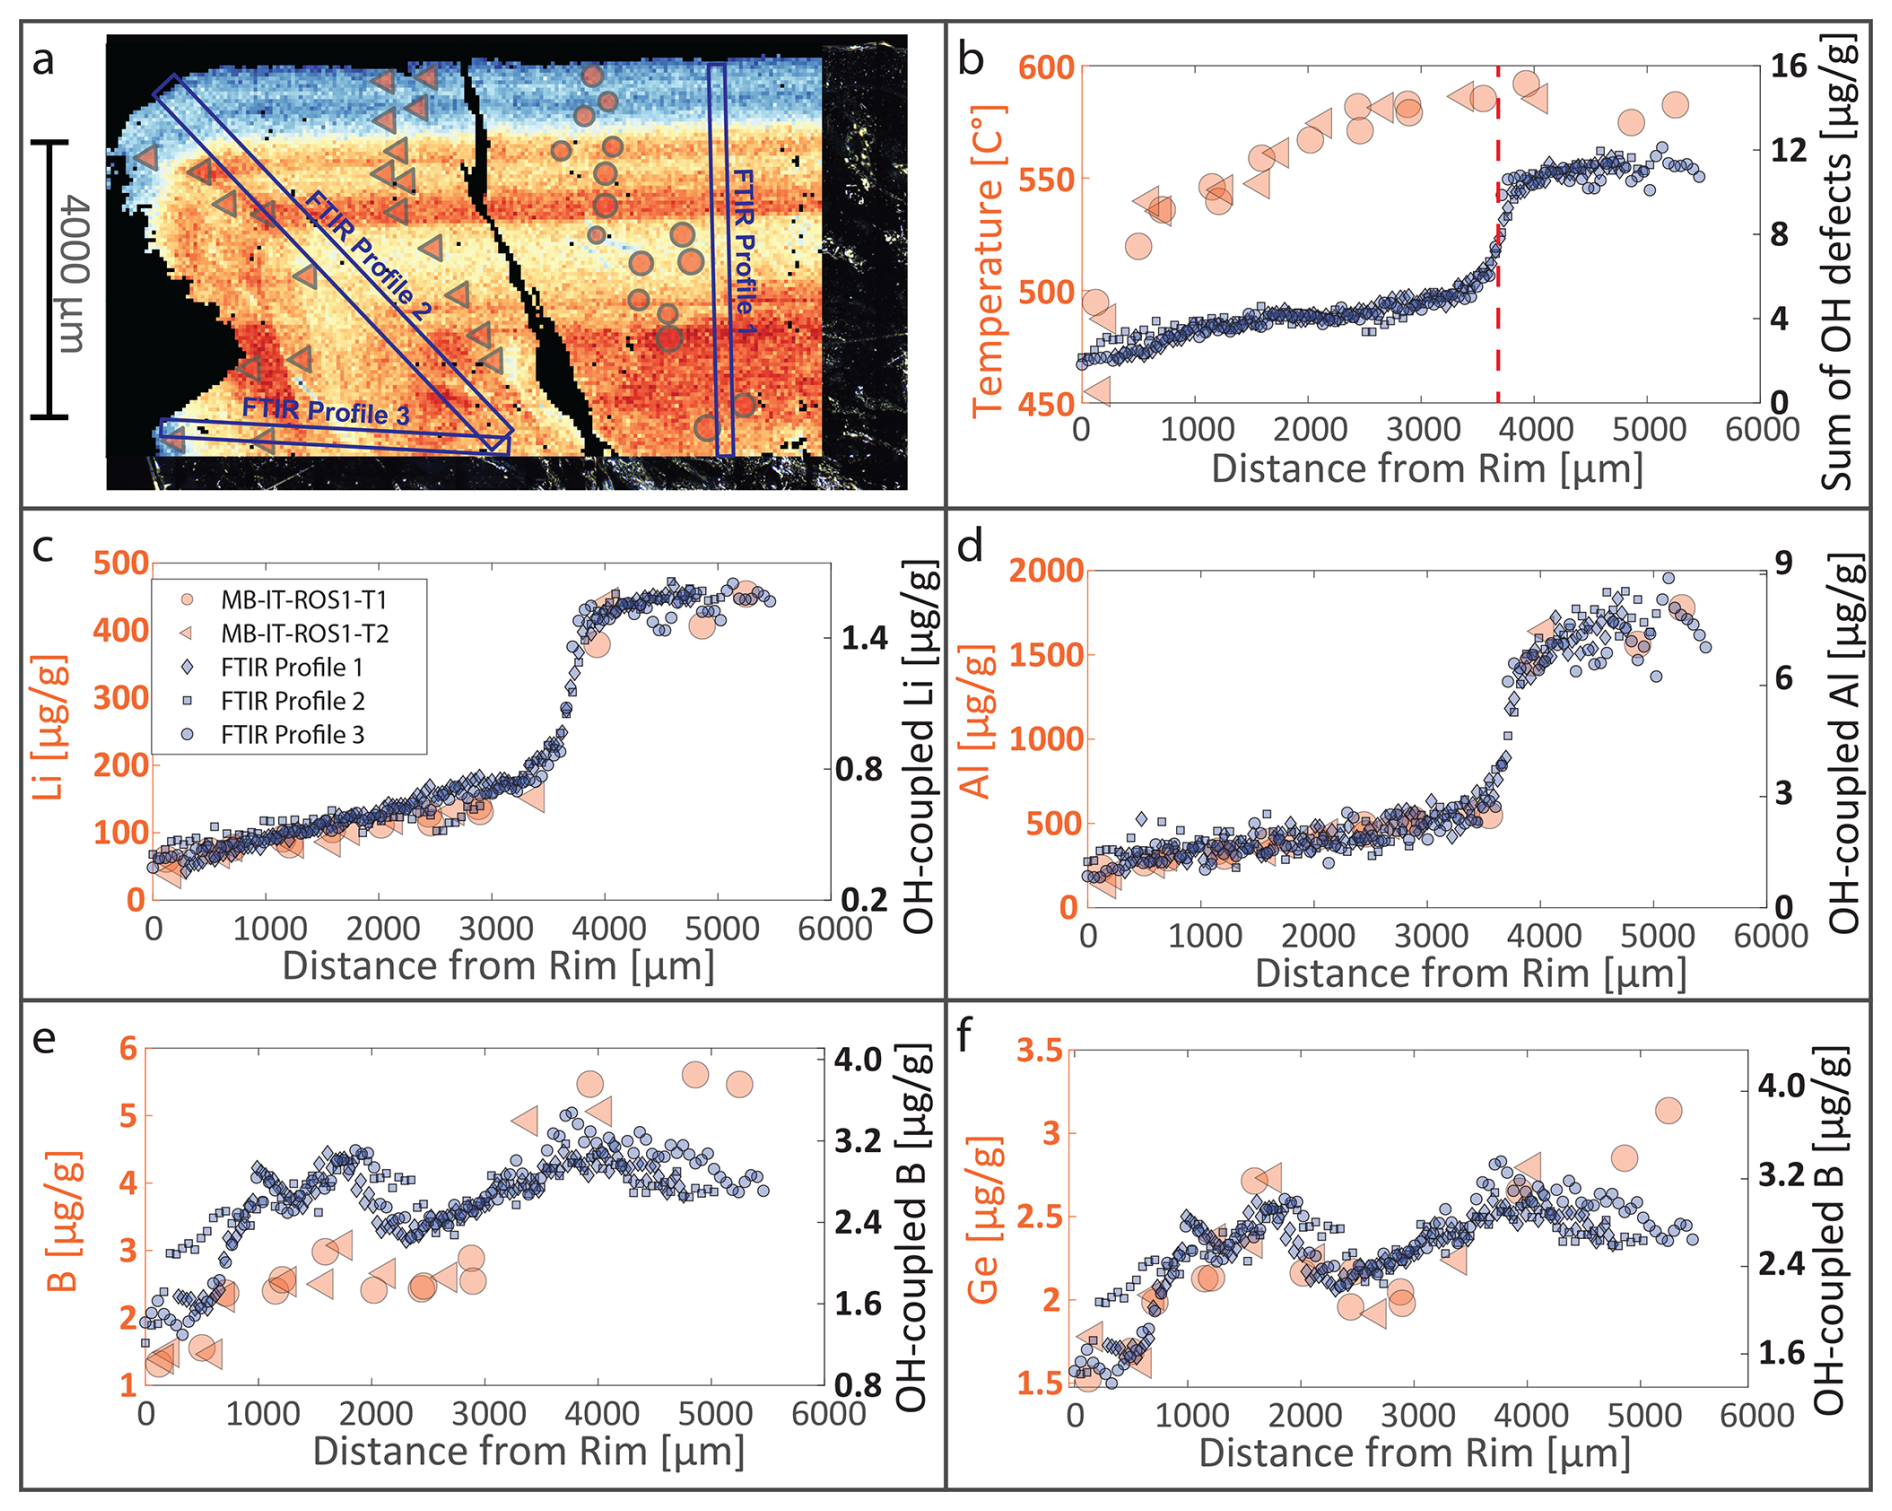
Figure 13LA-ICP-MS spot measurements (in orange) and mass fractions from the FTIR maps (in blue) along transects in Rosina quartz: (a) FTIR BOH map of the tip of the crystal MB-IT-ROS1. Marked in green are the positions of LA-ICP-MS spot measurements (circles) and areas of FTIR map used for integrating the FTIR profiles (rectangles). (b) Calculated TiQ temperatures (from LA-ICP-MS data, left y-axis scale; large orange symbols) and the sum of OH defects (smaller blue symbols; right y-axis scale) along the transect. The dashed red line shows the place of the quartz core–rim transition on the transect. (c) Comparison of LA-ICP-MS total Li mass fractions (large orange symbols; left y-axis scale) and OH-coupled Li mass fractions (smaller blue symbols; right y-axis scale) along the transect. (d) Comparison of LA-ICP-MS total Al mass fractions (large orange symbols; left y-axis scale) and OH-coupled Al mass fractions (smaller blue symbols; right y-axis scale) along the transect. (e) Comparison of measured total B mass fractions (large orange symbols; left y-axis scale) and OH-coupled B mass fractions (smaller blue symbols; right y-axis scale) along the transect. (f) Comparison of measured total Ge mass fractions (large orange symbols; left y-axis scale) and OH-coupled B mass fractions (smaller blue symbols; right y-axis scale) along the transect. For the calculations of all mass fractions see Table S1.
4.3 Quartz charge balancing
The charge balance of trace elements in the studied quartz was evaluated by considering the bulk incorporation of trivalent cations (Al3+ and B3+) and their charge compensation by monovalent cations (H+ and Li+), representing the dominant trace elements. The Li and Al contents linearly correlate (Fig. 9a, b) because of their coupled substitution , where Li+ in the structural channels compensates for the charge deficit created by the substitution of Al3+ for Si4+ (Fig. 1b). However, the slope of that correlation is not the same in all samples (Fig 9b), meaning that Li and Al contents are not always correlated in a 1:1 molar ratio. Since Li+ and H+ are the only significant monovalent species detected in our samples, we calculated the total available charge compensation as the sum of structurally bound H2O (measured by FTIR) and total Li+ minus 2 times the molar concentration of the LiOH defect to account for the Li and H not related to the incorporation of trivalent cations:
This approach does not attempt to allocate specific monovalent cations to individual trivalent cations but rather evaluates whether, in bulk, the total positive charge from H+ and Li+ is sufficient to compensate charge for the trivalent trace element content.
All of the measurements on Rosina quartz (except two outliers) fall on the 1:1 line, showing the same amount of trivalent and monovalent cations and a neutral charge balance (Fig. 14). However, all the measurements on Misox quartz plot to the left of the 1:1 reference line, indicating an excess of trivalent species, not fully charge balanced by the monovalent species (Fig. 14). There are also not enough pentavalent cations for charge balancing, and the excess Al in Misox quartz might be an indication of the presence of nanoparticle inclusions of aluminosilicates in these samples.
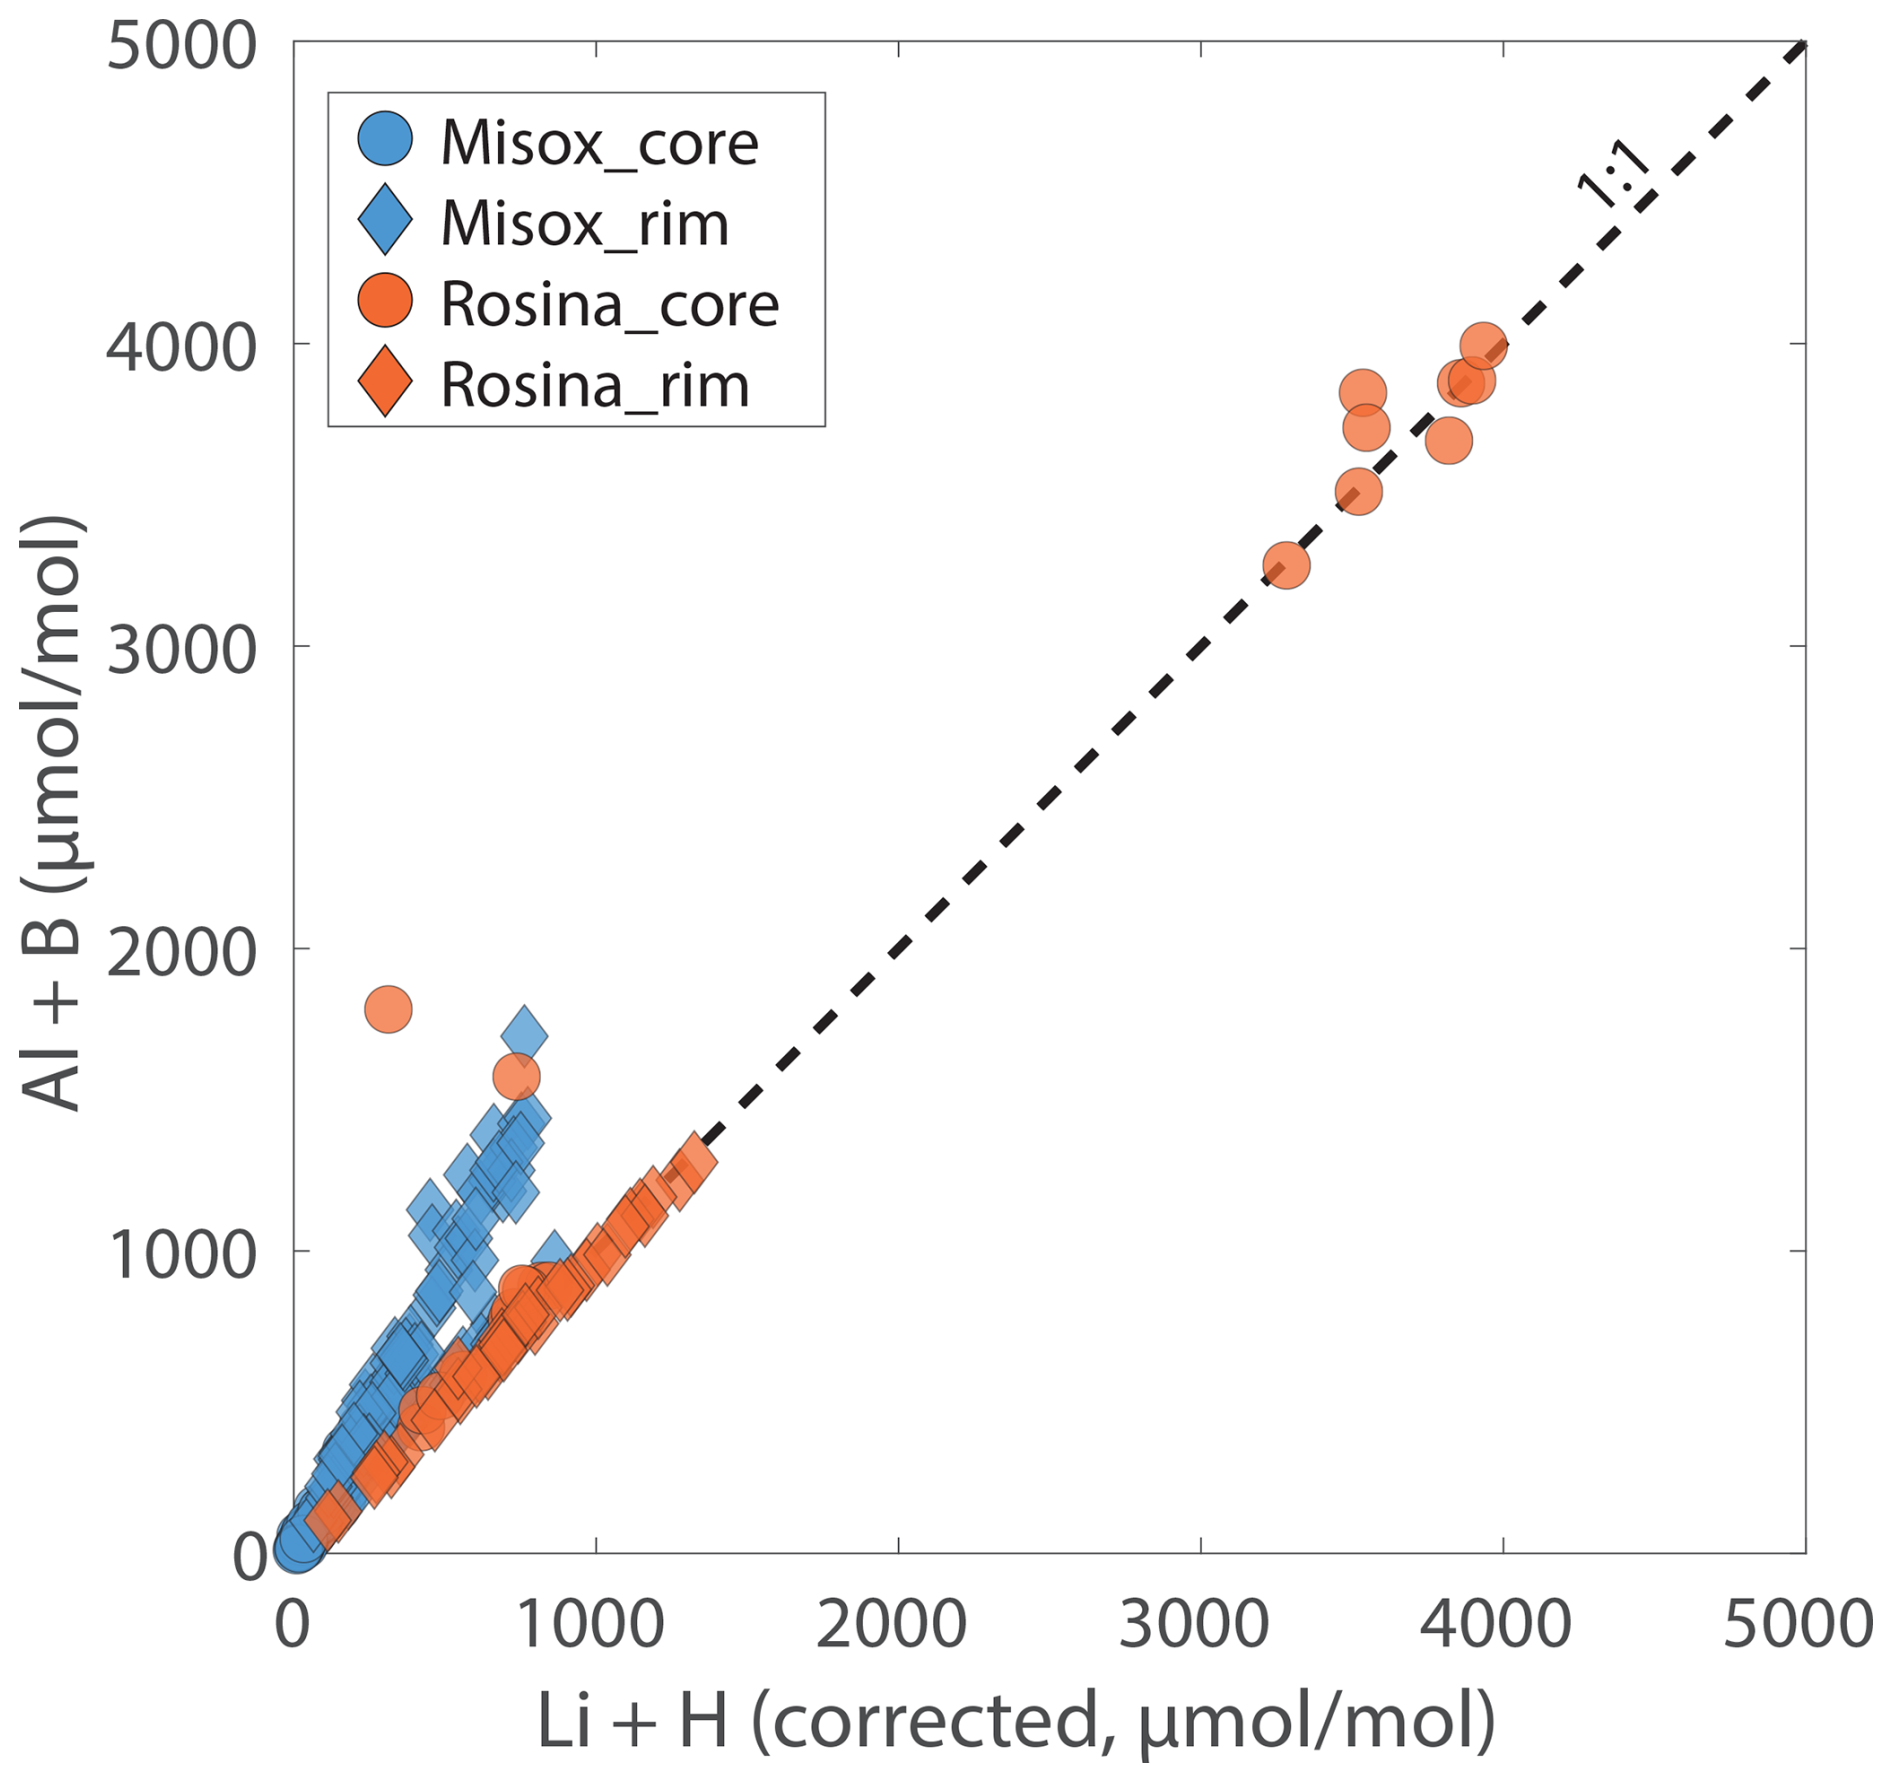
Figure 14A sum of molar concentrations of trivalent cations (Al and B) versus the sum of molar concentrations of monovalent cations related to charge compensation of trivalent cations (Eq. 2). While almost all spot measurements from Rosina quartz closely follow the 1:1 charge balance line, the spot measurements from Misox quartz follow a different slope.
Comparison of LA-ICP-MS element data with those obtained from FTIR reveals that only a small fraction of the total Li and Al is incorporated into Rosina quartz through coupled OH-related defects, never exceeding 4 % and 10 % of total Li and Al. For the Misox quartz, OH-coupled defects represent a more important incorporation mechanism for trace elements in the quartz crystal structure. A total of 10 %–30 % of total Al and <10 % of Li are incorporated into Misox quartz through coupling with an OH defect, with higher values at lower contents of elements. In both Rosina and Misox quartz, about 50 % of B is associated with OH defects, significantly higher than the main trivalent cation Al (Table S1). At low B concentrations, it is possible that the entirety of B is hosted in BOH defects.
This demonstrates that OH defects can play a major role in the incorporation of both monovalent and trivalent cations. Sharp zoning patterns in OH distribution maps (Figs. 7, 8) indicate that these OH-related defects are primary and faithfully record changes in fluid composition and trace element availability during hydrothermal quartz crystallization as limited diffusional equilibration preserved the observed zonation. Compositional zoning further reveals systematic core–rim variations: total trace element cations (µmol mol−1) are generally higher in crystal cores of Rosina quartz but lower in the cores of Misox quartz, relative to their respective rims. In Misox quartz, total Al cations dominate over Li in the rims, generating excess trivalent cations, whereas Rosina quartz cores exhibit two distinct populations of total cation concentrations.
4.4 Trace element incorporation in quartz and implications for Ti-in-quartz thermometry
Understanding the mechanisms of trace element incorporation in quartz is crucial for tracing the fluid evolution and the changes in P–T conditions during the formation of quartz-bearing ore deposits. There has been significant discussion regarding the optimization and use of TiQ as a geothermometer to determine the temperature of quartz crystallization (e.g. Huang and Audétat, 2012; Zhang et al. 2020; Audétat, 2021; Osborne et al., 2022). However, little to no attention has been given so far to intra-grain variability related to small-scale zoning and twinning of quartz crystals. Our measurement data document significant variability in TiQ temperatures for identical growth zones of different quartz twins. Data reported here result in over 20 °C difference as a function of where the LA-ICP-MS spot measurement was placed within the same growth zone (Fig. 16). It is also visible that the trace element contents are significantly higher in rhombohedral faces of the quartz rim region when compared to contemporaneously crystallized prism faces (Fig. 8b). Recently, Lueder et al. (2024) documented for rutile that Zr shows distinct zonation that correlates with other trace elements by using trace LA-ICP-MS element mapping. Resulting Zr-in-rutile temperatures varied by up to 10 % (±35 °C). This variation is of the same order as the temperature variations reported here (Fig. 15a) and is not a consequence of Ti mineral inclusions in quartz (Fig. 15b). Our results demonstrate that element mapping is essential for improving the understanding and interpretation of mineral thermometry data, while also underscoring the careful attention to detail required for the reliable interpretation of TiQ temperatures.
The geological context of the miarolitic cavity in the Misox pegmatite indicates that it likely formed under water-saturated, eutectic conditions. The haplogranite eutectic at ∼0.6 GPa occurs at ∼750 °C (e.g. Holtz et al., 2001), which might be further lowered by the presence of B to ∼600 °C. This implies that the crystallization temperatures were higher than estimated from TiQ measurements. Consequently, the most plausible explanation is that Ti activity was lower than the value of ∼0.5 inferred from the sporadic occurrence of ilmenite in the samples. A lower TiO2 activity of 0.3 or 0.2 would result in 30 or 60 °C higher temperatures (Table S1). The key point in the Misox quartz is not the absolute temperatures but the complications that can arise from twinning, resulting in temperature variations of up to 30 °C for adjacent domains in a growth zone.
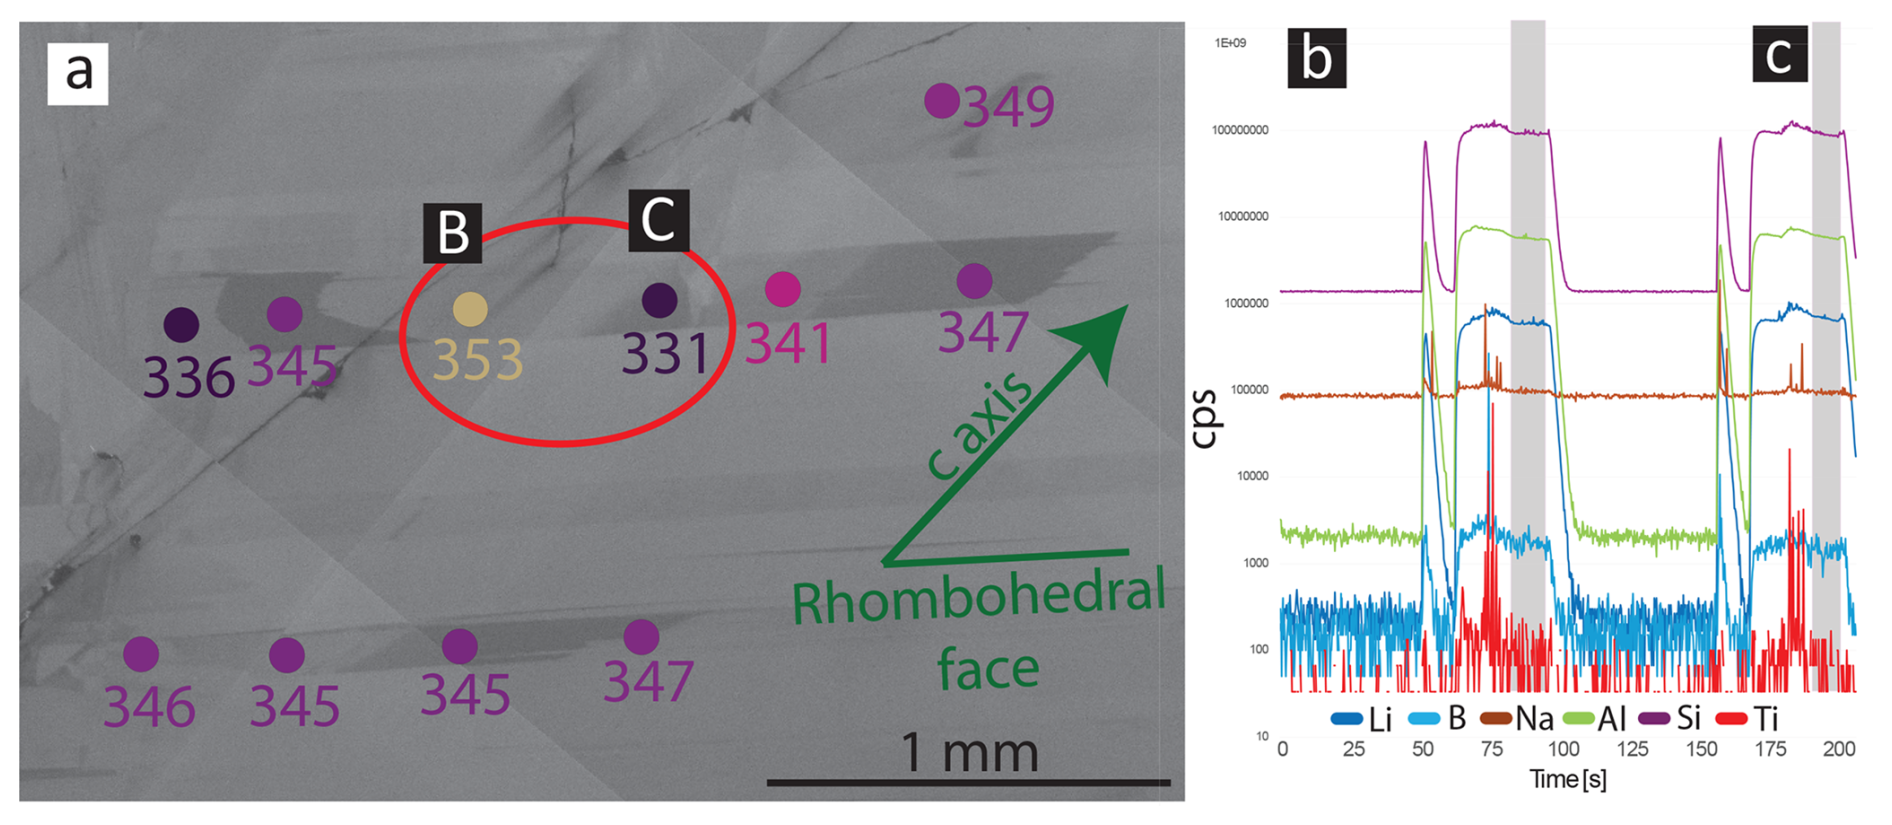
Figure 15(a) Most extreme example of TiQ temperature variations (highlighted in red) within the same growth zone of a twinned quartz crystal MB-CH3. (b) Transient signals from the LA-ICP-MS measurements of the two peaks with the most drastic difference in TiQ temperatures within the same growth zone. Both spot signals have a distinct ilmenite inclusion signal (Ti and Fe signal spikes); however, the integration range used for calculating the concentration (grey intervals) is always selected in a way that avoids the ilmenite inclusion.
The variability in trace element contents among quartz crystals from different cavities of Rosina highlights the localized nature of crystallization environments within a single magmatic–hydrothermal ore body. This suggests that each miarolitic cavity evolved in isolation and at local equilibrium. This localized variability is also documented by the relationship between Li mass fractions and TiQ temperatures (Fig. 16). The measured differences in trace element (TE) contents in quartz from three different miarolitic cavities reflect distinct physico-chemical evolutions during crystallization for each cavity. The highest temperatures and Li mass fractions were measured in the core of the sample MB-IT-ROS1 (quartz from the core zone of the pegmatite). At lower temperatures the three samples display parallel trends of Li decrease with decreasing temperatures. This suggests that fluid Li mass fractions from which the quartz crystallized were different in each of these cavities but followed a general trend of decreasing Li incorporation with decreasing temperature. This likely reflects a decrease in Li solubility with decreasing temperature.
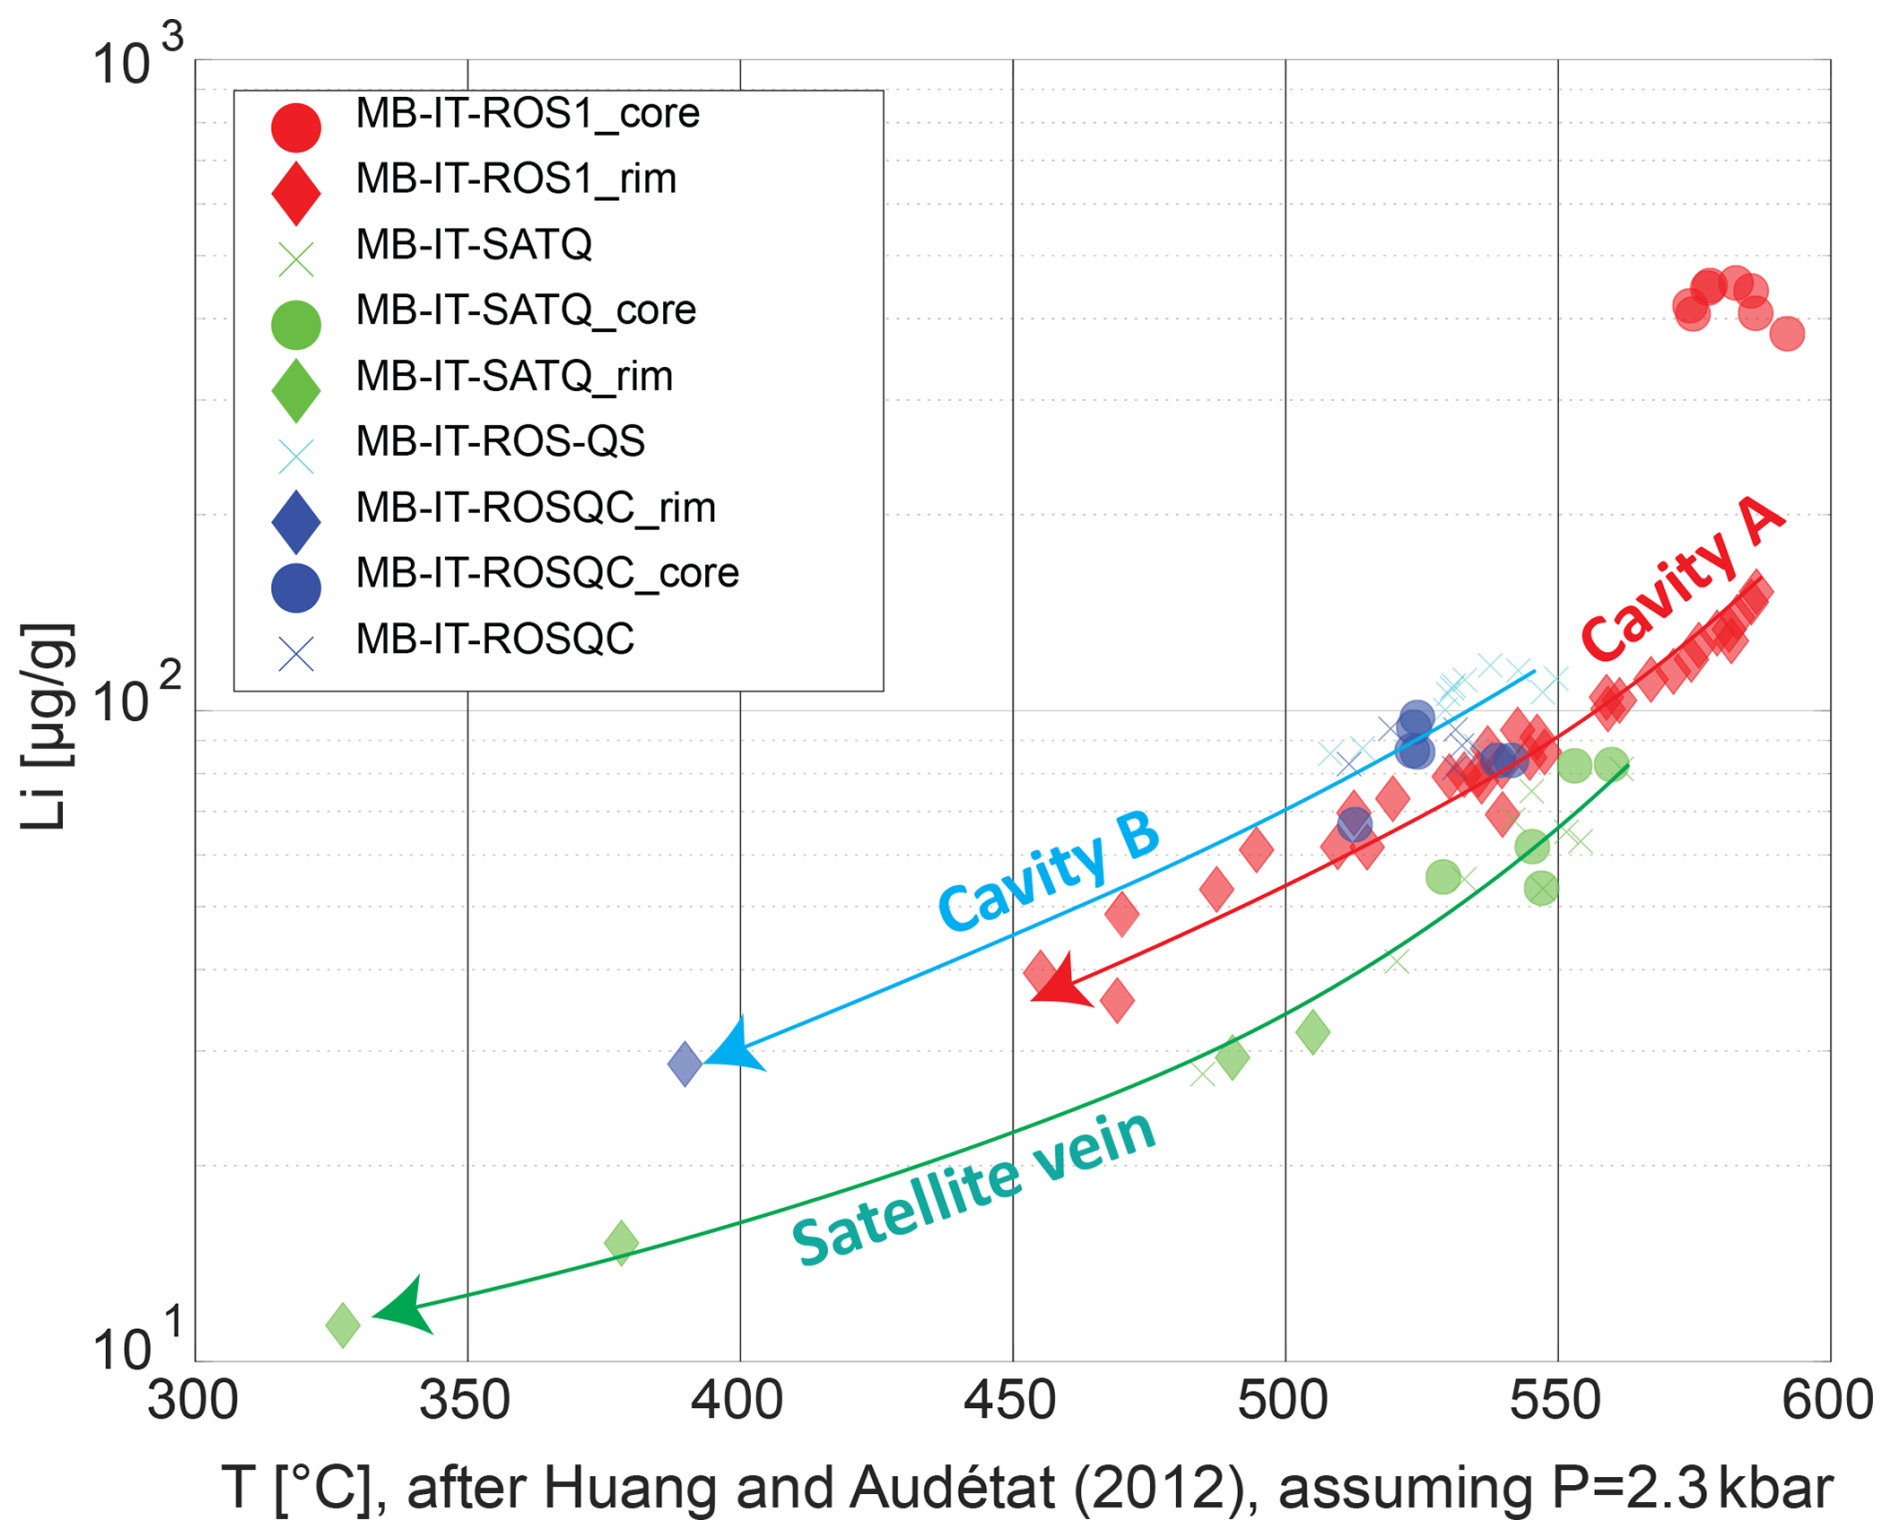
Figure 16Lithium mass fractions versus TiQ temperatures in Rosina pegmatite quartz samples (compare Fig. 2). Each trend line follows Li mass fractions of a single miarolitic cavity with decreasing TiQ temperatures.
The Rosina and Misox pegmatites both contain tourmaline, but only the Rosina samples have Li-rich minerals such as Li mica or Li tourmaline. By plotting Li against total H2O (Fig. 10d), two distinct compositional fields exist. For a given H2O content, the Rosina samples have up to an-order-of-magnitude-higher Li contents. Our data indicate that Li contents in quartz can represent a prospecting tool for individuating Li-rich pegmatites based on the trace element and H2O analyses of detrital quartz (see also Stalder et al., 2017).
This study demonstrates the power of combining FTIR mapping and LA-ICP-MS trace element analyses to illustrate quartz growth zoning and to investigate the incorporation mechanisms of trace elements in quartz from magmatic–hydrothermal ore deposits. A significant impact of trace element zoning and twinning on TiQ thermometry is observed. The findings suggest that temperature estimates based on measured Ti contents cannot be more precise than ∼10 % uncertainty (±25 °C), not accounting for potential errors related to extrapolation of experimental data to lower (hydrothermal) temperatures besides possibly inappropriate aTi values used for temperature calculation. This emphasizes the need for more careful textural sample characterization when using TiQ geothermometry.
The behaviour of Al, B, Li, and H2O, which are all relevant flux elements in pegmatites and evolved granitic magma systems, was successfully tracked throughout the complete crystallization sequence of miarolitic quartz crystals. The largest fraction of Al and Li is correlated by a coupled substitution of throughout quartz crystallization. Hydrogen is a relevant charge balance cation for trace element substitution in quartz, especially for B. FTIR maps may differ from SEM charge contrast images and thus reveal additional information on evolving trace element incorporation related to OH defects that cannot be captured by LA-ICP-MS trace element mass fraction data.
The comparison of Li enrichment in combination with H2O contents in quartz yields two distinct fields for the Misox (no Li mica) and the Rosina pegmatite (Li mica present). This relationship might be useful in the study of detrital quartz for prospecting for Li-rich pegmatites. The variability in Li mass fractions as function of temperature between quartz crystals from different miarolitic cavities within the Rosina pegmatite underscores the localized nature of crystallization pressure–temperature and composition conditions in highly evolved pegmatites while documenting common evolution trends during cooling of the pegmatite fluids.
Due to large file size, all raw FTIR and LA-ICP-MS data are available upon request to the corresponding author.
All samples studied are available upon request to the corresponding author.
The supplement related to this article is available online at https://doi.org/10.5194/ejm-38-397-2026-supplement.
MB conducted fieldwork. MB prepared samples; did petrographic investigations; and performed major, minor, and trace element mineral analyses with the LA-ICP-MS. MB and TP performed the LA-ICP-MS data acquisition and reduction. MB and NG performed FTIR mapping of quartz crystals. MB prepared the figures with contributions from all of the authors. All of the authors contributed to the discussion and writing of the paper. This study is the outcome of the Master's thesis of MB, which was supervised by TP and JH. All of the authors read and approved the final paper.
The contact author has declared that none of the authors has any competing interests.
Publisher's note: Copernicus Publications remains neutral with regard to jurisdictional claims made in the text, published maps, institutional affiliations, or any other geographical representation in this paper. The authors bear the ultimate responsibility for providing appropriate place names. Views expressed in the text are those of the authors and do not necessarily reflect the views of the publisher.
Special thanks are given to Federico Pezzotta and Angelo Stroppini for providing the sample materials, without which this study would not have been possible. Thanks are given to Thomas Aebi for a series of thin and thick section preparations, Thorsten Markmann and Renée Tamblyn for the help with the major mineral analyses via LA-ICP-MS, Mona Lüder for the help with the FTIR measurements of quartz, and Alfons Berger for the help and guidance with the SEM charge contrast imaging. The authors are grateful to the chief editor, Reto Gieré; the associate editor, Paola Comodi; and the two reviewers, Monika Koch-Müller and Roland Stalder, who have all helped greatly in improving the quality of the paper.
We acknowledge support from Swiss National Science Foundation (grant nos. 200020–196927 (NG and JH) and 200020_212727 (TP)).
This paper was edited by Paola Comodi and reviewed by Monika Koch-Müller and Roland Stalder.
Aines, R. D. and Rossman, G. R.: Water in minerals? A peak in the infrared, Geophys. Res.-Sol. Ea., 89, 4059–4071, 1984.
Audétat, A.: Comment on “Ti-in-quartz thermobarometry and TiO2 solubility in rhyolitic melts: New experiments and parametrization” by Zhang et al. [Earth Planet. Sci. Lett. 538 (2020) 116213], Earth Planet. Sci. Lett., 561, 116847, https://doi.org/10.1016/j.epsl.2021.116847, 2021.
Audétat, A. and Pettke, T.: The magmatic-hydrothermal evolution of two barren granites: A melt and fluid inclusion study of the Rito del Medio and Canada Pinabete plutons in northern New Mexico (USA), GCA, 67, 97–121, https://doi.org/10.1016/S0016-7037(02)01049-9, 2003.
Audétat, A., Gunther, D., and Heinrich, C. A.: Formation of a magmatic-hydrothermal ore deposit: Insights with LA-ICP-MS analysis of fluid inclusions, Science, 279, 2091–2094, https://doi.org/10.1126/science.279.5359.2091, 1998.
Bakker, R. J. and Schilli, S. E.: Formation conditions of leucogranite dykes and aplite-pegmatite dykes in the eastern Mt. Capanne plutonic complex (Elba, Italy): fluid inclusion studies in quartz, tourmaline, andalusite and plagioclase, Mineral. Petrol., 110, 43–63, https://doi.org/10.1007/s00710-015-0417-z, 2016.
Bambauer, H. V.: Trace element contents and g-color centers in quartz from fractures of the Swiss Alps. Schweizerische mineralogische und petrographische Mitteilungen, 41, 335–369, 1961.
Barboni, M., Annen, C., and Schoene, B.: Evaluating the construction and evolution of upper crustal magma reservoirs with coupled zircon geochronology and thermal modeling: A case study from the Mt. Capanne pluton (Elba, Italy), Earth Planet. Sci. Lett., 432, 436–448, https://doi.org/10.1016/j.epsl.2015.09.043, 2015.
Baron, M. A., Stalder, R., Konzett, J., and Hauzenberger, C. A.: OH-point defects in quartz in B-and Li-bearing systems and their application to pegmatites, Phys. Chem. Mineral, 42, 53–62, https://doi.org/10.1007/s00269-014-0699-4, 2015.
Berger, A., Burri, T., Alt-Epping, P., and Engi, M.: Tectonically controlled fluid flow and water-assisted melting in the middle crust: an example from the Central Alps, Lithos, 102, 598–615, https://doi.org/10.1016/j.lithos.2007.07.027, 2008.
Breiter, K. and Müller, A.: Evolution of rare-metal granitic magmas documented by quartz chemistry, Eur. J. Mineral., 21, 335–346, https://doi.org/10.1127/0935-1221/2009/0021-1907, 2009.
Breiter, K., Ďurišová, J., and Dosbaba, M.: Quartz chemistry–A step to understanding magmatic-hydrothermal processes in ore-bearing granites: Cínovec/Zinnwald Sn-W-Li deposit, Central Europe, Ore Geol. Rev., 90, 25–35, https://doi.org/10.1016/j.oregeorev.2017.10.013, 2017.
Brunner, G. O., Wondratschek, H., and Laves, F.: Ultrarotuntersuchungen fiber den Einbau von H in natürlichem Quarz, Z. Elektrochem., 65, 735–750, 1961.
Burri, T., Berger, A., and Engi, M.: Tertiary migmatites in the Central Alps: regional distribution, field relations, conditions of formation, and tectonic implications, Schweizerische Mineralogische und Petrographische Mitteilungen, 85, 215–232, 2005.
Chakraborty, D. and Lehmann, G.: Distribution of OH in synthetic and natural quartz crystals, Solid State Chem., 17, 305–311, https://doi.org/10.1016/0022-4596(76)90136-5, 1976a.
Chakraborty, D. and Lehmann, G.: On the structures and orientations of hydrogen defects in natural and synthetic quartz crystals, Phys. Status Solidi (A), 34, 467–474, https://doi.org/10.1002/pssa.2210340206, 1976b.
Chang, Z. and Meinert, L. D.: The magmatic–hydrothermal transition – evidence from quartz phenocryst textures and endoskarn abundance in Cu–Zn skarns at the Empire Mine, Idaho, USA, Chem. Geol., 210, 149–171, https://doi.org/10.1016/j.chemgeo.2004.06.018, 2004.
Dill, H. G.: Pegmatites and Aplites: Sources for energy, ore and industrial minerals. Meggener Rohstofftage “Minerals for the World,” 17–19 September, Lennestadt-Meggen, BDG Berufsverband Deutscher Geowissenschaftler and Traktor-Technik GMbH & Co. KG and Sachtleben Bergbau Verwaltungs–GMbH, Germany, 2015.
Dini, A., Lattanzi, P., Ruggieri, G., and Trumpy, E.: Lithium occurrence in Italy – an overview, Minerals, 12, 945, https://doi.org/10.3390/min12080945, 2022.
Frigo, C., Stalder, R., and Hauzenberger, C. A.: OH defects in quartz in granitic systems doped with spodumene, tourmaline and/or apatite: experimental investigations at 5–20 kbar, Phys. Chem. Mineral., 43, 717–729, https://doi.org/10.1007/s00269-016-0828-3, 2016.
Gies, N. B., Lanari, P., and Hermann, J.: A workflow and software solution for spatially resolved spectroscopic and numerical data (SpecXY), Comput. Geosci., 189, 105626, https://doi.org/10.1016/j.cageo.2024.105626, 2024.
Goodenough, K. M., Shaw, R. A., Smith, M., Estrade, G., Marqu, E., Bernard, C., and Nex, P.: Economic mineralization in pegmatites: Comparing and contrasting NYF and LCT examples, Can. Mineral., 57, 753–755, https://doi.org/10.3749/canmin.AB00013, 2019.
Götze, J.: Chemistry, textures and physical properties of quartz – geological interpretation and technical application, Mineral. Mag., 73, 645–671, https://doi.org/10.1180/minmag.2009.073.4.645, 2009.
Götze, J. and Möckel, R. (Eds.): Quartz: Deposits, mineralogy and analytics, p. 360, Springer, Berlin, https://doi.org/10.1007/978-3-642-22161-3, 2012.
Götze, J., Pan, Y., and Müller, A.: Mineralogy and mineral chemistry of quartz: A review, Mineral. Mag., 85, 639–664, https://doi.org/10.1180/mgm.2021.72, 2021.
Gregory, C. J., Rubatto, D., Hermann, J., Berger, A., and Engi, M.: Allanite behaviour during incipient melting in the southern Central Alps, GCA, 84, 433–458, https://doi.org/10.1016/j.gca.2012.01.020, 2012.
Griffin, B. J.: Charge contrast imaging of material growth and defects in environmental scanning electron miscroscopy – linking electron emission and cathodoluminescence, Scanning, 22, 234–242, https://doi.org/10.1002/sca.4950220402, 2000.
Griggs, D. T. and Blacic, J. D.: Quartz: Anomalous weakness of synthetic crystals, Science, 147, 292–295, 1965.
Guillong, M., Meier, D. L., Allan, M. M., Heinrich, C. A., and Yardley, B. W.: Appendix a6: sills: a matlab-based program for the reduction of laser ablation ICP–MS data of homogeneous materials and inclusions, Mineralogical Association of Canada Short Course 40, Vancouver, B.C., 328–333. https://doi.org/10.3749/9780921294801.app06, 2008.
Heinrich, C. A., Gunther, D., Audétat, A., Ulrich, T., and Frischknecht, R.: Metal fractionation between magmatic brine and vapor, determined by microanalysis of fluid inclusions, Geology, 27, 755–758, https://doi.org/10.1130/0091-7613(1999)027<0755:MFBMBA>2.3.CO;2, 1999.
Holtz, F., Andreas B., and Johannes, W.: The water-undersaturated and dry Qz-Ab-Or system revisited. Experimental results at very low water activities and geological implications, Contrib. Mineral. Petr., 141, 347, https://doi.org/10.1007/s004100100245, 2001.
Huang, R. and Audétat, A.: The titanium-in-quartz (TitaniQ) thermobarometer: A critical examination and re-calibration, GCA, 84, 75–89, https://doi.org/10.1016/j.gca.2012.01.009, 2012.
Jollands, M. C., Blanchard, M., and Balan, E.: Structure and theoretical infrared spectra of OH defects in quartz, Eur. J. Mineral., 32, 311–323, https://doi.org/10.5194/ejm-32-311-2020, 2020.
Kats, A.: Hydrogen in alpha quartz, Philips Research Reports, 17, 133–279, 1962.
Kronenberg, A. K., Hasnan, H. F. B., Holyoke III, C. W., Law, R. D., Liu, Z., and Thomas, J. B.: Synchrotron FTIR imaging of OH in quartz mylonites, Solid Earth, 8, 1025–1045, https://doi.org/10.5194/se-8-1025-2017, 2017.
Landtwing, M. R., Pettke, T., Halter, W. E., Heinrich, C. A., Redmond, P. B., Einaudi, M. T., and Kunze, K.: Copper deposition during quartz dissolution by cooling magmatic–hydrothermal fluids: the Bingham porphyry, Earth Planet. Sci. Lett., 235, 229-243, https://doi.org/10.1016/j.epsl.2005.02.046, 2005.
Larsen, R. B., Polvé, M., and Juve, G.: Granite pegmatite quartz from Evje-Iveland: trace element chemistry and implications for the formation of high-purity quartz, Norges geologiske undersøgelse Bulletin, 57–65, 2000.
Lehmann, K., Berger, A., Götte, T. H., Ramseyer, K., and Wiedenbeck, M.: Growth related zonations in authigenic and hydrothermal quartz characterized by SIMS-, EPMA-, SEM-CL-and SEM-CC-imaging, Mineral. Mag., 73, 633–643, https://doi.org/10.1180/minmag.2009.073.4.633, 2009.
Lueder, M., Tamblyn, R., Rubatto, D., and Hermann, J.: H2O-rich rutile as an indicator for modern-style cold subduction, Contrib. Mineral. Petr., 179, 26, https://doi.org/10.1007/s00410-024-02107-2, 2024.
Mao, W., Zhong, H., Zhu, W.-G., Lin, X.-G., and Zhao, X.-Y.: Magmatic-hydrothermal evolution of the Yuanzhuding porphyry Cu-Mo deposit, South China: Insights from mica and quartz geochemistry, Ore Geol. Rev., 101, 765–784, https://doi.org/10.1016/j.oregeorev.2018.08.016, 2018.
Morgan, S. W. and Phillips, M. R.: Gaseous scintillation detection and amplification in variable pressure scanning electron microscopy, Appl. Phys., 100, https://doi.org/10.1063/1.2355539, 2006.
Müller, A. and Koch-Müller, M.: Hydrogen speciation and trace element contents of igneous, hydrothermal and metamorphic quartz from Norway, Mineral. Mag., 73, 569–583, https://doi.org/10.1180/minmag.2009.073.4.569, 2009.
Müller, A., Ihlen, P. M., and Kronz, A.: Quartz chemistry in polygeneration Svenconorwegian pegmatites, Froland. Norway, Europ. J. Mineral., 20, 447–463, https://doi.org/10.1127/0935-1221/2008/0020-1822, 2008.
Müller, A., Wanvik, J. E., and Ihlen, P. M.: Petrological and chemical characterisation of high-purity quartz deposits with examples from Norway, in: Quartz: deposits, mineralogy and analytics, edited by: Götze, J. and Möckel, R., 71–118, Springer Berlin Heidelberg, Berlin, Heidelberg, https://doi.org/10.1007/978-3-642-22161-3_4, 2012.
Müller, A., Ihlen, P. M., Snook, B., Larsen, R. B., Flem, B., Bingen, B., and Williamson, B. J.: The chemistry of quartz in granitic pegmatites of southern Norway: Petrogenetic and economic implications, Econ. Geol., 110, 1737–1757, https://doi.org/10.2113/econgeo.110.7.1737, 2015.
Müller, A., Keyser, W., Simmons, W. B., Webber, K., Wise, M., Beurlen, H., Garate-Olave, I., Roda-Robles, I., and Galliski, M.Á.: Quartz chemistry of granitic pegmatites: Implications for classification, genesis and exploration, Chem. Geol., 584, 120507, https://doi.org/10.1016/j.chemgeo.2021.120507, 2021.
Orlandi, P. and Pezzotta, F.: Minerali dell'isola d'Elba: i minerali dei giacimenti metalliferi dell'Elba orientale e delle pegmatiti del Monte Capanne, Novecento grafico, 1996.
Osborne, Z. R., Thomas, J. B., Nachlas, W. O., Angel, R. J., Hoff, C. M., and Watson, E. B.: TitaniQ revisited: expanded and improved Ti-in-quartz solubility model for thermobarometry, Contrib. Mineral. Petr., 177, 31, https://doi.org/10.1007/s00410-022-01896-8, 2022.
Pan, J.-Y., Ni, P., and Wang, R.-C.: Comparison of fluid processes in coexisting wolframite and quartz from a giant vein-type tungsten deposit, South China: Insights from detailed petrography and LA-ICP-MS analysis of fluid inclusions, Am. Min., 104, 1092–1116, https://doi.org/10.2138/am-2019-6958, 2019.
Pan, X., Li, S., Li, Y., Guo, P., Zhao, X., and Cai, Y.: Resource, characteristic, purification and application of quartz: A review, Miner. Eng., 183, 107600, https://doi.org/10.1016/j.mineng.2022.107600, 2022.
Paterson, M.: The determination of hydroxyl by infrared absorption in quartz, silicate glasses and similar materials, Bulletin de minéralogie, 105, 20–29, 1982.
Peterková, T. and Dolejš, D.: Magmatic-hydrothermal transition of Mo-W-mineralized granite-pegmatite-greisen system recorded by trace elements in quartz: Krupka district, Eastern Krušné hory/Erzgebirge, Chem. Geol., 523, 179–202, https://doi.org/10.1016/j.chemgeo.2019.04.009, 2019.
Pettke, T., Oberli, F., Audétat, A., Guillong, M., Simon, A. C., Hanley, J. J., and Klemm, L. M.: Recent developments in element concentration and isotope ratio analysis of individual fluid inclusions by laser ablation single and multiple collector ICP-MS, Ore Geol. Rev., 44, 10–38, https://doi.org/10.1016/j.oregeorev.2011.11.001, 2012.
Pezzotta, F.: Internal structures, parageneses and classification of the miarolitic Li-bearing complex pegmatites of Elba Island (Italy), Memorie della società italiana di scienze náturali e del museo civìco di storia naturale di Milano, 30, 29–43, 2000.
Potrafke, A., Stalder, R., Schmidt, B. C., and Ludwig, T., OH defect contents in quartz in a granitic system at 1–5 kbar, Contrib. Mineral. Petr., 174, 98, https://doi.org/10.1007/s00410-019-1632-0, 2019.
Rubatto, D., Hermann, J., Berger, A., and Engi, M.: Protracted fluid-induced melting during Barrovian metamorphism in the Central Alps, Contrib. Mineral. Petr., 158, 703–722, https://doi.org/10.1007/s00410-009-0406-5, 2009.
Shah, S. A., Shao, Y., Zhang, Y., Zhao, H., and Zhao, L.: Texture and trace element geochemistry of quartz: a review, Minerals, 12, 1042, https://doi.org/10.3390/min12081042, 2022.
Staats, P. A. and Kopp, O. C.: Studies on the origin of the 3400 cm region infrared bands of synthetic and natural α-quartz, Phys. Chem. Solids, 35, 1029–1033, https://doi.org/10.1016/S0022-3697(74)80118-6, 1974.
Stalder, R.: OH point defects in quartz – a review, Eur. J. Mineral., 33, 145–163, https://doi.org/10.5194/ejm-33-145-2021, 2021.
Stalder, R. and Konzett, J.: OH defects in quartz in the system quartz–albite–water and granite–water between 5 and 25 kbar, Phys. Chem. Mineral., 39, 817–827, https://doi.org/10.1007/s00269-012-0537-5, 2012.
Stalder, R., Potrafke, A., Billström, K., Skogby, H., Meinhold, G., Gögele, C., and Berberich, T.: OH defects in quartz as monitor for igneous, metamorphic, and sedimentary processes, Am. Min., 102, 1832–1842, https://doi.org/10.2138/am-2017-6107, 2017.
Stroppini, A.: Die Entdeckung einer großen Pegmatitgeode im Misox (GR), Schweizer Strahler, 53, 2–14, 2019.
Tagliaferri, A., Schenker, F. L., Ulianov, A., Maino, M., and Schmalholz, S. M.: Implications of new geological mapping and U-Pb zircon dating for the Barrovian tectono-metamorphic evolution of the Lepontine dome (Central European Alps), Geochem., 24, e2022GC010772, https://doi.org/10.1029/2022GC010772, 2023.
Thomas, S. M., Koch-Müller, M., Reichart, P., Rhede, D., Thomas, R., and Wirth, R.: IR calibrations for water determination in olivine, r-GeO2 and SiO2 polymorphs, Phys. Chem. Miner., 36, 489–509, https://doi.org/10.1007/s00269-009-0295-1, 2009.
Tumaini, G., Tavazzani, L., Skogby, H., Bernardi, F., Sinigoi, S., and Lenaz, D.: Tracking the transition from magmatic to post-crystallization environment in the Sesia Magmatic System (Italy) by coupling quartz OH-defects and trace element analyses, Chem. Geol., 122810, https://doi.org/10.1016/j.chemgeo.2025.122810, 2025.
Walters, J. B. and Gies, N. B.: MinPlotX: A powerful tool for formula recalculation, visualization, and comparison of large mineral compositional datasets, Mineralogia, 56, 13–22, https://doi.org/10.2478/mipo-2025-0003, 2025.
Watt, G. R., Griffin, B. J., and Kinny, P. D.: Charge contrast imaging of geological materials in the environmental scanning electron microscope, Am. Min., 85, 1784–1794, https://doi.org/10.2138/am-2000-11-1221, 2000.
Yuan, Y., Chen, B., Shang, L., Sendula, E., and Chou, I. M.: Lithium enrichment of the magmatic-hydrothermal fluid in albite-spodumene pegmatite from Lijiagou, Eastern Tibetan Plateau: Evidence from fluid inclusions, Ore Geol. Rev., 162, 105685, https://doi.org/10.1016/j.oregeorev.2023.105685, 2023.
Zajacz, Z., Halter, W. E., Pettke, T., and Guillong, M.: Determination of fluid/melt partition coefficients by LA-ICPMS analysis of co-existing fluid and silicate melt inclusions: Controls on element partitioning, GCA, 72, 2169–2197, https://doi.org/10.1016/j.gca.2008.01.034, 2008.
Zhang, C., Li, X., Almeev, R. R., Horn, I., Behrens, H., and Holtz, F.: Ti-in-quartz thermobarometry and TiO2 solubility in rhyolitic melts: new experiments and parametrization, Earth Planet. Sci. Lett., 538, 116213, https://doi.org/10.1016/j.epsl.2020.116213, 2020.